Embed Size (px)
Citation preview

RESEARCH ARTICLE
Air change rate effects on the airborne diseases spreadingin Underground Metro wagons
Mostafa El-Salamony1 & Ahmed Moharam2& Amr Guaily2,3,4 & Mohammed A. Boraey2,4,5
Received: 26 November 2020 /Accepted: 15 February 2021
AbstractThe effect of the rate of change of fresh air inside passengers’ wagons for Underground Metro on the spreading of airbornediseases like COVID-19 is investigated numerically. The study investigates two extreme scenarios for the location of the sourceof infection within the wagon with four different air change rates for each. The first scenario considers the source of infection atthe closest point to the ventilation system while the other places the infection source at the farthest point from the wagonventilation system. The effect of the wagon windows’ status (i.e. closed or open) is also studied. It is found that under allconditions, open windows are always favored to decrease the infection spreading potential. A higher air change rate alsodecreases the infection spreading up to a certain value, beyond which the effect is not noticeable. The location of the infectionsource was found to greatly affect the infection spreading as well. The paper gives recommendations on the minimum air changerate to keep the infection spreading potentials to a minimum considering different times the passengers stay in the wagon.
Keywords COVID-19 . Infection potential . Ventilation . Air change rate . GCUM
https://doi.org/10.1007/s11356-021-13036-z
/ Published online: 22 February 2021
Environmental Science and Pollution Research (2021) 28:31895–31907
Introduction
The Middle East and North Africa (MENA) region is one ofthe hottest places on earth with temperatures up to 50 °Cduring summer (Krarti and Ihm 2016; Hijazi and Howieson2018). Egypt, as part of the MENA region, has an averageannual cooling degree-day of about 2500 for a base tempera-ture of 22 °C and an average heating degree-day of about 300for a base temperature of 18 °C (Hijazi and Howieson 2018).This high cooling and heating load demand necessitates the
use of ventilation equipment to ensure that the proper temper-ature and humidity conditions are met (Gupta et al. 2009).Metro stations are no exception to this fact with stricter con-strains on the used ventilation mechanism duo to its hugeimpact on the Indoor Air Quality (IAQ) (Kim et al. 2012;Kwon et al. 2015; Martins et al. 2015; Qiao et al. 2015).
Egypt is one of the most populous countries in the MENAregion with an estimated population of 100 million (Ahmedet al. 2020). Cairo has an estimated population of 20 millionas of 2016 making it the city with the highest population in the
The original online version of this article was revised: The correct order ofthe assigned affiliations for the 3rd and 4th Author is shown in this paper.
Responsible Editor: Lotfi Aleya
* Mostafa [email protected]
Ahmed [email protected]
Mohammed A. [email protected]
1 Aerospace Department, College of Engineering, Peking University,Beijing 100871, China
2 Smart Engineering Systems Research Center (SESC), NileUniversity, Sheikh Zayed City 12588, Egypt
3 Department of Engineering Mathematics and Physics, Faculty ofEngineering, Cairo University, Giza 12613, Egypt
4 Mechanical Engineering Program, School of Engineering andApplied Sciences, Nile University, Sheikh Zayed City 12588, Egypt
5 Mechanical Power Engineering Department, Zagazig University,Zagazig 44519, Egypt
# The Author(s), under exclusive licence to Springer-Verlag GmbH, DE part of Springer Nature 2021, corrected publication 2021
31896 Environ Sci Pollut Res (2021) 28:31895–31907
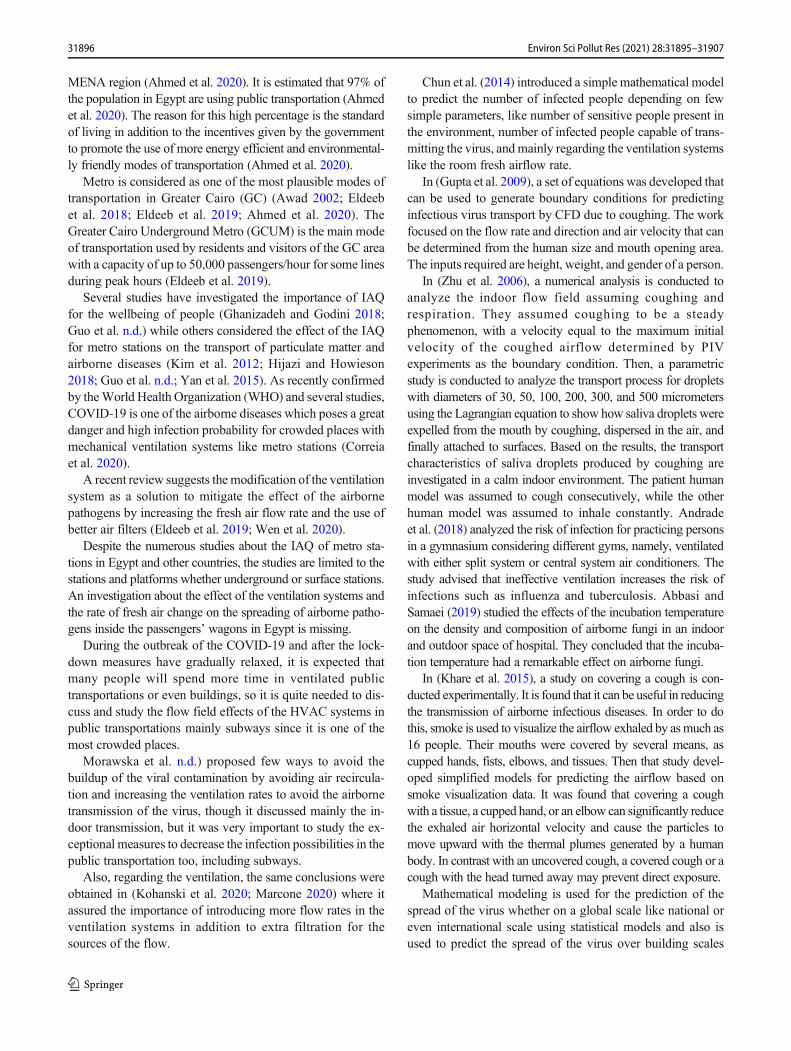
MENA region (Ahmed et al. 2020). It is estimated that 97% ofthe population in Egypt are using public transportation (Ahmedet al. 2020). The reason for this high percentage is the standardof living in addition to the incentives given by the governmentto promote the use of more energy efficient and environmental-ly friendly modes of transportation (Ahmed et al. 2020).
Metro is considered as one of the most plausible modes oftransportation in Greater Cairo (GC) (Awad 2002; Eldeebet al. 2018; Eldeeb et al. 2019; Ahmed et al. 2020). TheGreater Cairo Underground Metro (GCUM) is the main modeof transportation used by residents and visitors of the GC areawith a capacity of up to 50,000 passengers/hour for some linesduring peak hours (Eldeeb et al. 2019).
Several studies have investigated the importance of IAQfor the wellbeing of people (Ghanizadeh and Godini 2018;Guo et al. n.d.) while others considered the effect of the IAQfor metro stations on the transport of particulate matter andairborne diseases (Kim et al. 2012; Hijazi and Howieson2018; Guo et al. n.d.; Yan et al. 2015). As recently confirmedby theWorld Health Organization (WHO) and several studies,COVID-19 is one of the airborne diseases which poses a greatdanger and high infection probability for crowded places withmechanical ventilation systems like metro stations (Correiaet al. 2020).
A recent review suggests the modification of the ventilationsystem as a solution to mitigate the effect of the airbornepathogens by increasing the fresh air flow rate and the use ofbetter air filters (Eldeeb et al. 2019; Wen et al. 2020).
Despite the numerous studies about the IAQ of metro sta-tions in Egypt and other countries, the studies are limited to thestations and platforms whether underground or surface stations.An investigation about the effect of the ventilation systems andthe rate of fresh air change on the spreading of airborne patho-gens inside the passengers’ wagons in Egypt is missing.
During the outbreak of the COVID-19 and after the lock-down measures have gradually relaxed, it is expected thatmany people will spend more time in ventilated publictransportations or even buildings, so it is quite needed to dis-cuss and study the flow field effects of the HVAC systems inpublic transportations mainly subways since it is one of themost crowded places.
Morawska et al. n.d.) proposed few ways to avoid thebuildup of the viral contamination by avoiding air recircula-tion and increasing the ventilation rates to avoid the airbornetransmission of the virus, though it discussed mainly the in-door transmission, but it was very important to study the ex-ceptional measures to decrease the infection possibilities in thepublic transportation too, including subways.
Also, regarding the ventilation, the same conclusions wereobtained in (Kohanski et al. 2020; Marcone 2020) where itassured the importance of introducing more flow rates in theventilation systems in addition to extra filtration for thesources of the flow.
Chun et al. (2014) introduced a simple mathematical modelto predict the number of infected people depending on fewsimple parameters, like number of sensitive people present inthe environment, number of infected people capable of trans-mitting the virus, andmainly regarding the ventilation systemslike the room fresh airflow rate.
In (Gupta et al. 2009), a set of equations was developed thatcan be used to generate boundary conditions for predictinginfectious virus transport by CFD due to coughing. The workfocused on the flow rate and direction and air velocity that canbe determined from the human size and mouth opening area.The inputs required are height, weight, and gender of a person.
In (Zhu et al. 2006), a numerical analysis is conducted toanalyze the indoor flow field assuming coughing andrespiration. They assumed coughing to be a steadyphenomenon, with a velocity equal to the maximum initialvelocity of the coughed airflow determined by PIVexperiments as the boundary condition. Then, a parametricstudy is conducted to analyze the transport process for dropletswith diameters of 30, 50, 100, 200, 300, and 500 micrometersusing the Lagrangian equation to show how saliva droplets wereexpelled from the mouth by coughing, dispersed in the air, andfinally attached to surfaces. Based on the results, the transportcharacteristics of saliva droplets produced by coughing areinvestigated in a calm indoor environment. The patient humanmodel was assumed to cough consecutively, while the otherhuman model was assumed to inhale constantly. Andradeet al. (2018) analyzed the risk of infection for practicing personsin a gymnasium considering different gyms, namely, ventilatedwith either split system or central system air conditioners. Thestudy advised that ineffective ventilation increases the risk ofinfections such as influenza and tuberculosis. Abbasi andSamaei (2019) studied the effects of the incubation temperatureon the density and composition of airborne fungi in an indoorand outdoor space of hospital. They concluded that the incuba-tion temperature had a remarkable effect on airborne fungi.
In (Khare et al. 2015), a study on covering a cough is con-ducted experimentally. It is found that it can be useful in reducingthe transmission of airborne infectious diseases. In order to dothis, smoke is used to visualize the airflow exhaled by asmuch as16 people. Their mouths were covered by several means, ascupped hands, fists, elbows, and tissues. Then that study devel-oped simplified models for predicting the airflow based onsmoke visualization data. It was found that covering a coughwith a tissue, a cupped hand, or an elbow can significantly reducethe exhaled air horizontal velocity and cause the particles tomove upward with the thermal plumes generated by a humanbody. In contrast with an uncovered cough, a covered cough or acough with the head turned away may prevent direct exposure.
Mathematical modeling is used for the prediction of thespread of the virus whether on a global scale like national oreven international scale using statistical models and also isused to predict the spread of the virus over building scales
by tracing the path of the infection particles using differentialequations. For a review on different models, see Kohanskiet al. (2020).
Regarding the mathematical modeling of airborne diseasesmodelled as aerosols, one could think of purely Eulerian tech-niques (Hijazi and Howieson 2018) or mixed Eulerian–Lagrangian techniques (Kim et al. 2012; Guo et al. n.d.) tobe able to capture or track the particles causing the infection,respectively. Using OpenFOAM package, Pendar and Páscoa(2020) applied a fully coupled Eulerian–Lagrangian techniqueresulting in a deeper understanding of the saliva-disease-carrier droplet transmission mechanisms. Dbouka andDrikakis (2020) used a mathematical model considering themultiphase nature of the phenomenon and considered heattransfer effects to investigate transport, dispersion, and evap-oration of saliva particles and they concluded that a furtherwork is required to quantify the influence of the environ-ment’s relative humidity (HR) and temperature. The effectof HR and the ambient wind on the value of the “physical-distancing” is investigated using Eulerian–Lagrangian
formulation by Feng et al. (2020) using computational fluid-particle dynamic (CFPD) simulations with the capability ofpredicting droplet size changes due to condensation andevaporation.
The goal of this paper is to study the transport of the cough-generated aerosol from a patient in a metro wagon subjected todifferent scenarios of ventilation rates and patient position andmake recommendations on the ventilation for reducing the risk ofinfection of COVID 19 and the similar airborne viruses.
The paper is structured as follows: in “The mathematicalmodel”, the mathematical model of the problem is stated,followed by describing the geometry, mesh, and the boundaryconditions of the cases in “Problem setup”. Results arediscussed in “Results and discussion”, and conclusions aredrawn in “Summary and conclusions”.
The mathematical model
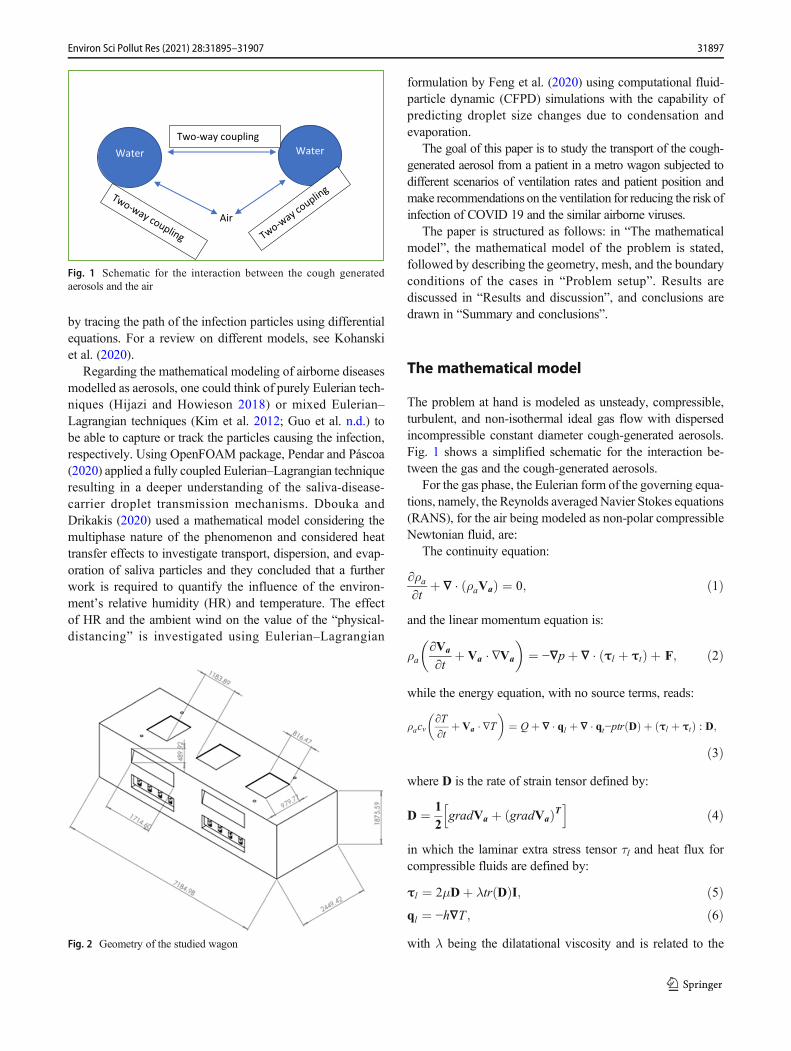
The problem at hand is modeled as unsteady, compressible,turbulent, and non-isothermal ideal gas flow with dispersedincompressible constant diameter cough-generated aerosols.Fig. 1 shows a simplified schematic for the interaction be-tween the gas and the cough-generated aerosols.
For the gas phase, the Eulerian form of the governing equa-tions, namely, the Reynolds averagedNavier Stokes equations(RANS), for the air being modeled as non-polar compressibleNewtonian fluid, are:
The continuity equation:
∂ρa∂t
þ ∇ � ρaVað Þ ¼ 0; ð1Þ
and the linear momentum equation is:
ρa∂Va
∂tþ Va � ∇Va
� �¼ −∇pþ ∇ � τl þ τtð Þ þ F; ð2Þ
while the energy equation, with no source terms, reads:
ρacv∂T∂t
þ Va � ∇T� �
¼ Qþ ∇ � ql þ ∇ � qt−ptr Dð Þ þ τl þ τtð Þ : D;
ð3Þwhere D is the rate of strain tensor defined by:
D ¼ 12
gradVa þ gradVað ÞTh i
ð4Þ
in which the laminar extra stress tensor τl and heat flux forcompressible fluids are defined by:
τl ¼ 2μDþ λtr Dð ÞI; ð5Þql ¼ −h∇T ; ð6Þwith λ being the dilatational viscosity and is related to the
Air
WaterWaterTwo-way coupling
Fig. 1 Schematic for the interaction between the cough generatedaerosols and the air
Fig. 2 Geometry of the studied wagon
31897Environ Sci Pollut Res (2021) 28:31895–31907
shear viscosity μ by the Stokes assumption λ ¼ −2�3μ and k
is the thermal conductivity. The dispersed cough-generatedaerosols are modeled using the Lagrangian approach. For ageneric water droplet, Newton’s second law reads:
dVw
dt¼ f
mð7Þ
in which f = fg + fs + fb is the total force as felt by the waterdroplet and fg is the force due to gravity, fs is the Stokes dragforce and fb is the buoyancy force. The force term appearing inthe momentum equation is related to the forces on the coughgenerated aerosols by the relation (Khare et al. 2015):
F ¼ −∑N
i¼1f i
∑N
i¼1Vi
; ð8Þ
And the energy source term in the energy equation is:
Q ¼ −∑N
i¼1f i � Vwð Þ
∑N
i¼1Vi
; ð9Þ
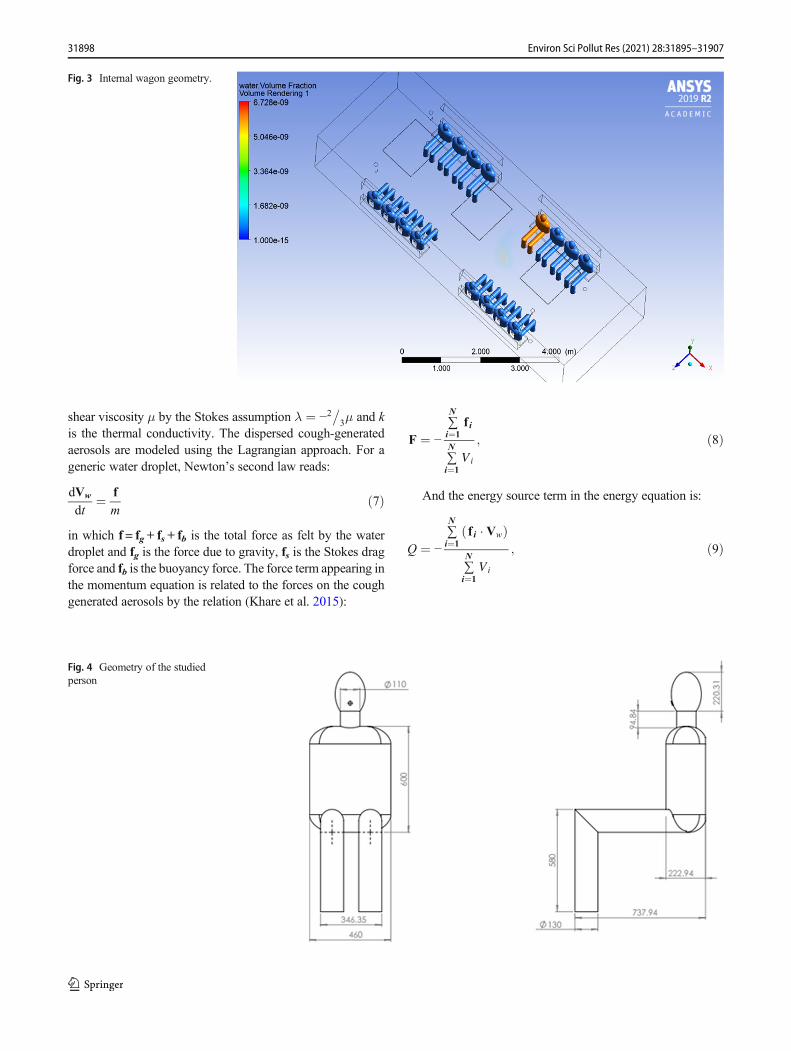
Fig. 3 Internal wagon geometry.
Fig. 4 Geometry of the studiedperson
31898 Environ Sci Pollut Res (2021) 28:31895–31907

Adopting the Boussinesq hypothesis for turbulence model-ing, the Reynolds stress tensor for compressible flows is givenby Couaillier (2000):
τt ¼ 2μtD−2
3ρk þ μt tr Dð Þ½ �I; ð10Þ
and the turbulent heat flux is:
qt ¼ −ht∇T ; ð11Þ
With the Boussinesq hypothesis, the turbulence problem isreduced to the determination of two variables, namely, theturbulent viscosity μt and the turbulent thermal conductivityht which are determined from appropriate turbulence modelspecifically in this work k-ω model.
The evolution equation for the turbulent kinetic energy is(Couaillier 2000):
ρa∂k∂t
þ Va � ∇k� �
¼ τt : Dþ ∇
� μþ μtð Þ∇k½ �−ρaε−R; ð12Þ
and for the dissipation rate of k is:
ρa∂ε∂t
þ Va � ∇ε� �
¼ 1:57εkτt : Dþ ∇ � μþ μt
1:3
� �∇ε
h i−2c
ε2
kþ E;
ð13Þ
with
R ¼ 2μ ∇ffiffiffik
p� 2;E ¼ 2μμt
ρ∂2Vt∂n2
� �2, c ¼ 1−0:3exp −Ret
2�
; ht ¼ cpμt Prt and Ret ¼ ρk2
με .
The turbulent viscosity is by (Couaillier 2000):
μt ¼ 0:09Retexp−2:5
1þ 0:02Ret
� �
In the above equations, ρa is the air density, Va is air ve-locity vector, p is the thermodynamics pressure to be deter-mined from the perfect gas equation of state, andm is the massof the water droplet.
Problem setup
Geometry
The geometry of the used metro wagon is illustrated in Fig. 2.The volume of the available space is 58 m3. It contains threeHVAC openings, with area of 0.8 m2 each and a distance of1.18 m between each other. The wagon has four windows,open with 15 degrees.
Besides, the wagon contains 4 seats, each one has threepeople, and so 12 people are located (one of them isconsidered to be infected and setting near to the centralventilation window, as illustrated in Fig. 3). Dimensions ofthe person’s model are shown in Fig. 4.
Mesh
The meshing sizing is as follows: mesh element size over allthe faces and mouths is 5 mm, 20 mm over the bodies, and50 mm in the rest of the domain. Hence, the total number ofelements is 7.8 million. The mesh is demonstrated in Figs. 5and 6, and the mesh statistics is listed in Table 1.
Table 1 Mesh properties
Property Average Standard Deviation
Aspect ratio 1.99 1.42
Orthogonality 0.73 0.14
Skewness 0.27 0.14
Quality 0.81 0.11
Fig. 5 Side cross-section of theused mesh
31899Environ Sci Pollut Res (2021) 28:31895–31907

Boundary conditions
The boundary conditions for exhalation can be summarized asfollows (Gupta et al. 2009; Gupta et al. 2011; Wen et al.2020): air speed of coughing changes according to the lungsize, which can be approximated to Gamma function that isdescribed by three main parameters: Cough Peak Flow Rate(CPFR), Peak Velocity Time (PVT), and Cough ExpiredVolume (CEV) that is the area under the curve in Fig. 7.These parameters are correlated by the patient’s length andmass, as in the equations below.
Cough Peak Flow Rate (CPFR)
CPFR l=sð Þ ¼ −8:8980þ 6:3952 h mð Þþ 0:0346 w kgð Þ; for male ð14Þ
CPFR l=sð Þ ¼ −3:9702þ 4:6265 h mð Þ; for female ð15Þ
Cough Expired Volume (CEV)
CEV lð Þ ¼ 0:138CPFR 1=sð Þ þ 02983; for male ð16Þ
CEV lð Þ ¼ 0:0204 CPFR 1=sð Þ−0:043; for female ð17Þ
Peak Velocity Time (PVT)
PVT msð Þ ¼ 1:360 CPFR 1=sð Þ þ 65:860; for male ð18ÞPVT msð Þ ¼ 3:152 CPFR 1=sð Þ þ 64:631; for female ð19Þ
Mouth opening area (MOA)
MOA ¼ 4� 0:95 cm2; for male ð20ÞMOA ¼ 3:370� 1:40 cm2; for female ð21Þ
Size distribution and quantity of the droplets also changeconsiderably according to the exit from the infected person.As shown in Table 2, themost critical case is coughing; hence,it is decided in this article to investigate coughing in a metrowagon.
It is assumed that all the droplets exhaled during coughingare of one size of 8.5 μm. Coughing velocity of the cough ispresented in Fig. 7, and the respiration follows Equation 22. Itis assumed that all people breathe and cough from mouth tohave more realistic flow behavior; different people have dif-ferent phase shifts.
Vbreath ¼ 4:5 sin ω t þ Sð Þ m=s½ � ð22Þwhere ω is the breathing frequency, t is time, and S is the phaseshift. It is assumed that the normal breath rate is 17 per minute,and the phase shift varies to make the flow inside the wagon
Fig. 6 Front cross-section of the used mesh
Fig. 7 Variation of coughing velocity with time
Table 2 Size distribution and quantity of the droplets [ref_20]
Exhalation Droplet Diameter (μm) Number of droplets
Coughing 8.5 106 per cough
Breathing 0.4 525 per breath
Talking 30 2250 for 15 sec of talk
31900 Environ Sci Pollut Res (2021) 28:31895–31907

more realistic. Temperatures of the bodies are 32 and 33 °Cfor the healthy and sick people, respectively.
Considering the wagon, wall temperature is 25 °C, and thewalls have no-slip condition. The ventilation flow rate variesfrom 16 to 40 cubic feet per minute (CFM), and the tempera-ture is 18 °C. For brevity, all the boundary conditions arepresented in Table 3.
Results and discussion
In order to quantify the risk of COVID-19 propagation, a casestudy is simulated as follows. At time 0, one patient coughs,exhaling air-water mixture, while other people breathe nor-mally, and the ventilation system continuously supplies freshair. It is assumed that water is initially dispersed, and the
infection is carried on these droplets. Hence, the water contentin the whole metro wagon is used to identify the presence ofthe infection. Namely, the ratio of water volume divided bythe whole volume of the wagon is measured in this study. Thesimulations are done using ANSYS CFX on 64 cores. Thecomputational time for one simulation is 576 hours/core.
Three sets of numerical simulations were conducted. Thefirst set simulates the patient to sit close to the ventilationsuction window, which represents the best-case scenario,and the flow rate of the ventilation system changes from 16to 40 CFM per passenger, corresponding to air changes perhour (ACPH) of 0.47 to 1.17 which were calculated usingEquation (23).
ACPH ¼ 60*CFM=volume ð23Þ
The second set represents the case where the patient sitsaway from the ventilation suction window, which representsthe worst-case scenario, and the ventilation flow rate changesalso. The third and fourth cases study the window’s effect, by
Table 3 Boundary conditions
Boundary Property Value
Bodies Velocity No slip
Temp Sick: 33/healthy: 32 °C
Mouths Velocity Equation 22, Fig. 7
Temp Sick: 33/healthy: 31 °C
Droplets Size 8.5 μm
Water volume fraction 3.216e − 7
Seat Velocity No slip
Temp Adiabatic
HVAC Inlet volume flow rate 16, 24, 32, 40 CFM per person
Inlet air temperature 18 °C
Turbulence intensity Medium (5%)
Wagon wall Velocity No slip
Temp 25
Table 4 Investigated casesCase number Volume flow rate Window status Patient position
ACPH CFM
1 0.47 16 Closed Close to air exit window
2 0.70 24 Closed Close to air exit window
3 0.94 32 Closed Close to air exit window
4 1.17 40 Closed Close to air exit window
5 0.47 16 Closed Close to air inlet window
6 0.70 24 Closed Close to air inlet window
7 0.94 32 Closed Close to air inlet window
8 1.17 40 Closed Close to air inlet window
9 0.47 16 Open Close to air exit window
10 0.70 24 Open Close to air exit window
11 0.47 16 Open Close to air inlet window
Fig. 8 Couching and breathing velocity profiles
31901Environ Sci Pollut Res (2021) 28:31895–31907

comparing cases where the wagon windows are closed withthose where the windows are open, in both the best and worstcases. In these cases, the ventilation flow rate changes from 16to 24 CFM. The simulated cases are summarized in Table 4.
Best-case scenario
In this simulation, the patient starts coughing, according to thedefault coughing profile shown in Fig. 8, then breathes nor-mally, as the other passengers. While coughing, the ratio ofwater volume divided by the whole space volume was notedhere by Water Volume Ratio (WVR), increases. Besides, theventilation system continuously supplies fresh air to the wag-on and throws out the old. Through this process, the old airand water are removed out from the wagon, and hence, theWVR decreases with time.
It can be seen from Fig. 9 that as time increases, the WVRdecreases suddenly, then decays exponentially. Both sudden
and exponential rates depend on the ventilation flow rate.WVR reduced to 50% of its maximum in 280 seconds forthe 0.468136 ACPH case, while it takes 184 and 134 secondsfor 0.702204 and 0.936271 ACPH and 110 seconds for1.170339 ACPH.
After 10 minutes, WVR reached 19%, 6%, 2%, and 0.5%for 0.468136, 0.702204, 0.936271, and 1.170339 ACPH perpassenger. This shows that increasing the flow rate from0.468136 to 0.702204 ACPH reduces the danger of infection,while the change from 0.936271 to 1.170339 does not have asignificant effect.
Worst-case scenario
In this scenario, the patient sits far from the ventilation exit;hence, cough-generated aerosols take longer time to go out, asshown in Fig. 10. In this figure, the best and worst cases,denoted by Cases I and II, are compared together, for 16
Fig. 9 Aerosol retention in thebest-case scenario
Fig. 10 Aerosol retention in thebest and worst scenarios
31902 Environ Sci Pollut Res (2021) 28:31895–31907

CFM. It is shown that the initial WVR rises in both cases aresimilar, till 100 seconds. Then Case I starts the exponentialWVR reduction with higher rate compared to the other case.This make WVR reach 50% of its maximum in 444 seconds,compared to 280 seconds for Case I, i.e., 58% more time.After 10 minutes, WVR for Case II is 35% compared to19%. This indicates the large variation generated from thelocation of the patient with respect to the ventilation exitwindow.
It can be seen from Fig. 11 that as time increases, the WVRlevel is maintained constant then decreases exponentially.Both being-constant time and decaying rate depend on theventilation flow rate. WVR reduced to 50% of its maximumin 451 seconds for the 16 CFM case, while it takes 339 and276 seconds for 24 and 32CFM and 219 seconds for 40 CFM.After 10 minutes, WVR reached 35%, 20%, 12%, and 7% for16, 24, 32, and 40 CFM per passenger. This shows again thatincreasing the flow rate from 16 to 24 CFM reduces the
danger of infection, while the change from 32 to 40 does notproduce a significant effect. Also, it indicates that sitting awayfrom the ventilation exit can dramatically increase the infec-tion probability, as the ventilation inlet air can block the cir-culation of the air and the cough-generated aerosols would betrapped in one region of the wagon. Another evidence for the“circulation blockage” is that for the highest flow rate thewater volume reached the highest value compared to all othercases, which means that the droplets were not allowed to exitthe domain because of the high flow rate that blocked the pathto the exit in front of the droplets. This shall be investigated indetail in a further study.
Window’s effect
As illustrated in Fig. 12, opening windows can lead to consid-erable reduction in WVR. Quantitatively speaking, to reach50% WVR, it takes 167 seconds for the 16 CFM open case,
Fig. 11 Aerosol retention in theworst-case scenario
Fig. 12 Aerosol retention in theclosed and open windowconditions—best-case scenario
31903Environ Sci Pollut Res (2021) 28:31895–31907
compared to 280 seconds for the closed window case, i.e.,40% less time. After 10 minutes, WVR reached 5% comparedto 19% of the closed window case. Hence, one concludes theimportance of keeping the windows open to reduce the infec-tion risk.
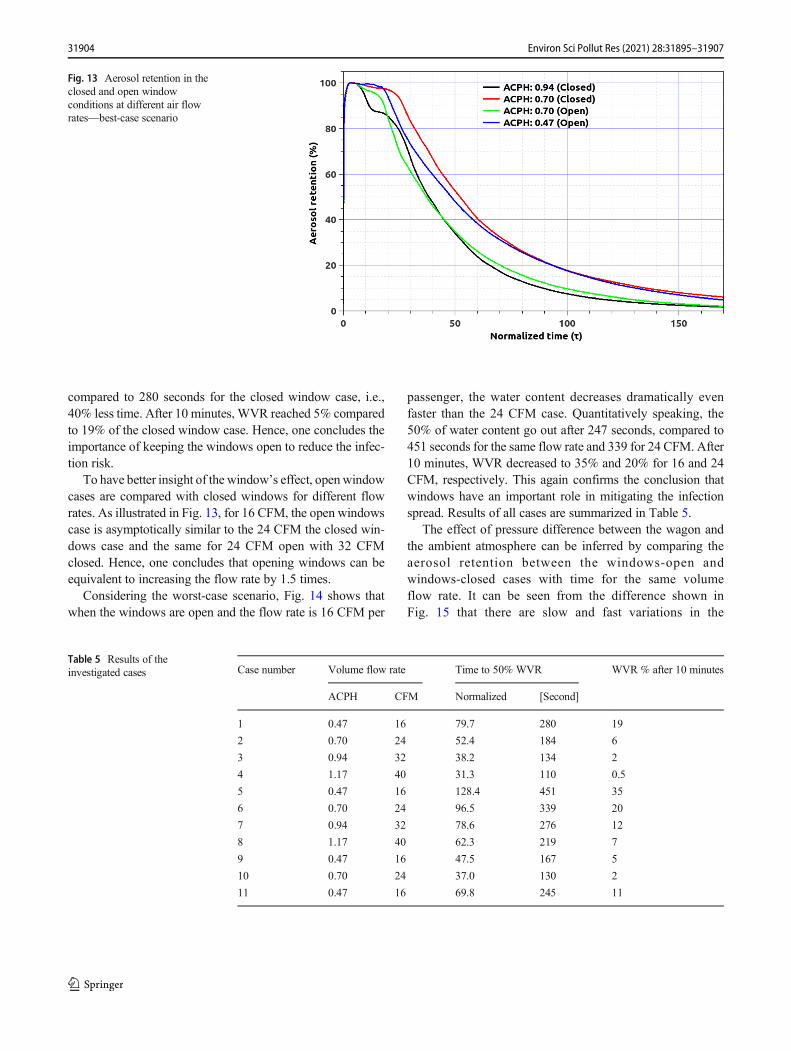
To have better insight of the window’s effect, openwindowcases are compared with closed windows for different flowrates. As illustrated in Fig. 13, for 16 CFM, the open windowscase is asymptotically similar to the 24 CFM the closed win-dows case and the same for 24 CFM open with 32 CFMclosed. Hence, one concludes that opening windows can beequivalent to increasing the flow rate by 1.5 times.
Considering the worst-case scenario, Fig. 14 shows thatwhen the windows are open and the flow rate is 16 CFM per
passenger, the water content decreases dramatically evenfaster than the 24 CFM case. Quantitatively speaking, the50% of water content go out after 247 seconds, compared to451 seconds for the same flow rate and 339 for 24 CFM. After10 minutes, WVR decreased to 35% and 20% for 16 and 24CFM, respectively. This again confirms the conclusion thatwindows have an important role in mitigating the infectionspread. Results of all cases are summarized in Table 5.
The effect of pressure difference between the wagon andthe ambient atmosphere can be inferred by comparing theaerosol retention between the windows-open andwindows-closed cases with time for the same volumeflow rate. It can be seen from the difference shown inFig. 15 that there are slow and fast variations in the
Fig. 13 Aerosol retention in theclosed and open windowconditions at different air flowrates—best-case scenario
Table 5 Results of theinvestigated cases Case number Volume flow rate Time to 50% WVR WVR % after 10 minutes
ACPH CFM Normalized [Second]
1 0.47 16 79.7 280 19
2 0.70 24 52.4 184 6
3 0.94 32 38.2 134 2
4 1.17 40 31.3 110 0.5
5 0.47 16 128.4 451 35
6 0.70 24 96.5 339 20
7 0.94 32 78.6 276 12
8 1.17 40 62.3 219 7
9 0.47 16 47.5 167 5
10 0.70 24 37.0 130 2
11 0.47 16 69.8 245 11
31904 Environ Sci Pollut Res (2021) 28:31895–31907

difference. The fast variation is most probably due tothe breathing of the passengers, while the short varia-tion is due to the pressure difference between the wagonand ambiance.
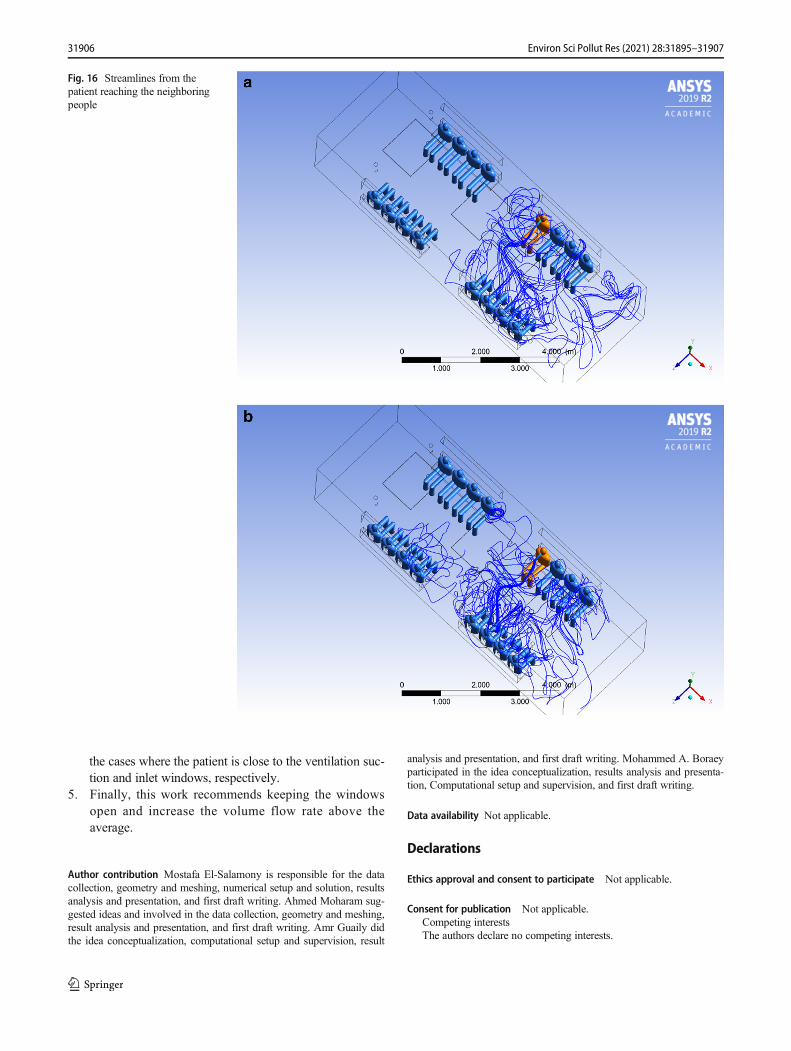
Streamline visualization
Considering the streamlines starting from the patient, shownin Fig. 16, they usually affect the one sitting in front of himand the one beside him. Those who sit aligned with the patientand beside the suction window have the least probability ofinfection. It rarely propagates in the sides, but in some cases,the streamlines may reach the furthest person, but the aerosolcontent tends to zero, as shown below, where the streamlines
reach all people. As a conclusion, it is better to stay nearwindows and the ventilation windows.
Summary and conclusions
The effect of ventilation systems on the spread of airbornediseases like COVID-19 is numerically investigated usingEulerian–Lagrangian approach considering turbulence andthermal effects. The infection particles are modeled as beingaerosol particles. From the simulation results, the followingconclusions are clear:
1. Opening the windows helps in changing the air inside thewagon. Quantitatively speaking, opening windows re-duced the time required to reach 50% WVR by 40%, forthe same ACPH.
2. By increasing the ventilation inlet flow rate, the infectionspreading decreases considerably. In the current simula-tion, increasing the ACPH from 0.47 to 0.7 reduced theWVR from 19% to 6% after 10 minutes.
3. As the HVAC inlet flow rate increases beyond a certainvalue, the infection hazard does not show much differ-ence. Changing the ACPH value from 0.7 to 0.94 reducedthe WVR from 6% to 2% after 10 minutes.
4. The position of the infected person relative to the ventila-tion windows has a major role in the infection spreading.The closer the infected person to the suction ventilationwindow is, the faster the cough generated aerosols leavethe wagon. In the best-case scenario, after 10 minutesfrom the cough, the WVR values are 19% and 35% for
Fig. 14 Aerosol retention in theclosed and open windowconditions—worst-case scenario
Fig. 15 Difference in aerosol retention between the windows-open adwindows-closed cases
31905Environ Sci Pollut Res (2021) 28:31895–31907
the cases where the patient is close to the ventilation suc-tion and inlet windows, respectively.
5. Finally, this work recommends keeping the windowsopen and increase the volume flow rate above theaverage.
Author contribution Mostafa El-Salamony is responsible for the datacollection, geometry and meshing, numerical setup and solution, resultsanalysis and presentation, and first draft writing. Ahmed Moharam sug-gested ideas and involved in the data collection, geometry and meshing,result analysis and presentation, and first draft writing. Amr Guaily didthe idea conceptualization, computational setup and supervision, result
analysis and presentation, and first draft writing. Mohammed A. Boraeyparticipated in the idea conceptualization, results analysis and presenta-tion, Computational setup and supervision, and first draft writing.
Data availability Not applicable.
Declarations
Ethics approval and consent to participate Not applicable.
Consent for publication Not applicable.Competing interestsThe authors declare no competing interests.
Fig. 16 Streamlines from thepatient reaching the neighboringpeople
31906 Environ Sci Pollut Res (2021) 28:31895–31907
References
Abbasi F, Samaei MR (2019) The effect of temperature on airbornefilamentous fungi in the indoor and outdoor space of a hospital.Environ Sci Pollut Res 26:16868–16876
Ahmed AW, Mahrous M, El Monem NA (2020) Sustainable and greentransportation for better quality of life case study greater Cairo–Egypt. HBRC J 16(1):17–37
Andrade A, Dominski FH, Pereira ML, de Liz CM, Buonanno G (2018)Infection risk in gyms during physical exercise. Environ Sci PollutRes 25:19675–19686
Awad AHA (2002) Environmental study in subway metro stations inCairo, Egypt. J Occup Health 44(2):112–118
Chun C, Lin C-H, Zheng J, Chen Q (2014) Simplified models for exhaledairflow from a cough with the mouth covered. Indoor Air 24(6):580–591
Correia G, Rodrigues L, SilvaMG, Calves TG (2020) Airborne route andbad use of ventilation systems as non-negligible factors in SARS-CoV-2 transmission. Med Hypotheses 141:109781
Couaillier V (2000) Turbulent compressible flow computations. In:Peyret R, Krause E (eds) Advanced Turbulent FlowComputations. International Centre for Mechanical Sciences(Courses and Lectures), vol 395. Springer, Vienna
Dbouka T, Drikakis D (2020) On coughing and airborne droplet trans-mission to humans. Phys Fluids 32:053310
Eldeeb MM, Qotb AS, Riad HS, Ashour AM (2018) Optimal operationinteraction (passenger/train/platform) for GreaterCairoUnderground metro (GCUM) 1st and 2nd line. Ain Shams Eng J9(4):3067–3076
Eldeeb MM, Kotb AS, Riad HS, Ashour AA (2019) Passenger Capacityof Underground Metro by the Use of Neural Net-work Program(NNP). Int J Innov Technol Explor Eng 8(10):2469–2473
Feng Y, Marchal T, Sperry T, Yi H (2020) Influence of wind and relativehumidity on the social distancing effectiveness to prevent COVID-19 airborne transmission: a numerical study. J Aerosol Sci 147:105585
Ghanizadeh F, Godini H (2018) A review of the chemical and biologicalpollutants in indoor air in hospitals and assessing their effects on thehealth of patients, staff and visitors. Rev Environ Health 33(3):231–245
Guo L, Hu Y, Hu Q, Lin J, Li C, Chen J, Li L, Hongbo F Characteristicsand chemical compositions of particulate matter collected at theselected metro stations of Shanghai, China. Sci Total Environ496(2014):443–452
Gupta JK, Lin C-H, Chen Q (2009) Flow dynamics and characterizationof a cough. Indoor Air 19(6):517–525
Gupta JK, Lin C-H, Chen Q (2011) Transport of expiratory droplets in anaircraft cabin. Indoor Air 21(1):3–11
Hijazi J, Howieson S (2018) Displacing air conditioning in Kingdom ofSaudi Arabia: an evaluation of ‘fabric first design integrated withhybrid night radiant and ground pipe cooling systems. Build ServEng Res Technol 39(4):377–390
Khare P, Wang S, Yang V (2015) Modeling of finite-size droplets andparticles in multiphase flows. Chin J Aeronaut 28(4):974–982
KimMJ, Sankara Rao B, Kang OY, Kim JT, Yoo CK (2012) Monitoringand prediction of indoor air quality (IAQ) in sub-way or metrosystems using season dependent models. Energy Build 46:48–55
Kohanski MA, Lo LJ, Waring MS (2020) Review of indoor aerosolgeneration, transport, and control in the context of COVID‐19. InInternational forum of allergy & rhinology 10(10):1173–1179
Krarti M, Ihm P (2016) Evaluation of net-zero energy-residential build-ings in the MENA region. Sustain Cities Soc 22:116–125
Kwon S-B, Jeong W, Park D, Kim K-T, Cho KH (2015) A multivariatestudy for characterizing particulate matter (PM10, PM2. 5, andPM1) in Seoul metropolitan subway stations, Korea. J HazardMater 297:295–303
Marcone V (2020) Reduction of contagion risks by SARS-Cov-2(COVID-19) in air-conditioned work environments. Pain Phys23(4S):S475–S482
Martins V, Moreno T, MinguilĺonMC, Amato F, deMiguel E, CapdevilaM, Querol X (2015) Exposure toairborne particulate matter in thesubway system. Sci Total Environ 511:711–722
Morawska L, Tang JW, Bahnfleth W, MBluyssen P, Boerstra A,Buonanno G, Cao J, Dancer S, Floto A, Franchimon F et al Howcan airborne trans-mission of COVID-19 indoors be minimised?Environ Int 142(2020):105832
PendarM-R, Páscoa JC (2020) Numerical modeling of the distribution ofvirus carrying saliva droplets during sneeze and cough. Phys Fluids32(8):083305
Qiao T, Xiu G, Zheng Y, Yang J, Wang L (2015) Characterization of PMandmicroclimate in a Shanghai subway tunnel, China. Procedia Eng102:1226–1232
Wen Y, Leng J, Shen X, Han G, Sun L, Yu F (2020) Environmental andhealth effects of ventilation in subway stations: a literature review.Int J Environ Res Public Health 17(3):1084
Yan C, Zheng M, Yang Q, Zhang Q, Qiu X, Zhang Y, Huaiyu F, Li X,Zhu T, Zhu Y (2015) Commuter exposure to particulate matter andparticle-bound PAHs in three transportation modes in Beijing,China. EnvironmentalPollution 204:199–206
Zhu S, Kato S, Yang J-H (2006) Study on trans-port characteristics ofsaliva droplets produced by coughing in a calm in-door environ-ment. Build Environ 41(12):1691–1702
Publisher’s note Springer Nature remains neutral with regard to jurisdic-tional claims in published maps and institutional affiliations.
31907Environ Sci Pollut Res (2021) 28:31895–31907