Embed Size (px)
Citation preview
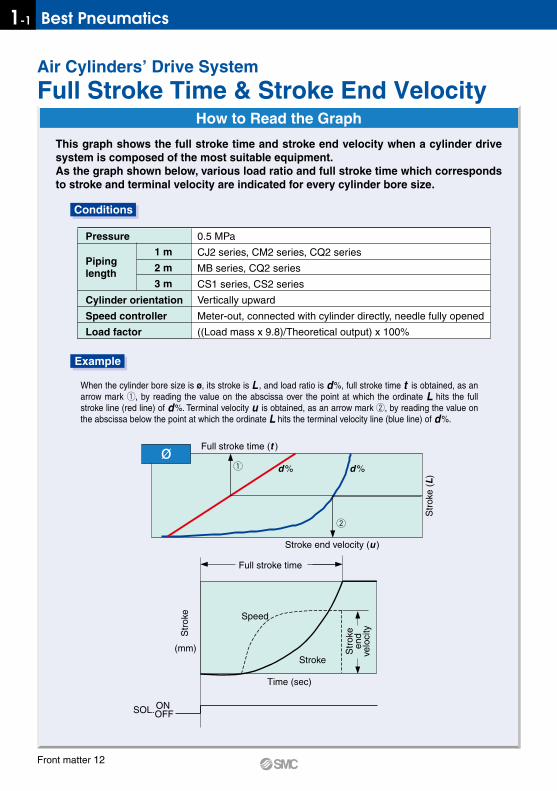
How to Read the Graph
This graph shows the full stroke time and stroke end velocity when a cylinder drive system is composed of the most suitable equipment.As the graph shown below, various load ratio and full stroke time which corresponds to stroke and terminal velocity are indicated for every cylinder bore size.
When the cylinder bore size is ø, its stroke is L , and load ratio is d%, full stroke time t is obtained, as an arrow mark q, by reading the value on the abscissa over the point at which the ordinate L hits the full stroke line (red line) of d%. Terminal velocity u is obtained, as an arrow mark w, by reading the value on the abscissa below the point at which the ordinate L hits the terminal velocity line (blue line) of d%.
ø Full stroke time (t )
Stroke end velocity (u )
Air Cylinders’ Drive System
Full Stroke Time & Stroke End Velocity
Pressure
Cylinder orientation
Speed controller
Load factor
Piping length
0.5 MPa
CJ2 series, CM2 series, CQ2 series
MB series, CQ2 series
CS1 series, CS2 series
Vertically upward
Meter-out, connected with cylinder directly, needle fully opened
((Load mass x 9.8)/Theoretical output) x 100%
1 m
2 m
3 m
Conditions
Example
Str
oke
(L)
Full stroke time
Stroke
Speed
Time (sec)
(mm)
SOL. ON OFF
Str
oke
Str
oke
end
ve
loci
ty
q
w
d % d %
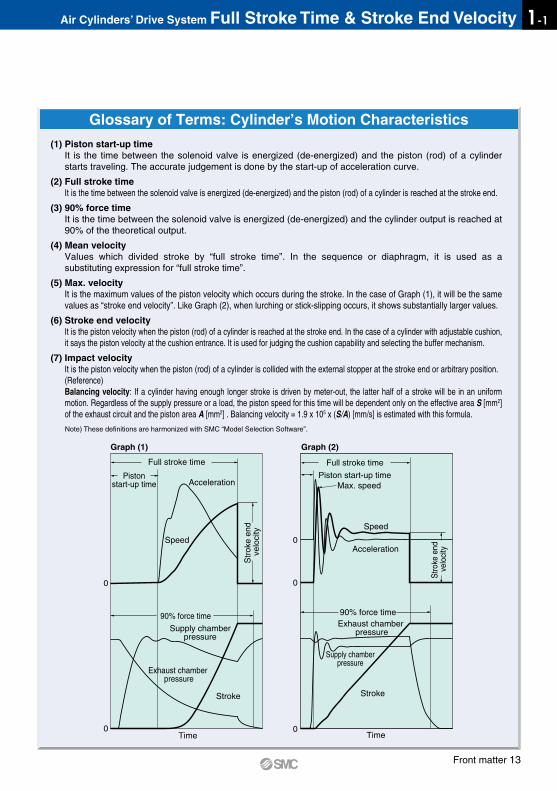
Glossary of Terms: Cylinder’s Motion Characteristics
(1) Piston start-up time It is the time between the solenoid valve is energized (de-energized) and the piston (rod) of a cylinder starts traveling. The accurate judgement is done by the start-up of acceleration curve.
(2) Full stroke timeIt is the time between the solenoid valve is energized (de-energized) and the piston (rod) of a cylinder is reached at the stroke end.
(3) 90% force timeIt is the time between the solenoid valve is energized (de-energized) and the cylinder output is reached at 90% of the theoretical output.
(4) Mean velocityValues which divided stroke by “full stroke time”. In the sequence or diaphragm, it is used as a substituting expression for “full stroke time”.
(5) Max. velocityIt is the maximum values of the piston velocity which occurs during the stroke. In the case of Graph (1), it will be the same values as “stroke end velocity”. Like Graph (2), when lurching or stick-slipping occurs, it shows substantially larger values.
(6) Stroke end velocityIt is the piston velocity when the piston (rod) of a cylinder is reached at the stroke end. In the case of a cylinder with adjustable cushion, it says the piston velocity at the cushion entrance. It is used for judging the cushion capability and selecting the buffer mechanism.
(7) Impact velocityIt is the piston velocity when the piston (rod) of a cylinder is collided with the external stopper at the stroke end or arbitrary position. (Reference)Balancing velocity: If a cylinder having enough longer stroke is driven by meter-out, the latter half of a stroke will be in an uniform motion. Regardless of the supply pressure or a load, the piston speed for this time will be dependent only on the effective area S [mm2] of the exhaust circuit and the piston area A [mm2] . Balancing velocity = 1.9 x 10⁵ x (S/A) [mm/s] is estimated with this formula.
Full stroke time
Pistonstart-up time Acceleration
Speed
Time
0
0
90% force time
Exhaust chamber pressure
Supply chamberpressure
Stroke
Graph (1)
Note) These definitions are harmonized with SMC “Model Selection Software”.
Str
oke
end
velo
city
Full stroke time
Piston start-up time
Acceleration
Speed
Time
0
0
0
Max. speed
90% force timeExhaust chamber
pressure
Supply chamberpressure
Stroke
Graph (2)
Stro
ke e
nd
velo
city
Front matter 12
1-1 Best Pneumatics
How to Read the Graph
This graph shows the full stroke time and stroke end velocity when a cylinder drive system is composed of the most suitable equipment.As the graph shown below, various load ratio and full stroke time which corresponds to stroke and terminal velocity are indicated for every cylinder bore size.
When the cylinder bore size is ø, its stroke is L , and load ratio is d%, full stroke time t is obtained, as an arrow mark q, by reading the value on the abscissa over the point at which the ordinate L hits the full stroke line (red line) of d%. Terminal velocity u is obtained, as an arrow mark w, by reading the value on the abscissa below the point at which the ordinate L hits the terminal velocity line (blue line) of d%.
ø Full stroke time (t )
Stroke end velocity (u )
Air Cylinders’ Drive System
Full Stroke Time & Stroke End Velocity
Pressure
Cylinder orientation
Speed controller
Load factor
Piping length
0.5 MPa
CJ2 series, CM2 series, CQ2 series
MB series, CQ2 series
CS1 series, CS2 series
Vertically upward
Meter-out, connected with cylinder directly, needle fully opened
((Load mass x 9.8)/Theoretical output) x 100%
1 m
2 m
3 m
Conditions
Example
Str
oke
(L)
Full stroke time
Stroke
Speed
Time (sec)
(mm)
SOL. ON OFF
Str
oke
Str
oke
end
ve
loci
ty
q
w
d % d %
Glossary of Terms: Cylinder’s Motion Characteristics
(1) Piston start-up time It is the time between the solenoid valve is energized (de-energized) and the piston (rod) of a cylinder starts traveling. The accurate judgement is done by the start-up of acceleration curve.
(2) Full stroke timeIt is the time between the solenoid valve is energized (de-energized) and the piston (rod) of a cylinder is reached at the stroke end.
(3) 90% force timeIt is the time between the solenoid valve is energized (de-energized) and the cylinder output is reached at 90% of the theoretical output.
(4) Mean velocityValues which divided stroke by “full stroke time”. In the sequence or diaphragm, it is used as a substituting expression for “full stroke time”.
(5) Max. velocityIt is the maximum values of the piston velocity which occurs during the stroke. In the case of Graph (1), it will be the same values as “stroke end velocity”. Like Graph (2), when lurching or stick-slipping occurs, it shows substantially larger values.
(6) Stroke end velocityIt is the piston velocity when the piston (rod) of a cylinder is reached at the stroke end. In the case of a cylinder with adjustable cushion, it says the piston velocity at the cushion entrance. It is used for judging the cushion capability and selecting the buffer mechanism.
(7) Impact velocityIt is the piston velocity when the piston (rod) of a cylinder is collided with the external stopper at the stroke end or arbitrary position. (Reference)Balancing velocity: If a cylinder having enough longer stroke is driven by meter-out, the latter half of a stroke will be in an uniform motion. Regardless of the supply pressure or a load, the piston speed for this time will be dependent only on the effective area S [mm2] of the exhaust circuit and the piston area A [mm2] . Balancing velocity = 1.9 x 10⁵ x (S/A) [mm/s] is estimated with this formula.
Full stroke time
Pistonstart-up time Acceleration
Speed
Time
0
0
90% force time
Exhaust chamber pressure
Supply chamberpressure
Stroke
Graph (1)
Note) These definitions are harmonized with SMC “Model Selection Software”.
Str
oke
end
velo
city
Full stroke time
Piston start-up time
Acceleration
Speed
Time
0
0
0
Max. speed
90% force timeExhaust chamber
pressure
Supply chamberpressure
Stroke
Graph (2)
Stro
ke e
nd
velo
city
Front matter 13
1-1Air Cylinders’ Drive System Full Stroke Time & Stroke End Velocity
Full stroke time (sec)
0.0 0.1 0.2 0.3 0.4 0.5 0.6 0.7 0.8 0.9 1.0
60
45
30
15
0
100
75
50
25
0
100
75
50
25
0
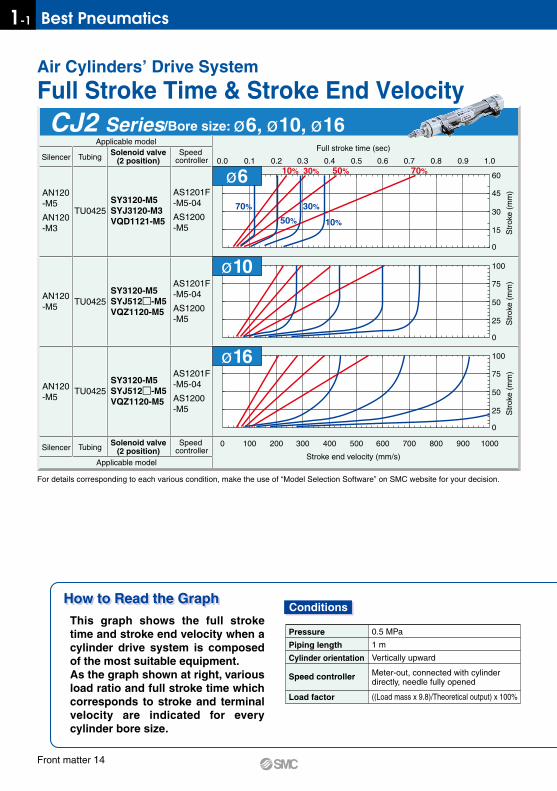
This graph shows the full stroke time and stroke end velocity when a cylinder drive system is composed of the most suitable equipment.As the graph shown at right, various load ratio and full stroke time which corresponds to stroke and terminal velocity are indicated for every cylinder bore size.
10% 30% 50% 70%
70%
50%
30%
10%
ø6
ø10
ø16
Stroke end velocity (mm/s)
0 100 200 300 400 500 600 700 800 900 1000
For details corresponding to each various condition, make the use of “Model Selection Software” on SMC website for your decision.
CJ2 Series/Bore size: ø6, ø10, ø16
Air Cylinders’ Drive System
Full Stroke Time & Stroke End Velocity
Pressure
Piping length
Cylinder orientation
Speed controller
Load factor
0.5 MPa
1 m
Vertically upward
Meter-out, connected with cylinder directly, needle fully opened
((Load mass x 9.8)/Theoretical output) x 100%
ConditionsHow to Read the GraphHow to Read the GraphHow to Read the Graph
Str
oke
(mm
)S
trok
e (m
m)
Str
oke
(mm
)
Applicable model
Silencer TubingSpeed
controllerSolenoid valve
(2 position)
AN120-M5
AN120-M3
TU0425
AS1201F-M5-04
AS1200-M5
SY3120-M5SYJ3120-M3VQD1121-M5
AN120-M5 TU0425
AS1201F-M5-04
AS1200-M5
SY3120-M5SYJ512-M5VQZ1120-M5
AN120-M5
TU0425
AS1201F-M5-04
AS1200-M5
SY3120-M5SYJ512-M5VQZ1120-M5
Applicable model
Silencer TubingSpeed
controllerSolenoid valve
(2 position)
CM2 Series/Bore size: ø20, ø25, ø32, ø40
When the cylinder bore size is ø, its stroke is L , and load ratio is d%, full stroke time t is obtained, as an arrow mark q, by reading the value on the abscissa over the point at which the ordinate L hits the full stroke line (red line) of d%. Terminal velocity u is obtained, as an arrow mark w, by reading the value on the abscissa below the point at which the ordinate L hits the terminal velocity line (blue line) of d%.
Example
ø Full stroke time (t )
Stroke end velocity (u)
q
w
d% d%
Full stroke time
Stroke
Speed
Time (sec)SOL
ONOFF
Str
oke
( L)
Str
oke
(mm
)
Str
oke
end
velo
city
Applicable modelFull stroke time (sec)
0.0 0.1 0.2 0.3 0.4 0.5 0.6 0.7 0.8 0.9 1.0
Stroke end velocity (mm/s)
0 100 200 300 400 500 600 700 800 900 1000
200
150
100
50
0
Silencer TubingSpeed
controllerSolenoid valve
(2 position)
Applicable model
Silencer TubingSpeed
controllerSolenoid valve
(2 position)
AN120-M5
TU0425
AS2201F-01-04
AS2200-01
SY3120-M5SYJ5120-M5VQ1160-M5
AN120-M5
TU0425
AS2201F-01-04
AS2200-01
SY3120-M5SYJ5120-M5VQ1160-M5
ANB1-01
AN101-01
TU0604
AS2201F-01-06
AS2200-01
SY5120-01SX5120-01
ANB1-01
AN101-01
TU0604
AS2201F-02-06
AS2200-02
SY5120-01SX5120-01
Str
oke
(mm
)
200
150
100
50
0
Str
oke
(mm
)
200
150
100
50
0
Str
oke
(mm
)
200
150
100
50
0
Str
oke
(mm
)
10% 30% 50% 70%ø20
ø25
ø32
ø40
10%
30%50%70%
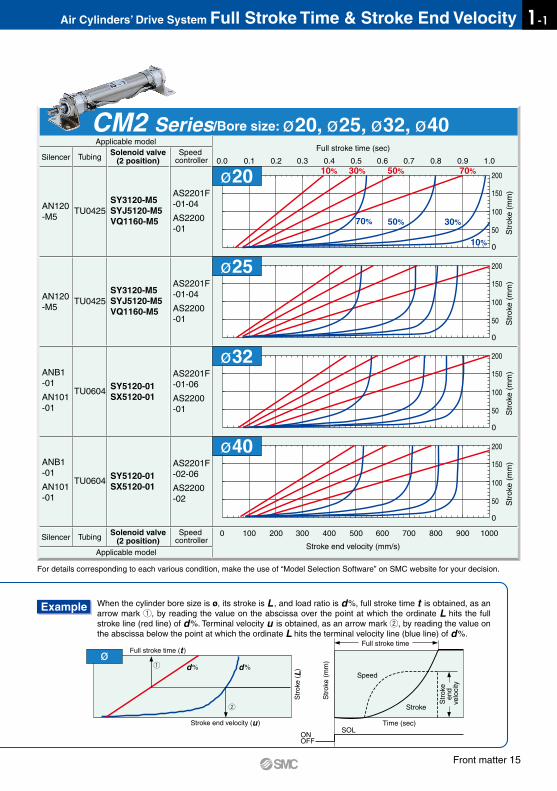
For details corresponding to each various condition, make the use of “Model Selection Software” on SMC website for your decision.
Front matter 14
1-1 Best Pneumatics
Full stroke time (sec)
0.0 0.1 0.2 0.3 0.4 0.5 0.6 0.7 0.8 0.9 1.0
60
45
30
15
0
100
75
50
25
0
100
75
50
25
0
This graph shows the full stroke time and stroke end velocity when a cylinder drive system is composed of the most suitable equipment.As the graph shown at right, various load ratio and full stroke time which corresponds to stroke and terminal velocity are indicated for every cylinder bore size.
10% 30% 50% 70%
70%
50%
30%
10%
ø6
ø10
ø16
Stroke end velocity (mm/s)
0 100 200 300 400 500 600 700 800 900 1000
For details corresponding to each various condition, make the use of “Model Selection Software” on SMC website for your decision.
CJ2 Series/Bore size: ø6, ø10, ø16
Air Cylinders’ Drive System
Full Stroke Time & Stroke End Velocity
Pressure
Piping length
Cylinder orientation
Speed controller
Load factor
0.5 MPa
1 m
Vertically upward
Meter-out, connected with cylinder directly, needle fully opened
((Load mass x 9.8)/Theoretical output) x 100%
ConditionsHow to Read the GraphHow to Read the GraphHow to Read the Graph
Str
oke
(mm
)S
trok
e (m
m)
Str
oke
(mm
)
Applicable model
Silencer TubingSpeed
controllerSolenoid valve
(2 position)
AN120-M5
AN120-M3
TU0425
AS1201F-M5-04
AS1200-M5
SY3120-M5SYJ3120-M3VQD1121-M5
AN120-M5 TU0425
AS1201F-M5-04
AS1200-M5
SY3120-M5SYJ512-M5VQZ1120-M5
AN120-M5
TU0425
AS1201F-M5-04
AS1200-M5
SY3120-M5SYJ512-M5VQZ1120-M5
Applicable model
Silencer TubingSpeed
controllerSolenoid valve
(2 position)
CM2 Series/Bore size: ø20, ø25, ø32, ø40
When the cylinder bore size is ø, its stroke is L , and load ratio is d%, full stroke time t is obtained, as an arrow mark q, by reading the value on the abscissa over the point at which the ordinate L hits the full stroke line (red line) of d%. Terminal velocity u is obtained, as an arrow mark w, by reading the value on the abscissa below the point at which the ordinate L hits the terminal velocity line (blue line) of d%.
Example
ø Full stroke time (t )
Stroke end velocity (u)
q
w
d% d%
Full stroke time
Stroke
Speed
Time (sec)SOL
ONOFF
Str
oke
( L)
Str
oke
(mm
)
Str
oke
end
velo
city
Applicable modelFull stroke time (sec)
0.0 0.1 0.2 0.3 0.4 0.5 0.6 0.7 0.8 0.9 1.0
Stroke end velocity (mm/s)
0 100 200 300 400 500 600 700 800 900 1000
200
150
100
50
0
Silencer TubingSpeed
controllerSolenoid valve
(2 position)
Applicable model
Silencer TubingSpeed
controllerSolenoid valve
(2 position)
AN120-M5
TU0425
AS2201F-01-04
AS2200-01
SY3120-M5SYJ5120-M5VQ1160-M5
AN120-M5
TU0425
AS2201F-01-04
AS2200-01
SY3120-M5SYJ5120-M5VQ1160-M5
ANB1-01
AN101-01
TU0604
AS2201F-01-06
AS2200-01
SY5120-01SX5120-01
ANB1-01
AN101-01
TU0604
AS2201F-02-06
AS2200-02
SY5120-01SX5120-01
Str
oke
(mm
)
200
150
100
50
0
Str
oke
(mm
)
200
150
100
50
0
Str
oke
(mm
)
200
150
100
50
0S
trok
e (m
m)
10% 30% 50% 70%ø20
ø25
ø32
ø40
10%
30%50%70%
For details corresponding to each various condition, make the use of “Model Selection Software” on SMC website for your decision.
Front matter 15
1-1Air Cylinders’ Drive System Full Stroke Time & Stroke End Velocity
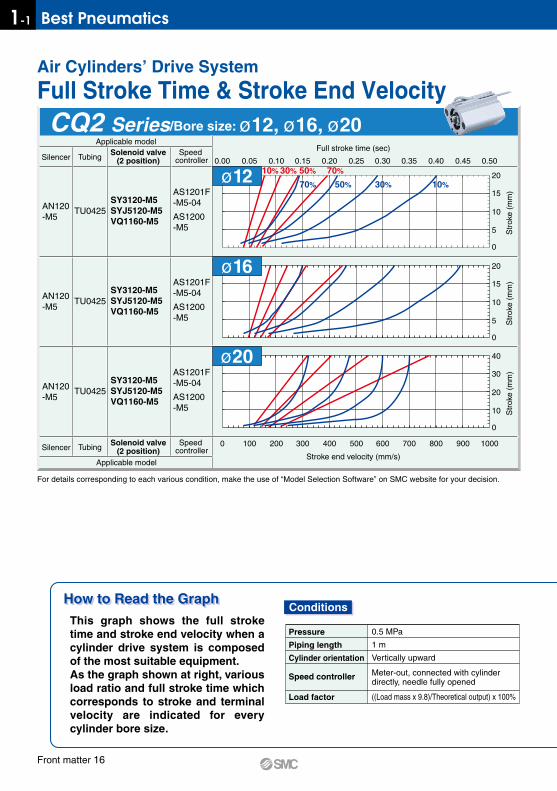
This graph shows the full stroke time and stroke end velocity when a cylinder drive system is composed of the most suitable equipment.As the graph shown at right, various load ratio and full stroke time which corresponds to stroke and terminal velocity are indicated for every cylinder bore size.
CQ2 Series/Bore size: ø12, ø16, ø20
Air Cylinders’ Drive System
Full Stroke Time & Stroke End Velocity
Applicable modelFull stroke time (sec)
0.00 0.05 0.10 0.15 0.20 0.25 0.30 0.35 0.40 0.45 0.50
20
15
10
5
0
Silencer TubingSpeed
controllerSolenoid valve
(2 position)
AN120-M5
TU0425
AS1201F-M5-04
AS1200-M5
SY3120-M5SYJ5120-M5VQ1160-M5
AN120-M5
TU0425
AS1201F-M5-04
AS1200-M5
SY3120-M5SYJ5120-M5VQ1160-M5
AN120-M5
TU0425
AS1201F-M5-04
AS1200-M5
SY3120-M5SYJ5120-M5VQ1160-M5
Str
oke
(mm
)
20
15
10
5
0
Str
oke
(mm
)
40
30
20
10
0
Str
oke
(mm
)
Stroke end velocity (mm/s)
0 100 200 300 400 500 600 700 800 900 1000
Applicable model
Silencer TubingSpeed
controllerSolenoid valve
(2 position)
ø12
ø16
ø20
10% 30% 50% 70%
70% 50% 30% 10%
How to Read the GraphHow to Read the Graph
Pressure
Piping length
Cylinder orientation
Speed controller
Load factor
0.5 MPa
1 m
Vertically upward
Meter-out, connected with cylinder directly, needle fully opened
((Load mass x 9.8)/Theoretical output) x 100%
Conditions
For details corresponding to each various condition, make the use of “Model Selection Software” on SMC website for your decision.
CQ2 Series/Bore size: ø25, ø32Applicable model
Full stroke time (sec)
0.00 0.05 0.10 0.15 0.20 0.25 0.30 0.35 0.40 0.45 0.50
Stroke end velocity (mm/s)
0 100 200 300 400 500 600 700 800 900 1000
40
30
20
10
0
Silencer TubingSpeed
controllerSolenoid valve
(2 position)
Applicable model
Silencer TubingSpeed
controllerSolenoid valve
(2 position)
AN120-M5
TU0425
AS1201F-M5-04
AS1200-M5
SY3120-M5SYJ5120-M5VQ1160-M5
AN120-M5
TU0604
AS2201F-01-06
AS2200-01
SY3120-M5SYJ5120-M5VQ1160-M5
Str
oke
(mm
)
40
30
20
10
0
Str
oke
(mm
)
ø25
ø32
10% 30% 50% 70%70% 50% 30% 10%
When the cylinder bore size is ø, its stroke is L , and load ratio is d%, full stroke time t is obtained, as an arrow mark q, by reading the value on the abscissa over the point at which the ordinate L hits the full stroke line (red line) of d%. Terminal velocity u is obtained, as an arrow mark w, by reading the value on the abscissa below the point at which the ordinate L hits the terminal velocity line (blue line) of d%.
Example
ø Full stroke time (t )
Stroke end velocity (u)
q
w
d% d%
Full stroke time
Stroke
Speed
Time (sec)SOL
ONOFF
Str
oke
( L)
Str
oke
(mm
)
Str
oke
end
velo
city
For details corresponding to each various condition, make the use of “Model Selection Software” on SMC website for your decision.
Front matter 16
1-1 Best Pneumatics
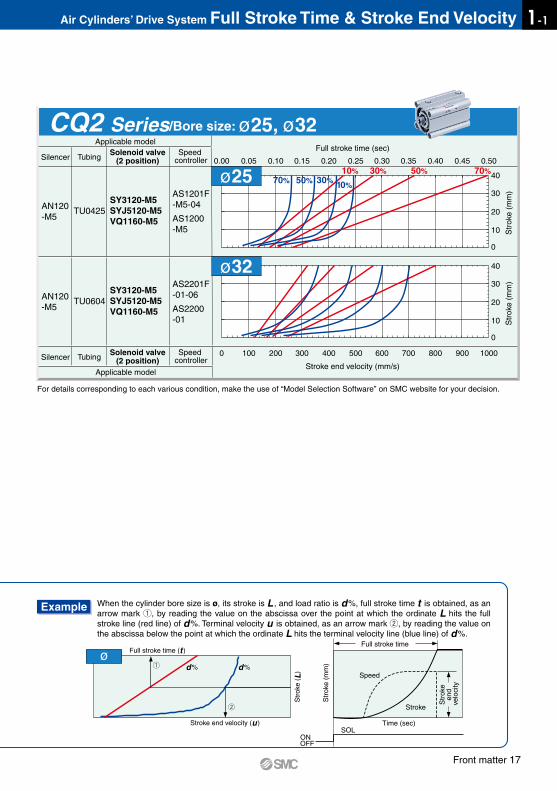
This graph shows the full stroke time and stroke end velocity when a cylinder drive system is composed of the most suitable equipment.As the graph shown at right, various load ratio and full stroke time which corresponds to stroke and terminal velocity are indicated for every cylinder bore size.
CQ2 Series/Bore size: ø12, ø16, ø20
Air Cylinders’ Drive System
Full Stroke Time & Stroke End Velocity
Applicable modelFull stroke time (sec)
0.00 0.05 0.10 0.15 0.20 0.25 0.30 0.35 0.40 0.45 0.50
20
15
10
5
0
Silencer TubingSpeed
controllerSolenoid valve
(2 position)
AN120-M5
TU0425
AS1201F-M5-04
AS1200-M5
SY3120-M5SYJ5120-M5VQ1160-M5
AN120-M5
TU0425
AS1201F-M5-04
AS1200-M5
SY3120-M5SYJ5120-M5VQ1160-M5
AN120-M5
TU0425
AS1201F-M5-04
AS1200-M5
SY3120-M5SYJ5120-M5VQ1160-M5
Str
oke
(mm
)
20
15
10
5
0
Str
oke
(mm
)
40
30
20
10
0
Str
oke
(mm
)
Stroke end velocity (mm/s)
0 100 200 300 400 500 600 700 800 900 1000
Applicable model
Silencer TubingSpeed
controllerSolenoid valve
(2 position)
ø12
ø16
ø20
10% 30% 50% 70%
70% 50% 30% 10%
How to Read the GraphHow to Read the Graph
Pressure
Piping length
Cylinder orientation
Speed controller
Load factor
0.5 MPa
1 m
Vertically upward
Meter-out, connected with cylinder directly, needle fully opened
((Load mass x 9.8)/Theoretical output) x 100%
Conditions
For details corresponding to each various condition, make the use of “Model Selection Software” on SMC website for your decision.
CQ2 Series/Bore size: ø25, ø32Applicable model
Full stroke time (sec)
0.00 0.05 0.10 0.15 0.20 0.25 0.30 0.35 0.40 0.45 0.50
Stroke end velocity (mm/s)
0 100 200 300 400 500 600 700 800 900 1000
40
30
20
10
0
Silencer TubingSpeed
controllerSolenoid valve
(2 position)
Applicable model
Silencer TubingSpeed
controllerSolenoid valve
(2 position)
AN120-M5
TU0425
AS1201F-M5-04
AS1200-M5
SY3120-M5SYJ5120-M5VQ1160-M5
AN120-M5
TU0604
AS2201F-01-06
AS2200-01
SY3120-M5SYJ5120-M5VQ1160-M5
Str
oke
(mm
)
40
30
20
10
0
Str
oke
(mm
)
ø25
ø32
10% 30% 50% 70%70% 50% 30% 10%
When the cylinder bore size is ø, its stroke is L , and load ratio is d%, full stroke time t is obtained, as an arrow mark q, by reading the value on the abscissa over the point at which the ordinate L hits the full stroke line (red line) of d%. Terminal velocity u is obtained, as an arrow mark w, by reading the value on the abscissa below the point at which the ordinate L hits the terminal velocity line (blue line) of d%.
Example
ø Full stroke time (t )
Stroke end velocity (u)
q
w
d% d%
Full stroke time
Stroke
Speed
Time (sec)SOL
ONOFF
Str
oke
( L)
Str
oke
(mm
)
Str
oke
end
velo
city
For details corresponding to each various condition, make the use of “Model Selection Software” on SMC website for your decision.
Front matter 17
1-1Air Cylinders’ Drive System Full Stroke Time & Stroke End Velocity
This graph shows the full stroke time and stroke end velocity when a cylinder drive system is composed of the most suitable equipment.As the graph shown at right, various load ratio and full stroke time which corresponds to stroke and terminal velocity are indicated for every cylinder bore size.
CQ2 Series/Bore size: ø40, ø50, ø63
Air Cylinders’ Drive System
Full Stroke Time & Stroke End Velocity
Applicable modelFull stroke time (sec)
0.0 0.1 0.2 0.3 0.4 0.5 0.6 0.7 0.8 0.9 1.0
100
75
50
25
0
Silencer TubingSpeed
controllerSolenoid valve
(2 position)
AS2201F-02-06
AS2200-02
AS3201F-02-08
AS3000-02
Str
oke
(mm
)
100
75
50
25
0
Str
oke
(mm
)
Stroke end velocity (mm/s)
0 100 200 300 400 500 600 700 800 900 1000
Applicable model
Silencer TubingSpeed
controllerSolenoid valve
(2 position)
AS2201F-01-06
AS2200-01
100
75
50
25
0
Str
oke
(mm
)
ø40 10% 30% 50% 70%
70%
50%
30%
10%
ø50
ø63
AN101-01
SY5120-01
AN101-01
SY5120-01
AN101-01
SY5120-01
TU0604
TU0805
TU0604
How to Read the GraphHow to Read the Graph
Pressure
Piping length
Cylinder orientation
Speed controller
Load factor
0.5 MPa
2 m
Vertically upward
Meter-out, connected with cylinder directly, needle fully opened
((Load mass x 9.8)/Theoretical output) x 100%
Conditions
For details corresponding to each various condition, make the use of “Model Selection Software” on SMC website for your decision.
CQ2 Series/Bore size: ø80, ø100
ø Full stroke time (t )
Stroke end velocity (u)
q
w
d% d%
Full stroke time
Time (sec)SOL
ONOFF
Str
oke
( L)
Str
oke
(mm
)
Str
oke
end
velo
city
Stroke
Speed
When the cylinder bore size is ø, its stroke is L , and load ratio is d%, full stroke time t is obtained, as an arrow mark q, by reading the value on the abscissa over the point at which the ordinate L hits the full stroke line (red line) of d%. Terminal velocity u is obtained, as an arrow mark w, by reading the value on the abscissa below the point at which the ordinate L hits the terminal velocity line (blue line) of d%.
Example
Applicable modelFull stroke time (sec)
0.0 0.1 0.2 0.3 0.4 0.5 0.6 0.7 0.8 0.9 1.0
Stroke end velocity (mm/s)
0 100 200 300 400 500 600 700 800 900 1000
100
75
50
25
0
Silencer TubingSpeed
controllerSolenoid valve
(2 position)
Applicable model
Silencer TubingSpeed
controllerSolenoid valve
(2 position)
AN110-01
AN101-01
TU1065 AS4000-03
SY7120-02SX7120-01
ANB1-03
AN30-03
TU1208
AS5000-03
AS420-03
VFS41-03VFR41-03
Str
oke
(mm
)
100
75
50
25
0
Str
oke
(mm
)
ø80
ø100
10% 30% 50% 70%
10%
30%
50%
70%
For details corresponding to each various condition, make the use of “Model Selection Software” on SMC website for your decision.
Front matter 18
1-1 Best Pneumatics
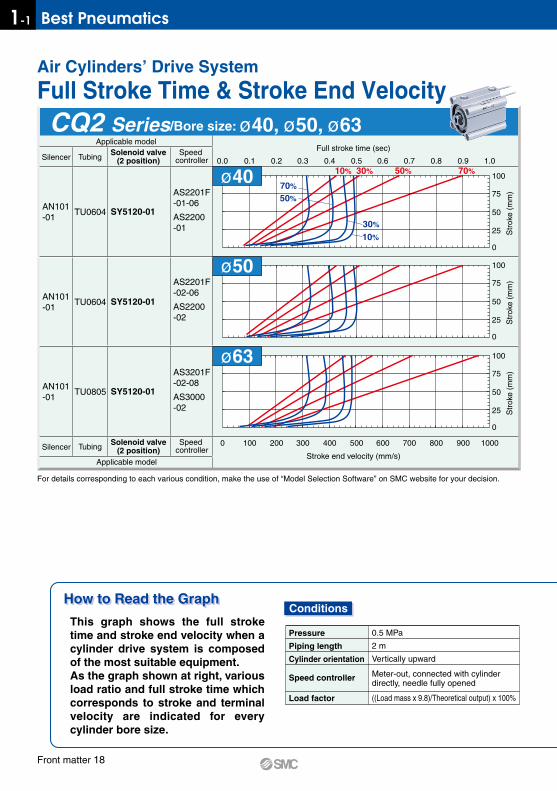
This graph shows the full stroke time and stroke end velocity when a cylinder drive system is composed of the most suitable equipment.As the graph shown at right, various load ratio and full stroke time which corresponds to stroke and terminal velocity are indicated for every cylinder bore size.
CQ2 Series/Bore size: ø40, ø50, ø63
Air Cylinders’ Drive System
Full Stroke Time & Stroke End Velocity
Applicable modelFull stroke time (sec)
0.0 0.1 0.2 0.3 0.4 0.5 0.6 0.7 0.8 0.9 1.0
100
75
50
25
0
Silencer TubingSpeed
controllerSolenoid valve
(2 position)
AS2201F-02-06
AS2200-02
AS3201F-02-08
AS3000-02
Str
oke
(mm
)
100
75
50
25
0
Str
oke
(mm
)
Stroke end velocity (mm/s)
0 100 200 300 400 500 600 700 800 900 1000
Applicable model
Silencer TubingSpeed
controllerSolenoid valve
(2 position)
AS2201F-01-06
AS2200-01
100
75
50
25
0
Str
oke
(mm
)
ø40 10% 30% 50% 70%
70%
50%
30%
10%
ø50
ø63
AN101-01
SY5120-01
AN101-01
SY5120-01
AN101-01
SY5120-01
TU0604
TU0805
TU0604
How to Read the GraphHow to Read the Graph
Pressure
Piping length
Cylinder orientation
Speed controller
Load factor
0.5 MPa
2 m
Vertically upward
Meter-out, connected with cylinder directly, needle fully opened
((Load mass x 9.8)/Theoretical output) x 100%
Conditions
For details corresponding to each various condition, make the use of “Model Selection Software” on SMC website for your decision.
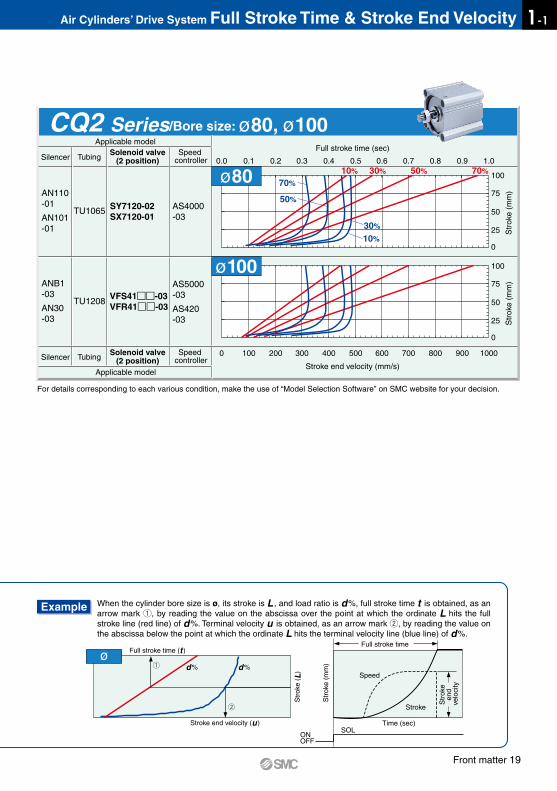
CQ2 Series/Bore size: ø80, ø100
ø Full stroke time (t )
Stroke end velocity (u)
q
w
d% d%
Full stroke time
Time (sec)SOL
ONOFF
Str
oke
( L)
Str
oke
(mm
)
Str
oke
end
velo
city
Stroke
Speed
When the cylinder bore size is ø, its stroke is L , and load ratio is d%, full stroke time t is obtained, as an arrow mark q, by reading the value on the abscissa over the point at which the ordinate L hits the full stroke line (red line) of d%. Terminal velocity u is obtained, as an arrow mark w, by reading the value on the abscissa below the point at which the ordinate L hits the terminal velocity line (blue line) of d%.
Example
Applicable modelFull stroke time (sec)
0.0 0.1 0.2 0.3 0.4 0.5 0.6 0.7 0.8 0.9 1.0
Stroke end velocity (mm/s)
0 100 200 300 400 500 600 700 800 900 1000
100
75
50
25
0
Silencer TubingSpeed
controllerSolenoid valve
(2 position)
Applicable model
Silencer TubingSpeed
controllerSolenoid valve
(2 position)
AN110-01
AN101-01
TU1065 AS4000-03
SY7120-02SX7120-01
ANB1-03
AN30-03
TU1208
AS5000-03
AS420-03
VFS41-03VFR41-03
Str
oke
(mm
)
100
75
50
25
0
Str
oke
(mm
)
ø80
ø100
10% 30% 50% 70%
10%
30%
50%
70%
For details corresponding to each various condition, make the use of “Model Selection Software” on SMC website for your decision.
Front matter 19
1-1Air Cylinders’ Drive System Full Stroke Time & Stroke End Velocity
This graph shows the full stroke time and stroke end velocity when a cylinder drive system is composed of the most suitable equipment.As the graph shown at right, various load ratio and full stroke time which corresponds to stroke and terminal velocity are indicated for every cylinder bore size.
MB Series/Bore size ø32, ø40, ø50
Air Cylinders’ Drive System
Full Stroke Time & Stroke End Velocity
Applicable modelFull stroke time (sec)
0.0 0.2 0.4 0.6 0.8 1.0 1.2 1.4 1.6 1.8 2.0
400
300
200
100
0
Silencer TubingSpeed
controllerSolenoid valve
(2 position)
ANB1-01
AN101-01
TU0604
AS2201F-01-06
AS2200-01
SY5120-01SX5120-01
ANB1-01
AN101-01
TU0604
AS2201F-02-06
AS2200-02
SY5120-01SX5120-01
ANB1-01
AN101-01
TU0805
AS3201F-02-08
AS3000-02
SY5120-01SX5120-01
Str
oke
(mm
)
400
300
200
100
0
Str
oke
(mm
)
400
300
200
100
0
Str
oke
(mm
)
Stroke end velocity (mm/s)
0 100 200 300 400 500 600 700 800 900 1000
Applicable model
Silencer TubingSpeed
controllerSolenoid valve
(2 position)
ø32
ø40
ø50
70% 50% 30%
10%
10% 30% 50% 70%
How to Read the GraphHow to Read the Graph
Pressure
Piping length
Cylinder orientation
Speed controller
Load factor
0.5 MPa
2 m
Vertically upward
Meter-out, connected with cylinder directly, needle fully opened
((Load mass x 9.8)/Theoretical output) x 100%
Conditions
For details corresponding to each various condition, make the use of “Model Selection Software” on SMC website for your decision.
MB Series/Bore size: ø63, ø80, ø100
When the cylinder bore size is ø, its stroke is L , and load ratio is d%, full stroke time t is obtained, as an arrow mark q, by reading the value on the abscissa over the point at which the ordinate L hits the full stroke line (red line) of d%. Terminal velocity u is obtained, as an arrow mark w, by reading the value on the abscissa below the point at which the ordinate L hits the terminal velocity line (blue line) of d%.
Example
ø Full stroke time (t )
Stroke end velocity (u)
q
w
d % d %
Full stroke time
Time (sec)SOL
ONOFF
Str
oke
( L)
Str
oke
(mm
)
Str
oke
end
velo
city
Stroke
Speed
Applicable modelFull stroke time (sec)
0.0 0.2 0.4 0.6 0.8 1.0 1.2 1.4 1.6 1.8 2.0
Stroke end velocity (mm/s)
0 100 200 300 400 500 600 700 800 900 1000
400
300
200
100
0
Silencer TubingSpeed
controllerSolenoid valve
(2 position)
Applicable model
Silencer TubingSpeed
controllerSolenoid valve
(2 position)
AN110-01
AN101-01
TU1065 AS4000-03
SY7120-02SX7120-02
ANB1-02
AN20-02
TU1065
AS5000-02
AS420-02
VFS31-02VFR31-02
ANB1-03
AN30-03
TU1208
AS5000-03
AS420-03
VFS41-03VFR41-03
Str
oke
(mm
)
400
300
200
100
0
Str
oke
(mm
)
400
300
200
100
0
Str
oke
(mm
)
10% 30% 50% 70%
10%30%50%70%
ø63
ø80
ø100
For details corresponding to each various condition, make the use of “Model Selection Software” on SMC website for your decision.
Front matter 20
1-1 Best Pneumatics
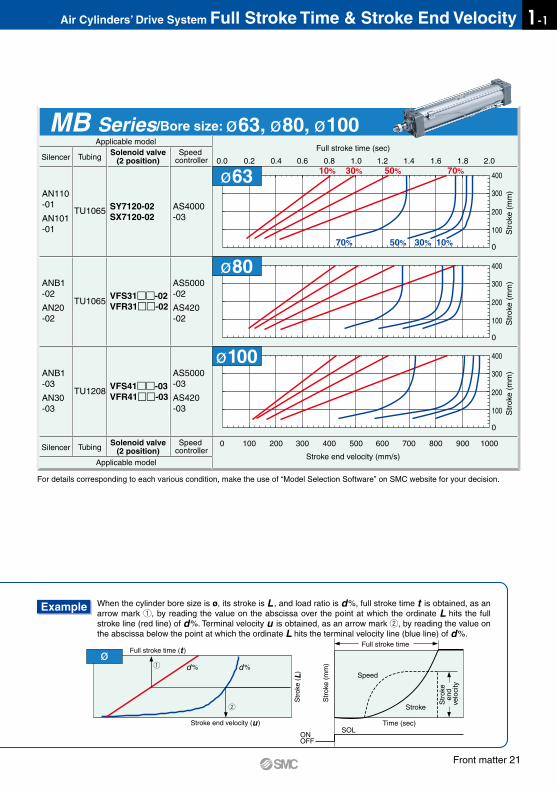
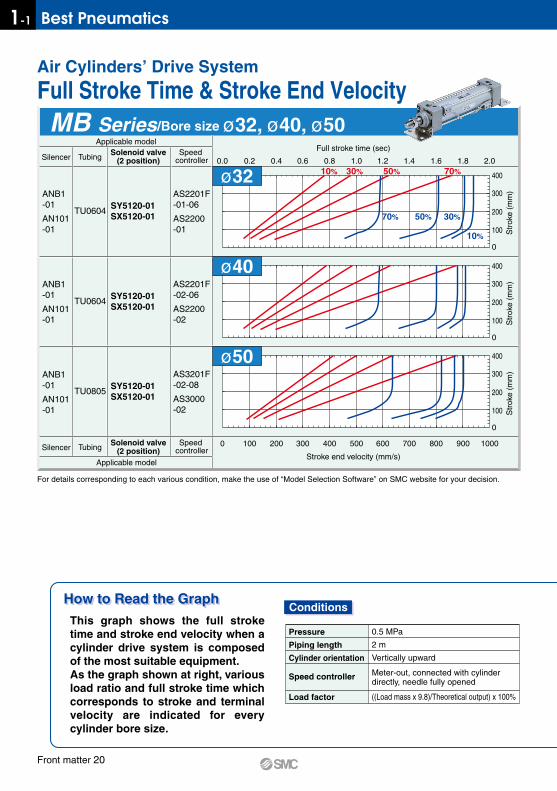
This graph shows the full stroke time and stroke end velocity when a cylinder drive system is composed of the most suitable equipment.As the graph shown at right, various load ratio and full stroke time which corresponds to stroke and terminal velocity are indicated for every cylinder bore size.
Series MB/Bore size ø32, ø40, ø50
Air Cylinders’ Drive System
Full Stroke Time & Stroke End Velocity
Applicable modelFull stroke time (sec)
0.0 0.2 0.4 0.6 0.8 1.0 1.2 1.4 1.6 1.8 2.0
400
300
200
100
0
Silencer TubingSpeed
controllerSolenoid valve
(2 position)
ANB1-01
AN101-01
TU0604
AS2201F-01-06
AS2200-01
SY5120-01SX5120-01
ANB1-01
AN101-01
TU0604
AS2201F-02-06
AS2200-02
SY5120-01SX5120-01
ANB1-01
AN101-01
TU0805
AS3201F-02-08
AS3000-02
SY5120-01SX5120-01
Str
oke
(mm
)
400
300
200
100
0
Str
oke
(mm
)
400
300
200
100
0
Str
oke
(mm
)
Stroke end velocity (mm/s)
0 100 200 300 400 500 600 700 800 900 1000
Applicable model
Silencer TubingSpeed
controllerSolenoid valve
(2 position)
ø32
ø40
ø50
70% 50% 30%
10%
10% 30% 50% 70%
How to Read the GraphHow to Read the Graph
Pressure
Piping length
Cylinder orientation
Speed controller
Load factor
0.5 MPa
2 m
Vertically upward
Meter-out, connected with cylinder directly, needle fully opened
((Load mass x 9.8)/Theoretical output) x 100%
Conditions
For details corresponding to each various condition, make the use of “Model Selection Software” on SMC website for your decision.
MB Series/Bore size: ø63, ø80, ø100
When the cylinder bore size is ø, its stroke is L , and load ratio is d%, full stroke time t is obtained, as an arrow mark q, by reading the value on the abscissa over the point at which the ordinate L hits the full stroke line (red line) of d%. Terminal velocity u is obtained, as an arrow mark w, by reading the value on the abscissa below the point at which the ordinate L hits the terminal velocity line (blue line) of d%.
Example
ø Full stroke time (t )
Stroke end velocity (u)
q
w
d % d %
Full stroke time
Time (sec)SOL
ONOFF
Str
oke
( L)
Str
oke
(mm
)
Str
oke
end
velo
city
Stroke
Speed
Applicable modelFull stroke time (sec)
0.0 0.2 0.4 0.6 0.8 1.0 1.2 1.4 1.6 1.8 2.0
Stroke end velocity (mm/s)
0 100 200 300 400 500 600 700 800 900 1000
400
300
200
100
0
Silencer TubingSpeed
controllerSolenoid valve
(2 position)
Applicable model
Silencer TubingSpeed
controllerSolenoid valve
(2 position)
AN110-01
AN101-01
TU1065 AS4000-03
SY7120-02SX7120-02
ANB1-02
AN20-02
TU1065
AS5000-02
AS420-02
VFS31-02VFR31-02
ANB1-03
AN30-03
TU1208
AS5000-03
AS420-03
VFS41-03VFR41-03
Str
oke
(mm
)
400
300
200
100
0
Str
oke
(mm
)
400
300
200
100
0
Str
oke
(mm
)
10% 30% 50% 70%
10%30%50%70%
ø63
ø80
ø100
For details corresponding to each various condition, make the use of “Model Selection Software” on SMC website for your decision.
Front matter 21
1-1Air Cylinders’ Drive System Full Stroke Time & Stroke End Velocity
This graph shows the full stroke time and stroke end velocity when a cylinder drive system is composed of the most suitable equipment.As the graph shown at right, various load ratio and full stroke time which corresponds to stroke and terminal velocity are indicated for every cylinder bore size.
CS1, CS2 Series/Bore size: ø125, ø140, ø160
Air Cylinders’ Drive System
Full Stroke Time & Stroke End Velocity
Applicable modelFull stroke time (sec)
0.0 1.0 2.0 3.0 4.0 5.0 6.0 7.0 8.0 9.0 10.0
800
600
400
200
0
Silencer TubingSpeed
controllerSolenoid valve
(2 position)
ANB1-03
AN30-03
SGP10A
AS420-02
AS5000-02
VFR3100-03VEX3320-03
ANB1-03
AN30-03
SGP10A
AS420-03
AS5000-03
VFR3100-03VEX3320-03
ANB1-04
AN40-04
SGP10A AS420-03
VFR4100-04VEX3320-04
Str
oke
(mm
)
800
600
400
200
0
Str
oke
(mm
)
800
600
400
200
0
Str
oke
(mm
)
Stroke end velocity (mm/s)
0 50 100 150 200 250 300 350 400 450 500
Applicable model
Silencer TubingSpeed
controllerSolenoid valve
(2 position)
ø125
ø140
ø160
10% 30% 50% 70%
70% 50%
30%
10%
How to Read the GraphHow to Read the Graph
Pressure
Piping length
Cylinder orientation
Speed controller
Load factor
0.5 MPa
3 m
Vertically upward
Meter-out, connected with cylinder directly, needle fully opened
((Load mass x 9.8)/Theoretical output) x 100%
Conditions
For details corresponding to each various condition, make the use of “Model Selection Software” on SMC website for your decision.
CS1 Series/Bore size: ø180, ø200, ø250, ø300Applicable model
Full stroke time (sec)
0.0 1.0 2.0 3.0 4.0 5.0 6.0 7.0 8.0 9.0 10.0
Stroke end velocity (mm/s)
0 50 100 150 200 250 300 350 400 450 500
800
600
400
200
0
Silencer TubingSpeed
controllerSolenoid valve
(2 position)
Applicable model
Silencer TubingSpeed
controllerSolenoid valve
(2 position)
ANB1-04
AN40-04
SGP15A AS420-03
VEX3500-04VP3145-03
ANB1-04
AN40-04
SGP15A AS420-04
VEX3500-04VP3145-03
ANB1-06
AN500-06
SGP20A AS600-10
VEX3500-06VP3145-04
ANB1-10
AN600-10
SGP20A AS600-10
VEX3500-10VP3145-06
Str
oke
(mm
)
800
600
400
200
0
Str
oke
(mm
)
800
600
400
200
0
Str
oke
(mm
)
800
600
400
200
0
Str
oke
(mm
)
ø180
ø200
ø250
ø300
10% 30% 50% 70%
10%
30%
50%70%
When the cylinder bore size is ø, its stroke is L , and load ratio is d%, full stroke time t is obtained, as an arrow mark q, by reading the value on the abscissa over the point at which the ordinate L hits the full stroke line (red line) of d%. Terminal velocity u is obtained, as an arrow mark w, by reading the value on the abscissa below the point at which the ordinate L hits the terminal velocity line (blue line) of d%.
Example
ø Full stroke time (t )
Stroke end velocity (u)
q
w
d% d%
Full stroke time
Time (sec)SOL
ONOFF
Str
oke
( L)
Str
oke
end
velo
city
Stroke
Speed
Str
oke
(mm
)
For details corresponding to each various condition, make the use of “Model Selection Software” on SMC website for your decision.
Front matter 22
1-1 Best Pneumatics
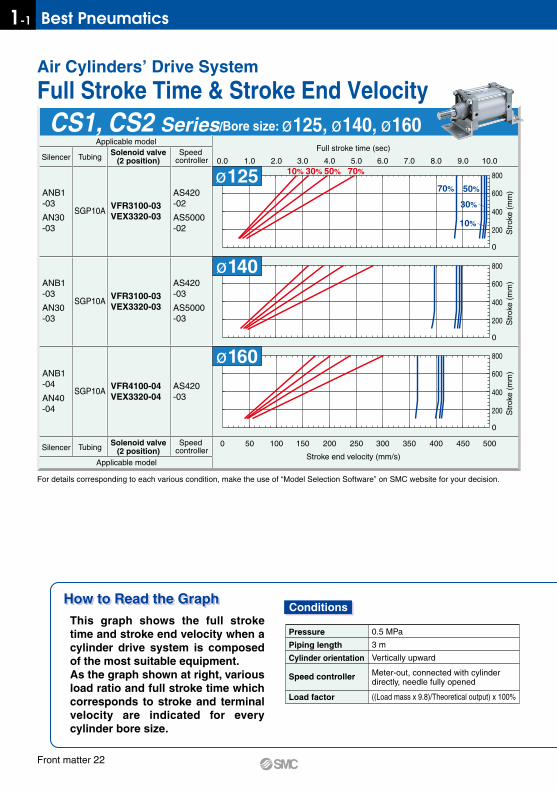
This graph shows the full stroke time and stroke end velocity when a cylinder drive system is composed of the most suitable equipment.As the graph shown at right, various load ratio and full stroke time which corresponds to stroke and terminal velocity are indicated for every cylinder bore size.
CS1, CS2 Series/Bore size: ø125, ø140, ø160
Air Cylinders’ Drive System
Full Stroke Time & Stroke End Velocity
Applicable modelFull stroke time (sec)
0.0 1.0 2.0 3.0 4.0 5.0 6.0 7.0 8.0 9.0 10.0
800
600
400
200
0
Silencer TubingSpeed
controllerSolenoid valve
(2 position)
ANB1-03
AN30-03
SGP10A
AS420-02
AS5000-02
VFR3100-03VEX3320-03
ANB1-03
AN30-03
SGP10A
AS420-03
AS5000-03
VFR3100-03VEX3320-03
ANB1-04
AN40-04
SGP10A AS420-03
VFR4100-04VEX3320-04
Str
oke
(mm
)
800
600
400
200
0
Str
oke
(mm
)
800
600
400
200
0
Str
oke
(mm
)
Stroke end velocity (mm/s)
0 50 100 150 200 250 300 350 400 450 500
Applicable model
Silencer TubingSpeed
controllerSolenoid valve
(2 position)
ø125
ø140
ø160
10% 30% 50% 70%
70% 50%
30%
10%
How to Read the GraphHow to Read the Graph
Pressure
Piping length
Cylinder orientation
Speed controller
Load factor
0.5 MPa
3 m
Vertically upward
Meter-out, connected with cylinder directly, needle fully opened
((Load mass x 9.8)/Theoretical output) x 100%
Conditions
For details corresponding to each various condition, make the use of “Model Selection Software” on SMC website for your decision.
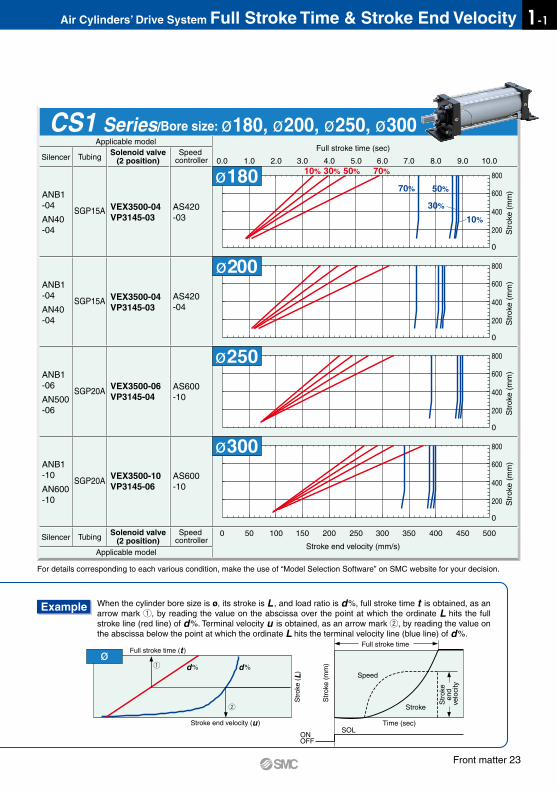
CS1 Series/Bore size: ø180, ø200, ø250, ø300Applicable model
Full stroke time (sec)
0.0 1.0 2.0 3.0 4.0 5.0 6.0 7.0 8.0 9.0 10.0
Stroke end velocity (mm/s)
0 50 100 150 200 250 300 350 400 450 500
800
600
400
200
0
Silencer TubingSpeed
controllerSolenoid valve
(2 position)
Applicable model
Silencer TubingSpeed
controllerSolenoid valve
(2 position)
ANB1-04
AN40-04
SGP15A AS420-03
VEX3500-04VP3145-03
ANB1-04
AN40-04
SGP15A AS420-04
VEX3500-04VP3145-03
ANB1-06
AN500-06
SGP20A AS600-10
VEX3500-06VP3145-04
ANB1-10
AN600-10
SGP20A AS600-10
VEX3500-10VP3145-06
Str
oke
(mm
)
800
600
400
200
0
Str
oke
(mm
)
800
600
400
200
0
Str
oke
(mm
)
800
600
400
200
0S
trok
e (m
m)
ø180
ø200
ø250
ø300
10% 30% 50% 70%
10%
30%
50%70%
When the cylinder bore size is ø, its stroke is L , and load ratio is d%, full stroke time t is obtained, as an arrow mark q, by reading the value on the abscissa over the point at which the ordinate L hits the full stroke line (red line) of d%. Terminal velocity u is obtained, as an arrow mark w, by reading the value on the abscissa below the point at which the ordinate L hits the terminal velocity line (blue line) of d%.
Example
ø Full stroke time (t )
Stroke end velocity (u)
q
w
d% d%
Full stroke time
Time (sec)SOL
ONOFF
Str
oke
( L)
Str
oke
end
velo
city
Stroke
Speed
Str
oke
(mm
)
For details corresponding to each various condition, make the use of “Model Selection Software” on SMC website for your decision.
Front matter 23
1-1Air Cylinders’ Drive System Full Stroke Time & Stroke End Velocity
1. Indication of flow rate characteristicsThe flow rate characteristics in equipment such as a solenoid valve, etc. are indicated in their specifications as shown in Table (1).
2. Pneumatic equipment2.1 Indication according to the international standards(1) Conformed standard
ISO 6358: 1989 : Pneumatic fluid power—Components using compressible fluids—Determination of flow rate characteristics
JIS B 8390: 2000 : Pneumatic fluid power—Components using compressible fluids—How to test flow rate characteristics
(2) Definition of flow rate characteristicsThe flow rate characteristics are indicated as a result of a comparison between sonic conductance C and critical pressure ratio b.Sonic conductance C : Value which divides the passing mass flow rate of an equipment in a choked flow
condition by the product of the upstream absolute pressure and the density in a standard condition.
Critical pressure ratio b : Pressure ratio (downstream pressure/upstream pressure) which will turn to a choked flow when the value is smaller than this ratio.
Choked flow : The flow in which the upstream pressure is higher than the downstream pressure and where sonic speed in a certain part of an equipment is reached. Gaseous mass flow rate is in proportion to the upstream pressure and not dependent on the downstream pressure.
Subsonic flow : Flow greater than the critical pressure ratioStandard condition : Air in a temperature state of 20°C, absolute pressure 0.1 MPa (= 100 kPa = 1 bar),
relative humidity 65%.It is stipulated by adding the “(ANR)” after the unit depicting air volume.(standard reference atmosphere)Conformed standard: ISO 8778: 1990 Pneumatic fluid power—Standard reference atmosphere, JIS B 8393: 2000: Pneumatic fluid power—Standard reference atmosphere
(3) Formula for flow rateIt is described by the practical units as following.WhenP2 + 0.1———— ≤ b, choked flowP1 + 0.1 293Q = 600 x C (P1 + 0.1) ———— ·····························································(1) 273 + TWhen P2 + 0.1———— > b, subsonic flowP1 + 0.1
C, b
Indication byinternational standard
S
Cv
Cv
Conformed standard
ISO 6358: 1989JIS B 8390: 2000
JIS B 8390: 2000Equipment: JIS B 8379, 8381-1, 8381-2
IEC60534-1: 2005IEC60534-2-3: 1997JIS B 2005-1: 2012JIS B 2005-2-3: 2004Equipment: JIS B 8471, 8472, 8473
ANSI/(NFPA)T3.21.3 R1-2008
Table (1) Indication of Flow Rate Characteristics
Kv
—
—
—
—
Pneumaticequipment
Process fluidcontrol
equipment
Correspondingequipment
Otherindications
Solenoid Valve Flow Rate Characteristics(How to indicate flow rate characteristics)
P2 + 0.1 ———— – b P1 + 0.1 Q = 600 x C (P1 + 0.1) 1 – —————— ———— ···························· (2) 1 – b
2
293273 + T
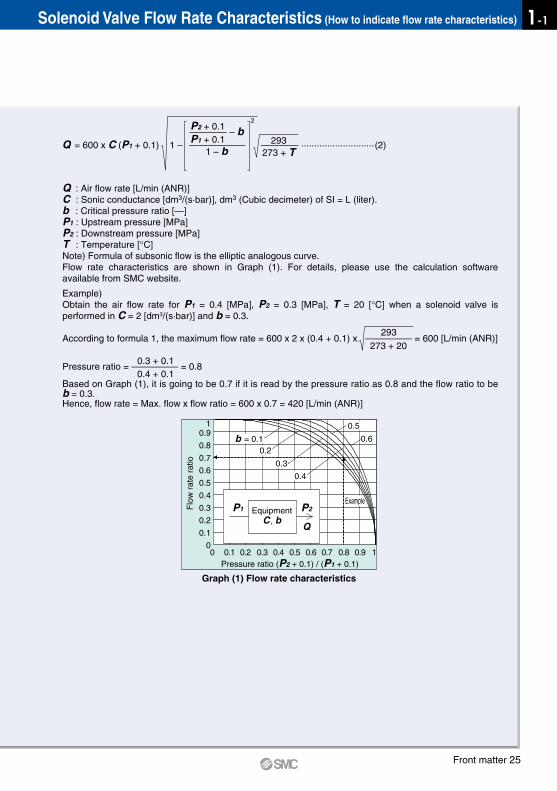
Q : Air flow rate [L/min (ANR)]C : Sonic conductance [dm3/(s·bar)], dm3 (Cubic decimeter) of SI = L (liter).b : Critical pressure ratio [—]P1 : Upstream pressure [MPa]P2 : Downstream pressure [MPa]T : Temperature [°C]Note) Formula of subsonic flow is the elliptic analogous curve.Flow rate characteristics are shown in Graph (1). For details, please use the calculation software available from SMC website.
Example)Obtain the air flow rate for P1 = 0.4 [MPa], P2 = 0.3 [MPa], T = 20 [°C] when a solenoid valve is performed in C = 2 [dm3/(s·bar)] and b = 0.3.
293According to formula 1, the maximum flow rate = 600 x 2 x (0.4 + 0.1) x ————— = 600 [L/min (ANR)] 273 + 20
0.3 + 0.1Pressure ratio = ————— = 0.8 0.4 + 0.1Based on Graph (1), it is going to be 0.7 if it is read by the pressure ratio as 0.8 and the flow ratio to be b = 0.3.Hence, flow rate = Max. flow x flow ratio = 600 x 0.7 = 420 [L/min (ANR)]
10.9
0.8
0.7
0.6
0.5
0.4
0.3
0.2
0.1
00 0.1 0.2 0.3 0.4 0.5 0.6 0.7 0.8 0.9 1
EquipmentC , b
P2
Q
P1
b = 0.10.2
0.5
0.6
0.3
0.4
Pressure ratio (P2 + 0.1) / (P1 + 0.1)
Graph (1) Flow rate characteristics
Flo
w r
ate
ratio
Example
Front matter 24
1-1 Best Pneumatics
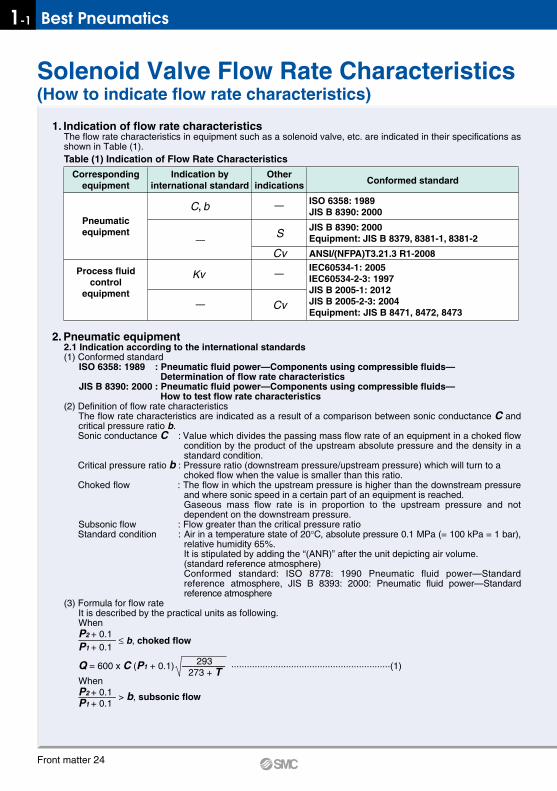
1. Indication of flow rate characteristicsThe flow rate characteristics in equipment such as a solenoid valve, etc. are indicated in their specifications as shown in Table (1).
2. Pneumatic equipment2.1 Indication according to the international standards(1) Conformed standard
ISO 6358: 1989 : Pneumatic fluid power—Components using compressible fluids—Determination of flow rate characteristics
JIS B 8390: 2000 : Pneumatic fluid power—Components using compressible fluids—How to test flow rate characteristics
(2) Definition of flow rate characteristicsThe flow rate characteristics are indicated as a result of a comparison between sonic conductance C and critical pressure ratio b.Sonic conductance C : Value which divides the passing mass flow rate of an equipment in a choked flow
condition by the product of the upstream absolute pressure and the density in a standard condition.
Critical pressure ratio b : Pressure ratio (downstream pressure/upstream pressure) which will turn to a choked flow when the value is smaller than this ratio.
Choked flow : The flow in which the upstream pressure is higher than the downstream pressure and where sonic speed in a certain part of an equipment is reached. Gaseous mass flow rate is in proportion to the upstream pressure and not dependent on the downstream pressure.
Subsonic flow : Flow greater than the critical pressure ratioStandard condition : Air in a temperature state of 20°C, absolute pressure 0.1 MPa (= 100 kPa = 1 bar),
relative humidity 65%.It is stipulated by adding the “(ANR)” after the unit depicting air volume.(standard reference atmosphere)Conformed standard: ISO 8778: 1990 Pneumatic fluid power—Standard reference atmosphere, JIS B 8393: 2000: Pneumatic fluid power—Standard reference atmosphere
(3) Formula for flow rateIt is described by the practical units as following.WhenP2 + 0.1———— ≤ b, choked flowP1 + 0.1 293Q = 600 x C (P1 + 0.1) ———— ·····························································(1) 273 + TWhen P2 + 0.1———— > b, subsonic flowP1 + 0.1
C, b
Indication byinternational standard
S
Cv
Cv
Conformed standard
ISO 6358: 1989JIS B 8390: 2000
JIS B 8390: 2000Equipment: JIS B 8379, 8381-1, 8381-2
IEC60534-1: 2005IEC60534-2-3: 1997JIS B 2005-1: 2012JIS B 2005-2-3: 2004Equipment: JIS B 8471, 8472, 8473
ANSI/(NFPA)T3.21.3 R1-2008
Table (1) Indication of Flow Rate Characteristics
Kv
—
—
—
—
Pneumaticequipment
Process fluidcontrol
equipment
Correspondingequipment
Otherindications
Solenoid Valve Flow Rate Characteristics(How to indicate flow rate characteristics)
P2 + 0.1 ———— – b P1 + 0.1 Q = 600 x C (P1 + 0.1) 1 – —————— ———— ···························· (2) 1 – b
2
293273 + T
Q : Air flow rate [L/min (ANR)]C : Sonic conductance [dm3/(s·bar)], dm3 (Cubic decimeter) of SI = L (liter).b : Critical pressure ratio [—]P1 : Upstream pressure [MPa]P2 : Downstream pressure [MPa]T : Temperature [°C]Note) Formula of subsonic flow is the elliptic analogous curve.Flow rate characteristics are shown in Graph (1). For details, please use the calculation software available from SMC website.
Example)Obtain the air flow rate for P1 = 0.4 [MPa], P2 = 0.3 [MPa], T = 20 [°C] when a solenoid valve is performed in C = 2 [dm3/(s·bar)] and b = 0.3.
293According to formula 1, the maximum flow rate = 600 x 2 x (0.4 + 0.1) x ————— = 600 [L/min (ANR)] 273 + 20
0.3 + 0.1Pressure ratio = ————— = 0.8 0.4 + 0.1Based on Graph (1), it is going to be 0.7 if it is read by the pressure ratio as 0.8 and the flow ratio to be b = 0.3.Hence, flow rate = Max. flow x flow ratio = 600 x 0.7 = 420 [L/min (ANR)]
10.9
0.8
0.7
0.6
0.5
0.4
0.3
0.2
0.1
00 0.1 0.2 0.3 0.4 0.5 0.6 0.7 0.8 0.9 1
EquipmentC , b
P2
Q
P1
b = 0.10.2
0.5
0.6
0.3
0.4
Pressure ratio (P2 + 0.1) / (P1 + 0.1)
Graph (1) Flow rate characteristics
Flo
w r
ate
ratio
Example
Front matter 25
1-1Solenoid Valve Flow Rate Characteristics (How to indicate flow rate characteristics)
ød2
ød1
3d3
3d210d23d110d1≥10d3
ød3≥3d1
Solenoid Valve Flow Rate Characteristics(How to indicate flow rate characteristics)
2.1 Indication according to the international standards
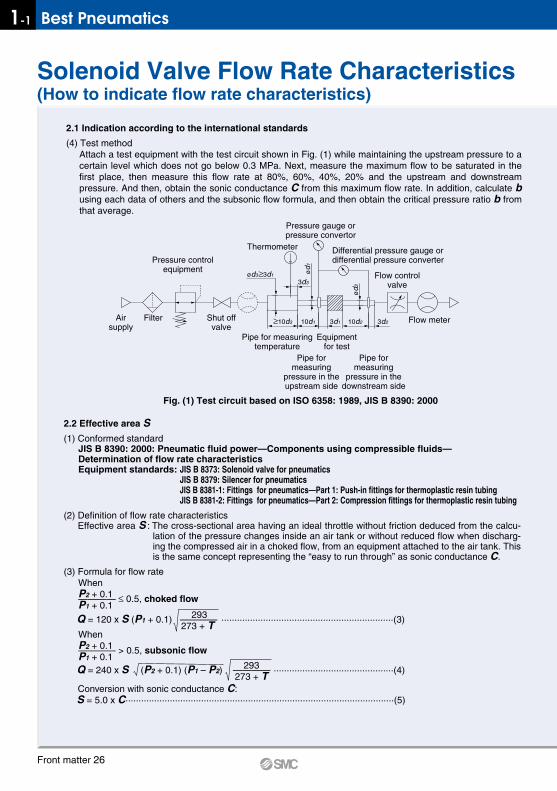
(4) Test methodAttach a test equipment with the test circuit shown in Fig. (1) while maintaining the upstream pressure to a certain level which does not go below 0.3 MPa. Next, measure the maximum flow to be saturated in the first place, then measure this flow rate at 80%, 60%, 40%, 20% and the upstream and downstream pressure. And then, obtain the sonic conductance C from this maximum flow rate. In addition, calculate b using each data of others and the subsonic flow formula, and then obtain the critical pressure ratio b from that average.
Airsupply
Pressure controlequipment
Thermometer
Pressure gauge orpressure convertor
Differential pressure gauge ordifferential pressure converter
Flow controlvalve
Filter
Pipe for measuringtemperature
Pipe formeasuring
pressure in theupstream side
Pipe formeasuring
pressure in thedownstream side
Equipmentfor test
Shut offvalve
Flow meter
Fig. (1) Test circuit based on ISO 6358: 1989, JIS B 8390: 2000
2.2 Effective area S(1) Conformed standard
JIS B 8390: 2000: Pneumatic fluid power—Components using compressible fluids—Determination of flow rate characteristicsEquipment standards: JIS B 8373: Solenoid valve for pneumatics
JIS B 8379: Silencer for pneumaticsJIS B 8381-1: Fittings for pneumatics—Part 1: Push-in fittings for thermoplastic resin tubingJIS B 8381-2: Fittings for pneumatics—Part 2: Compression fittings for thermoplastic resin tubing
(2) Definition of flow rate characteristicsEffective area S : The cross-sectional area having an ideal throttle without friction deduced from the calcu-
lation of the pressure changes inside an air tank or without reduced flow when discharg-ing the compressed air in a choked flow, from an equipment attached to the air tank. This is the same concept representing the “easy to run through” as sonic conductance C.
(3) Formula for flow rateWhenP2 + 0.1———— ≤ 0.5, choked flowP1 + 0.1 293Q = 120 x S (P1 + 0.1) ———— ··································································(3) 273 + TWhen P2 + 0.1———— > 0.5, subsonic flowP1 + 0.1 293Q = 240 x S (P2 + 0.1) (P1 – P2) ———— ··············································(4) 273 + TConversion with sonic conductance C:S = 5.0 x C·······································································································(5)
Fig. (2) Test circuit based on JIS B 8390: 2000
Pressure switch
Timer (Clock)Pressure recorder
Controlcircuit
Thermometer
Air tank
Pressure controlequipment
Shut offvalve
FilterAirsupply
Rec
tifie
r tu
be in
the
dow
nstr
eam
sid
e
Rec
tifie
r tu
be in
the
upst
ream
sid
e
Powersupply
Solenoid valveEquipmentfor test
Pressure gaugeor pressureconvertor
Q : Air flow rate[L/min(ANR)]S : Effective area [mm2]P1 : Upstream pressure [MPa]P2 : Downstream pressure [MPa]T : Temperature [°C]Note) Formula for subsonic flow (4) is only applicable when the critical pressure ratio b is the unknown
equipment. In the formula (2) by the sonic conductance C, it is the same formula as when b = 0.5.
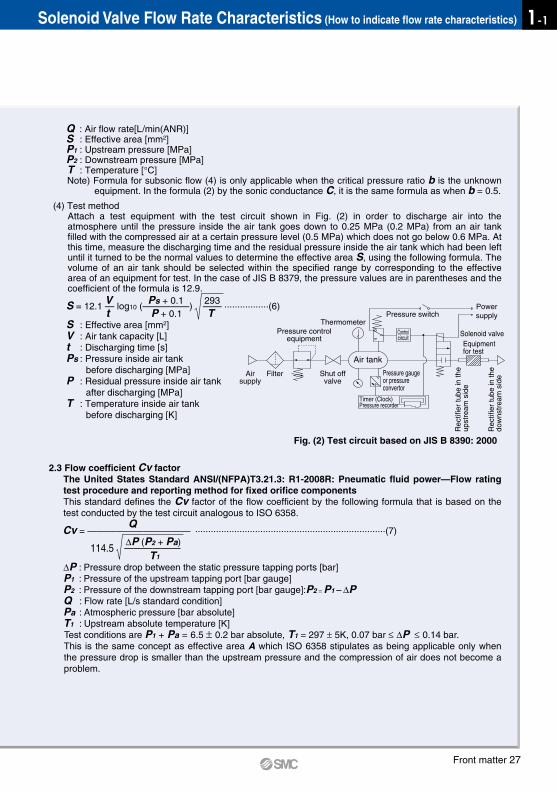
(4) Test methodAttach a test equipment with the test circuit shown in Fig. (2) in order to discharge air into the atmosphere until the pressure inside the air tank goes down to 0.25 MPa (0.2 MPa) from an air tank filled with the compressed air at a certain pressure level (0.5 MPa) which does not go below 0.6 MPa. At this time, measure the discharging time and the residual pressure inside the air tank which had been left until it turned to be the normal values to determine the effective area S, using the following formula. The volume of an air tank should be selected within the specified range by corresponding to the effective area of an equipment for test. In the case of JIS B 8379, the pressure values are in parentheses and the coefficient of the formula is 12.9. V Ps + 0.1 293S = 12.1 — log10 (—————) —— ·················(6) t P + 0.1 TS : Effective area [mm2]V : Air tank capacity [L]t : Discharging time [s]Ps : Pressure inside air tank
before discharging [MPa]P : Residual pressure inside air tank
after discharging [MPa]T : Temperature inside air tank
before discharging [K]
2.3 Flow coefficient Cv factorThe United States Standard ANSI/(NFPA)T3.21.3: R1-2008R: Pneumatic fluid power—Flow rating test procedure and reporting method for fixed orifice componentsThis standard defines the Cv factor of the flow coefficient by the following formula that is based on the test conducted by the test circuit analogous to ISO 6358. QCv = ——————————— ·········································································(7) ∆P (P2 + Pa) 114.5 —————— T1
∆P : Pressure drop between the static pressure tapping ports [bar]P1 : Pressure of the upstream tapping port [bar gauge]P2 : Pressure of the downstream tapping port [bar gauge]:P2 = P1 – ∆PQ : Flow rate [L/s standard condition]Pa : Atmospheric pressure [bar absolute]T1 : Upstream absolute temperature [K] Test conditions are P1 + Pa = 6.5 ± 0.2 bar absolute, T1 = 297 ± 5K, 0.07 bar ≤ ∆P �≤ 0.14 bar.This is the same concept as effective area A which ISO 6358 stipulates as being applicable only when the pressure drop is smaller than the upstream pressure and the compression of air does not become a problem.
Front matter 26
1-1 Best Pneumatics
ød2
ød1
3d3
3d210d23d110d1≥10d3
ød3≥3d1
Solenoid Valve Flow Rate Characteristics(How to indicate flow rate characteristics)
2.1 Indication according to the international standards
(4) Test methodAttach a test equipment with the test circuit shown in Fig. (1) while maintaining the upstream pressure to a certain level which does not go below 0.3 MPa. Next, measure the maximum flow to be saturated in the first place, then measure this flow rate at 80%, 60%, 40%, 20% and the upstream and downstream pressure. And then, obtain the sonic conductance C from this maximum flow rate. In addition, calculate b using each data of others and the subsonic flow formula, and then obtain the critical pressure ratio b from that average.
Airsupply
Pressure controlequipment
Thermometer
Pressure gauge orpressure convertor
Differential pressure gauge ordifferential pressure converter
Flow controlvalve
Filter
Pipe for measuringtemperature
Pipe formeasuring
pressure in theupstream side
Pipe formeasuring
pressure in thedownstream side
Equipmentfor test
Shut offvalve
Flow meter
Fig. (1) Test circuit based on ISO 6358: 1989, JIS B 8390: 2000
2.2 Effective area S(1) Conformed standard
JIS B 8390: 2000: Pneumatic fluid power—Components using compressible fluids—Determination of flow rate characteristicsEquipment standards: JIS B 8373: Solenoid valve for pneumatics
JIS B 8379: Silencer for pneumaticsJIS B 8381-1: Fittings for pneumatics—Part 1: Push-in fittings for thermoplastic resin tubingJIS B 8381-2: Fittings for pneumatics—Part 2: Compression fittings for thermoplastic resin tubing
(2) Definition of flow rate characteristicsEffective area S : The cross-sectional area having an ideal throttle without friction deduced from the calcu-
lation of the pressure changes inside an air tank or without reduced flow when discharg-ing the compressed air in a choked flow, from an equipment attached to the air tank. This is the same concept representing the “easy to run through” as sonic conductance C.
(3) Formula for flow rateWhenP2 + 0.1———— ≤ 0.5, choked flowP1 + 0.1 293Q = 120 x S (P1 + 0.1) ———— ··································································(3) 273 + TWhen P2 + 0.1———— > 0.5, subsonic flowP1 + 0.1 293Q = 240 x S (P2 + 0.1) (P1 – P2) ———— ··············································(4) 273 + TConversion with sonic conductance C:S = 5.0 x C·······································································································(5)
Fig. (2) Test circuit based on JIS B 8390: 2000
Pressure switch
Timer (Clock)Pressure recorder
Controlcircuit
Thermometer
Air tank
Pressure controlequipment
Shut offvalve
FilterAirsupply
Rec
tifie
r tu
be in
the
dow
nstr
eam
sid
e
Rec
tifie
r tu
be in
the
upst
ream
sid
e
Powersupply
Solenoid valveEquipmentfor test
Pressure gaugeor pressureconvertor
Q : Air flow rate[L/min(ANR)]S : Effective area [mm2]P1 : Upstream pressure [MPa]P2 : Downstream pressure [MPa]T : Temperature [°C]Note) Formula for subsonic flow (4) is only applicable when the critical pressure ratio b is the unknown
equipment. In the formula (2) by the sonic conductance C, it is the same formula as when b = 0.5.
(4) Test methodAttach a test equipment with the test circuit shown in Fig. (2) in order to discharge air into the atmosphere until the pressure inside the air tank goes down to 0.25 MPa (0.2 MPa) from an air tank filled with the compressed air at a certain pressure level (0.5 MPa) which does not go below 0.6 MPa. At this time, measure the discharging time and the residual pressure inside the air tank which had been left until it turned to be the normal values to determine the effective area S, using the following formula. The volume of an air tank should be selected within the specified range by corresponding to the effective area of an equipment for test. In the case of JIS B 8379, the pressure values are in parentheses and the coefficient of the formula is 12.9. V Ps + 0.1 293S = 12.1 — log10 (—————) —— ·················(6) t P + 0.1 TS : Effective area [mm2]V : Air tank capacity [L]t : Discharging time [s]Ps : Pressure inside air tank
before discharging [MPa]P : Residual pressure inside air tank
after discharging [MPa]T : Temperature inside air tank
before discharging [K]
2.3 Flow coefficient Cv factorThe United States Standard ANSI/(NFPA)T3.21.3: R1-2008R: Pneumatic fluid power—Flow rating test procedure and reporting method for fixed orifice componentsThis standard defines the Cv factor of the flow coefficient by the following formula that is based on the test conducted by the test circuit analogous to ISO 6358. QCv = ——————————— ·········································································(7) ∆P (P2 + Pa) 114.5 —————— T1
∆P : Pressure drop between the static pressure tapping ports [bar]P1 : Pressure of the upstream tapping port [bar gauge]P2 : Pressure of the downstream tapping port [bar gauge]:P2 = P1 – ∆PQ : Flow rate [L/s standard condition]Pa : Atmospheric pressure [bar absolute]T1 : Upstream absolute temperature [K] Test conditions are P1 + Pa = 6.5 ± 0.2 bar absolute, T1 = 297 ± 5K, 0.07 bar ≤ ∆P �≤ 0.14 bar.This is the same concept as effective area A which ISO 6358 stipulates as being applicable only when the pressure drop is smaller than the upstream pressure and the compression of air does not become a problem.
Front matter 27
1-1Solenoid Valve Flow Rate Characteristics (How to indicate flow rate characteristics)
Solenoid Valve Flow Rate Characteristics(How to indicate flow rate characteristics)
3. Process fluid control equipment(1) Conformed standard
IEC60534-1: 2005: Industrial-process control valves. Part 1: control valve terminology and general considerations
IEC60534-2-3: 1997: Industrial-process control valves. Part 2: Flow capacity, Section Three-Test procedures
JIS B 2005-1: 2012: Industrial-process control valves – Part 1: Control valve terminology and general considerations
JIS B 2005-2-3: 2004: Industrial-process control valves – Part 2: Flow capacity – Section 3: Test proceduresEquipment standards: JIS B 8471: Solenoid valve for water
JIS B 8472: Solenoid valve for steamJIS B 8473: Solenoid valve for fuel oil
(2) Definition of flow rate characteristics
Kv factor: Value of the clean water flow rate represented by m3/h that runs through the valve (equipment for test) at 5 to 40°C, when the pressure difference is 1 x 10⁵ Pa (1 bar). It is calculated using the following formula:
1 x 10⁵Kv = Q ———— · ——— ········································································(8) ∆P 1000Kv : Flow coefficient [m3/h]Q : Flow rate [m3/h]∆P : Pressure difference [Pa] : Density of fluid [kg/m3]
(3) Formula of flow rateIt is described by the practical units. Also, the flow rate characteristics are shown in Graph (2).In the case of liquid: ∆PQ = 53Kv ———— ···············································································(9) GQ : Flow rate [L/min]Kv : Flow coefficient [m3/h]∆P : Pressure difference [MPa]G : Relative density [water = 1]In the case of saturated aqueous vapor: Q = 232Kv ∆P(P2 + 0.1) ·······································································(10)Q : Flow rate [kg/h]Kv : Flow coefficient [m3/h]∆P : Pressure difference [MPa]P1 : Upstream pressure [MPa]: ∆P = P1 – P2
P2 : Downstream pressure [MPa] Conversion of flow coefficient:Kv = 0.865 Cv ···········································································(11)
Here,Cv factor: Value of the clean water flow rate represented by US gal/min that runs through the valve at 40 to
100°F, when the pressure difference is 1 lbf/in2 (psi)Value is different from Kv and Cv factors for pneumatic purpose due to different test method.
ρ
ρ
Fig. (3) Test circuit based on IEC60534-2-3, JIS B 2005-2-3
Test range
Equipmentfor test
Thermometer
Throttle valvein the
upstream side
Throttle valve in thedownstream side
Flowmeter
Pressuretap
2d
≥ 20d ≥ 7d
6d
Pressuretap
Wat
er fl
ow r
ate
Q0
[L/m
in] (
Whe
n K
v =
1)
Sat
urat
ed s
team
flow
rat
e Q
0 [k
g/h]
(w
hen
Kv
= 1
)
Pressure differential ∆P [MPa]
Upstream pressure
P1 = 1 MPaP1 = 0.8 MPa
P1 = 0.6 MPa
P1 = 0.5 MPa
P1 = 0.1 MPa
P1 = 0.2 MPa
P1 = 0.4 MPa
Example 2
Example 1
P1 = 0.3 MPa
1
10
100
1
10
100
0.001 0.01 0.1
20
3
4
30
20
5
30
0.002 0.003 0.02 0.03 0.040.004
2
3
45
2
50
4040
50
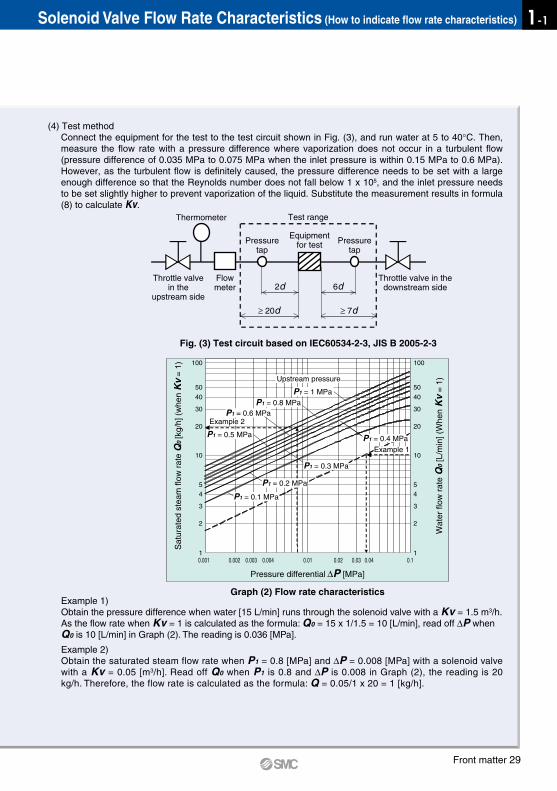
Graph (2) Flow rate characteristicsExample 1)Obtain the pressure difference when water [15 L/min] runs through the solenoid valve with a Kv = 1.5 m3/h.As the flow rate when Kv = 1 is calculated as the formula: Q0 = 15 x 1/1.5 = 10 [L/min], read off ∆P when Q0 is 10 [L/min] in Graph (2). The reading is 0.036 [MPa].
Example 2)Obtain the saturated steam flow rate when P1 = 0.8 [MPa] and ∆P = 0.008 [MPa] with a solenoid valve with a Kv = 0.05 [m3/h]. Read off Q0 when P1 is 0.8 and ∆P is 0.008 in Graph (2), the reading is 20 kg/h. Therefore, the flow rate is calculated as the formula: Q = 0.05/1 x 20 = 1 [kg/h].
(4) Test methodConnect the equipment for the test to the test circuit shown in Fig. (3), and run water at 5 to 40°C. Then, measure the flow rate with a pressure difference where vaporization does not occur in a turbulent flow (pressure difference of 0.035 MPa to 0.075 MPa when the inlet pressure is within 0.15 MPa to 0.6 MPa). However, as the turbulent flow is definitely caused, the pressure difference needs to be set with a large enough difference so that the Reynolds number does not fall below 1 x 10⁵, and the inlet pressure needs to be set slightly higher to prevent vaporization of the liquid. Substitute the measurement results in formula (8) to calculate Kv.
Front matter 28
1-1 Best Pneumatics
Solenoid Valve Flow Rate Characteristics(How to indicate flow rate characteristics)
3. Process fluid control equipment(1) Conformed standard
IEC60534-1: 2005: Industrial-process control valves. Part 1: control valve terminology and general considerations
IEC60534-2-3: 1997: Industrial-process control valves. Part 2: Flow capacity, Section Three-Test procedures
JIS B 2005-1: 2012: Industrial-process control valves – Part 1: Control valve terminology and general considerations
JIS B 2005-2-3: 2004: Industrial-process control valves – Part 2: Flow capacity – Section 3: Test proceduresEquipment standards: JIS B 8471: Solenoid valve for water
JIS B 8472: Solenoid valve for steamJIS B 8473: Solenoid valve for fuel oil
(2) Definition of flow rate characteristics
Kv factor: Value of the clean water flow rate represented by m3/h that runs through the valve (equipment for test) at 5 to 40°C, when the pressure difference is 1 x 10⁵ Pa (1 bar). It is calculated using the following formula:
1 x 10⁵Kv = Q ———— · ——— ········································································(8) ∆P 1000Kv : Flow coefficient [m3/h]Q : Flow rate [m3/h]∆P : Pressure difference [Pa] : Density of fluid [kg/m3]
(3) Formula of flow rateIt is described by the practical units. Also, the flow rate characteristics are shown in Graph (2).In the case of liquid: ∆PQ = 53Kv ———— ···············································································(9) GQ : Flow rate [L/min]Kv : Flow coefficient [m3/h]∆P : Pressure difference [MPa]G : Relative density [water = 1]In the case of saturated aqueous vapor: Q = 232Kv ∆P(P2 + 0.1) ·······································································(10)Q : Flow rate [kg/h]Kv : Flow coefficient [m3/h]∆P : Pressure difference [MPa]P1 : Upstream pressure [MPa]: ∆P = P1 – P2
P2 : Downstream pressure [MPa] Conversion of flow coefficient:Kv = 0.865 Cv ···········································································(11)
Here,Cv factor: Value of the clean water flow rate represented by US gal/min that runs through the valve at 40 to
100°F, when the pressure difference is 1 lbf/in2 (psi)Value is different from Kv and Cv factors for pneumatic purpose due to different test method.
Example 1)Obtain the pressure difference when water [15 L/min] runs through the solenoid valve with a Kv = 1.5 m3/h.As the flow rate when Kv = 1 is calculated as the formula: Q0 = 15 x 1/1.5 = 10 [L/min], read off ∆P when Q0 is 10 [L/min] in Graph (2). The reading is 0.036 [MPa].
Example 2)Obtain the saturated steam flow rate when P1 = 0.8 [MPa] and ∆P = 0.008 [MPa] with a solenoid valve with a Kv = 0.05 [m3/h]. Read off Q0 when P1 is 0.8 and ∆P is 0.008 in Graph (2), the reading is 20 kg/h. Therefore, the flow rate is calculated as the formula: Q = 0.05/1 x 20 = 1 [kg/h].
(4) Test methodConnect the equipment for the test to the test circuit shown in Fig. (3), and run water at 5 to 40°C. Then, measure the flow rate with a pressure difference where vaporization does not occur in a turbulent flow (pressure difference of 0.035 MPa to 0.075 MPa when the inlet pressure is within 0.15 MPa to 0.6 MPa). However, as the turbulent flow is definitely caused, the pressure difference needs to be set with a large enough difference so that the Reynolds number does not fall below 1 x 10⁵, and the inlet pressure needs to be set slightly higher to prevent vaporization of the liquid. Substitute the measurement results in formula (8) to calculate Kv.
Fig. (3) Test circuit based on IEC60534-2-3, JIS B 2005-2-3
Test range
Equipmentfor test
Thermometer
Throttle valvein the
upstream side
Throttle valve in thedownstream side
Flowmeter
Pressuretap
2d
≥ 20d ≥ 7d
6d
Pressuretap
Wat
er fl
ow r
ate
Q0
[L/m
in] (
Whe
n K
v =
1)
Sat
urat
ed s
team
flow
rat
e Q
0 [k
g/h]
(w
hen
Kv
= 1
)
Pressure differential ∆P [MPa]
Upstream pressure
P1 = 1 MPaP1 = 0.8 MPa
P1 = 0.6 MPa
P1 = 0.5 MPa
P1 = 0.1 MPa
P1 = 0.2 MPa
P1 = 0.4 MPa
Example 2
Example 1
P1 = 0.3 MPa
1
10
100
1
10
100
0.001 0.01 0.1
20
3
4
30
20
5
30
0.002 0.003 0.02 0.03 0.040.004
2
3
45
2
50
4040
50
Graph (2) Flow rate characteristics
Front matter 29
1-1Solenoid Valve Flow Rate Characteristics (How to indicate flow rate characteristics)