Embed Size (px)
Citation preview

Air Ion Researchin
Atmospheric Electricity
Institute of Environmental Physics, University of Tartu
Hyytiälä 2005

CONTENTS:
• Discovery and Nature of Air Ions
• Air Ion Measurements Until 1963
• World Data Centre
• Dataset ATMEL1
• Air Ion Measurements at Tahkuse
Hyytiälä 2005
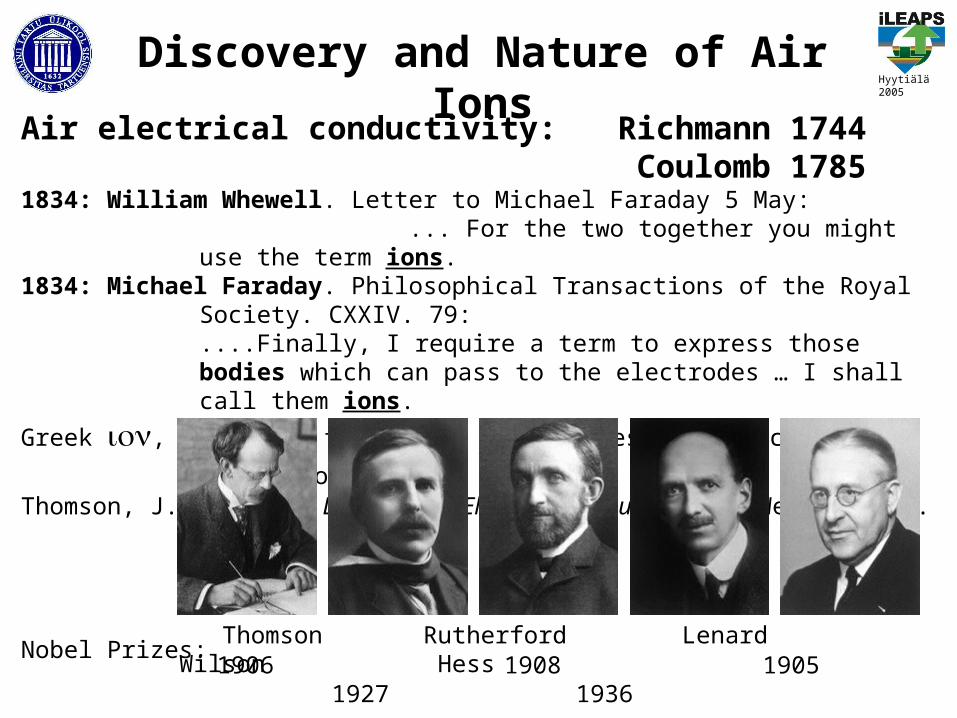
Discovery and Nature of Air Ions
Air electrical conductivity: Richmann 1744Coulomb 1785
1834: William Whewell. Letter to Michael Faraday 5 May: ... For the two together you might use the term ions.1834: Michael Faraday. Philosophical Transactions of the Royal Society. CXXIV. 79:
....Finally, I require a term to express those bodies which can pass to the electrodes … I shall call them ions.
Greek , something that goes, neuter present participle of , to go.Thomson, J.J. (1898) Discharge of Electricity Through Gases, Westminster.
Nobel Prizes:
Hyytiälä 2005
Thomson Rutherford Lenard Wilson Hess1906 1908 1905 1927 1936

Discovery and Nature of Air Ions
Elster, J., Geitel, H. (1899) Über die Existenz elektrischer Ionen in der Atmosphäre.Terr. Magn. Atmos. Electr. 4, 213-234.
(Terrestrial Magnetism was grounded 1996, renamed to Terrestrial Magnetism and Atmospheric Electricity 1899 and to Journal of Geophysical Research 1949)
Hyytiälä 2005
Langevin, P. (1905) Sur les ions de l’atmosphère. C. R. Acad. Sci. 140, 232-234.Pollock, J.A. (1915) A new type of ion in the air. Phil. Mag. 29, 636-646.................Israël, H. (1970) Atmospheric Electricity. Jerusalem.
222Rn → 218Po → 214Pb → 214Bi → 214Po → 210Pb → 210Bi → 210Po → 206Pb
220Rn → 216Po → 212Bi → 208Tl → 208Pb
3.8 d 3 min 27 min 20 min <1 ms 23 y 5 d 138 d
5.5 MeV 5.2 Mev 7.7 MeV 5.3 MeV
56 s 0.2 s 1 h 183 s
6.3 MeV 6.8 MeV 6 MeV

Expanding research fields and the position of air ionsas a common research subject Hyytiälä 2005
GD
AE
ASGD – Gas Dischargeand Plasma Physics
AS – Aerosol Science
AE – Atmospheric Electricity
AIR IONS

Air Ion Measurements Until 1963Measured quantities:
Air conductivity
Concentration of small air ions
Concentrations of few ion groups
Mobility distribution of air ions
During the first period of the increased activity in 1904...1914, air conductivity was routinely measured at a large number of stations. Both conductivity and small ion concentration were systematically measured at about 10 locations in Europe and South America. The original data of old measurements are often lost or stored in archives inaccessible for the wide community of scientists.
A large amount of work in recovering and analysing retrospective data has been done by Giles Harrison in Reading, UK.
Hyytiälä 2005
} Mobility and size of small air ions

Analysis of retrospective data by Harrison:
F. Märcz and R.G. Harrison (2005) Further signatures of long-term changes in atmospheric electrical parameters observed in Europe. Annales Geophysicae 23.
Harrison R.G. and Ingram W.J. (2004) Air-earth current measurements at Kew, London, 1909-1979. Atmos. Res., doi: 10.1016.
Harrison, R.G. (2004) Long-range correlations in measurements of the global atmospheric electric circuit. J. Atmos. Solar-Terr. Phys., 66, 1127-1133.
Harrison R.G. (2004) Long term measurements of the global atmospheric electric circuit at Eskdalemuir, Scotland, 1911-1981. Atmos. Res. 70 (1), 1-19.
Harrison R.G. and Aplin K.L. (2003) Nineteenth century Parisian smoke variations inferred from Eiffel Tower atmospheric electrical observations. Atmos. Environ. 37, 5319-5324.
Märcz F. and Harrison R.G. (2003) Long-term changes in atmospheric electrical parameters observed at Nagycenk (Hungary) and the UK Observatories at Eskdalemuir and Kew. Annales Geophysicae 21, 2193-2200.
Harrison R.G. (2003) Twentieth century atmospheric electrical measurements at the observatories of Kew, Eskdalemuir and Lerwick. Weather 58, 11-19.
Harrison R.G. (2002) Twentieth century secular decrease in the atmospheric electric circuit. Geophysical Research Letters, 29(14) DOI 10.1029/2002GL014878,
Harrison R.G. and Aplin K.L. (2002) Mid-nineteenth century diurnal smoke concentrations at Kew, London. Atmos. Environ. 36, 25 4037-4043.
Harrison R.G. (2004) Twentieth century air pollution near London: a reconstruction from measurements of atmospheric electricity. Childhood Leukaemia: Incidence, causal mechanisms and prevention, London 6th-10th September 2004, 4-6.
Harrison R.G. (2003) Climate change and long-term variations in the atmospheric electrical system. Proc.12th International Conference on Atmospheric Electricity, Versailles, vol2, 703-706, 2003.
Harrison R.G. (2003) Long-term changes in aerosol and the electrical conductivity of oceanic air. Proc. 14th annual conference, The Aerosol Society, Reading, 2nd-3rd April 2003, 22-25.
Harrison R.G. and Aplin K.L. (2002) Aerosol variations inferred from historical atmospheric electrical data. Proc. XIIIth Annual Conference The Aerosol Society, Lancaster, April 2002, 113-116.
Hyytiälä 2005

Concentration of few ion groups
Early thirties: H. Israël and L. Schulz (Ph.D. thesis 1933 “Beiträge zur Kenntnis der Luftionen”) initiated measurement of four ion groups (ultralarge, Langevin, large intermediate, small intermediate) in many locations in Europe. 4-10 measurements were made in one location. The results are resumed in the book by Israël (1970).
Systematic measurements were made by J. Reinet in Tartu during full year 1951. Events of increased concentration of intermediate ions (charged nanometer particles) were discovered. P. Prüller carried out 3 year measurements in Tartu 1960-1963. The concentrations of ion groups were recorded 4-8 times every day.
Hyytiälä 2005
Early fifties: Christian Junge showed that the measurements of large and intermediate ions contain unique information about atmospheric aerosol:
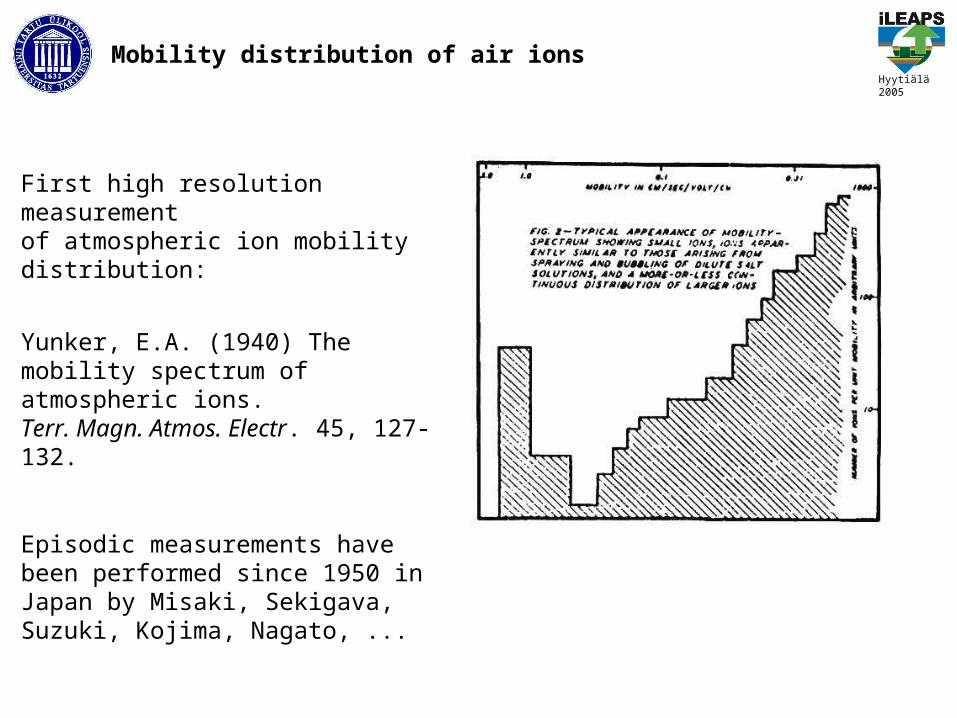
Mobility distribution of air ions
First high resolution measurementof atmospheric ion mobility distribution:
Yunker, E.A. (1940) The mobility spectrum of atmospheric ions.Terr. Magn. Atmos. Electr. 45, 127-132.
Episodic measurements have been performed since 1950 in Japan by Misaki, Sekigava, Suzuki, Kojima, Nagato, ...
Hyytiälä 2005

World Data Centre
The World Data Centre for Atmospheric Electricity operated within the Main Geophysical Observatory, St. Petersburg, Russia 1965-1993.
The data for 1964-1989 were published as monthly reports "Results of ground observations of atmospheric electricity".
Hyytiälä 2005
Kolokolov, V.P. (1981) On activity of World Data Centre for Atmospheric Electricity (in Russian). Meteorologya i Gidrologya, N2, 119-120.
Gordyuk, V.P. and Tammet, H. (1992) Modernization of the World Data Center for Atmospheric Electricity. Proc. 9th Int. Conf. on Atmospheric Electricity, St. Petersburg, 1, pp. 46–49.
Dolezalek, H. (1992) The World Data Centre for Atmospheric Electricity and global change monitoring. European Science Notes Information Bulletin. 92-02. Office of Naval Research, European Office, 1-37.

List of 37 stations, which have been sent the data to WDCHyytiälä 2005
Aachen (FRG) Kara-Dag (Ukraine) Porto (Portugal)
Auckland (N-Zealand) Kew (UK) Potsdam (Germany)
Athens (Greece) Kiev (Ukraine) Sacushima (Japan)
B-Elan (Russia) Kirov (Russia) Soccoro (USA)
Brest (France) Lisbon (Portugal) Swider (Poland)
Budapest (Hungary) Lerwick (UK) Tashkent (Uzbekistan)
Dourbes (Belgium) Macherata (Italy) Toronto (Canada)
Eskdalemuir (UK) Memambetsu (Japan) Uccle (Belgium)
Dusheti (Georgia) Montreal (Canada) University Park (USA)
Helsinki (Finland) Murmansk (Russia) Venice (Italy)
Irkutsk (Russia) Nivot Ridge (USA) Verkhnee Dubrovo (Russia)
Kakioka (Japan) Odessa (Russia) Voeikovo (Russia)
Yuzhno-Sakhalinsk (Russia)

A page of WDC monthly brochure Hyytiälä 2005

A sample of original WDC data written in YaOD
599307096 4 1 9999999 8 796121200120150 29999599307096 4 110999999 7 696999999999999999999599307096 4 111999999 7 696999999999999999999599307096 4 112999999 7 69610 084000100 39999599307096 4 113999999 5 596999999999999999999599307096 4 114999999 4 496999999999999999999599307096 4 115999999 6 69610 084000 90 49999599307096 4 116999999 6 5969999999999999972 2599307096 4 117999999 6 5969999999999999972 1599307096 4 118999999 6 59610 882020 90 472 1599307096 4 119999999 6 5969999999999999972 1599307096 4 120999999 5 4969999999999999972 1599307096 4 121999999 3 596101088002 90 672 1599307096 4 122999999 4 4969999999999999972 1599307096 4 123999999 3 5969999999999999972 2599307096 4 124999999 5 696101088002110 573 1599307096 4 2 1999999 5 6969999999999999973 2599307096 4 2 2999999 6 6969999999999999973 2599307096 4 2 3999999 7 796101088220120 373 1
Hyytiälä 2005

Dataset ATMEL1Stations: 13 Quantities: 51 Variables: 158 Diurnal series: 456 105
Data format: Diary (DataDiurna) Bytes: 42 922 325
Hyytiälä 2005
Latitude Longitude Altitude Station59.97 30.3 72 Voeikovo near St. Petersburg (former Leningrad)52.27 104.32 467 Irkutsk near Baikal See42.08 44.7 910 Dusheti near Tbilisi56.8 60.63 237 Verhnee Dubrovo near Jekaterinenburg (former Sverdlovsk)46.48 30.63 42 Odessa46.95 142.72 22 South-Sakhalinsk (Japanese name Toyohara)41.27 69.27 477 Tashkent47.5 11.15 1780 Wank Peak: R.Reiter's station near Garmish-Partenkirchen59.93 17.58 10 Marsta Meteorological Observatory (University of Uppsala)59.436 24.757 10 Viru: City centre of Tallinn (Estonia)58.55 26.38 40 Saarejärve: EMEP station in Estonia59.53 25.88 5 Lahemaa: EMEP station in Estonia58.39 21.84 5 Vilsandi: EMEP station in Estonia

ATMEL1 quantities
Type of quantity
#
Cloud characteristic
8Weather type
3Condensation nuclei
3Concentrations of gases
6Humidity
2Electric field
3Electric current
2Air conductivity
3Concentration of small air ions
2Space charge
1Air pressure
1Optical radiation (incl. UV)
4Air temperature
6Richardson number
1Wind
5Visibility
1
Hyytiälä 2005

ATMEL1 quantities page 1:
Stat. Quantity From ToIrk Cl-low 19890101 19970331Ode Cl-low 19890101 19940831Sakh Cl-low 19890101 19940630Tash Cl-low 19890101 19951231Ural Cl-low 19890101 19961210Vo Cl-low 19890101 19970331Irk Cl-mid 19890101 19970331Ode Cl-mid 19890101 19940831Sakh Cl-mid 19890101 19940630Tash Cl-mid 19890101 19951231Ural Cl-mid 19890101 19961210Vo Cl-mid 19890101 19970331Irk Cl-nim 19890101 19970331Ode Cl-nim 19890101 19940831Sakh Cl-nim 19890101 19940630Tash Cl-nim 19890101 19951231Ural Cl-nim 19890101 19961210Vo Cl-nim 19890101 19970331Wank Cl-R 19810613 19831231Irk Cl-str 19890101 19970331
Hyytiälä 2005
Stat. Quantity From ToOde Cl-str 19890101 19940831Sakh Cl-str 19890101 19940630Tash Cl-str 19890101 19951231Ural Cl-str 19890101 19961210Vo Cl-str 19890101 19970331Irk Cl-tot 19890101 19970331Ode Cl-tot 19890101 19940831Sakh Cl-tot 19890101 19940630Tash Cl-tot 19890101 19951231Ural Cl-tot 19890101 19961210Vo Cl-tot 19890101 19970331Irk Cl-upp 19890101 19970331Ode Cl-upp 19890101 19940831Sakh Cl-upp 19890101 19940630Tash Cl-upp 19890101 19951231Ural Cl-upp 19890101 19961210Vo Cl-upp 19890101 19970331Irk Cl-ver 19890101 19970331Ode Cl-ver 19890101 19940831Sakh Cl-ver 19890101 19940630
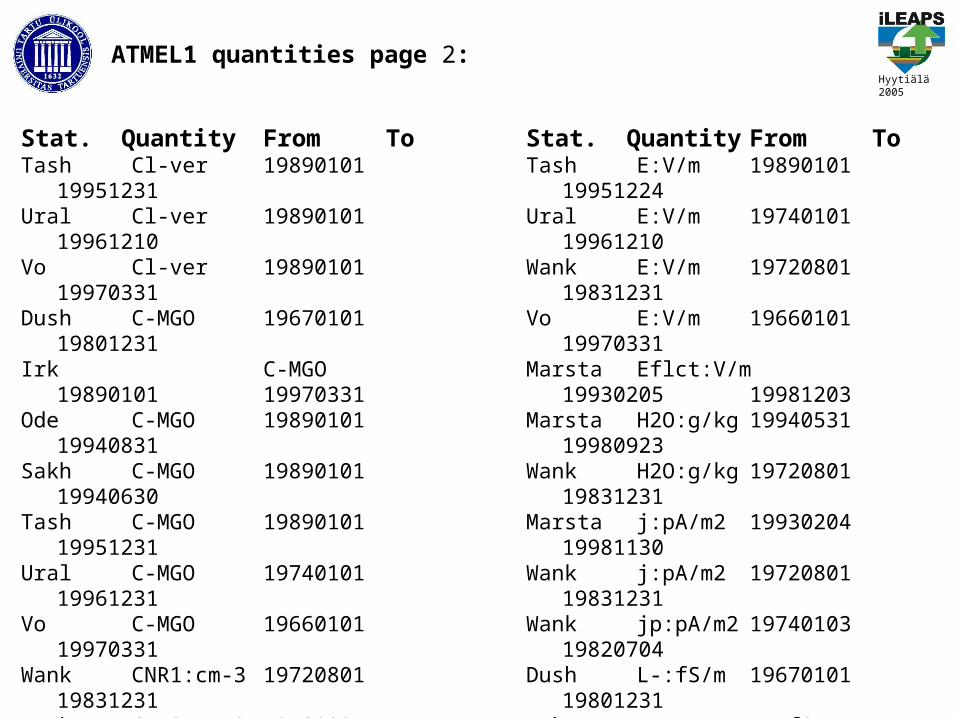
ATMEL1 quantities page 2:Hyytiälä 2005
Stat. Quantity From To Tash Cl-ver 19890101
19951231Ural Cl-ver 19890101
19961210Vo Cl-ver 19890101
19970331Dush C-MGO 19670101
19801231Irk C-MGO 19890101
19970331Ode C-MGO 19890101
19940831Sakh C-MGO 19890101
19940630Tash C-MGO 19890101
19951231Ural C-MGO 19740101
19961231Vo C-MGO 19660101
19970331Wank CNR1:cm-3 19720801
19831231Wank CNR2:cm-3 19720801
19831231Wank CNR3:cm-3 19720801
19831231Viru CO:mg/m3 19940725
19990731Wank E:inv/h 19720801
19831231Dush E:V/m 19670101
19801231Irk E:V/m 19890101
19970331Marsta E:V/m 19930203
19981203Ode E:V/m 19890101
19940831Sakh E:V/m 19890101
19940630
Stat. Quantity From ToTash E:V/m 19890101
19951224Ural E:V/m 19740101
19961210Wank E:V/m 19720801
19831231Vo E:V/m 19660101
19970331Marsta Eflct:V/m 19930205
19981203Marsta H2O:g/kg 19940531
19980923Wank H2O:g/kg 19720801
19831231Marsta j:pA/m2 19930204
19981130Wank j:pA/m2 19720801
19831231Wank jp:pA/m2 19740103
19820704Dush L-:fS/m 19670101
19801231Irk L-:fS/m 19890101
19970331Marsta L-:fS/m 19930204
19981130Ode L-:fS/m 19890204
19940831Sakh L-:fS/m 19890101
19910815Ural L-:fS/m 19740101
19951001Wank L-:fS/m 19730724
19831130Vo L-:fS/m 19660103
19970331Dush L+:fS/m 19670101
19801231Irk L+:fS/m 19890101
19970331

ATMEL1 quantities page 3:Hyytiälä 2005
Stat. Quantity From ToMarsta L+:fS/m 19930203
19981203Ode L+:fS/m 19890204
19940831Sakh L+:fS/m 19890101
19910815Ural L+:fS/m 19740101
19951001Wank L+:fS/m 19730724
19831130Vo L+:fS/m 19660102
19970331Wank NC-:cm-3 19720801
19831231Wank NC+:cm-3 19720801
19831231Saare NO:ug/m3 19971231
19990620Vils NO:ug/m3 19950418
19990630Viru NO:ug/m3 19940725
19990731Saare NO2:ug/m3 19971122
19990620Vils NO2:ug/m3 19950418
19990630Viru NO2:ug/m3 19940725
19990731Saare NOX:ug/m3 19971122
19990620Wank NOX:ug/m3 19740308
19830729Vils NOX:ug/m3 19950418
19990630Viru NOX:ug/m3 19940725
19990731Lahe O3:ug/m3 19940615
19990731Saare O3:ug/m3 19971112
19990620
Stat. Quantity From ToVils O3:ug/m3 19940528
19990630Viru O3:ug/m3 19960605
19990731Marsta p:mb 19940531
19981130Dush Ph-code 19670101
19801231Irk Ph-code 19890101
19970331Ode Ph-code 19890101
19940831Sakh Ph-code 19890101
19940630Tash Ph-code 19890101
19951231Ural Ph-code 19740101
19961231Vo Ph-code 19660101
19970331Dush Ph-int 19670101
19801231Irk Ph-int 19890101
19970331Ode Ph-int 19890101
19940831Sakh Ph-int 19890101
19940630Tash Ph-int 19890101
19951231Ural Ph-int 19740101
19961231Vo Ph-int 19660101
19970331Wank Rad:W/m2 19720801
19831231Marsta RH% 19940531
19980923Wank RH% 19720801
19831231

ATMEL1 quantities page 4:Hyytiälä 2005
Stat. Quantity From ToMarsta Ri 19940531
19981130Marsta SC:pC/m3 19930204
19981130Wank SC:pC/m3 19730724
19831231Wank Sky:W/m2 19770205
19831231Saare SO2:ug/m3 19971231
19990620Vils SO2:ug/m3 19940528
19990630Viru SO2:ug/m3 19940726
19990731Wank Sun% 19730729
19831231Wank T:C 19720801
19831231Marsta T08:C 19940531
19981130Marsta T10:C 19940531
19981130Wank Tepot:K 19730703
19831231Marsta Tgr:K/m 19940531
19981130Wank Tpot:K 19730703
19831231Wank UV:mW/m2 19740307
19831231Marsta Wflct:m/s 19940531
19981130Irk Wind:deg 19890101
19970331Lahe Wind:deg 19970218
19990731Marsta Wind:deg 19940531
19981130Ode Wind:deg 19890101
19940831
Stat. Quantity From ToSakh Wind:deg 19890101
19940630Tash Wind:deg 19890101
19951231Ural Wind:deg 19890101
19961210Wank Wind:deg 19720801
19831231Vils Wind:deg 19951231
19960720Vo Wind:deg 19890101
19970331Irk Wind:m/s 19890101
19970331Lahe Wind:m/s 19970219
19990731Ode Wind:m/s 19890101
19940831Sakh Wind:m/s 19890101
19940630Tash Wind:m/s 19890101
19951231Ural Wind:m/s 19890101
19961210Wank Wind:m/s 19720801
19831231Vils Wind:m/s 19951231
19960720Vo Wind:m/s 19890101
19970331Marsta Wind08:m/s 19940531
19981130Marsta Wind10:m/s 19940531
19981130Wank Vis:km 19750109
19831231

Diary format
From data by Reinhold Reiter:
WANK. 06.12.77STUNDENWERTE:T-00.4 -01.0 -02.2 -02.9 -01.8 -01.7 -00.1 +00.2 +00.7 +00.1 -00.1 -00.4-00.4 -00.1 +00.5 -00.2 -00.5 -01.2 -02.0 -02.1 -02.3 -02.7 -02.8 -03.0RF 21.5 21.8 24.2 26.2 22.4 24.0 20.7 22.8 29.8 36.1 41.1 43.8 45.9 49.4 47.6 50.6 52.8 58.6 61.2 63.7 76.1 83.8 88.1 89.5
Modified:06.12.77,T(Wank),-0.4,-1.0,-2.2,-2.9,-1.8,-1.7,-0.1,+0.2,+0.7,+0.1, -0.1,-0.4,-0.4,-0.1,+0.5,-0.2,-0.5,-1.2,-2.0,-2.1,-2.3,-2.7,-2.8,-3.006.12.77,RF(Wank),21.5,21.8,24.2,26.2,22.4,24.0,20.7,22.8,29.8,36.1, 41.1,43.8,45.9,49.4,47.6,50.6,52.8,58.6,61.2,63.7,76.1,83.8,88.1,89.5
Advantages of diary:• adapted for routine environmental measurements• saved as immediately readable text• data manager will be available as freeware
Hyytiälä 2005

A diary standard: DataDiurna
DDD,ATMEL1,20041230
19950615,Tash,Cl-mid,h0,1,1,1,1,1,1,1,1,1,1,1,1,1,1,1,1,0,0,0,0,0,0,1,1
19950615,Tash,Wind:deg,h0,87,103,120,133,147,160,203,247,290,193,97,0,...
19950615,Tash,Wind:m/s,h0,1,2,2,2,1,1,1,1,1,1,0,0,0,0,0,0,1,1,1,1,1,1,1,1
19950615,Marsta,RH%,h0,100.0,100.0,100.0,100.0,100.0,99.6,98.4,98.9,98.2,94.6,...
19950615,Marsta,E:V/m,h0,10,-2,46,72,67,66,-1,164,91,61,59,98,93,93,76,76,84,...
19950615,Marsta,L+:fS/m,h0,23.1,22.9,23.9,24.8,24.5,24.4,24.1,24.2,24.7,25.7,....
19950615,Marsta,L-:fS/m,h0,13.3,13.8,14.0,15.7,19.5,19.1,20.0,20.6,25.2,24.5,...
19950615,Marsta,SC:pC/m3,h0,3.7,1.3,-0.5,-0.5,-0.5,1.8,-1.0,-0.6,-0.3,-0.3,4.3,8.2,....
19950615,Marsta,j:pA/m2,h0,0.36,-0.07,1.74,2.92,2.95,2.87,-0.04,7.35,4.54,3.06,....
19950615,Viru,SO2:ug/m3,h0,3.7,2.9,2.5,2,2.6,3.8,6.1,7.5,7.7,6.7,5.7,5.2,5,2.7,2.1,...
19950615,Vils,NO2:ug/m3,h0,4.1,4.2,4.3,3.1,4.1,9999,0.8,2.1,9999,1.4,3.4,1.8,0.4,...
19950615,Vils,NOX:ug/m3,h0,4.3,4.5,4.5,3.5,4.5,9999,1.1,2.5,9999,1.8,4.3,2.2,0.6,...
Hyytiälä 2005

A diary standard: DataDiurna
DDS,ATMEL1,20041223Vo,59.97,30.3,72,Voeikovo near St. Petersburg (former Leningrad)Irk,52.27,104.32,467,Irkutsk near Baikal SeeDush,42.08,44.7,910,Dusheti near TbilisiUral,56.8,60.63,237,Verhnee Dubrovo near Jekaterinenburg (former Sverdlovsk)Ode,46.48,30.63,42,Odessastationlabel,latitude,longitude,altitude[,explanations]
DDQ,ATMEL1,20041223T:C,Celsius,1,-90,90,99,Air temperature near the stationT08:C,Celsius,2,-90,90,99,Air temperature at height of 0.8 mT10:C,Celsius,2,-90,90,99,Air temperature at height of 10 mTgr:K/m,K/m,3,-2,2,9,Gradient of temperature (ATMEL1-MARSTA.doc) Tpot:K,Kelvin,1,180,360,999,Potential temperature (ATMEL1-WANK.doc)Tepot:K,Kelvin,1,180,360,999,Equipotential temperature (ATMEL1-WANK.doc)p:mb,millibar,1,100,1200,9999,Air pressure near the stationRH%,%,1,0,100,999,Relative humidityquantitylabel,unit,decimals,lowconstraint,highconstraint,missing[,explanations]
DDR,ATMEL1,20041228h0,24,1800,Average during full hour, first period 00:00-01:00hw,24,0Average during full hour, first period 23:30-00:30regimelabel,valuesperday,reference[,explanations]
Hyytiälä 2005
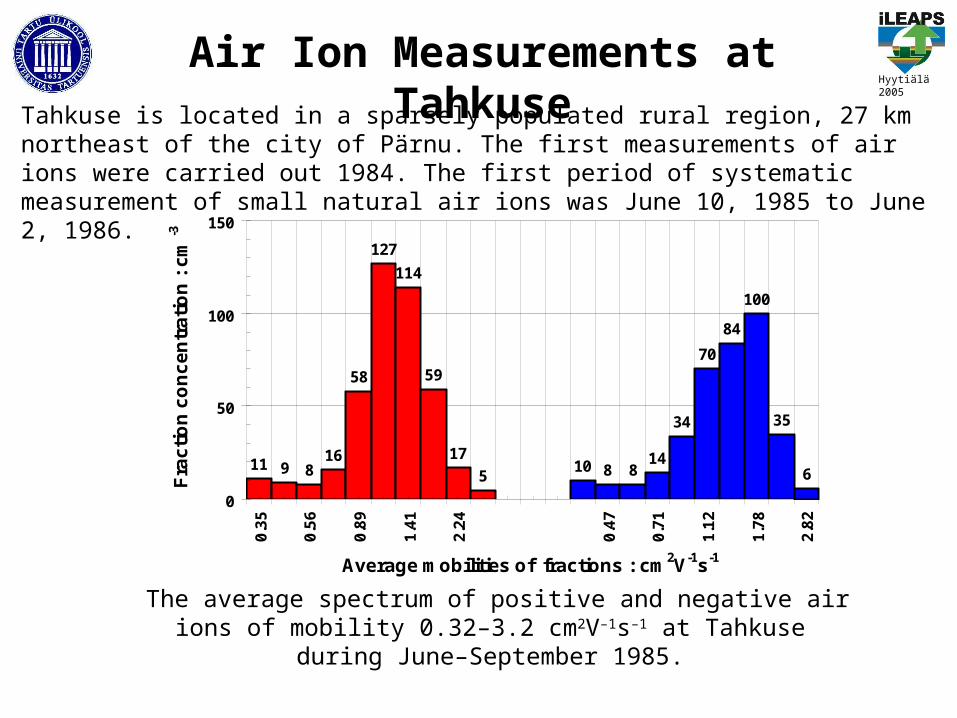
Air Ion Measurements at TahkuseTahkuse is located in a sparsely populated rural region, 27 km northeast of the city of Pärnu. The first measurements of air ions were carried out 1984. The first period of systematic measurement of small natural air ions was June 10, 1985 to June 2, 1986.
Hyytiälä 2005
11 9 816
58
127
114
59
17
510 8 8
14
34
70
84
100
35
6
0
50
100
150
0.3
5
0.5
6
0.8
9
1.4
1
2.2
4
0.4
7
0.7
1
1.1
2
1.7
8
2.8
2
Average mobilities of fractions : cm2V-1s-1
Fra
cti
on
co
nc
en
tra
tio
n :
cm
-3
+ _
The average spectrum of positive and negative air ions of mobility 0.32–3.2 cm2V–1s–1 at Tahkuse during June–September 1985.

First observations of bursts of intermediate ions at Tahkuse
Hourly average 13 June 1985 at 03 a.m.
Hyytiälä 2005
Hourly average 05 September 1985 at 05 p.m.
170
143
101
77
97 100
68
2010 8 7 8 10 15
33
78
105
41
10
224
0
50
100
150
200
250
0.3
5
0.5
6
0.8
9
1.4
1
2.2
4
0.4
7
0.7
1
1.1
2
1.7
8
2.8
2
Average mobilities of fractions : cm2V-1s-1
Fra
cti
on
co
nc
en
tra
tio
n :
cm-3
+ _
8 020
54
10410581
235
337
173
90 90107
131
100128
47
831
0
50
100
150
200
250
300
350
0.35
0.56
0.89
1.41
2.24
0.47
0.71
1.12
1.78
2.82
Average mobilities of fractions : cm2V-1s-1
Fra
ctio
n c
on
cen
trat
ion
: cm
-3
+ _
Tammet, H., Salm, J. and Iher, H. (1988) Observation of condensation on small air ions in the atmosphere. In Atmospheric Aerosols and Nucleation. Lecture Notes in Physics, Springer-Verlag, Vienna, 309, pp. 239–240.

Tahkuse:Hyytiälä 2005

Tahkuse today: An extended instrumentation for measurements of the air ion spectra in
a wide mobility range is running from 1988. Main instruments are: • Air ion spectrometer with a mobility range of 0.00032-3.2 cm2V-1s-1, • NO2 concentration meter designed at the University of Turku, • Ozone meter M-83 for measurements of total column ozone, • Pyranometer M-80M,• Sensors of wind, temperature, pressure, and humidity, • Devices for collection of precipitations. The data are saved as average values every 5 min.
Hyytiälä 2005
Selected publications Hõrrak, U., H. Iher, A. Luts, J. Salm, and H. Tammet (1994) Mobility spectrum of air ions at Tahkuse Observatory, J. Geophys. Res., 99, 10679–10700. Hõrrak, U., J. Salm, and H. Tammet (1998) Bursts of intermediate ions in atmospheric air, J. Geophys. Res. Atmospheres, 103, 13909-13915. Hõrrak, U., A. Mirme, J. Salm, E. Tamm, and H. Tammet (1998) Air ion measurements as a source of information about atmospheric aerosols, Atmos. Res., 46, 233-242.Hõrrak, U., Salm, J. and Tammet, H. (2000) Statistical characterization of air ion mobility spectra at Tahkuse Observatory: Classification of air ions. J. Geophys. Res. Atmospheres 105, 9291–9302.Hõrrak, U., Salm, J., Tammet, H. (2003) Diurnal variation in the concentration of air ions of different mobility classes at a rural area. J. Geophys. Res. Atmospheres, 108(D20), 4653.
Hõrrak, U. (2001) Air Ion Mobility Spectrum at a Rural Area. PhD Thesis, University of Tartu.

From the thesis by Hõrrak:
Average mobility spectra of air ions at Tahkuse. Sept. 1993 – Oct. 1994.
Hyytiälä 2005
Particle diameter (nm)
Mobility (cm 2 V -1 s -1 )
Fra
ctio
n c
on
cen
tra
tion
(c
m-3
)
90 26 7.6 2.0 0.36
0
100
200
300
400
500
600
0.00032 0.0032 0.032 0.32 3.2
Positive ions Negative ions
Small ions Large ions
Intermediate ions
Aerosol ions Cluster ions

Tahkuse: comparison of air ion and aerosol instruments
From: Hõrrak, U., Mirme, A., Salm, J., Tamm, E. and Tammet, H. (1998) Air ion measurements as a source of information about atmospheric aerosols. Atmos. Res. 46, 233–242.
Hyytiälä 2005
100
1000
10000
1 10 100 1000Particle diameter : nm
dn
/ d (l
n d
) : c
m-3
EAS, April
EAS, May
Ion spectrometer, April
Ion spectrometer, May