Embed Size (px)
Citation preview
Number 47May 2011
AbstrActThe purpose of this CAST Issue
Paper is to go beyond the general-izations and accusations often as-sociated with the air quality topic. Experts from six universities ex-amine a large amount of data and focus their information and conclu-sions around the key livestock ar-eas: swine, poultry, dairy, and beef. Their critical analyses look at a wide scope of issues, from greenhouse gas (GHG) emissions to the logistics of manure storage facilities. The U.S. Environmental Protection Agency (EPA) is increasing efforts to moni-tor emissions from agriculture, so further research is important for all parties involved, and this paper pro-vides solid, science-based informa-tion.
Studies indicate that large live-stock production facilities lower the value of residences within 4.8 kilometers (km; three miles) of the facility. Other economic studies also indicate, however, that the busi-nesses increase economic activity in the county and state. For the greater good of the rural community, a com-promise needs to be reached between the positive and negative impacts of livestock production facilities us-ing a common-sense approach that considers both regulatory and market forces.
Air emissions attributed to ani-mal agriculture consist of odorous and gaseous compounds as well as particulate matter associated with manure and animal management. While localized problems associated with odor tend to get highlighted, gaseous compounds having local-ized or regional impacts, such as ammonia, and global concerns, such
This material is based upon work supported by the U.S. Department of Agriculture’s (USDA) National Institute for Food and Agriculture (NIFA) Grants No. 2010-38902-20899, No. 2009-38902-20041, and No. 2008-38902-19327 and USDA’s Agricultural Research Service (ARS) Agreement No. 59-0202-7-144. Any opinions, findings, conclusions, or recommendations expressed in this publication are those of the author(s) and do not necessarily reflect the views of USDA, NIFA, or ARS.
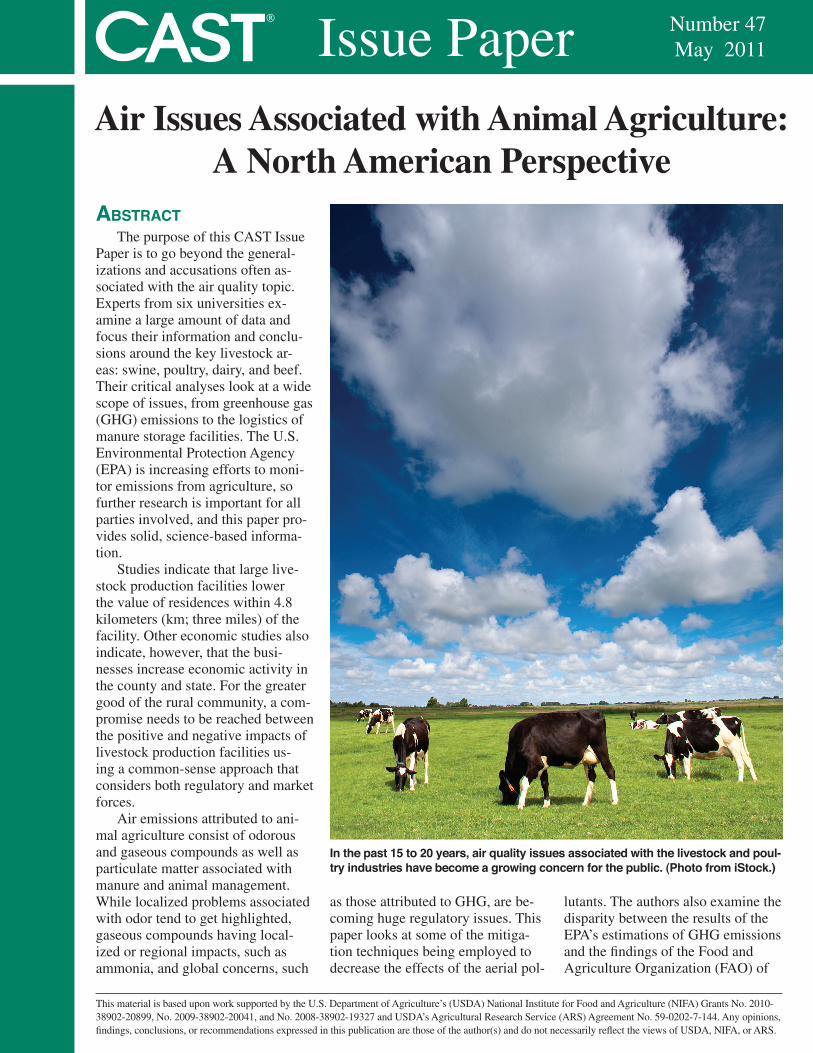
In the past 15 to 20 years, air quality issues associated with the livestock and poul-try industries have become a growing concern for the public. (Photo from iStock.)
Air Issues Associated with Animal Agriculture:A North American Perspective
as those attributed to GHG, are be-coming huge regulatory issues. This paper looks at some of the mitiga-tion techniques being employed to decrease the effects of the aerial pol-
lutants. The authors also examine the disparity between the results of the EPA’s estimations of GHG emissions and the findings of the Food and Agriculture Organization (FAO) of
COUNCIL FOR AGRICULTURAL SCIENCE AND TECHNOLOGY2
CAST Issue Paper 47 Task Force Members
Authors
ReviewersCAST Liaison
Larry D. Jacobson (Chair), Depart-ment of Bioproducts and Biosystems Engineering, University of Minne-sota, St. PaulBrent W. Auvermann, Department of Biological and Agricultural Engineering, Texas A&M Univer-sity, AmarilloRay Massey, Department of Ag-ricultural and Applied Economics, University of Missouri, Columbia
sions data for U.S. animal feeding operations (AFOs) and recommended the development of credible meth-odologies for estimating air emis-sions. The American Public Health Association (2003) called for a mora-torium on new AFOs until their im-pact on the environment and health was better understood. In 2001, the U.S. Department of Agriculture–Initiative for Future Agricultural and Food Systems program funded two multistate studies that monitored am-monia (NH3) emissions from poultry (broiler and layer) buildings (Iowa, Kentucky, Pennsylvania) and NH3, hydrogen sulfide (H2S), carbon diox-ide (CO2), particulate matter1 (PM), and odor emissions from swine and poultry buildings (Illinois, Indiana, Iowa, Minnesota, North Carolina, Texas).
In 2005, the United States Environmental Protection Agency (EPA) settled on an Air Compliance Agreement (ACA) (USEPA 2005) with various livestock and poultry industry groups with the goals of (1) monitoring and evaluating air emis-sions from AFOs, (2) decreasing air pollution, and (3) ensuring compli-ance by AFOs with applicable legis-lation and regulation. Another ACA study was conducted in 2005–2006
in the southeastern United States with a major poultry producer that measured NH3, H2S, greenhouse gases (GHGs—CH4 [methane], CO2, and N2O [nitrous oxide]), volatile organic compounds (VOCs), and PM emissions (ISU 2006).
The EPA recently (January 2011) released air emission data on their website, http://www.epa.gov/airqual-ity/agmonitoring/index.html, from the National Air Emissions Monitoring Study. This study, which was the main portion of the EPA ACA studies, includes emissions data from barns and manure storage sites across the United States for dairy (nine farms in California, Indiana, New York, Texas, Washington, and Wisconsin), swine (eleven farms in Indiana, Iowa, North Carolina, and Oklahoma), broiler (one farm in California), and layer (three farms in California, Indiana, and North Carolina) operations. Air pollutants monitored include PM, H2S, NH3, and VOCs (USEPA 2006a). The EPA cites the Clean Air Act (CAA) goal of protecting public health and environmental quality as the legislation directing it to poten-tially regulate air quality from animal agriculture, if emissions are found to exceed threshold levels triggering regulation.
Air emissions associated with animal agriculture consist of odor-ous and gaseous compounds and PM
Frank M. Mitloehner, Department of Animal Science, University of California–DavisAlan L. Sutton, Department of Animal Science, Purdue University, West Lafayette, IndianaHongwei Xin, Department of Agri-cultural and Biosystems Engineering, Iowa State University, Ames
Garth W. Boyd, Camco Global, Topsail Beach, North Carolina
Richard R. Stowell, Departments of Biological Systems Engineering and Animal Science, University of Nebraska–LincolnLingying Zhao, Department of Food, Agricultural, and Biological Engineering, The Ohio State Uni-versity, Columbus
A. David Scarfe, American Veterinary Medical Association, Schaumburg, Illinois
the United Nations.A few of the many specific find-
ings include: diet composition has a significant impact on emissions; miti-gation methods, such as covering the manure storage surface, can greatly decrease odor emissions; and aeration of the storage basin or employing an-aerobic digestion of the manure will also reduce the odor, but with higher costs. The much-quoted study entitled Livestock’s Long Shadow distinguish-es between intensive and extensive livestock production; U.S. production is intensive so it does not have the GHG emissions associated with poor feed quality and deforestation.
IntroductIonHistorically, environmental con-
cerns and regulations of animal agri-culture have focused on water quality. In the past 15 to 20 years, air quality issues associated with the livestock and poultry industries have become a growing concern for the public, lead-ing to increased attention on enforc-ing air quality regulations for animal agriculture and new multimedia regu-latory efforts.
In 2003, a report by the National Research Council (National Academy of Sciences), Air Emissions from Animal Feeding Operations: Current Knowledge, Future Needs, acknowl-edged the lack of baseline air emis-
1 Italicized terms (except genus/species names and published material titles) are defined in the Glossary.
3COUNCIL FOR AGRICULTURAL SCIENCE AND TECHNOLOGY
associated with manure and animal management. Odor problems tend to be localized to within a few kilome-ters of a production facility. Most gaseous compounds are also more in-tense locally, but some have regional or even national importance when redeposited on land or in water, or when they react to form secondary particles that can be transported long distances. For example, NH3 loss into the atmosphere can have negative im-pacts on the environment, such as soil acidification and eutrophication of surface waters. When combined with nitric or sulfuric acid, atmospheric NH3 can form fine particles that may impair human health and decrease visibility. Animal agriculture is also a significant source of GHGs, which are of global importance (IPCC 2007).
Air quality associated with ani-mal agriculture has historically been unregulated or minimally regulated. That, however, has been changing in many states with regulation at sev-eral levels of political jurisdiction. The EPA and other federal and state agencies, such as the Occupational Safety and Health Administration, are responsible for air quality as it affects the health of workers and nearby resi-dents. State and local governments have begun to enact regulations to minimize the impact of air emissions from AFOs on nearby neighbors, businesses, and public spaces.
regulAtory IssuesThe EPA is increasing its efforts
to ensure that air emissions from agriculture, including AFOs, meet the EPA’s environmental standards and their recent statement on human health risks from GHGs. The most notable efforts were the two ACAs, mentioned previously, between the EPA and livestock and poultry groups. Other EPA efforts directed toward agriculture entail (1) includ-ing sustainable production agricul-ture in the 2009–2014 EPA Strategic Plan Change Document with a goal of decreasing GHG emissions/contami-
nants (USEPA 2008), and (2) includ-ing manure management in their list of GHG emission sources that must annually report their emissions to the EPA (USEPA 2009a).
The EPA Inventory of U.S. Greenhouse Gas Emissions and Sinks: 1990–2008 estimates that of the 6,957 million metric tons of carbon dioxide equivalent (Mt CO2 Eq) produced in the United States in 2008, 532 Mt CO2 Eq (7.6%) are from agricultural activities. Of the agricultural emissions, 203 Mt CO2 Eq (2.9%) are directly emit-ted by animal production (USEPA 2010). The EPA follows the UN Intergovernmental Panel on Climate Change (IPCC) 2007 report, Good Practice Guidance and Uncertainty Management in National Greenhouse Gas Inventories, recommendation of setting priorities among GHG sources and sinks within the national inven-tory. A source is designated a key category when it has a “significant influence on the country’s total inven-tory of GHGs in terms of the absolute level of emissions, the trend in emis-sions, or both.” The EPA listed 19 key categories based on 2008 emission levels and trends. Key categories 7, 15, and 18 on the list are CH4 emis-sions from enteric fermentation, CH4 emissions from manure management, and N2O emissions from manure management, respectively (USEPA 2010).
Using a Life Cycle Assessment (LCA) methodology, the United Nations FAO report titled Livestock’s Long Shadow: Environmental Issues and Options estimated that global livestock account for 9%, 35 to 40%, and 65% of the total global anthropo-genic-emitted CO2, CH4, and N2O, respectively, which equated to 7,100 Mt CO2 Eq/yr (Eq/year), or 18% of global anthropogenic GHG emis-sions (Steinfeld et al. 2006). A recent paper by Pitesky, Stackhouse, and Mitloehner (2009) questioned the va-lidity of the FAO (2006) comparison between global livestock and trans-portation GHGs. The 2006 FAO re-
port used a comprehensive LCA for livestock versus only direct emissions for transportation, thereby elevating livestock’s relative contribution to cli-mate change.
As mentioned earlier, the EPA’s annual GHG inventory calculated a total of 203 Mt CO2 Eq/yr from U.S. animal agriculture, which is 2.9% of the total U.S. anthropogenic GHG emissions (USEPA 2010). The dis-parity between the EPA and FAO estimations of GHG emissions from livestock agriculture occurs primar-ily because of the weight both place on livestock-related land use changes. Specifically, the FAO identifies land use change (principally deforesta-tion to establish new pasture lands) as the number one global source of livestock-related emissions (34% of the FAO’s total livestock-related GHG emissions) (Steinfeld et al. 2006). But land use change to supply new pasture lands is not occurring in the United States, and the amount of forestland in the nation has increased during recent years because of more sustainable timbering and farming practices and the abandonment of former farmlands (Pitesky, Stackhouse, and Mitloehner 2009). Furthermore, transportation and other industries dwarf the rela-tive contributions livestock has made on total carbon (C) portfolios in de-veloped countries. For example, the U.S. transportation sector accounts for 26% of all GHG versus 3 to 4% for livestock (Pitesky, Stackhouse, and Mitloehner 2009; USEPA 2009b).
In Waterkeeper Alliance et al. v. EPA (2004), the Second Circuit Court of Appeals affirmed that the EPA can regulate point sources of emissions in agriculture. In American Farm Bureau Federation and National Pork Producers Council et al. v. EPA (2009), the Court decided that the EPA’s decision to regulate emissions of PM in rural areas was legal. This case is the first to allow regulation of PM air emissions in rural areas (except for engine emissions from off-road equipment) and accepts the use of the “precautionary principle”
COUNCIL FOR AGRICULTURAL SCIENCE AND TECHNOLOGY4
in justifying regulations. The precau-tionary principle argues that an action is to be avoided if the consequences of an action are unknown but judged to have some potential for major con-sequences. In this particular case, the Court concluded “the agency need not wait for conclusive findings be-fore regulating a pollutant it reason-ably believes may pose a significant risk to public health” (American Farm Bureau Federation and National Pork Producers Council et al. v. EPA 2009).
Many states (Iowa, Missouri, Oklahoma, etc.) regulate the siting of AFOs via setback distances be-tween AFOs and residences, busi-nesses, and public use areas (parks, churches, schools, etc.). These regu-lations are justified on a nuisance or air quality/odor rationale. Other states (Minnesota, Nebraska, etc.) have county or even township (local) control over siting of AFOs. The set-back distances vary by state, type of animal building, and AFO size. The assumption is that concentrations of odor and other air pollutants diminish with distance and the setback distance keeps the AFOs from negatively im-pacting nearby residents.
State courts also have ruled that the odor from AFOs can create a li-ability. A Missouri court in 2010 ruled that odor from one of Premium Standard Farm’s swine operations created an odor nuisance (Owens et al. v. ContiGroup Companies et al. not yet on file). A Nebraska court ruled that residences could not build within 0.8 kilometer (a half mile) of an AFO because of odor and dust (Larry Coffey v. County of Otoe 2008). Some counties and town-ships are beginning to regulate AFOs because of human health concerns. In Missouri, 21 counties or town-ships have instituted zoning or public health department regulations citing air quality as a human health concern (Milhollin 2010). Nebraska courts have ruled that municipalities can regulate AFOs, though primarily for water quality concerns (Community of
Alma v. Furnas County Farms 2003). Economic theory would suggest
that odors from animal agriculture would decrease the value of real es-tate near the feeding facility. A sum-mary of economic literature (Ulmer and Massey 2006) on the impact of AFOs on residential land values found the following: (1) five of eight studies did find that AFOs lowered residential property values; and (2) any decrease in property values was localized, or limited to properties less than 4.8 km (three miles) from the AFO.
AnImAl ProductIon oPerAtIons’ AIr emIssIons And AIr QuAlIty
SwineIntroduction
In pork production, gaseous com-pounds are primarily generated from anaerobic microbial decomposition of organic matter in animal manure and spoiled feedstuff. Gaseous com-pounds originate from the breakdown of various specific components of the pig’s diet or normal excretion of compounds from metabolism; there-fore, diet composition has a signifi-cant impact on the concentrations and emissions of gaseous compounds. Greenhouse gases (CH4, N2O, and CO2) are derived primarily from mi-crobial decomposition of manure in addition to normal animal respira-tion (CO2). Particulate matter gener-ates from feed systems, dried manure, and animal dander. Airborne microbes, otherwise classified as bioaerosols, generate from animals and manure and may be attached to PM. Bioaerosols need not be alive and viable to impair human health, as in the case of bacte-rial endotoxin.
Sources of gaseous emissions in pork production include the build-ings that house the animals, manure storage structures, and manure dur-ing and after land application. Most swine are housed in either mechani-cally or naturally ventilated enclosed
buildings. Manure is typically stored in liquid form within these buildings in a pit beneath the animal space for a period of only several days to as long as a year. Deep pits (8–10 feet deep) are commonly used to facilitate long-term storage of manure within these buildings, but long-term stor-age allows manure to decompose and release resulting biogases. In another common system, often referred to as a pull-plug system, manure is stored for only about a week within shallow pits and then removed from the build-ings routinely to outside storage facil-ities to keep gas levels low within the animal building. If not covered, these outside storage facilities (earthen, above- or in-ground concrete or steel tanks) can emit considerable amounts of gas. Swine also may be housed in buildings (such as hoop barns) that use added bedding—typically straw, cornstalks, or sawdust—and pro-duce solid manure. Swine manure is almost always applied to cropland as fertilizer.
Following is a discussion of both the concentrations of air pollutants inside or near swine buildings and manure storages and the mass flow or emissions of the airborne pollutants from pork production sites, in order of their perceived importance.
AmmoniaAmmonia concentrations inside
studied swine confinement buildings have been shown to vary widely, from as low as 1.9 parts per million (ppm) to as high as 25.9 ppm, depending on the cleanliness condition of the build-ing (Duchaine, Grimard, and Cormier 2000) and on the time of year and/or barn ventilation rate (Heber et al. 1997, 2000, 2004, 2005). Generally, farrowing rooms and nurseries had lower NH3 concentrations than swine gestation or grow-finishing facili-ties (Jacobson et al. 2006; Zhu et al. 2000). As one might expect, ambient NH3 concentrations diminished rapid-ly with the downwind distances from swine buildings (Stowell et al. 2000).
Arogo, Westerman, and Heber
5COUNCIL FOR AGRICULTURAL SCIENCE AND TECHNOLOGY
(2003) conducted a literature review on research studies that reported NH3 emissions from swine operations in-cluding buildings, lagoons, and field applications of swine wastes. They concluded that there are many factors affecting NH3 emission rates includ-ing housing type; animal size, age, and type; manure management, stor-age, and treatment; and climatic vari-ables. Because of these many factors, it is difficult to determine specific NH3 emission values for all types of swine operations across the coun-try. In a multistate research project involving different life-cycle aspects of pork production (Jacobson et al. 2004, 2006), average NH3 emissions were 48 and 30 grams/day/animal unit (g/day/AU) for gestating and far-rowing sows, respectively, and aver-age NH3 emissions for the finishing barns ranged from 102 to 130 g/day/AU in a deep-pit system and 77 to 81 g/day/AU from a pull-plug barn. An observation by Heber and colleagues (2005) was that hourly NH3 emission was positively correlated with indoor and outdoor temperatures, ventila-tion rate, and total live pig weight. Pig activity and NH3 emission rate displayed similar diurnal patterns. Carter, Lachmann, and Bundy (2008) showed that changing the diet of pigs can have a major impact on NH3 emis-sions from swine production buildings. They reported that the use of a low protein and synthetic amino acid diet compared to a control diet decreased NH3 emissions by almost half.
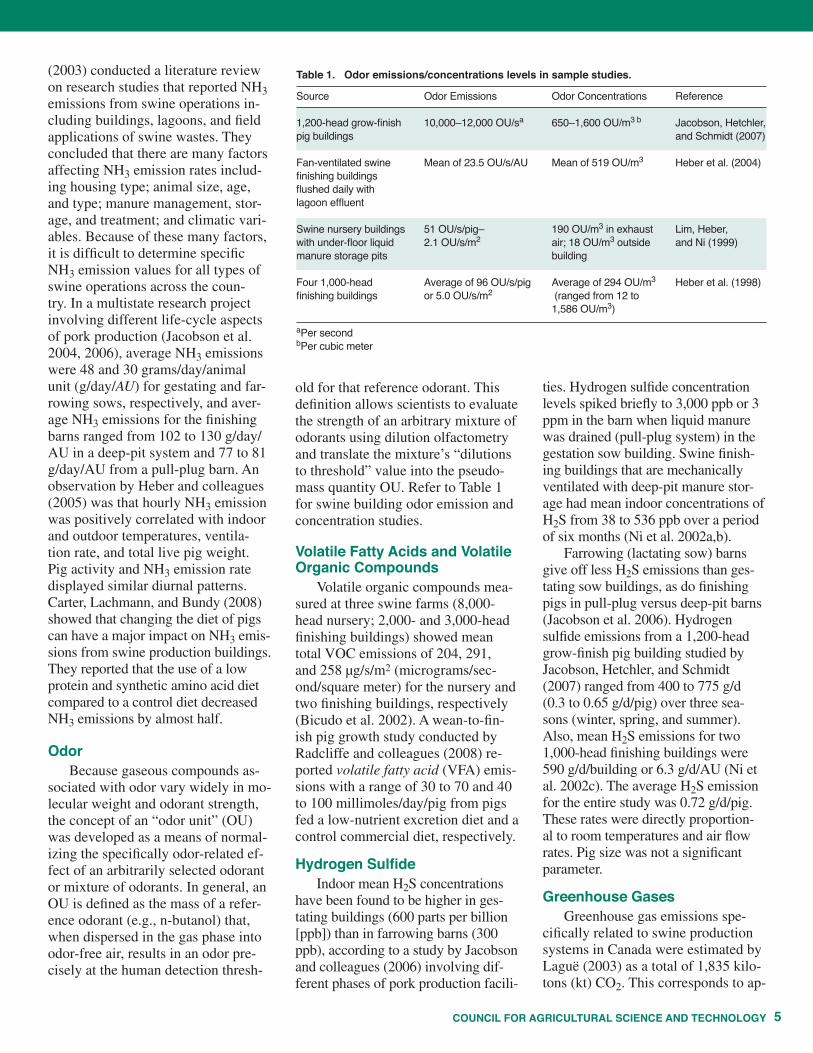
OdorBecause gaseous compounds as-
sociated with odor vary widely in mo-lecular weight and odorant strength, the concept of an “odor unit” (OU) was developed as a means of normal-izing the specifically odor-related ef-fect of an arbitrarily selected odorant or mixture of odorants. In general, an OU is defined as the mass of a refer-ence odorant (e.g., n-butanol) that, when dispersed in the gas phase into odor-free air, results in an odor pre-cisely at the human detection thresh-
old for that reference odorant. This definition allows scientists to evaluate the strength of an arbitrary mixture of odorants using dilution olfactometry and translate the mixture’s “dilutions to threshold” value into the pseudo-mass quantity OU. Refer to Table 1 for swine building odor emission and concentration studies.
Volatile Fatty Acids and Volatile Organic Compounds
Volatile organic compounds mea-sured at three swine farms (8,000-head nursery; 2,000- and 3,000-head finishing buildings) showed mean total VOC emissions of 204, 291, and 258 µg/s/m2 (micrograms/sec-ond/square meter) for the nursery and two finishing buildings, respectively (Bicudo et al. 2002). A wean-to-fin-ish pig growth study conducted by Radcliffe and colleagues (2008) re-ported volatile fatty acid (VFA) emis-sions with a range of 30 to 70 and 40 to 100 millimoles/day/pig from pigs fed a low-nutrient excretion diet and a control commercial diet, respectively.
Hydrogen SulfideIndoor mean H2S concentrations
have been found to be higher in ges-tating buildings (600 parts per billion [ppb]) than in farrowing barns (300 ppb), according to a study by Jacobson and colleagues (2006) involving dif-ferent phases of pork production facili-
ties. Hydrogen sulfide concentration levels spiked briefly to 3,000 ppb or 3 ppm in the barn when liquid manure was drained (pull-plug system) in the gestation sow building. Swine finish-ing buildings that are mechanically ventilated with deep-pit manure stor-age had mean indoor concentrations of H2S from 38 to 536 ppb over a period of six months (Ni et al. 2002a,b).
Farrowing (lactating sow) barns give off less H2S emissions than ges-tating sow buildings, as do finishing pigs in pull-plug versus deep-pit barns (Jacobson et al. 2006). Hydrogen sulfide emissions from a 1,200-head grow-finish pig building studied by Jacobson, Hetchler, and Schmidt (2007) ranged from 400 to 775 g/d (0.3 to 0.65 g/d/pig) over three sea-sons (winter, spring, and summer). Also, mean H2S emissions for two 1,000-head finishing buildings were 590 g/d/building or 6.3 g/d/AU (Ni et al. 2002c). The average H2S emission for the entire study was 0.72 g/d/pig. These rates were directly proportion-al to room temperatures and air flow rates. Pig size was not a significant parameter.
Greenhouse GasesGreenhouse gas emissions spe-
cifically related to swine production systems in Canada were estimated by Laguë (2003) as a total of 1,835 kilo-tons (kt) CO2. This corresponds to ap-
Table 1. Odor emissions/concentrations levels in sample studies.
Source OdorEmissions OdorConcentrations Reference
1,200-headgrow-finish 10,000–12,000OU/sa 650–1,600OU/m3b Jacobson,Hetchler,pigbuildings andSchmidt(2007)
Fan-ventilatedswine Meanof23.5OU/s/AU Meanof519OU/m3 Heberetal.(2004)finishingbuildingsflusheddailywithlagooneffluent
Swinenurserybuildings 51OU/s/pig– 190OU/m3inexhaust Lim,Heber,withunder-floorliquid 2.1OU/s/m2 air;18OU/m3outside andNi(1999)manurestoragepits building
Four1,000-head Averageof96OU/s/pig Averageof294OU/m3 Heberetal.(1998)finishingbuildings or5.0OU/s/m2 (rangedfrom12to 1,586OU/m3)
aPersecondbPercubicmeter
COUNCIL FOR AGRICULTURAL SCIENCE AND TECHNOLOGY6
proximately 3% of the total Canadian GHG agricultural emissions, 0.3% of the total Canadian anthropogenic GHG emissions, or 0.006% of the to-tal world GHG emissions. A majority of CO2 generation in pig operations is due to CO2 expiration from animals. The amount of CO2 released from the manure in a pig production building (partially slatted floor and shallow pits), as determined by Ni and col-leagues (1999), represents 37.5% of the quantity of CO2 exhaled by the animals, whereas Lim and colleagues (1998) reported CO2 emissions from an 880-head grow-finish swine build-ing with total slotted floors and tunnel ventilation as 3.0 kilograms/day/pig (kg/d/pig), ranging from 1.2 to 9.5.
Methane and N2O emissions var-ied from 48 to 54 g/d/AU and from 0.8 to 2.1 g/d/AU, respectively, for a slatted-floor pig finishing barn stud-ied by Osada, Ram, and Dahl (1998). Methane emissions of 160 g/d/AU were measured from deep-pit and pull-plug pig finishing facilities (Zahn et al. 2001), while N2O emissions from the liquid manure management system of swine production in North America were estimated to be 20 g/yr/animal (Laguë 2003).
Particulate MatterParticulate matter (PM10 —PM
with aerodynamic diameter of less than or equal to 10 micrometers [µm]) emission from a 1,200-head grow-fin-ish pig building studied by Jacobson, Hetchler, and Schmidt (2007) ranged from 180 to 900 g/d (0.15 to 0.75 g/d/pig) and the PM10 concentrations var-ied from 200 to 650 µg/m3 over three seasons (winter, spring, and summer). Total suspended particulates (TSP) and PM10 from fan-ventilated swine finishing buildings that were flushed daily with lagoon effluent showed a mean PM10 emission of 1.6 g/d/AU and a mean PM10 concentration of 334 µg/m3 (Heber et al. 2004). Total suspended particulate concentrations measured by Duchaine, Grimard, and Cormier (2000) in eight swine con-finement buildings with a range of cleanliness conditions resulted in a
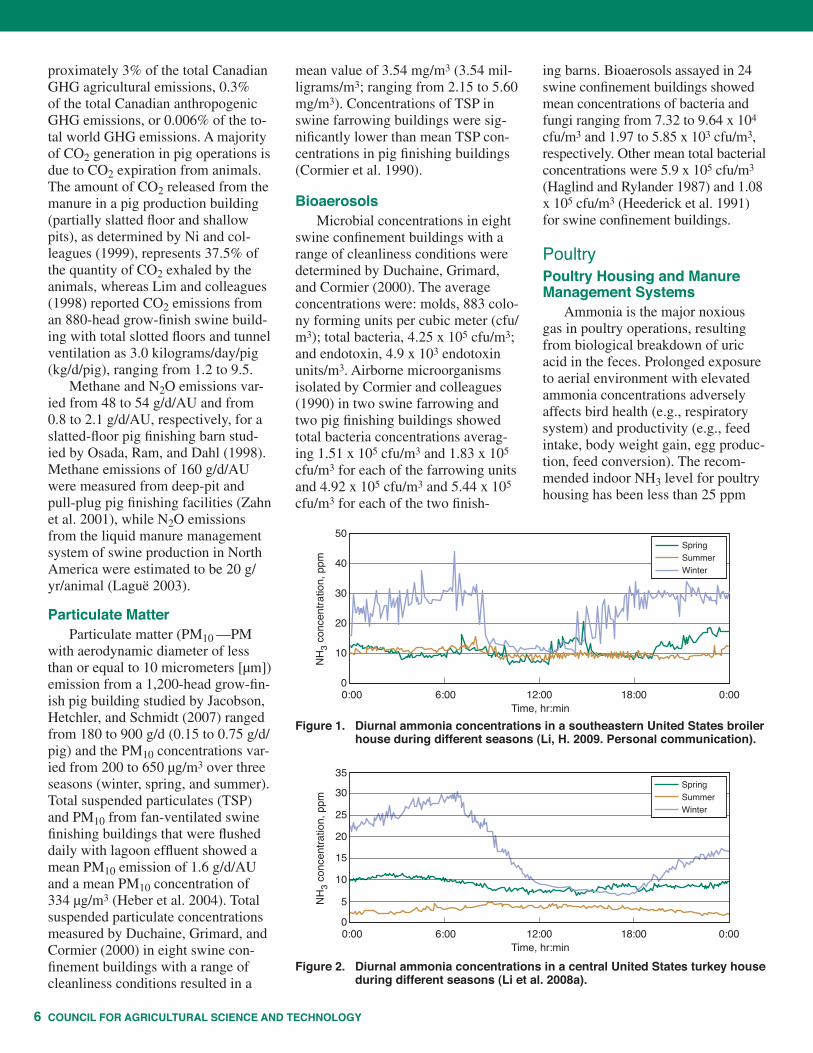
Figure 1. Diurnal ammonia concentrations in a southeastern United States broiler house during different seasons (Li, H. 2009. Personal communication).
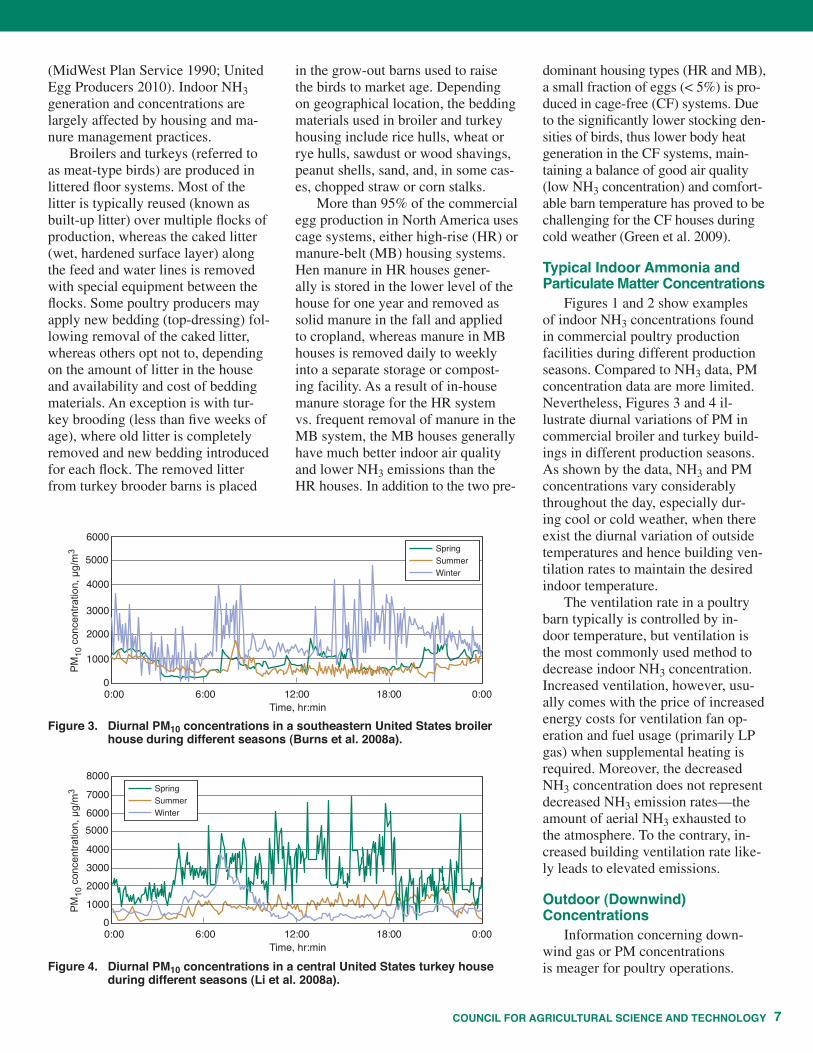
Figure 2. Diurnal ammonia concentrations in a central United States turkey house during different seasons (Li et al. 2008a).
mean value of 3.54 mg/m3 (3.54 mil-ligrams/m3; ranging from 2.15 to 5.60 mg/m3). Concentrations of TSP in swine farrowing buildings were sig-nificantly lower than mean TSP con-centrations in pig finishing buildings (Cormier et al. 1990).
Bioaerosols
Microbial concentrations in eight swine confinement buildings with a range of cleanliness conditions were determined by Duchaine, Grimard, and Cormier (2000). The average concentrations were: molds, 883 colo-ny forming units per cubic meter (cfu/m3); total bacteria, 4.25 x 10⁵ cfu/m3; and endotoxin, 4.9 x 10³ endotoxin units/m3. Airborne microorganisms isolated by Cormier and colleagues (1990) in two swine farrowing and two pig finishing buildings showed total bacteria concentrations averag-ing 1.51 x 10⁵ cfu/m3 and 1.83 x 10⁵ cfu/m3 for each of the farrowing units and 4.92 x 10⁵ cfu/m3 and 5.44 x 10⁵ cfu/m3 for each of the two finish-
ing barns. Bioaerosols assayed in 24 swine confinement buildings showed mean concentrations of bacteria and fungi ranging from 7.32 to 9.64 x 10⁴ cfu/m3 and 1.97 to 5.85 x 10³ cfu/m3, respectively. Other mean total bacterial concentrations were 5.9 x 10⁵ cfu/m3 (Haglind and Rylander 1987) and 1.08 x 10⁵ cfu/m3 (Heederick et al. 1991) for swine confinement buildings.
PoultryPoultry Housing and Manure Management Systems
Ammonia is the major noxious gas in poultry operations, resulting from biological breakdown of uric acid in the feces. Prolonged exposure to aerial environment with elevated ammonia concentrations adversely affects bird health (e.g., respiratory system) and productivity (e.g., feed intake, body weight gain, egg produc-tion, feed conversion). The recom-mended indoor NH3 level for poultry housing has been less than 25 ppm
7COUNCIL FOR AGRICULTURAL SCIENCE AND TECHNOLOGY
in the grow-out barns used to raise the birds to market age. Depending on geographical location, the bedding materials used in broiler and turkey housing include rice hulls, wheat or rye hulls, sawdust or wood shavings, peanut shells, sand, and, in some cas-es, chopped straw or corn stalks.
More than 95% of the commercial egg production in North America uses cage systems, either high-rise (HR) or manure-belt (MB) housing systems. Hen manure in HR houses gener-ally is stored in the lower level of the house for one year and removed as solid manure in the fall and applied to cropland, whereas manure in MB houses is removed daily to weekly into a separate storage or compost-ing facility. As a result of in-house manure storage for the HR system vs. frequent removal of manure in the MB system, the MB houses generally have much better indoor air quality and lower NH3 emissions than the HR houses. In addition to the two pre-
dominant housing types (HR and MB), a small fraction of eggs (< 5%) is pro-duced in cage-free (CF) systems. Due to the significantly lower stocking den-sities of birds, thus lower body heat generation in the CF systems, main-taining a balance of good air quality (low NH3 concentration) and comfort-able barn temperature has proved to be challenging for the CF houses during cold weather (Green et al. 2009).
Typical Indoor Ammonia and Particulate Matter Concentrations
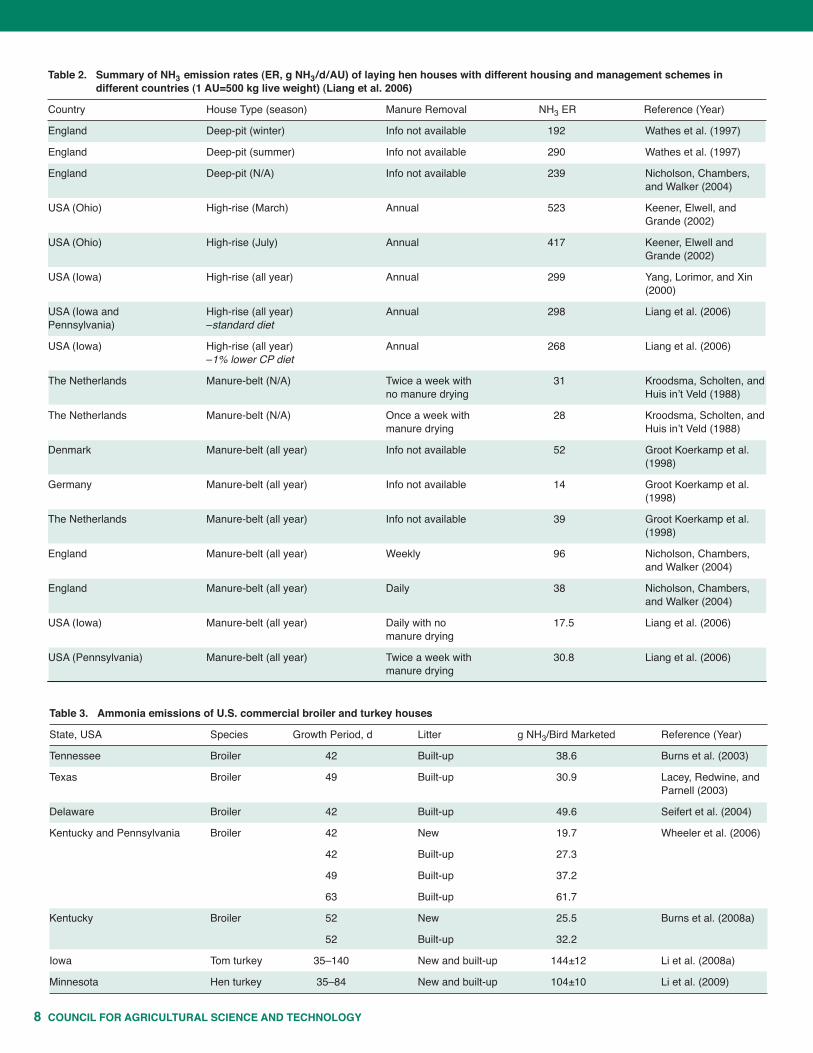
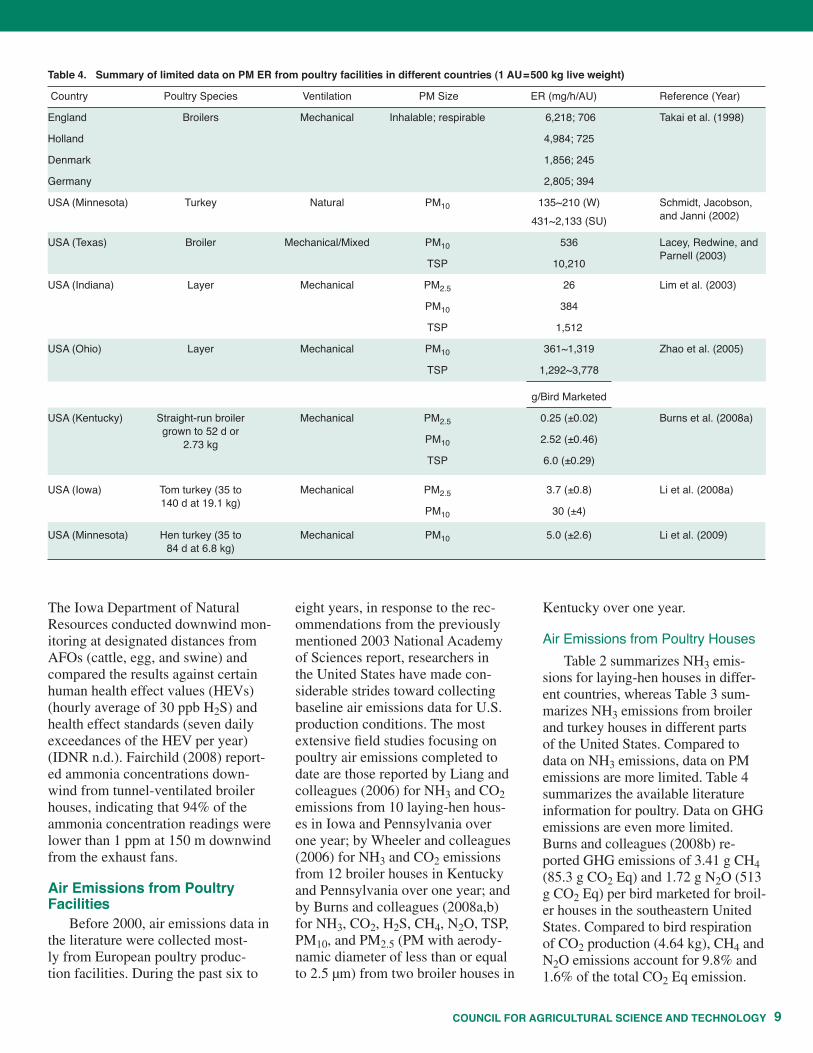
Figures 1 and 2 show examples of indoor NH3 concentrations found in commercial poultry production facilities during different production seasons. Compared to NH3 data, PM concentration data are more limited. Nevertheless, Figures 3 and 4 il-lustrate diurnal variations of PM in commercial broiler and turkey build-ings in different production seasons. As shown by the data, NH3 and PM concentrations vary considerably throughout the day, especially dur-ing cool or cold weather, when there exist the diurnal variation of outside temperatures and hence building ven-tilation rates to maintain the desired indoor temperature.
The ventilation rate in a poultry barn typically is controlled by in-door temperature, but ventilation is the most commonly used method to decrease indoor NH3 concentration. Increased ventilation, however, usu-ally comes with the price of increased energy costs for ventilation fan op-eration and fuel usage (primarily LP gas) when supplemental heating is required. Moreover, the decreased NH3 concentration does not represent decreased NH3 emission rates—the amount of aerial NH3 exhausted to the atmosphere. To the contrary, in-creased building ventilation rate like-ly leads to elevated emissions.
Outdoor (Downwind) Concentrations
Information concerning down-wind gas or PM concentrations is meager for poultry operations.
(MidWest Plan Service 1990; United Egg Producers 2010). Indoor NH3 generation and concentrations are largely affected by housing and ma-nure management practices.
Broilers and turkeys (referred to as meat-type birds) are produced in littered floor systems. Most of the litter is typically reused (known as built-up litter) over multiple flocks of production, whereas the caked litter (wet, hardened surface layer) along the feed and water lines is removed with special equipment between the flocks. Some poultry producers may apply new bedding (top-dressing) fol-lowing removal of the caked litter, whereas others opt not to, depending on the amount of litter in the house and availability and cost of bedding materials. An exception is with tur-key brooding (less than five weeks of age), where old litter is completely removed and new bedding introduced for each flock. The removed litter from turkey brooder barns is placed
Figure 3. Diurnal PM10 concentrations in a southeastern United States broiler house during different seasons (Burns et al. 2008a).
Figure 4. Diurnal PM10 concentrations in a central United States turkey house during different seasons (Li et al. 2008a).
COUNCIL FOR AGRICULTURAL SCIENCE AND TECHNOLOGY8
Table 3. Ammonia emissions of U.S. commercial broiler and turkey houses
State, USA Species Growth Period, d Litter g NH3/Bird Marketed Reference (Year)
Tennessee Broiler 42 Built-up 38.6 Burns et al. (2003)
Texas Broiler 49 Built-up 30.9 Lacey, Redwine, and Parnell (2003)
Delaware Broiler 42 Built-up 49.6 Seifert et al. (2004)
Kentucky and Pennsylvania Broiler 42 New 19.7 Wheeler et al. (2006)
42 Built-up 27.3
49 Built-up 37.2
63 Built-up 61.7
Kentucky Broiler 52 New 25.5 Burns et al. (2008a)
52 Built-up 32.2
Iowa Tom turkey 35–140 New and built-up 144±12 Li et al. (2008a)
Minnesota Hen turkey 35–84 New and built-up 104±10 Li et al. (2009)
Table 2. Summary of NH3 emission rates (ER, g NH3/d/AU) of laying hen houses with different housing and management schemes in different countries (1 AU=500 kg live weight) (Liang et al. 2006)
Country House Type (season) Manure Removal NH3 ER Reference (Year)
England Deep-pit (winter) Info not available 192 Wathes et al. (1997)
England Deep-pit (summer) Info not available 290 Wathes et al. (1997)
England Deep-pit (N/A) Info not available 239 Nicholson, Chambers, and Walker (2004)
USA (Ohio) High-rise (March) Annual 523 Keener, Elwell, and Grande (2002)
USA (Ohio) High-rise (July) Annual 417 Keener, Elwell and Grande (2002)
USA (Iowa) High-rise (all year) Annual 299 Yang, Lorimor, and Xin (2000)
USA (Iowa and High-rise (all year) Annual 298 Liang et al. (2006) Pennsylvania) –standard diet
USA (Iowa) High-rise (all year) Annual 268 Liang et al. (2006) –1% lower CP diet
The Netherlands Manure-belt (N/A) Twice a week with 31 Kroodsma, Scholten, and no manure drying Huis in’t Veld (1988)
The Netherlands Manure-belt (N/A) Once a week with 28 Kroodsma, Scholten, and manure drying Huis in’t Veld (1988)
Denmark Manure-belt (all year) Info not available 52 Groot Koerkamp et al. (1998)
Germany Manure-belt (all year) Info not available 14 Groot Koerkamp et al. (1998)
The Netherlands Manure-belt (all year) Info not available 39 Groot Koerkamp et al. (1998)
England Manure-belt (all year) Weekly 96 Nicholson, Chambers, and Walker (2004)
England Manure-belt (all year) Daily 38 Nicholson, Chambers, and Walker (2004)
USA (Iowa) Manure-belt (all year) Daily with no 17.5 Liang et al. (2006) manure drying
USA (Pennsylvania) Manure-belt (all year) Twice a week with 30.8 Liang et al. (2006) manure drying
9COUNCIL FOR AGRICULTURAL SCIENCE AND TECHNOLOGY
The Iowa Department of Natural Resources conducted downwind mon-itoring at designated distances from AFOs (cattle, egg, and swine) and compared the results against certain human health effect values (HEVs) (hourly average of 30 ppb H2S) and health effect standards (seven daily exceedances of the HEV per year) (IDNR n.d.). Fairchild (2008) report-ed ammonia concentrations down-wind from tunnel-ventilated broiler houses, indicating that 94% of the ammonia concentration readings were lower than 1 ppm at 150 m downwind from the exhaust fans.
Air Emissions from Poultry Facilities
Before 2000, air emissions data in the literature were collected most-ly from European poultry produc-tion facilities. During the past six to
eight years, in response to the rec-ommendations from the previously mentioned 2003 National Academy of Sciences report, researchers in the United States have made con-siderable strides toward collecting baseline air emissions data for U.S. production conditions. The most extensive field studies focusing on poultry air emissions completed to date are those reported by Liang and colleagues (2006) for NH3 and CO2 emissions from 10 laying-hen hous-es in Iowa and Pennsylvania over one year; by Wheeler and colleagues (2006) for NH3 and CO2 emissions from 12 broiler houses in Kentucky and Pennsylvania over one year; and by Burns and colleagues (2008a,b) for NH3, CO2, H2S, CH4, N2O, TSP, PM10, and PM2.5 (PM with aerody-namic diameter of less than or equal to 2.5 µm) from two broiler houses in
Kentucky over one year.
Air Emissions from Poultry HousesTable 2 summarizes NH3 emis-
sions for laying-hen houses in differ-ent countries, whereas Table 3 sum-marizes NH3 emissions from broiler and turkey houses in different parts of the United States. Compared to data on NH3 emissions, data on PM emissions are more limited. Table 4 summarizes the available literature information for poultry. Data on GHG emissions are even more limited. Burns and colleagues (2008b) re-ported GHG emissions of 3.41 g CH4 (85.3 g CO2 Eq) and 1.72 g N2O (513 g CO2 Eq) per bird marketed for broil-er houses in the southeastern United States. Compared to bird respiration of CO2 production (4.64 kg), CH4 and N2O emissions account for 9.8% and 1.6% of the total CO2 Eq emission.
Table 4. Summary of limited data on PM ER from poultry facilities in different countries (1 AU=500 kg live weight)
Country Poultry Species Ventilation PM Size ER (mg/h/AU) Reference (Year)
England Broilers Mechanical Inhalable; respirable 6,218; 706 Takai et al. (1998)
Holland 4,984; 725
Denmark 1,856; 245
Germany 2,805; 394
USA (Minnesota) Turkey Natural PM10 135~210 (W) Schmidt, Jacobson, and Janni (2002)
431~2,133 (SU)
USA (Texas) Broiler Mechanical/Mixed PM10 536 Lacey, Redwine, and Parnell (2003)
TSP 10,210
USA (Indiana) Layer Mechanical PM2.5 26 Lim et al. (2003)
PM10 384
TSP 1,512
USA (Ohio) Layer Mechanical PM10 361~1,319 Zhao et al. (2005)
TSP 1,292~3,778
g/Bird Marketed
USA (Kentucky) Straight-run broiler Mechanical PM2.5 0.25 (±0.02) Burns et al. (2008a) grown to 52 d or 2.73 kg
PM10 2.52 (±0.46)
TSP 6.0 (±0.29)
USA (Iowa) Tom turkey (35 to Mechanical PM2.5 3.7 (±0.8) Li et al. (2008a) 140 d at 19.1 kg)
PM10 30 (±4)
USA (Minnesota) Hen turkey (35 to Mechanical PM10 5.0 (±2.6) Li et al. (2009) 84 d at 6.8 kg)
COUNCIL FOR AGRICULTURAL SCIENCE AND TECHNOLOGY10
Air Emissions from Poultry Manure Storage
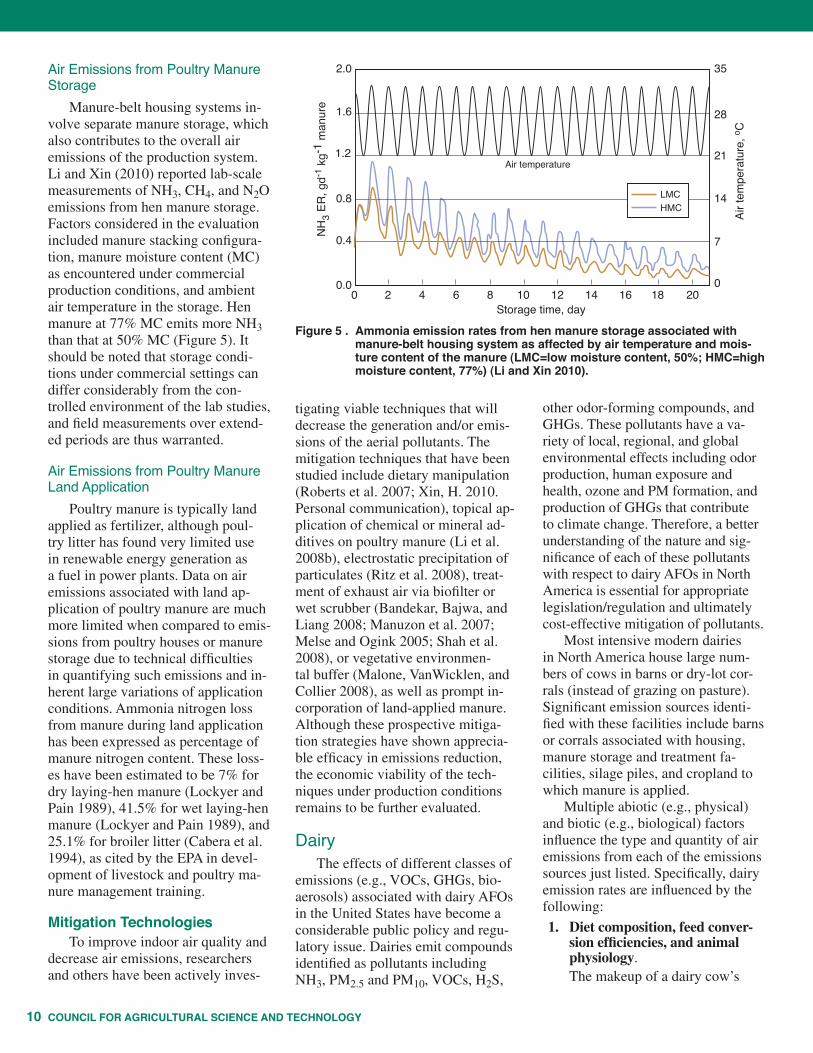
Manure-belt housing systems in-volve separate manure storage, which also contributes to the overall air emissions of the production system. Li and Xin (2010) reported lab-scale measurements of NH3, CH4, and N2O emissions from hen manure storage. Factors considered in the evaluation included manure stacking configura-tion, manure moisture content (MC) as encountered under commercial production conditions, and ambient air temperature in the storage. Hen manure at 77% MC emits more NH3 than that at 50% MC (Figure 5). It should be noted that storage condi-tions under commercial settings can differ considerably from the con-trolled environment of the lab studies, and field measurements over extend-ed periods are thus warranted.
Air Emissions from Poultry Manure Land Application
Poultry manure is typically land applied as fertilizer, although poul-try litter has found very limited use in renewable energy generation as a fuel in power plants. Data on air emissions associated with land ap-plication of poultry manure are much more limited when compared to emis-sions from poultry houses or manure storage due to technical difficulties in quantifying such emissions and in-herent large variations of application conditions. Ammonia nitrogen loss from manure during land application has been expressed as percentage of manure nitrogen content. These loss-es have been estimated to be 7% for dry laying-hen manure (Lockyer and Pain 1989), 41.5% for wet laying-hen manure (Lockyer and Pain 1989), and 25.1% for broiler litter (Cabera et al. 1994), as cited by the EPA in devel-opment of livestock and poultry ma-nure management training.
Mitigation TechnologiesTo improve indoor air quality and
decrease air emissions, researchers and others have been actively inves-
tigating viable techniques that will decrease the generation and/or emis-sions of the aerial pollutants. The mitigation techniques that have been studied include dietary manipulation (Roberts et al. 2007; Xin, H. 2010. Personal communication), topical ap-plication of chemical or mineral ad-ditives on poultry manure (Li et al. 2008b), electrostatic precipitation of particulates (Ritz et al. 2008), treat-ment of exhaust air via biofilter or wet scrubber (Bandekar, Bajwa, and Liang 2008; Manuzon et al. 2007; Melse and Ogink 2005; Shah et al. 2008), or vegetative environmen-tal buffer (Malone, VanWicklen, and Collier 2008), as well as prompt in-corporation of land-applied manure. Although these prospective mitiga-tion strategies have shown apprecia-ble efficacy in emissions reduction, the economic viability of the tech-niques under production conditions remains to be further evaluated.
DairyThe effects of different classes of
emissions (e.g., VOCs, GHGs, bio-aerosols) associated with dairy AFOs in the United States have become a considerable public policy and regu-latory issue. Dairies emit compounds identified as pollutants including NH3, PM2.5 and PM10, VOCs, H2S,
other odor-forming compounds, and GHGs. These pollutants have a va-riety of local, regional, and global environmental effects including odor production, human exposure and health, ozone and PM formation, and production of GHGs that contribute to climate change. Therefore, a better understanding of the nature and sig-nificance of each of these pollutants with respect to dairy AFOs in North America is essential for appropriate legislation/regulation and ultimately cost-effective mitigation of pollutants.
Most intensive modern dairies in North America house large num-bers of cows in barns or dry-lot cor-rals (instead of grazing on pasture). Significant emission sources identi-fied with these facilities include barns or corrals associated with housing, manure storage and treatment fa-cilities, silage piles, and cropland to which manure is applied.
Multiple abiotic (e.g., physical) and biotic (e.g., biological) factors influence the type and quantity of air emissions from each of the emissions sources just listed. Specifically, dairy emission rates are influenced by the following:
1. Diet composition, feed conver-sion efficiencies, and animal physiology.The makeup of a dairy cow’s
Figure 5 . Ammonia emission rates from hen manure storage associated with manure-belt housing system as affected by air temperature and mois-ture content of the manure (LMC=low moisture content, 50%; HMC=high moisture content, 77%) (Li and Xin 2010).
11COUNCIL FOR AGRICULTURAL SCIENCE AND TECHNOLOGY
diet, lactation status, and ef-ficiency of its conversion into meat and milk products affects the quantity and composition of manure and urine excreted by cows. For example, a lactating cow produces more than twice the amount of methane compared to its dry cow equivalent.
2. Manure handling practices. How manure is handled af-fects its chemical and physical properties, including chemical composition, biodegradability, microbial populations, oxygen content, moisture content, and pH. An adult dairy cow produces approximately 41 to 54 kg (90 to 120 pounds [lbs]) of manure daily, which on dairy AFOs is usually either flushed with water or scraped from the housing area (free-stall) into large manure storage basins or treatment la-goons. The type of liquid manure system determines the potential for gas volatilization and odor production in both dairy housing and land application (ASABE 2006). For example, long-term stored cattle manure produces twice the concentration of VFA compared to fresh manure during anaerobic incubation, reflect-ing the significance of time and hence management on mitiga-tion of odor-forming compounds (ASABE 2006).
3. Environmental conditions. Time of year, temperature, wind speed, and relative humidity greatly influence production and emissions of gaseous and partic-ulate compounds. For example, NH3 emissions from dairies were found to be approximately twice as much during the summer (11.3 to 18.2 g/d/cow) compared to the winter (3.8 to 6.8 g/d/cow) (Blu-teau, Masse, and Leduc 2009).
4. Dairy infrastructure. Stocking density, barn ventilation rates, housing type, and bedding material can significantly affect air emissions.
As these examples demonstrate, understanding the different emissions profiles of pollutants throughout their
“life cycle” and the factors that influ-ence the emissions rates are essential for understanding, regulating, and mitigating dairy air emissions effec-tively. The following brief synopsis reviews the major classes of emis-sions from dairy AFOs.
OdorOdor production and the mitiga-
tion of odor-producing compounds from dairies are of growing concern because of urban encroachment into dairying regions. Mackie, Stroot, and Varel (1998) identified six major groups of odorous compounds, which include VOCs (e.g., VFAs, volatile amines, phenols, and indoles), NH3, and sulfur-containing compounds. Most of these compounds are pro-duced by anaerobic digestion and fermentation of organic matter. On a dairy operation, these compounds can be emitted from silage mounds, barns, waste storage facilities, or manure applied to land (National Research Council 2003).
The greatest odors on dairy AFOs are associated with land application of manure (1.5 to 90 OU/s/m2) fol-lowed by dairy manure storage (5.1 to 32 OU/s/m2) and housing (1.3 to 3.0 OU/s/m2) (ASABE 2006; Pain et al. 1991). Although dairy manure that is applied to land has the greatest odor flux rates, the rates decrease rapidly over time (Mackie, Stroot, and Varel 1998). Furthermore, it should be noted that a 52% decrease in total odor units was achieved over 48 hours by imme-diately incorporating dairy slurry into the soil (Pain et al. 1991).
The class of compound with the greatest impact on odor production in dairy operations seems to be VOCs. Filipy and colleagues (2006) identified 82 different VOCs at a dairy lactating-cow pen stall and 73 VOCs from the manure lagoon, many of which are known to be odorous. Emissions rates of ethanol and dimethyl sulfide were highest and estimated at 1,026±513 and 13.8±10.3 µg/s/cow, respectively. Emissions rates from the manure la-goon for acetone, 2-butanone, methyl isobutyl ketone, 2-methyl-3-penta-
none, dimethyl sulfide, and dimethyl disulfide were at much lower rates at 3.03±0.85, 145±35, 3.46±1.11, 25.1±8.0, 2.19±0.92, and 16.1±3.9 nanograms/second/cow, respective-ly (Filipy et al. 2006). Although the concentration of most of the detected compounds in this study was below published odor detection thresholds, the cumulative effects (additive or multiplicative) of different VOCs still require further investigation.
Particulate Matter and BioaerosolsThe available literature is not ex-
tensive with respect to PM emissions from dairy AFOs in part because the emissions of particulates from differ-ent sources are dependent on sev-eral factors including animal density, manure management, flooring sys-tems, and weather. A considerable and growing body of evidence, however, shows an association between adverse health effects and exposure to ambi-ent airborne particulates in livestock operations (Aneja, Schlesinger, and Erisman 2009). Particulate matter emissions from dairies are consid-ered a human health risk because of the present and potential inhala-tion of PM2.5 and PM10. Specifically, exposure to PM2.5 has been associ-ated with various types of pulmonary disease (Pope, Ezzati, and Dockery 2009), whereas exposure to PM10 has been associated with decreased lung function, cardiac arrhythmia, heart at-tacks, and premature death (Madden, Southard, and Mitchell 2008).
In addition to the health effects, both PM2.5 and PM10 have local and regional environmental effects. On a dairy and at downwind locations, NH3 reacts with atmospheric nitric and sulfuric acids to form PM2.5. These fine particles contribute to smog or haze formation, decrease visibility, and may contribute to eutrophication in surface water following deposition downwind.
Feed storage and processing, crop-ping, composting, and manure storage can produce PM10, including those derived from soil matter, feed, dried
COUNCIL FOR AGRICULTURAL SCIENCE AND TECHNOLOGY12
feces, bacteria, fungi, and endotoxins (Cambra-López et al. 2009). Although the relative significance of PM10 is dependent on the type of dairy and the surrounding environmental conditions, soil-derived material often is the most significant source of PM10 (Madden, Southard, and Mitchell 2008). Madden, Southard, and Mitchell (2008) noted a reduction of PM10 from cropland between 52% and 93% with the use of conservation tillage.
With respect to bioaerosols, Seedorf and colleagues (1998) mea-sured bacterial, enterobacteriaceael, and fungal emissions of 6.8, 6.2, and 6.0 cfu/hour/AU, respectively, which were similar to measurements in other livestock housing operations. The significance of these data for public health and worker safety has not been determined.
Volatile Organic Compounds and Ammonia
Emissions of VOCs and NH3 from dairy operations occur when bacteria decompose organic matter in manure and silage under anaerobic conditions (Filipy et al. 2006). Both of these emissions have local effects including odor production, particulate formation, troposphere ozone for-mation, ecosystem degradation, and health effects including ear, nose, and throat damage (Cambra-López et al. 2009; Mitloehner and Calvo 2008; Pinder, Adams, and Pandis 2007).
Volatile organic compounds in-clude thousands of individual gases that vaporize at room temperature. They contribute to ozone forma-tion when combined with oxides of N (NOx) in the presence of sunlight (Shaw et al. 2007), although VOCs have differing reactivity and poten-tial to form ozone (Carter 1994). Volatile organic compounds typically are divided into the following classes: VFAs, indoles and phenols, amines, and sulfur-containing compounds (ASABE 2006).
Among the major VOC emis-sions identified in dairy operations, five compounds (2-butanone, p-cre-
sol, phenol, methyl isobutyl ketone or hexone, and methanol) have been identified as hazardous air pollutants by the EPA. To attain “major-source” emissions levels, however, herd sizes will have to be of considerable size (Ndegwa 2009).
In addition to the cows and their manure, recent work has identi-fied fermented feeds as a significant source of VOC emissions on dairy AFOs (Alanis et al. 2008; Howard et al. 2010a). But more research is need-ed and is currently being conducted to better identify VOC sources and emission rates from dairy production.
Volatile organic compound pro-duction, emissions, and flux rates are determined by biological (i.e., chemi-cal reactions catalyzed by bacteria) and environmental (i.e., wind speed, volatility) factors. Consequently, there is considerable variability in the type and concentration of VOCs from dairy AFOs, leading to much controversy regarding the impact of VOCs (Filipy et al. 2006; Hobbs, Misselbrook, and Cumby 1999). For example, in 2004, California regu-latory agencies estimated dairies to contribute as many VOCs to the atmosphere as light/medium-duty trucks or light passenger vehicles. But two subsequent studies concluded that the sum of reactive VOC fluxes measured was 6 to 10 times less than previous estimates and that the VOC emissions from dairy cattle and their fresh waste have a relatively small impact on ozone formation per VOC mass emitted (Howard et al. 2010b; Shaw et. al. 2007). On dairies, fer-mented feed is a much larger con-tributor of smog-forming VOCs than manure or any other source (Howard et al. 2010a).
Ammonia is emitted from AFOs when the nitrogen (mainly urea) in animal waste is hydrolyzed, mineral-ized, and/or volatilized. Once volatil-ized, the NH3 can be harmful in sev-eral ways including acidification of ecosystems, eutrophication, and for-mation of aerosols and particulates, including PM2.5 (National Research
Council 2003). As discussed previ-ously, NH3 is derived from N that originates in the excreta. The N ex-cretion (urine and feces) estimate for an average dairy cow in a modern western U.S. dairy is 169 kg/head/yr (Sunesson, Gullberg, and Blomquist 2001). Urine urea N, when combined with urease contained in feces, is readily hydrolyzed to ammonia; how-ever, the content of urea N in a dairy animal’s urine varies greatly with diet (James et al. 1999).
Ammonia volatilization is the main loss pathway for N from dairy AFOs (Kirchmann et al. 1998) with total NH3 losses ranging from 17 to 46 kg N/yr/cow (Bussink and Oenema 1998) or between 20 and 40 g NH3/d/AU in the free-stall area (Groot Koerkamp et al. 1998; Snell, Seipelt, and Van den Weghe 2003). The wide ranges in NH3 losses and volatilization reflect the variability in amount and composition of animal excreta (urine + feces), management of the slurry, and soil and environ-mental conditions. Sources of NH3 emissions on dairy AFOs in decreas-ing relative importance are slurry ap-plication, housing, slurry storage, and fertilizer application (Bussink and Oenema 1998).
Manure and facilities manage-ment (i.e., flooring system, type of bedding, and manure handling sys-tem) have a significant effect on vola-tilization rates of NH3. Kroodsma, Huis in’t Veld, and Scholtens (1993) determined that scraped or dirty solid floors gave NH3 emissions of 15 g NH3d/m2, versus 5 g NH3/d/m2 for a flushed system. Thompson and Meisinger (2002) measured NH3 emissions following surface land ap-plication of liquid dairy manure and found when manure was left unincor-porated into the soil for a period of five days, 39 to 52% of the ammoni-um-N (NH4
+-N) was lost. Mitigation of NH3 emissions from land appli-cation via land injection of manure (i.e., anaerobic conditions) versus traditional land application is an area of active research. Although imme-
13COUNCIL FOR AGRICULTURAL SCIENCE AND TECHNOLOGY
diately incorporating manure into the soil can decrease NH3 emissions (Thompson and Meisinger 2002), incorporating manure can greatly in-crease emissions of the potent GHG N2O (Wulf, Maeting, and Clemens 2002). Likewise, mitigation of N2O emissions via composting of manure often results in increased NH3 (Amon et al. 2001).
Greenhouse GasesMajor sources of CH4 on dair-
ies include enteric fermentation within the rumen and stored manure. Methane emissions from dairy cows raised in intensive systems range from between 55 and 70 kg CH4/yr/animal (ASABE 2006; Moiser et al. 1998).
Dairy AFOs produce significant amounts of CH4 because of the wide-spread use of anaerobic manure la-goons and storage basins. Specifically, manure stored under aerobic condi-tions produces less CH4 than the an-aerobic systems used in dairy AFOs (ASABE 2006). Safley and Casada (1992) measured CH4 conversion factors (MCF) between 20 and 90 from anaerobic liquid slurry systems compared to MCFs of 10 for solid and pasture-applied manure (ASABE 2006).
Gaseous emissions of N2O from soils associated with dairy waste or dairy-owned cropland are a major source of indirect GHG emissions as-sociated with dairy manure. Nitrous oxide formation results from deni-trification processes reducing nitrate (NO3) to N2O and from nitrification oxidizing ammonium (NH4) to N2O. Therefore, when excess NO3 or NH4 is present in the soil (i.e., from fer-tilizer or manure application), N2O emissions can be significant (Menneer et al. 2005). In addition, higher N2O emissions have been noted at sites with long-term N applications, sug-gesting that long-term accumula-tion of N in soils affects emissions. Consequently, effective manure and land management is essential to the mitigation of N2O. Enteric fermenta-tion has been found to produce small
amounts of N2O (Kaspar and Tiedje 1981); however, little research has been conducted to quantify N2O emis-sions derived directly from dairy cat-tle. Decreasing N2O emissions could have a significant impact on total GHG emissions from dairies because of its high global warming potential (IPCC 2007).
BeefAlthough most of the confined
beef production in the United States now takes place in the Great Plains and the West in outdoor facilities known as “feedlots” or “feedyards,” some cattle feeding still occurs in open-sided or fully enclosed barns. Most of the beef production that takes place under roof in the United States is found in the higher-rainfall areas east of the Mississippi River, where the abundant rainfall is captured as roof drainage and directed away from the production areas without being contaminated by manure, feed, or other kinds of waste.
In the Great Plains and West, open feedlots are the norm because most or all of the precipitation that falls on the production area can be evapo-rated or irrigated (during the warmer months) or cheaply stored in runoff ponds through the colder months until it can be evaporated or used for irri-gation. As a result, air emissions from beef production areas in the Great Plains and West tend to be driven and modified by precipitation (or its ex-tended absence). Air emissions from beef production areas in the eastern United States tend to be driven and modified by ventilation, either pas-sive or active (forced). Where beef animals are fed under roof, addition-al gas-phase emissions result from uncovered manure storages, holding ponds, and anaerobic lagoons, similar to most of the confined swine- and poultry-feeding operations across the nation.
In the semi-arid and temper-ate climates of the Great Plains and the western United States, open-lot feedyards are the norm and consist of
unvegetated, usually earthen corrals in which beef animals receive a grain-based, mixed feed in concrete feed troughs two or three times per day. Depending on liveweight or growth stage, animal sex, bunk space, cli-matic factors, management schemes, and topography, each animal may be allocated from 7 to 28 m2/head (7 to 28 m2/hd; 75 to 300 ft2/hd) of corral area. The production area of a cattle feedyard with a one-time capacity of 20,000 hd may occupy a footprint be-tween 14 and 57 hectares (ha; 35 and 140 acres). In the most concentrated cattle-feeding region in the United States—the southern High Plains, comprising parts of Texas, Oklahoma, and southwest Kansas—the typical summertime cattle stocking density is about 14 m2/hd (150 ft2/hd).
Beef production in the United States includes a substantial herd grown on pasture and rangeland, ei-ther all the way to slaughter or for a period of time before being trans-ported to feedyards to be finished. Although such operations are beyond the scope of this report, they also exchange gases with the atmosphere that may represent significant propor-tions of the North American budgets of ecologically important elements such as C, N, and sulfur (S). A life-cycle understanding of emissions at-tributable to beef production would need to include pasture operations, where applicable.
Emissions from Beef FeedyardsThe primary emissions of local
concern to cattle feeders and their neighbors are fugitive particulate matter (PM10 and coarse particu-late or PM10-2.5), which arise mostly from uncovered corrals, unpaved roads, or exhaust fans, and nuisance odor, which consists mainly of VOCs and, to a lesser extent, NH3 and H2S. At the regional and national scales, NH3, H2S, and VOCs may contribute to secondary fine particulate matter (PM2.5), acid rain, and ground-level ozone (O3).
As with other livestock and poul-
COUNCIL FOR AGRICULTURAL SCIENCE AND TECHNOLOGY14
try species, most of the airborne emissions from cattle feedyards de-rive from what the animals eat. The nutrient composition of so-called “finishing” rations—mixed feed giv-en to animals within a few weeks of slaughter, with a dry-matter digest-ibility of about 83%—includes about 2.2% N and 0.32% S on a dry-matter basis (Heflin, K., L. McDonald, and B. W. Auvermann. 2000. Unpublished data). When distillers’ grains are in-cluded at up to 30% of feed dry mat-ter, N and S may be as high as 2.6 and 0.43% of dry matter, respectively, with dry-matter digestibility decreas-ing to around 78% (MacDonald, J. Personal communication). The more N, S, and dry matter excreted by the animals, the greater the potential for those constituents to be emitted as NH3, H2S, and PM, respectively.
Feed efficiency of cattle (i.e., dry matter intake per unit of body weight gain) ranges from 5:1 to 7:1 depend-ing on breed, sex, diet composition, days on feed, dietary supplements, animal health, climate, and anabolic implant status. Nutrition technologies have been quite successful in decreas-ing the feed-to-gain ratio (increasing feed efficiency) industry-wide, which increases production efficiency and decreases emissions of macronutrient gases per unit of beef produced.
Particulate MatterParticulate matter is the primary
air pollutant of concern to cattle feed-ers, their neighbors, and their local communities. Airborne PM emitted by cattle-feeding operations includes dust from unpaved roads, dander, hair, and dry, pulverized manure and soil resuspended in the air by hoof action on the corral surface. Under typical conditions, hoof action is the primary mechanism for fugitive PM emissions.
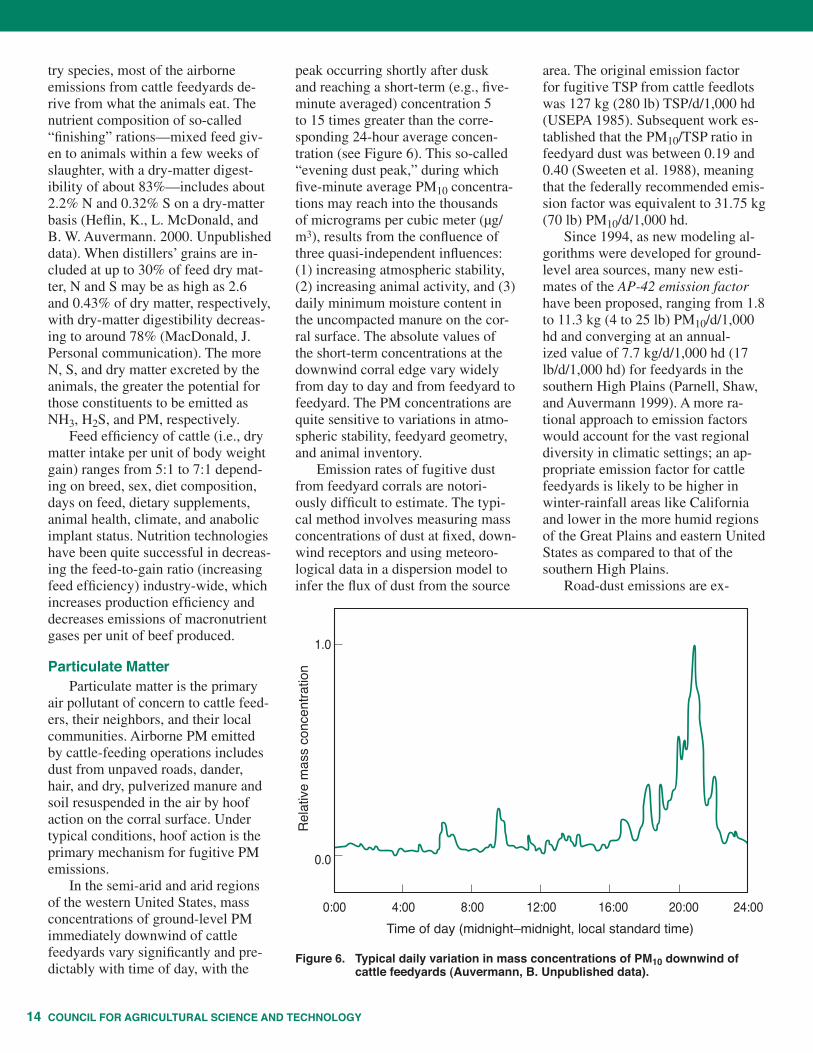
In the semi-arid and arid regions of the western United States, mass concentrations of ground-level PM immediately downwind of cattle feedyards vary significantly and pre-dictably with time of day, with the
peak occurring shortly after dusk and reaching a short-term (e.g., five-minute averaged) concentration 5 to 15 times greater than the corre-sponding 24-hour average concen-tration (see Figure 6). This so-called “evening dust peak,” during which five-minute average PM10 concentra-tions may reach into the thousands of micrograms per cubic meter (µg/m3), results from the confluence of three quasi-independent influences: (1) increasing atmospheric stability, (2) increasing animal activity, and (3) daily minimum moisture content in the uncompacted manure on the cor-ral surface. The absolute values of the short-term concentrations at the downwind corral edge vary widely from day to day and from feedyard to feedyard. The PM concentrations are quite sensitive to variations in atmo-spheric stability, feedyard geometry, and animal inventory.
Emission rates of fugitive dust from feedyard corrals are notori-ously difficult to estimate. The typi-cal method involves measuring mass concentrations of dust at fixed, down-wind receptors and using meteoro-logical data in a dispersion model to infer the flux of dust from the source
area. The original emission factor for fugitive TSP from cattle feedlots was 127 kg (280 lb) TSP/d/1,000 hd (USEPA 1985). Subsequent work es-tablished that the PM10/TSP ratio in feedyard dust was between 0.19 and 0.40 (Sweeten et al. 1988), meaning that the federally recommended emis-sion factor was equivalent to 31.75 kg (70 lb) PM10/d/1,000 hd.
Since 1994, as new modeling al-gorithms were developed for ground-level area sources, many new esti-mates of the AP-42 emission factor have been proposed, ranging from 1.8 to 11.3 kg (4 to 25 lb) PM10/d/1,000 hd and converging at an annual-ized value of 7.7 kg/d/1,000 hd (17 lb/d/1,000 hd) for feedyards in the southern High Plains (Parnell, Shaw, and Auvermann 1999). A more ra-tional approach to emission factors would account for the vast regional diversity in climatic settings; an ap-propriate emission factor for cattle feedyards is likely to be higher in winter-rainfall areas like California and lower in the more humid regions of the Great Plains and eastern United States as compared to that of the southern High Plains.
Road-dust emissions are ex-
Figure 6. Typical daily variation in mass concentrations of PM10 downwind of cattle feedyards (Auvermann, B. Unpublished data).
15COUNCIL FOR AGRICULTURAL SCIENCE AND TECHNOLOGY
pressed in units of mass per distance traveled (e.g., kg/vehicle miles trav-eled). The EPA has developed emis-sion estimates of PM10 from unpaved roads (USEPA 2006b) that are a func-tion of the silt content (%) of the road surface, the gross vehicle weight, the vehicle ground speed, and the mois-ture content (%) of the road surface. An estimate of the total annual PM10 emissions from a feedyard’s vehicle fleet may be obtained by estimating the average daily emissions for each vehicle used in the feedyard, sum-ming those emissions over all vehi-cles used in the facility, and multiply-ing by 365.
Emission factors, which are es-timates of the mass emitted per unit of industrial throughput or capacity, are often criticized as one-size-fits-all estimates that do not account for dif-ferences in feeding regimes, climate, corral design, or management fac-tors that vary from feedyard to feed-yard. A report commissioned by the National Academy of Sciences rec-ommended that the emission-factor approach to estimating emissions of all kinds of air pollutants be replaced by a process-based modeling ap-proach that accounts for site-specific feedyard attributes, climate, and man-agement tactics (National Research Council 2003). A mathematical framework for process-based model-ing of PM emissions from cattle feed-yards has been proposed (Auvermann 2003); although that framework has been used to develop screening meth-ods for various dust-control tech-niques (Razote et al. 2006), it has not been comprehensively and conclu-sively validated.
AmmoniaAmmonia emissions from cattle
feedyards arise principally from the metabolism of proteins and amino acids. Metabolites of those feed con-stituents are excreted as urea, which is subsequently hydrolyzed to aque-ous-phase NH3 in the presence of the enzyme urease. Once aqueous NH3 is present in the manure on the feedyard
surface, it may be volatilized to the atmosphere as gaseous NH3. Because the chemical pathways from feed N to gas-phase N emissions are well defined, gaseous NH3 emissions are probably best expressed in mass-bal-ance terms as a percentage of the N fed to the animals.
Ammonia emissions from open-lot cattle feedyards vary seasonally, with summertime emission rates ap-proximately twice the wintertime emission rates (Todd et al. 2008). Using a variety of independent meth-ods to estimate emissions, annualized NH3-N emissions from commercial cattle feedyards in Texas were be-tween 36 and 53% of the N fed to the animals (Todd and Cole 2007; Todd et al. 2008). Thus, a 20,000-hd yard feeding a corn-based ration at about 10.2 kg (22.5 lb) dry matter per day per head would be expected to emit a total of about 2,050 kg (4,519 lb) of N per day (2,050 kg N/d). Other researchers have estimated NH3 emissions from open-lot feedyards at rates between 9 and 56% of the N fed to the animals (Faulkner and Shaw 2008). Although some of that N is emitted from runoff holding ponds, most of it is emitted by the corral surfaces.
Concentrations of NH3 at ground level near cattle feedyards are highly variable and, as is the case with near-ly all air pollutants, depend strongly on the averaging time over which the concentrations were measured (National Research Council 2003).2 Moreover, because NH3 is so reac-tive, changing the location at which NH3 is measured may change the measured concentrations significant-ly. Finally, NH3 plumes downwind of open-lot feedyards are spatially non-uniform, so path-averaged and point monitors generally yield different measured concentrations.
Flesch and colleagues (2007) used open-path lasers to measure 15-min-ute average NH3 concentrations within and downwind of a cattle feed-yard. The long-term mean of their measurements within the feedyard was between 1.2 and 1.7 ppm, with daily maximum 15-minute concen-trations approaching 5 ppm. At their downwind measurement path nearest the feedyard, long-term mean con-centrations were between 0.8 and 1.0 ppm, with daily maximum 15-min-ute concentrations approaching 2.5 ppm. Long-term averages and daily maximum 15-minute concentrations decreased substantially at the more distant monitoring sites downwind. They assumed that the long-term av-erage background concentration was on the order of 0.015 ppm (15 ppb) or two orders of magnitude lower than the in-source and downwind concen-trations (Flesch et al. 2007).
McGinn, Janzen, and Coates (2003) measured 48- to 72-hour aver-age concentrations of NH3-N down-wind of three cattle feedyards in Alberta. Concentrations immediately downwind occasionally approached 1.5 ppm (850 µg/m3) but averaged about 1 ppm. Short-duration (five-minute) concentrations measured with portable analyzers were on the order of 3 ppm or less at the down-wind perimeter. At 200 m downwind, NH3-N concentrations routinely de-creased by 60 to 80% as compared to the concentrations measured at the feedyards’ downwind perimeter.
Hydrogen SulfideHydrogen sulfide is a product of
the fermentation of sulfur-contain-ing compounds (primarily the ami-no acids methionine and cysteine, as well as sulfur salts) ingested by cattle in feed and drinking water and then excreted in urine and feces. It is produced under anaerobic condi-tions, generally postexcretion, which in the feedyard are found in runoff holding ponds and on corral surfaces that remain wet for an extended time (Parker et al. 2005). Its odor (he-
2 In general, peak concentrations over short dura-tions significantly exceed the peak concentrations over much longer durations. Thus, the highest peak 1-hour NH3 concentration on a given day would be much greater than the corresponding 24-hour aver-age concentration.
COUNCIL FOR AGRICULTURAL SCIENCE AND TECHNOLOGY16
donic tone) is widely described as “rotten eggs,” which accounts for its offensiveness and its reputation as a primary cause of nuisance odor. At high concentrations (> 150 ppm), H2S can be lethal, but such concentrations are not observed in outdoor livestock facilities.3 Koelsch and colleagues (2002) measured total reduced S, which includes mainly hydrogen sul-fide, concentrations on a 15-minute averaging time near cattle feedyards in Nebraska and reported a maximum 15-minute concentration of 0.03 ppm along feedyard perimeters. Within the feedyard properties (i.e., adjacent to primary sources such as runoff hold-ing ponds) per se, “no situations were observed where three consecutive readings exceeded Nebraska’s 0.1 ppm, 30-minute standard” (Koelsch et al. 2002).
Like NH3, H2S is listed as a “haz-ardous substance” under the EPA’s Emergency Planning and Community Right-to-Know Act (EPCRA), and as of January 2009 livestock facilities releasing more than 45.4 kg/day (100 lb/day) of H2S are required to report those releases to local emergency-response authorities. Drawing on re-search conducted in the Texas High Plains, the range of emission fac-tors used in the National Cattlemen Beef Association’s 2009 EPCRA guidance document for cattle feed-yards4 is 2.132x10⁻³ to 3.856x10⁻³ kg/d/hd (4.7x10⁻³ to 8.5x10⁻³ lb/d/hd).5 Because the study area has a
semi-arid, summer-rainfall climate, those emission factors would need to be adjusted for use in winter-rainfall, colder, or temperate climates such as the Pacific Coast, the northern Great Plains, and the southeastern United States, respectively.
Volatile Organic CompoundsTrace gases emitted by cattle
feedyards include many of the same metabolites and co-products emitted by other livestock and poultry species. The class of emissions known as VOC is diverse.
Odorous VOCS tend to be, though not exclusively, intermediate products of fermentation and include mercap-tans, amines, organic sulfides, VFAs, phenols, alcohols, aldehydes, ketones, and many others. Their odor poten-tials, as measured by the threshold concentrations at which the human nose can detect them, vary over many orders of magnitude.
Reactive VOCs are known, along with a wide variety of hydrocarbons, to react with other atmospheric gases in the presence of sunlight to form O3, a criteria pollutant6 and the main component of smog. The reactive VOCs include alkenes, aldehydes, and some industrial chemicals. Of particu-lar regulatory importance are the so-called “highly reactive VOCs,” which react more rapidly than other reactive VOCs to form O3. Some of the most notorious of the reactive VOCs, iso-prene and monoterpenes, are emitted naturally and in large quantities by deciduous and coniferous forests, re-spectively (Fuentes et al. 1996).
Emission fluxes of VOCs, like other fugitive emissions from cattle feedlots, are difficult to obtain with good precision, and accuracy is dif-ficult to assess because there are no standard methods that have been vali-dated against known emission fluxes.
In most cases, researchers use the inverse-modeling technique of mea-suring downwind concentrations and inferring source strength via disper-sion modeling.
Downwind concentration data are more easily found. For example, researchers in Texas measured p-cresol (an odorous VOC) concentra-tions in the air upwind and at multi-ple locations downwind of two cattle feedyards in the Texas Panhandle (Perschbacher-Buser et al. 2007). One-hour concentrations of p-cresol occasionally approached 0.07 ppb at the downwind property line but de-creased rapidly with downwind dis-tance. Researchers in Canada mea-sured VFAs and other odorants over two- to three-day averaging times near the downwind perimeters of three cattle feedyards in Alberta (McGinn, Janzen, and Coates 2003). Total VFA concentrations varied from 10.4 to 177.6 µg/m3, with acetic, butyric, and propionic acids predominating. The p-cresol concentrations ranged from 0.003 to 0.018 µg/m3, which are in the low part-per-trillion range. It also seems from their research that VFAs are less prone than NH3 to depletion from the plume as the compounds are carried downwind.
Organic compounds—not all of them volatile—are also likely to be carried along in fugitive aerosols either as (inherently) solid-phase or adsorbed constituents. Rogge, Medeiros, and Simoneit (2006) found more than 100 organic compounds in samples of the soil collected near the surfaces of cattle feedyards and dairies in the San Joaquin Valley of California.7 Not surprisingly, the compounds they found are associated with feedstuffs, vitamins, and supple-ments routinely fed to livestock, as well as metabolites of those materi-als, and the authors proposed that the
6 “Criteria pollutants” are air pollutants for which health-based, ambient air quality standards have been adopted under the CAA Amendments. They include PM10 and PM2.5, lead, O3, NOx, sulfur di-oxide, and carbon monoxide. For more information, see http://www.epa.gov/air/urbanair/.
7 Using the term “soil” for the materials they ana-lyzed may be confusing. The samples in question were collected outside the corrals and should be interpreted as mineral soil that has been subjected to continuous dry deposition of dust and gases emitted from the feedyard surfaces.
3 Agricultural fatalities associated with H2S tend to cluster around indoor facilities in which manure is stored below the production floor. When a manure pit is agitated to ensure that it can be emptied ef-ficiently, it releases a burst of H2S that may exceed the concentration that is lethal to any worker present in that building without respiratory protection. See, for example, Ni et al. (2000).4 See Sweeten et al. (1988).5 Expressing the upper bound of the H2S emission factor in terms of mass per animal unit is slightly misleading in the case of cattle feedyards because (1) basal (dry-weather) H2S emissions come primar-ily from runoff holding ponds, and (2) elevated (wet-weather) emissions are roughly proportional to wet corral area. In either weather regime, the emit-ting area is likely to be a more reliable predictor of H2S emissions than the number of animals on feed at the time. Lower flux estimates were reported by Baek et al. (2006).
17COUNCIL FOR AGRICULTURAL SCIENCE AND TECHNOLOGY
organic compounds be used as source markers that distinguish feedyard dust from other aerosol sources.
Because there are so many organ-ic, N- and S-based, and aerosol-phase compounds present in cattle excreta on the feedyard surface, no brief ac-count can describe all of them with respect to emissions processes, fate and transport, or downwind concen-trations. Researchers generally group them into classes and subclasses, which obscures individual compound behavior but permits useful general-izations for selecting control mea-sures.8 Still, the scientific literature on VOC emissions from cattle feed-yards is thin, and to the extent odors and ground-level ozone continue to be nuisance and public-health threats (respectively) near cattle-feeding op-erations, efforts to quantify emissions and develop abatement measures should continue.
Greenhouse GasesGreenhouse gases of concern to the
cattle-feeding industry include CH4, CO2, and N2O. They vary widely in their atmospheric prevalence and in their heat-trapping capacity, with N2O>CH4>CO2. Greenhouse gases from beef production units in Ireland were the focus of a life-cycle invento-ry study by Casey and Holden (2006). Although Irish beef systems differ considerably from cattle feedyards in the United States, their projections serve as an interesting benchmark for future work on U.S. confinement operations. Synthesizing survey re-sponses from 15 suckler-beef opera-tions, they projected that GHG emis-sion from Irish beef production was between 1,500 and 6,000 kg of CO2 equivalents per hectare per year, de-pending on feed composition, man-agement strategies, and other site-specific descriptors.9
Manure Storage and Land Application
Manure is stored at nearly all commercial animal operations in the United States, from a few days to more than one year, primarily to conserve manure nutrients for timely application onto cropland or for value-added processes, such as anaerobic di-gesters and composting. The practice of production site manure storage cre-ates another emission source of odors, gases, particulates, and bioaerosols. The type of manure storage varies depending on species and region of the country. Earthen storage basins or treatment lagoons are common for dairy farms throughout the country and for swine operations in the south-eastern and southern regions of the United States. Concrete storage pits beneath buildings are commonly used in the Midwest by swine producers, especially pig finishing and nursery facilities. Poultry operations may store their manure (semi-dry litter) within the buildings (on floor) for up to two years or as short as a single flock (sev-en weeks) and then stockpile the lit-ter outside the building or adjacent to cropland for up to six months or more. All of these manure storage options affect the farm’s overall air quality and emissions.
Land application of manure has the potential to be the largest emitter of air pollutants from the animal pro-duction systems. But in manure han-dling systems that experience large emission losses during the housing and/or manure storage phases, there may not be much N or S to lose dur-ing land application. Also, the mag-nitude of these emissions (primarily odor and gas) during land application of manure can be greatly decreased with known technologies such as di-rect incorporation (injection) into the soil and tillage immediately or shortly after surface application. Because manure contains valuable crop nutri-ents, nearly all manure from animal production systems is eventually ap-plied to cropland or pastures. Besides this strong economic incentive to
recover nutrients, land application of manure may be the most environmen-tally friendly method for using animal manure.
OdorManure storage units are chronic
sources of odor emissions for most of the animal species. This is especially the case for uncovered earthen stor-age or treatment lagoons that store liquid manure, because any distur-bance of the liquid surface can result in odor (as well as many gas) emis-sions. A number of studies, summa-rized by Casey and colleagues (2006), have measured odor emissions (pri-marily odor flux rates) with ranges from 5 to 50 OU/s/m-2 for swine and dairy liquid manure storage units and also for stockpiled solid poul-try manure storage units. Mitigation methods such as covering, either by a natural crust or an artificial mem-brane, of the storage surface can greatly (70 to 90%) decrease the odor emissions from these sources (Bicudo et al. 2002). Other mitigation tech-niques, such as aeration of the stor-age basin (Westerman, Bicudo, and Kantardjieff 2000) or employing an-aerobic digestion (Powers et al. 1997) of the manure, will also decrease the odor generated but with considerably higher costs.
Odor emissions during land ap-plication of “stored” manure (espe-cially liquid manure) are an acute problem for the animal production industry. Much of the odor released during land application originates during the agitation/mixing process of manure storage units to suspend manure solids so they can be pumped and removed from the storage basin or tank. Also, the spreading of ma-nure, especially liquid manure, onto cropland or grassland can produce high amounts of odor if it is simply broadcast or spread on the land sur-face. A large decrease in odor (90+%) emissions occurs if manure is directly injected into the soil or tilled into the soil immediately after surface ap-plication (Pain et al. 1991). Pain and
8 A good example of this tendency can be found in Miller and Berry (2005).9 Projections like these are difficult, if not impos-sible, to validate at the national scale. For a full description of the authors’ life-cycle procedure, see Casey and Holden (2006).
COUNCIL FOR AGRICULTURAL SCIENCE AND TECHNOLOGY18
colleagues (1991) also measured odor emissions from the application of solid cattle manure and found consid-erably smaller odor flux rates than for pig slurry spreading.
Ammonia, Hydrogen Sulfide, and Volatile Organic Compounds
Manure storage systems can emit so-called hazardous gases—NH3, H2S, as well as VOCs—into the at-mosphere. Uncovered liquid manure storage basins and tanks along with treatment lagoons can release moder-ate to high levels (5 to 40 g NH3/d/m2) of NH3 and relatively low levels (0.65 to 5 g H2S/d/m2) of H2S (Gay et al. 2003). Volatile organic compound emission data are much more lim-ited for manure storage sources and have typically identified specific com-pounds such as VFAs, phenols, and indoles (Bicudo et al. 2004; Hobbs, Misselbrook, and Cumby 1999; Zahn et al 2001). As with odor emissions, covered liquid manure storage and most solid manure storage systems have lower gas emission rates, typi-cally in the lower ranges (5 to 10 g NH3/d/m2) of those seen for uncov-ered liquid systems (Bicudo et al. 2004; Brewer and Costello 1999) for NH3 and below the range (0.16 g H2S/d/m2) for uncovered liquid sys-tems for H2S (Bicudo et al. 2004).
Land application of manure can constitute large NH3 and other gas emission sources with reported levels above 100 g NH3/d/m2 (Chadwick et al. 1998). As with odor, much of the gas emission occurs during the agita-tion of the manure storages (liquid) that often produces large spikes of H2S, NH3, and other VOCs (Clarke and McQuitty 1987). Ammonia loss during land application using both deep and shallow injection and drag shoe methods was decreased from 90+, 80+, and 60+%, respective-ly, in a study conducted by Burton (1997). Other techniques can be used to decrease these gases (especially NH3) but are highly dependent on soil, moisture, and climate condi-tions during the application process (Thompson and Meisinger 2001).
Greenhouse GasesDesigns for anaerobic treat-
ment basins or lagoons often result in low VOC and other gas emissions but may produce increased levels of CH4 emissions (Zahn et al. 2001). Measurements of lagoon CH4 emis-sion rates have varied from almost 0 up to as high as 188 g CH4/d/AU (Casey et al. 2006). Average CH4 emissions of 154 g/d/AU and 21.4 g/d/AU were measured from liq-uid manure storage units by Zahn and colleagues (2001) and Hobbs, Misselbrook, and Cumby (1999), re-spectively. Covers over cattle slurry storages (straw, Leca, or natural crust) decreased CH4 emissions 40% com-pared to uncovered storages (Sommer and Moller 2000). Solid manure stor-ages may also produce CH4 depend-ing on the degree of composting (in-creasing CH4 generation) that occurs. Sommer and Moller (2000) found sol-id dairy manure produced about 50.8 g CH4/tonne (50 g CH4/ton) whereas composting of deep-bedded housing swine manure with a high bulk den-sity produced up to 254 g CH4/tonne (250 g CH4/ton).
Solid manure storages have been identified as sources of N2O with emissions of 3.58 kt N2O/yr and 1.86 kt N2O/yr being reported by Chadwick and colleagues (1999) for stockpiled cattle and poultry manure, respectively. Nitrous oxide emissions will be released in any manure treat-ment system that uses a combina-tion of aerobic and anoxic treatments (Beline and Martinez 2002). Sommer and Moller (2000) measured N2O emissions from the composting of solid manure with straw from swine housing and found a total of 58.9 g/tonne (58 g/ton) of N2O emitted dur-ing the composting period. Anaerobic lagoons in North Carolina from a farrow-to-finish farm and a farrow-to-wean operation emitted 0.3 and 0.4 kg/d/ha of N2O, respectively (Harper et al. 2004).
Chadwick and colleagues (1998) measured CH4 emissions after land
application of pig slurry and found nearly all (98%) occurred within the first four days after spreading. They also found that CH4 emissions during fall application were twice as large as summer spreading (5.5 vs. 2.35 kg CH4/ha). Sharpe and Harper (2002) reported an N2O flux of 0.0016 mg/d/m2 before irrigation of swine lagoon liquid to cropland and 2.6 to 3.8 mg/d/m2 after irrigation. Akiyama and Tsuruta (2003) measured yearly N2O fluxes of 184 and 61.3 mg/m2 from the land application of poultry and swine manure, respectively.
Particulate Matter and BioaerosolsAirborne emissions of dust and
bioaerosol from manure storage units and land application are relatively unknown. Liquid manure would emit little or no PM during the storage or land application phase but could be a source of airborne microorganisms (pathogenic or otherwise). However, little or no data have been collected. Solid manure storage and the associ-ated application of these solids onto cropland could produce some PM if the solid manure is sufficiently dry. Typically only cattle feedyard stock-piles and lots (especially in the dry High Plains area of the southwest-ern United States) have been iden-tified as a source of PM emissions (Auvermann et al. 2002).
Manure Use SummaryOn-farm manure storage systems
and the land application of animal manure are sources of odor, gases (hazardous and greenhouse), particu-lates, and bioaerosols. The magnitude and importance or priority of each of these pollutants varies depending on species, location in the United States, and type of manure management system. From a producer’s perspec-tive, odor is often the main neighbor-hood concern during siting of a new production operation or expansion of an existing one. From a regula-tory standpoint, hazardous gases (H2S and NH3) may be of the great-
19COUNCIL FOR AGRICULTURAL SCIENCE AND TECHNOLOGY
est concern, because depending on the state or area of the country, there may be regulatory limits on what can be emitted from the production site or there is a property line concentra-tion threshold for certain gases. Until recently, GHGs, PM, and bioaerosols have been less of a concern from ei-ther manure storage or land applica-tion sources. But GHGs and PM are a growing concern as more data are becoming available and the concern over climate change and regional air quality in nonattainment sections of the country increases. Bioaerosols are being examined both from public and animal health perspectives but are not high on the list for most producers.
AIr PollutAnt ImPActs And PolIcy
Most studies indicate that large livestock production facilities lower the value of residences within 4.8 km (three miles) of the facility (Ulmer and Massey 2006). Studies also in-dicate that these businesses increase economic activity in the county and state. Political actions try to balance the competing positive and negative impacts of any business. To the ex-tent that pollutants (including odor) have local effects, regulatory actions should be taken into account locally. For example, the risk of nitrogenous gases leaving lagoons and being rede-posited within water bodies is greater in Missouri (with average rainfall of 1.02 m/year [40 inches/year]) than in western Oklahoma (with average rainfall less than 0.5 m [20 inches] per year).
A combination of regulatory and market forces is causing a shift in the way manure is stored and land ap-plied. Regulatory forces are empha-sizing sufficient storage capacities for spreading windows, setbacks of storage and spreading areas from en-vironmental concerns such as wells and streams, and application lim-its that reflect crop nutrient needs. Environmental forces are reinforcing
some of these ideas. Higher fertilizer prices are causing producers to seek to maximize the value of their manure resource by storing in a manner that conserves nutrients and land applying it to crops that benefit from the nutri-ents. Livestock production is moving back to the crop-producing regions of the nation as opposed to areas where the nutrients are not as valuable be-cause crop production is minimal.
Greenhouse gases from livestock production are primarily from enteric fermentation and manure manage-ment. The much-quoted UN study Livestock’s Long Shadow distinguish-es between intensive and extensive livestock production (Steinfeld et al. 2006). United States livestock produc-tion is intensive and does not have the GHG emissions associated with poor feed quality and deforestation. Enteric fermentation is a natural process for ruminant animals, but the GHG emis-sions/unit of meat produced is very low in the U.S. production system.
The U.S. manure management system is relatively high in GHG emissions because most all pork ma-nure and at least half of the dairy manure is stored wet rather than dry. The CH4 emissions that come from manure storage structures can be cap-tured and destroyed by using covers and digesters on large facilities. The economies of scale associated with capturing and destroying CH4 indi-cate that attempts to decrease CH4 from livestock production will foster greater concentration in the industry. Currently, the science exists to capture and destroy CH4, but the economic benefit from qualifying and selling C offsets or credits using registries such as the Climate Action Reserve, Regional Greenhouse Gas Initiative, and Chicago Climate Exchange and from electricity generation using methane-powered generators is insuf-ficient in most livestock operations to justify the expense of the equipment. Other benefits must be identified (e.g., odor reduction or increased retention of nutrients) or costs must come down
in order for methane digesters to be voluntarily adopted.
summAryIn the past 10 to 20 years, air
quality and emissions inside of and from animal production systems have become environmental concerns equal to those of water quality and emissions to surface and groundwa-ter for animal agriculture in the 1970s and ’80s. During the same time, there has been a large increase in air qual-ity/emission research, much of it driv-en and funded by the animal industry, that has provided air emission rates and information for a variety of air-borne parameters from animal hous-ing units, associated manure storages, and land application systems. The airborne parameters measured and the levels of concern include the follow-ing:
• Odor and PM10—primarily a local issue and nuisance complaints
• Hazardous gases (NH3 and H2S) and PM2.5—regional/national issues; primarily environmental impacts, but also health concerns
• Greenhouse gases—global impor-tance on climate change impacts
• Air quality (pollutant concentra-tions) inside animal buildings or ambient levels near neighbors—animal and human health issues
Swine production systems gen-erate a large variety of significant air emissions. Ammonia, H2S, odor, VOCs, PM, bioaerosols, and GHGs are all emitted in quantities of con-cern from pork production systems. This has created challenges for pork producers, because a more compre-hensive approach (vs. targeting one or two contaminants) is necessary to control or manage several of these air emission parameters simultaneously. But the pork industry has been quite progressive in dealing with air quality problems, funding emissions research projects, and promoting practices and technologies that manage and miti-
COUNCIL FOR AGRICULTURAL SCIENCE AND TECHNOLOGY20
gate air emissions from their produc-tion systems.
Poultry producers, on the other hand, have been concerned primar-ily with one airborne contaminant—ammonia—secondarily, with PM and, potentially, bioaerosols. This is especially the case for layer opera-tions. Meat bird (broiler and turkey) producers have some concern with PM levels in barns and PM emissions because of the litter pack manure-handling systems. Ammonia emis-sions have been determined for the major housing systems used in the poultry industry, with some housing systems and/or management practices producing substantial NH3 emission decrease.
Dairy producers, like swine pro-ducers, have a number of different air emission parameters of concern. Ammonia, odor, and GHG emissions are of interest to the U.S. dairy in-dustry; in addition, dairies in western states such as California are also con-cerned about VOC emissions. Dairy operations not only have emissions from buildings and manure storages, but they also have large feed (for-age) storage sources. Additionally, the dairy industry has become proactive in managing and mitigating emissions from their operations, funding air emission monitoring and C footprint studies.
Beef cattle are primarily finished in large open feedyards. The main air quality concern with these open lots is PM (dust) emissions. Other air-borne parameters such as NH3 may be of concern under certain weather (wet) conditions.
Emission of gases from manure storages and land application of ani-mal manure on cropland and pastures can be a significant percentage of the total air emissions from animal op-erations. Management practices and mitigation technologies have been and are being developed and used to decrease odor, hazardous gases, GHGs, and VOCs from manure stor-age units and during land application of manure.
Regulation of air emissions from animal production at the federal, state, and even local level has been steadily increasing during the past 20 years, creating uncertainty for pro-ducers and the industries. Compliance to existing and new regulations is being met through a combination of new mitigation technologies and management practices depending on the animal species, location of the production operations, and economics of the industry. Many of these mitiga-tion technologies are site and specie specific, but several, such as diet ma-nipulation, are common to all animal species. The goal is to use science-based information to help all stake-holders involved in animal produc-tion to protect the environment and public health in a proactive manner and avoid costly litigation to solve nuisance suits or enforce regulations.
glossAryAnimal unit. 1 AU=500 kg or 1,100
lbs of animal weight.AP-42 emission factor. Emission
factors listed in the AP-42 series of documents are best viewed as EPA guidance, primary regulatory au-thority residing with the states.
Bioaerosols. Airborne particles that are biological in origin.
Biogas. A mixture of methane and carbon dioxide produced by the bacterial decomposition of organic wastes and used as a fuel.
Endotoxin. A toxin produced by cer-tain bacteria and released upon de-struction of the bacterial cell.
Eutrophication. A process where water bodies receive excess nutri-ents that stimulate excessive plant growth.
Greenhouse gases. Gases that trap heat in the atmosphere.
Hedonic tone. A property of an odor relating to its pleasantness or un-pleasantness.
Particulate matter. Minute airborne liquid or solid particles (such as dust, fume, mist, smog, smoke) that cause air pollution.
Volatile fatty acid. A short‐chain fatty acid—acetic, propionic, and butyric acid—which, apart from its presence in some foods, is pro-duced by intestinal bacteria from undigested starch and dietary fiber.
Volatile organic compounds. A large group of carbon-based chemicals that easily evaporate at room temperature.
lIterAture cItedAkiyama, H. and H. Tsuruta. 2003. Nitrous oxide,
nitric oxide, and nitrogen dioxide fluxes from soils after manure and urea applica-tion. J Environ Qual 32 (2): 423–431.
Alanis, P., M. Sorenson, M. Beene, C. Krauter, B. Shamp, and A. S. Hasson. 2008. Measure-ment of non-enteric emission fluxes of volatile fatty acids from a California dairy by solid phase micro-extraction with gas chromatography/mass spectrometry. Atmos Environ 42:6417–6424.
American Farm Bureau Federation and National Pork Producers Council et al. v. EPA, 559 F.3d 512 (DC Cir. 2009).
American Public Health Association. 2003. Precautionary moratorium on new animal feeding operations. Adv Pol, Policy No. 20037, http://www.apha.org/advocacy/policy/policysearch/default.htm?id=1243 (12 November 2010)
Amon, B., Th. Amon, J. Boxberger, and Ch. Alt. 2001. Emissions of NH3, N2O, and CH4 from dairy cows housed in a farmyard ma-nure-tying stall (housing, manure storage, manure spreading). Nutr Cycl Agroecosyst 60:103–113.
Aneja, V. P., W. H. Schlesinger, and J. W. Eris-man. 2009. Effects of agriculture upon the air quality and climate: Research, policy, and regulations. Environ Sci Technol 43:4234–4240.
Arogo, J., P. W. Westerman, and A. J. Heber. 2003. A review of ammonia emissions from confined swine feeding operations. Trans ASAE (Am Soc Agric Eng) 46:805–817.
American Society of Agricultural and Biologi-cal Engineers (ASABE). 2006. Air quality and emissions from livestock and poultry production/waste management systems. Pp. 1–40. In J. M. Rice, D. F. Caldwell, and F. J. Humenik (eds.). Animal Agriculture and the Environment: National Center for Manure and Animal Waste Management White Papers.
Auvermann, B. W. 2003. A mechanistic model of fugitive dust emissions from cattle feedyards. Paper presented at the Third International Conference on Air Pollution from Agricultural Operations, 12 October, Durham, North Carolina.
Auvermann, B. W., R. W. Bottcher, A. J. Heber, D. Meyer, C. B. Parnell, B. Shaw, and J. Worley. 2002. Particulate Matter Emissions from Confined Animal Operations: Manage-ment and Control Measures: National Cen-
21COUNCIL FOR AGRICULTURAL SCIENCE AND TECHNOLOGY
ter for Manure and Animal Waste Manage-ment White Papers, p. 41. North Carolina State University, Raleigh, North Carolina (available on CD-ROM from MidWest Plan Service).
Baek, B., R. Todd, N. A. Cole, and J. Koziel. 2006. Ammonia and hydrogen sulphide flux and dry deposition velocity estimates using vertical gradient method at a commercial beef cattle feedlot. Int J Global Environ Iss 6 (2/3): 189–203.
Bandekar, P., S. Bajwa, and Y. Liang. 2008. Preliminary evaluation of a wet scrubber system to reduce ammonia emission from poultry houses. ASAE Paper No. 083945. ASAE, St. Joseph, Michigan.
Beline, F. and J. Martinez. 2002. Nitrogen trans-formations during biological aerobic treat-ment of pig slurry: Effect of intermittent aeration on nitrous oxide emissions. Biores Technol 83:225–228.
Bicudo, J. R., D. R. Schmidt, W. Powers, J. A. Zahn, C. L. Tengman, C. J. Clanton, and L. D. Jacobson. 2002. Odor and VOC emis-sions from swine manure storages. Proceed-ings of Odor and Toxic Air Emissions 2002, Albuquerque, New Mexico, April 28 to May 1, 2002. WEF, Alexandria, Virginia (on CD-ROM).
Bicudo, J. R., C. J. Clanton, D. R. Schmidt, W. Powers, L. D. Jacobson, and C. L. Tengman. 2004. Geotextile covers to reduce odor and gas emissions from swine manure storage ponds. Appl Eng in Agric. 20 (1): 65–75.
Bluteau, C. V., D. I. Masse, and R. Leduc. 2009. Ammonia emission rates from dairy live-stock buildings in eastern Canada. Biosys Eng 103 (4): 480–488.
Brewer, S. K. and T. A. Costello. 1999. In situ measurements of ammonia volatilization from broiler litter using an enclosed air chamber. Trans ASAE (Am Soc Agric Eng) 42:1415–1422.
Burns, R. T., K. A. Armstrong, F. R. Walker, C. J. Richards, and D. R. Raman. 2003. Am-monia emissions from a broiler production facility in the United States. Pp. 88–95. Proceedings International Symposium on Gaseous and Odor Emissions from Animal Production Facilities, CIGR, Horsens, Denmark.
Burns, R. T., H. Li, L. Moody, H. Xin, R. Gates, D. Overhults, and J. Earnest. 2008a. Quantification of particulate emissions from broiler houses in the southeastern United States. Proceedings of the 8th International Livestock Environment Symposium, Iguassu Falls, Brazil, September 1 to 3, 2008. ASAE, St. Joseph, Michigan.
Burns, R. T., H. Li, H. Xin, R. Gates, D. Over-hults, J. Earnest, and L. Moody. 2008b. Greenhouse gas (GHG) emissions from broiler houses in the southeastern United States. ASABE Technical Paper #08-4649. ASABE, St. Joseph, Michigan.
Burton, C. H. 1997. Manure Management—Treatment Strategies for Sustainable Agri-culture. Silsoe Research Institute, Silsoe, Bedford, United Kingdom.
Bussink, D. W. and O. Oenema. 1998. Ammonia volatilization from dairy farming systems in temperate areas: A review. Nutr Cyc Agro-ecosys 51:19–33.
Cabera, M. L., S .C. Chiang, O. C. Merka, O. C. Pancorbo, and S. C. Thompson. 1994. Pelletizing and soil water effects on gaseous emission from surface-applied poultry litter. Soil Sci Soc Am J 58:807–811.
Cambra-López, M., A. J. A. Aarnink, Y. Zhao, S. Calvet, and A. G. Torres. 2009. Airborne particular matter from livestock produc-tion systems: A review of an air pollution problem. Environ Pollut doi:10.1016/j.envpol.2009.07.011.
Carter, S., M. Lachmann, and J. Bundy. 2008. Effects of dietary manipulation on ammonia emissions. Proceedings Mitigating Air Emissions from Animal Feeding Operations cd, Des Moines, Iowa, May 19 to 21, 2008.
Carter, W. P. L. 1994. Development of ozone reactivity scales for volatile organic com-pounds. J Air Waste Manage 44:881–899.
Casey, J. and N. M. Holden. 2006. GHG emis-sions from conventional agri-environmental scheme and organic Irish suckler-beef units. J Environ Qual 35:231–239.
Casey, K. D., J. R. Bicudo, D. R. Schmidt, A. Singh, S. W. Gay, R. S. Gates, L. D. Jacobson, and S. J. Hoff. 2006. Air quality and emissions from livestock and poultry production/waste management systems. Pp. 1–40. In J. M. Rice, D. F. Caldwell, and F. J. Humenik (eds.). Animal Agriculture and the Environment. National Center for Manure and Animal Waste Management White Papers. ASABE, St. Joseph, Michigan.
Chadwick, D. R., T. van der Weerden, J. Marti-nez, and B. F. Pain. 1998. Nitrogen trans-formations and losses following pig slurry applications to a natural soil filter system (Solepur process) in Brittany, France. J Agric Eng Res 69:85–93.
Chadwick, D. R., R. W. Sneath, V. R. Phillips, and B. F. Pain. 1999. A UK inventory of nitrous oxide emissions from farmed live-stock. Atmos Environ 33:3345–3354.
Clark, P. C. and J. B. McQuitty. 1987. Air quality in six Alberta commercial free-stall dairy barns. Can Eng Agric 29:77–80.
Community of Alma v. Furnas County Farms. 266 Neb. 558 (2003).
Cormier, Y., G. Tremblay, A. Meriaux, G. Brochu, and J. Lavoie. 1990. Airborne microbial contents in two types of swine confinement buildings in Quebec. Am Ind Hyg Assoc J 51:304–309.
Duchaine, C., Y. Grimard, and Y. Cormier. 2000. Influence of building maintenance, envi-ronmental factors, and seasons on airborne contaminants of swine confinement build-ings. Am Ind Hyg Assoc J 61:56–63.
Fairchild, B. D. 2008. Fence line ammonia con-centration from broiler operations. Poultry Science Department, University of Georgia, Athens, Georgia.
Faulkner, W. B. and B. W. Shaw. 2008. Review of ammonia emission factors for United States animal agriculture. Atmos Environ 42 (27): 6567–6574.
Filipy, J., B. Rumburg, G. Mount, H. Westberg, and B. Lamb. 2006. Identification and quan-tification of volatile organic compounds from a dairy. Atmos Environ 40:1480–1494.
Flesch, T., J. D. Wilson, L. A. Harper, R. W. Todd, and N. A. Cole. 2007. Determining ammonia emissions from a cattle feedlot
with an inverse dispersion technique. Agric Forest Meteor 144 (2): 139–155.
Fuentes, J., D. Wang, H. Neumann, T. Gillespie, G. Den Hartog, and T. Dann. 1996. Ambi-ent biogenic hydrocarbons and isoprene emissions from a mixed deciduous forest. J Atmos Chem 25 (1): 67–95.
Gay, S. W., C. J. Clanton, D. R. Schmidt, K. A. Janni, L. D. Jacobson, and S. Weisberg. 2003. Odor, total reduced sulfur, and am-monia emissions from livestock and poultry buildings and manure storage units. ASAE App Eng Agric 19 (3): 347–360.
Green, A. R., I. Wesley, D. W. Trampel, and H. Xin. 2009. Air quality and hen health status in three types of commercial laying hen houses. J App Poult Res 18 (3): 605–621.
Groot Koerkamp, P. W. G., J. H. M. Metz, G. H. Uenk, V. R. Phillips, M. R. Holden, R. W. Sneath, J. L. Short, R. P. White, J. Hartung, J. Seedorf, M. Schröder, K. H. Linkert, S. Pedersen, H. Takai, J. O. Johnsen, and C. M. Wathes. 1998. Concentrations and emissions of ammonia in livestock buildings in North-ern Europe. J Agri Eng Res 70:79–95.
Haglind, P. and R. Rylander. 1987. Occupational exposure and lung function measurements among workers in swine confinement build-ings. J Occup Med 29:904–907.
Harper, L. A., R. R. Sharpe, T. B. Parkin, A. De Visscher, O. van Cleemput, and F. M. Byers. 2004. Nitrogen cycling through swine pro-duction systems: Ammonia, dinitrogen, and nitrous oxide emissions. J Environ Qual 33 (4): 1189–1201.
Heber, A. J., R. K. Duggirala, J. Q. Ni, M. L. Spence, B. L. Haymore, V. I. Adamchuk, D. S. Bundy, A. L. Sutton, and K. M. Keener. 1997. Field Performance of a Pit Additive Tested in Commercial Grow-Finish Houses. Purdue University Swine Day Report, http://www.ansc.purdue.edu/swine/swineday/sday97/psd17-97.htm (12 November 2010)
Heber, A. J., D. S. Bundy, T. T. Lim, J. Q. Ni, B. L. Haymore, C. A. Diehl, and R. K. Duggi-rala. 1998. Odor emission rates from swine confinement buildings. Pp. 301–310. Animal Production Systems and the Environment. Proceedings International Conference on Odor, Water Quality, Nutrient Management, and Socioeconomic Issues, Des Moines, Iowa, July 20 to 22, 1998.
Heber, A. J., J. Q. Ni, T. T. Lim, C. A. Diehl, A. L. Sutton, R. K. Duggirala, B. L. Haymore, D. T. Kelly, and V. I. Adamchuk. 2000. Effect of a manure additive on ammonia emission from swine finishing buildings. Trans ASAE 43:1895–1902.
Heber, A. J., T. T. Lim, P. C. Tao, and J. Q. Ni. 2004. Control of air emissions from swine finishing buildings flushed with recycled lagoon effluent. Paper presented at the 2004 ASAE/CSAE Annual International Meeting, Ottawa, Ontario, Canada.
Heber, A. J., P. Tao, J. Q. Ni, T. T. Lim, and A. M. Schmidt. 2005. Air emissions from two swine finishing buildings with flushing: Ammonia characteristics. Livestock Envi-ronment VII Proceedings 7th International Symposium, Beijing, China, May 18 to 20, 2005. ASAE 701P0205.
Heederik, D., R. Brouwer, K. Biersteker, and J. S. M. Boleij. 1991. Relationship of airborne
COUNCIL FOR AGRICULTURAL SCIENCE AND TECHNOLOGY22
endotoxin and bacterial levels in pig farms with the lung function and respiratory symp-toms of farmers. Int Arch Occup Health 62:595–601.
Hobbs, P. J., T. H. Misselbrook, and T. R. Cumby. 1999. Production and emission of odours and gases from ageing pig waste. J Agric Eng Res 72:291–298.
Howard, C. J., A. Kumar, I. A. Malkina, F. M. Mitloehner, P. G. Green, R. Flocchini, and M. Kleeman. 2010a. Reactive organic gas emissions from livestock feed contribute significantly to ozone production in central California. Env Sci Technol 44:2309–2314.
Howard C., A. Kumar, F. M. Mitloehner, K. R. Stackhouse, P. G. Green, R. G. Flocchini, and M. J. Kleeman. 2010b. Direct measure-ments of the ozone formation potential from livestock and poultry waste emissions. Env Sci Technol 44:2292–2298.
Intergovernmental Panel on Climate Change (IPCC). 2007. Good Practice Guidance and Uncertainty Management in National Greenhouse Gas Inventories. Cambridge University Press, Cambridge, U.K., and New York, New York. 996 pp.
Iowa Department of Natural Resources (IDNR). n.d. Iowa DNR Air Quality—Animal Feed-ing Operations (AFOs), http://www.iow-adnr.gov/air/afo/afo.html (23 March 2011)
Iowa State University. 2006. Tyson Foods Air Pollutant Emission Monitoring. Iowa State University Animal Industry Report 2006. A. S. Leaflet 2121, http://www.ans.iastate.edu/report/air/2006pdf/R2121.pdf (22 April 2011)
Jacobson, L. D., B. R. Hetchler, and D. R. Schmidt. 2007. Sampling pit and wall emis-sion for H2S, NH3, CO2, PM and odor from deep-pit pig finishing facilities. Proceed-ings of the International Symposium on Air Quality Waste Management Agriculture, Broomfield, Colorado, September 16 to 19, 2007. ASABE 701P0907cd.
Jacobson, L. D., B. P. Hetchler, V. J. Johnson, R. E. Nicolai, D. R. Schmidt, P. R. Goodrich, A. J. Heber, J. Q. Ni, T. T. Lim, P. C. Tao, S. J. Hoff, D. S. Bundy, M. A. Huebner, B. C. Zelle, Y. Zhang, J. McClure, M. Roberts, J. A. Koziel, B. H. Baek, A. Balota, J. P. Pinhirme, J. M. Sweeten, D. B. Beasley, G. R. Baughman, and R. Manilla. 2004. Pre-liminary NH3, H2S, and PM10 data from pig and poultry buildings from six-state project. ASAE Paper 044156.
Jacobson, L. D., A. J. Heber, S. J. Hoff, Y. Zhang, D. B. Beasley, J. A. Koziel, and B. J. Hetchler. 2006. Aerial emissions from confirmed animal buildings. Pp. 775–784. Proceedings of the Workshop on Agricul-tural Air Quality: State of the Science, June 5 to 8, 2006.
James, T., D. Meyer, E. Esparza, E. J. DePeters, and H. Perez-Monti. 1999. Effects of dietary nitrogen manipulation on ammonia volatil-ization from manure from Holstein heifers. J Dairy Sci 82:2430–2439.
Kaspar, H. F. and J. M. Tiedje. 1981. Dissimila-tory reduction of nitrate and nitrite in the bovine rumen: Nitrous oxide production and effect of acetylene. Appl Environ Microbiol 41:705–709.
Keener, H. M., D. L. Elwell, and D. Grande. 2002. NH3 emissions and N-balances for a 1.6 million caged layer facility: Manure belt/composting vs. deep pit operation. Trans ASAE 45 (6): 1977–1984.
Kirchmann, H., M. Esala, J. Morken, M. Ferm, W. Bussink, J. Gustavsson, and C. Jako-bsson. 1998. Ammonia emissions from agriculture; summary of the Nordic seminar on ammonia emission, science and policy. Nutr Cycl Agroecosys 51:1–3.
Koelsch, R., B. Woodbury, D. Stenberg, D. Miller, and D. Schulte. 2002. Survey of hydrogen sulfide concentrations in vicin-ity of beef cattle feedlots. Proceedings of the Annual International Meeting of the American Society of Agricultural Engineers, Chicago, Illinois, July 28 to 31, 2002. Paper No. 02-4088.
Kroodsma, W., J. W. H. Huis in’t Veld, and R. Scholtens. 1993. Ammonia emissions and its reduction from cubicle house by flushing. Livest Prod Sci 35:293–302.
Kroodsma, W., R. Scholten, and J. W. H. Huis in’t Veld. 1988. Ammonia emissions from poultry housing systems. Pp. 7.1–7.13. Report 96: Proceedings of the CIGR Semi-nar on Storing, Handling, and Spreading of Manure and Municipal Waste, Uppsala, Sweden.
Lacey, R. E., J. S. Redwine, and C. B. Parnell, Jr. 2003. Particulate matter and ammonia emission factors for tunnel-ventilated broiler production houses in the southern U. S. Trans ASAE 46 (4): 1203–1214.
Laguë, C. 2003. Management practices to reduce greenhouse gas emissions from swine production systems. Adv Pork Prod 14:287–294.
Larry Coffey v. County of Otoe. S-06-921, Su-preme Court of Nebraska (2008).
Li, H. and H. Xin. 2010. Lab-scale assessment of gaseous emissions from laying-hen manure storage as affected by physical and environmental factors. Trans ASAE 53 (2): 593–604.
Li, H., H. Xin, R. T. Burns, S. J. Hoff, J. D. Harmon, L. D. Jacobson, and S. Noll. 2008a. Ammonia and PM emissions from a tom turkey barn in Iowa. ASABE Techni-cal Paper #08-4425. ASABE, St. Joseph, Michigan.
Li, H., H. Xin, R. T. Burns, and Y. Liang. 2008b. Reduction of ammonia emission from stored poultry manure using additives: Zeolite, Al+Clear, Ferix-3 and PLT. J App Poult Res 17 (4): 421–431.
Li, H., H. Xin, R. T. Burns, L. D. Jacobson, S. Noll, S. J. Hoff, J .D. Harmon, and J. A. Koziel. 2009. Ammonia and PM emissions from Midwest turkey barns. Trans ASABE (in review).
Liang, Y., H. Xin, H. Li, R. S. Gates, E. F. Wheeler, and K. D. Casey. 2006. Effect of measurement interval on estimation of am-monia emission rates for layer houses. Trans ASAE 49 (1): 183–186.
Lim, T. T., A. J. Heber, and J. Q. Ni. 1999. Odor emissions from commercial swine nurser-ies. Paper 994147, ASAE/CSAE Interna-tional Meeting, Toronto. ASAE, St. Joseph, Michigan.
Lim, T. T., A. J. Heber, J. Q. Ni, R. Duggirala, and C. A. Diehl. 1998. Production of carbon dioxide in a deep-pit swine finishing house. Paper 984049, ASAE International Meet-ing, Orlando, Florida. ASAE, St. Joseph, Michigan.
Lim, T. T., A. J. Heber, J. Q. Ni, A. L. Sutton, and P. Shao. 2003. Odor and gas release from anaerobic treatment lagoons from swine ma-nure. J Environ Qual 32:406–416.
Lockyer, D. R. and B. F. Pain. 1989. Ammonia emission from cattle, pig, and poultry wastes applied to pasture. Environ Pollut 56 (1989): 19–30.
Mackie, R. I., P. G. Stroot, and V. H. Varel. 1998. Biochemical identification and biological origin of key odor components in livestock waste. J Anim Sci 76:1331–1342.
Madden, N. M., R. J. Southard, and J. P. Mitchell. 2008. Conservation tillage reduces PM10 emissions in dairy forage rotations. Atmos Environ 42 (16): 3795–3808.
Malone, G., G. VanWicklen, and S. Collier. 2008. Efficacy of vegetative environmental buffers to mitigate emissions from tunnel-ventilated poultry houses. Pp. 27–29. Proceedings of the Mitigating Air Emissions from Animal Feeding Operations Conference, Des Moines, Iowa, May 19 to 21, 2008. E. Muhlbauer, L. Moody, and R. T. Burns (eds.). ISBN 978-0-9817781-0-5.
Manuzon, R. B., L. Y. Zhao, H. M. Keener, and M. J. Darr. 2007. An acid spray wet scrub-ber for absorbing ammonia emissions from exhaust fans of animal buildings. Trans ASABE 50 (4): 1395–1407.
McGinn, S. M., H. H. Janzen, and T. Coates. 2003. Atmospheric ammonia, volatile fatty acids, and other odorants near beef feedlots. J Environ Qual 32:1173–1182.
McGinn, S., T. Flesch, B. Crenna, K. Beauche-min, and T. Coates. 2007. Quantifying ammonia emissions from a cattle feedlot using a dispersion model. J Environ Qual 36:1585–1590.
Melse, R. W. and N. W. M. Ogink. 2005. Air scrubbing techniques for ammonia and odor reduction at livestock operations: Review of on-farm research in the Netherlands. Trans ASABE 48 (6): 2303–2313.
Menneer, J. C., S. Ledgard, C. Ledgard, C. McLay, and W. Silvester. 2005. Animal treading stimulates denitrification in soil under pasture. Soil Biol Biochem 37:1625–1629.
Midwest Plan Service. 1990. Mechanical Venti-lating Systems for Livestock Housing. Iowa State University, Ames, Iowa, MWPS-32, ISBN 0-89373-075-0.
Milhollin, R., 2010. Permitting Animal Feeding Operations in Missouri: Local Restriction, http://agebb.missouri.edu/commag/permit/restrictions.asp (23 August 2010)
Miller, D. and E. Berry. 2005. Cattle feedlot soil moisture and manure content: I. Impacts on greenhouse gases, odor compounds, nitrogen losses, and dust. J Environ Qual 34:644–655.
Mitloehner, F. M. and M. S. Calvo. 2008. Worker health and safety in concentrated animal feeding operations. J Agric Saf Health 14:163–187.
23COUNCIL FOR AGRICULTURAL SCIENCE AND TECHNOLOGY
Moiser, A. R., J. M. Duxbury, J. R. Freney, O. Heinemeyer, K. Minami, and D. E. Johnson. 1998. Mitigating agricultural emissions of methane. Clim Change 40:39–80.
National Research Council. 2003. Air Emissions from Animal Feeding Operations: Current Knowledge, Future Needs. National Acad-emies Press, Washington, D.C. 263 pp.
Ndegwa, P. 2009. Important Air Emissions from Dairy Operations vis-à-vis the Prevailing Federal Statutes. Report submitted to Wash-ington State Dairy Federation.
Ni, J. Q., C. Vinckier, J. Hendriks, and J. Coene-grachts. 1999. Production of carbon dioxide in a fattening pig house under field condi-tions. II. Release from the manure. Atmos Environ 33:3697–3703.
Ni, J. Q., A. J. Heber, C. A. Diehl, and T. T. Lim. 2000. Ammonia, hydrogen sulphide and carbon dioxide release from pig manure in under-floor deep pits. J Agric Eng Res 77:53–66.
Ni, J. Q., A. J. Heber, C. A. Diehl, T. T. Lim, R. K. Duggirala, and B. L. Haymore. 2002a. Characteristics of hydrogen sulphide con-centrations in mechanically ventilated swine buildings. Can Biosys Eng 44:6.11–6.19.
Ni, J. Q., A. J. Heber, C. A. Diehl, T. T. Lim, R. K. Duggirala, and B. L. Haymore. 2002b. Summertime concentrations and emissions of hydrogen sulfide at a mechanically venti-lated swine finishing building. Trans ASAE 45:193–199.
Ni, J. Q., A. J. Heber, T. T. Lim, C. A. Diehl, R. K. Duggirala, and B. L. Haymore. 2002c. Hydrogen sulphide emission from two large pig-finishing buildings with long-term high-frequency measurements. J Agric Sci 138:227–236.
Nicholson, F. A., B. J. Chambers, and A. W. Walker. 2004. Ammonia emissions from broiler litter and laying hen manure manage-ment systems. Biosyst Eng 89 (2): 175–185.
Osada, T., H. B. Ram, and P. Dahl. 1998. Con-tinuous measurement of nitrous oxide and methane emission in pig units by infrared photoacoustic detection. Trans ASAE 41 (4): 1109–1114.
Owens et al. v. ContiGroup Companies et al. 16th Judicial Circuit Court (Jackson County, Missouri), 02CV235322 (not yet on file).
Pain, B. F., C. R. Clarkson, V. R. Phillips, J. V. Klareneek, T. H. Misselbrook, and M. Bruins. 1991. Odour emission arising from application of livestock slurries on land: Measurements following spreading using a micrometeorological technique and olfac-tometry. J Agric Eng Res 48:101–110.
Parker, D., K. Casey, N. A. Cole, J. Sweeten, B. Auvermann, M. Rhoades, S. Mukhtar, and R. Todd. 2005. Hydrogen Sulfide Emissions from Open-Lot Beef Cattle Feedyard Pens and Ponds. White paper presented to the Industry Advisory Committee of USDA-CSREES. Special Research Grant 2005-34466-15703.
Parnell, C. B. Jr., B. W. Shaw, and B. W. Auver-mann. 1999. Agricultural Air Quality Fine Particle Project—Task 1: Livestock-Feedlot PM Emission Factors and Emissions Inventory Estimates. Final project report to the Texas Natural Resource Conservation
Commission. Department of Agricultural Engineering, Texas A&M University, Col-lege Station, Texas.
Perschbacher-Buser, Z., D. Parker, K. Casey, G. Green, E. Caraway, and M. Rhoades. 2007. Quantification of ambient p-cresol concentrations downwind of beef cattle feedyards. Paper presented at the Interna-tional Symposium on Air Quality and Waste Management for Agriculture, Broomfield, Colorado, September 16 to 19, 2007.
Pinder, R. W., P. J. Adams, and S. N. Pandis. 2007. Ammonia emission controls as a cost-effective strategy for reducing atmospheric particulate matter in the eastern United States. Environ Sci Technol 41:380–386.
Pitesky, M. E., K. R. Stackhouse, and F. M. Mit-loehner. 2009. Clearing the air: Livestock’s contribution to climate change. Adv Agron 103:3–36.
Pope, C. A. III, M. Ezzati, and D. W. Dockery. 2009. Fine-particulate air pollution and life expectancy in the United States. N Engl J Med 360:376–386.
Powers, W. J., A. C. Wilkie, H. H. Van Horn, and R. A. Nordstedt. 1997. Effects of hydraulic retention time on performance and effluent odor of conventional and fixed-film anaero-bic digesters fed dairy manure wastewaters. Trans ASAE 40 (5): 1449–1455.
Radcliffe, J. S., B. T. Richert, D. M. Sholly, K. A. Foster, B. Hollas, T. T. Lim, J. Q. Ni, A. J. Heber, and A. L. Sutton. 2008. Diet modi-fication to reduce odors, gas emissions and nutrient excretions from swine operations. Proceedings of Mitigating Air Emissions from Animal Feeding Operations cd, Des Moines, Iowa, May 19 to 21, 2008.
Razote, E. B., R. G. Maghirang, B. Z. Predicala, J. P. Murphy, B. W. Auvermann, J. P. Harner III, and W. L. Hargrove. 2006. Laboratory evaluation of the dust-emission potential of cattle feedlot surfaces. Trans ASABE 49 (4): 1117–1124.
Ritz, C. W., B. W. Mitchell, B. D. Fairchild, M. Czarick III, and J. W. Worley. 2008. Dust and ammonia control in poultry production facilities using an electrostatic space charge system. Pp. 47–50. Proceedings of the Mitigating Air Emissions from Animal Feed-ing Operations Conference, Des Moines, Iowa, May 19 to 21, 2008. E. Muhlbauer, L. Moody, and R. T. Burns (eds.). ISBN 978-0-9817781-0-5.
Roberts, S. A., H. Xin, B. J. Kerr, J. R. Russell, and K. Bregendahl. 2007. Effects of dietary fiber and low crude protein on ammonia emission from laying-hen manure. Poul Sci 86:1716–1725.
Rogge, W., P. Medeiros, and B. Simoneit. 2006. Organic marker compounds for surface soil and fugitive dust from open lot dairies and cattle feedlots. Atmos Environ 40 (1): 27–49.
Safley, L. M. and M. E. Casada. 1992. Global Methane Emissions from Livestock and Poultry Manure. U.S. Environmental Protection Agency, Report 400/1-92/048, Washington, D.C.
Schmidt, D. R., L. D. Jacobson, and K. A. Janni. 2002. Continuous monitoring of ammonia, hydrogen sulfide and dust emissions from
swine, dairy and poultry barns. ASAE Paper No. 024060. ASAE, St. Joseph, Michigan.
Seedorf, J., J. Hartung, M. Schroder, K. M. Linkert, V. R. Phillips, M. R. Holden, R. W. Sneath, J. L. Short, R. P. White, and S. Ped-ersen. 1998. Concentrations and emissions of airborne endotoxins and microorganisms in livestock buildings in northern Europe. J Agric Eng Res 70 (1): 97–109.
Seifert, R. L., J. R. Scudlark, A. G. Potter, K. A. Simonsen, and K. B. Savidge. 2004. Characterization of atmospheric ammonia emission from a commercial chicken house on the Delmarva Peninsula. Environ Sci Technol 38:2769–2778.
Shah, S. B., P. W. Westerman, R. D. Munilla, M. E. Adcock, and G. R. Baughman. 2008. Design and evaluation of a regenerating scrubber for reducing animal house emis-sions. Trans ASABE 51 (1): 243–250.
Sharpe, R. R. and L. A. Harper. 2002. Nitrous oxide and ammonia fluxes in a soybean field irrigated with swine effluent. J Environ Qual 31:524–532.
Shaw, S. L., F. M. Mitloehner, W. Jackson, E. J. DePeters, J. G. Fadel, P. H. Robinson, R. Holzinger, and A. H. Goldstein. 2007. Volatile organic compound emissions from dairy cows and their waste as measured by proton-transfer-reaction mass spectrometry. Environ Sci Technol 41:1310–1316.
Snell, H. G. J., F. Seipelt, and H. F. A. Van den Weghe. 2003. Ventilation rates and gaseous emissions from naturally ventilated dairy houses. Biosys Eng 8 (1): 67–73.
Sommer, S. G. and H. B. Moller. 2000. Emis-sion of greenhouse gases during com-posting of deep litter from pig produc-tion—Effect of straw content. J Agric Sci 134:327–335.
Steinfeld, H., P. Gerber, T. Wassenaar, V. Caster, M. Rosales, and C. de Haan. 2006. Live-stock’s Long Shadow. Food and Agriculture Organization of the United Nations, http://www.fao.org/docrep/010/a0701e/a0701e00.htm (12 November 2010)
Stowell, R. R., S. Foster, H. Keener, and D. Elwell. 2000. Ammonia emissions from a high-rise swine finishing facility. Paper presented at the ASAE International Meet-ing, Milwaukee, Wisconsin. Paper 004080. ASAE, St. Joseph. Michigan.
Sunesson, A-L., J. Gullberg, and G. Blomquist. 2001. Airborne chemical compounds on dairy farms. J Environ Monitor 3:210–216.
Sweeten, J. M., C. B. Parnell, R. S. Etheredge, and D. Osborne. 1988. Dust emissions in cattle feedlots. Vet Clin N Am: Food Anim Prac 4 (3): 557–578.
Takai, H., S. Pedersen, J. O. Johnsen, J. H. M. Metz, P. W. G. Groot Koerkamp, G. H. Uenk, V. R. Phillips, M. R. Holden, R. W. Sneath, J. L. Short, R. P. White, J. Hartung, J. Seedorf, M. Schröder, K. H. Linkert, and C. M. Wathes. 1998. Concentrations and emissions of airborne dust in livestock buildings in northern Europe. J Agric Eng Res 70:59–77.
Thompson, R. B. and J. J. Meisinger. 2001. Mea-surement and management of ammonia vol-atilization from dairy slurries. Proceedings of the International Symposium Addressing
24 COUNCIL FOR AGRICULTURAL SCIENCE AND TECHNOLOGY
CAST Member Societies, Companies, and Nonprofit OrganizationsAMERICAN ACADEMY OF VETERINARY AND COMPARATIVE TOXICOLOGY/AMERICAN BOARD OF VETERINARY TOXICOLOGY n AMERICAN ASSOCIATION OF AVIAN PATHOLOGISTS n AMERICAN ASSOCIATION OF BOVINE PRACTITIONERS n AMERICAN ASSOCIATION OF PESTICIDE SAFETY EDUCATORS n AMERICAN BAR ASSOCIATION, SECTION OF ENVIRONMENT, ENERGY, & RESOURCES–AGRICULTURAL MANAGEMENT n AMERICAN DAIRY SCIENCE ASSOCIATION n AMERICAN FARM BUREAU FEDERATION n AMERICAN FORAGE AND GRASSLAND COUNCIL n AMERICAN MEAT SCIENCE ASSOCIATION n AMERICAN METEOROLOGICAL SOCIETY, COMMITTEE ON AGRICULTURAL AND FOREST METEOROLOGY n AMERICAN SOCIETY FOR NUTRITION n AMERICAN SOCIETY OF AGRICULTURAL AND BIOLOGICAL ENGINEERS n AMERICAN SOCIETY OF AGRONOMY n AMERICAN SOCIETY OF ANIMAL SCIENCE n AMERICAN SOCIETY OF PLANT BIOLOGISTS n AMERICAN VETERINARY MEDICAL ASSOCIATION n AQUATIC PLANT MANAGEMENT SOCIETY n COUNCIL OF ENTOMOLOGY DEPARTMENT ADMINISTRATORS n CROPLIFE AMERICA n ELANCO ANIMAL HEALTH • IOWA SOYBEAN ASSOCIATION n LAND O’LAKES n MONSANTO n NATIONAL CATTLEMEN’S BEEF ASSOCIATION n NATIONAL PORK BOARD n NORTH CENTRAL WEED SCIENCE SOCIETY n NORTHEASTERN WEED SCIENCE SOCIETY n NOVUS INTERNATIONAL, INC. n PIONEER, A DUPONT BUSINESS n POULTRY SCIENCE ASSOCIATION n SOCIETY FOR IN VITRO BIOLOGY n SOCIETY OF NEMATOLOGISTS n SYNGENTA CROP PROTECTION, INC. n THE FERTILIZER INSTITUTE n UNITED SOYBEAN BOARD n WEED SCIENCE SOCIETY OF AMERICA n WESTERN SOCIETY OF WEED SCIENCE
The mission of the Council for Agricultural Science and Technology (CAST) is to assemble, interpret, and communicate credible science-based information regionally, nationally, and internationally to legislators, regulators, policymakers, the media, the private sector, and the public. CAST is a nonprofit organization com-posed of scientific societies and many individual, student, company, nonprofit, and associate society members. CAST’s Board is composed of representatives of the scien-tific societies, commercial companies, nonprofit or trade organizations, and individual members, and an Executive Committee. CAST was established in 1972 as a result of a meeting sponsored in 1970 by the National Academy of Sciences, National Research Council. ISSN 1070-0021
Additional copies of this Issue Paper are available from CAST. Linda M. Chimenti, Chief Operating Officer. http://www.cast-science.org.
Citation: Council for Agricultural Science and Technology (CAST). 2011. Air Issues Associated with Animal Agriculture: A North American Perspective. Issue Paper 47. CAST, Ames, Iowa.
Animal Production and Environmental Issues, Raleigh, North Carolina, October 3 to 5, 2001. North Carolina State University, Raleigh, North Carolina (on CD-ROM).
Thompson, R. B. and J. J. Meisinger. 2002. Management factors affecting ammonia volatilization from land-applied cattle slurry in the Mid-Atlantic USA. J Environ Qual 31:1329–1338.
Todd, R., and N. A. Cole. 2007. Ammonia emis-sions from a beef cattle feedyard using flux-gradient, integrated horizontal flux, backward Lagrangian stochastic modeling, mass balance, and nitrogen/phosphorus ratio methods. In J. M. Sweeten et al. Air Quali-ty: Odor, Dust, and Gaseous Pollutants from Concentrated Animal Feeding Operations in the Southern Great Plains. Annual progress report submitted to USDA-CSREES. Spe-cial Grant No. 2006-34466-17434.
Todd, R., N. A. Cole, R. N. Clark, T. Flesch, L. Harper, and B. H. Baek. 2008. Ammonia emissions from a beef cattle feedyard on the southern High Plains. Atmos Environ 42 (28): 6797–6805.
Ulmer, A. and R. Massey. 2006. Animal Feeding Operations and Residential Land Value. University of Missouri Extension Guide MP748. July.
United Egg Producers. 2010. United Egg Produc-ers Animal Husbandry Guidelines for US Egg Laying Flocks, http://www.uepcertified.com/media/pdf/UEP-Animal-Welfare-Guidelines.pdf (September 2010).
U.S. Environmental Protection Agency (USEPA). 1985. AP-42: Compilation of Air Pollut-ant Emission Factors, Volume I: Station-ary Point and Area Sources. 4th ed. Pp. 6.15–3. Office of Air Quality Planning and
Standards, Research Triangle Park, North Carolina.
U.S. Environmental Protection Agency (USEPA). 2005. Consent Agreement and Final Order, http://www.epa.gov/compliance/resources/agreements/caa/cafo-agr-050121.pdf (25 March 2011)
U.S. Environmental Protection Agency (USEPA). 2006a. Animal Feeding Operations Air Quality Compliance Agreement Fact Sheet, http://www.epa.gov/compliance/resources/agreements/caa/cafo-infosht-0309.html (30 January 2006).
U.S. Environmental Protection Agency (USEPA). 2006b. Unpaved roads. Chapter 13.2.2 in AP-42: Compilation of Emission Factors. Re-search Triangle Park, United States Environ-mental Protection Agency. Updated November 1, http://www.epa.gov/ttn/chief/ap42/ch13/final/c13s0202.pdf (15 October 2008).
U.S. Environmental Protection Agency (USEPA). 2008. 2009–2014 EPA Strategic Plan Change Document. September 30, 2008.
U.S. Environmental Protection Agency (USEPA). 2009a. Mandatory reporting of greenhouse gases: Final rule. Federal Register 74 (209): 56260–56519, October 30, 2009. National Archives and Records Administration, Washington, D.C.
U.S. Environmental Protection Agency (USE-PA). 2009b. Animal Feeding Operations: Overview, http:cfpub.epa.gov/npdes/home.cfm?program_id=7 (18 September 2009)
U.S. Environmental Protection Agency (USEPA). 2010. Inventory of U.S. Greenhouse Gas Emissions and Sinks: 1990–2008. April 15, 2010.
Waterkeeper Alliance et al. v. EPA, 399 F.3d 486 (2d Cir. 2004).
Wathes, C. M., M. R. Holden, R. W. Sneath, R. P. White, and V. R. Phillips. 1997. Concentra-tions and emission rates of aerial ammonia, nitrous oxide, methane, carbon dioxide, dust, and endotoxin in U.K. broiler and layer houses. Brit Poul Sci 38 (1): 14–28.
Westerman, P. W., J. R. Bicudo, and A. Kantard-jieff. 2000. Upflow biological aerated filters for the treatment of flushed swine manure. Biores Technol 74:181–190.
Wheeler, E. F., K. D. Casey, R. S. Gates, H. Xin, J. L. Zajaczkowski, P. A. Topper, Y. Liang, and A. J. Pescatore. 2006. Ammonia emis-sions from twelve U.S.A. broiler chicken houses. Trans ASAE 49 (5): 1495–1512.
Wulf, S., M. Maeting, and J. Clemens. 2002. Application technique and slurry co-fermen-tation effects on ammonia, nitrous oxide, and methane emissions after spreading: II. Greenhouse gas emissions. J Environ Qual 31:1795–1801.
Yang, P., J. C. Lorimor, and H. Xin. 2000. Nitrogen losses from laying hen manure in commercial high-rise layer facilities. Trans ASAE 43 (6): 1771–1780.
Zahn, J. A., J. L. Hatfield, Y. S. Do, and A. A. DiSpirito. 2001. Functional classification of swine manure management systems based on effluent and gas emission characteristics. J Environ Qual 30:635–647.
Zhao, L., T. T. Lim, A. J. Heber, H. Sun, C. A. Diehl, J.-Q. Ni, P. C. Tao, and S. M. Hanni. 2005. Particulate matter emissions from a Ohio belt-battery layer barn. ASAE Paper No. 054010. ASAE, St. Joseph, Michigan.
Zhu, J., L. Jacobson, D. Schmidt, and R. Nicolai. 2000. Daily variations in odor and gas emis-sions from animal facilities. Appl Eng Agric 16:153–158.