Embed Size (px)
Citation preview

AIR POLLUTION AND CLIMATOLOGY GEOG/ENST 3331 – Lecture 11 Ahrens: Chapter 18; A&B: Chapter 14; Turco: Chapter 5

Assignment 5
¨ What gas is the major form of carbon in the atmosphere? What are the two main sinks for removing this carbon from the atmosphere?
¨ How is the hydrologic cycle linked to other biogeochemical cycles discussed in class? In other words, how would they be affected if the hydrologic cycle were interrupted?

Last week
¨ Reservoirs ¤ Box models and fluxes
¨ Global chemical cycles ¤ Water ¤ Carbon ¤ Oxygen ¤ Nitrogen ¤ Sulfur

John Evelyn, 1661 Fumifugium, or, The inconveniencie of the aer and smoak of London dissipated together

Air Pollution
¨ Sources and receptors ¨ Dispersion ¨ Climate and pollutants ¨ Case study
Pollutants
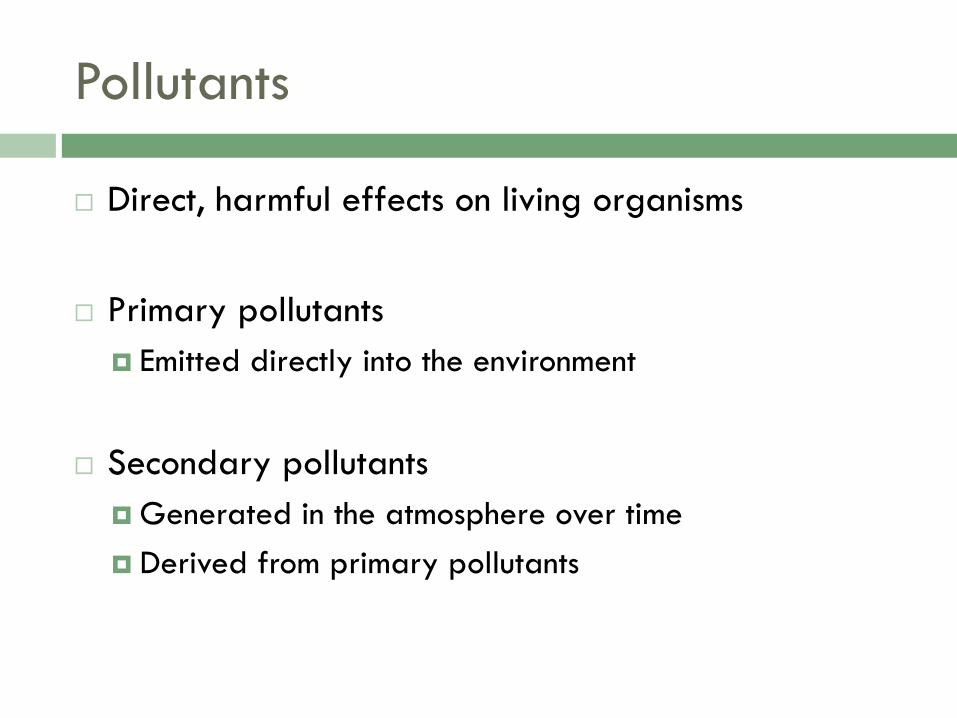
¨ Direct, harmful effects on living organisms
¨ Primary pollutants ¤ Emitted directly into the environment
¨ Secondary pollutants ¤ Generated in the atmosphere over time ¤ Derived from primary pollutants

Primary pollutants
Pollutant Full Name Sources
CO Carbon Monoxide Combustion
SO2 Sulfur dioxide Coal, oil, smelters, refineries, paper mills
NOx Nitrogen oxides Vehicles, power plants, waste disposal
VOCs Volatile organic compounds
Industrial processes, vehicles
PM Particulate matter Industrial processes, vehicles

Industrial Sources 64%
Energy 29%
Vehicles 7%
Major SOx Sources
Source: Environment Canada National Pollutant Release Inventory

Industrial 30%
Electricity and
Residential 14%
Vehicles 56%
Major NOx Sources
Source: Environment Canada National Pollutant Release Inventory

Industrial 16%
Electricity and Residential
9%
Vehicles 75%
Major CO Sources
Source: Environment Canada National Pollutant Release Inventory

Industrial 32%
Electricity and
Residential 8%
Vehicles 25%
Other 21%
Open Sources 14%
Major VOC Sources
Source: Environment Canada National Pollutant Release Inventory
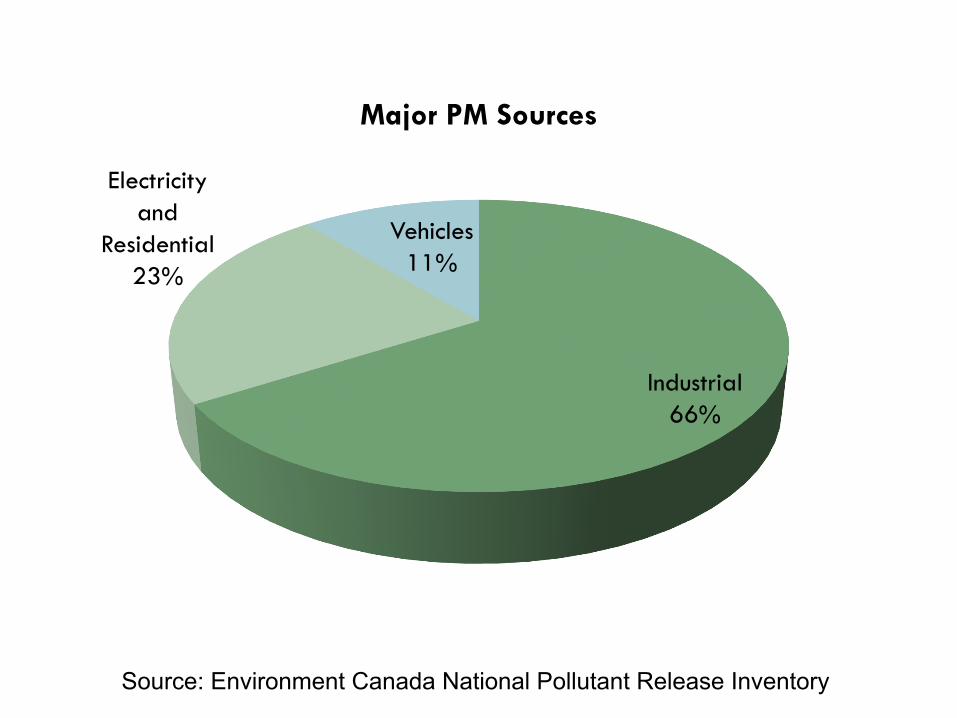
Industrial 66%
Electricity and
Residential 23%
Vehicles 11%
Major PM Sources
Source: Environment Canada National Pollutant Release Inventory

0
500,000
1,000,000
1,500,000
2,000,000
2,500,000
3,000,000
3,500,000
4,000,000
1985 1989 1993 1997 2001 2005 2009
Ann
ual E
mis
sion
s in
Ton
nes
Primary Pollutants
TPM SOx NOx VOC
Source: Environment Canada National Pollutant Release Inventory

Secondary pollutants
Pollutant Full Name Source
O3 Ozone NOx, VOCs
Smog O3, SO2
PM Particulate matter Primary pollutants
VOCs Volatile organic compounds Primary pollutants

Characterizing Sources
¨ Point source ¤ Localized, e.g. smokestack
n SOx
¨ Distributed source ¤ Relatively large, continuous, e.g. agriculture, landfill
n VOCs
¤ Cluster of point sources, e.g. road network n Nox
¤ Is Thunder Bay a Point source or Distributed source?

Characterizing Receptors
¨ Areas receiving pollutants ¨ Impacts depend on
¤ Vulnerability ¤ Concentration and total amount of pollutant
received n Size n Distance from source n Dispersal of pollutant
¨ Role of atmospheric processes

Pollutant dispersion
¨ “The solution to pollution is dilution” ¨ Contributing processes:
¤ Diffusion, Turbulence, Advection, Convection
Diffusion ¨ “Drunken walk” – Random movement of gas molecules
¨ Spatial distribution of a gas in the air becomes more uniform as time passes

Diffusion
¨ Movement of a gas molecule through the air is random ¤ “Drunken walk” ¤ The net distance that a gas molecule travels away from
the starting point increases as time passes
¨ The spatial distribution of a gas in the air becomes more uniform as time passes

Eight random walks from zero
Source: Chemistry Daily
time

Horizontal dispersal: advection
¨ Long range transport via winds ¨ Faster winds increases horizontal dispersal
¤ Also increases turbulent mixing
Ahrens: Figure 18.11

Vertical dispersal: Turbulence
¨ Atmospheric turbulence (eddies) contributes vertical mixing
¨ Caused by friction ¤ Greater surface roughness means greater turbulence
¨ Pollutants disperse faster if turbulence aids diffusion
A&B: Fig. 3-13

Effect of chimney height
¨ Faster winds ¤ Pollutants carried farther, sooner ¤ Pollutants disperse more rapidly
¨ Farther away from surface ¤ More time before surface receptors are affected
n Greater distance travelled n Lower received concentration
¤ “Superstacks” –answer to Sudbury’s pollution problem?

Tall stacks
H&K: Figure 8.19

Vertical dispersal: Convection
¨ Vertical mixing driven by surface heating ¨ Creates a ‘mixed layer’ of air near the surface ¨ Varies with surface temperature and atmospheric
stability
Ahrens: Fig. 9.12

Atmospheric stability
¨ Unstable conditions enhance vertical mixing
¨ Stable conditions suppress vertical mixing

Atmospheric Stability
¨ Dry adiabatic lapse rate ¤ 10°C/km
¨ Saturated adiabatic lapse rate ¤ 5-6°C/km
¨ Environmental conditions

q Inversions common at night
q The smoke does not mix well and follows the prevailing wind.
q ‘Fanning’
q ‘Pooling’ if insufficient wind
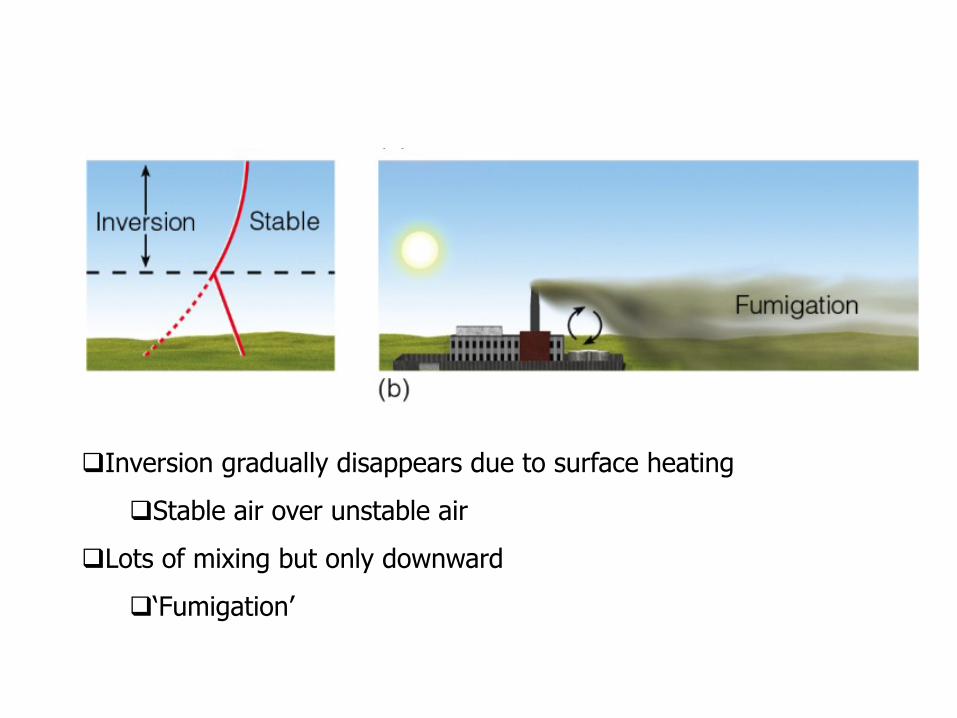
q Inversion gradually disappears due to surface heating
q Stable air over unstable air
q Lots of mixing but only downward
q ‘Fumigation’

q Temperature structure is unstable throughout.
q Distribution of smoke follows convective cells.
q ‘Looping’

q Mixing leads to neutral stability
q Distribution of smoke in a narrow cone.
q ‘Coning’

q Inversion gradually re-appears due to surface cooling q Unstable (or neutral) air above stable air q Downward mixing is suppressed
q ‘Lofting’

Ahrens: Figure 18.12
¨ Importance of the location and height of the smoke stack.
¨ A lower stack causes fanning or pooling of pollutants.
¨ Higher stacks cause lofting and pollution does not penetrate to surface levels.

Ground plumes
¨ Many pollutant sources are at ground level ¨ Height of plume depends on distance and stability ¨ Can be a serious problem for toxic pollutants
¤ E.g. CO
Industrial 16%
Energy 9%
Vehicles 75%
Major CO Sources

Country breeze ¨ Urban heat island
¤ Cities retain more heat than surroundings
¤ Induces a ‘country breeze’ at night
¨ Focuses pollutants and causes increase in vertical extent
Ahrens: Fig. 18.16

Mountain breeze
Ahrens: Figure 18.16 Ahrens: Figure 9.18

Subsidence inversion
¨ Warm air is less dense ¨ Lee side wind may be
unable to push aside cold air

Marine inversion
Sea breeze brings in cool air underlying rising warm air
Ahrens:
Ch. 5, Fig. 1

Los Angeles: the Bay of Smoke
Turco: Fig. 5.12

Case Study: Five days in Donora
¨ City in Pennsylvania ¨ 1948: population 14 000 ¨ “Mill town”
¤ Steel, zinc smelters ¤ High emissions of SO2, NOx, F

Persistent high pressure system for 5 consecutive days in 1948
Weak pressure gradients and light winds
Donora, Pennsylvania
High pressure in Donora
¨ Descending air ¤ Traps pollutants near the surface ¤ Low horizontal winds near the centre
¨ Clear conditions ¤ Promotes radiative heating and night-time cooling
¨ Fog formed morning of first day ¤ Valley location didn’t help; extra cool air at night ¤ Blocked sunlight from reaching surface and prolonged
temperature inversion

Ahrens: Figure 18.13
Inversion layer

High pressure in Donora
¨ Factories continued operation ¤ SO2 and particulates
¨ Toxic fog got thicker and thicker over five day period
¨ 22 deaths in community of 14 000 ¨ Finally, storm cleared the air
¨ 10 years later, still experienced higher than normal mortality rates

Next lecture
¨ Air quality
¨ Ahrens: Chapter 18 ¨ A&B: Chapter 14 ¨ Turco: Chapter 5