Embed Size (px)
Citation preview
Air Quality Factorsin the Ocean SAMP
John Merrill,URI GSO
February 2, 2010
1 / 15
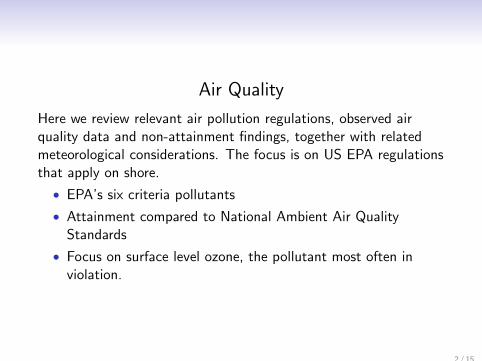
Air Quality
Here we review relevant air pollution regulations, observed airquality data and non-attainment findings, together with relatedmeteorological considerations. The focus is on US EPA regulationsthat apply on shore.
• EPA’s six criteria pollutants
• Attainment compared to National Ambient Air QualityStandards
• Focus on surface level ozone, the pollutant most often inviolation.
2 / 15
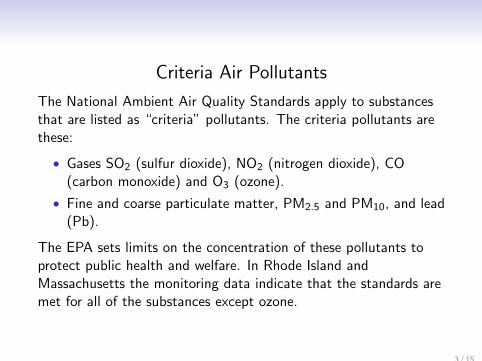
Criteria Air Pollutants
The National Ambient Air Quality Standards apply to substancesthat are listed as “criteria” pollutants. The criteria pollutants arethese:
• Gases SO2 (sulfur dioxide), NO2 (nitrogen dioxide), CO(carbon monoxide) and O3 (ozone).
• Fine and coarse particulate matter, PM2.5 and PM10, and lead(Pb).
The EPA sets limits on the concentration of these pollutants toprotect public health and welfare. In Rhode Island andMassachusetts the monitoring data indicate that the standards aremet for all of the substances except ozone.
3 / 15
The NAAQS 8-hour standard for surface O3 is met if the 3-yearaverage of the fourth highest daily maximum 8-hour averagemixing ratio at each monitoring site does not exceed 0.075 ppm.
Note that the maximum values are not regulated. At eachmonitoring site the three highest 8-hour average values are notedbut do not constitute a violation. Also, peak 1-hour values andlonger-term average values are not regulated.
4 / 15
Surface ozone mixing ratios have been declining in recent years inresponse to regulatory measures. Nevertheless, Rhode Islandremains a moderate non-attainment area. Here are some findingsabout surface ozone in Rhode Island.
• The standard is not met at any of the three monitoring sites.
• The ozone mixing ratio varies in time in a way that differsamong the monitoring sites.
• This variation is informative in the context ofon-shore/off-shore variations.
Also, the EPA has proposed strengthening the standard for ozoneto make it consistent with the recommendations of its panel ofadvisors. This change will make meeting the standard morechallenging.
5 / 15
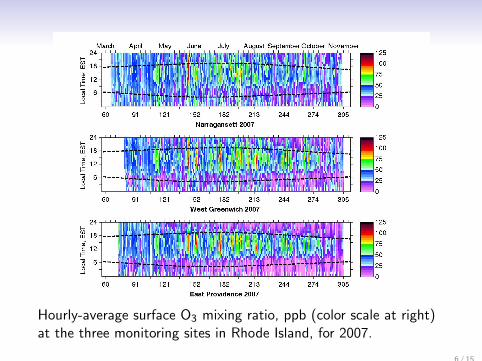
Hourly-average surface O3 mixing ratio, ppb (color scale at right)at the three monitoring sites in Rhode Island, for 2007.
6 / 15
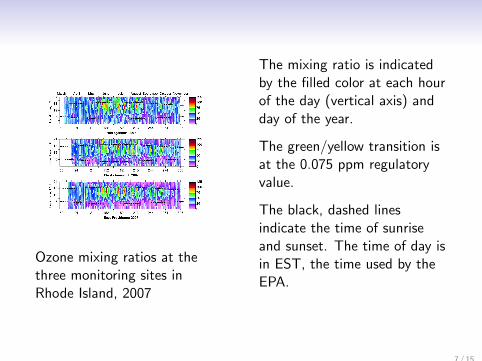
Ozone mixing ratios at thethree monitoring sites inRhode Island, 2007
The mixing ratio is indicatedby the filled color at each hourof the day (vertical axis) andday of the year.
The green/yellow transition isat the 0.075 ppm regulatoryvalue.
The black, dashed linesindicate the time of sunriseand sunset. The time of day isin EST, the time used by theEPA.
7 / 15
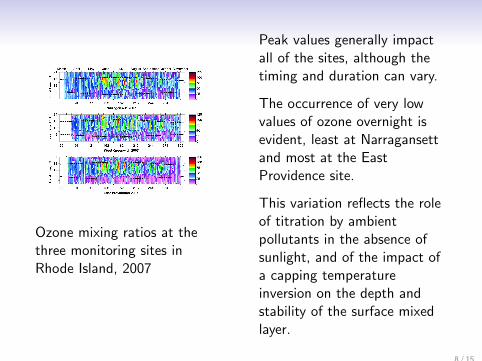
Ozone mixing ratios at thethree monitoring sites inRhode Island, 2007
Peak values generally impactall of the sites, although thetiming and duration can vary.
The occurrence of very lowvalues of ozone overnight isevident, least at Narragansettand most at the EastProvidence site.
This variation reflects the roleof titration by ambientpollutants in the absence ofsunlight, and of the impact ofa capping temperatureinversion on the depth andstability of the surface mixedlayer.
8 / 15
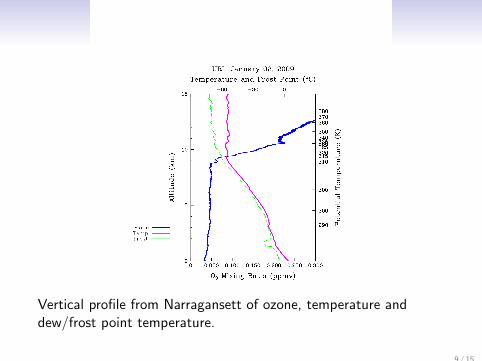
Vertical profile from Narragansett of ozone, temperature anddew/frost point temperature.
9 / 15
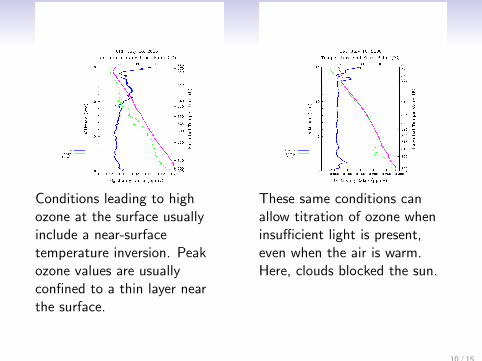
Conditions leading to highozone at the surface usuallyinclude a near-surfacetemperature inversion. Peakozone values are usuallyconfined to a thin layer nearthe surface.
These same conditions canallow titration of ozone wheninsufficient light is present,even when the air is warm.Here, clouds blocked the sun.
10 / 15
The following are factors that we have not considered in our work.
• Emission of pollutants by fixed (land-based) energyproduction facilities will likely be reduced when there is asubstantial capacity of renewable energy sources, because ofdecreased utilization of fossil fuel sources.
• Accurate estimation of the likely reduction of emissions isdifficult for several reasons: energy generating facilities arewidely distributed, and a number of factors contribute todecisions about their utilization.
11 / 15
Preparation for and installation of offshore turbine facilities willconstitute large-scale industrial operations, requiring air-pollutantemissions permits.
• There are no off-shore air quality monitoring sites in southernNew England.
• It is assumed that near-shore conditions are similar to those atthe coastal monitoring sites (e.g. Narragansett).
• Surface ozone variations are known to be controlled byregional transport patterns, with major sources of ozone andozone precursors carried here by the prevailing south-westerlysurface level winds.
• Ozone precursors (NOx and VOCs) emitted in offshoreoperations will contribute to the regional ozonenonattainment.
12 / 15
Emissions estimates for vessels and other equipment to be used insite preparation and construction are required as part of thepermitting process.
• These estimates depend upon the types of equipment to beused, how the work is distributed in time and other factorsthat can only be determined together with project plans.
• Permitting involves State interests, as the emissions will becounted in the context of the State Implementation Plan.This is an agreement directed at bringing the state intocompliance with the NAAQS.
13 / 15
Meteorology
Meteorological factors, not limited to the available wind energyresource, have relevance to the Ocean SAMP effort. I list thesefactors here, but will not present results on them at this time.
• Occurrence of disturbances - winter storms and gales, tropicalstorms and hurricanes.
• Precipitation - occurrence frequency and variability.
• Occurrence of fog; occurrence of icing conditions.
These phenomena have an impact on the design of facilities, andon their installation and maintenance. Despite their familiarity tothose working in the marine environment in Southern New England,data on these factors need to be included in the SAMP report.
14 / 15

∼ Finis ∼
15 / 15