Embed Size (px)
Citation preview

Air Quality Impact AnalysisAir Quality Impact Analysis
1. Establish a relationship between emissions and air quality.
AQpast = a EMpast + b
2. A change in emissions results in an air quality impact.
AQfuture = a EMfuture + b
3. However, for some pollutants, air quality is a complicated function of meteorology and chemistry.

Case 1: No Chemistry, Widespread Case 1: No Chemistry, Widespread SourceSource
Use Linear Rollback
Pollutants– CO– Diesel particulate matter– Benzene - reacts very slowly

Case 2: No Chemistry, Case 2: No Chemistry, Variety of SourcesVariety of Sources
Use Chemical Mass Balance Model– Trace metals identify source
contributions for organic carbon and elemental carbon
Use Meteorological Analyses– Identify source areas for dust, organic
carbon, and elemental carbon

Bakersfield PM SourcesBakersfield PM Sources
0%
20%
40%
60%
80%
100%
Fra
ctio
n (
%)
Unexplained
Nitrate
Sulfate
Construction
Primary Crude Oil
Vegetative Burning
Primary MV
Geological
PM10 PM2.5 PM2.5PM10
Annual 24-Hour

Case 3: Linear Chemistry, Case 3: Linear Chemistry, Single PrecursorSingle Precursor
Verify Linear Rollback– Trace metals identify source contributions– Meteorological analyses identify source areas
Pollutants– Nitrates - correlate to NOX, assume sufficient NH3
– Sulfates - correlate to SOX, assume sufficient oxidant
– Secondary organic carbon - estimate with conversion factors for aromatics and high-weight alkanes
– 1,3-Butadiene -check for loss rate proportional to O3
– HCHO, CH3CHO - compare to O3 for chemical formation estimate
– NO2 - correlate to NOX

California NOCalifornia NO22 and NO and NOXX
0
0.01
0.02
0.03
0.04
0.05
0.06
0.07
1982
1983
1984
1985
1986
1987
1988
1989
1990
1991
1992
1993
1994
1995
1996
Me
an
An
nu
al N
O2
0.00
0.05
0.10
0.15
0.20
0.25
Me
an
An
nu
al S
um
me
r N
Ox
Mean Annual NO2-Southern California Mean Annual NOx-Downtown LA

Trends for Los AngelesTrends for Los AngelesAnnual Top30 MeanAnnual Top30 Mean
0
5
10
15
20
25
30
77 79 81 83 85 87 89 91 93
Mid-Year of 3-year Moving Mean Period
[NO
x] o
r [S
O2]
(pph
m)
05101520253035404550
[NO
3] o
r [S
O4]
(ug/
m3 )
NOx
SO2
NO3
SO4

Trends for BakersfieldTrends for BakersfieldAnnual Top30 MeanAnnual Top30 Mean
0
5
10
15
20
25
78 80 82 84 86 88 90 92
Mid-Year of 3-year Moving Mean Period
[NO
x] o
r [S
O2]
(p
ph
m)
0
5
10
15
20
25
[NO
3] o
r [S
O4]
(u
g/m
3 )
NOx
SO2
NO3
SO4

Case 4: Complex Chemistry, Case 4: Complex Chemistry, Several PrecursorsSeveral Precursors
PM2.5– Includes combustion and chemical formation
products– PM2.5 nitrates + sulfates + OC + EC + SOC
PM10– Includes fine and coarse particles– PM10 PM2.5 + dust
Observation-Based Techniques for O3
– Extent of reaction
– Ratio of O3 to NOX
– NOX concentration

Preparatory TasksPreparatory Tasks
Data Quality Review– Site visits– Graphical analysis– Statistical analysis
Emission Inventory Reconciliation– Ambient ratio analysis– VOC speciation evaluation

Project OverviewProject Overview
A Study on Changes in Specifications for Gasoline and Diesel Fuels in Thailand
Daedalus LLC/ERM Siam

Task 4 - Air Quality AnalysisTask 4 - Air Quality Analysis
Air ToxicsPM10 and PM2.5OzoneCarbon MonoxideNitrogen Dioxide

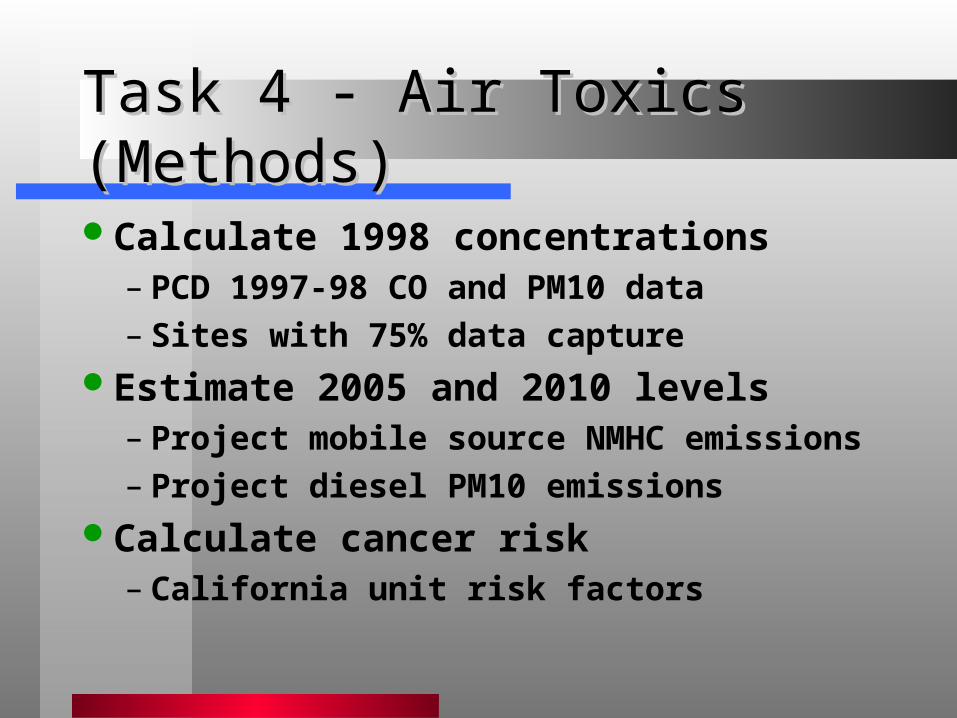
Task 4 - Air Toxics (Methods)Task 4 - Air Toxics (Methods)
PTT Data Collection– 3 sites, 40 samples– December 1999 and January 2000 – benzene, 1,3-butadiene– formaldehyde, acetaldehyde
– CO, CO2, CH4, TNMHC
Correlate air toxics with COEstimate diesel PM from PM10
Task 4 - Air Toxics (Methods)Task 4 - Air Toxics (Methods)
Calculate 1998 concentrations– PCD 1997-98 CO and PM10 data– Sites with 75% data capture
Estimate 2005 and 2010 levels– Project mobile source NMHC emissions– Project diesel PM10 emissions
Calculate cancer risk– California unit risk factors

Benzene vs. Carbon MonoxideAll Sites
y = 1.75x
R2 = 0.33
0
4
8
12
0 2 4 6 8
Carbon Monoxide (ppm)
Be
nze
ne
(p
pb
)

Benzene vs. Nonmethane HydrocarbonAll Sites
y = 0.0017x
R2 = 0.08
0
4
8
12
0 2000 4000 6000 8000 10000
Nonmethane Hydrocarbons (ppbC)
Be
nze
ne
(p
pb
)
Maximum Ratio=2.4% Benzene

1,3-Butadiene vs. Carbon MonoxideAll Sites
y = 0.18x
R2 = 0.53
0
0.5
1
1.5
0 2 4 6 8
Carbon Monoxide (ppm)
1,3
-Bu
tad
ien
e (
pp
b)
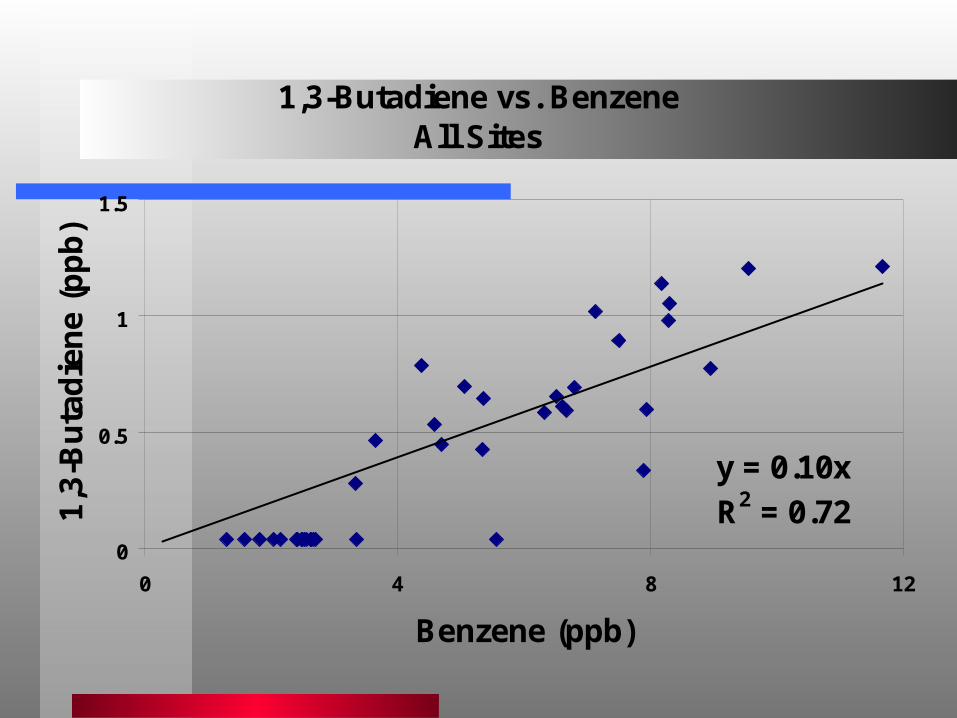
1,3-Butadiene vs. BenzeneAll Sites
y = 0.10x
R2 = 0.720
0.5
1
1.5
0 4 8 12
Benzene (ppb)
1,3
-Bu
tad
ien
e (
pp
b)

Carbon Dioxide vs. Carbon MonoxideAll Sites
y = 107x + 378
R2 = 0.31
0
400
800
1200
1600
0 2 4 6 8
Carbon Monoxide (ppm)
Ca
rbo
n D
iox
ide
(p
pm
)
Global Background Carbon Dioxide =370 ppm

Methane vs. Carbon MonoxideAll Sites
y = 0.12x + 1.13
R2 = 0.23
0
1
2
3
0 2 4 6 8
Carbon Monoxide (ppm)
Me
tha
ne
(p
pm
)
Global Background Methane=1.7 ppm

Nonmethane Hydrocarbon vs. Carbon MonoxideAll Sites
y = 948x
R2 = 0.80
0
2000
4000
6000
8000
10000
0 2 4 6 8
Carbon Monoxide (ppm)
NM
HC
(p
pb
C)
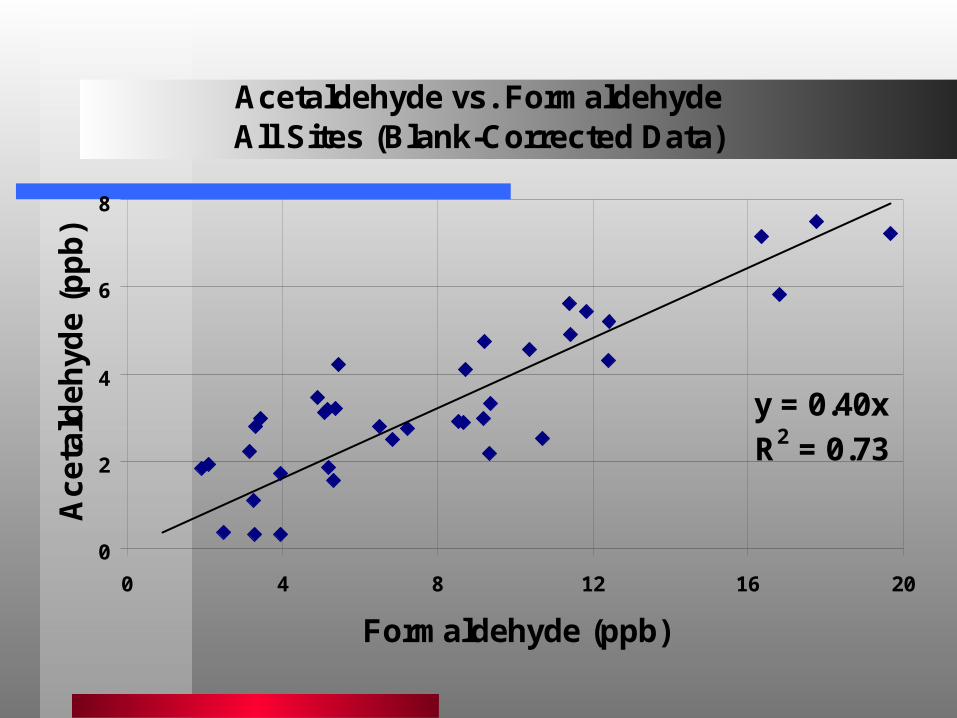
Acetaldehyde vs. FormaldehydeAll Sites (Blank-Corrected Data)
y = 0.40x
R2 = 0.73
0
2
4
6
8
0 4 8 12 16 20
Formaldehyde (ppb)
Ac
eta
lde
hyd
e (
pp
b)

Formaldehyde/CO vs. Carbon MonoxideAll Sites (Blank-Corrected Data)
0
2
4
6
8
10
0 2 4 6 8
Carbon Monoxide (ppm)
Fo
rmal
deh
yde/
CO
(p
pb
/pp
m)
Minimum Ratio = 1.0

Acetaldehyde/CO vs. Carbon MonoxideAll Sites (Blank-Corrected Data)
0
1
2
3
4
0 2 4 6 8
Carbon Monoxide (ppm)
Ace
tald
ehyd
e/C
O (
pp
b/p
pm
)
Minimum Ratio = 0.5

Task 4 - Annual ConcentrationsTask 4 - Annual ConcentrationsAir Toxic Average Range
Diesel PM 5.7 g/m3 3.1 – 9.3
Benzene 2.7 ppb 1.0 – 7.2
1,3-Butadiene 0.3 ppb 0.1 – 0.7
Formaldehyde 1.5 ppb 0.6 – 4.1
Acetaldehyde 0.8 ppb 0.3 – 2.1
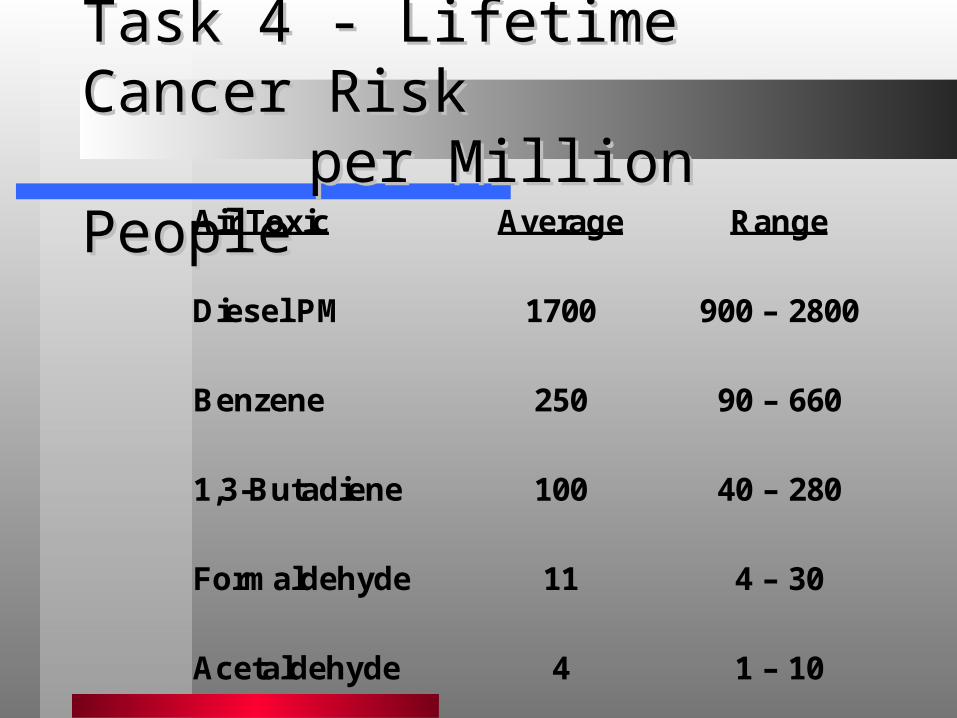
Task 4 - Lifetime Cancer RiskTask 4 - Lifetime Cancer Risk per Million People per Million People
Air Toxic Average Range
Diesel PM 1700 900 – 2800
Benzene 250 90 – 660
1,3-Butadiene 100 40 – 280
Formaldehyde 11 4 – 30
Acetaldehyde 4 1 – 10
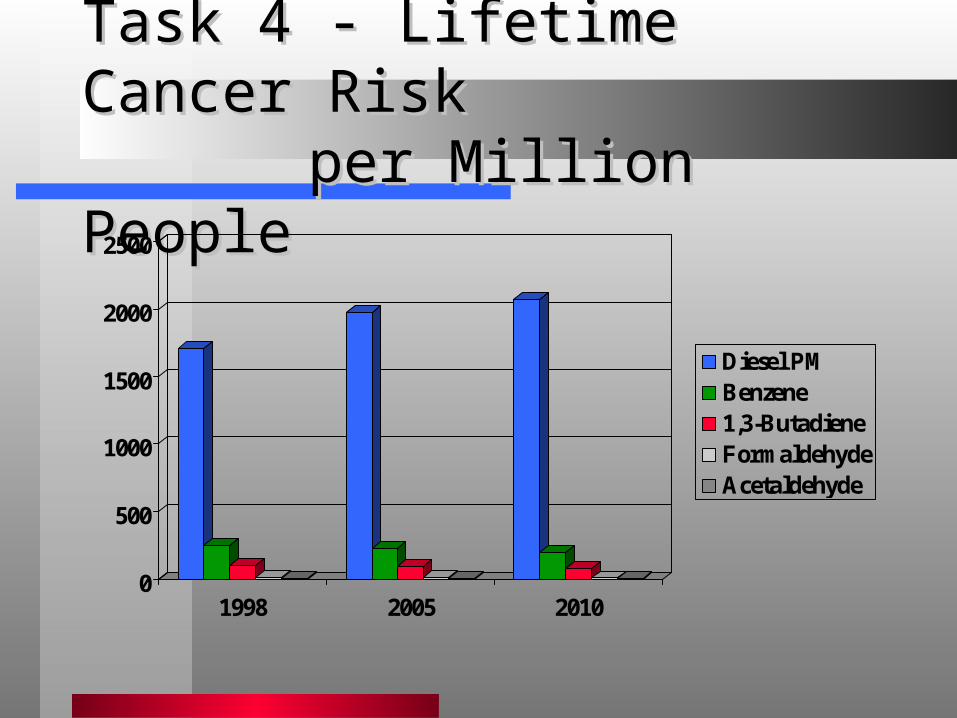
Task 4 - Lifetime Cancer RiskTask 4 - Lifetime Cancer Risk per Million People per Million People
0
500
1000
1500
2000
2500
1998 2005 2010
Diesel PMBenzene1,3-ButadieneFormaldehydeAcetaldehyde

Task 4 - Air Toxics (Remaining)Task 4 - Air Toxics (Remaining)
Obtain PCD data– Compare to PTT CO, CH4, and NMHC data
as a quality check– Determine if air toxics correlate better
with NOX and PM10
– Include secondary formation of aldehydesDiscuss analysis with PTT and PCD
– Character of Nonsi site– Resolve 1,3-butadiene issues

Task 4 - PM (Methods)Task 4 - PM (Methods)
PCD Data Collection– 16 permanent sites with hourly PM10 data in
1997 and 1998– Filter-based PM10 and TSP not provided
Summarize 24-hr and annual averagesExamine PM10 relationships with air
quality and meteorological dataEstimate 2005 and 2010 levels
– Rollback from 1998 using emissions

Number of Days with 24-Hour-Average PM10Exceeding Standard of 120 ug/m3 in 1997
0
40
80
120
160
200
06T* 09T 10T 11T 12T 13T 14T 16T* 17T* 19T* 20T 22T* 23T 27T 52T 53T 54T
Sites (* denotes <75% data capture)
Nu
mb
er
of
Da
ys

Number of Days with 24-Hour-Average PM10Exceeding Standard of 120 ug/m3 in 1998
0
40
80
120
160
200
09T 10T 11T 12T 13T* 14T 16T* 17T* 19T* 20T* 22T* 23T 27T 52T 53T 54T
Sites (* denotes <75% data capture)
Nu
mb
er
of
Da
ys

Peak 24-Hour-Average PM10 in 1997(Standard = 120 ug/m3)
0
100
200
300
400
06T* 09T 10T 11T 12T 13T 14T 16T* 17T* 19T* 20T 22T* 23T 27T 52T 53T 54T
Sites (* denotes <75% data capture)
Co
nc
en
tra
tio
n (
ug
/m3
)

Peak 24-Hour-Average PM10 in 1997(Standard = 120 ug/m3)
0
100
200
300
400
09T 10T 11T 12T 13T* 14T 16T* 17T* 19T* 20T* 22T* 23T 27T 52T 53T 54T
Sites (* denotes <75% data capture)
Co
nc
en
tra
tio
n (
ug
/m3
)

Annual-Average PM10 in 1997(Standard = 50 ug/m3)
0
50
100
150
06T* 09T 10T 11T 12T 13T 14T 16T* 17T* 19T* 20T 22T* 23T 27T 52T 53T 54T
Sites (* denotes <75% data capture)
Co
nc
en
tra
tio
n (
ug
/m3
)

Annual-Average PM10 in 1998(Standard = 50 ug/m3)
0
50
100
150
09T 10T 11T 12T 13T* 14T 16T* 17T* 19T* 20T* 22T* 23T 27T 52T 53T 54T
Sites (* denotes <75% data capture)
Co
nc
en
tra
tio
n (
ug
/m3
)

Task 4 - PM (Results)Task 4 - PM (Results)
Large reduction from 1997 to 1998– All sites, both averaging times
Annual-average PM ratios– PM10:TSP = 0.3 to 0.6 (4 sites)– PM2.5:PM10 = 0.5 (2 sites)
Din Daeng (54T) is peak site– Strong association with CO and NOX
– Weak with NMHC and SO2
– None with O3 and meteorology
Task 4 - PM (Results)Task 4 - PM (Results)
High PM associated with mobile sources, diesel in particular
PM2.5 and PM10 levels exceed all Thai and U.S. standards
Ostro et al. found 10 g/m3 in daily Bangkok PM10 associated with– 1-2% increase in natural mortality– 1-2% increase in cardiovascular mortality– 3-6% increase in respiratory mortality

Task 4 - PM (Results)Task 4 - PM (Results)
PM2.5 and PM10 levels likely to be higher in 2005 and 2010– Mobile source diesel PM emissions
increase• 16% from 1998 to 2005
• 22% from 1998 to 2010
– Mobile source NOX emissions increase• 26% from 1998 to 2005
• 40% from 1998 to 2010

Task 4 - PM (Remaining)Task 4 - PM (Remaining)
Discuss analysis with PCD– Obtain hi-vol PM10 and TSP data– Compare hi-vol and BAM PM10 data as
a quality check– Determine causes of large PM10
reduction from 1997 to 1998Compare 1997 air quality and
meteorological data to 1998

Task 4 - CO and NOTask 4 - CO and NO22 (Methods) (Methods)
PCD Data Collection– 14 permanent sites with CO and NO2
– 1997 and 1998 data most complete
Verify NO2 correlation to CO and NOX
Estimate 2005 and 2010 levels– Rollback from 1998 using emissions
– Project mobile source CO and NOX emissions

Peak Nitrogen Dioxide -- Din DaengFebruary 20, 1998
0
200
400
600
800
1000
1200
1 3 5 7 9 11 13 15 17 19 21 23
Hour
Co
nc
en
tra
tio
n
CO (pphm)
NO (ppb)
NO2 (ppb)
NOx (ppb)
Ozone (ppb)
SO2 (ppb)
NMHC (pphmC)
THC (pphmC)
PM10 (ug/m3)
NOx matches CO, NMHC, and THC from mobile sources during AM traffic. No correlation with SO2 from stationary sources.

Task 4 - CO and NOTask 4 - CO and NO22 (Results) (Results)
0%
50%
100%
150%
200%
250%
Per
cent
of S
tand
ard
1998 2005 2010
1-Hour CO8-Hour CO1-Hour NO2

Task 4 - CO and NOTask 4 - CO and NO22 (Remaining) (Remaining)
Discuss analysis with PCD– Confirm that no 1998 data from
Junkasame (highest CO in 1996) are available
Task 4 -ConclusionsTask 4 -Conclusions
Air Toxics– PTT data provides a good first estimate of
gaseous air toxic levels in Bangkok– Diesel PM is the major contributor to cancer
risk– Benzene and 1,3-butadiene are also
significant contributors– Formaldehyde and acetaldehyde are minor
factors, but secondary formation still needs to be included

Task 4 -ConclusionsTask 4 -Conclusions
Particulate Matter– Many days over Thai and U.S. standards
for PM2.5 and PM10– High PM levels related to mobile sources
(direct emissions and/or road dust)– PM strongly associated with mortality– Large decrease from 1997 to 1998 may
indicate effect of economic crisis

Task 4 -ConclusionsTask 4 -Conclusions
Carbon Monoxide– Likely to attain 1-hour and 8-hour
standards with existing controlsNitrogen Dioxide
– Only one violation of standard in 1998– Peaks driven by mobile source, rather
than stationary source, NOX emissions
– Peak levels likely to increase in future