Embed Size (px)
Citation preview
1
AIR: THE GREAT, THE LARGE and the small. Lecture 3-4. P.B.Rhines 5 ii 2003 AIR: THE LARGE SCALE Let’s return to simpler science and talk about the large-scale properties of the Earth’s atmosphere (and its circulation). Here our earlier ideas about sun’s radiation are important too. The atmosphere is a shell of air, about 10 km thick, thin compared with the radius of the Earth (6380 km). Some of its dominant properties are: • the atmosphere is layered, with density about 1.25 kg/meter3 near the ground, decreasing upward. [Like the ocean, even though air is ~ 800 times less dense than water.] This layering causes winds to be dominantly horizontal: vertical motion of the air is opposed by the density layers, which trap pollutants in the lower atmosphere. • the basic temperature decreases by about 500C from the ground to the ‘half-way house’ at 10km above the ground. At the altitude of jet aircraft, say 35,000 feet or 10.6 km, the temperature is about –500C . This colder air at high altitude is not denser than the warm air beneath as you might expect. The pressure (p) decrease more than compensates the temperature decrease, in the determination of density, ρ, as you move upward. As you climb a mountain it becomes cooler at a rate of about 100C per km of elevation (this is known as the “adiabatic lapse rate”). • the basic atmospheric pressure decreases almost like an exponential curve; at any point most of the pressure can be attributed to the weight of the column of air overhead (this is known as ‘hydrostatic balance’).
• At the ground the pressure is about 105 Newton/m2 or 14.7 lbs/inch2 in old-fashioned British units. Approximately 80% of the mass of the atmosphere is in the layer known as the troposphere below about 10 km, and capped by a transition to a more layered (density-stratified) region known as the stratosphere. • the atmosphere is heated by the sun and by clouds, which carry the ocean’s heat upward in the form of water vapor. Clouds are small heat engines, taking the gaseous water (invisible water vapor) from the sea or near the ground, raising it up to where it condenses into liquid water (cloud and rain). This cools the sea or ground and warms the cloud, making it buoyant and pushing it to greater heights. • contrasting temperatures lead to contrasting densities, and these lead to winds, as dense (cold) air sinks, less dense (warm) air rises. • the sun heats the tropics more than the Poles, leading to a distribution of air temperature which is always trying to convect…to flow up in the tropics, downward at higher latitude and north-south in between: this is roughly what a ‘Hadley Cell’ is. • beside the density layering, the dominant feature that shapes the circulation of the atmosphere is the Earth’s rotation (through the Coriolis force). This force turns the north-south motions into east-west winds, which are the most visible part of the atmospheric circulation.
2
• air behaves nearly like an ‘ideal gas’, for which pressure p, density ρ and temperature T are related by p = ρRT. R is known as the gas constant, R = 287.04 Joules per kg per 0C. The units of p are force/area or newtons/m2 or Pascals.
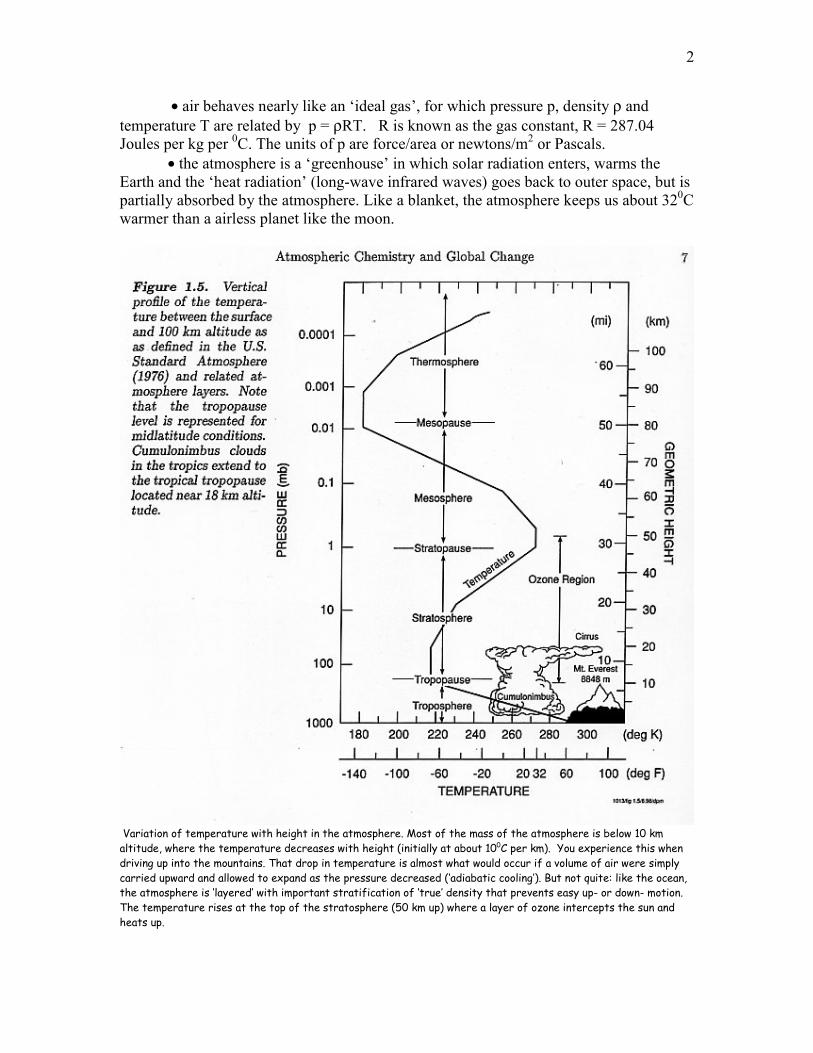
• the atmosphere is a ‘greenhouse’ in which solar radiation enters, warms the Earth and the ‘heat radiation’ (long-wave infrared waves) goes back to outer space, but is partially absorbed by the atmosphere. Like a blanket, the atmosphere keeps us about 320C warmer than a airless planet like the moon.
Variation of temperature with height in the atmosphere. Most of the mass of the atmosphere is below 10 km altitude, where the temperature decreases with height (initially at about 100C per km). You experience this when driving up into the mountains. That drop in temperature is almost what would occur if a volume of air were simply carried upward and allowed to expand as the pressure decreased (‘adiabatic cooling’). But not quite: like the ocean, the atmosphere is ‘layered’ with important stratification of ‘true’ density that prevents easy up- or down- motion. The temperature rises at the top of the stratosphere (50 km up) where a layer of ozone intercepts the sun and heats up.
3
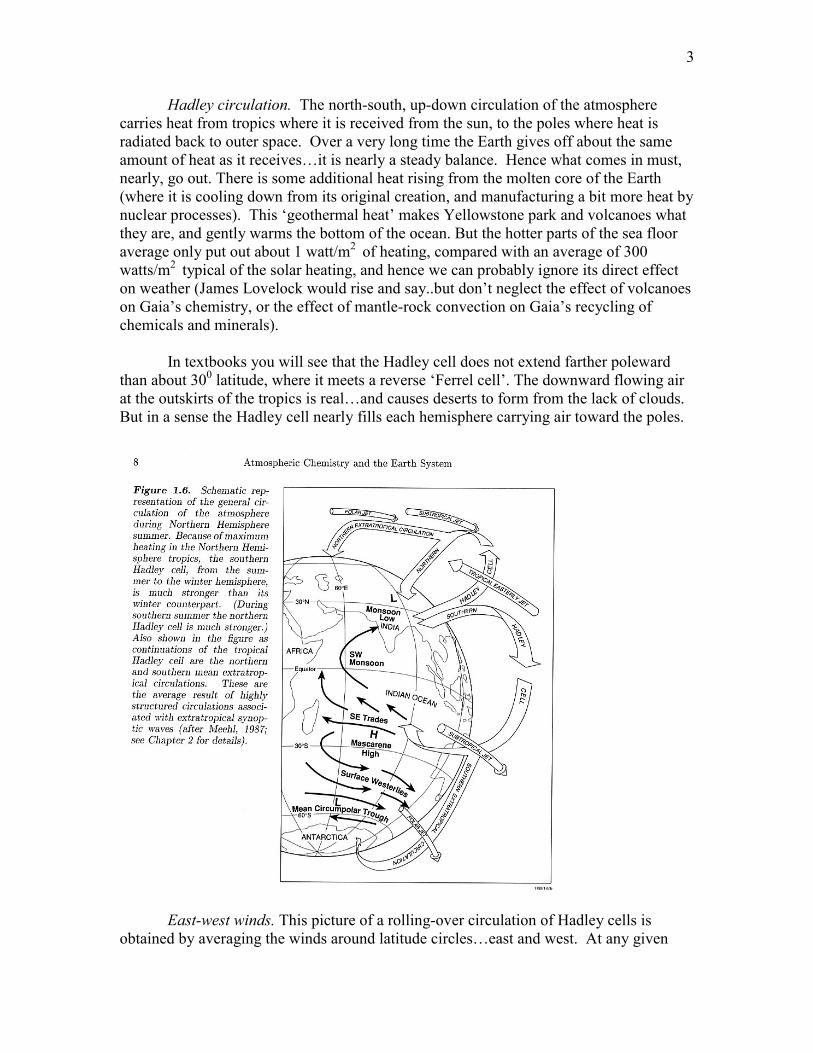
Hadley circulation. The north-south, up-down circulation of the atmosphere carries heat from tropics where it is received from the sun, to the poles where heat is radiated back to outer space. Over a very long time the Earth gives off about the same amount of heat as it receives…it is nearly a steady balance. Hence what comes in must, nearly, go out. There is some additional heat rising from the molten core of the Earth (where it is cooling down from its original creation, and manufacturing a bit more heat by nuclear processes). This ‘geothermal heat’ makes Yellowstone park and volcanoes what they are, and gently warms the bottom of the ocean. But the hotter parts of the sea floor average only put out about 1 watt/m2 of heating, compared with an average of 300 watts/m2 typical of the solar heating, and hence we can probably ignore its direct effect on weather (James Lovelock would rise and say..but don’t neglect the effect of volcanoes on Gaia’s chemistry, or the effect of mantle-rock convection on Gaia’s recycling of chemicals and minerals). In textbooks you will see that the Hadley cell does not extend farther poleward than about 300 latitude, where it meets a reverse ‘Ferrel cell’. The downward flowing air at the outskirts of the tropics is real…and causes deserts to form from the lack of clouds. But in a sense the Hadley cell nearly fills each hemisphere carrying air toward the poles.
East-west winds. This picture of a rolling-over circulation of Hadley cells is obtained by averaging the winds around latitude circles…east and west. At any given
4
place, the structure of the winds has more to it. In particular, looking at satellite images what stands out is the intense swirling of weather patterns and the general east-west motion of the atmosphere. We scarcely see any evidence for the Hadley cell. This is typical of ‘geophysical fluid dynamics’, the basic science behind atmosphere/ocean circulation: the obvious and strong motions are connected to almost invisible, slower winds. Imagine a bit of air moving northward in a Hadley circulation. Think of a ring of air all the way round the Earth, and imagine looking down on the North Pole. It is moving with the Earth (‘spinning’ eastward). If the ring moves northward everywhere, it is coming closer to the Earth’s rotation axis. Like a figure skater drawing her/his arms inward, this concentrates the spin of ring of air: it spins faster than the Earth. This relates to a basic law of physics, stating that the radius of the ring from the Earth’s axis, call it r, multiplied by its eastward velocity (including the velocity of the Earth’s surface), v, stays constant, in ideal circumstances (no friction).
We can calculate how strong this new eastward wind will be. The basic east-west velocity of the rotating Earth is Ω r. Ω is the rate of rotation of the Earth, Ω = 2π/(length of one day), or 7.27 x 10⁻⁵ sec-1). We can write the product r v as r (v‘+ Ωr) = constant where v’ is the windspeed measured by an observer sitting on the rotating Earth and r is radius of the ring (measured from the Earth’s axis). This is known as conservation of angular momentum. You can show that if this quantity is constant as the ring of air moves northward, a small change in r will lead to a change in wind given approximately by change in v’ = 2Ω x change in r (*) Let’s do a calculation. If the ring of air is initially sitting over Seattle, its distance to the Earth’s axis is the radius of the Earth (6380 km) times the cosine of the latitude, or
r1 = 6380 cos(47.50) km = 4310 km. Say we move the ring 100 km north, to latitude 48.40; then
r2 = 6380 cos(48.40) = 4236 km. The equation (*) then gives change in v’ = 7.27 x 10⁻⁵ ((4310)2/ 4236 - 4236 ) = .01085 km/sec. Convert this to meters per second: +10.85 m/sec. So we get a healthy eastward (or ‘westerly’ in the jargon of meterology) wind by moving a ring of air (which runs all the way round the Earth at this latitude) from Seattle to Bellingham. The overall pattern of the winds on Earth can be understood by turning this result into a simple rule: rings of air moving north spin faster (more eastward) than the Earth, rings moving southward spin more slowly than the Earth (more westward). If the ring of air moved more like 1000 km northward (that is 90 of latitude) at these latitudes it would gain about 128 meters/sec eastward velocity, which is about as fast as the westerly winds can go. Look at a satellite animation of the northern hemisphere winds: in the middle latitudes the winds are dominantly eastward. The air well above the ground has moved north from the tropics. Because air is not piling up anywhere, there must be just as much moving south as moving north, at any given latitude. The
5
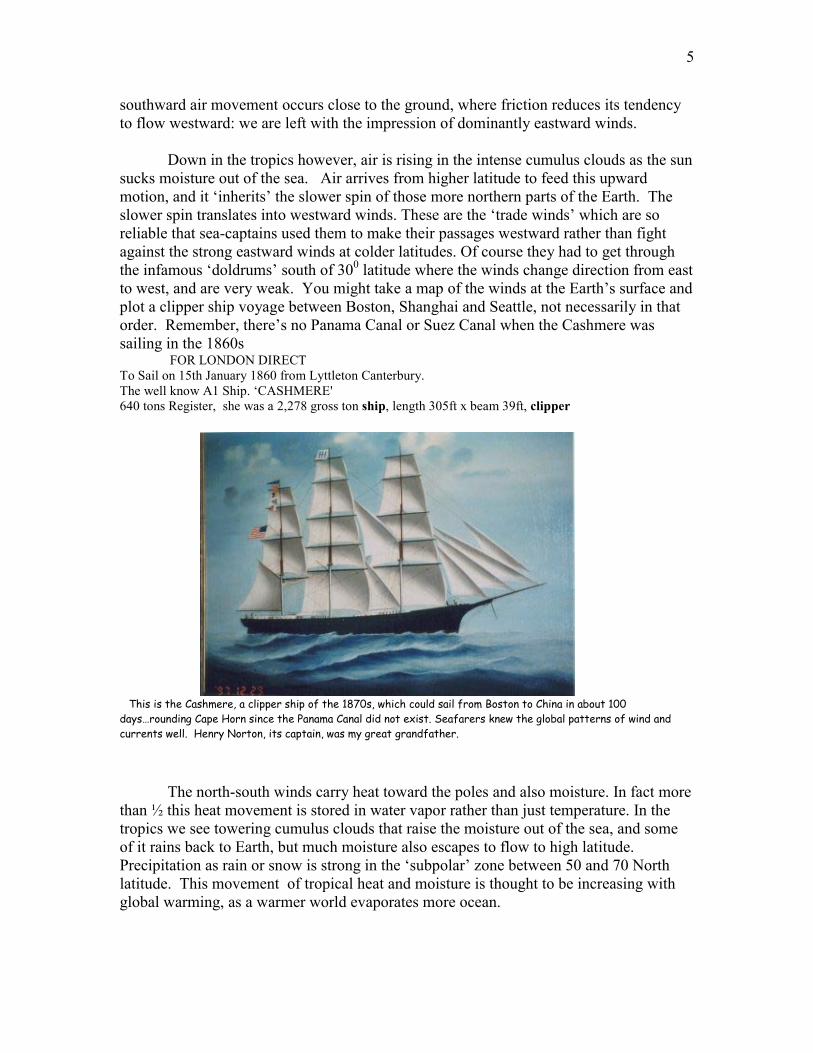
southward air movement occurs close to the ground, where friction reduces its tendency to flow westward: we are left with the impression of dominantly eastward winds. Down in the tropics however, air is rising in the intense cumulus clouds as the sun sucks moisture out of the sea. Air arrives from higher latitude to feed this upward motion, and it ‘inherits’ the slower spin of those more northern parts of the Earth. The slower spin translates into westward winds. These are the ‘trade winds’ which are so reliable that sea-captains used them to make their passages westward rather than fight against the strong eastward winds at colder latitudes. Of course they had to get through the infamous ‘doldrums’ south of 300 latitude where the winds change direction from east to west, and are very weak. You might take a map of the winds at the Earth’s surface and plot a clipper ship voyage between Boston, Shanghai and Seattle, not necessarily in that order. Remember, there’s no Panama Canal or Suez Canal when the Cashmere was sailing in the 1860s FOR LONDON DIRECT To Sail on 15th January 1860 from Lyttleton Canterbury. The well know A1 Ship. ‘CASHMERE' 640 tons Register, she was a 2,278 gross ton ship, length 305ft x beam 39ft, clipper
This is the Cashmere, a clipper ship of the 1870s, which could sail from Boston to China in about 100 days…rounding Cape Horn since the Panama Canal did not exist. Seafarers knew the global patterns of wind and currents well. Henry Norton, its captain, was my great grandfather. The north-south winds carry heat toward the poles and also moisture. In fact more than ½ this heat movement is stored in water vapor rather than just temperature. In the tropics we see towering cumulus clouds that raise the moisture out of the sea, and some of it rains back to Earth, but much moisture also escapes to flow to high latitude. Precipitation as rain or snow is strong in the ‘subpolar’ zone between 50 and 70 North latitude. This movement of tropical heat and moisture is thought to be increasing with global warming, as a warmer world evaporates more ocean.
6
The air pressure maps below show a tendency for air to circulate counter clockwise round a low-pressure center … this ‘cyclonic’ rotation as in a cyclone. [In the southern hemisphere air circulates clockwise round a ‘low’.]. As an aid to memory: ring of air drawn toward Pole => concentrates spin of Earth => spins counterclockwise like the Earth (northern hemisphere) => cyclonic like a cyclone with low pressure Perhaps the most useful result of meteorology is that low pressure centers are surrounded by cyclonic winds. The low pressure draws air in near the ground which must then rise near the center. This causes cloud to form: low pressure => cloudy, high pressure => clear.
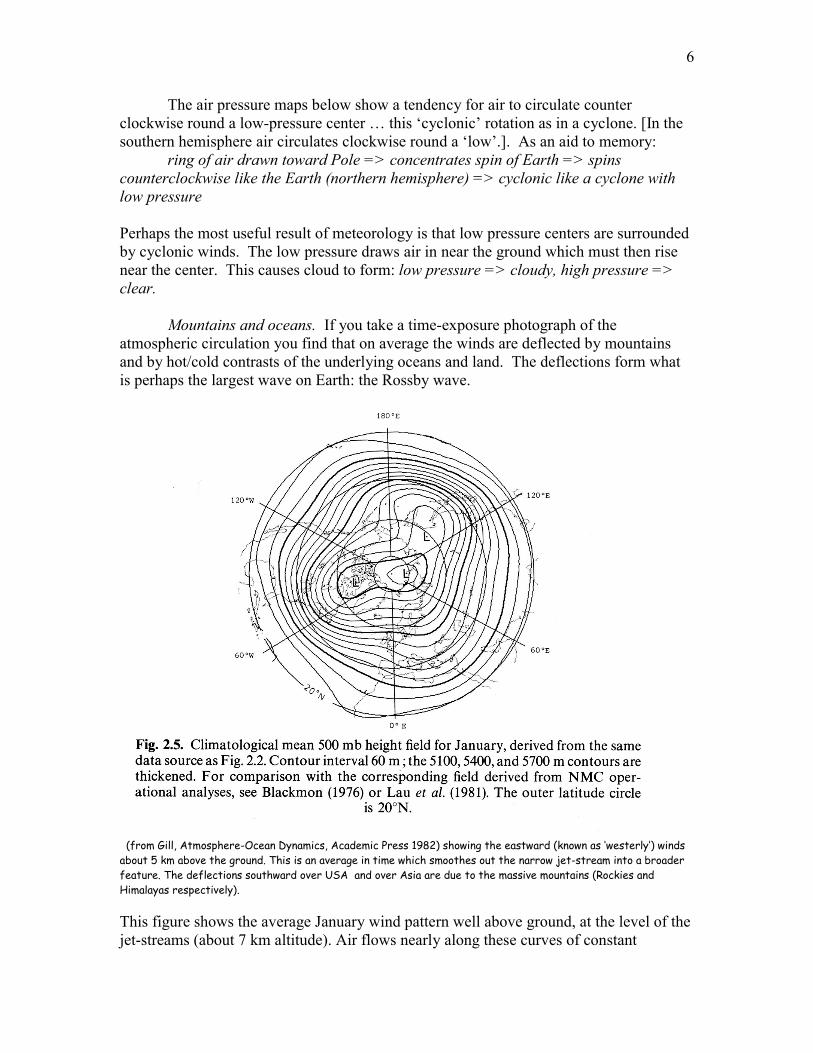
Mountains and oceans. If you take a time-exposure photograph of the atmospheric circulation you find that on average the winds are deflected by mountains and by hot/cold contrasts of the underlying oceans and land. The deflections form what is perhaps the largest wave on Earth: the Rossby wave.
(from Gill, Atmosphere-Ocean Dynamics, Academic Press 1982) showing the eastward (known as ‘westerly’) winds about 5 km above the ground. This is an average in time which smoothes out the narrow jet-stream into a broader feature. The deflections southward over USA and over Asia are due to the massive mountains (Rockies and Himalayas respectively). This figure shows the average January wind pattern well above ground, at the level of the jet-streams (about 7 km altitude). Air flows nearly along these curves of constant
7
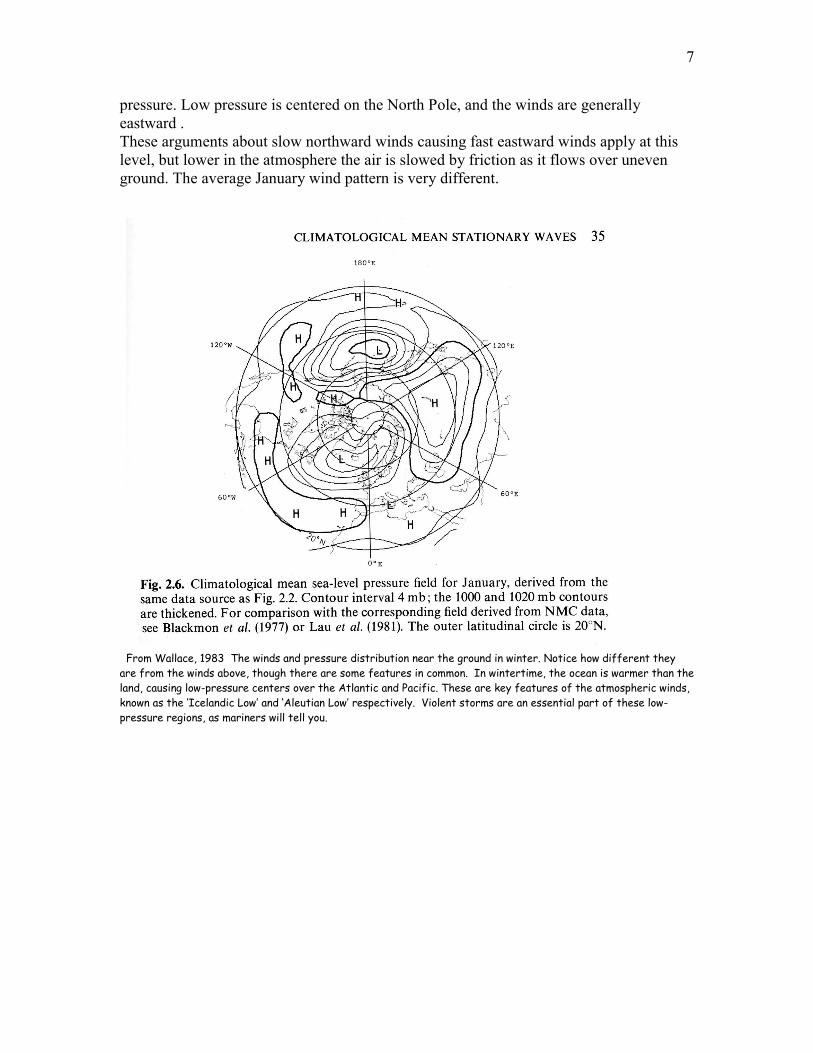
pressure. Low pressure is centered on the North Pole, and the winds are generally eastward . These arguments about slow northward winds causing fast eastward winds apply at this level, but lower in the atmosphere the air is slowed by friction as it flows over uneven ground. The average January wind pattern is very different.
From Wallace, 1983 The winds and pressure distribution near the ground in winter. Notice how different they are from the winds above, though there are some features in common. In wintertime, the ocean is warmer than the land, causing low-pressure centers over the Atlantic and Pacific. These are key features of the atmospheric winds, known as the ‘Icelandic Low’ and ‘Aleutian Low’ respectively. Violent storms are an essential part of these low-pressure regions, as mariners will tell you.
8
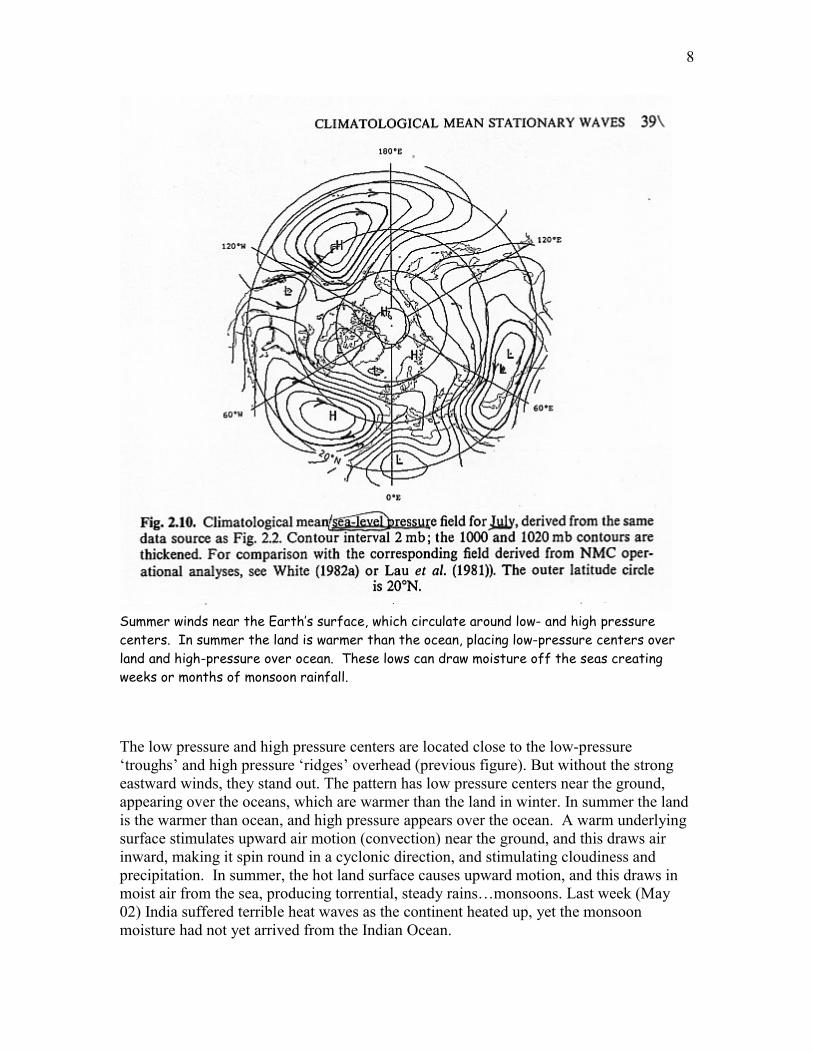
Summer winds near the Earth’s surface, which circulate around low- and high pressure centers. In summer the land is warmer than the ocean, placing low-pressure centers over land and high-pressure over ocean. These lows can draw moisture off the seas creating weeks or months of monsoon rainfall. The low pressure and high pressure centers are located close to the low-pressure ‘troughs’ and high pressure ‘ridges’ overhead (previous figure). But without the strong eastward winds, they stand out. The pattern has low pressure centers near the ground, appearing over the oceans, which are warmer than the land in winter. In summer the land is the warmer than ocean, and high pressure appears over the ocean. A warm underlying surface stimulates upward air motion (convection) near the ground, and this draws air inward, making it spin round in a cyclonic direction, and stimulating cloudiness and precipitation. In summer, the hot land surface causes upward motion, and this draws in moist air from the sea, producing torrential, steady rains…monsoons. Last week (May 02) India suffered terrible heat waves as the continent heated up, yet the monsoon moisture had not yet arrived from the Indian Ocean.
9
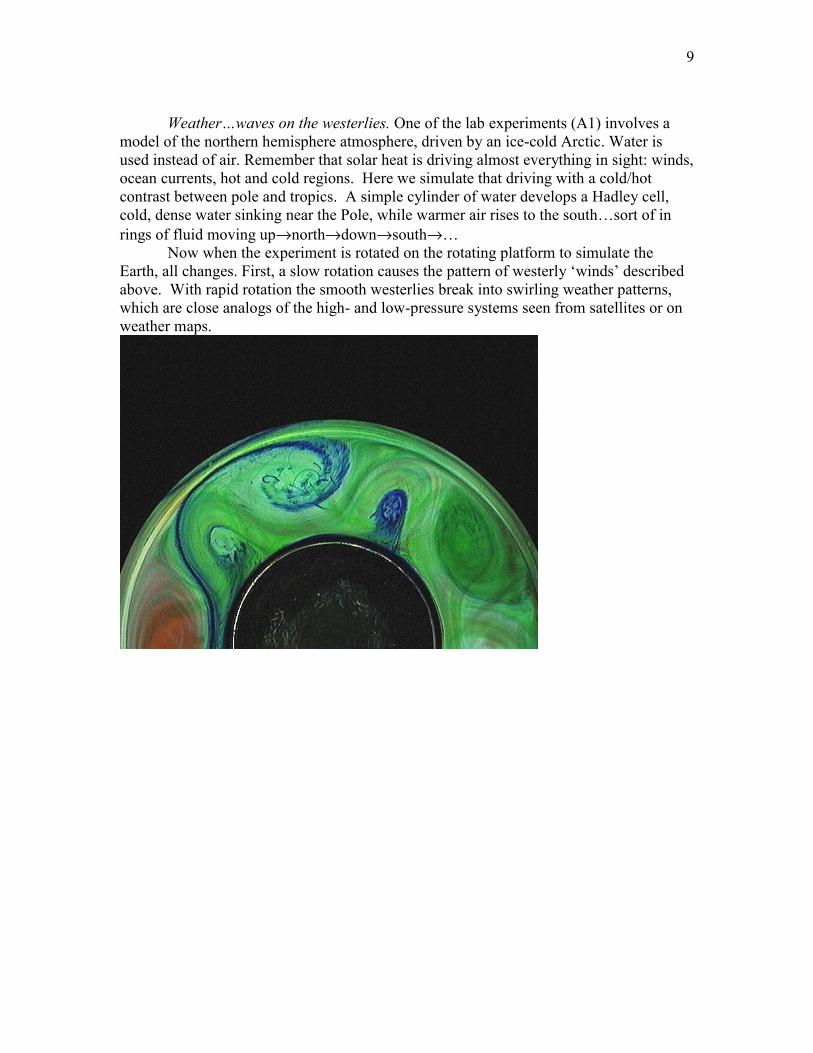
Weather…waves on the westerlies. One of the lab experiments (A1) involves a model of the northern hemisphere atmosphere, driven by an ice-cold Arctic. Water is used instead of air. Remember that solar heat is driving almost everything in sight: winds, ocean currents, hot and cold regions. Here we simulate that driving with a cold/hot contrast between pole and tropics. A simple cylinder of water develops a Hadley cell, cold, dense water sinking near the Pole, while warmer air rises to the south…sort of in rings of fluid moving up→north→down→south→… Now when the experiment is rotated on the rotating platform to simulate the Earth, all changes. First, a slow rotation causes the pattern of westerly ‘winds’ described above. With rapid rotation the smooth westerlies break into swirling weather patterns, which are close analogs of the high- and low-pressure systems seen from satellites or on weather maps.
10
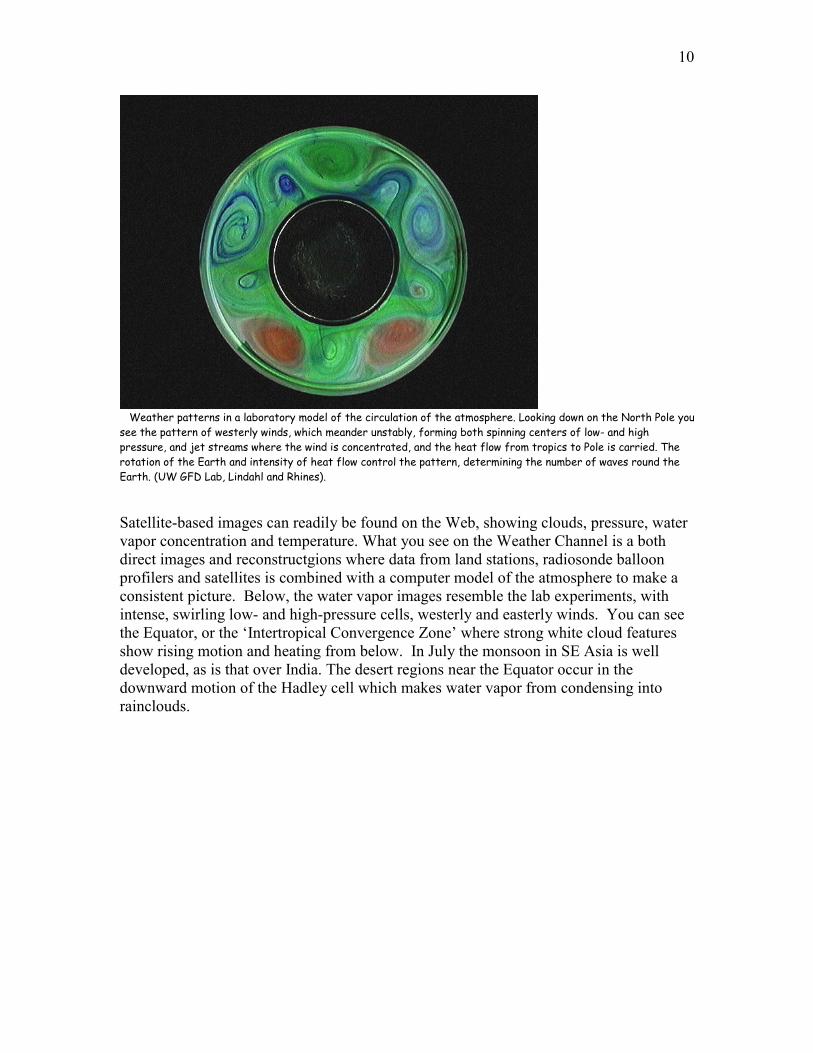
Weather patterns in a laboratory model of the circulation of the atmosphere. Looking down on the North Pole you see the pattern of westerly winds, which meander unstably, forming both spinning centers of low- and high pressure, and jet streams where the wind is concentrated, and the heat flow from tropics to Pole is carried. The rotation of the Earth and intensity of heat flow control the pattern, determining the number of waves round the Earth. (UW GFD Lab, Lindahl and Rhines). Satellite-based images can readily be found on the Web, showing clouds, pressure, water vapor concentration and temperature. What you see on the Weather Channel is a both direct images and reconstructgions where data from land stations, radiosonde balloon profilers and satellites is combined with a computer model of the atmosphere to make a consistent picture. Below, the water vapor images resemble the lab experiments, with intense, swirling low- and high-pressure cells, westerly and easterly winds. You can see the Equator, or the ‘Intertropical Convergence Zone’ where strong white cloud features show rising motion and heating from below. In July the monsoon in SE Asia is well developed, as is that over India. The desert regions near the Equator occur in the downward motion of the Hadley cell which makes water vapor from condensing into rainclouds.
11
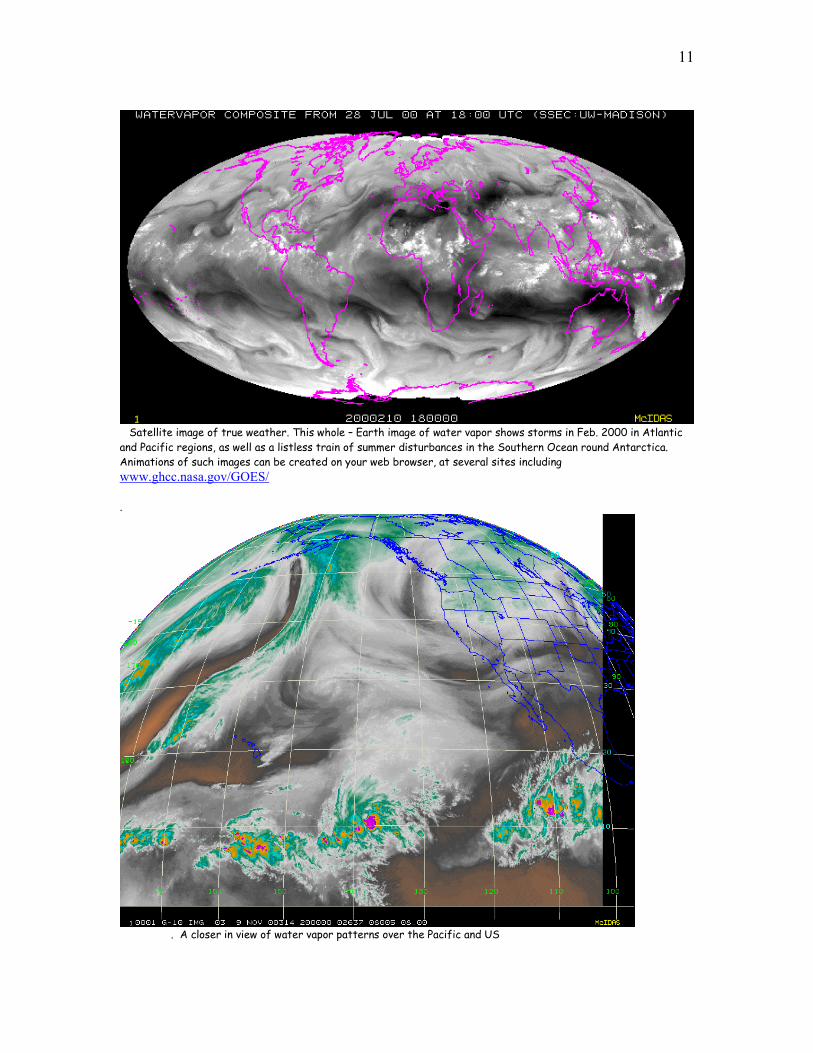
Satellite image of true weather. This whole – Earth image of water vapor shows storms in Feb. 2000 in Atlantic and Pacific regions, as well as a listless train of summer disturbances in the Southern Ocean round Antarctica. Animations of such images can be created on your web browser, at several sites including www.ghcc.nasa.gov/GOES/ .
. A closer in view of water vapor patterns over the Pacific and US
12
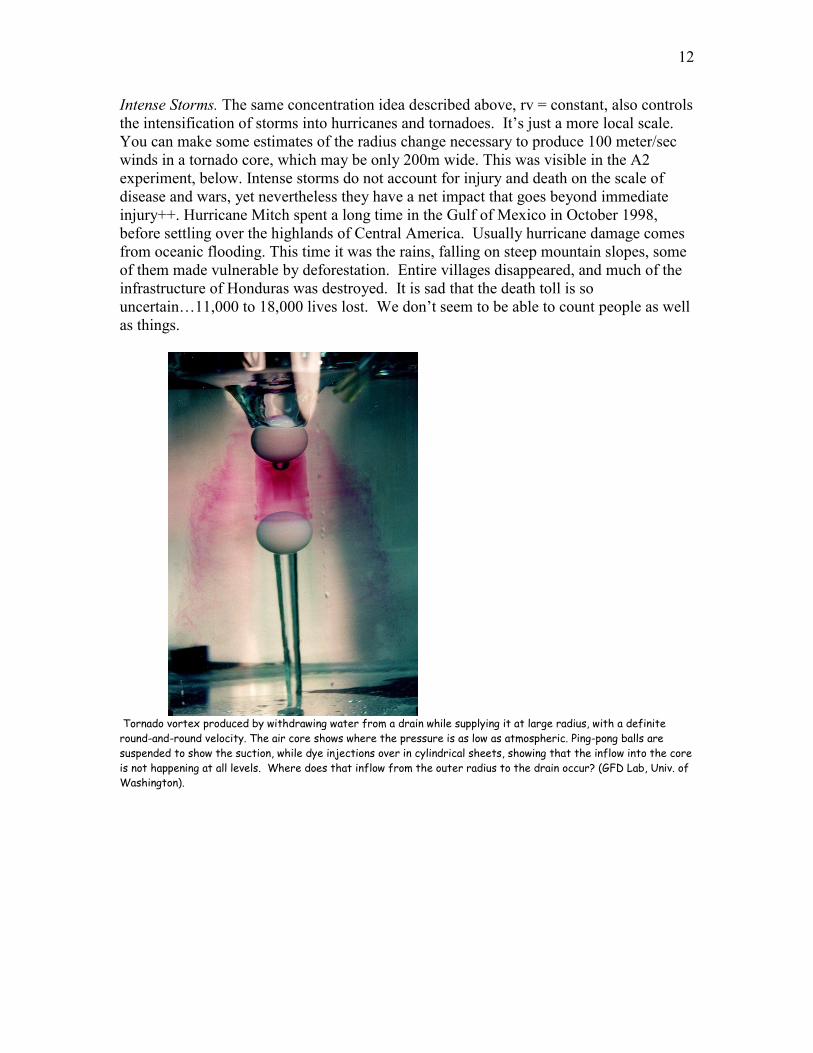
Intense Storms. The same concentration idea described above, rv = constant, also controls the intensification of storms into hurricanes and tornadoes. It’s just a more local scale. You can make some estimates of the radius change necessary to produce 100 meter/sec winds in a tornado core, which may be only 200m wide. This was visible in the A2 experiment, below. Intense storms do not account for injury and death on the scale of disease and wars, yet nevertheless they have a net impact that goes beyond immediate injury++. Hurricane Mitch spent a long time in the Gulf of Mexico in October 1998, before settling over the highlands of Central America. Usually hurricane damage comes from oceanic flooding. This time it was the rains, falling on steep mountain slopes, some of them made vulnerable by deforestation. Entire villages disappeared, and much of the infrastructure of Honduras was destroyed. It is sad that the death toll is so uncertain…11,000 to 18,000 lives lost. We don’t seem to be able to count people as well as things.
Tornado vortex produced by withdrawing water from a drain while supplying it at large radius, with a definite round-and-round velocity. The air core shows where the pressure is as low as atmospheric. Ping-pong balls are suspended to show the suction, while dye injections over in cylindrical sheets, showing that the inflow into the core is not happening at all levels. Where does that inflow from the outer radius to the drain occur? (GFD Lab, Univ. of Washington).
13
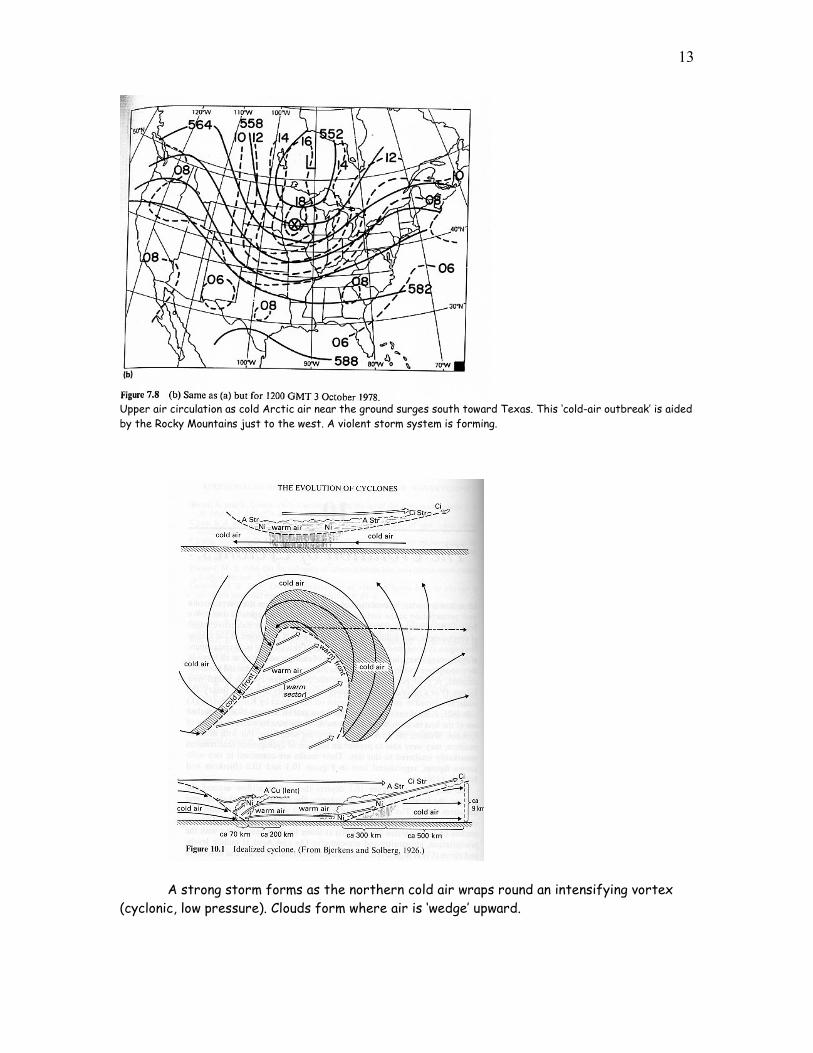
Upper air circulation as cold Arctic air near the ground surges south toward Texas. This ‘cold-air outbreak’ is aided by the Rocky Mountains just to the west. A violent storm system is forming.
A strong storm forms as the northern cold air wraps round an intensifying vortex
(cyclonic, low pressure). Clouds form where air is ‘wedge’ upward.
14
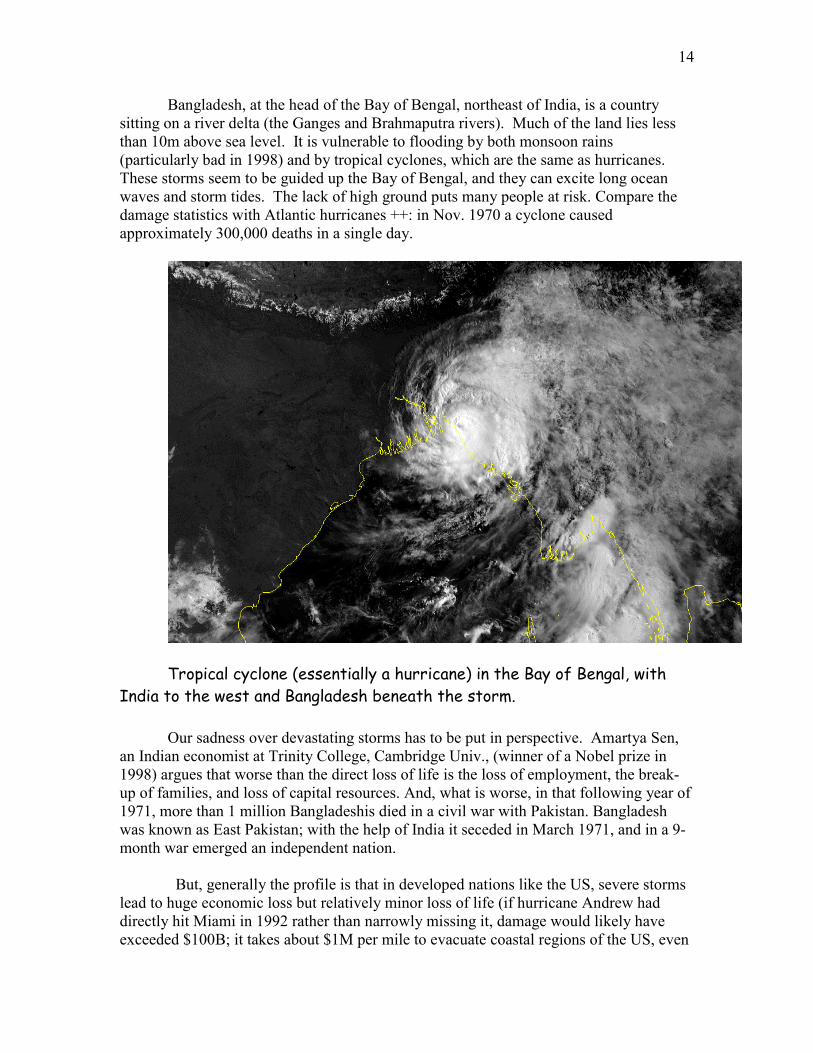
Bangladesh, at the head of the Bay of Bengal, northeast of India, is a country sitting on a river delta (the Ganges and Brahmaputra rivers). Much of the land lies less than 10m above sea level. It is vulnerable to flooding by both monsoon rains (particularly bad in 1998) and by tropical cyclones, which are the same as hurricanes. These storms seem to be guided up the Bay of Bengal, and they can excite long ocean waves and storm tides. The lack of high ground puts many people at risk. Compare the damage statistics with Atlantic hurricanes ++: in Nov. 1970 a cyclone caused approximately 300,000 deaths in a single day.
Tropical cyclone (essentially a hurricane) in the Bay of Bengal, with
India to the west and Bangladesh beneath the storm. Our sadness over devastating storms has to be put in perspective. Amartya Sen,
an Indian economist at Trinity College, Cambridge Univ., (winner of a Nobel prize in 1998) argues that worse than the direct loss of life is the loss of employment, the break-up of families, and loss of capital resources. And, what is worse, in that following year of 1971, more than 1 million Bangladeshis died in a civil war with Pakistan. Bangladesh was known as East Pakistan; with the help of India it seceded in March 1971, and in a 9-month war emerged an independent nation.
But, generally the profile is that in developed nations like the US, severe storms
lead to huge economic loss but relatively minor loss of life (if hurricane Andrew had directly hit Miami in 1992 rather than narrowly missing it, damage would likely have exceeded $100B; it takes about $1M per mile to evacuate coastal regions of the US, even
15
if no storm ever arrives!). In under-developed nations it is the opposite, with great loss of life. Their economic loss is, of course, also great in proportion to their wealth.
Overturning circulations . Rather like the Hadley cell in the large scale atmospheric circulations we have in tornadoes and hurricanes movement of air toward the center and upward near the center. This motion is hard to see but it has tremendous impact. The rising air expands (as it rises to regions of lower atmospheric pressure): this cools the air making water vapor condense into cloud. As this happens the condensation releases latent heat. Heating in storms is the major reason for their intensity, all the way from large weather systems to tornadoes. Conversely, high-pressure centers rotate anti-cyclonically (counter-clockwise) and air in them descends, making for clear air and gentle winds…and (see below) deserts!
By now we have encounter many kinds of ‘overturning circulation’ in this course. In estuaries, in the global ocean, the global atmosphere, and the small-scale swirling flows that are weather and storms. They are a complex part of atmosphere/ocean dynamics, but one worth noticing.
Summary: The great heat engine of the atmosphere is driven by the pole-to-
Equator temperature differences produced by the sun. It starts with a Hadley cell…a direct overturning circulation that moves north-south and up-down as dense cold air tries to underflow water air. On a rotating Earth this causes east-west winds to develop as the Earth’s spin is ‘inherited’ by the atmosphere. The westerly (that is, eastward) winds are strongest in the winter hemisphere. Mountain effects, deflecting these winds are thus also strongest in winter. This causes a Rossby-wave pattern with roughly two waves round the globe (visible in the attached figures, corresponding to Asian and North American continents). Both the mountain ranges and ocean/land differences affect the atmospheric wind patterns. The low-pressure centers over oceans in winter are strengthened by oceanic warmth, while in summer, low-pressure centers lie over the continents…also caused by heating of the underlying land.
Weather…high- and low-pressure centers, clouds, rain, hot, cold…is the result of instability of the basic steady circulation of the atmosphere. Cold air trapped in the north can break free (as in a ‘cold-air outbreak’ of the US Midwest, when freezing temperatures and Arctic air can reach Texas). The result is an intensification of the winds, especially in low-pressure, cyclonic circulations which get an extra boost from upward winds, releasing heat as clouds form. Many features of the atmospheric circulation have some geographical preference. Monsoons form where heating of the land in summer drives air upward, drawing in moist air from over the oceans. The rainfall can be extreme, unrelenting, and lead to flooding of low-lying countries like Bangladesh. The importance of severe weather and storms is deeper than the obvious damage and injury. Long-lived dislocations of human populations and ecosystems can occur. As the world’s overpopulation increases, and with more than one-half the global population living close to the seacoast (~roughly, within 50 km), we are living closer to the ‘edge’, tempting the elements.
16
Global warming. An idea that transcends ‘storms and weather’ is the long-term
behavior of climate. It is said that historically, human populations can endure few years of drought or flooding, but not more. With our globalized economy, its monoculture farming and lack of diversification, we may be more vulnerable than ever. Climate change is happening. Trace gases change the solar radiation balance of the atmosphere; particularly CO2, methane and ozone. CO2 is particularly effective in ‘blanketing’ the Earth, preventing the long-wave (infrared) radiation from reaching upward through the atmosphere. [The heat arrived as short-wave (visible) sunshine, but at the moderate 3000 absolute temperature of the Earth, the ‘black-body’ radiation is invisible heat.] A hotter world evaporates more ocean, moves more moisture about, tends to rain more on average. But ‘on average’ means little. Even the ‘average’ warming of the surface of the world (the ‘hockey stick curve below’) is small compared to the extremes.
17
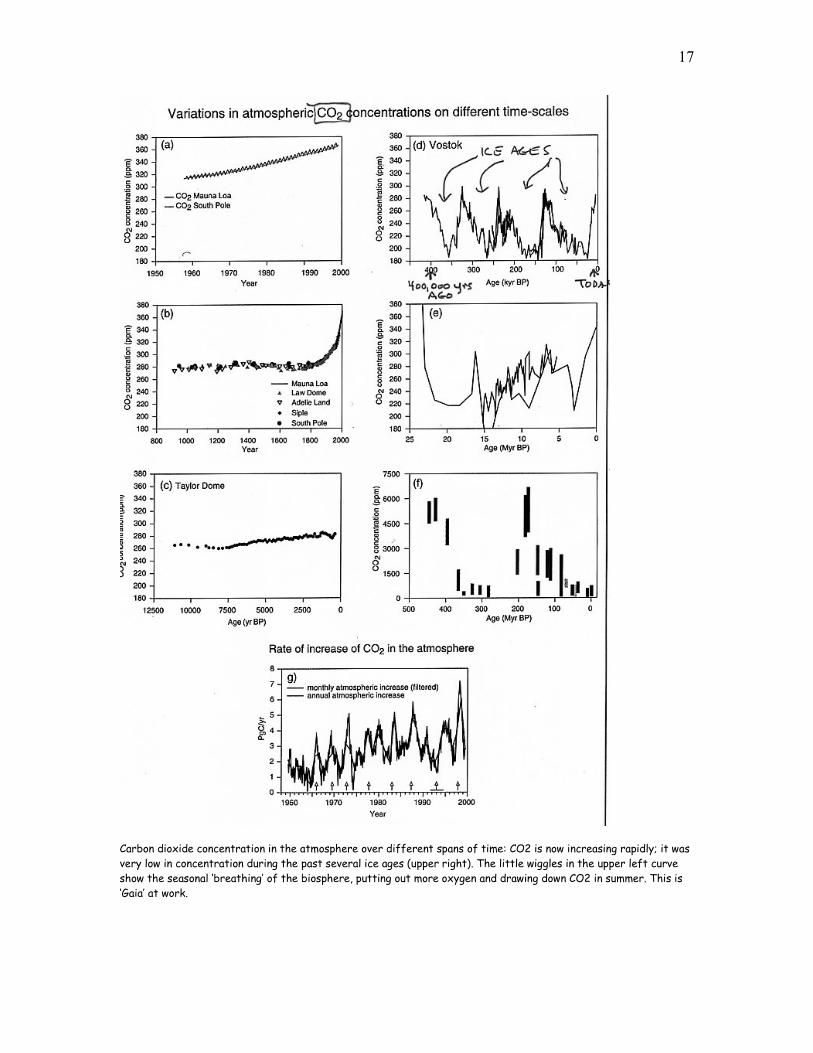
Carbon dioxide concentration in the atmosphere over different spans of time: CO2 is now increasing rapidly; it was very low in concentration during the past several ice ages (upper right). The little wiggles in the upper left curve show the seasonal ‘breathing’ of the biosphere, putting out more oxygen and drawing down CO2 in summer. This is ‘Gaia’ at work.
18
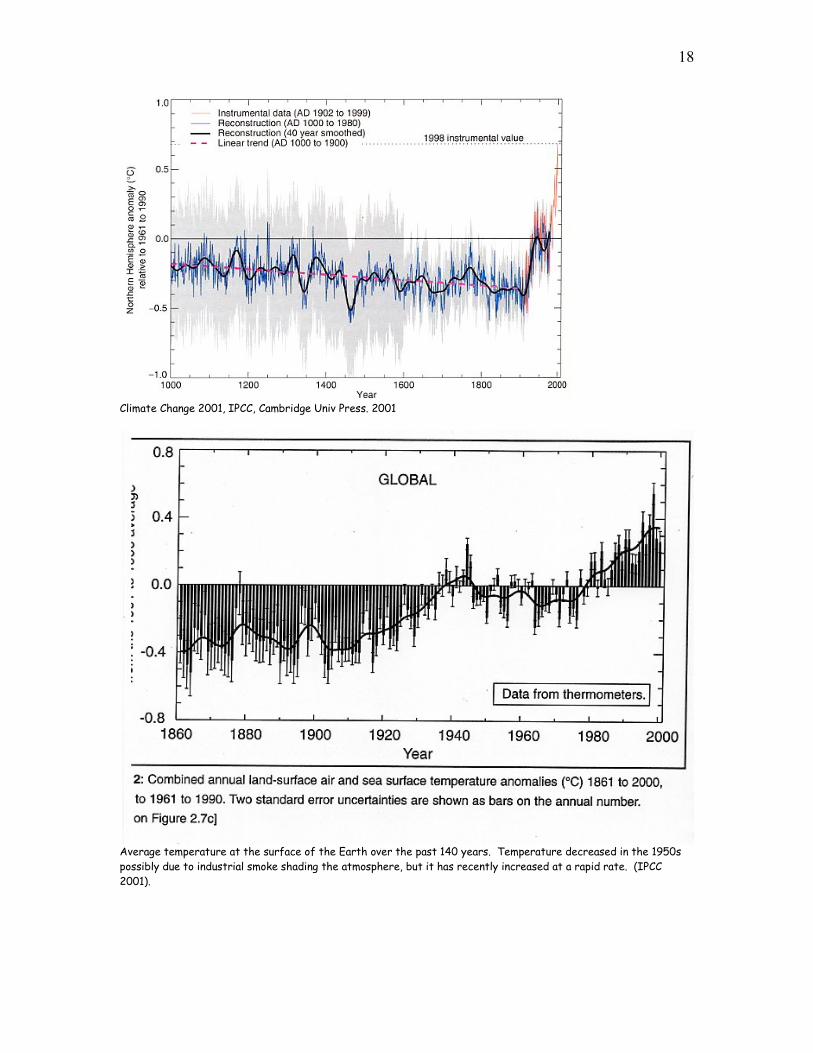
Climate Change 2001, IPCC, Cambridge Univ Press. 2001
Average temperature at the surface of the Earth over the past 140 years. Temperature decreased in the 1950s possibly due to industrial smoke shading the atmosphere, but it has recently increased at a rapid rate. (IPCC 2001).
19
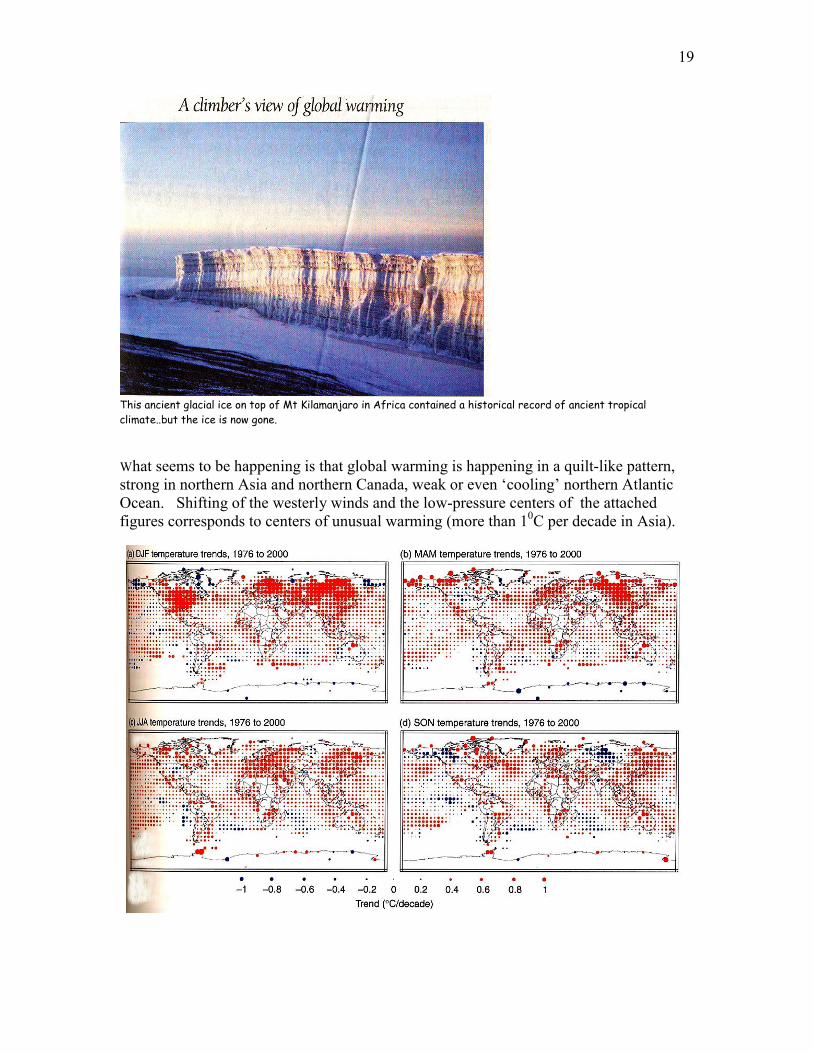
This ancient glacial ice on top of Mt Kilamanjaro in Africa contained a historical record of ancient tropical climate..but the ice is now gone. What seems to be happening is that global warming is happening in a quilt-like pattern, strong in northern Asia and northern Canada, weak or even ‘cooling’ northern Atlantic Ocean. Shifting of the westerly winds and the low-pressure centers of the attached figures corresponds to centers of unusual warming (more than 10C per decade in Asia).
20
Pattern of global warming, in 4 different seasons. Note the extreme warming over Asia and northern N. America. Climate Change 2001, IPCC, Cambridge Univ Press. 2001
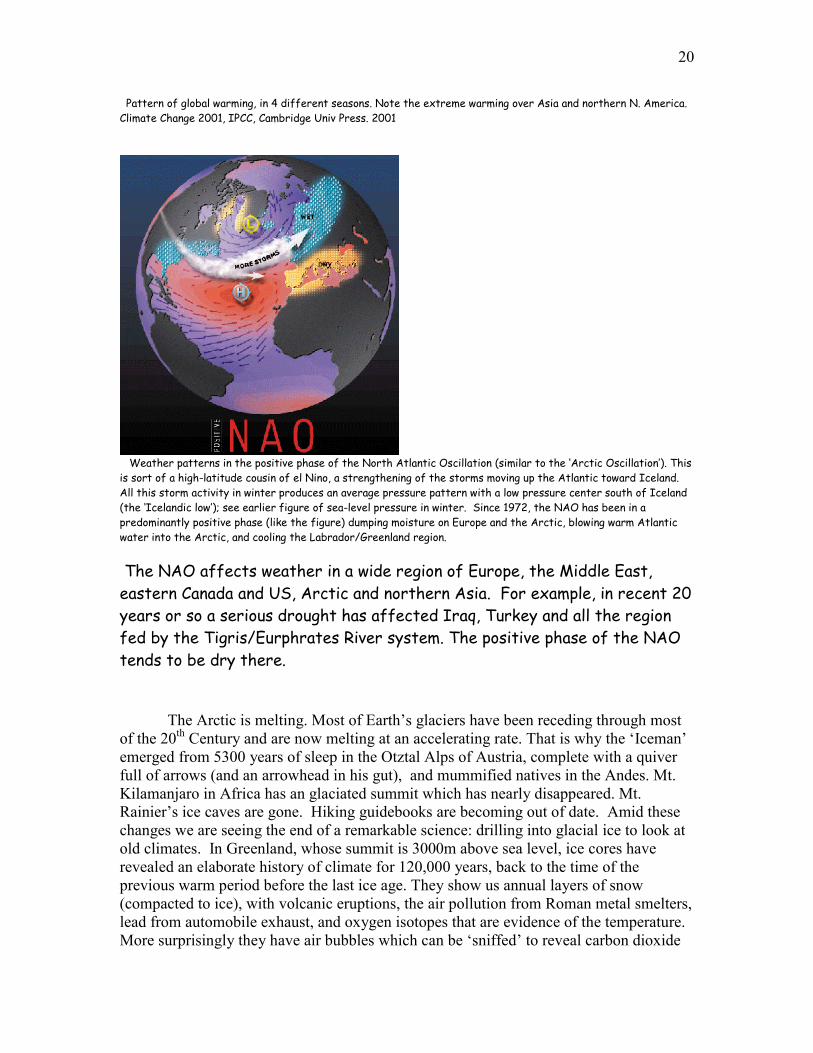
Weather patterns in the positive phase of the North Atlantic Oscillation (similar to the ‘Arctic Oscillation’). This is sort of a high-latitude cousin of el Nino, a strengthening of the storms moving up the Atlantic toward Iceland. All this storm activity in winter produces an average pressure pattern with a low pressure center south of Iceland (the ‘Icelandic low’); see earlier figure of sea-level pressure in winter. Since 1972, the NAO has been in a predominantly positive phase (like the figure) dumping moisture on Europe and the Arctic, blowing warm Atlantic water into the Arctic, and cooling the Labrador/Greenland region.
The NAO affects weather in a wide region of Europe, the Middle East, eastern Canada and US, Arctic and northern Asia. For example, in recent 20 years or so a serious drought has affected Iraq, Turkey and all the region fed by the Tigris/Eurphrates River system. The positive phase of the NAO tends to be dry there. The Arctic is melting. Most of Earth’s glaciers have been receding through most of the 20th Century and are now melting at an accelerating rate. That is why the ‘Iceman’ emerged from 5300 years of sleep in the Otztal Alps of Austria, complete with a quiver full of arrows (and an arrowhead in his gut), and mummified natives in the Andes. Mt. Kilamanjaro in Africa has an glaciated summit which has nearly disappeared. Mt. Rainier’s ice caves are gone. Hiking guidebooks are becoming out of date. Amid these changes we are seeing the end of a remarkable science: drilling into glacial ice to look at old climates. In Greenland, whose summit is 3000m above sea level, ice cores have revealed an elaborate history of climate for 120,000 years, back to the time of the previous warm period before the last ice age. They show us annual layers of snow (compacted to ice), with volcanic eruptions, the air pollution from Roman metal smelters, lead from automobile exhaust, and oxygen isotopes that are evidence of the temperature. More surprisingly they have air bubbles which can be ‘sniffed’ to reveal carbon dioxide
21
levels, and other trace gases, preserved for all that time. Carbon dioxide was very much less present in air during the last ice age. Is this the simple proximate cause of the ice ages…less of a greenhouse trapping of sunshine? It is a big scientific argument just now. Astronomical forcing..variations in the Earth’s orbit and tilt of its rotation axis play a role, at least as ‘pacemakers’ of ice ages. But there is much more going on. Stay tuned. This pattern structure, the ‘modes’ of global climate change, make prediction more difficult and human futures more uncertain. Will the American ‘bread-basket’ of the mid-west vanish, or move to Alberta? Will the Arctic truly melt and, as predicted, slow down the global ocean circulation? Nothing is independent. Human activity and natural climate variability now interact in many ways. Ecosystems are changing, moving, disappearing due to a combination of both.
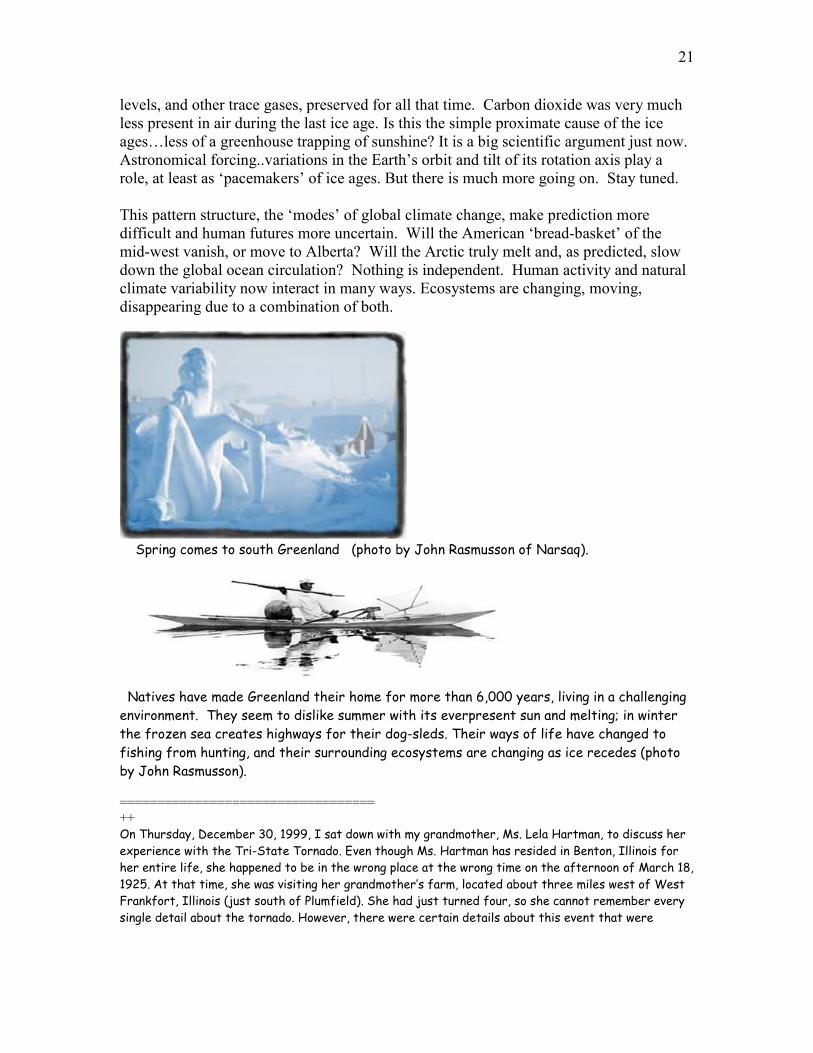
Spring comes to south Greenland (photo by John Rasmusson of Narsaq).
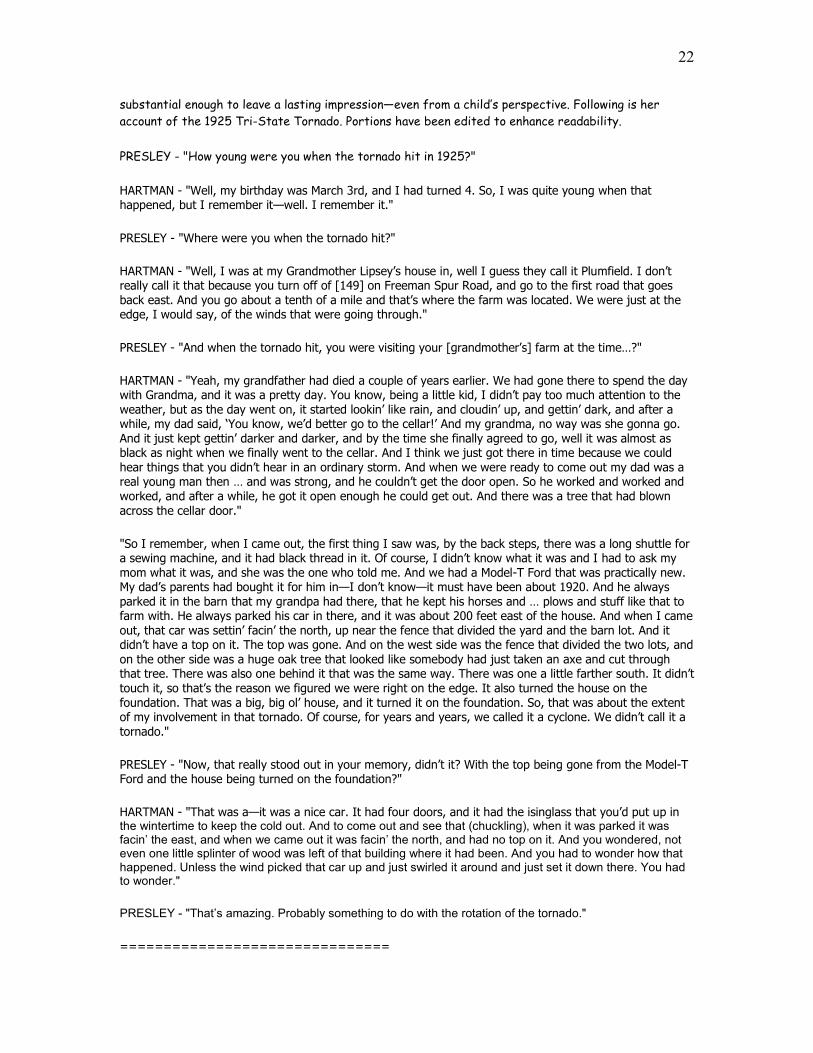
Natives have made Greenland their home for more than 6,000 years, living in a challenging environment. They seem to dislike summer with its everpresent sun and melting; in winter the frozen sea creates highways for their dog-sleds. Their ways of life have changed to fishing from hunting, and their surrounding ecosystems are changing as ice recedes (photo by John Rasmusson). ================================== ++ On Thursday, December 30, 1999, I sat down with my grandmother, Ms. Lela Hartman, to discuss her experience with the Tri-State Tornado. Even though Ms. Hartman has resided in Benton, Illinois for her entire life, she happened to be in the wrong place at the wrong time on the afternoon of March 18, 1925. At that time, she was visiting her grandmother’s farm, located about three miles west of West Frankfort, Illinois (just south of Plumfield). She had just turned four, so she cannot remember every single detail about the tornado. However, there were certain details about this event that were
22
substantial enough to leave a lasting impression—even from a child’s perspective. Following is her account of the 1925 Tri-State Tornado. Portions have been edited to enhance readability.
PRESLEY - "How young were you when the tornado hit in 1925?"
HARTMAN - "Well, my birthday was March 3rd, and I had turned 4. So, I was quite young when that happened, but I remember it—well. I remember it."
PRESLEY - "Where were you when the tornado hit?"
HARTMAN - "Well, I was at my Grandmother Lipsey’s house in, well I guess they call it Plumfield. I don’t really call it that because you turn off of [149] on Freeman Spur Road, and go to the first road that goes back east. And you go about a tenth of a mile and that’s where the farm was located. We were just at the edge, I would say, of the winds that were going through."
PRESLEY - "And when the tornado hit, you were visiting your [grandmother’s] farm at the time…?"
HARTMAN - "Yeah, my grandfather had died a couple of years earlier. We had gone there to spend the day with Grandma, and it was a pretty day. You know, being a little kid, I didn’t pay too much attention to the weather, but as the day went on, it started lookin’ like rain, and cloudin’ up, and gettin’ dark, and after a while, my dad said, ‘You know, we’d better go to the cellar!’ And my grandma, no way was she gonna go. And it just kept gettin’ darker and darker, and by the time she finally agreed to go, well it was almost as black as night when we finally went to the cellar. And I think we just got there in time because we could hear things that you didn’t hear in an ordinary storm. And when we were ready to come out my dad was a real young man then … and was strong, and he couldn’t get the door open. So he worked and worked and worked, and after a while, he got it open enough he could get out. And there was a tree that had blown across the cellar door."
"So I remember, when I came out, the first thing I saw was, by the back steps, there was a long shuttle for a sewing machine, and it had black thread in it. Of course, I didn’t know what it was and I had to ask my mom what it was, and she was the one who told me. And we had a Model-T Ford that was practically new. My dad’s parents had bought it for him in—I don’t know—it must have been about 1920. And he always parked it in the barn that my grandpa had there, that he kept his horses and … plows and stuff like that to farm with. He always parked his car in there, and it was about 200 feet east of the house. And when I came out, that car was settin’ facin’ the north, up near the fence that divided the yard and the barn lot. And it didn’t have a top on it. The top was gone. And on the west side was the fence that divided the two lots, and on the other side was a huge oak tree that looked like somebody had just taken an axe and cut through that tree. There was also one behind it that was the same way. There was one a little farther south. It didn’t touch it, so that’s the reason we figured we were right on the edge. It also turned the house on the foundation. That was a big, big ol’ house, and it turned it on the foundation. So, that was about the extent of my involvement in that tornado. Of course, for years and years, we called it a cyclone. We didn’t call it a tornado."
PRESLEY - "Now, that really stood out in your memory, didn’t it? With the top being gone from the Model-T Ford and the house being turned on the foundation?"
HARTMAN - "That was a—it was a nice car. It had four doors, and it had the isinglass that you’d put up in the wintertime to keep the cold out. And to come out and see that (chuckling), when it was parked it was facin’ the east, and when we came out it was facin’ the north, and had no top on it. And you wondered, not even one little splinter of wood was left of that building where it had been. And you had to wonder how that happened. Unless the wind picked that car up and just swirled it around and just set it down there. You had to wonder."
PRESLEY - "That’s amazing. Probably something to do with the rotation of the tornado."
===============================
23
%% From http://lwf.ncdc.noaa.gov/oa/reports/mitch/mitch:
“In an awesome display of power and destruction, Hurricane Mitch will be remembered as the most deadly hurricane to strike the Western Hemisphere in the last two centuries! Not since the Great Hurricane of 1780, which killed approximately 22,000 people in the eastern Caribbean, was there a more deadly hurricane. Mitch struck Central America with such viciousness that it was nearly a week before the magnitude of the disaster began to reach the outside world. The death toll currently is reported as 11,000 with thousands of others missing. Though the final death toll will never be known, it is quite likely that Mitch directly killed more people than any Atlantic hurricane in over 200 years. More than three million people were either homeless or severely affected. In this extremely poor third world region of the globe, estimates of the total damage from the storm are at $5 billion and rising. The President of Honduras, Carlos Flores Facusse, claimed the storm destroyed 50 years of progress. Table 1 lists the top seven most deadly hurricanes ever witnessed in the Western Hemisphere. Mitch is ranked number 2, a rank which will likely stand for a long, long time.
Within four days of its birth as a tropical depression on October 22, 1998, Mitch had grown into a Category 5 storm on the Saffir-Simpson Hurricane Scale . By 2100 UTC on October 26, the monster storm had deepened to a pressure of 905 millibars with sustained winds of 155 knots (180 mph) and gusts well over 200 mph! Mitch thus became tied for the fourth strongest Atlantic hurricane on record based upon barometric pressure values. After threatening Jamaica and the Cayman Islands, Mitch moved westward and by 2100 UTC on October 27, the Category 5 storm was about 60 miles north of Trujilo on the north coast of Honduras. Preliminary wave height estimates north of Honduras during this time at the height of the hurricane are as high as 44 feet, according to one wave model. Although its ferocious winds began to abate slowly, it took Mitch two days to drift southward to make landfall. Coastal regions and the offshore Honduran island of Guanaja were devastated. Mitch then began a slow westward drift through the mountainous interior of Honduras, finally reaching the border with Guatemala two days later on October 31.
Although the ferocity of the winds decreased during the westward drift, the storm produced enormous amounts of precipitation caused in part by the mountains of Central America. As Mitch's feeder bands swirled into its center from both the Caribbean and the Pacific Ocean to its south, the stage was set for a disaster of epic proportions. Taking into account the orographic effects by the volcanic peaks of Central America and Mitch's slow movement, rain fell at the rate of a foot or two per day in many of the mountainous regions. Total rainfall has been reported as high as 75 inches for the entire storm. The resulting floods and mud slides virtually destroyed the entire infrastructure of Honduras and devastated parts of Nicaragua, Guatemala, Belize, and El Salvador. Whole villages and their inhabitants were swept away in the torrents of flood waters and deep mud that came rushing down the mountainsides. Hundreds of thousands of homes were destroyed.
Though the pressure began rising six hours later, Mitch remained at Category 5 status
for a continuous period of 33 hours - the longest continuous period for a Category 5 storm since the 36 consecutive hours by Hurricane David in 1979. In addition, Mitch maintained sustained winds of 155 knots for 15 hours - the third longest period of such winds on record after the continuous 18 hours of 155 knot winds or higher by Hurricane Camille in 1969 and Hurricane Dog in 1950. Though exact comparisons are suspect due to differing frequencies in observation times (3-hourly versus 6-hourly observations) and a bias in earlier years toward higher estimated wind speeds, it is quite apparent that Mitch was one of the stronger storms ever recorded in the Atlantic.
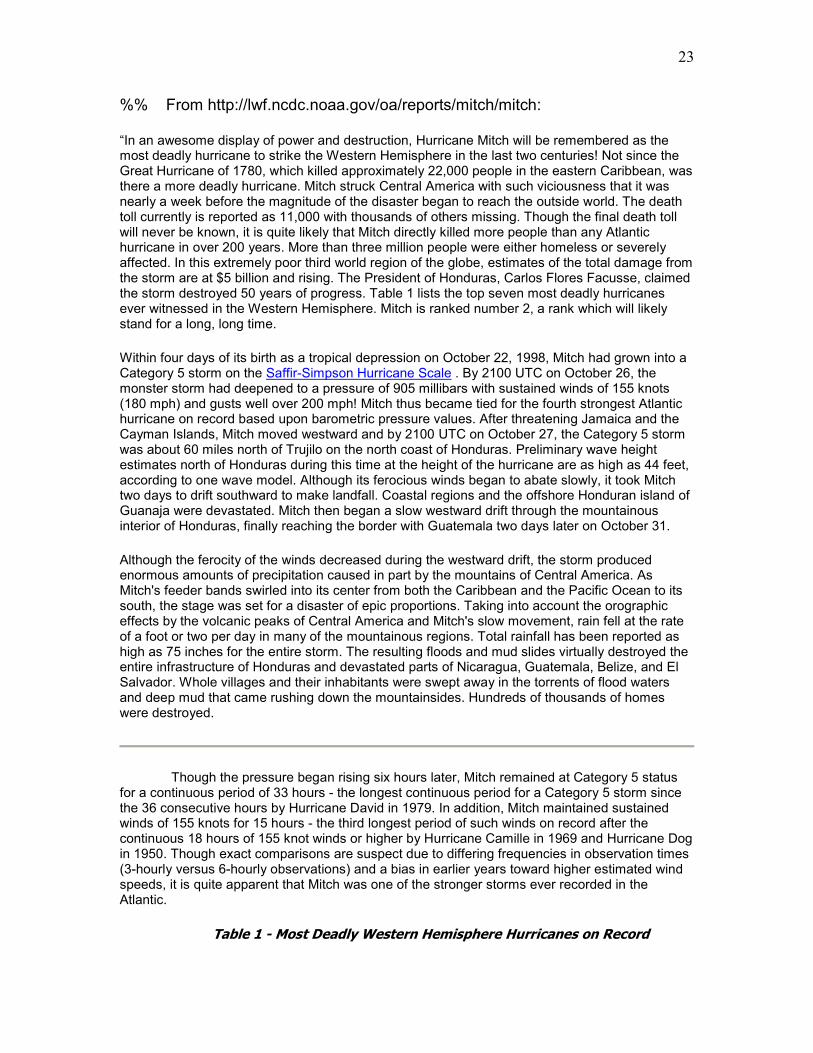
Table 1 - Most Deadly Western Hemisphere Hurricanes on Record
24
Hurricane Date Areas Struck Deaths
"The Great Hurricane" October 10-16, 1780
Martinique St. Eustatius
Barbados Ships
22,000
Hurricane Mitch Oct 26 - Nov 4, 1998 Central America:
Honduras Nicaragua
11,000+
Galveston, Texas September 8, 1900 Galveston Island 8,000
Hurricane Fifi September 14 -19, 1974 Honduras 8,000
Dominican Republic September 1-6, 1930 Dominican Republic 8,000
Hurricane Flora Sep 30, 1963 - Oct 8, 1963 Haiti Cuba 7,200
Martinique September 6, 1776 Point Petre Bay >6,000
Reference: 1995: Rappaport, Edward N. and Fernandez-Partagas, Jose; "The Deadliest Atlantic Tropical Cyclones, 1492-1994," NOAA Technical Memorandum NWS NHC-47, National Hurricane Center, 41 pp.
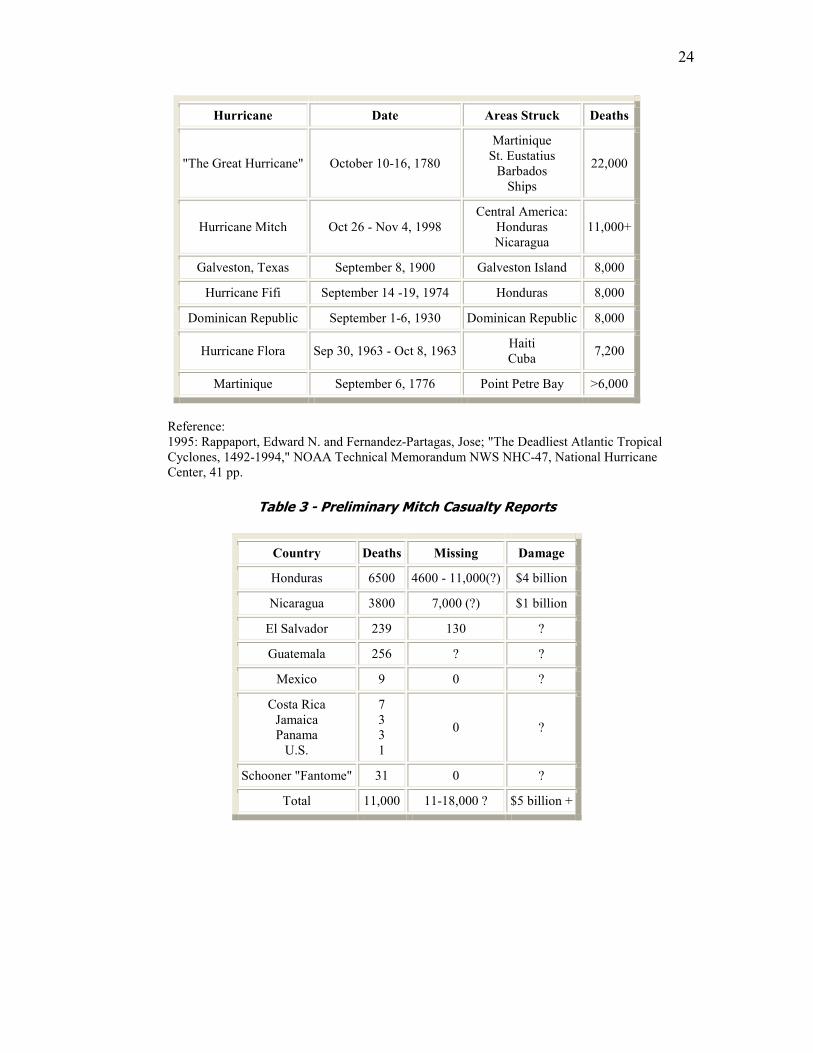
Table 3 - Preliminary Mitch Casualty Reports
Country Deaths Missing Damage
Honduras 6500 4600 - 11,000(?) $4 billion
Nicaragua 3800 7,000 (?) $1 billion
El Salvador 239 130 ?
Guatemala 256 ? ?
Mexico 9 0 ?
Costa Rica Jamaica Panama
U.S.
7 3 3 1
0 ?
Schooner "Fantome" 31 0 ?
Total 11,000 11-18,000 ? $5 billion +