Embed Size (px)
Citation preview
STATISTICAL SUMMARY
Air Transportation
Occurrences in 2020
Transportation Safety Board of Canada
Place du Centre
200 Promenade du Portage, 4th floor
Gatineau QC K1A 1K8
819-994-3741
1-800-387-3557
www.tsb.gc.ca
© Her Majesty the Queen in Right of Canada, as represented by
the Transportation Safety Board of Canada, 2021
Statistical summary: air transportation occurrences in 2020
Cat. No. TU1-17E-PDF
ISSN 2562-6655
This document is available on the website of the
Transportation Safety Board of Canada at www.tsb.gc.ca
Le présent rapport est également disponible en français.
Table of contents
COVID-19 impacts on civil aviation in Canada ........................................................ 2
Overview of accidents and fatalities ............................................................................ 5
Accident counts ........................................................................................................................................... 5
Accident rate ................................................................................................................................................. 9
Overview of incidents ..................................................................................................... 15
Incident counts.......................................................................................................................................... 15
Data tables .......................................................................................................................... 17
Definitions ........................................................................................................................... 35
Aviation occurrence ................................................................................................................................ 35
Reportable aviation accident ............................................................................................................... 35
Reportable aviation incident................................................................................................................ 35
Collision ....................................................................................................................................................... 36
Risk of collision ......................................................................................................................................... 36
Loss of separation .................................................................................................................................... 36
Serious injury ............................................................................................................................................. 36
Operation .................................................................................................................................................... 37
Operator ...................................................................................................................................................... 37
Commercial operators ............................................................................................................................ 37
Airliner .......................................................................................................................................................... 37
Commuter aircraft .................................................................................................................................... 37
Aerial work aircraft................................................................................................................................... 37
Air taxi aircraft ........................................................................................................................................... 37
State operators.......................................................................................................................................... 38
Private operators ...................................................................................................................................... 38
Recreational operators ........................................................................................................................... 38

Statistical Summary: Air Transportation Occurrences in 2020 ◼ 1
Statistical Summary
Air Transportation Occurrences in 2020
The TSB gathers and uses transportation occurrence data during the course of its investigations to analyze
safety deficiencies and identify risks in the Canadian air transportation system.
It should be noted that certain characteristics of the data constrain statistical analysis and identification of
emerging trends. These include the small totals of accidents and incidents, the large variability in the data
from year to year, and changes to regulations and definitions. The reader is cautioned to keep these
limitations in mind when reading this summary to avoid drawing conclusions that cannot be supported by
statistical analysis.
Throughout this document, there are instances where categories of occurrences sum to more than the
total number of occurrences. For example, if a single occurrence involves an airplane and a glider, the
occurrence count will increase by one in each aircraft category but the occurrence itself will be counted
only once in the total of occurrences.
The 2020 data were collected according to the reporting requirements described in the Transportation
Safety Board Regulations in force during that calendar year.
The statistics presented here reflect the TSB Aviation Safety Information System (ASIS) database at 9 April
2021. Since the occurrence data are constantly being updated in the live database, the statistics may
change slightly over time.
Also, as many occurrences are limited to data gathering, information recorded on some occurrences may
not have been verified.
2 ◼ Transportation Safety Board of Canada
COVID-19 impacts on civil aviation in Canada
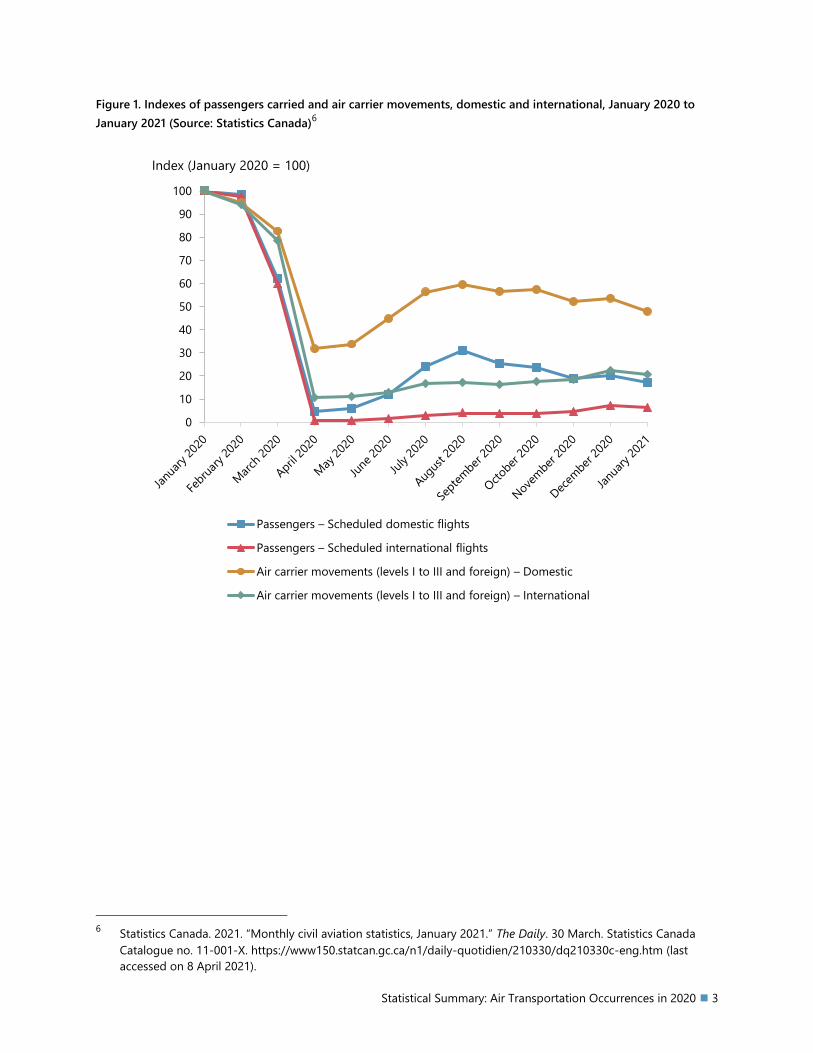
In early 2020, a new coronavirus began to affect air passenger travel in China and Hong Kong. By mid-
March, broad travel restrictions were in place in Canada and around the world in an effort to contain the
virus. The impact on commercial aviation was immediate, widespread, and lasting, with air transportation
activity in Canada being greatly reduced during most of 2020. In April of 2020, total aircraft movements at
major airports1 in Canada were roughly 75% fewer than in 2019. While domestic itinerant movements
slowly resumed over the remainder of the year, total traffic continued to be greatly reduced. In January of
2021, total aircraft movements at major Canadian airports remained 30% fewer than in January of 2020.2
Major Canadian airlines carried 797 000 passengers in January of 2021, which is 89% fewer than a year
before.3 Notably, Statistics Canada data for major airports indicate that itinerant (point-to-point)
movements were down 41% in calendar year 2020 compared to 2019, but local movements (returning to
where they took off) were down by only 20% for the same periods.4 Unfortunately, data for small airports
(without NAV CANADA towers or flight service stations) are no longer available from Statistics Canada.
Although passenger air carriers greatly reduced their activity during 2020, other sectors of the air
transportation industry were less affected by COVID-19 restrictions. There is evidence that smaller aircraft
continued to operate during much of 2020 at levels that were similar to 2019. Flight training units, aerial
work, and air taxi operations, as well as recreational flying, were less affected than major airlines. Statistics
Canada estimates of aviation fuel consumption5 are revealing: compared with 2019, average monthly
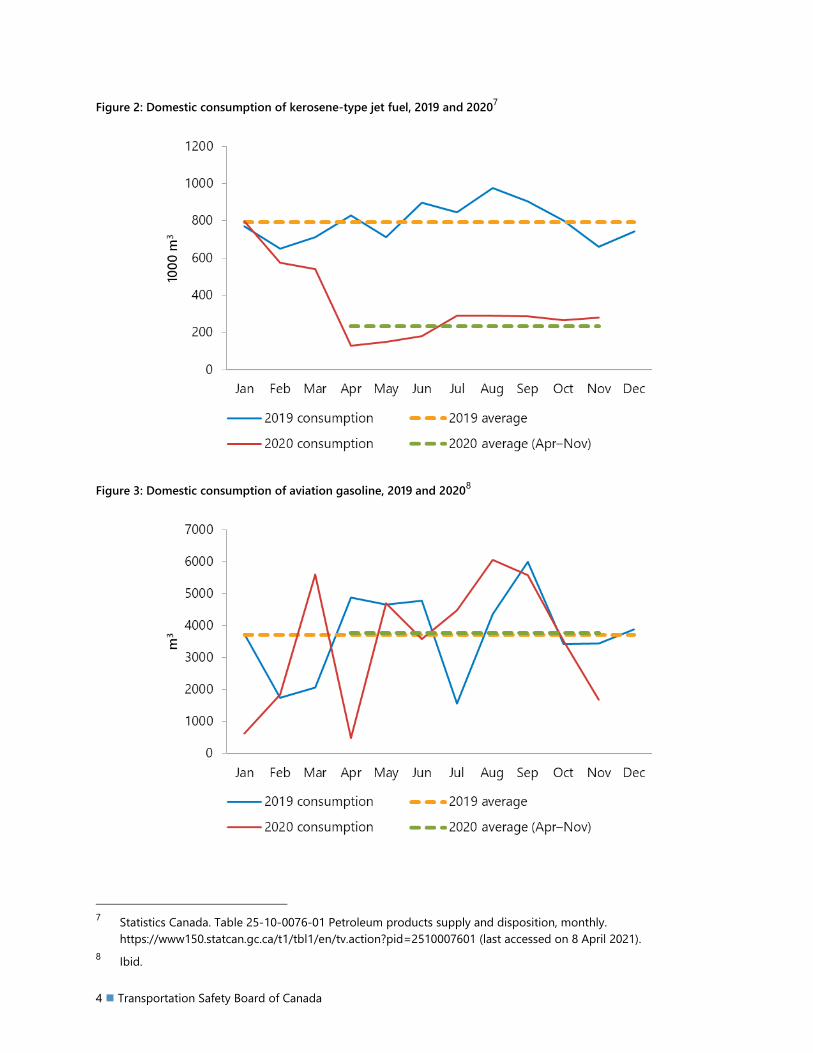
consumption of kerosene-type jet fuel in 2020 (April to November) fell by almost 75%. This is consistent
with the activity decrease seen for large passenger aircraft. However, consumption of aviation gasoline—
used in smaller, piston-powered aircraft—did not decrease (on average) for the same period.
The above patterns in civil aviation activity informs the discussion of accident and incident counts for
2020, which is presented below.
1 Major airports are the 90 Canadian airports with NAV CANADA air traffic control towers and flight service
stations.
2 Statistics Canada. 2021. “Aircraft movement statistics: Major airports, January 2021.” The Daily. 30 March.
Statistics Canada Catalogue no. 11-001-X. https://www150.statcan.gc.ca/n1/daily-quotidien/210330/dq210330d-
eng.htm (last accessed on 8 April 2021).
3 Ibid.
4 Statistics Canada. From the following tables:
• Table 23-10-0002-01 Aircraft movements, by class of operation and peak hour and peak day of movements, for
airports with NAV CANADA towers, monthly.
https://www150.statcan.gc.ca/t1/tbl1/en/tv.action?pid=2310000201. DOI:
https://doi.org/10.25318/2310000201-eng.
• Table 23-10-0009-01 Aircraft movements, by class of operation and peak hour and peak day of movements,
airports with NAV CANADA flight service stations, monthly.
https://www150.statcan.gc.ca/t1/tbl1/en/tv.action?pid=2310000901. DOI:
https://doi.org/10.25318/2310000901-eng.
5 Statistics Canada. Table 25-10-0076-01 Petroleum products supply and disposition, monthly, inactive.
https://www150.statcan.gc.ca/t1/tbl1/en/cv!recreate.action?pid=2510007601&selectedNodeIds=2D6,3D2,3D6&c
heckedLevels=0D1,3D1&refPeriods=20190101,20201201&dimensionLayouts=layout3,layout2,layout2,layout3,lay
out3&vectorDisplay=false (last accessed on 8 April 2021).
Statistical Summary: Air Transportation Occurrences in 2020 ◼ 3
Figure 1. Indexes of passengers carried and air carrier movements, domestic and international, January 2020 to
January 2021 (Source: Statistics Canada)6
6 Statistics Canada. 2021. “Monthly civil aviation statistics, January 2021.” The Daily. 30 March. Statistics Canada
Catalogue no. 11-001-X. https://www150.statcan.gc.ca/n1/daily-quotidien/210330/dq210330c-eng.htm (last
accessed on 8 April 2021).
0
10
20
30
40
50
60
70
80
90
100
Index (January 2020 = 100)
Passengers – Scheduled domestic flights
Passengers – Scheduled international flights
Air carrier movements (levels I to III and foreign) – Domestic
Air carrier movements (levels I to III and foreign) – International
4 ◼ Transportation Safety Board of Canada
Figure 2: Domestic consumption of kerosene-type jet fuel, 2019 and 20207
Figure 3: Domestic consumption of aviation gasoline, 2019 and 20208
7 Statistics Canada. Table 25-10-0076-01 Petroleum products supply and disposition, monthly.
https://www150.statcan.gc.ca/t1/tbl1/en/tv.action?pid=2510007601 (last accessed on 8 April 2021).
8 Ibid.
Statistical Summary: Air Transportation Occurrences in 2020 ◼ 5
Overview of accidents and fatalities
Accident counts
Air transportation occurrences are reportable to the TSB if they occur in Canada. They are also reportable
outside of Canada if they involve Canadian-registered aircraft, and meet the criteria laid out in the TSB
Regulations.9
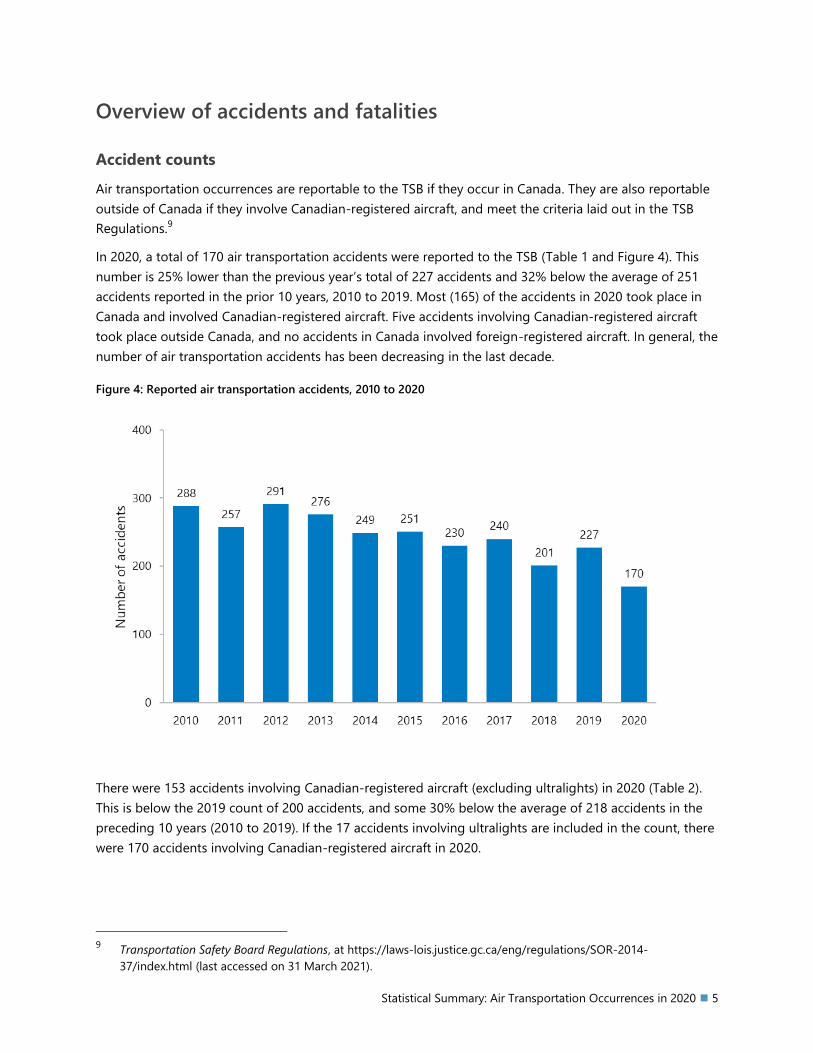
In 2020, a total of 170 air transportation accidents were reported to the TSB (Table 1 and Figure 4). This
number is 25% lower than the previous year’s total of 227 accidents and 32% below the average of 251
accidents reported in the prior 10 years, 2010 to 2019. Most (165) of the accidents in 2020 took place in
Canada and involved Canadian-registered aircraft. Five accidents involving Canadian-registered aircraft
took place outside Canada, and no accidents in Canada involved foreign-registered aircraft. In general, the
number of air transportation accidents has been decreasing in the last decade.
Figure 4: Reported air transportation accidents, 2010 to 2020
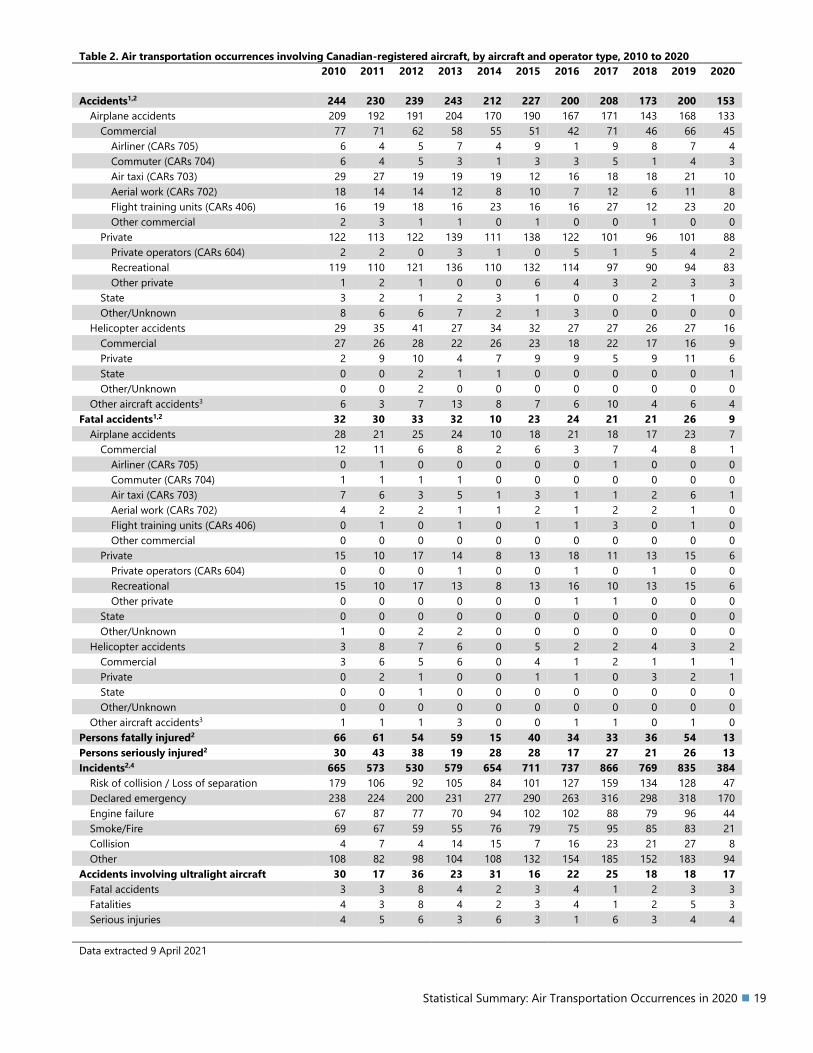
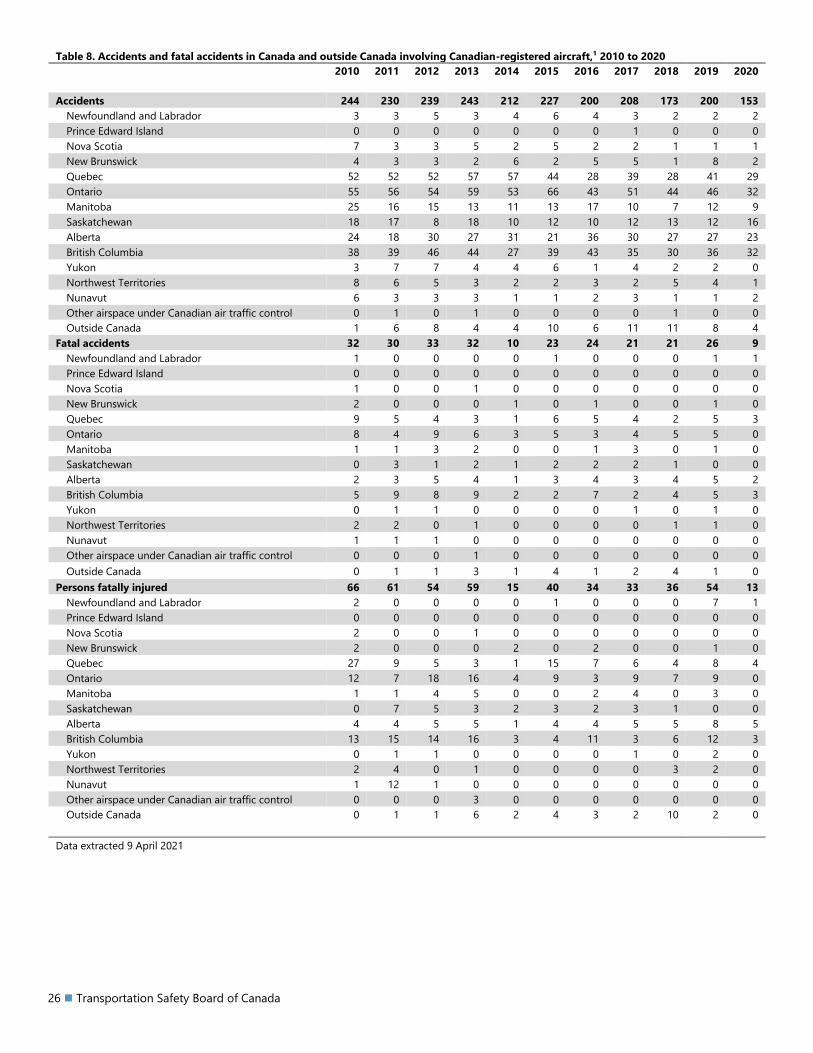
There were 153 accidents involving Canadian-registered aircraft (excluding ultralights) in 2020 (Table 2).
This is below the 2019 count of 200 accidents, and some 30% below the average of 218 accidents in the
preceding 10 years (2010 to 2019). If the 17 accidents involving ultralights are included in the count, there
were 170 accidents involving Canadian-registered aircraft in 2020.
9 Transportation Safety Board Regulations, at https://laws-lois.justice.gc.ca/eng/regulations/SOR-2014-
37/index.html (last accessed on 31 March 2021).
6 ◼ Transportation Safety Board of Canada
Aircraft type
Of the 170 air transportation accidents reported to the TSB in 2020, 133 (78%) involved fixed-wing,
powered airplanes (other than ultralights) (Table 1), 16 (9%) involved helicopters, 17 (10%) involved
ultralights, and 4 accidents (2%) involved other types of aircraft. In the 10 years from 2010 to 2019, the
average proportion of accidents involving each of these 4 types of aircraft has remained fairly constant:
airplanes have been involved in roughly 75% of reportable accidents each year, helicopters in about 12%
of accidents, ultralights in about 10%, and other aircraft in about 3% of accidents each year.
Operator type
There were 54 accidents that involved commercially-operated aircraft in 2020 (Table 1). This is fewer than
the 83 such accidents recorded in 2019, and 36% below the average of 85 accidents recorded in the 10
years 2010–2019.
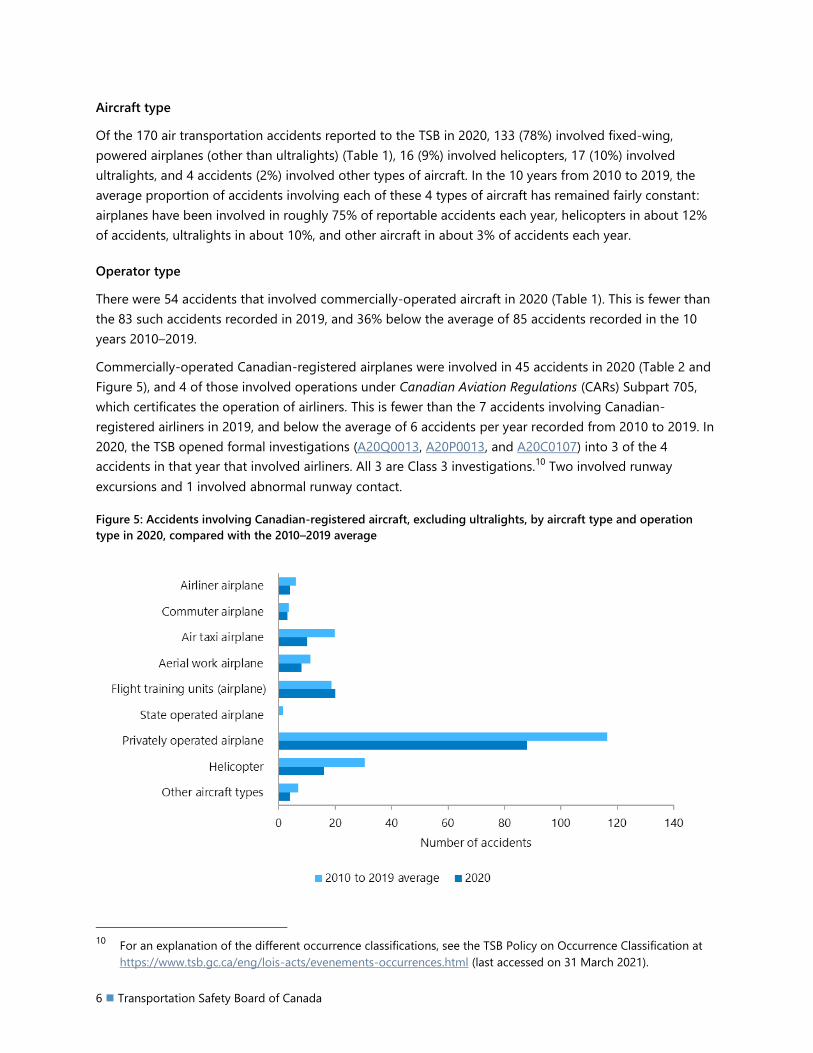
Commercially-operated Canadian-registered airplanes were involved in 45 accidents in 2020 (Table 2 and
Figure 5), and 4 of those involved operations under Canadian Aviation Regulations (CARs) Subpart 705,
which certificates the operation of airliners. This is fewer than the 7 accidents involving Canadian-
registered airliners in 2019, and below the average of 6 accidents per year recorded from 2010 to 2019. In
2020, the TSB opened formal investigations (A20Q0013, A20P0013, and A20C0107) into 3 of the 4
accidents in that year that involved airliners. All 3 are Class 3 investigations.10 Two involved runway
excursions and 1 involved abnormal runway contact.
Figure 5: Accidents involving Canadian-registered aircraft, excluding ultralights, by aircraft type and operation
type in 2020, compared with the 2010–2019 average
10
For an explanation of the different occurrence classifications, see the TSB Policy on Occurrence Classification at
https://www.tsb.gc.ca/eng/lois-acts/evenements-occurrences.html (last accessed on 31 March 2021).
Statistical Summary: Air Transportation Occurrences in 2020 ◼ 7
Also in 2020, there were 3 accidents involving Canadian-registered commuter airplanes operating under
CARs Subpart 704 (Table 2), as well as 13 accidents involving air taxi operations (CARs Subpart 703)—10
involving airplanes and 3 involving helicopters. These 13 air taxi accidents are substantially fewer than the
26 seen in 2019, and far below the average of 31 accidents per year between 2010 and 2019. Flight
training units operating under CARs Subpart 406 were involved in 20 accidents in 2020, all of which
involved airplanes (as opposed to helicopters). On average for the period 2010 to 2019, flight training
units reported about 19 airplane and 1 helicopter accidents per year.
Overall in 2020, 114 air transportation accidents involved non-commercial (i.e., private aircraft) operations
(Table 1), compared to 143 in the preceding year. This is 28% below the annual average of 159 accidents
from 2010 to 2019. Of the 114 total accidents in the non-commercial (private aircraft) operations
category, 88 involved Canadian-registered airplanes (Table 2), and 2 of these 88 were operating under
CARs Subpart 604 with a Private Operator Registration Document (PORD).
Most operators of non-commercial (private) aircraft are classified as recreational operators. Recreational
operators are responsible for a significant amount of flying activity, and are involved in many accidents
each year. In 2020, 109 accidents involved recreational operators (Table 1). This figure is down 18% from
the previous year’s count, and 28% below the average (152) for the period 2010 to 2019.
In addition to commercial, private and recreational operations, 1 accident in 2020 involved a remotely-
piloted aircraft system (RPAS), or “drone”, which was operated with a special flight operations certificate
(SFOC) and was categorized as an ‘other’ operator type.
Province or territory
Ontario, with 39 reported accidents (all aircraft types, including ultralights), was the province with the
largest number of reported accidents in 2020, as it was in the previous 3 years (Table 7; data not shown).
Ontario also averaged more accidents per year (63) in the 2010–2019 period than any other province or
territory, with Quebec having the second-largest average accident count (54) for the same period. British
Columbia and Alberta also have high average accident counts compared with the remaining provinces
and territories.
Altogether, 5 accidents that were reportable under TSB Regulations occurred outside Canada in 2020.
These involved 3 airplanes, 1 helicopter and 1 ultralight.
The number of accidents involving Canadian-registered aircraft (excluding ultralights) by province or
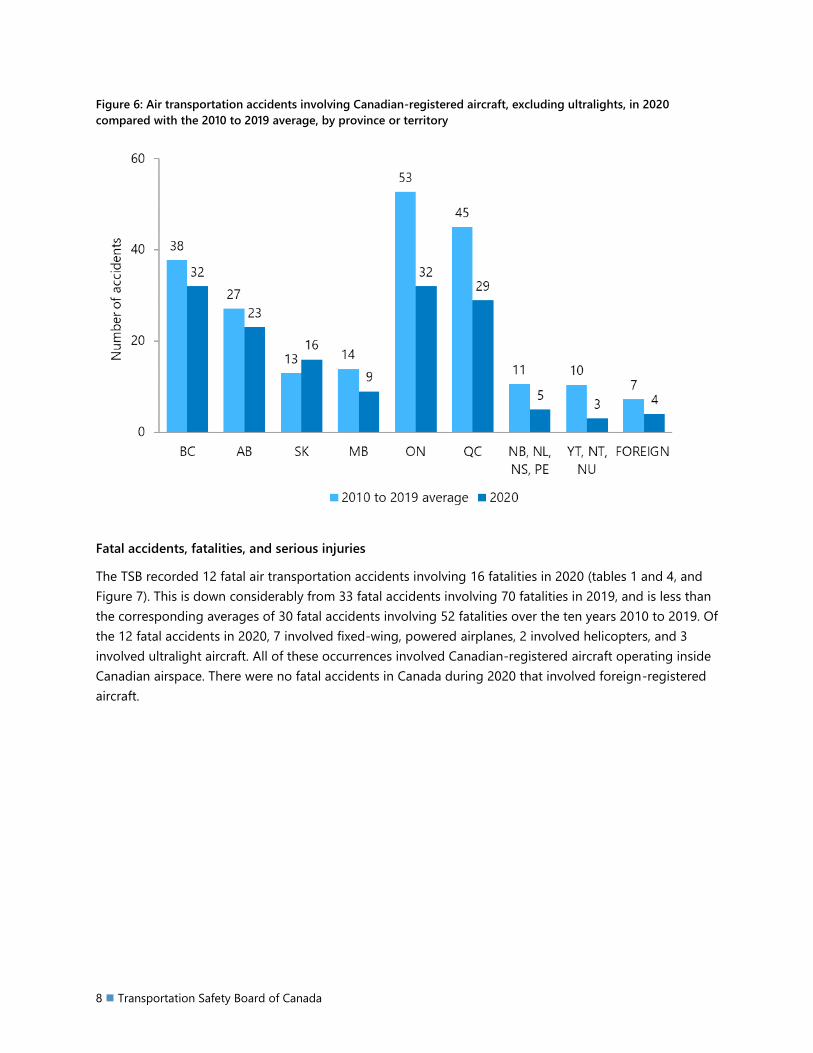
territory (Table 8) is shown in Figure 6. There were 32 accidents reported in Ontario involving Canadian-
registered aircraft in 2020, which is 39% below the average number (53) for the years 2010 to 2019.
Saskatchewan was the only province to have an increase in the number of accidents in 2020, with 16
accidents during 2020 compared to 12 in 2019, a 33% increase.
8 ◼ Transportation Safety Board of Canada
Figure 6: Air transportation accidents involving Canadian-registered aircraft, excluding ultralights, in 2020
compared with the 2010 to 2019 average, by province or territory
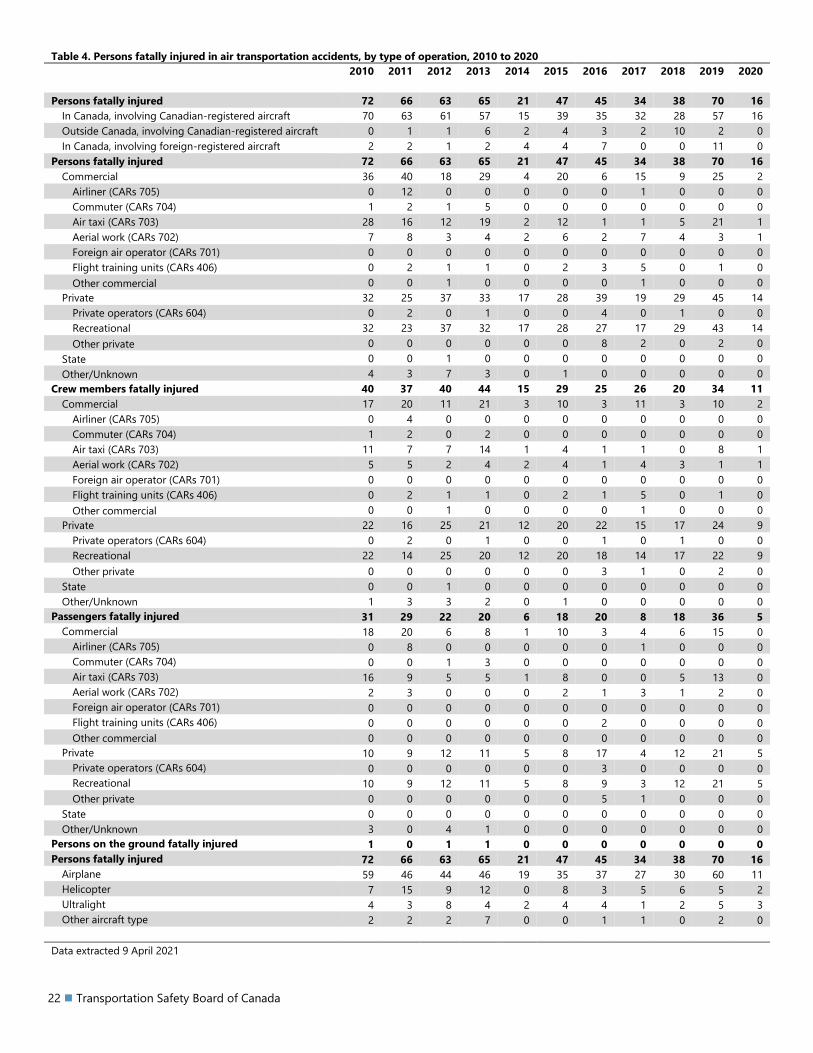
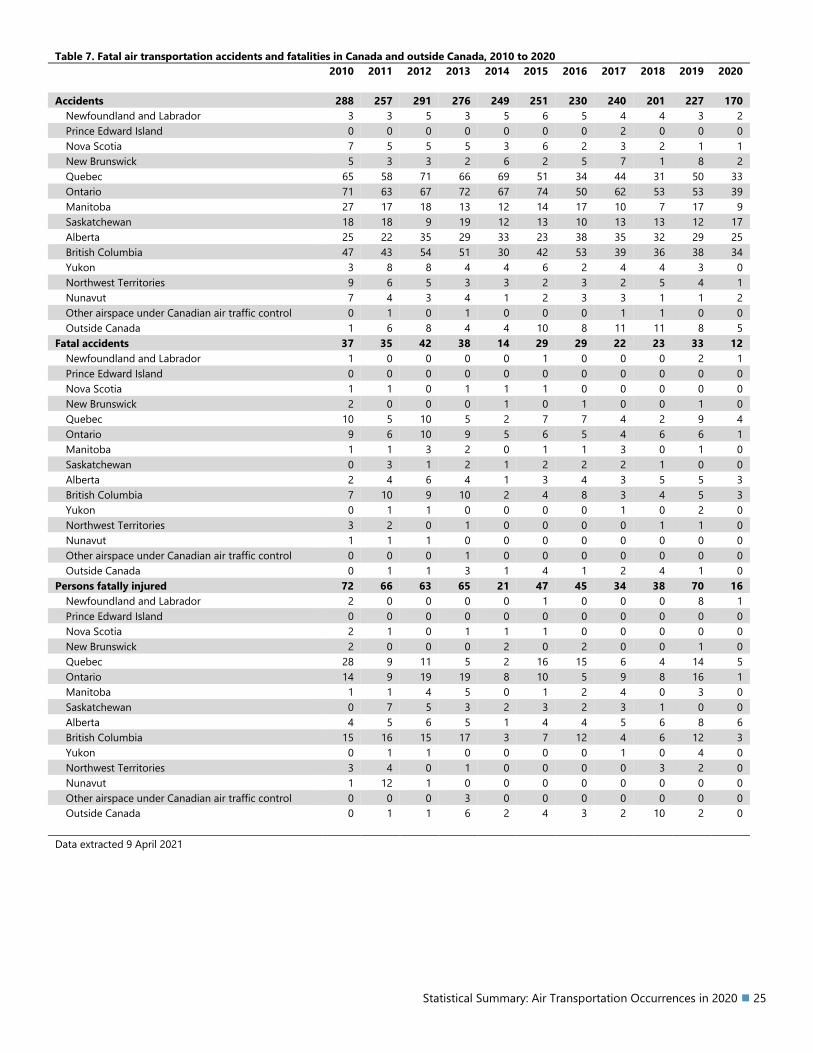
Fatal accidents, fatalities, and serious injuries
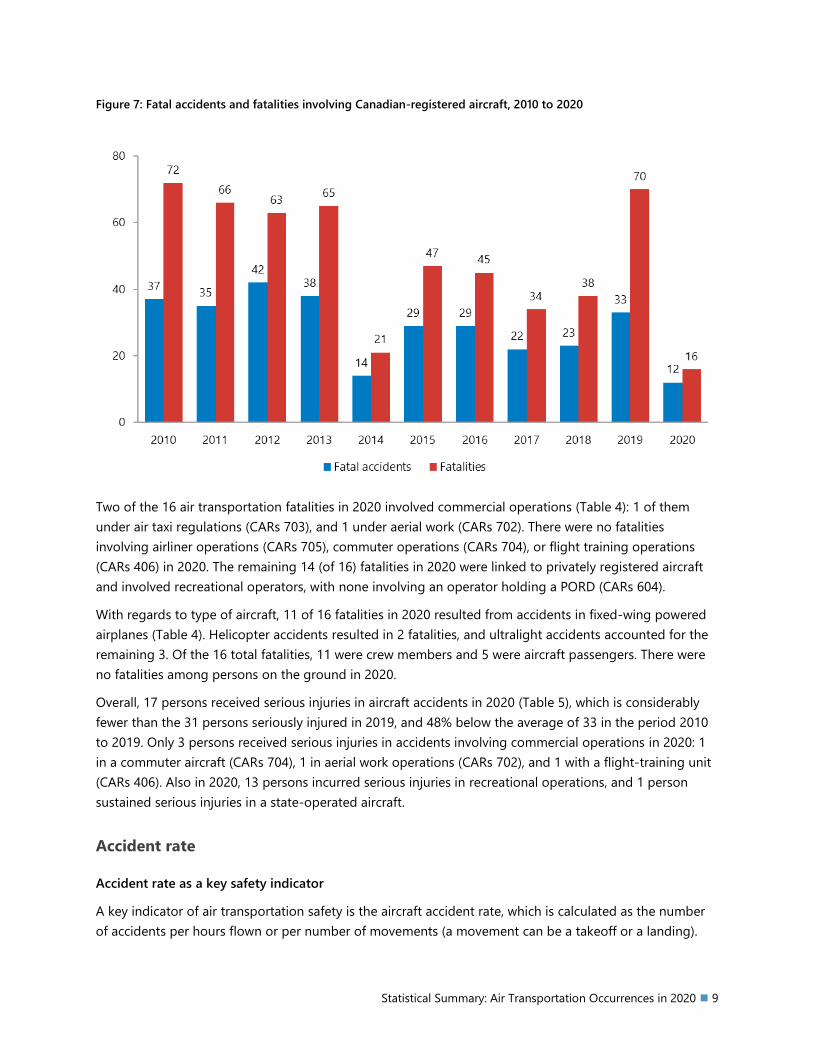
The TSB recorded 12 fatal air transportation accidents involving 16 fatalities in 2020 (tables 1 and 4, and
Figure 7). This is down considerably from 33 fatal accidents involving 70 fatalities in 2019, and is less than
the corresponding averages of 30 fatal accidents involving 52 fatalities over the ten years 2010 to 2019. Of
the 12 fatal accidents in 2020, 7 involved fixed-wing, powered airplanes, 2 involved helicopters, and 3
involved ultralight aircraft. All of these occurrences involved Canadian-registered aircraft operating inside
Canadian airspace. There were no fatal accidents in Canada during 2020 that involved foreign-registered
aircraft.
Statistical Summary: Air Transportation Occurrences in 2020 ◼ 9
Figure 7: Fatal accidents and fatalities involving Canadian-registered aircraft, 2010 to 2020
Two of the 16 air transportation fatalities in 2020 involved commercial operations (Table 4): 1 of them
under air taxi regulations (CARs 703), and 1 under aerial work (CARs 702). There were no fatalities
involving airliner operations (CARs 705), commuter operations (CARs 704), or flight training operations
(CARs 406) in 2020. The remaining 14 (of 16) fatalities in 2020 were linked to privately registered aircraft
and involved recreational operators, with none involving an operator holding a PORD (CARs 604).
With regards to type of aircraft, 11 of 16 fatalities in 2020 resulted from accidents in fixed-wing powered
airplanes (Table 4). Helicopter accidents resulted in 2 fatalities, and ultralight accidents accounted for the
remaining 3. Of the 16 total fatalities, 11 were crew members and 5 were aircraft passengers. There were
no fatalities among persons on the ground in 2020.
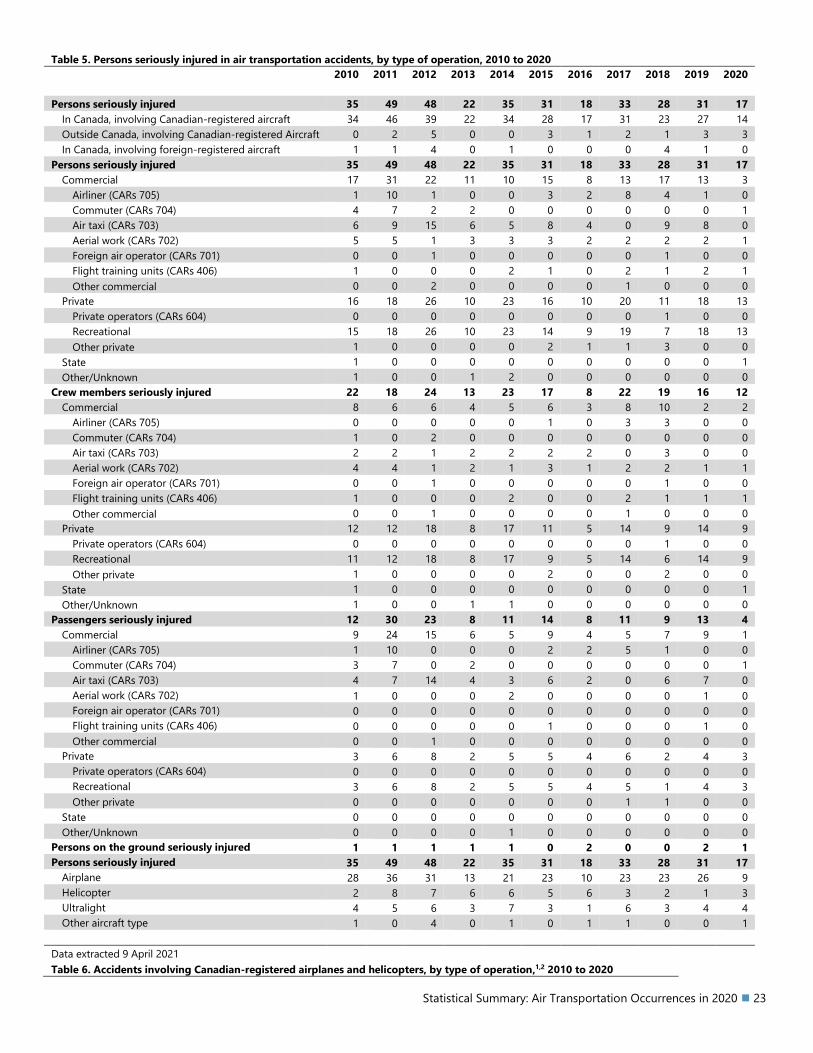
Overall, 17 persons received serious injuries in aircraft accidents in 2020 (Table 5), which is considerably
fewer than the 31 persons seriously injured in 2019, and 48% below the average of 33 in the period 2010
to 2019. Only 3 persons received serious injuries in accidents involving commercial operations in 2020: 1
in a commuter aircraft (CARs 704), 1 in aerial work operations (CARs 702), and 1 with a flight-training unit
(CARs 406). Also in 2020, 13 persons incurred serious injuries in recreational operations, and 1 person
sustained serious injuries in a state-operated aircraft.
Accident rate
Accident rate as a key safety indicator
A key indicator of air transportation safety is the aircraft accident rate, which is calculated as the number
of accidents per hours flown or per number of movements (a movement can be a takeoff or a landing).
10 ◼ Transportation Safety Board of Canada
Analyzing trends of accident rates for different types of operators can signal emerging safety issues
associated with specific operator types and activities.
Activity data (e.g., flight hours) broken out by operator type11 are required to calculate accident rates that
enable trend analysis of specific operator types over time, or support comparisons across operator types
or geographical regions.
Until 2010, Transport Canada provided activity data broken out by operator type, and the TSB used these
data to calculate and publish accident rates across operator types. Since 2010, however, Transport Canada
no longer provides hours-flown activity data breakouts by operator type, because it had concerns
regarding the accuracy of those data, which, for some operators that operated under more than one
subpart of the CARs, were collectively reported only under the most restrictive CARs subpart.
Reporting all hours for all subparts under a single total conflates and confounds airline and commuter
activity, as well as the activity of many smaller air operators that carry out operations under multiple
subparts of the CARs (commuter, air taxi, and/or aerial work) and report their activity as a single total.
Furthermore, movement data as presently reported by Statistics Canada12 come from a survey that covers
all aircraft movements at major Canadian airports with NAV CANADA air traffic control towers and flight
service stations, but as of April 2020, Statistics Canada no longer collects data about movements at small
airports without towers or flight service stations, and so activity at smaller airports is not reflected in the
data.
Because hours-flown and movement data are currently not categorized by CARs subpart when collected
by the Canadian government, there is no differentiation between sectors (e.g., air-taxi operators versus
airline operators) or between different types of aircraft (airplane, helicopter, floatplane). Therefore,
accident rates cannot be calculated for individual sectors of the industry.
Without hours-flown and movement data that are categorized by CARs subpart and aircraft type, it will be
more difficult for sector stakeholders to assess risks and determine if mitigation strategies being carried
out to improve safety are actually working.
Therefore, in 2019 the Board recommended that
the Department of Transport require all commercial operators to collect and report hours flown
and movement data for their aircraft by Canadian Aviation Regulations subpart and aircraft type,
and that the Department of Transport publish those data.
TSB Recommendation A19-05
11
The operator types in the CARs are: airline operations (Subpart 705), commuter operations (Subpart 704), air-taxi
operations (Subpart 703), aerial work (Subpart 702), foreign air operations (Subpart 701), and private operators
(Subpart 604).
12 Statistics Canada, “Aircraft Movement Statistics,” at
https://www23.statcan.gc.ca/imdb/p2SV.pl?Function=getSurvey&SDDS=2715 (last accessed on 6 April 2021).
Statistical Summary: Air Transportation Occurrences in 2020 ◼ 11
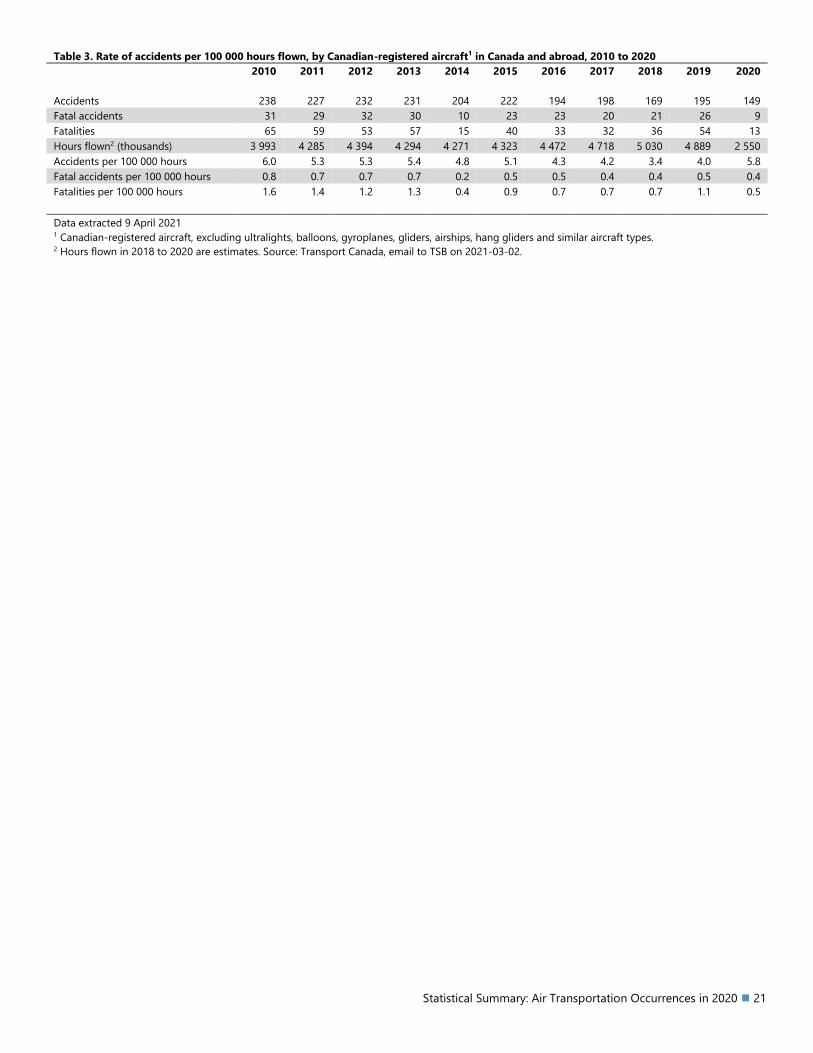
Accident rate for Canadian-registered aircraft, in Canada and abroad, per 100 000 hours flown
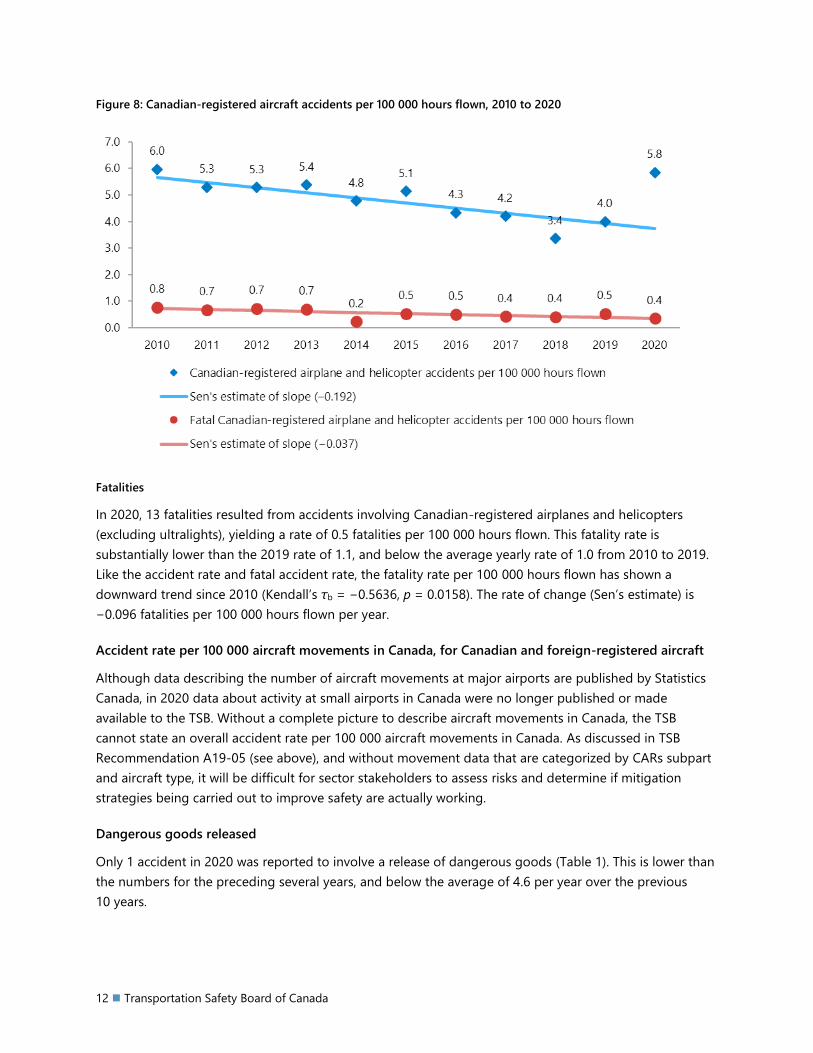
Overall accident rate
Transport Canada collects information about the number of hours flown by Canadian-registered aircraft.
The 2020 overall air transportation accident rate of 5.8 per 100 000 hours flown (Table 3) was calculated
based on the 149 accidents (24% below 2019) in Canada and abroad involving Canadian-registered
airplanes and helicopters (ultralights and other aircraft types are excluded), and the estimated 2 550 000
hours flown by Canadian-registered aircraft (48% below 2019).13 This rate is above the 2019 rate of 4.0
accidents per 100 000 flight hours, and 24% above the average rate of 4.7 accidents per 100 000 hours
flown each year over the previous 10 years. While the number of hours flown decreased by almost half in
2020 compared to 2019, the number of reported accidents decreased by a lesser amount – around 25%.
Taken together this means the accident rate statistic went up.
Despite the upward jump in accident rate in 2020, it remains statistically plausible that the accident rate
for Canadian-registered aircraft has been trending generally downward over the past 11 years. The
accident rate has fallen from about 6 accidents per 100 000 hours flown in 2010 to 4 in 2019, a reduction
of 33%, before rising again to 5.8 during 2020. Kendall’s tau-b (τb) correlation and Sen’s estimate of slope
were used to quantify the trend in Canadian-registered aircraft accident rate and fatal accident rate.
Kendall's τb correlation coefficient is a nonparametric measure of the strength and direction of association
that exists between two variables. Kendall’s τb was calculated on the 11-year series of accident rate values
by year from 2010 to 2020. There was a moderate, negative correlation that indicates a downward trend in
accident rate per 100 000 hours flown over the period (τb = −0.5273, p = 0.0240). Sen’s estimate of slope,
the amount of downward rate change per year, was −0.192 occurrences per 100 000 hours flown per year.
A graphical illustration is presented in Figure 8.
Fatal accidents
Figure 8 also illustrates a trend line for fatal accidents. For the 12 fatal accidents involving Canadian-
registered aircraft in 2020, the fatal accident rate was 0.4 per 100 000 hours flown. That rate is down from
the 2019 rate of 0.5, and is below the 2010 to 2019 average of 0.5 fatal accidents per 100 000 hours flown.
Although there is a downward trend to the series of fatal accident rates since 2010 (Kendall’s τb =
−0.6000, p = 0.0102), the slope of the trend is quite small: Sen’s estimate of slope is −0.037 fatal accidents
per 100 000 hours flown per year.
13
Source of estimated hours flown data: Transport Canada (email communication, 2 March 2021).
12 ◼ Transportation Safety Board of Canada
Figure 8: Canadian-registered aircraft accidents per 100 000 hours flown, 2010 to 2020
Fatalities
In 2020, 13 fatalities resulted from accidents involving Canadian-registered airplanes and helicopters
(excluding ultralights), yielding a rate of 0.5 fatalities per 100 000 hours flown. This fatality rate is
substantially lower than the 2019 rate of 1.1, and below the average yearly rate of 1.0 from 2010 to 2019.
Like the accident rate and fatal accident rate, the fatality rate per 100 000 hours flown has shown a
downward trend since 2010 (Kendall’s τb = −0.5636, p = 0.0158). The rate of change (Sen’s estimate) is
−0.096 fatalities per 100 000 hours flown per year.
Accident rate per 100 000 aircraft movements in Canada, for Canadian and foreign-registered aircraft
Although data describing the number of aircraft movements at major airports are published by Statistics
Canada, in 2020 data about activity at small airports in Canada were no longer published or made
available to the TSB. Without a complete picture to describe aircraft movements in Canada, the TSB
cannot state an overall accident rate per 100 000 aircraft movements in Canada. As discussed in TSB
Recommendation A19-05 (see above), and without movement data that are categorized by CARs subpart
and aircraft type, it will be difficult for sector stakeholders to assess risks and determine if mitigation
strategies being carried out to improve safety are actually working.
Dangerous goods released
Only 1 accident in 2020 was reported to involve a release of dangerous goods (Table 1). This is lower than
the numbers for the preceding several years, and below the average of 4.6 per year over the previous
10 years.
Statistical Summary: Air Transportation Occurrences in 2020 ◼ 13
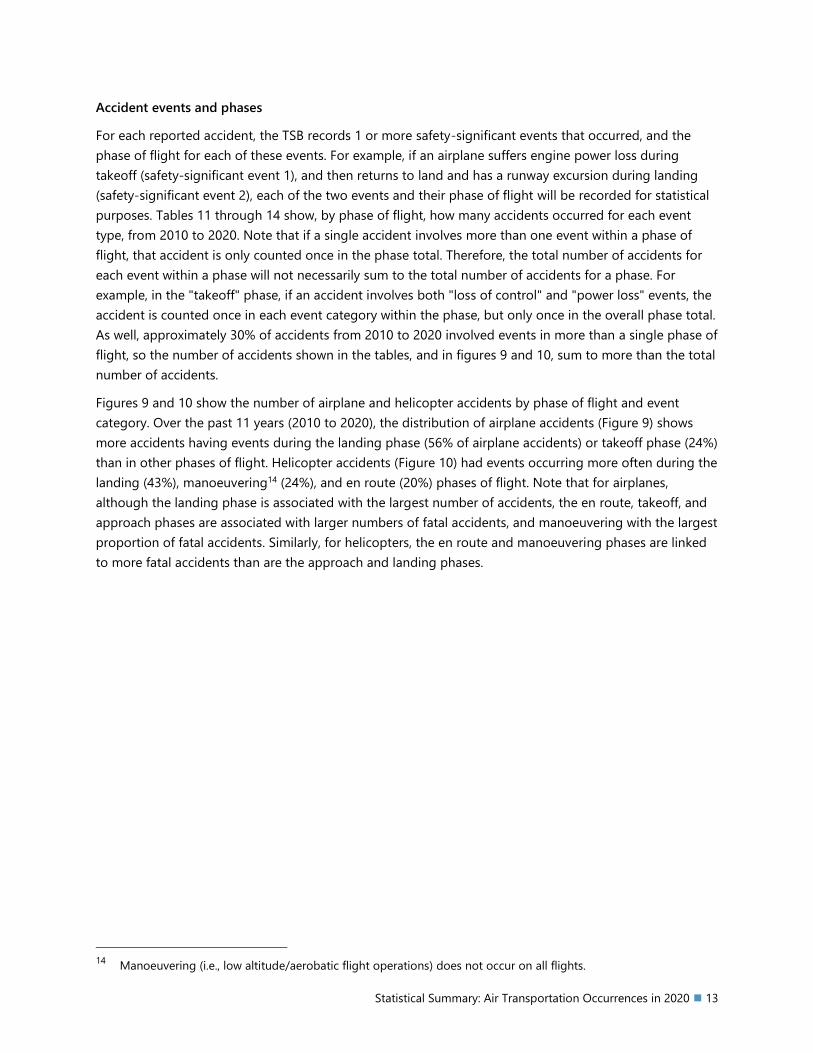
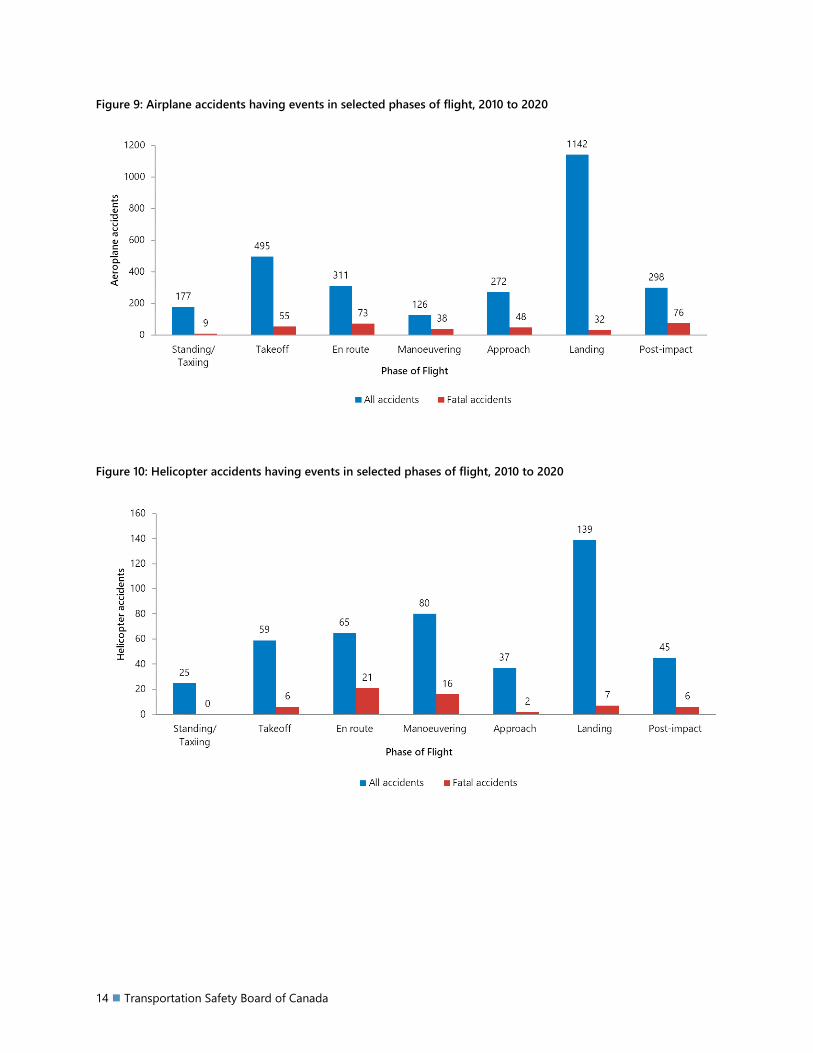
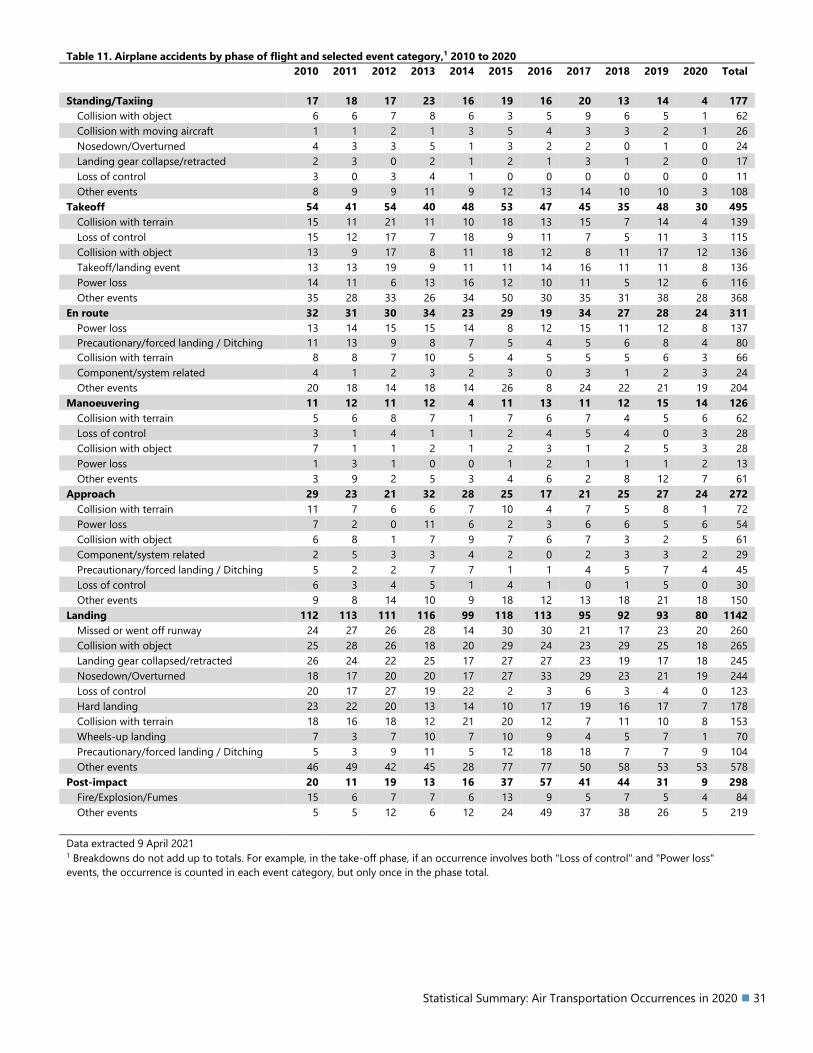
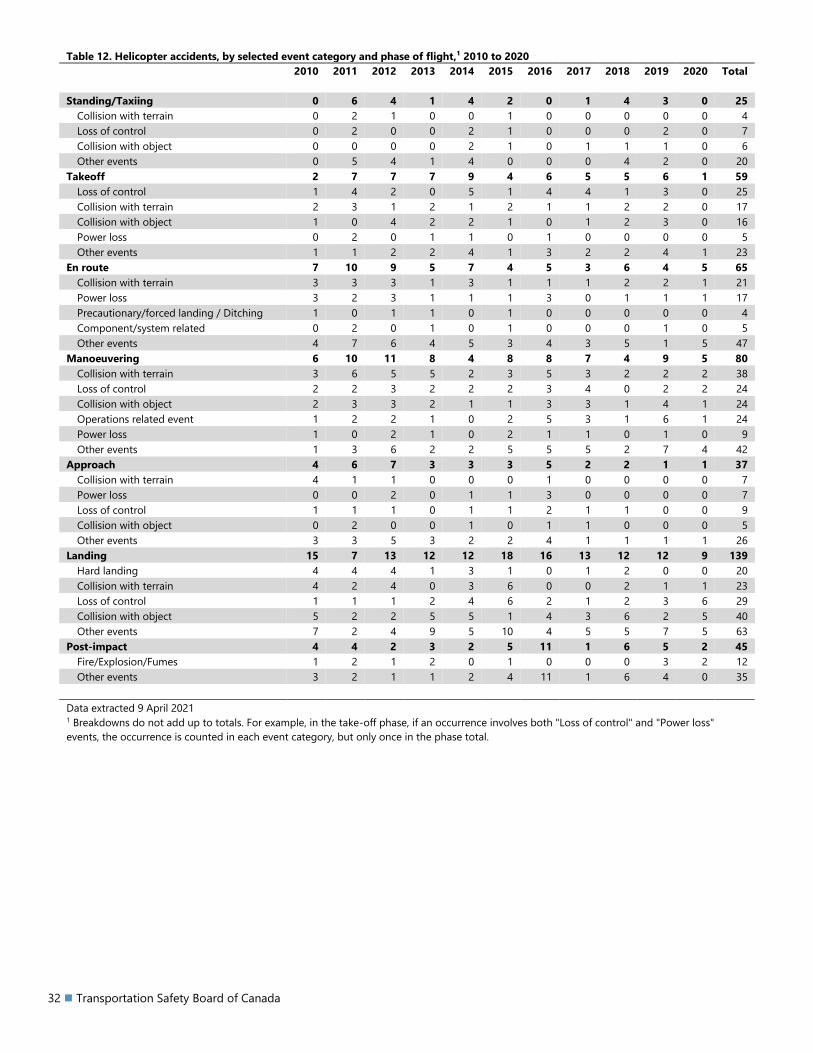
Accident events and phases
For each reported accident, the TSB records 1 or more safety-significant events that occurred, and the
phase of flight for each of these events. For example, if an airplane suffers engine power loss during
takeoff (safety-significant event 1), and then returns to land and has a runway excursion during landing
(safety-significant event 2), each of the two events and their phase of flight will be recorded for statistical
purposes. Tables 11 through 14 show, by phase of flight, how many accidents occurred for each event
type, from 2010 to 2020. Note that if a single accident involves more than one event within a phase of
flight, that accident is only counted once in the phase total. Therefore, the total number of accidents for
each event within a phase will not necessarily sum to the total number of accidents for a phase. For
example, in the "takeoff" phase, if an accident involves both "loss of control" and "power loss" events, the
accident is counted once in each event category within the phase, but only once in the overall phase total.
As well, approximately 30% of accidents from 2010 to 2020 involved events in more than a single phase of
flight, so the number of accidents shown in the tables, and in figures 9 and 10, sum to more than the total
number of accidents.
Figures 9 and 10 show the number of airplane and helicopter accidents by phase of flight and event
category. Over the past 11 years (2010 to 2020), the distribution of airplane accidents (Figure 9) shows
more accidents having events during the landing phase (56% of airplane accidents) or takeoff phase (24%)
than in other phases of flight. Helicopter accidents (Figure 10) had events occurring more often during the
landing (43%), manoeuvering14 (24%), and en route (20%) phases of flight. Note that for airplanes,
although the landing phase is associated with the largest number of accidents, the en route, takeoff, and
approach phases are associated with larger numbers of fatal accidents, and manoeuvering with the largest
proportion of fatal accidents. Similarly, for helicopters, the en route and manoeuvering phases are linked
to more fatal accidents than are the approach and landing phases.
14
Manoeuvering (i.e., low altitude/aerobatic flight operations) does not occur on all flights.
14 ◼ Transportation Safety Board of Canada
Figure 9: Airplane accidents having events in selected phases of flight, 2010 to 2020
Figure 10: Helicopter accidents having events in selected phases of flight, 2010 to 2020
Statistical Summary: Air Transportation Occurrences in 2020 ◼ 15
Overview of incidents
Incident counts
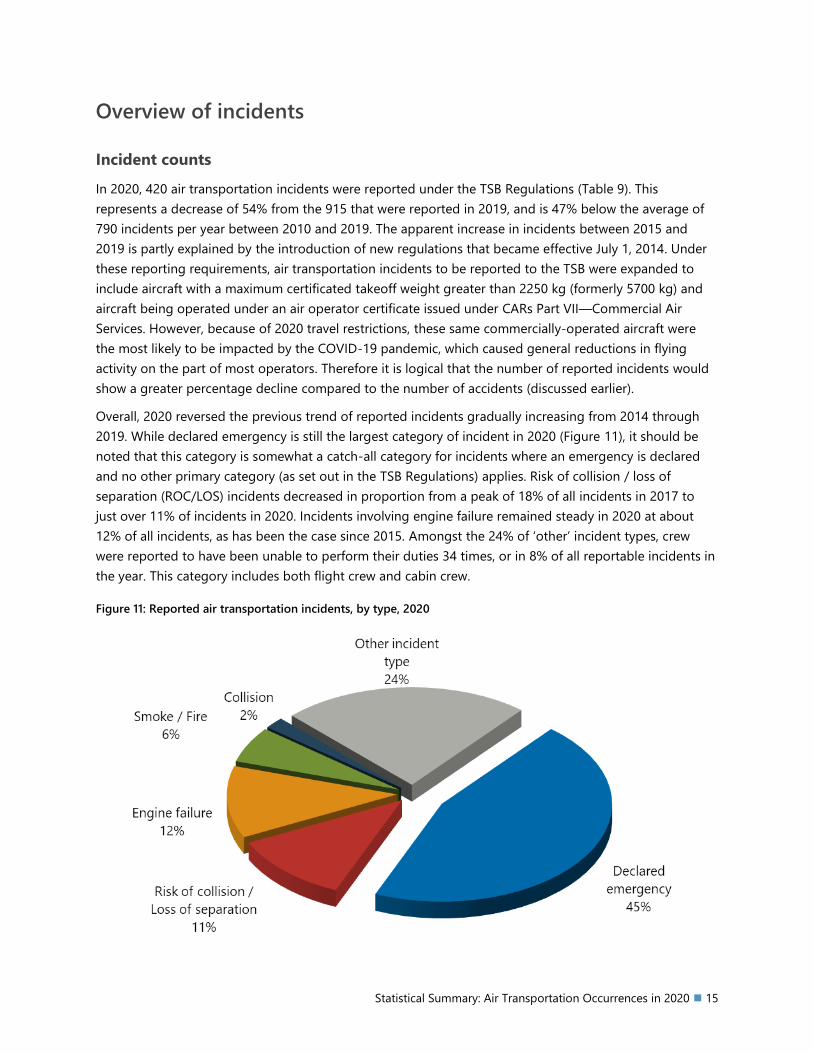
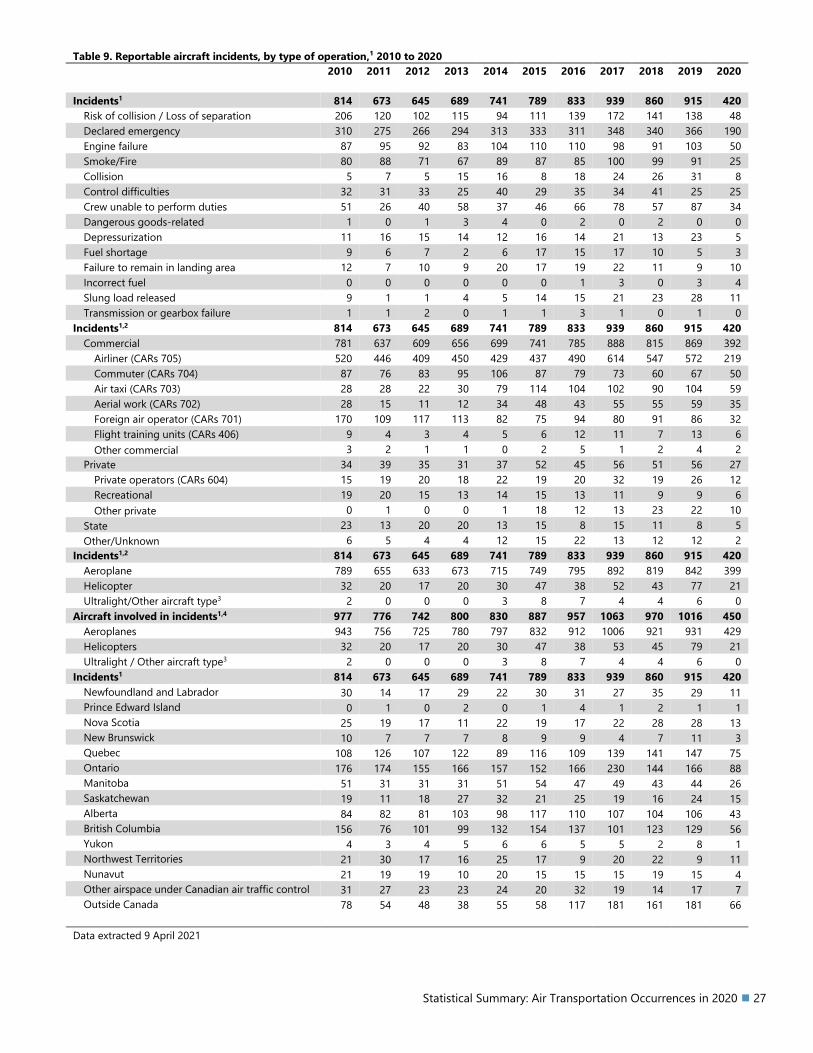
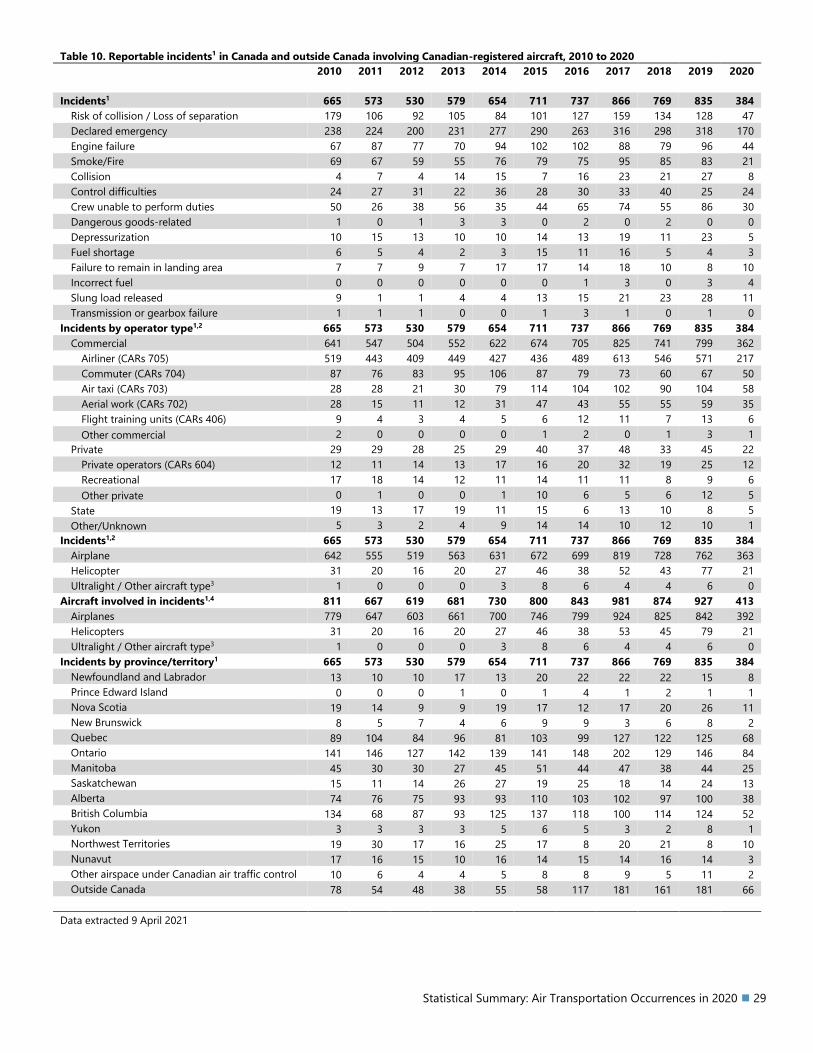
In 2020, 420 air transportation incidents were reported under the TSB Regulations (Table 9). This
represents a decrease of 54% from the 915 that were reported in 2019, and is 47% below the average of
790 incidents per year between 2010 and 2019. The apparent increase in incidents between 2015 and
2019 is partly explained by the introduction of new regulations that became effective July 1, 2014. Under
these reporting requirements, air transportation incidents to be reported to the TSB were expanded to
include aircraft with a maximum certificated takeoff weight greater than 2250 kg (formerly 5700 kg) and
aircraft being operated under an air operator certificate issued under CARs Part VII—Commercial Air
Services. However, because of 2020 travel restrictions, these same commercially-operated aircraft were
the most likely to be impacted by the COVID-19 pandemic, which caused general reductions in flying
activity on the part of most operators. Therefore it is logical that the number of reported incidents would
show a greater percentage decline compared to the number of accidents (discussed earlier).
Overall, 2020 reversed the previous trend of reported incidents gradually increasing from 2014 through
2019. While declared emergency is still the largest category of incident in 2020 (Figure 11), it should be
noted that this category is somewhat a catch-all category for incidents where an emergency is declared
and no other primary category (as set out in the TSB Regulations) applies. Risk of collision / loss of
separation (ROC/LOS) incidents decreased in proportion from a peak of 18% of all incidents in 2017 to
just over 11% of incidents in 2020. Incidents involving engine failure remained steady in 2020 at about
12% of all incidents, as has been the case since 2015. Amongst the 24% of ‘other’ incident types, crew
were reported to have been unable to perform their duties 34 times, or in 8% of all reportable incidents in
the year. This category includes both flight crew and cabin crew.
Figure 11: Reported air transportation incidents, by type, 2020
16 ◼ Transportation Safety Board of Canada
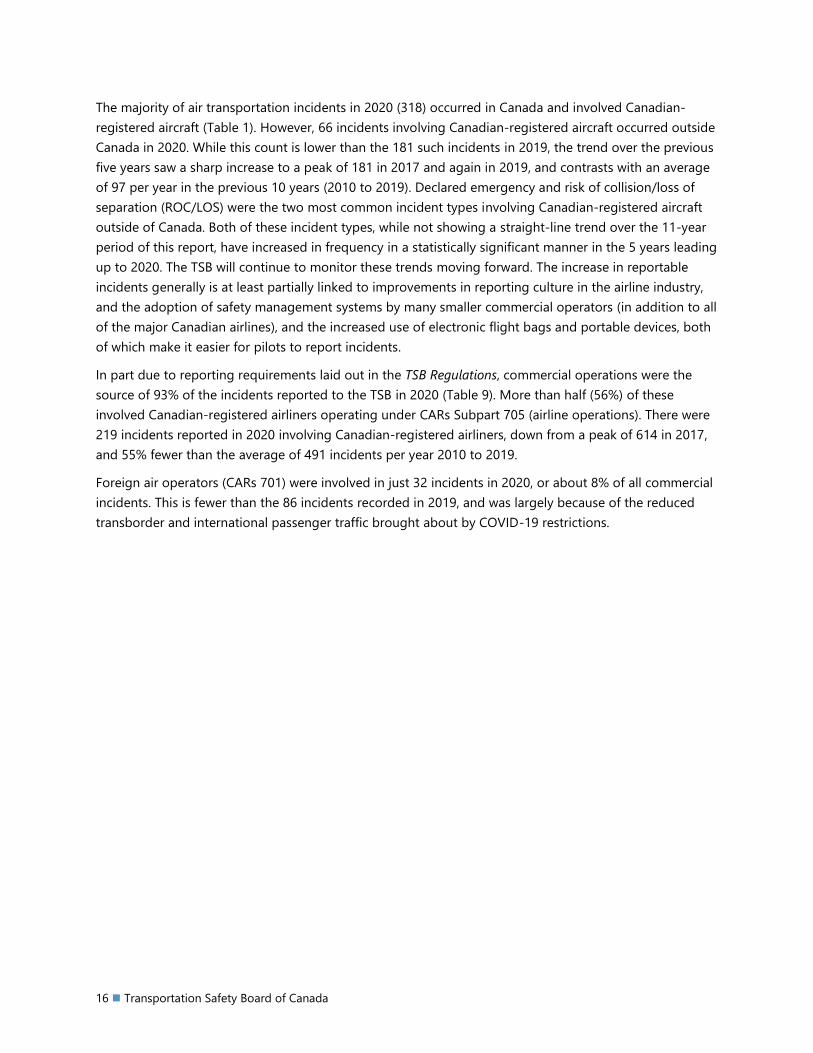
The majority of air transportation incidents in 2020 (318) occurred in Canada and involved Canadian-
registered aircraft (Table 1). However, 66 incidents involving Canadian-registered aircraft occurred outside
Canada in 2020. While this count is lower than the 181 such incidents in 2019, the trend over the previous
five years saw a sharp increase to a peak of 181 in 2017 and again in 2019, and contrasts with an average
of 97 per year in the previous 10 years (2010 to 2019). Declared emergency and risk of collision/loss of
separation (ROC/LOS) were the two most common incident types involving Canadian-registered aircraft
outside of Canada. Both of these incident types, while not showing a straight-line trend over the 11-year
period of this report, have increased in frequency in a statistically significant manner in the 5 years leading
up to 2020. The TSB will continue to monitor these trends moving forward. The increase in reportable
incidents generally is at least partially linked to improvements in reporting culture in the airline industry,
and the adoption of safety management systems by many smaller commercial operators (in addition to all
of the major Canadian airlines), and the increased use of electronic flight bags and portable devices, both
of which make it easier for pilots to report incidents.
In part due to reporting requirements laid out in the TSB Regulations, commercial operations were the
source of 93% of the incidents reported to the TSB in 2020 (Table 9). More than half (56%) of these
involved Canadian-registered airliners operating under CARs Subpart 705 (airline operations). There were
219 incidents reported in 2020 involving Canadian-registered airliners, down from a peak of 614 in 2017,
and 55% fewer than the average of 491 incidents per year 2010 to 2019.
Foreign air operators (CARs 701) were involved in just 32 incidents in 2020, or about 8% of all commercial
incidents. This is fewer than the 86 incidents recorded in 2019, and was largely because of the reduced
transborder and international passenger traffic brought about by COVID-19 restrictions.
Statistical Summary: Air Transportation Occurrences in 2020 ◼ 17
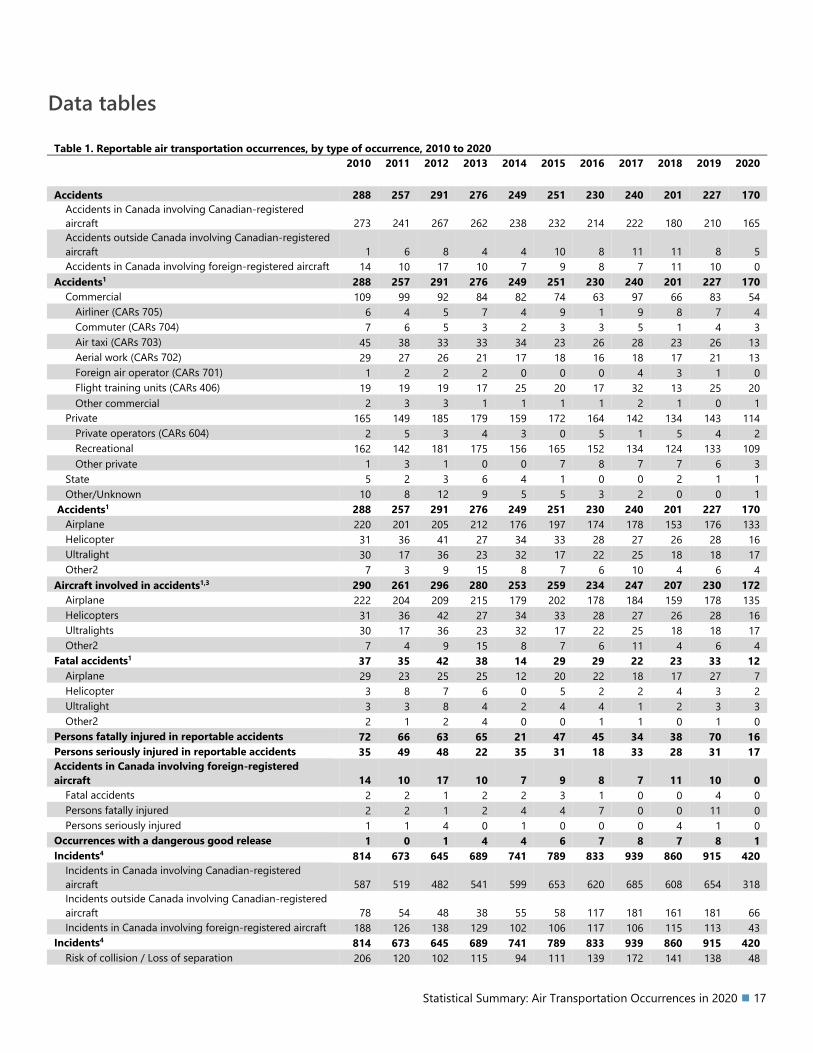
Data tables
Table 1. Reportable air transportation occurrences, by type of occurrence, 2010 to 2020 2010 2011 2012 2013 2014 2015 2016 2017 2018 2019 2020
Accidents 288 257 291 276 249 251 230 240 201 227 170
Accidents in Canada involving Canadian-registered
aircraft 273 241 267 262 238 232 214 222 180 210 165
Accidents outside Canada involving Canadian-registered
aircraft 1 6 8 4 4 10 8 11 11 8 5
Accidents in Canada involving foreign-registered aircraft 14 10 17 10 7 9 8 7 11 10 0
Accidents1 288 257 291 276 249 251 230 240 201 227 170
Commercial 109 99 92 84 82 74 63 97 66 83 54
Airliner (CARs 705) 6 4 5 7 4 9 1 9 8 7 4
Commuter (CARs 704) 7 6 5 3 2 3 3 5 1 4 3
Air taxi (CARs 703) 45 38 33 33 34 23 26 28 23 26 13
Aerial work (CARs 702) 29 27 26 21 17 18 16 18 17 21 13
Foreign air operator (CARs 701) 1 2 2 2 0 0 0 4 3 1 0
Flight training units (CARs 406) 19 19 19 17 25 20 17 32 13 25 20
Other commercial 2 3 3 1 1 1 1 2 1 0 1
Private 165 149 185 179 159 172 164 142 134 143 114
Private operators (CARs 604) 2 5 3 4 3 0 5 1 5 4 2
Recreational 162 142 181 175 156 165 152 134 124 133 109
Other private 1 3 1 0 0 7 8 7 7 6 3
State 5 2 3 6 4 1 0 0 2 1 1
Other/Unknown 10 8 12 9 5 5 3 2 0 0 1
Accidents1 288 257 291 276 249 251 230 240 201 227 170
Airplane 220 201 205 212 176 197 174 178 153 176 133
Helicopter 31 36 41 27 34 33 28 27 26 28 16
Ultralight 30 17 36 23 32 17 22 25 18 18 17
Other2 7 3 9 15 8 7 6 10 4 6 4
Aircraft involved in accidents1,3 290 261 296 280 253 259 234 247 207 230 172
Airplane 222 204 209 215 179 202 178 184 159 178 135
Helicopters 31 36 42 27 34 33 28 27 26 28 16
Ultralights 30 17 36 23 32 17 22 25 18 18 17
Other2 7 4 9 15 8 7 6 11 4 6 4
Fatal accidents1 37 35 42 38 14 29 29 22 23 33 12
Airplane 29 23 25 25 12 20 22 18 17 27 7
Helicopter 3 8 7 6 0 5 2 2 4 3 2
Ultralight 3 3 8 4 2 4 4 1 2 3 3
Other2 2 1 2 4 0 0 1 1 0 1 0
Persons fatally injured in reportable accidents 72 66 63 65 21 47 45 34 38 70 16
Persons seriously injured in reportable accidents 35 49 48 22 35 31 18 33 28 31 17
Accidents in Canada involving foreign-registered
aircraft 14 10 17 10 7 9 8 7 11 10 0
Fatal accidents 2 2 1 2 2 3 1 0 0 4 0
Persons fatally injured 2 2 1 2 4 4 7 0 0 11 0
Persons seriously injured 1 1 4 0 1 0 0 0 4 1 0
Occurrences with a dangerous good release 1 0 1 4 4 6 7 8 7 8 1
Incidents4 814 673 645 689 741 789 833 939 860 915 420
Incidents in Canada involving Canadian-registered
aircraft 587 519 482 541 599 653 620 685 608 654 318
Incidents outside Canada involving Canadian-registered
aircraft 78 54 48 38 55 58 117 181 161 181 66
Incidents in Canada involving foreign-registered aircraft 188 126 138 129 102 106 117 106 115 113 43
Incidents4 814 673 645 689 741 789 833 939 860 915 420
Risk of collision / Loss of separation 206 120 102 115 94 111 139 172 141 138 48
18 ◼ Transportation Safety Board of Canada
Declared emergency 310 275 266 294 313 333 311 348 340 366 190
Engine failure 87 95 92 83 104 110 110 98 91 103 50
Smoke/Fire 80 88 71 67 89 87 85 100 99 91 25
Collision 5 7 5 15 16 8 18 24 26 31 8
Other 126 88 109 115 125 140 170 197 163 186 99
Data extracted 9 April 2021 1 Breakdowns may not add up to totals. For example, when an occurrence involves an airplane and a helicopter, the occurrence is counted in each
type, but only once in the total. 2 Includes balloons, gyroplanes, gliders, airships, hang gliders, unmanned aerial vehicles (UAV) and similar aircraft types. 3 "Aircraft involved in accidents" are aircraft counts, all other data are accident counts. 4 Under the 2014 TSB Regulations, reportable aviation incidents include a) aircraft having a maximum certificated take-off weight greater than 2250 kg
(formerly 5700 kg); b) aircraft being operated under an air operator certificate issued under the Canadian Aviation Regulations, Part VII.
Statistical Summary: Air Transportation Occurrences in 2020 ◼ 19
Table 2. Air transportation occurrences involving Canadian-registered aircraft, by aircraft and operator type, 2010 to 2020 2010 2011 2012 2013 2014 2015 2016 2017 2018 2019 2020
Accidents1,2 244 230 239 243 212 227 200 208 173 200 153
Airplane accidents 209 192 191 204 170 190 167 171 143 168 133
Commercial 77 71 62 58 55 51 42 71 46 66 45
Airliner (CARs 705) 6 4 5 7 4 9 1 9 8 7 4
Commuter (CARs 704) 6 4 5 3 1 3 3 5 1 4 3
Air taxi (CARs 703) 29 27 19 19 19 12 16 18 18 21 10
Aerial work (CARs 702) 18 14 14 12 8 10 7 12 6 11 8
Flight training units (CARs 406) 16 19 18 16 23 16 16 27 12 23 20
Other commercial 2 3 1 1 0 1 0 0 1 0 0
Private 122 113 122 139 111 138 122 101 96 101 88
Private operators (CARs 604) 2 2 0 3 1 0 5 1 5 4 2
Recreational 119 110 121 136 110 132 114 97 90 94 83
Other private 1 2 1 0 0 6 4 3 2 3 3
State 3 2 1 2 3 1 0 0 2 1 0
Other/Unknown 8 6 6 7 2 1 3 0 0 0 0
Helicopter accidents 29 35 41 27 34 32 27 27 26 27 16
Commercial 27 26 28 22 26 23 18 22 17 16 9
Private 2 9 10 4 7 9 9 5 9 11 6
State 0 0 2 1 1 0 0 0 0 0 1
Other/Unknown 0 0 2 0 0 0 0 0 0 0 0
Other aircraft accidents3 6 3 7 13 8 7 6 10 4 6 4
Fatal accidents1,2 32 30 33 32 10 23 24 21 21 26 9
Airplane accidents 28 21 25 24 10 18 21 18 17 23 7
Commercial 12 11 6 8 2 6 3 7 4 8 1
Airliner (CARs 705) 0 1 0 0 0 0 0 1 0 0 0
Commuter (CARs 704) 1 1 1 1 0 0 0 0 0 0 0
Air taxi (CARs 703) 7 6 3 5 1 3 1 1 2 6 1
Aerial work (CARs 702) 4 2 2 1 1 2 1 2 2 1 0
Flight training units (CARs 406) 0 1 0 1 0 1 1 3 0 1 0
Other commercial 0 0 0 0 0 0 0 0 0 0 0
Private 15 10 17 14 8 13 18 11 13 15 6
Private operators (CARs 604) 0 0 0 1 0 0 1 0 1 0 0
Recreational 15 10 17 13 8 13 16 10 13 15 6
Other private 0 0 0 0 0 0 1 1 0 0 0
State 0 0 0 0 0 0 0 0 0 0 0
Other/Unknown 1 0 2 2 0 0 0 0 0 0 0
Helicopter accidents 3 8 7 6 0 5 2 2 4 3 2
Commercial 3 6 5 6 0 4 1 2 1 1 1
Private 0 2 1 0 0 1 1 0 3 2 1
State 0 0 1 0 0 0 0 0 0 0 0
Other/Unknown 0 0 0 0 0 0 0 0 0 0 0
Other aircraft accidents3 1 1 1 3 0 0 1 1 0 1 0
Persons fatally injured2 66 61 54 59 15 40 34 33 36 54 13
Persons seriously injured2 30 43 38 19 28 28 17 27 21 26 13
Incidents2,4 665 573 530 579 654 711 737 866 769 835 384
Risk of collision / Loss of separation 179 106 92 105 84 101 127 159 134 128 47
Declared emergency 238 224 200 231 277 290 263 316 298 318 170
Engine failure 67 87 77 70 94 102 102 88 79 96 44
Smoke/Fire 69 67 59 55 76 79 75 95 85 83 21
Collision 4 7 4 14 15 7 16 23 21 27 8
Other 108 82 98 104 108 132 154 185 152 183 94
Accidents involving ultralight aircraft 30 17 36 23 31 16 22 25 18 18 17
Fatal accidents 3 3 8 4 2 3 4 1 2 3 3
Fatalities 4 3 8 4 2 3 4 1 2 5 3
Serious injuries 4 5 6 3 6 3 1 6 3 4 4
Data extracted 9 April 2021
20 ◼ Transportation Safety Board of Canada
1 Breakdowns may not add up to totals. For example, when an occurrence involves an airplane and a helicopter, the occurrence is counted
in each type, but only once in the total. 2 Excludes ultralight aircraft. 3 Includes balloons, gyroplanes, gliders, airships, hang gliders, unmanned aerial vehicles (UAV) and similar aircraft types. 4 Under the 2014 TSB Regulations, reportable aviation incidents include a) aircraft having a maximum certificated take-off weight greater
than 2250 kg (formerly 5700 kg); b) aircraft being operated under an air operator certificate issued under the Canadian Aviation
Regulations, Part VII.
Statistical Summary: Air Transportation Occurrences in 2020 ◼ 21
Table 3. Rate of accidents per 100 000 hours flown, by Canadian-registered aircraft¹ in Canada and abroad, 2010 to 2020 2010 2011 2012 2013 2014 2015 2016 2017 2018 2019 2020
Accidents 238 227 232 231 204 222 194 198 169 195 149
Fatal accidents 31 29 32 30 10 23 23 20 21 26 9
Fatalities 65 59 53 57 15 40 33 32 36 54 13
Hours flown2 (thousands) 3 993 4 285 4 394 4 294 4 271 4 323 4 472 4 718 5 030 4 889 2 550
Accidents per 100 000 hours 6.0 5.3 5.3 5.4 4.8 5.1 4.3 4.2 3.4 4.0 5.8
Fatal accidents per 100 000 hours 0.8 0.7 0.7 0.7 0.2 0.5 0.5 0.4 0.4 0.5 0.4
Fatalities per 100 000 hours 1.6 1.4 1.2 1.3 0.4 0.9 0.7 0.7 0.7 1.1 0.5
Data extracted 9 April 2021 1 Canadian-registered aircraft, excluding ultralights, balloons, gyroplanes, gliders, airships, hang gliders and similar aircraft types. 2 Hours flown in 2018 to 2020 are estimates. Source: Transport Canada, email to TSB on 2021-03-02.
22 ◼ Transportation Safety Board of Canada
Table 4. Persons fatally injured in air transportation accidents, by type of operation, 2010 to 2020
2010 2011 2012 2013 2014 2015 2016 2017 2018 2019 2020
Persons fatally injured 72 66 63 65 21 47 45 34 38 70 16
In Canada, involving Canadian-registered aircraft 70 63 61 57 15 39 35 32 28 57 16
Outside Canada, involving Canadian-registered aircraft 0 1 1 6 2 4 3 2 10 2 0
In Canada, involving foreign-registered aircraft 2 2 1 2 4 4 7 0 0 11 0
Persons fatally injured 72 66 63 65 21 47 45 34 38 70 16
Commercial 36 40 18 29 4 20 6 15 9 25 2
Airliner (CARs 705) 0 12 0 0 0 0 0 1 0 0 0
Commuter (CARs 704) 1 2 1 5 0 0 0 0 0 0 0
Air taxi (CARs 703) 28 16 12 19 2 12 1 1 5 21 1
Aerial work (CARs 702) 7 8 3 4 2 6 2 7 4 3 1
Foreign air operator (CARs 701) 0 0 0 0 0 0 0 0 0 0 0
Flight training units (CARs 406) 0 2 1 1 0 2 3 5 0 1 0
Other commercial 0 0 1 0 0 0 0 1 0 0 0
Private 32 25 37 33 17 28 39 19 29 45 14
Private operators (CARs 604) 0 2 0 1 0 0 4 0 1 0 0
Recreational 32 23 37 32 17 28 27 17 29 43 14
Other private 0 0 0 0 0 0 8 2 0 2 0
State 0 0 1 0 0 0 0 0 0 0 0
Other/Unknown 4 3 7 3 0 1 0 0 0 0 0
Crew members fatally injured 40 37 40 44 15 29 25 26 20 34 11
Commercial 17 20 11 21 3 10 3 11 3 10 2
Airliner (CARs 705) 0 4 0 0 0 0 0 0 0 0 0
Commuter (CARs 704) 1 2 0 2 0 0 0 0 0 0 0
Air taxi (CARs 703) 11 7 7 14 1 4 1 1 0 8 1
Aerial work (CARs 702) 5 5 2 4 2 4 1 4 3 1 1
Foreign air operator (CARs 701) 0 0 0 0 0 0 0 0 0 0 0
Flight training units (CARs 406) 0 2 1 1 0 2 1 5 0 1 0
Other commercial 0 0 1 0 0 0 0 1 0 0 0
Private 22 16 25 21 12 20 22 15 17 24 9
Private operators (CARs 604) 0 2 0 1 0 0 1 0 1 0 0
Recreational 22 14 25 20 12 20 18 14 17 22 9
Other private 0 0 0 0 0 0 3 1 0 2 0
State 0 0 1 0 0 0 0 0 0 0 0
Other/Unknown 1 3 3 2 0 1 0 0 0 0 0
Passengers fatally injured 31 29 22 20 6 18 20 8 18 36 5
Commercial 18 20 6 8 1 10 3 4 6 15 0
Airliner (CARs 705) 0 8 0 0 0 0 0 1 0 0 0
Commuter (CARs 704) 0 0 1 3 0 0 0 0 0 0 0
Air taxi (CARs 703) 16 9 5 5 1 8 0 0 5 13 0
Aerial work (CARs 702) 2 3 0 0 0 2 1 3 1 2 0
Foreign air operator (CARs 701) 0 0 0 0 0 0 0 0 0 0 0
Flight training units (CARs 406) 0 0 0 0 0 0 2 0 0 0 0
Other commercial 0 0 0 0 0 0 0 0 0 0 0
Private 10 9 12 11 5 8 17 4 12 21 5
Private operators (CARs 604) 0 0 0 0 0 0 3 0 0 0 0
Recreational 10 9 12 11 5 8 9 3 12 21 5
Other private 0 0 0 0 0 0 5 1 0 0 0
State 0 0 0 0 0 0 0 0 0 0 0
Other/Unknown 3 0 4 1 0 0 0 0 0 0 0
Persons on the ground fatally injured 1 0 1 1 0 0 0 0 0 0 0
Persons fatally injured 72 66 63 65 21 47 45 34 38 70 16
Airplane 59 46 44 46 19 35 37 27 30 60 11
Helicopter 7 15 9 12 0 8 3 5 6 5 2
Ultralight 4 3 8 4 2 4 4 1 2 5 3
Other aircraft type 2 2 2 7 0 0 1 1 0 2 0
Data extracted 9 April 2021
Statistical Summary: Air Transportation Occurrences in 2020 ◼ 23
Table 5. Persons seriously injured in air transportation accidents, by type of operation, 2010 to 2020
2010 2011 2012 2013 2014 2015 2016 2017 2018 2019 2020
Persons seriously injured 35 49 48 22 35 31 18 33 28 31 17
In Canada, involving Canadian-registered aircraft 34 46 39 22 34 28 17 31 23 27 14
Outside Canada, involving Canadian-registered Aircraft 0 2 5 0 0 3 1 2 1 3 3
In Canada, involving foreign-registered aircraft 1 1 4 0 1 0 0 0 4 1 0
Persons seriously injured 35 49 48 22 35 31 18 33 28 31 17
Commercial 17 31 22 11 10 15 8 13 17 13 3
Airliner (CARs 705) 1 10 1 0 0 3 2 8 4 1 0
Commuter (CARs 704) 4 7 2 2 0 0 0 0 0 0 1
Air taxi (CARs 703) 6 9 15 6 5 8 4 0 9 8 0
Aerial work (CARs 702) 5 5 1 3 3 3 2 2 2 2 1
Foreign air operator (CARs 701) 0 0 1 0 0 0 0 0 1 0 0
Flight training units (CARs 406) 1 0 0 0 2 1 0 2 1 2 1
Other commercial 0 0 2 0 0 0 0 1 0 0 0
Private 16 18 26 10 23 16 10 20 11 18 13
Private operators (CARs 604) 0 0 0 0 0 0 0 0 1 0 0
Recreational 15 18 26 10 23 14 9 19 7 18 13
Other private 1 0 0 0 0 2 1 1 3 0 0
State 1 0 0 0 0 0 0 0 0 0 1
Other/Unknown 1 0 0 1 2 0 0 0 0 0 0
Crew members seriously injured 22 18 24 13 23 17 8 22 19 16 12
Commercial 8 6 6 4 5 6 3 8 10 2 2
Airliner (CARs 705) 0 0 0 0 0 1 0 3 3 0 0
Commuter (CARs 704) 1 0 2 0 0 0 0 0 0 0 0
Air taxi (CARs 703) 2 2 1 2 2 2 2 0 3 0 0
Aerial work (CARs 702) 4 4 1 2 1 3 1 2 2 1 1
Foreign air operator (CARs 701) 0 0 1 0 0 0 0 0 1 0 0
Flight training units (CARs 406) 1 0 0 0 2 0 0 2 1 1 1
Other commercial 0 0 1 0 0 0 0 1 0 0 0
Private 12 12 18 8 17 11 5 14 9 14 9
Private operators (CARs 604) 0 0 0 0 0 0 0 0 1 0 0
Recreational 11 12 18 8 17 9 5 14 6 14 9
Other private 1 0 0 0 0 2 0 0 2 0 0
State 1 0 0 0 0 0 0 0 0 0 1
Other/Unknown 1 0 0 1 1 0 0 0 0 0 0
Passengers seriously injured 12 30 23 8 11 14 8 11 9 13 4
Commercial 9 24 15 6 5 9 4 5 7 9 1
Airliner (CARs 705) 1 10 0 0 0 2 2 5 1 0 0
Commuter (CARs 704) 3 7 0 2 0 0 0 0 0 0 1
Air taxi (CARs 703) 4 7 14 4 3 6 2 0 6 7 0
Aerial work (CARs 702) 1 0 0 0 2 0 0 0 0 1 0
Foreign air operator (CARs 701) 0 0 0 0 0 0 0 0 0 0 0
Flight training units (CARs 406) 0 0 0 0 0 1 0 0 0 1 0
Other commercial 0 0 1 0 0 0 0 0 0 0 0
Private 3 6 8 2 5 5 4 6 2 4 3
Private operators (CARs 604) 0 0 0 0 0 0 0 0 0 0 0
Recreational 3 6 8 2 5 5 4 5 1 4 3
Other private 0 0 0 0 0 0 0 1 1 0 0
State 0 0 0 0 0 0 0 0 0 0 0
Other/Unknown 0 0 0 0 1 0 0 0 0 0 0
Persons on the ground seriously injured 1 1 1 1 1 0 2 0 0 2 1
Persons seriously injured 35 49 48 22 35 31 18 33 28 31 17
Airplane 28 36 31 13 21 23 10 23 23 26 9
Helicopter 2 8 7 6 6 5 6 3 2 1 3
Ultralight 4 5 6 3 7 3 1 6 3 4 4
Other aircraft type 1 0 4 0 1 0 1 1 0 0 1
Data extracted 9 April 2021
Table 6. Accidents involving Canadian-registered airplanes and helicopters, by type of operation,1,2 2010 to 2020
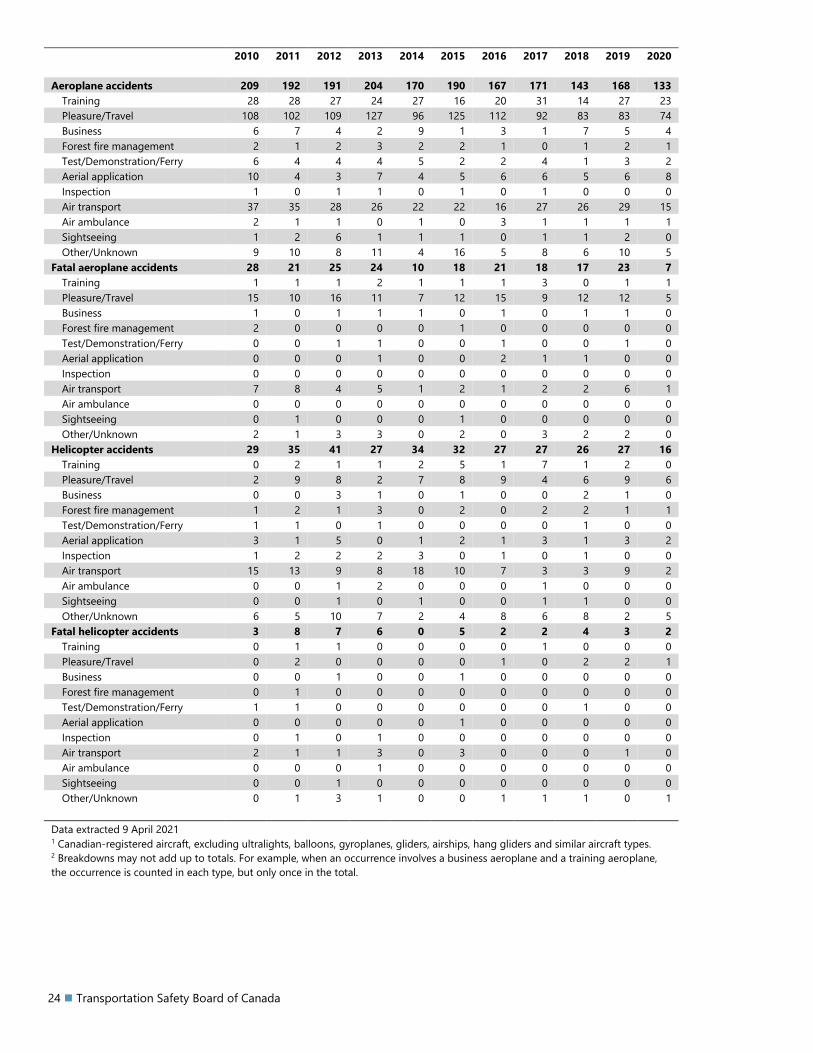
24 ◼ Transportation Safety Board of Canada
2010 2011 2012 2013 2014 2015 2016 2017 2018 2019 2020
Aeroplane accidents 209 192 191 204 170 190 167 171 143 168 133
Training 28 28 27 24 27 16 20 31 14 27 23
Pleasure/Travel 108 102 109 127 96 125 112 92 83 83 74
Business 6 7 4 2 9 1 3 1 7 5 4
Forest fire management 2 1 2 3 2 2 1 0 1 2 1
Test/Demonstration/Ferry 6 4 4 4 5 2 2 4 1 3 2
Aerial application 10 4 3 7 4 5 6 6 5 6 8
Inspection 1 0 1 1 0 1 0 1 0 0 0
Air transport 37 35 28 26 22 22 16 27 26 29 15
Air ambulance 2 1 1 0 1 0 3 1 1 1 1
Sightseeing 1 2 6 1 1 1 0 1 1 2 0
Other/Unknown 9 10 8 11 4 16 5 8 6 10 5
Fatal aeroplane accidents 28 21 25 24 10 18 21 18 17 23 7
Training 1 1 1 2 1 1 1 3 0 1 1
Pleasure/Travel 15 10 16 11 7 12 15 9 12 12 5
Business 1 0 1 1 1 0 1 0 1 1 0
Forest fire management 2 0 0 0 0 1 0 0 0 0 0
Test/Demonstration/Ferry 0 0 1 1 0 0 1 0 0 1 0
Aerial application 0 0 0 1 0 0 2 1 1 0 0
Inspection 0 0 0 0 0 0 0 0 0 0 0
Air transport 7 8 4 5 1 2 1 2 2 6 1
Air ambulance 0 0 0 0 0 0 0 0 0 0 0
Sightseeing 0 1 0 0 0 1 0 0 0 0 0
Other/Unknown 2 1 3 3 0 2 0 3 2 2 0
Helicopter accidents 29 35 41 27 34 32 27 27 26 27 16
Training 0 2 1 1 2 5 1 7 1 2 0
Pleasure/Travel 2 9 8 2 7 8 9 4 6 9 6
Business 0 0 3 1 0 1 0 0 2 1 0
Forest fire management 1 2 1 3 0 2 0 2 2 1 1
Test/Demonstration/Ferry 1 1 0 1 0 0 0 0 1 0 0
Aerial application 3 1 5 0 1 2 1 3 1 3 2
Inspection 1 2 2 2 3 0 1 0 1 0 0
Air transport 15 13 9 8 18 10 7 3 3 9 2
Air ambulance 0 0 1 2 0 0 0 1 0 0 0
Sightseeing 0 0 1 0 1 0 0 1 1 0 0
Other/Unknown 6 5 10 7 2 4 8 6 8 2 5
Fatal helicopter accidents 3 8 7 6 0 5 2 2 4 3 2
Training 0 1 1 0 0 0 0 1 0 0 0
Pleasure/Travel 0 2 0 0 0 0 1 0 2 2 1
Business 0 0 1 0 0 1 0 0 0 0 0
Forest fire management 0 1 0 0 0 0 0 0 0 0 0
Test/Demonstration/Ferry 1 1 0 0 0 0 0 0 1 0 0
Aerial application 0 0 0 0 0 1 0 0 0 0 0
Inspection 0 1 0 1 0 0 0 0 0 0 0
Air transport 2 1 1 3 0 3 0 0 0 1 0
Air ambulance 0 0 0 1 0 0 0 0 0 0 0
Sightseeing 0 0 1 0 0 0 0 0 0 0 0
Other/Unknown 0 1 3 1 0 0 1 1 1 0 1
Data extracted 9 April 2021 1 Canadian-registered aircraft, excluding ultralights, balloons, gyroplanes, gliders, airships, hang gliders and similar aircraft types. 2 Breakdowns may not add up to totals. For example, when an occurrence involves a business aeroplane and a training aeroplane,
the occurrence is counted in each type, but only once in the total.
Statistical Summary: Air Transportation Occurrences in 2020 ◼ 25
Table 7. Fatal air transportation accidents and fatalities in Canada and outside Canada, 2010 to 2020 2010 2011 2012 2013 2014 2015 2016 2017 2018 2019 2020
Accidents 288 257 291 276 249 251 230 240 201 227 170
Newfoundland and Labrador 3 3 5 3 5 6 5 4 4 3 2
Prince Edward Island 0 0 0 0 0 0 0 2 0 0 0
Nova Scotia 7 5 5 5 3 6 2 3 2 1 1
New Brunswick 5 3 3 2 6 2 5 7 1 8 2
Quebec 65 58 71 66 69 51 34 44 31 50 33
Ontario 71 63 67 72 67 74 50 62 53 53 39
Manitoba 27 17 18 13 12 14 17 10 7 17 9
Saskatchewan 18 18 9 19 12 13 10 13 13 12 17
Alberta 25 22 35 29 33 23 38 35 32 29 25
British Columbia 47 43 54 51 30 42 53 39 36 38 34
Yukon 3 8 8 4 4 6 2 4 4 3 0
Northwest Territories 9 6 5 3 3 2 3 2 5 4 1
Nunavut 7 4 3 4 1 2 3 3 1 1 2
Other airspace under Canadian air traffic control 0 1 0 1 0 0 0 1 1 0 0
Outside Canada 1 6 8 4 4 10 8 11 11 8 5
Fatal accidents 37 35 42 38 14 29 29 22 23 33 12
Newfoundland and Labrador 1 0 0 0 0 1 0 0 0 2 1
Prince Edward Island 0 0 0 0 0 0 0 0 0 0 0
Nova Scotia 1 1 0 1 1 1 0 0 0 0 0
New Brunswick 2 0 0 0 1 0 1 0 0 1 0
Quebec 10 5 10 5 2 7 7 4 2 9 4
Ontario 9 6 10 9 5 6 5 4 6 6 1
Manitoba 1 1 3 2 0 1 1 3 0 1 0
Saskatchewan 0 3 1 2 1 2 2 2 1 0 0
Alberta 2 4 6 4 1 3 4 3 5 5 3
British Columbia 7 10 9 10 2 4 8 3 4 5 3
Yukon 0 1 1 0 0 0 0 1 0 2 0
Northwest Territories 3 2 0 1 0 0 0 0 1 1 0
Nunavut 1 1 1 0 0 0 0 0 0 0 0
Other airspace under Canadian air traffic control 0 0 0 1 0 0 0 0 0 0 0
Outside Canada 0 1 1 3 1 4 1 2 4 1 0
Persons fatally injured 72 66 63 65 21 47 45 34 38 70 16
Newfoundland and Labrador 2 0 0 0 0 1 0 0 0 8 1
Prince Edward Island 0 0 0 0 0 0 0 0 0 0 0
Nova Scotia 2 1 0 1 1 1 0 0 0 0 0
New Brunswick 2 0 0 0 2 0 2 0 0 1 0
Quebec 28 9 11 5 2 16 15 6 4 14 5
Ontario 14 9 19 19 8 10 5 9 8 16 1
Manitoba 1 1 4 5 0 1 2 4 0 3 0
Saskatchewan 0 7 5 3 2 3 2 3 1 0 0
Alberta 4 5 6 5 1 4 4 5 6 8 6
British Columbia 15 16 15 17 3 7 12 4 6 12 3
Yukon 0 1 1 0 0 0 0 1 0 4 0
Northwest Territories 3 4 0 1 0 0 0 0 3 2 0
Nunavut 1 12 1 0 0 0 0 0 0 0 0
Other airspace under Canadian air traffic control 0 0 0 3 0 0 0 0 0 0 0
Outside Canada 0 1 1 6 2 4 3 2 10 2 0
Data extracted 9 April 2021
26 ◼ Transportation Safety Board of Canada
Table 8. Accidents and fatal accidents in Canada and outside Canada involving Canadian-registered aircraft,¹ 2010 to 2020 2010 2011 2012 2013 2014 2015 2016 2017 2018 2019 2020
Accidents 244 230 239 243 212 227 200 208 173 200 153
Newfoundland and Labrador 3 3 5 3 4 6 4 3 2 2 2
Prince Edward Island 0 0 0 0 0 0 0 1 0 0 0
Nova Scotia 7 3 3 5 2 5 2 2 1 1 1
New Brunswick 4 3 3 2 6 2 5 5 1 8 2
Quebec 52 52 52 57 57 44 28 39 28 41 29
Ontario 55 56 54 59 53 66 43 51 44 46 32
Manitoba 25 16 15 13 11 13 17 10 7 12 9
Saskatchewan 18 17 8 18 10 12 10 12 13 12 16
Alberta 24 18 30 27 31 21 36 30 27 27 23
British Columbia 38 39 46 44 27 39 43 35 30 36 32
Yukon 3 7 7 4 4 6 1 4 2 2 0
Northwest Territories 8 6 5 3 2 2 3 2 5 4 1
Nunavut 6 3 3 3 1 1 2 3 1 1 2
Other airspace under Canadian air traffic control 0 1 0 1 0 0 0 0 1 0 0
Outside Canada 1 6 8 4 4 10 6 11 11 8 4
Fatal accidents 32 30 33 32 10 23 24 21 21 26 9
Newfoundland and Labrador 1 0 0 0 0 1 0 0 0 1 1
Prince Edward Island 0 0 0 0 0 0 0 0 0 0 0
Nova Scotia 1 0 0 1 0 0 0 0 0 0 0
New Brunswick 2 0 0 0 1 0 1 0 0 1 0
Quebec 9 5 4 3 1 6 5 4 2 5 3
Ontario 8 4 9 6 3 5 3 4 5 5 0
Manitoba 1 1 3 2 0 0 1 3 0 1 0
Saskatchewan 0 3 1 2 1 2 2 2 1 0 0
Alberta 2 3 5 4 1 3 4 3 4 5 2
British Columbia 5 9 8 9 2 2 7 2 4 5 3
Yukon 0 1 1 0 0 0 0 1 0 1 0
Northwest Territories 2 2 0 1 0 0 0 0 1 1 0
Nunavut 1 1 1 0 0 0 0 0 0 0 0
Other airspace under Canadian air traffic control 0 0 0 1 0 0 0 0 0 0 0
Outside Canada 0 1 1 3 1 4 1 2 4 1 0
Persons fatally injured 66 61 54 59 15 40 34 33 36 54 13
Newfoundland and Labrador 2 0 0 0 0 1 0 0 0 7 1
Prince Edward Island 0 0 0 0 0 0 0 0 0 0 0
Nova Scotia 2 0 0 1 0 0 0 0 0 0 0
New Brunswick 2 0 0 0 2 0 2 0 0 1 0
Quebec 27 9 5 3 1 15 7 6 4 8 4
Ontario 12 7 18 16 4 9 3 9 7 9 0
Manitoba 1 1 4 5 0 0 2 4 0 3 0
Saskatchewan 0 7 5 3 2 3 2 3 1 0 0
Alberta 4 4 5 5 1 4 4 5 5 8 5
British Columbia 13 15 14 16 3 4 11 3 6 12 3
Yukon 0 1 1 0 0 0 0 1 0 2 0
Northwest Territories 2 4 0 1 0 0 0 0 3 2 0
Nunavut 1 12 1 0 0 0 0 0 0 0 0
Other airspace under Canadian air traffic control 0 0 0 3 0 0 0 0 0 0 0
Outside Canada 0 1 1 6 2 4 3 2 10 2 0
Data extracted 9 April 2021
Statistical Summary: Air Transportation Occurrences in 2020 ◼ 27
Table 9. Reportable aircraft incidents, by type of operation,¹ 2010 to 2020
2010 2011 2012 2013 2014 2015 2016 2017 2018 2019 2020
Incidents1 814 673 645 689 741 789 833 939 860 915 420
Risk of collision / Loss of separation 206 120 102 115 94 111 139 172 141 138 48
Declared emergency 310 275 266 294 313 333 311 348 340 366 190
Engine failure 87 95 92 83 104 110 110 98 91 103 50
Smoke/Fire 80 88 71 67 89 87 85 100 99 91 25
Collision 5 7 5 15 16 8 18 24 26 31 8
Control difficulties 32 31 33 25 40 29 35 34 41 25 25
Crew unable to perform duties 51 26 40 58 37 46 66 78 57 87 34
Dangerous goods-related 1 0 1 3 4 0 2 0 2 0 0
Depressurization 11 16 15 14 12 16 14 21 13 23 5
Fuel shortage 9 6 7 2 6 17 15 17 10 5 3
Failure to remain in landing area 12 7 10 9 20 17 19 22 11 9 10
Incorrect fuel 0 0 0 0 0 0 1 3 0 3 4
Slung load released 9 1 1 4 5 14 15 21 23 28 11
Transmission or gearbox failure 1 1 2 0 1 1 3 1 0 1 0
Incidents1,2 814 673 645 689 741 789 833 939 860 915 420
Commercial 781 637 609 656 699 741 785 888 815 869 392
Airliner (CARs 705) 520 446 409 450 429 437 490 614 547 572 219
Commuter (CARs 704) 87 76 83 95 106 87 79 73 60 67 50
Air taxi (CARs 703) 28 28 22 30 79 114 104 102 90 104 59
Aerial work (CARs 702) 28 15 11 12 34 48 43 55 55 59 35
Foreign air operator (CARs 701) 170 109 117 113 82 75 94 80 91 86 32
Flight training units (CARs 406) 9 4 3 4 5 6 12 11 7 13 6
Other commercial 3 2 1 1 0 2 5 1 2 4 2
Private 34 39 35 31 37 52 45 56 51 56 27
Private operators (CARs 604) 15 19 20 18 22 19 20 32 19 26 12
Recreational 19 20 15 13 14 15 13 11 9 9 6
Other private 0 1 0 0 1 18 12 13 23 22 10
State 23 13 20 20 13 15 8 15 11 8 5
Other/Unknown 6 5 4 4 12 15 22 13 12 12 2
Incidents1,2 814 673 645 689 741 789 833 939 860 915 420
Aeroplane 789 655 633 673 715 749 795 892 819 842 399
Helicopter 32 20 17 20 30 47 38 52 43 77 21
Ultralight/Other aircraft type3 2 0 0 0 3 8 7 4 4 6 0
Aircraft involved in incidents1,4 977 776 742 800 830 887 957 1063 970 1016 450
Aeroplanes 943 756 725 780 797 832 912 1006 921 931 429
Helicopters 32 20 17 20 30 47 38 53 45 79 21
Ultralight / Other aircraft type3 2 0 0 0 3 8 7 4 4 6 0
Incidents1 814 673 645 689 741 789 833 939 860 915 420
Newfoundland and Labrador 30 14 17 29 22 30 31 27 35 29 11
Prince Edward Island 0 1 0 2 0 1 4 1 2 1 1
Nova Scotia 25 19 17 11 22 19 17 22 28 28 13
New Brunswick 10 7 7 7 8 9 9 4 7 11 3
Quebec 108 126 107 122 89 116 109 139 141 147 75
Ontario 176 174 155 166 157 152 166 230 144 166 88
Manitoba 51 31 31 31 51 54 47 49 43 44 26
Saskatchewan 19 11 18 27 32 21 25 19 16 24 15
Alberta 84 82 81 103 98 117 110 107 104 106 43
British Columbia 156 76 101 99 132 154 137 101 123 129 56
Yukon 4 3 4 5 6 6 5 5 2 8 1
Northwest Territories 21 30 17 16 25 17 9 20 22 9 11
Nunavut 21 19 19 10 20 15 15 15 19 15 4
Other airspace under Canadian air traffic control 31 27 23 23 24 20 32 19 14 17 7
Outside Canada 78 54 48 38 55 58 117 181 161 181 66
Data extracted 9 April 2021
28 ◼ Transportation Safety Board of Canada
1 Under the 2014 TSB Regulations, reportable aviation incidents include a) aircraft having a maximum certificated take-off weight greater than
2250 kg (formerly 5700 kg); b) aircraft being operated under an air operator certificate issued under the Canadian Aviation Regulations, Part
VII. 2 Breakdowns may not add up to totals. For example, when an occurrence involves an airplane and a helicopter, the occurrence is counted in
each type, but only once in the total. 3 Includes balloons, gyroplanes, gliders, airships, hang gliders, unmanned aerial vehicles (UAV) and similar aircraft types. 4 "Aircraft involved in accidents" are aircraft counts; all other data are accident counts.
Statistical Summary: Air Transportation Occurrences in 2020 ◼ 29
Table 10. Reportable incidents¹ in Canada and outside Canada involving Canadian-registered aircraft, 2010 to 2020
2010 2011 2012 2013 2014 2015 2016 2017 2018 2019 2020
Incidents1 665 573 530 579 654 711 737 866 769 835 384
Risk of collision / Loss of separation 179 106 92 105 84 101 127 159 134 128 47
Declared emergency 238 224 200 231 277 290 263 316 298 318 170
Engine failure 67 87 77 70 94 102 102 88 79 96 44
Smoke/Fire 69 67 59 55 76 79 75 95 85 83 21
Collision 4 7 4 14 15 7 16 23 21 27 8
Control difficulties 24 27 31 22 36 28 30 33 40 25 24
Crew unable to perform duties 50 26 38 56 35 44 65 74 55 86 30
Dangerous goods-related 1 0 1 3 3 0 2 0 2 0 0
Depressurization 10 15 13 10 10 14 13 19 11 23 5
Fuel shortage 6 5 4 2 3 15 11 16 5 4 3
Failure to remain in landing area 7 7 9 7 17 17 14 18 10 8 10
Incorrect fuel 0 0 0 0 0 0 1 3 0 3 4
Slung load released 9 1 1 4 4 13 15 21 23 28 11
Transmission or gearbox failure 1 1 1 0 0 1 3 1 0 1 0
Incidents by operator type1,2 665 573 530 579 654 711 737 866 769 835 384
Commercial 641 547 504 552 622 674 705 825 741 799 362
Airliner (CARs 705) 519 443 409 449 427 436 489 613 546 571 217
Commuter (CARs 704) 87 76 83 95 106 87 79 73 60 67 50
Air taxi (CARs 703) 28 28 21 30 79 114 104 102 90 104 58
Aerial work (CARs 702) 28 15 11 12 31 47 43 55 55 59 35
Flight training units (CARs 406) 9 4 3 4 5 6 12 11 7 13 6
Other commercial 2 0 0 0 0 1 2 0 1 3 1
Private 29 29 28 25 29 40 37 48 33 45 22
Private operators (CARs 604) 12 11 14 13 17 16 20 32 19 25 12
Recreational 17 18 14 12 11 14 11 11 8 9 6
Other private 0 1 0 0 1 10 6 5 6 12 5
State 19 13 17 19 11 15 6 13 10 8 5
Other/Unknown 5 3 2 4 9 14 14 10 12 10 1
Incidents1,2 665 573 530 579 654 711 737 866 769 835 384
Airplane 642 555 519 563 631 672 699 819 728 762 363
Helicopter 31 20 16 20 27 46 38 52 43 77 21
Ultralight / Other aircraft type3 1 0 0 0 3 8 6 4 4 6 0
Aircraft involved in incidents1,4 811 667 619 681 730 800 843 981 874 927 413
Airplanes 779 647 603 661 700 746 799 924 825 842 392
Helicopters 31 20 16 20 27 46 38 53 45 79 21
Ultralight / Other aircraft type3 1 0 0 0 3 8 6 4 4 6 0
Incidents by province/territory1 665 573 530 579 654 711 737 866 769 835 384
Newfoundland and Labrador 13 10 10 17 13 20 22 22 22 15 8
Prince Edward Island 0 0 0 1 0 1 4 1 2 1 1
Nova Scotia 19 14 9 9 19 17 12 17 20 26 11
New Brunswick 8 5 7 4 6 9 9 3 6 8 2
Quebec 89 104 84 96 81 103 99 127 122 125 68
Ontario 141 146 127 142 139 141 148 202 129 146 84
Manitoba 45 30 30 27 45 51 44 47 38 44 25
Saskatchewan 15 11 14 26 27 19 25 18 14 24 13
Alberta 74 76 75 93 93 110 103 102 97 100 38
British Columbia 134 68 87 93 125 137 118 100 114 124 52
Yukon 3 3 3 3 5 6 5 3 2 8 1
Northwest Territories 19 30 17 16 25 17 8 20 21 8 10
Nunavut 17 16 15 10 16 14 15 14 16 14 3
Other airspace under Canadian air traffic control 10 6 4 4 5 8 8 9 5 11 2
Outside Canada 78 54 48 38 55 58 117 181 161 181 66
Data extracted 9 April 2021

30 ◼ Transportation Safety Board of Canada
1 Under the 2014 TSB Regulations, reportable aviation incidents include a) aircraft having a maximum certificated take-off weight greater than 2250
kg (formerly 5700 kg); b) aircraft being operated under an air operator certificate issued under the Canadian Aviation Regulations, Part VII. 2 Breakdowns may not add up to totals. For example, when an occurrence involves an airplane and a helicopter, the occurrence is counted in each
type, but only once in the total. 3 Includes balloons, gyroplanes, gliders, airships, hang gliders, unmanned aerial vehicles (UAV) and similar aircraft types. 4 "Aircraft involved in accidents" are aircraft counts; all other data are accident counts.
Statistical Summary: Air Transportation Occurrences in 2020 ◼ 31
Table 11. Airplane accidents by phase of flight and selected event category,¹ 2010 to 2020
2010 2011 2012 2013 2014 2015 2016 2017 2018 2019 2020 Total
Standing/Taxiing 17 18 17 23 16 19 16 20 13 14 4 177
Collision with object 6 6 7 8 6 3 5 9 6 5 1 62
Collision with moving aircraft 1 1 2 1 3 5 4 3 3 2 1 26
Nosedown/Overturned 4 3 3 5 1 3 2 2 0 1 0 24
Landing gear collapse/retracted 2 3 0 2 1 2 1 3 1 2 0 17
Loss of control 3 0 3 4 1 0 0 0 0 0 0 11
Other events 8 9 9 11 9 12 13 14 10 10 3 108
Takeoff 54 41 54 40 48 53 47 45 35 48 30 495
Collision with terrain 15 11 21 11 10 18 13 15 7 14 4 139
Loss of control 15 12 17 7 18 9 11 7 5 11 3 115
Collision with object 13 9 17 8 11 18 12 8 11 17 12 136
Takeoff/landing event 13 13 19 9 11 11 14 16 11 11 8 136
Power loss 14 11 6 13 16 12 10 11 5 12 6 116
Other events 35 28 33 26 34 50 30 35 31 38 28 368
En route 32 31 30 34 23 29 19 34 27 28 24 311
Power loss 13 14 15 15 14 8 12 15 11 12 8 137
Precautionary/forced landing / Ditching 11 13 9 8 7 5 4 5 6 8 4 80
Collision with terrain 8 8 7 10 5 4 5 5 5 6 3 66
Component/system related 4 1 2 3 2 3 0 3 1 2 3 24
Other events 20 18 14 18 14 26 8 24 22 21 19 204
Manoeuvering 11 12 11 12 4 11 13 11 12 15 14 126
Collision with terrain 5 6 8 7 1 7 6 7 4 5 6 62
Loss of control 3 1 4 1 1 2 4 5 4 0 3 28
Collision with object 7 1 1 2 1 2 3 1 2 5 3 28
Power loss 1 3 1 0 0 1 2 1 1 1 2 13
Other events 3 9 2 5 3 4 6 2 8 12 7 61
Approach 29 23 21 32 28 25 17 21 25 27 24 272
Collision with terrain 11 7 6 6 7 10 4 7 5 8 1 72
Power loss 7 2 0 11 6 2 3 6 6 5 6 54
Collision with object 6 8 1 7 9 7 6 7 3 2 5 61
Component/system related 2 5 3 3 4 2 0 2 3 3 2 29
Precautionary/forced landing / Ditching 5 2 2 7 7 1 1 4 5 7 4 45
Loss of control 6 3 4 5 1 4 1 0 1 5 0 30
Other events 9 8 14 10 9 18 12 13 18 21 18 150
Landing 112 113 111 116 99 118 113 95 92 93 80 1142
Missed or went off runway 24 27 26 28 14 30 30 21 17 23 20 260
Collision with object 25 28 26 18 20 29 24 23 29 25 18 265
Landing gear collapsed/retracted 26 24 22 25 17 27 27 23 19 17 18 245
Nosedown/Overturned 18 17 20 20 17 27 33 29 23 21 19 244
Loss of control 20 17 27 19 22 2 3 6 3 4 0 123
Hard landing 23 22 20 13 14 10 17 19 16 17 7 178
Collision with terrain 18 16 18 12 21 20 12 7 11 10 8 153
Wheels-up landing 7 3 7 10 7 10 9 4 5 7 1 70
Precautionary/forced landing / Ditching 5 3 9 11 5 12 18 18 7 7 9 104
Other events 46 49 42 45 28 77 77 50 58 53 53 578
Post-impact 20 11 19 13 16 37 57 41 44 31 9 298
Fire/Explosion/Fumes 15 6 7 7 6 13 9 5 7 5 4 84
Other events 5 5 12 6 12 24 49 37 38 26 5 219
Data extracted 9 April 2021 1 Breakdowns do not add up to totals. For example, in the take-off phase, if an occurrence involves both "Loss of control" and "Power loss"
events, the occurrence is counted in each event category, but only once in the phase total.
32 ◼ Transportation Safety Board of Canada
Table 12. Helicopter accidents, by selected event category and phase of flight,¹ 2010 to 2020
2010 2011 2012 2013 2014 2015 2016 2017 2018 2019 2020 Total
Standing/Taxiing 0 6 4 1 4 2 0 1 4 3 0 25
Collision with terrain 0 2 1 0 0 1 0 0 0 0 0 4
Loss of control 0 2 0 0 2 1 0 0 0 2 0 7
Collision with object 0 0 0 0 2 1 0 1 1 1 0 6
Other events 0 5 4 1 4 0 0 0 4 2 0 20
Takeoff 2 7 7 7 9 4 6 5 5 6 1 59
Loss of control 1 4 2 0 5 1 4 4 1 3 0 25
Collision with terrain 2 3 1 2 1 2 1 1 2 2 0 17
Collision with object 1 0 4 2 2 1 0 1 2 3 0 16
Power loss 0 2 0 1 1 0 1 0 0 0 0 5
Other events 1 1 2 2 4 1 3 2 2 4 1 23
En route 7 10 9 5 7 4 5 3 6 4 5 65
Collision with terrain 3 3 3 1 3 1 1 1 2 2 1 21
Power loss 3 2 3 1 1 1 3 0 1 1 1 17
Precautionary/forced landing / Ditching 1 0 1 1 0 1 0 0 0 0 0 4
Component/system related 0 2 0 1 0 1 0 0 0 1 0 5
Other events 4 7 6 4 5 3 4 3 5 1 5 47
Manoeuvering 6 10 11 8 4 8 8 7 4 9 5 80
Collision with terrain 3 6 5 5 2 3 5 3 2 2 2 38
Loss of control 2 2 3 2 2 2 3 4 0 2 2 24
Collision with object 2 3 3 2 1 1 3 3 1 4 1 24
Operations related event 1 2 2 1 0 2 5 3 1 6 1 24
Power loss 1 0 2 1 0 2 1 1 0 1 0 9
Other events 1 3 6 2 2 5 5 5 2 7 4 42
Approach 4 6 7 3 3 3 5 2 2 1 1 37
Collision with terrain 4 1 1 0 0 0 1 0 0 0 0 7
Power loss 0 0 2 0 1 1 3 0 0 0 0 7
Loss of control 1 1 1 0 1 1 2 1 1 0 0 9
Collision with object 0 2 0 0 1 0 1 1 0 0 0 5
Other events 3 3 5 3 2 2 4 1 1 1 1 26
Landing 15 7 13 12 12 18 16 13 12 12 9 139
Hard landing 4 4 4 1 3 1 0 1 2 0 0 20
Collision with terrain 4 2 4 0 3 6 0 0 2 1 1 23
Loss of control 1 1 1 2 4 6 2 1 2 3 6 29
Collision with object 5 2 2 5 5 1 4 3 6 2 5 40
Other events 7 2 4 9 5 10 4 5 5 7 5 63
Post-impact 4 4 2 3 2 5 11 1 6 5 2 45
Fire/Explosion/Fumes 1 2 1 2 0 1 0 0 0 3 2 12
Other events 3 2 1 1 2 4 11 1 6 4 0 35
Data extracted 9 April 2021 1 Breakdowns do not add up to totals. For example, in the take-off phase, if an occurrence involves both "Loss of control" and "Power loss"
events, the occurrence is counted in each event category, but only once in the phase total.

Statistical Summary: Air Transportation Occurrences in 2020 ◼ 33
Table 13. Fatal airplane accidents, by phase of flight and selected event category,¹ 2010 to 2020
2010 2011 2012 2013 2014 2015 2016 2017 2018 2019 2020 Total
Standing/Taxiing 0 1 1 1 0 1 2 1 0 1 1 9
Collision with object 0 0 0 0 0 0 0 0 0 0 0 0
Collision with moving aircraft 0 0 0 0 0 0 0 0 0 0 0 0
Nosedown/Overturned 0 0 0 0 0 0 0 0 0 0 0 0
Landing gear collapsed/retracted 0 0 0 0 0 0 0 0 0 0 0 0
Loss of control 0 0 0 0 0 0 0 0 0 0 0 0
Other events 0 1 1 1 0 1 2 1 0 1 1 9
Takeoff 6 4 6 4 2 9 5 6 5 7 1 55
Collision with terrain 2 1 4 3 0 4 4 5 2 5 0 30
Loss of control 1 2 2 2 1 4 4 2 2 2 0 22
Collision with object 0 1 2 0 0 1 0 1 1 1 0 7
Takeoff/landing event 0 1 1 1 1 0 0 1 0 0 1 6
Power loss 3 1 0 0 1 1 1 1 0 1 0 9
Other events 3 4 3 2 0 7 1 4 4 3 1 32
En route 9 9 8 9 3 7 5 5 6 10 2 73
Power loss 0 2 1 0 0 0 2 0 1 2 0 8
Precautionary/forced landing / Ditching 0 1 0 0 0 0 1 0 0 1 0 3
Collision with terrain 8 5 6 7 3 4 4 3 5 6 1 52
Component/system related 1 0 0 0 0 1 0 0 0 0 0 2
Other events 4 4 2 5 1 6 2 4 5 7 1 41
Manoeuvering 2 1 4 3 2 4 5 4 5 4 4 38
Collision with terrain 1 1 4 2 1 4 4 4 3 4 3 31
Loss of control 1 0 2 0 1 0 2 2 4 0 1 13
Collision with object 2 0 0 0 0 1 1 1 0 0 1 6
Power loss 0 0 0 0 0 0 0 0 0 0 0 0
Other events 1 1 0 1 1 0 1 1 3 2 1 12
Approach 10 6 5 5 1 5 4 4 4 4 0 48
Collision with terrain 6 4 3 5 0 3 3 3 2 2 0 31
Power loss 1 1 0 1 0 0 0 0 0 0 0 3
Collision with object 2 2 0 0 0 1 1 1 0 0 0 7
Component/system related 0 0 0 0 0 0 0 1 0 2 0 3
Precautionary/forced landing / Ditching 2 1 0 0 0 0 0 0 0 0 0 3
Loss of control 5 0 1 2 0 0 1 0 0 1 0 10
Other events 4 1 4 1 1 2 2 2 2 3 0 22
Landing 3 5 3 3 4 4 5 0 1 4 0 32
Missed or went off runway 0 0 0 0 1 0 1 0 0 0 0 2
Collision with object 0 1 0 0 0 1 1 0 1 2 0 6
Landing gear collapsed/retracted 0 0 0 0 0 0 0 0 0 0 0 0
Nosedown/Overturned 1 1 1 2 1 0 0 0 1 2 0 9
Loss of control 1 0 0 1 0 0 0 0 0 0 0 2
Hard landing 0 0 1 0 0 0 0 0 0 0 0 1
Collision with terrain 2 2 3 2 2 2 4 0 0 1 0 18
Wheels-up landing 0 0 0 0 0 0 0 0 0 0 0 0
Precautionary/forced landing / Ditching 0 0 0 1 0 1 0 0 0 0 0 2
Other events 1 1 2 0 2 1 3 0 1 2 0 13
Post-impact 13 6 8 8 4 10 9 5 8 4 1 76
Fire/Explosion/Fumes 12 4 6 7 3 10 7 4 6 3 1 63
Other events 1 2 2 1 2 0 2 1 2 1 0 14
Data extracted 9 April 2021 1 Breakdowns do not add up to totals. For example, in the takeoff phase, if an occurrence involves both "Loss of control" and "Power loss" events,
the occurrence is counted in each event category, but only once in the phase total.
34 ◼ Transportation Safety Board of Canada
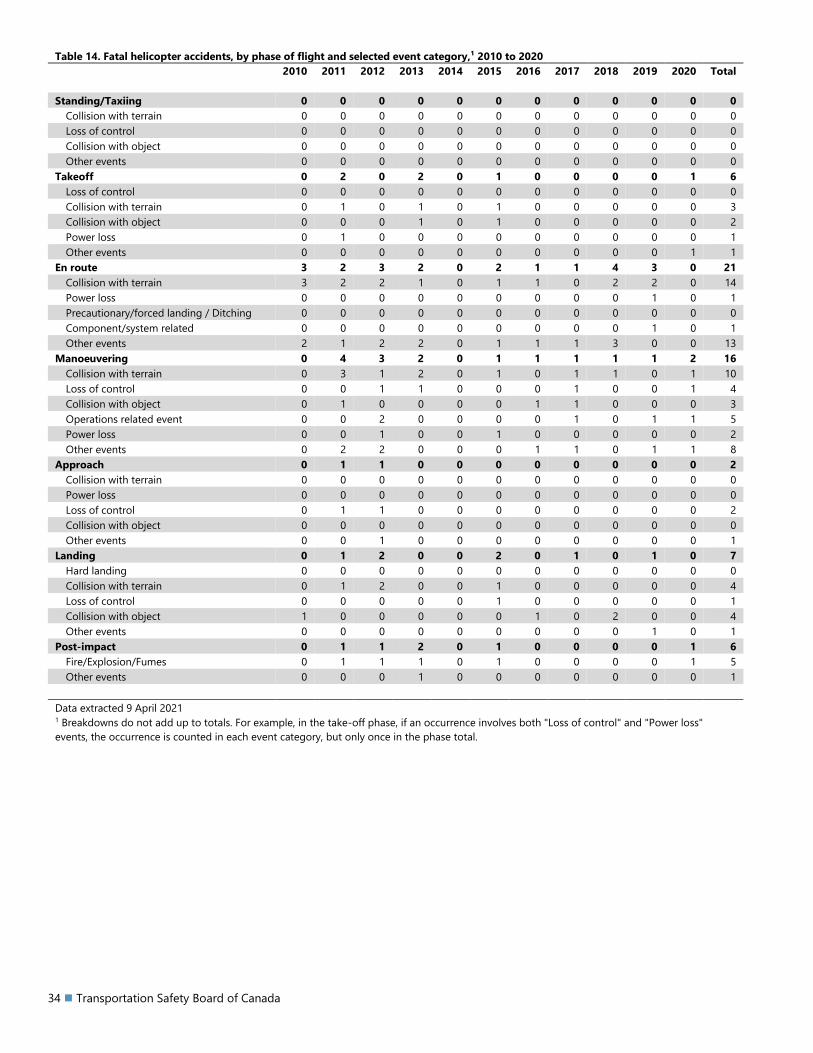
Table 14. Fatal helicopter accidents, by phase of flight and selected event category,¹ 2010 to 2020
2010 2011 2012 2013 2014 2015 2016 2017 2018 2019 2020 Total
Standing/Taxiing 0 0 0 0 0 0 0 0 0 0 0 0
Collision with terrain 0 0 0 0 0 0 0 0 0 0 0 0
Loss of control 0 0 0 0 0 0 0 0 0 0 0 0
Collision with object 0 0 0 0 0 0 0 0 0 0 0 0
Other events 0 0 0 0 0 0 0 0 0 0 0 0
Takeoff 0 2 0 2 0 1 0 0 0 0 1 6
Loss of control 0 0 0 0 0 0 0 0 0 0 0 0
Collision with terrain 0 1 0 1 0 1 0 0 0 0 0 3
Collision with object 0 0 0 1 0 1 0 0 0 0 0 2
Power loss 0 1 0 0 0 0 0 0 0 0 0 1
Other events 0 0 0 0 0 0 0 0 0 0 1 1
En route 3 2 3 2 0 2 1 1 4 3 0 21
Collision with terrain 3 2 2 1 0 1 1 0 2 2 0 14
Power loss 0 0 0 0 0 0 0 0 0 1 0 1
Precautionary/forced landing / Ditching 0 0 0 0 0 0 0 0 0 0 0 0
Component/system related 0 0 0 0 0 0 0 0 0 1 0 1
Other events 2 1 2 2 0 1 1 1 3 0 0 13
Manoeuvering 0 4 3 2 0 1 1 1 1 1 2 16
Collision with terrain 0 3 1 2 0 1 0 1 1 0 1 10
Loss of control 0 0 1 1 0 0 0 1 0 0 1 4
Collision with object 0 1 0 0 0 0 1 1 0 0 0 3
Operations related event 0 0 2 0 0 0 0 1 0 1 1 5
Power loss 0 0 1 0 0 1 0 0 0 0 0 2
Other events 0 2 2 0 0 0 1 1 0 1 1 8
Approach 0 1 1 0 0 0 0 0 0 0 0 2
Collision with terrain 0 0 0 0 0 0 0 0 0 0 0 0
Power loss 0 0 0 0 0 0 0 0 0 0 0 0
Loss of control 0 1 1 0 0 0 0 0 0 0 0 2
Collision with object 0 0 0 0 0 0 0 0 0 0 0 0
Other events 0 0 1 0 0 0 0 0 0 0 0 1
Landing 0 1 2 0 0 2 0 1 0 1 0 7
Hard landing 0 0 0 0 0 0 0 0 0 0 0 0
Collision with terrain 0 1 2 0 0 1 0 0 0 0 0 4
Loss of control 0 0 0 0 0 1 0 0 0 0 0 1
Collision with object 1 0 0 0 0 0 1 0 2 0 0 4
Other events 0 0 0 0 0 0 0 0 0 1 0 1
Post-impact 0 1 1 2 0 1 0 0 0 0 1 6
Fire/Explosion/Fumes 0 1 1 1 0 1 0 0 0 0 1 5
Other events 0 0 0 1 0 0 0 0 0 0 0 1
Data extracted 9 April 2021 1 Breakdowns do not add up to totals. For example, in the take-off phase, if an occurrence involves both "Loss of control" and "Power loss"
events, the occurrence is counted in each event category, but only once in the phase total.
Statistical Summary: Air Transportation Occurrences in 2020 ◼ 35
Definitions
The following definitions apply to air transportation occurrences that are required to be reported
pursuant to the Canadian Transportation Accident Investigation and Safety Board Act and the
Transportation Safety Board Regulations.
Aviation occurrence
• Any accident or incident associated with the operation of an aircraft, and
• any situation or condition that the Board has reasonable grounds to believe could, if left unattended,
induce an accident or incident described below.
Reportable aviation accident
An aviation accident is an occurrence resulting directly from the operation of an aircraft in which
a. a person is killed or sustains a serious injury as a result of
i. being on board the aircraft,
ii. coming into direct contact with any part of the aircraft, including parts that have become
detached from the aircraft, or
iii. being directly exposed to jet blast, rotor down wash or propeller wash;
b. the aircraft sustains structural failure or damage that adversely affects the aircraft's structural
strength, performance or flight characteristics and would normally require major repair or
replacement of any affected component, except for
i. engine failure or damage, when the damage is limited to the engine, its cowlings or
accessories, or
ii. damage limited to propellers, wing tips, antennae, tires, brakes, fairings or small dents or
puncture holes in the aircraft's skin; or
c. the aircraft is missing or inaccessible.
Reportable aviation incident
An aviation incident is an occurrence resulting directly from the operation of an aircraft having a
maximum certificated take-off weight greater than 2250 kg or of an aircraft being operated under an air
operator certificate issued under Part VII of the Canadian Aviation Regulations in which,
a. an engine fails or is shut down as a precautionary measure;
b. a power train transmission gearbox malfunction occurs;
c. smoke is detected or a fire occurs on board;
36 ◼ Transportation Safety Board of Canada
d. difficulties in controlling the aircraft are encountered owing to any aircraft system malfunction,
weather phenomena, wake turbulence, uncontrolled vibrations or operations outside the flight
envelope;
e. the aircraft fails to remain within the intended landing or take-off area, lands with all or part of
the landing gear retracted or drags a wing tip, an engine pod or any other part of the aircraft;
f. a crew member whose duties are directly related to the safe operation of the aircraft is unable to
perform their duties as a result of a physical incapacitation which poses a threat to the safety of
persons, property or the environment;
g. depressurization of the aircraft occurs that requires an emergency descent;
h. a fuel shortage occurs that requires a diversion or requires approach and landing priority at the
destination of the aircraft;
i. the aircraft is refuelled with the incorrect type of fuel or contaminated fuel;
j. a minor collision, a risk of collision or a loss of separation occurs;
k. a crew member declares an emergency or indicates an emergency that requires priority handling
by air traffic services or the standing by of emergency response services;
l. a slung load is released unintentionally or as a precautionary or emergency measure from the
aircraft; or
m. any dangerous goods are released in or from the aircraft.
Collision
Collision means an impact, other than an impact associated with normal operating circumstances,
between aircraft or between an aircraft and another object or terrain.
Risk of collision
Risk of collision means a situation in which an aircraft comes so close to being involved in a collision that
a threat to the safety of any person, property or the environment exists.
Loss of separation
Loss of separation means a situation in which the distance separating two aircraft is less than the
minimum established in the Canadian Domestic Air Traffic Control Separation Standards, published by the
Department of Transport, as amended from time to time.
Serious injury
• a fracture of any bone, except simple fractures of fingers, toes or the nose;
• lacerations that cause severe hemorrhage or nerve, muscle or tendon damage,
• an injury to an internal organ;
• second or third degree burns, or any burns affecting more than 5% of the body surface;
• a verified exposure to infectious substances or injurious radiation; or
Statistical Summary: Air Transportation Occurrences in 2020 ◼ 37
• an injury that is likely to require hospitalization.
Operation
Operation means the activities for which an aircraft is used from the time any person boards the aircraft
with the intention of flight until they disembark.
Operator
Operator has the same meaning as in subsection 101.01(1) of the Canadian Aviation Regulations.
Commercial operators
Commercial operators include carriers that offer a “for-hire” service to transport people or goods, or to
undertake specific tasks such as aerial photography, flight training, or crop spraying.
Airliner
An airplane used by a Canadian air operator in an air transport service or in aerial work involving
sightseeing operations, that has a MCTOW of more than 8 618 kg (19 000 pounds) or for which a
Canadian type certificate has been issued authorizing the transport of 20 or more passengers.
Commuter aircraft
An airplane used by a Canadian air operator, in an air transport service or in aerial work involving
sightseeing operations, in which the aircraft is
• a multi-engined aircraft that has a MCTOW of 8618 kg (19 000 pounds) or less and a seating
configuration, excluding pilot seats, of 10 to 19, inclusive; or
• a turbo jet powered airplane that has a maximum zero fuel weight of 22 680 kg (50 000 pounds) or
less and for which a Canadian type certificate has been issued authorizing the transport of not more
than 19 passengers.
Aerial work aircraft
A commercially operated airplane or helicopter used in aerial work involving
• the carriage on board of persons other than flight crew members;
• the carriage of helicopter external loads;
• the towing of objects; or
• the dispersal of products.
Air taxi aircraft
A commercially operated aircraft used in an air transport service or in aerial work involving sightseeing
operations, in which the aircraft is
• a single engined aircraft;
38 ◼ Transportation Safety Board of Canada
• a multi engined aircraft, other than a turbo jet powered airplane, that has a MCTOW of 8618 kg (19
000 pounds) or less and a seating configuration, excluding pilot seats, of nine or less; or
• any aircraft that is authorized by the Minister of Transport to be operated under Part VII, Subpart 3,
Division 1 of the CARs.
State operators
State operators include the federal and provincial governments.
Private operators
Private operator means the holder of a private operator registration document issued under subsection
604.04(2) of the CARs.
Recreational operators
Recreational operators include individuals flying for pleasure. Included are flights on which it is not
possible to transport people or cargo on a “for-hire” basis.