Embed Size (px)
Citation preview

XXX-X-XXXX-XXXX-X/XX/$XX.00 ©20XX IEEE
Airborne Radar for sUAS Sense and AvoidGeorge N. Szatkowski
NASA Langley Research Center
Hampton, Va, USA
Andrew Kriz
Virginia Polytechnic Institute and
State University
Blacksburg, Va, USA
Larry A. Ticatch
TEAMS III
Hampton, VA, USA
Robert Briggs
Virginia Polytechnic Institute and
State University
Blacksburg, Va, USA
John Coggin
Virginia Polytechnic Institute and
State University
Blacksburg, Va, USA
Christopher M. Morris
Analytical Mechanics Associates
Hampton, VA, USA
Abstract A primary challenge for the safe integration of small
UAS operations into the National Airspace System (NAS) is
traffic deconfliction, both from manned and unmanned aircraft.
The UAS Traffic Management (UTM) project being conducted at
the National Aeronautics and Space Administration (NASA)
considers a layered approach to separation provision, ranging
from segregation of operations through airspace volumes
(geofences) to autonomous sense and avoid (SAA) technologies
for higher risk, densely occupied airspace. Cooperative SAA
systems, such as Automatic Dependent Surveillance-Broadcast
(ADS-B) and/or vehicle-to-vehicle communication systems
provide significant additional risk mitigation but they fail to
adequately mitigate collision risks for non-cooperative (non-
transponder equipped) airborne aircraft. The RAAVIN (Radar
on Autonomous Aircraft to Verify ICAROUS Navigation) flight
test being conducted by NASA and the Mid-Atlantic Aviation
Partnership (MAAP) was designed to investigate the applicability
and performance of a prototype, commercially available sUAS
radar to detect and track non-cooperative airborne traffic, both
manned and unmanned.
The radar selected for this research was a Frequency
Modulated Continuous Wave (FMCW) radar with 120 degree
azimuth and 80 degree elevation field of view operating at
24.55GHz center frequency with a 200 MHz bandwidth. The
radar transmits 2 watts of power thru a Metamaterial
Electronically Scanning Array antenna in horizontal
polarization. When the radar is transmitting, personnel must be
at least 1 meter away from the active array to limit nonionizing
radiation exposure. The radar physical dimensions are 18.7cm
by 12.1cm by 4.1cm and it weighs less than 820 grams making it
well suited for installation on small UASs. The onboard, SAA
capability, known as ICAROUS, (Independent Configurable
Architecture for Reliable Operations of Unmanned Systems),
developed by NASA to support sUAS operations, will provide
autonomous guidance using the traffic radar tracks from the
onboard radar.
The RAAVIN set of studies will be conducted in three phases.
The first phase included outdoor, ground-based radar
evaluations performed at the Virginia Tech’s Kentland Farm
testing range in Blacksburg, VA. The test was designed to
measure how well the radar could detect and track a small UAS
flying in the radar’s field of view. The radar was used to monitor
5 test flights consisting of outbound, inbound and crossing routes
at different ranges and altitudes. The UAS flown during the
ground test was the Inspire 2, a quad copter weighing less than
4250 grams (10 pounds) at maximum payload. The radar was set
up to scan and track targets over its full azimuthal field of view
from 0 to 40 degrees in elevation. The radar was configured to
eliminate tracks generated from any targets located beyond 2000
meters from the radar and moving at velocities under 1.45
meters per second.
For subsequent phases of the study the radar will be
integrated with a sUAS platform to evaluate its performance in
flight for SAA applications ranging from sUAS to manned GA
aircraft detections and tracking.
Preliminary data analysis from the first outdoor ground tests
showed the radar performed well at tracking the vehicle as it
flew outbound and repeatedly maintained a track out to 1000
meters (maximum 1387 meters) until the vehicle slowed to a stop
to reverse direction to fly inbound. As the Inspire flew inbound
tracks from beyond 800 meters, a reacquisition time delay was
consistently observed between when the Inspire exceeds a speed
of 1.45 meters per second and when the radar indicated an
inbound target was present and maintained its track. The time
delay varied between 6 seconds to over 37 seconds for the
inbound flights examined, and typically resulted in about a 200
meter closure distance before the Inspire track was maintained.
The radar performed well at both acquiring and tracking the
vehicle as it flew crossing routes out past 400 meters across the
azimuthal field of view. The radar and ICAROUS software will
be integrated and flown on a BFD-1400-SE8-E UAS during the
next phase of the RAAVIN project.
The main goal at the conclusion of this effort is to determine
if this radar technology can reliably support minimum
requirements for SAA applications of sUAS. In particular, the
study will measure the range of vehicle detections, lateral and
vertical angular errors, false and missed/late detections, and
estimated distance at closest point of approach after an
avoidance maneuver is executed. This last metric is directly
impacted by sensor performance and indicates its suitability for
the task.
Keywords—UTM, SAA, Radar, UAS

I. INTRODUCTION
The NASA UTM project is conducting research to evaluate
prototype technologies needed to safely integrate UAS operations into the NAS. The Federal Aviation Administration’s Unmanned Aircraft Systems (UAS) Traffic Management (UTM) Concept of Operations states risk mitigation for UAS flights conducted beyond visual line of sight in Class G (Uncontrolled) airspace can be achieved with sense and avoid on-board equipment capable of continuously tracking the range, position and velocity of airborne objects in its vicinity to ensure a safe separation distance from other airborne vehicles is maintained. [1] Under this scenario, the sense and avoid sensor would relay the location and trajectory information of the airborne targets to the UAS ground control system to adjust the UAS vehicle heading or to enact an automatic contingency procedure to maneuver the UAS autonomously.
The RAAVIN (Radar on Autonomous Aircraft to Verify ICAROUS Navigation) flight tests reported here were conducted to demonstrate a candidate sense and avoid 24.5 GHz Doppler radar marketed for UTM operations to evaluate its capabilities to locate, track and alert the presence of airborne vehicles operating in the UAS’s vicinity for the purpose of autonomous maneuvering. The performance of the SAA radar is expected to replicate the function of an onboard human pilot, and have at least have the same field of view as a pilot in a cockpit, which is to about +/- 110 degrees in azimuth and about +/- 15 degrees in elevation (relative to the aircraft). This coverage corresponds to the “see and avoid” task performed by a “manned” crew. The radar should also revisit a track at least every 2 second and provide a minimum of a 20 second warning of approaching traffic. [2] A NASA developed SAA algorithm ICAROUS, (Independent Configurable Architecture for Reliable Operations of Unmanned Systems) will use the real time radar tracking data to execute autonomous maneuvers to eliminate potential airborne conflicts. [3]
II. GROUND TESTS
A. Radar Setup
The candidate UTM sense and avoid sensor selected for this research was a Frequency Modulated Continuous Wave radar with 120° azimuth and 80° elevation field of view operating at 24.55 GHz center frequency with a 45 MHz swept bandwidth. The radar transmits 2 watts of peak power through a Metamaterial Electronically Scanning Array (MESA) antenna oriented in horizontal polarization. The 22 dBi gain from the MESA antenna requires personnel to be at least 1 meter away from the active array to limit nonionizing radiation exposure. The radar’s physical dimensions are 18.7 cm by 12.1 cm by 4.1 cm and it weighs less than 820 grams, making it well suited for installation on small UASs. The radar has independent transmit and receive antenna arrays divided by a small aluminum metal fence to reduce cross talk coupling. The radar firmware version 12 was used during the ground test evaluation. Enhancements to improve the performance of the Kalman filter have been achieved in later firmware versions.
The radar is controlled using a command line interface API software called BNET thru an Ethernet TCP protocol. Scripting commands are used to establish the radar’s operational characteristics including the search and track fields of view, parameters to govern the tracking Kalman filter, range and velocity masking options to help reduce false tracks, and data logging selections. Radar detections are generated every time the radar is able to detect a Doppler target. Detections may or may not turn into radar tracks depending on the radar masking settings defined in the startup script command. The radar track and detection data packets are recorded in binary (.bin) files. By default, detection packets are transmitted at a rate of every beam step period, 6.72 msec, while Track data packets by default are transmitted every 4.98 Hz which gives about 210 msec between every update. The user cannot modify the detection transmit rate, but the track data transmit rate can be configured to transmit at the user specified track update rate in the range (0.0, 5.0) per second. In later firmware versions the update rate has increased to 10 Hz.
The ground tests were conducted with the radar field of view configured to scan 120 degrees in azimuth and 0 to +40 degrees in elevation. To reduce the potential for false tracks, the masking commands were set to only monitor targets out to 2000 meters with radial velocities between 1.45 and 30 meters per second and an estimated radar cross section greater than -20 decibels per square meter. To ensure new tracks were identified as quickly as possible, the minimum reporting confidence level was set to 15 (out of 100). All other radar command settings were placed at the recommended default values to track airborne UAS.
The radar was mounted on a tripod at a height of approximately 5 feet above the ground facing 227 degrees from true north at 0 degree pitch and roll. The radar location was measured to be at approximately 526.7 meters above sea level, at 37.196297 degrees latitude and -80.578373 degrees longitude based on reference measurements made from the GPS location of the Inspire’s launch position. The radar orientation and position are approximations, and not absolutes.
The radar uses a right handed Cartesian coordinate system that is fixed to the face of the antenna to determine where antenna radiation is pointed relative to the radar aperture. The z axis is the broadside direction normal to the face of the radar. The y axis is the vertical direction in the plane of the radar aperture. The x axis is the horizontal direction and points from right to left in the plane of the antenna face. Azimuth is defined as the angle measured from the z axis toward the x axis. Elevation angle is defined as the angle between the pointing vector and the xz plane.
B. Flight Test Approach
The stationary radar was used to track an airborne UAS target flying outbound, inbound and crossing routes in 5 separate flights. The UAS used in these tests was the DJI Inspire 2. The Inspire has a maximum takeoff weight of less than 10 pounds and can achieve velocities of up to 93 kilometers per hour. The outbound flight paths typically took the Inspire away from the radar at a -15 degrees azimuth angle out to a range distance of around 1000 meters at a traveling

velocity of 14 meters per seconds. The Inspire was then slowed to a stop, reversed course direction and maintained the same inbound trajectory back to the radar. The farthest outbound flight carried the Inspire out to a range of 1350 meters. The Inspire was flown at an altitude of either 60 or 120 meters. The majority of the flights were flown in this manner with slight variation in heading. Flight 5 had one route flown at a velocity of 7 meters per second. The crossing route flights were conducted at varying boresight range distances out to 400 meters. A total of 12 outbound/inbound routes were flown and 3 crossing routes.
C. Radar Data Processing
A Python script was developed to parse the radar generated track.bin files to enable data analysis. The parser application opens the radar track .bin files, parses the binary data found in these files, then stores the parsed information into new ASCII formatted .csv files that can be viewed and manipulated in common spreadsheet applications such as Microsoft Excel for future plotting and analysis. The parsed .csv files contain all variables found in the track packets available for analysis, including x, y, z, coordinate locations, azimuth, elevation, and range coordinates, velocity, confidence level, estimated radar cross section (RCS), lifetime of the track and sample acquisition time. The parser also calculates two additional outputs used in the data analysis. The total velocity, which is calculated from the radar velocities given in x, y, and z coordinates, provides a measure of direct correlation to the speed of the Doppler target regardless of direction. The relative recorded time from the first track point is also calculated to provide a standard time base between tracks and is used as the x-axis for the data plots. To expedite plotting and analysis of the .csv files, a LabVIEW based application was developed. The plotting routine retrieves individual data points assembled in the tracking .csv data files and automatically generates data plot curves viewable in Microsoft Excel.
The DJI Inspire 2 flight control system logs binary files on-board which contain the position and velocity data necessary to validate the radar tracks. The binary files were downloaded post-flight and converted into CSV format using DatCon3.4. The resulting data included timestamped data and GPS data including 3D position and velocity data. The Inspire velocity data was synchronized in time with the radar tracking data to establish the relative time delay between when the GPS derived velocity data indicated the Inspire had exceeded a velocity of 1.45 meters/second and when the radar reacquired its track on inbound routes. The Inspire's timestamped data showed about an extra 48.662 second time drift over an actual 1173 second flight; thus, the data needed to be linearly scaled by a factor of 1.041 to match the timing of the radar data. The GPS velocity data was plotted against the radar measured total velocity data on a synchronized time scale to calculate the time required to identify a new track showing the Inspire was approaching the radar location.
D. Radar Analysis
The radar tracking data for the 5 flights were plotted and compared to the Inspire’s onboard flight control log data to determine the general performance of the radar. The radar and
GPS data were imported into Google Earth visual software to overlay the radar track with the Inspire’s flight path. Fig. 1 presents the Google Earth map with the superimposed flight and track data for flight 1. The white trace in the image is the radar data. The GPS data is the red trace. The radar data aligns well with GPS coordinates of the Inspire during the 3 outbound/inbound routes. The radar traces which are not associated with the Inspire’s flight route are believed to be from birds in the area. In addition to the Google Earth data comparisons, the radar’s range, azimuth, elevation, total velocity, confidence level, estimated radar cross section (RCS), and track lifetime data were also plotted against relative time for each flight. Analysis of the combination of these plots provided a means to establish when the radar was and should have been tracking the Inspire, versus when tracks were from birds, road traffic or other unidentified targets. Generally speaking, the track data was very clean and no identifiable clutter such as from moving tree branches were observed. The tracks in the data that were not from the Inspire could usually be traced to flying birds and road traffic being observed in the radar’s field of view. Google Earth map overlays were made for each flight for analysis, but only data for flight 1 will be presented.
The radar range verses time plot proved to provide a good indication of when the Inspire was being tracked. The range data, combined together with the radar total velocity data and Inspire’s GPS velocity data, provided a means to establish when the Inspire should be observable and tracked by the radar based on its GPS velocity exceeding 1.45 meters per second. Fig. 2 shows these three data curves plotted on the same relative time axis for flight 1. The left y-axis presents the velocity in meters per second and corresponds to the GPS velocity curve in blue and radar velocity curve in red. The right y-axis is radar range in meters and corresponds to the gold curve. The x axis is the synchronized relative time of the track. The range data shows the Inspire is first tracked at about 70 meters and maintains the track out to around 850 meters, when the Inspire stops to reverse course. The flight profile of the Inspire indicated it entered the radar’s field of view at 40 degrees elevation, which equates to the 70 meter range distance
Fig. 1. Google Earth Map displaying flight 1 GPS data and radar tacks

Fig. 2. Radar range, velocity and GPS velocity plot for flight 1.
TABLE I: FLIGHT 1 RADAR PERFORMANCE SUMMARY
at the 60 meter flight altitude. The Inspire’s return inbound route was first tracked at around 574 meters at 88.2 seconds on the relative time scale during the first pass. The radar maintained the Inspire’s track as it flew back to the radar, stopped, reversed course and continued its outbound journey to well past 1000 meters on its second pass. As it returned on the inbound pass, the radar reacquired the Inspire for about a second and a half at 733 meters out before losing it for unknown reason. The return track is then reacquired and maintained from a distance of 627 meters out. The radar continues to track the Inspire as it reverses direction, climbs to 120 meters for its third outbound pass, and flies out to over 1000 meters. On the inbound route, the Inspire track is picked up again at 828 meters.
The GPS velocity data only provides absolute speed and shows the Inspire maintains a steady speed of 14.4 meters per second in both outbound and inbound flights. The corresponding radar velocity data also indicates the direction of the flight. The radar velocity is positive when the Inspire is flying away from the radar and negative when Inspire is closing in on the radar. The radar data showed the Inspire typically maintained a speed of around 15.4 meters per second. The radar tracker derived velocity was found to have a calculation error based on the tracker update speed which was assumed to be 200 milliseconds. But in reality the tracker is updated about every 210 milliseconds. This caused the tracker to overestimate the target velocity by 5 to 10%. The velocity derivation has been corrected in later radar firmware versions.
The GPS velocity data curve indicates the moment in time when the Inspire exceeds 1.45 meters per second. The range data curve shows the time when the inbound track is reacquired. The difference between these two times is the warning time of an incoming target. In the first inbound pass for flight 1, the radar responded in 20.2 seconds. On the second pass, the radar tracked the incoming Inspire for 1.5 seconds before losing the track. The track was not maintained until 267.5 seconds. The GPS velocity data indicated the Inspire exceeded the 1.45 meters per second radar track threshold velocity at 236.8 seconds making the warning time of 30.7 seconds. The warning time of the third inbound route was 14.4 seconds.
Table I presents a summary of the radar performance metrics, highlighting the maximum outbound range track distance and the inbound warning times for flight 1. The radar azimuth and elevation angles are included in the table to verify the Inspire was within the radar’s field of view and ensure the validity of the warning time calculation. The inbound acquired track distance used in the tables were selected from the point in time where the track was held and not dropped intermittently. On the second inbound pass in flight 1, the radar did track the Inspire for 1 ½ seconds prior to maintaining a steady lock. The radar confidence level for the 1 ½ second track did not get higher than 40%. Other flights had similar occurrences where the inbound route was tracked intermittently before maintaining a steady lock. The data used in the radar performance summary tables for the inbound track distance was chosen to be the point in time when the radar maintains a steady lock and the track would eventually reach a 100%
confidence level. The confidence level of the reacquired radar track data point used in all summary tables was 15%.
Fig. 3 presents the radar range, velocity and GPS velocity data for flight 2 in the same format found in Fig. 2. Flight 2 consisted of two outbound/inbound routes with a maintained velocity of around 14 meters per second. The first route was flown at 60 meters altitude, the second at 120 meters. The radar range data curve indicates the Inspire was tracked out to over 1000 meters in both passes. The radar reacquired the inbound Inspire at a range of 859 meters at 60 meters altitude and maintained lock at a range of 780 meters at 120 meters altitude. This resulted in an 11 second and 18.4 second warning time respectively. A summary of the radar performance metrics are shown in Table II.
Fig. 4 presents the range and velocity data plot for flight 3. The Inspire flew essentially the same mission profile in flight 3 as in flight 2. The first outbound route was flown at 60 meters altitude, the second at 120 meters altitude. The radar tracked the Inspire out to a range of 1043 meters in the first outbound and to 1039 meters in the second. The radar maintained the inbound tracks starting at a distance of 709 meters at 60 meters altitude and 750 meters at 120 meters altitude. The resulting warning times were 21 and 19.6 seconds, respectively. Table III shows a summary of the radar performance metrics for flight 3.
In Fig. 5, the radar and velocity data are presented for flight 4. There were 4 outbound/inbound passes flown in Flight 4. The first outbound route was flown at 60 meters altitude out to a range 870 meters. The next two outbound routes were flown
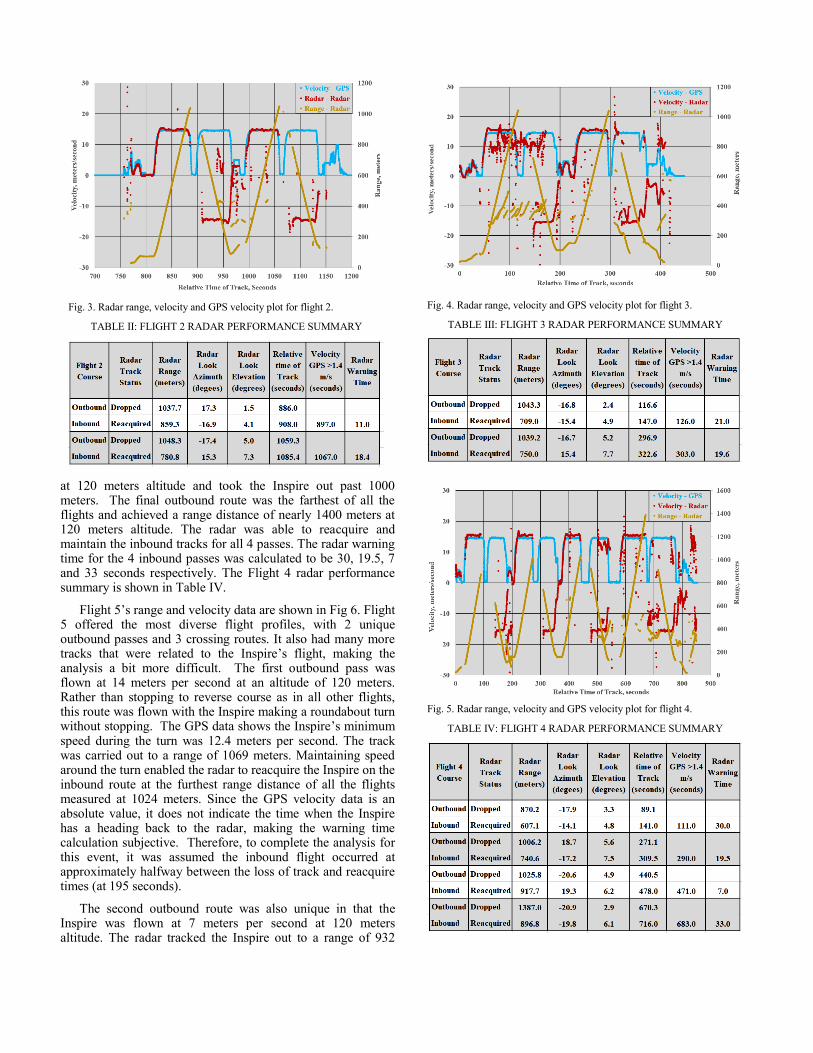
Fig. 3. Radar range, velocity and GPS velocity plot for flight 2.
TABLE II: FLIGHT 2 RADAR PERFORMANCE SUMMARY
Fig. 4. Radar range, velocity and GPS velocity plot for flight 3.
TABLE III: FLIGHT 3 RADAR PERFORMANCE SUMMARY
Fig. 5. Radar range, velocity and GPS velocity plot for flight 4.
TABLE IV: FLIGHT 4 RADAR PERFORMANCE SUMMARY
at 120 meters altitude and took the Inspire out past 1000 meters. The final outbound route was the farthest of all the flights and achieved a range distance of nearly 1400 meters at 120 meters altitude. The radar was able to reacquire and maintain the inbound tracks for all 4 passes. The radar warning time for the 4 inbound passes was calculated to be 30, 19.5, 7 and 33 seconds respectively. The Flight 4 radar performance summary is shown in Table IV.
Flight 5’s range and velocity data are shown in Fig 6. Flight 5 offered the most diverse flight profiles, with 2 unique outbound passes and 3 crossing routes. It also had many more tracks that were related to the Inspire’s flight, making the analysis a bit more difficult. The first outbound pass was flown at 14 meters per second at an altitude of 120 meters. Rather than stopping to reverse course as in all other flights, this route was flown with the Inspire making a roundabout turn without stopping. The GPS data shows the Inspire’s minimum speed during the turn was 12.4 meters per second. The track was carried out to a range of 1069 meters. Maintaining speed around the turn enabled the radar to reacquire the Inspire on the inbound route at the furthest range distance of all the flights measured at 1024 meters. Since the GPS velocity data is an absolute value, it does not indicate the time when the Inspire has a heading back to the radar, making the warning time calculation subjective. Therefore, to complete the analysis for this event, it was assumed the inbound flight occurred at approximately halfway between the loss of track and reacquire times (at 195 seconds).
The second outbound route was also unique in that the Inspire was flown at 7 meters per second at 120 meters altitude. The radar tracked the Inspire out to a range of 932

Fig. 6. Radar range, velocity and GPS velocity plot for flight 5.
TABLE V: FLIGHT 5 RADAR PERFORMANCE SUMMARY
meters when it stopped to reverse course. On its inbound route, the range data shows the Inspire was first picked up at a range of 977 meters, which is the only time an inbound track was acquired beyond where the outbound track was lost. The Inspire was flying at 7 meters per second, which had some influence on the reacquisition range closure. This particular track was dropped, and three other intermittent tracks were recorded before the track was maintained at a range distance of 725 meters. Having the criteria that a track must be maintained and reach 100% confidence level to be used in the warning time calculation, the 4 intermittent tracks caused the longest warning time in all the flights at 37.7 seconds.
The next 3 passes in flight 5 were composed of complex flight paths with crossing routes, making analysis more difficult. The timing of the crossing routes cannot be discerned by only looking at the range plot. Accurate analysis required examination of the Google Earth map overlay to identify the Inspire radar tracks from the large number of close in radar bird tracks. The radar’s azimuth, elevation, RCS, confidence level and lifetime plots were also examined. The passes with crossing routes took the Inspire outside of the azimuth radar field of view. This prevented an accurate assessment of the radar warning time. The radar was able to track and reacquire the Inspire in the crossing routes as it entered and exited the radar field of view, but no additional radar performance metrics were established. Table V shows a summary of the radar performance metrics for the two outbound/inbound routes in flight 5.
III. CONCLUSIONS AND FUTURE WORK
The RAAVIN (Radar on Autonomous Aircraft to Verify
ICAROUS Navigation) flight test being conducted by NASA
and the Mid-Atlantic Aviation Partnership (MAAP) was
designed to investigate the applicability and performance of a
prototype, commercially available sUAS radar to detect and
track non-cooperative airborne traffic, both manned and
unmanned. The RAAVIN set of studies will be conducted in
three phases. The first phase reported here, included outdoor,
ground-based radar evaluations performed at the Virginia
Tech’s Kentland Farm testing range in Blacksburg, VA. The
test was designed to measure how well the radar could detect
and track a small UAS flying in the radar’s field of view. The
radar was used to monitor 5 test flights consisting of
outbound, inbound and crossing routes at different ranges and
altitudes. The UAS flown during the ground test was the
Inspire 2, a quad copter weighing less than 4250 grams (10
pounds) at maximum payload. The radar was set up to scan
and track targets over its full azimuthal field of view and from
0 to 40 degrees in elevation. The radar was operated using the
software version 12, and configured to eliminate tracks
generated from any targets located beyond 2000 meters from
the radar and moving at velocities under 1.45 meters per
second.
The ground radar tests showed the radar performed well
at acquiring and maintaining a track on the Inspire as it
routinely flew outbound routes to beyond 1000 meters until
the vehicle slowed to a stop to reverse direction to fly
inbound. The maximum distance tracked was 1387 meters.
Inbound routes were analyzed to determine the warning time
delay between when the Inspire was flying at a speed of
greater than 1.45 meters per second and when the radar
maintained a track that achieved 100% confidence level,
alerting the presence of an airborne target. As the Inspire flew
inbound tracks from beyond 800 meters, the warning time
delay varied between 6 seconds to over 37 seconds. The
higher warning times were a result of initial tracks being
dropped before the radar was able to maintain the inbound
track. The radar performed well at both acquiring and tracking
the vehicle as it flew crossing routes out past 400 meters
across the azimuth field of view.
For subsequent phases of the RAAVIN study, the radar
and ICAROUS will be integrated and flown on a BFD-1400-
SE8-E UAS sUAS platform to evaluate its performance in
flight for SAA applications ranging from sUAS to manned
GA aircraft. The airborne testing will incorporate version 13
of the radar software with improved Kalman filtering features.
At the conclusion of this effort, the study is aimed to
determine if this radar technology can reliably support
minimum requirements for SAA applications of sUAS. In
particular, the study will measure the range of vehicle
detections, lateral and vertical angular errors, false and
missed/late detections, and estimated distance at closest point
of approach after an avoidance maneuver is executed. This last

metric is directly impacted by sensor performance and
indicates its suitability for the task.
REFERENCES
[1] Unmanned Aircraft Systems (UAS) Traffic Management (UTM)
Concept of Operations. Version 1.0. Federal Aviation Administration. May 18, 2018
[2] S. Kemkemian, M. Nouvel-Fiani, P. Cornic, P. Le Bihan, and P. Garrec, “Radar systems for ‘Sense and Avoid’ on UAV,” Radar Conference-Surveillance for a Safer World, 2009. RADAR. International, pp. 1-6, 2009.
[3] M. Consiglio, B. Duffy, S. Balachandran, L. Glaab, C. Muñoz,, “Sense and Avoid Characterization of the Independent Configurable Architecture for Reliable Operations of Unmanned Systems”, Thirteenth USA/Europe Air Traffic Management Research and Development Seminar (ATM2019)