Embed Size (px)
Citation preview
manuscript submitted to JGR: Atmospheres
Aircraft Charging and its Influence on Triggered1
Lightning2
C. Pavan1, P. Fontanes2, M. Urbani2, N. C. Nguyen1, M. Martinez-Sanchez1,3
J. Peraire1, J. Montanya2, and C. Guerra-Garcia14
1Department of Aeronautics and Astronautics, Massachusetts Institute of Technology, Cambridge,5
Massachusetts.62Department of Electrical Engineering, Universitat Politecnica de Catalunya, Terrassa (Barcelona), Spain.7
Key Points:8
• Aircraft triggered lightning is influenced by the net charge of the floating body9
• Positive leader inception from an aircraft requires higher amplitude external fields10
when negatively biasing the vehicle11
• Experimental results validate a proposed method of aircraft triggered lightning12
strike risk-reduction13
Corresponding author: C. Guerra-Garcia, [email protected]
–1–

manuscript submitted to JGR: Atmospheres
Abstract14
This paper reports on a laboratory experiment to study the effect of vehicle net charge15
on the inception of a positive leader from an aircraft exposed to high atmospheric elec-16
tric fields. The experiment models the first stage of aircraft-triggered lightning, in which17
a positive leader typically develops from the vehicle and is shortly afterwards followed18
by a negative leader. This mechanism of lightning initiation amounts to around 90% of19
strikes to aircraft. Aircraft can acquire net charge levels of the order of a millicoulomb20
from a number of sources including corona emission, charged particles in the engine ex-21
haust and charge transfer by collisions with particles in the atmosphere. In addition, air-22
craft could potentially be artificially charged through controlled charge emission from23
the surface. Experiments were performed on a model aircraft with a 1m wingspan, which24
was suspended between two parallel electrodes in a 1.45m gap with voltage difference25
of a few hundred kilovolts applied across it. In this configuration, it is found that the26
breakdown field can vary by as much as 30% for the range of charging levels tested. The27
experimental results show agreement with an electrostatic model of leader initiation from28
aircraft, and the model indicates that the effect can be substantially stronger if additional29
negative charge is added to the aircraft. The results from this work suggest that flying30
uncharged is not optimal in terms of lightning avoidance and open up the possibility of31
developing risk-reduction strategies based on net charge control.32
Plain Language Summary33
Commercial aircraft are typically struck by lightning around once per year, and the34
vast majority of these events are triggered by the aircraft itself. The lightning discharge35
originates on the surface of the aircraft in areas with sharp edges. Whether a discharge36
develops is in part due to the net electric charge of the aircraft, which can be acquired37
both naturally or artificially. Previous work has shown that it is theoretically possible38
to reduce the likelihood of a lightning strike occurring by manipulating the net charge39
of the aircraft. In this paper, the authors perform laboratory experiments to validate this40
hypothesis. These experiments demonstrate that the threshold for lightning could be in-41
creased by 30% by charging the aircraft negatively, which means that an aircraft could42
fly safely through ambient electric fields that are around 30% higher than those of an43
uncharged baseline. Theoretical estimates suggest that further improvement may be pos-44
sible if the aircraft were charged to a more negative state than those tested. This work45
gives laboratory scale experimental evidence that it is possible to reduce the frequency46
of lightning strikes on aircraft by manipulating their charge, and encourages further in-47
vestigation of the proposed lightning strike risk-reduction strategy.48
1 Introduction49
Formal studies into lightning effects and aircraft survivability began in the 1940s50
after the catastrophic accident of a Pennsylvania-Central Airlines DC-3A aircraft (Plumer,51
2017). Nowadays, strict protection and mitigation measures are embedded in aircraft:52
the use of expanded metal foil or wire mesh to ensure a fully conductive path and elec-53
tromagnetic shielding in composite structures, incorporation of lightning diverter strips54
in the radome, securing of fasteners and joints to avoid arcing and sparking in the fuel55
tanks, wire bundle shielding, proper grounding, and the use of surge protectors (Sweers56
et al., 2012). These measures ensure the safety of flight in the event of a strike and must57
comply with regulations of the civil certification authorities (the Federal Aviation Ad-58
ministration, FAA, and the European Aviation Safety Agency, EASA). Standard com-59
mittees (the Society of Automotive Engineers, SAE, and the European Organization for60
Civil Aviation Equipment, EUROCAE) provide detailed guidelines on testing standards61
to demonstrate compliance (section 2.1). Although lightning strikes pose no critical safety62
concerns, they are responsible for costly delays, service interruptions, and repairs.63
–2–
manuscript submitted to JGR: Atmospheres
E�
E�
(1) (2)
(3) (4)
+
−
−− −−
E∞
+
−
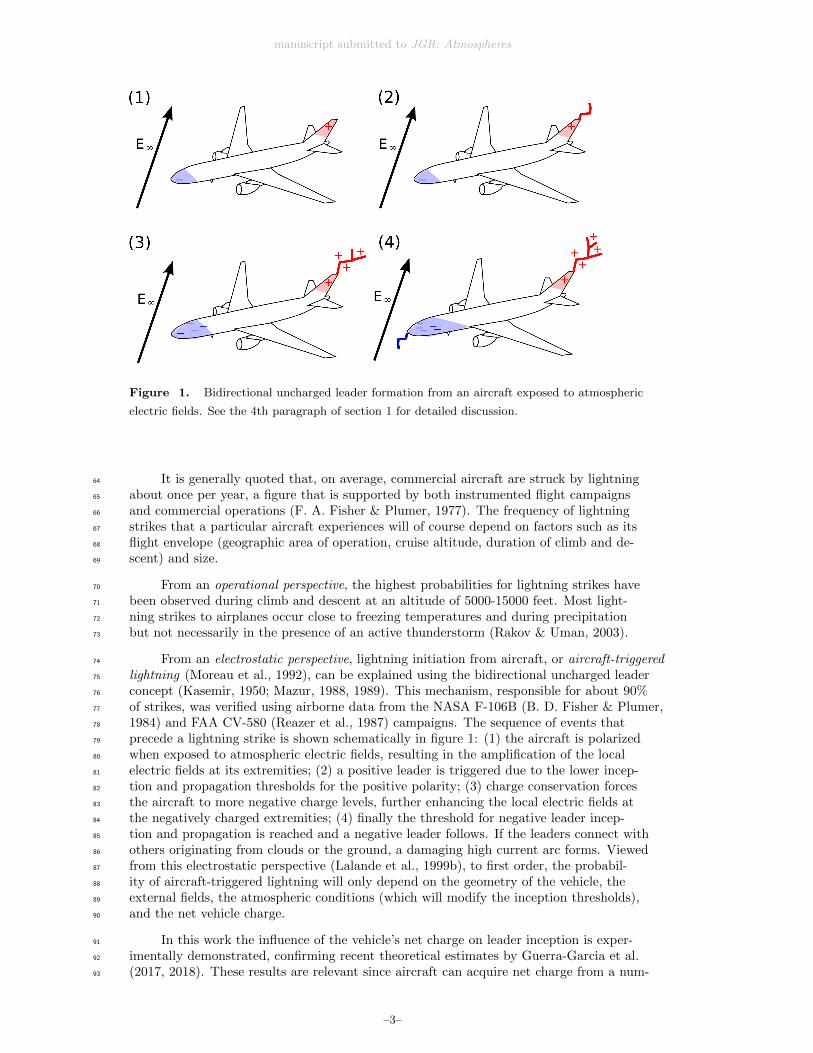
Figure 1. Bidirectional uncharged leader formation from an aircraft exposed to atmospheric
electric fields. See the 4th paragraph of section 1 for detailed discussion.
It is generally quoted that, on average, commercial aircraft are struck by lightning64
about once per year, a figure that is supported by both instrumented flight campaigns65
and commercial operations (F. A. Fisher & Plumer, 1977). The frequency of lightning66
strikes that a particular aircraft experiences will of course depend on factors such as its67
flight envelope (geographic area of operation, cruise altitude, duration of climb and de-68
scent) and size.69
From an operational perspective, the highest probabilities for lightning strikes have70
been observed during climb and descent at an altitude of 5000-15000 feet. Most light-71
ning strikes to airplanes occur close to freezing temperatures and during precipitation72
but not necessarily in the presence of an active thunderstorm (Rakov & Uman, 2003).73
From an electrostatic perspective, lightning initiation from aircraft, or aircraft-triggered74
lightning (Moreau et al., 1992), can be explained using the bidirectional uncharged leader75
concept (Kasemir, 1950; Mazur, 1988, 1989). This mechanism, responsible for about 90%76
of strikes, was verified using airborne data from the NASA F-106B (B. D. Fisher & Plumer,77
1984) and FAA CV-580 (Reazer et al., 1987) campaigns. The sequence of events that78
precede a lightning strike is shown schematically in figure 1: (1) the aircraft is polarized79
when exposed to atmospheric electric fields, resulting in the amplification of the local80
electric fields at its extremities; (2) a positive leader is triggered due to the lower incep-81
tion and propagation thresholds for the positive polarity; (3) charge conservation forces82
the aircraft to more negative charge levels, further enhancing the local electric fields at83
the negatively charged extremities; (4) finally the threshold for negative leader incep-84
tion and propagation is reached and a negative leader follows. If the leaders connect with85
others originating from clouds or the ground, a damaging high current arc forms. Viewed86
from this electrostatic perspective (Lalande et al., 1999b), to first order, the probabil-87
ity of aircraft-triggered lightning will only depend on the geometry of the vehicle, the88
external fields, the atmospheric conditions (which will modify the inception thresholds),89
and the net vehicle charge.90
In this work the influence of the vehicle’s net charge on leader inception is exper-91
imentally demonstrated, confirming recent theoretical estimates by Guerra-Garcia et al.92
(2017, 2018). These results are relevant since aircraft can acquire net charge from a num-93
–3–
manuscript submitted to JGR: Atmospheres
ber of sources including friction with the runway during takeoff, corona discharges from94
static dischargers or other electrically stressed regions, charged species in the engine ex-95
haust, and charge transfer by collision with particles in the atmosphere (Vonnegut & Lit-96
tle, 1965). In addition, the results from this work may open up a pathway towards an97
active means of reducing the risk of aircraft-triggered lightning through charge control98
(Martinez-Sanchez et al., 2019).99
The paper is organized as follows. It begins with an overview of aircraft lightning100
leader attachment testing standards, followed by a description of the modifications in-101
corporated to allow for the exploration of the effect of the vehicle’s net charge. Next, ex-102
perimental results of the dependence of lightning inception on aircraft charge are pre-103
sented and compared to a theoretical model. The paper closes with a discussion on how104
the electrostatic perspective of aircraft-triggered lightning can assist the development of105
lightning detection and prediction, and ultimately, risk-reduction technologies.106
2 Testing Procedures107
2.1 Overview of Lightning Leader Attachment Testing108
Aircraft components must undergo a variety of tests for susceptibility to environ-109
mental damage. In particular, testing standards representative of flight conditions lead-110
ing up to and during a strike are described in the SAE standard ARP5416 (SAE Aerospace,111
2005) and the equivalent European standard EUROCAE ED-105 (EUROCAE, 2005).112
The impact of strikes to aircraft are typically classified as either direct effects, encom-113
passing any risks associated with the lightning discharge itself; or indirect effects, which114
arise from interactions between the electromagnetic fields generated by the discharge and115
components of the aircraft. Direct effects mostly correspond to physical damage to the116
external surfaces of the aircraft, while indirect effects include damage to sensors and elec-117
tronics (Uman, 2008; Plumer, 2012).118
The risks associated with lightning strikes can also be broken up chronologically119
since, in most cases, the lightning channel attachment location will be swept along the120
aircraft as a result of its motion. This can result in lightning damage occurring on lo-121
cations of the aircraft that are not leader trigger points themselves (Lalande & Delan-122
noy, 2012). In general, aircraft are divided into zones based on how they typically ex-123
perience lightning strikes. The locations corresponding to initial leader connection and124
first return stroke are referred to as zone 1 per guidelines given in SAE standard ARP5414125
(SAE Aerospace, 2012). While determination of the extent of this zone requires in-depth126
analysis and testing, it generally encompasses most of the aircraft extremities which will127
enhance the local electric field and favor leader initiation. Examples include the aircraft128
nose, wingtips, nacelles, and empennage. Zone 2 corresponds to regions susceptible to129
subsequent return strokes as the lightning channel is swept along the aircraft and zone130
3 to regions experiencing current flow without arc attachment (SAE Aerospace, 2012).131
Lightning leader and swept channel attachment tests are conducted by applying132
different high voltage waveforms across a gap containing the components to be tested.133
The voltage required depends on the size of the gap, but will be on the order of hundreds134
of kilovolts to a few megavolts. The currents produced in these tests are relatively low135
(for the experiments reported, the generator provides about 800 A), hence these tests136
are used to determine leader attachment locations only and not for determining poten-137
tial damage (SAE Aerospace, 2005). Damage assessment is performed by applying a se-138
quence of high current waveforms directly to the component. These current waveforms139
replicate the many individual current pulses resulting from first return stroke, contin-140
uing current and subsequent return strokes following the initial leader connection (SAE141
Aerospace, 2005).142
–4–
manuscript submitted to JGR: Atmospheres
In this work, the primary concern is lightning initiation; the relevant testing stan-143
dards to determine the initial attachment of a lightning leader are described in section144
5.1.1 of ARP5416 (SAE Aerospace, 2005). The background electric field amplitude de-145
pendence with time, recommended for this test, is a D-type waveform as specified by SAE146
standard ARP5412 (SAE Aerospace, 2013). This waveform has a rise time of 50-250µs147
and a decay to half-maximum time on the order of 2ms. It is designed to increase at a148
slow enough rate so as to allow streamer coronae to develop and propagate from the air-149
craft, which results in a greater variation of lightning attachment points to the model150
(SAE Aerospace, 2013; Plumer, 2012). The experimental setup to demonstrate the in-151
fluence of net charge on aircraft-triggered lightning is based on this standard and is de-152
scribed in section 2.2.153
2.2 Experimental Setup154
Lightning leader attachment tests make use of a conductive model aircraft suspended155
between two electrode plates, one grounded, one at high voltage, to simulate the effect156
of a strong ambient field on a vehicle in flight.157
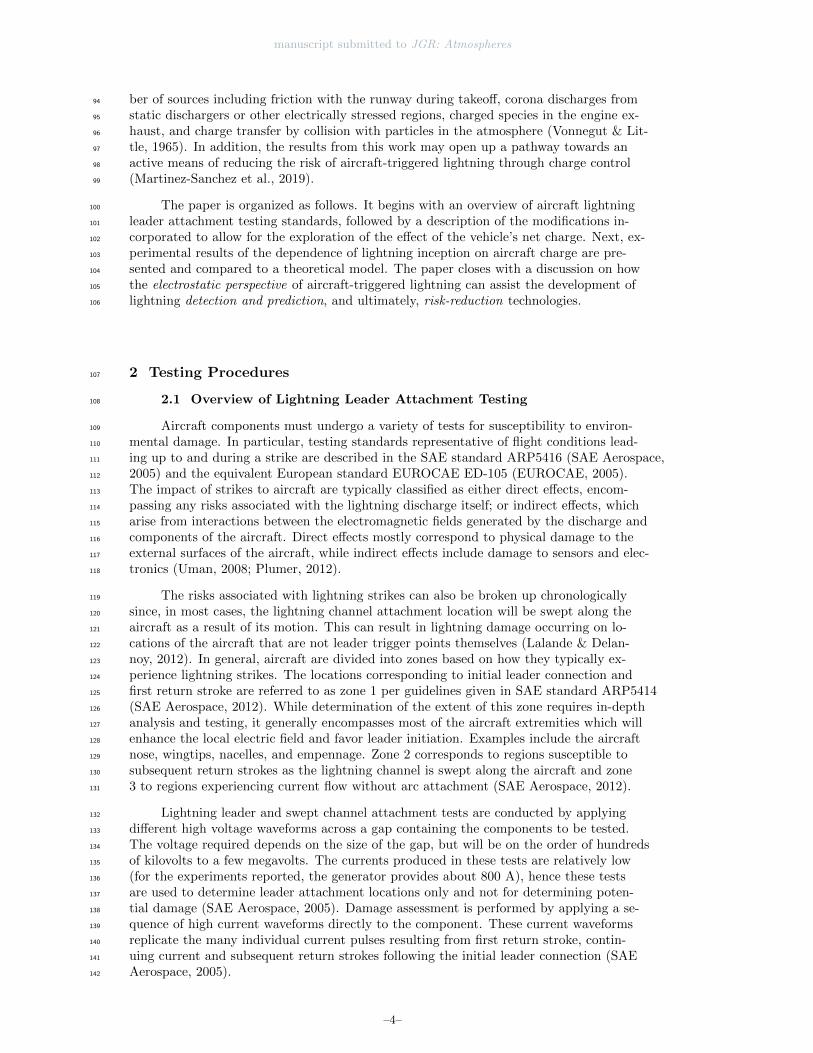
Figure 2. Diagram of experimental setup to demonstrate effect of model net charge on first
leader inception. Dashed lines are non-contact line-of-sight measurements. PMT=photomultiplier
tube, EFM= electric field mill, VD=voltage divider, VDG=Van de Graaff generator,
CAM=camera.
A diagram of the experimental setup is shown in figure 2 and a plan view show-158
ing the approximate locations of the sensors is shown in figure 3. A high voltage plate159
2m in diameter was suspended 145cm above a grounded base. The high voltage electrode160
was connected to a 1MV Marx generator through a resistor with a spark gap on either161
side. Between the resistor and the spark gap to the electrode, a damped capacitive volt-162
age divider was connected to measure the applied voltage. Two lengths of kevlar rope163
were strung through the gap between the high voltage electrode and ground plate, and164
the test model was rested on them. The rope was secured at either end to PTFE (poly-165
tetraflouroethylene) blocks which were anchored to ground. The test model was pitched166
up with an angle between the nose and the ground of approximately 50 degrees. The short-167
est distance between the model aircraft and the high voltage plate was 26cm measured168
at the aircraft nose and the shortest distance between the model and the ground was 78cm169
measured at the winglets. This orientation was chosen to favor positive leader forma-170
–5–
manuscript submitted to JGR: Atmospheres
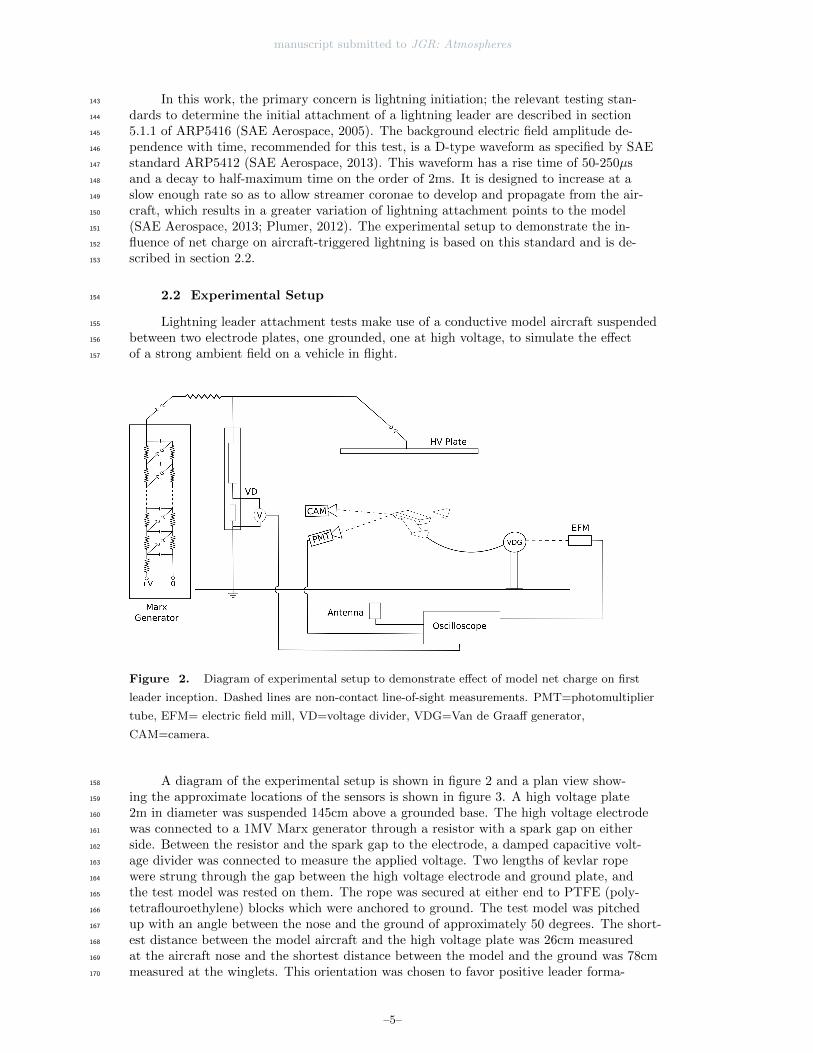
Figure 3. Plan view of experimental setup showing approximate location of sensors relative to
aircraft model.
tion from the nose of the model (rather than, for example, the wing tips) so that there171
would be a repeatable location on which to focus optical sensors. The model itself was172
electrically connected via conducting wire to a Van de Graaff generator which provided173
a means of charging the floating body to tens of kilovolts (negative) relative to ground.174
The Van de Graaff generator was operated using batteries to keep it separated from the175
building electrical system, and in this setup could sustain a model potential of up to -176
40kV. The Van de Graaff generator remained on for the duration of the test. The smooth177
spherical geometry of the Van de Graaff top electrode provided a good reference surface178
on which to focus an electric field mill to get a non-contact measurement of this poten-179
tial. This sphere was mounted on top of an insulating post designed to allow voltages180
of up to -400kV relative to the grounded base without electric breakdown or significant181
current conduction.182
The model aircraft used for this experiment was the frame of a hobby aircraft con-183
structed to dimensions given by Bixler and Sponholz (2016). The model was a blended-184
wing-body design approximately 52cm in length with a wingspan of 104cm and a radius185
of curvature of 2.5cm at the nose. The entire model was wrapped in aluminum foil to186
ensure conductivity.187
In this work, three different high voltage waveforms (applied to the upper plate)188
were tested including a D-type waveform (with rise time 90µs, waveform 1) and two wave-189
forms with longer rise times (waveforms 2 and 3 with rise times of 330µs and 800µs re-190
spectively). The rise time is here defined as the time to peak. Negative amplitude wave-191
forms were applied in this experiment so that the aircraft model would be positively charged192
–6–
manuscript submitted to JGR: Atmospheres
0 0.5 1 1.5 2 2.5 30
0.2
0.4
0.6
0.8
1
Waveform 1 (D-Type)Waveform 2Waveform 3
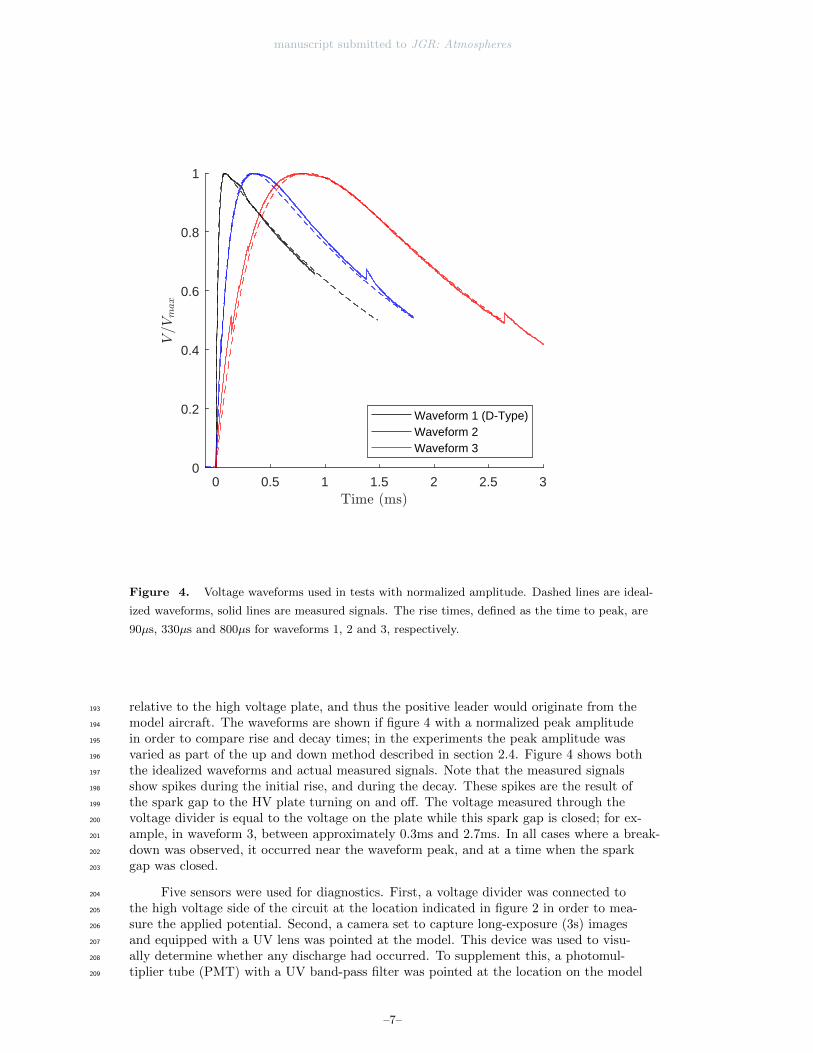
Figure 4. Voltage waveforms used in tests with normalized amplitude. Dashed lines are ideal-
ized waveforms, solid lines are measured signals. The rise times, defined as the time to peak, are
90µs, 330µs and 800µs for waveforms 1, 2 and 3, respectively.
relative to the high voltage plate, and thus the positive leader would originate from the193
model aircraft. The waveforms are shown if figure 4 with a normalized peak amplitude194
in order to compare rise and decay times; in the experiments the peak amplitude was195
varied as part of the up and down method described in section 2.4. Figure 4 shows both196
the idealized waveforms and actual measured signals. Note that the measured signals197
show spikes during the initial rise, and during the decay. These spikes are the result of198
the spark gap to the HV plate turning on and off. The voltage measured through the199
voltage divider is equal to the voltage on the plate while this spark gap is closed; for ex-200
ample, in waveform 3, between approximately 0.3ms and 2.7ms. In all cases where a break-201
down was observed, it occurred near the waveform peak, and at a time when the spark202
gap was closed.203
Five sensors were used for diagnostics. First, a voltage divider was connected to204
the high voltage side of the circuit at the location indicated in figure 2 in order to mea-205
sure the applied potential. Second, a camera set to capture long-exposure (3s) images206
and equipped with a UV lens was pointed at the model. This device was used to visu-207
ally determine whether any discharge had occurred. To supplement this, a photomul-208
tiplier tube (PMT) with a UV band-pass filter was pointed at the location on the model209
–7–
manuscript submitted to JGR: Atmospheres
where the first leader was expected. This measurement was able to time-resolve the dis-210
charge, although the very intense luminosity would often saturate the detector after leader211
connection between the model and the high voltage electrode. Also used to detect the212
leader was an antenna, which measured variations in the ambient electric fields caused213
by leader propagation/current flow. The antenna was a flat plate antenna with gain -214
60 dB and bandwidth 400 Hz to 500 MHz. The final sensor was an electric field mill (EFM),215
which was pointed at the Van de Graaff generator and as far as possible from the par-216
allel plate electrodes. The primary purpose of this sensor was to determine the level of217
charge on the model, as charged by the Van de Graaff generator. The field mill was cal-218
ibrated by applying a known voltage to the spherical electrode of the Van de Graaff gen-219
erator using a high voltage power supply and measuring the output signal. The field mill220
was calibrated to be accurate for electrode voltages between 0 and -50kV since this was221
the typical range applied using the Van de Graaff generator.222
2.3 Interpretation of the Sensor Data223
820 825 830 835 840 845 850-240
-230
-220
-210
-200
820 825 830 835 840 845 850
AntennaPMT
A B C
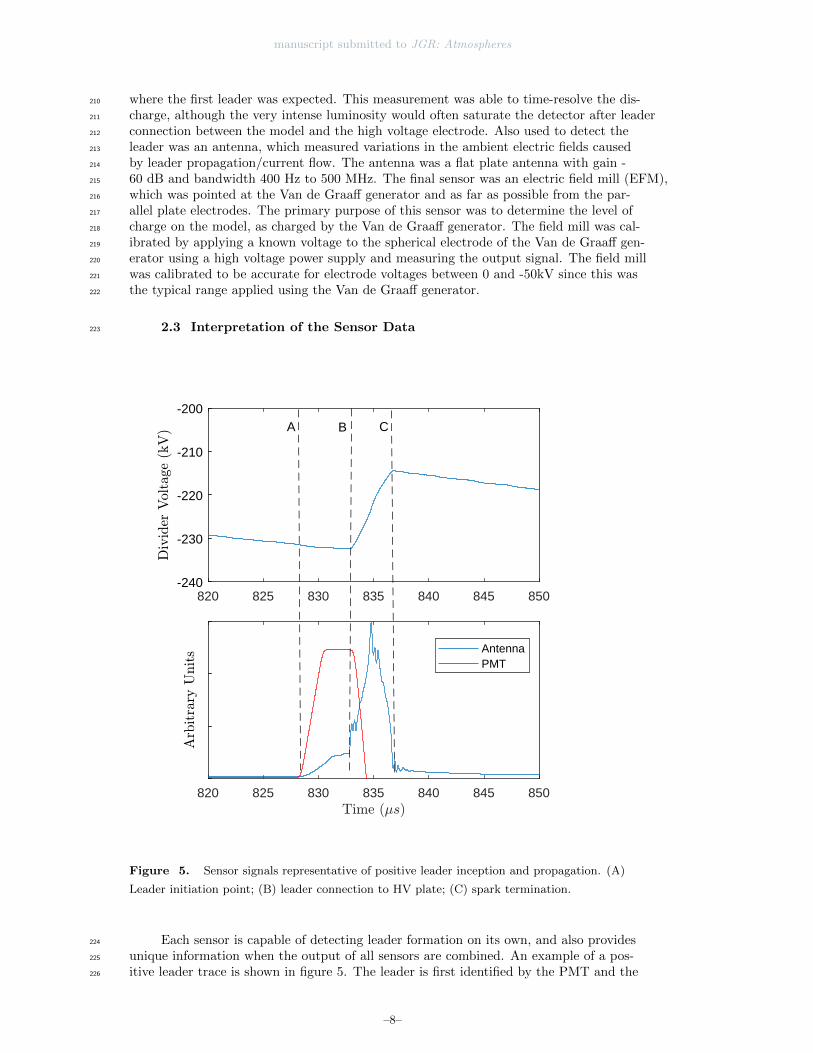
Figure 5. Sensor signals representative of positive leader inception and propagation. (A)
Leader initiation point; (B) leader connection to HV plate; (C) spark termination.
Each sensor is capable of detecting leader formation on its own, and also provides224
unique information when the output of all sensors are combined. An example of a pos-225
itive leader trace is shown in figure 5. The leader is first identified by the PMT and the226
–8–
manuscript submitted to JGR: Atmospheres
antenna at point A. The signal is attributed to a leader, and not streamers, due to the227
high luminosity: streamers are typically less bright than leaders. Since a voltage change228
is not measured in the high voltage plate, this indicates that the leader is originating at229
the aircraft model. This is consistent with the physics of real aircraft-triggered lightning230
(Lalande & Delannoy, 2012; Plumer, 2012). After approximately 5µs (point B), the up-231
per plate voltage begins to change. This indicates that the leader has bridged the gap232
and that current is flowing from the high voltage plate to the model. The 5µs transit233
time across a gap on the order of 25cm gives a leader speed of 5·104m/s. A leader speed234
on the order of 104m/s is consistent with other laboratory measurements (Plumer, 2012;235
Les Renardieres Group, 1973; Andreev et al., 2008) and further evidence that the sig-236
nal being observed is a positive leader. Note that the sensitive PMT saturates due to237
the bright leader between points A and B. At point B, when the even brighter spark con-238
nects, the PMT starts reading over-range which is why the signal cuts out. The current239
flow lasts a few microseconds, during which the antenna picks up significant changes in240
the surrounding electric fields relative to those occurring during leader propagation. Af-241
ter the model and plate have equilibrated, the current flow stops and the system begins242
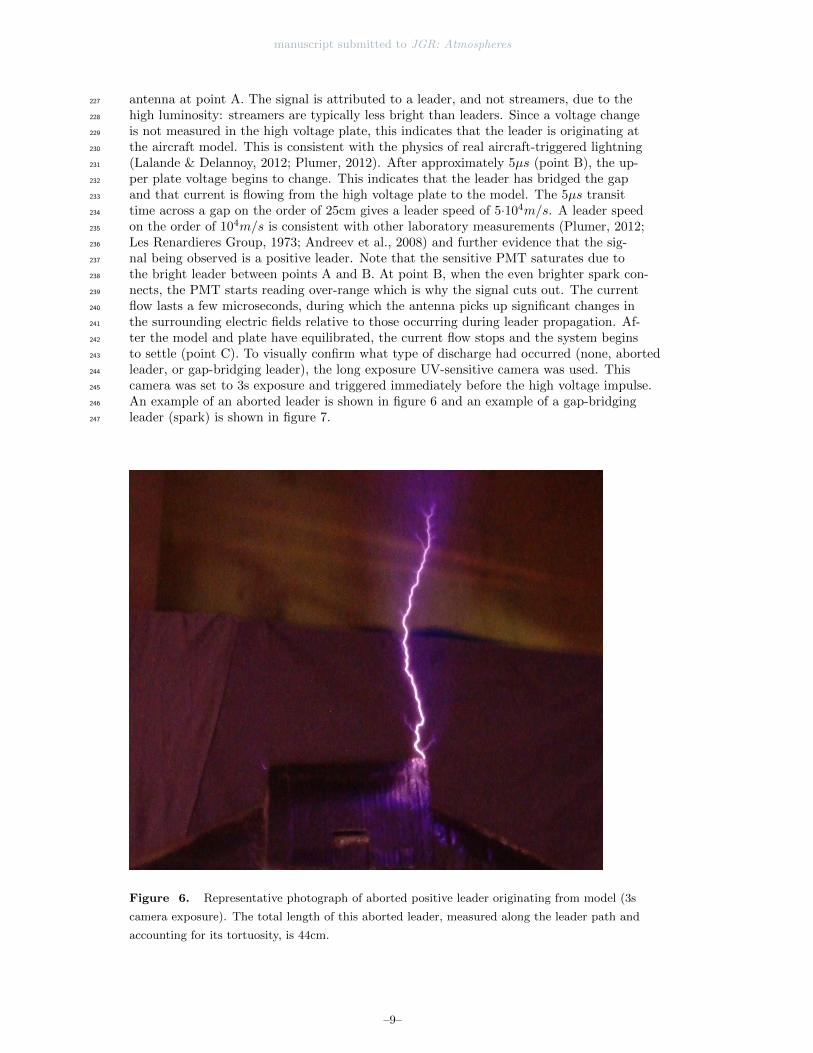
to settle (point C). To visually confirm what type of discharge had occurred (none, aborted243
leader, or gap-bridging leader), the long exposure UV-sensitive camera was used. This244
camera was set to 3s exposure and triggered immediately before the high voltage impulse.245
An example of an aborted leader is shown in figure 6 and an example of a gap-bridging246
leader (spark) is shown in figure 7.247
Figure 6. Representative photograph of aborted positive leader originating from model (3s
camera exposure). The total length of this aborted leader, measured along the leader path and
accounting for its tortuosity, is 44cm.
–9–
manuscript submitted to JGR: Atmospheres
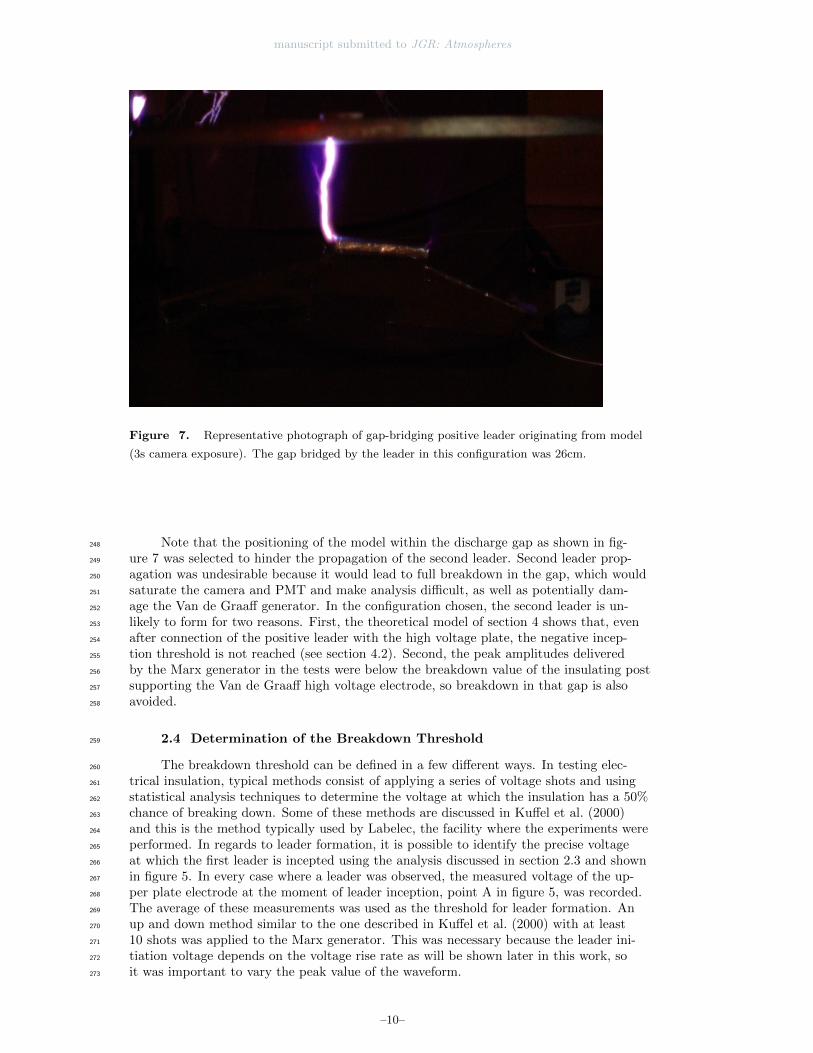
Figure 7. Representative photograph of gap-bridging positive leader originating from model
(3s camera exposure). The gap bridged by the leader in this configuration was 26cm.
Note that the positioning of the model within the discharge gap as shown in fig-248
ure 7 was selected to hinder the propagation of the second leader. Second leader prop-249
agation was undesirable because it would lead to full breakdown in the gap, which would250
saturate the camera and PMT and make analysis difficult, as well as potentially dam-251
age the Van de Graaff generator. In the configuration chosen, the second leader is un-252
likely to form for two reasons. First, the theoretical model of section 4 shows that, even253
after connection of the positive leader with the high voltage plate, the negative incep-254
tion threshold is not reached (see section 4.2). Second, the peak amplitudes delivered255
by the Marx generator in the tests were below the breakdown value of the insulating post256
supporting the Van de Graaff high voltage electrode, so breakdown in that gap is also257
avoided.258
2.4 Determination of the Breakdown Threshold259
The breakdown threshold can be defined in a few different ways. In testing elec-260
trical insulation, typical methods consist of applying a series of voltage shots and using261
statistical analysis techniques to determine the voltage at which the insulation has a 50%262
chance of breaking down. Some of these methods are discussed in Kuffel et al. (2000)263
and this is the method typically used by Labelec, the facility where the experiments were264
performed. In regards to leader formation, it is possible to identify the precise voltage265
at which the first leader is incepted using the analysis discussed in section 2.3 and shown266
in figure 5. In every case where a leader was observed, the measured voltage of the up-267
per plate electrode at the moment of leader inception, point A in figure 5, was recorded.268
The average of these measurements was used as the threshold for leader formation. An269
up and down method similar to the one described in Kuffel et al. (2000) with at least270
10 shots was applied to the Marx generator. This was necessary because the leader ini-271
tiation voltage depends on the voltage rise rate as will be shown later in this work, so272
it was important to vary the peak value of the waveform.273
–10–
manuscript submitted to JGR: Atmospheres
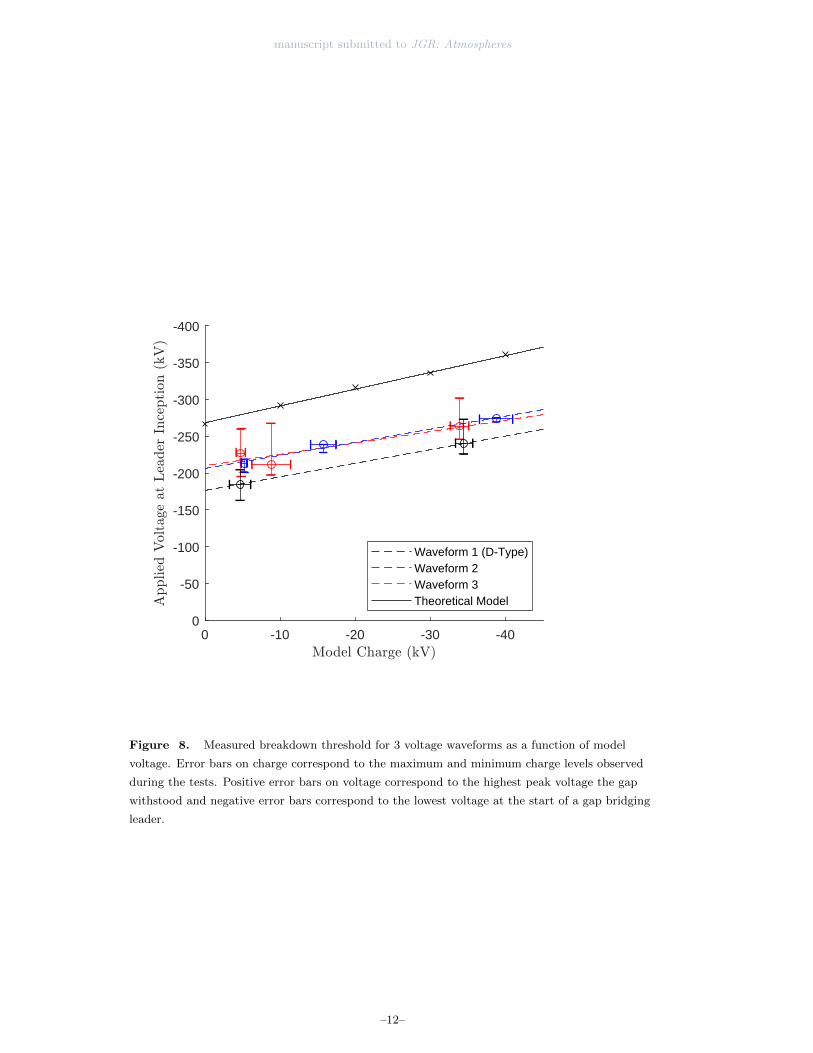
Table 1. Slope of the breakdown versus model charge curve for the different waveforms (rise
times in parentheses).
Waveform Slope (kV/kV )
1 (90µs) 1.852 (330µs) 1.783 (800µs) 1.54
Theoretical Model 2.28
3 Experimental Results274
3.1 Net Charge Effect on Breakdown Voltage275
Tests were performed using each of the waveforms shown in figure 4, with a min-276
imum of 10 shots per configuration. In the cases where a leader bridged the gap between277
the model and the plate (figure 7), the leader inception voltage was determined since these278
cases correspond to a viable positive leader. The results were averaged across all tests279
in a given configuration.280
The value reported for the model voltage was measured around 100µs before the281
Marx generator was triggered, using the field mill pointed at the Van de Graaff gener-282
ator. The model charge did not vary significantly in the interim between the Marx gen-283
erator being triggered and the positive leader generation (point A in figure 5), with ab-284
solute differences typically less than 500V. E.g. for the example in figure 5, the differ-285
ence between the model voltage before the Marx generator is triggered and that mea-286
sured at point A is less than 1%.287
Figure 8 shows that, as the model acquires more negative charge, the threshold for288
first (positive) leader formation increases in magnitude. This outcome confirms the in-289
fluence of vehicle net charge on the likelihood of lightning strike occurrence, as predicted290
by Guerra-Garcia et al. (2018). A direct comparison with the theoretical model is dis-291
cussed in section 4.2.292
A linear fit to the data is shown, and the slopes are recorded in table 1. The fit has293
a positive slope greater than unity for all three waveforms tested. In all cases, the slope294
of the curves shows reasonable agreement with the theoretical breakdown curve, with295
the discrepancy in slope and breakdown voltage attributable to different model geom-296
etry and other uncertainties in the model discussed in the original paper (Guerra-Garcia297
et al., 2018).298
It is interesting to note that in those tests with a model aircraft that had been grounded,299
a potential of approximately -5kV developed on the model during the time between ground-300
ing and the start of the voltage pulse. For safety reasons, the grounding (which was done301
manually) had to be performed well in advance of the high voltage shot. One possible302
explanation for this baseline charge is charge conduction by the insulating support ca-303
bles which were found to have non-zero conductance when high voltage was applied across304
them. Charge could accumulate in these cables during the last voltage shot and be con-305
ducted to the model. Residual space charge from the previous voltage shot could also306
be a factor in creating the baseline charge. It is of interest to note that, as far as the au-307
thors know, the standard recommended practices do not discuss the need of grounding308
the model in between tests and the present results show the criticality of this good prac-309
tice.310
–11–
manuscript submitted to JGR: Atmospheres
-40-30-20-100
-400
-350
-300
-250
-200
-150
-100
-50
0
Waveform 1 (D-Type)Waveform 2Waveform 3Theoretical Model
Figure 8. Measured breakdown threshold for 3 voltage waveforms as a function of model
voltage. Error bars on charge correspond to the maximum and minimum charge levels observed
during the tests. Positive error bars on voltage correspond to the highest peak voltage the gap
withstood and negative error bars correspond to the lowest voltage at the start of a gap bridging
leader.
–12–
manuscript submitted to JGR: Atmospheres
When extrapolating the test results to the airborne scenario, some discrepancies311
may exist related to the effect of negative coronae that will be developing on the neg-312
atively charged model prior to the high voltage impulse, due to the model’s high volt-313
age relative to the surroundings. An estimate of the onset voltage of these coronae is dis-314
cussed later (section 3.3). In the tests, the presence of these negative ions in the vicin-315
ity of the model could be modifying the conditions for leader initiation in a way not en-316
tirely consistent with the airborne situation. Note that this ion cloud is not expected to317
interfere with the EFM measurement, since the measurement is taken about 3m away318
from the model (see figure 3). Another difference between the lab and airborne situa-319
tions is the effect of nearby grounded objects causing the experimental setup to deviate320
from the idealized situation wherein the aircraft is exposed to a uniform applied field,321
and is far away from other objects.322
3.2 Effect of Voltage Rise Rate323
In reality, aircraft-triggered lightning will occur both for aircraft exposed to a rapid324
rise in the ambient field (e.g., due to nearby lightning (Saba et al., 2016)) and for air-325
craft flying into sufficiently high ambient fields (in-flight experiments report ambient fields326
about 50 kV/m at the moment of triggered-lightning (Rakov & Uman, 2003)). Consid-327
ering that a typical airliner flies about 250 m in 1 s, and this may be of the order of the328
motion required to enter the area of influence of a cloud charge center, the conditions329
might be slow in the second scenario compared to the waveforms tested. However, fast330
waveforms need to be used in laboratory tests to compensate for static electrodes, and331
simulate to some extent that a fast-moving aircraft can escape regions of space charge,332
created by local corona phenomena, modifying the conditions for leader formation. E.g.,333
it has been observed that initiation of upward leaders from rotating blades of windmills334
occurs more readily than from static towers due to the redistribution of the ion charge335
cloud that locally shields the electric fields in static towers (Montanya et al., 2014).336
When comparing the three waveforms tested, with rise times ranging between 90µs-337
800µs, the threshold for leader formation is reduced when the rate of voltage rise is in-338
creased. This effect is most noticeable when comparing waveform 1 (90µs, D-type) to339
waveforms 2 (330µs) and 3 (800µs), and is seen for all charging levels. The breakdown340
threshold, at comparable charging levels, for waveform 3 was about 30 kV in magnitude341
less than for the faster waveforms. As discussed in section 2.1, it is known (Les Renardieres342
Group, 1973) that the rate of field rise has an impact on breakdown characteristics and343
it appears that extending the rise time beyond that of the standard D-type waveform344
increases the breakdown threshold.345
The data for waveform 3 shows some unexpected results; notably the large error346
bars and inconsistent trend at low voltages. Part of the issue here is the slow ramp in347
waveform 3, which was difficult to achieve experimentally. These tests yielded a signal348
that indicated that the spark gap between the Marx generator and the high voltage plate349
electrode would turn on and off during the voltage ramp, while in the other tests per-350
formed the circuit to the plate remained closed after the initial connection was made.351
One instance of this spark gap switching can be seen in the rise portion of waveform 3352
when compared to the idealized waveform in figure 4. The result was a voltage appli-353
cation to the plate electrode that occurred in steps, rather than a smooth ramp, obstruct-354
ing the interpretation of the results.355
More interestingly for the range of rise times tested, it is shown in figure 8 and ta-356
ble 1 that the variation of the breakdown potential with model charge (the slope of the357
line) is only weakly related to the rate of rise of the input voltage, and the weak depen-358
dence observed is within the margin of error of the experimental data. This means that359
a negatively charged model hinders positive leader inception by about the same amount360
regardless of the rate of rise of the external field.361
–13–
manuscript submitted to JGR: Atmospheres
Table 2. Time constants for model discharging.
Initial Charge (kV) τfast (s) τslow (s)
-30 0.92 31-15 0.29 74
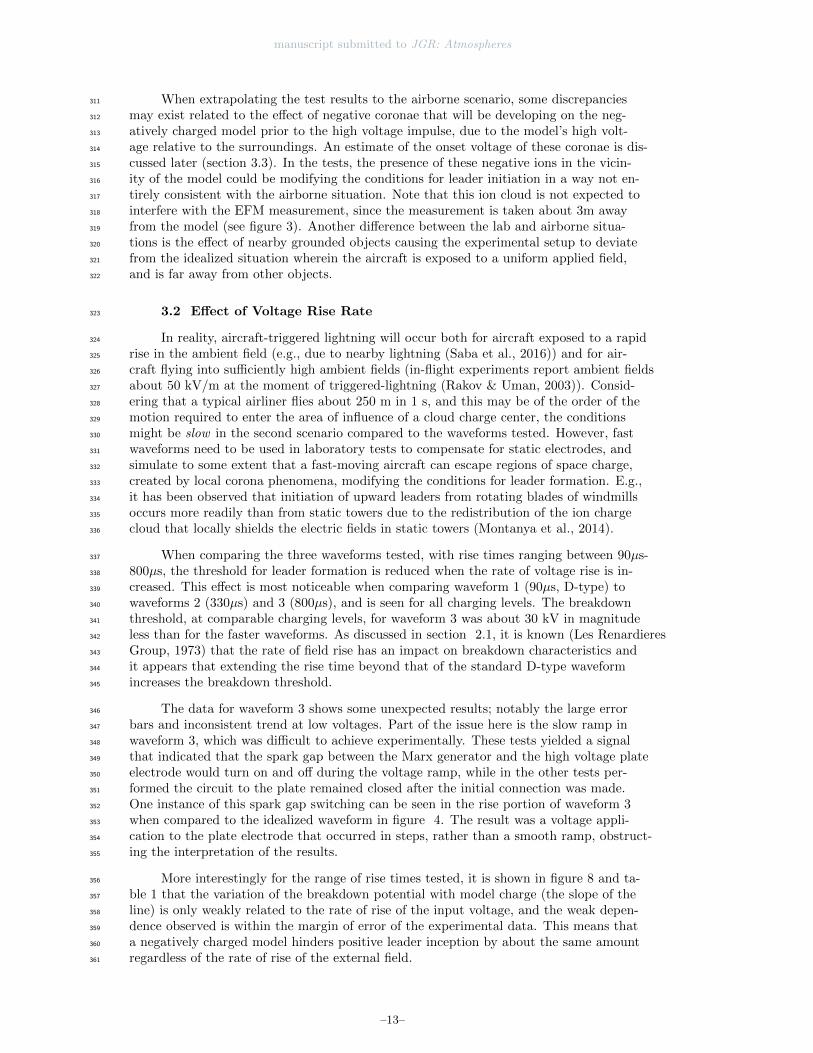
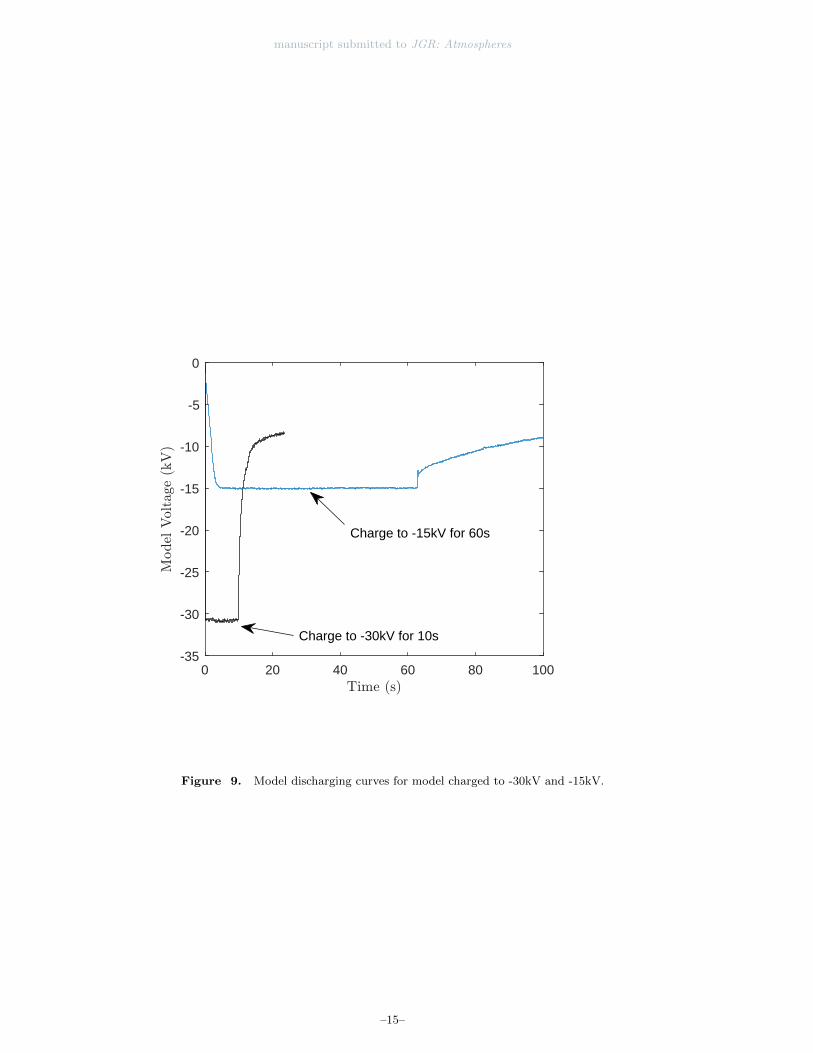
3.3 Model Aircraft Discharging362
For the chosen aircraft model, it was difficult to maintain a voltage on the model363
beyond a few tens of kilovolts, without a continuous current supply. At voltages on the364
order of -10 to -15kV, the sharp corners on the model (or possibly wrinkles in the alu-365
minum foil) would begin to corona emit, dissipating the charge. This effect was observed366
visually through long-exposure photographs taken with a UV-sensitive lens, as well as367
through a non-contact measurement of the model voltage, once the charging source was368
disconnected. An example of this measurement is shown for two tests in figure 9. In both369
cases, immediately after the charging source was disconnected, the model aircraft began370
to rapidly discharge. The slope of this discharging curve became less steep when the model371
had dropped to around -10kV or -12kV depending on the test. This is interpreted as a372
termination of the corona emission mechanism from the aircraft extremities, and the dom-373
inant discharge mechanism switching to conduction through the support cables. The time374
constants corresponding to the fast and slow discharging mechanisms, τfast and τslow,375
can be estimated by fitting the data in figure 9 by a double exponential decay:376
V = Vfast exp(−t/τfast) + Vslow exp(−t/τslow).
An estimate of these time constants is given in table 2. There are two important con-377
clusions to be drawn from this figure. First, to maintain a model voltage beyond -10kV378
requires an active charging strategy that remains connected at the moment of the high379
voltage impulse. Second, while conduction through the insulating support cables is sig-380
nificantly less rapid than the corona discharge mechanism, it is non-zero during high volt-381
age testing.382
4 Discussion Guided by Comparison to Electrostatic Model383
4.1 Computational Model Description384
A physics-based numerical model is used to explain the experimental observations.385
The model is described in detail in Guerra-Garcia et al. (2017, 2018) and is based on the386
numerical zoning methods developed by Lalande et al. (1999b) that combine an electro-387
static simulation of the aircraft to semi-empirical criteria for leader inception. The semi-388
empirical leader inception criteria used are based on the critical charge concept of Gallimberti389
(1979): a leader is incepted if the charge accumulated within the impulse corona that390
precedes the leader exceeds a certain threshold (qcr). The corona charge is estimated from391
the electrostatic model through a volumetric integral (Arevalo et al., 2012) assuming that392
the electric field within the corona is constant and equal to the stability field value, Ecr393
(Gallimberti, 1979). The main difference between this model and those previously re-394
ported in the literature is that it makes no assumption on the polarity of the first leader395
to be incepted and uses different thresholds for the positive and negative polarity. The396
thresholds used for the positive leader inception are: q+cr = 1µC, E+cr = 450kV/m; and397
for the negative leader: q−cr = −4µC, E−cr = 750kV/m (consistent with laboratory mea-398
surements by Castellani et al. (1998) and Niemeyer (1991) and theoretical work by Gallimberti399
et al. (2002), among others). For self-consistency, the model is briefly described in what400
follows.401
–14–
manuscript submitted to JGR: Atmospheres
0 20 40 60 80 100-35
-30
-25
-20
-15
-10
-5
0
Charge to -15kV for 60s
Charge to -30kV for 10s
Figure 9. Model discharging curves for model charged to -30kV and -15kV.
–15–
manuscript submitted to JGR: Atmospheres
4.1.1 Determination of Breakdown Voltage and First Attachment Point402
The pre-strike electrostatics of the model aircraft at a pitch angle of 50 degrees placed403
between two large parallel plates at a distance of 145cm, as pictured in figure 2, is solved404
by solving Laplace’s equation. The bottom plate is grounded and a negative high volt-405
age potential is applied to the upper plate. The geometry of the model used is that in406
Guerra-Garcia et al. (2018), scaled to have the same wingspan as in the experiment in407
order to have a comparable electrical capacitance of value C = 41pF in the numerical408
model.409
The pre-strike electrostatics are solved for a given net charge of the vehicle (in the410
computational model, the net charge and voltage are related through the capacitance),411
and the voltage of the upper plate is gradually increased in amplitude. At each upper-412
plate voltage level, the criteria for both positive and negative leader inception are tested413
on all possible attachment points (namely nose, wing tips and rear end). Once the cri-414
terion for leader inception has been reached at any given point, the first attachment point415
and the applied voltage for leader inception has been obtained.416
4.1.2 Propagation of First Leader and Second Attachment Point417
Once the first leader is incepted, it propagates along the local electric field line witha constant charge per unit length, λ+ = 65µC/m for the positive leader and λ− = 108µC/mfor the negative leader, as measured by Les Renardieres Group (1973). As the leader prop-agates, the net charge of the model, Q, is biased in the opposite polarity:
Q(t) = Q(0) ∓ λl(t),
where the minus sign corresponds to the case of a positive leader preceding, time zero418
corresponds to first leader inception and l(t) is the length of the leader at each moment.419
At each time step, the criterion for the opposite polarity leader inception is tested on420
all possible attachment points. As the model is biased in the direction that favors the421
opposite polarity leader, the first leader is propagated in time until the second leader is422
triggered.423
4.2 Computational Model Results and Comparison to Experimental Data424
The computational model is used to explain the experimentally measured influence425
of model net charge on self-triggered lightning (section 3.1).426
Table 3 shows the influence of model potential φM (note that it relates to the net427
charge Q through the self-capacitance) on the voltage applied to the upper plate, Vapp,428
to trigger a bidirectional leader. The 1st leader and its polarity, as well as the 2nd leader429
and the length of the first leader at 2nd leader inception (lcrit1 ) are also reported. The430
first 5 rows correspond to the range experimentally tested.431
For an uncharged model, φM = 0, the first leader to be incepted is the positive432
one, since the threshold values in the positive polarity are lower than in the negative po-433
larity. The experimentally measured voltage for positive leader inception is approximately434
30-35% lower than the model predicts. The 1st attachment point predicted by the model,435
as in the experiment, is at the nose of the vehicle. As the positive leader propagates, it436
biases the vehicle to negative values facilitating the inception of the negative leader. The437
model predicts the initiation of the negative leader occurs when the first leader is lcrit1 ≈438
22 cm long. This translates to the model being biased to φM (lcrit1 ) = C−1Q(lcrit1 ) =439
−347kV. The implications for the experiment are that, since this magnitude is higher440
than the peak amplitudes delivered by the Marx generator in the tests and the gap be-441
tween vehicle and upper plate is comparable to the critical distance, the second leader442
will not be triggered from the model, even after the first leader connects to the upper443
plate.444
–16–
manuscript submitted to JGR: Atmospheres
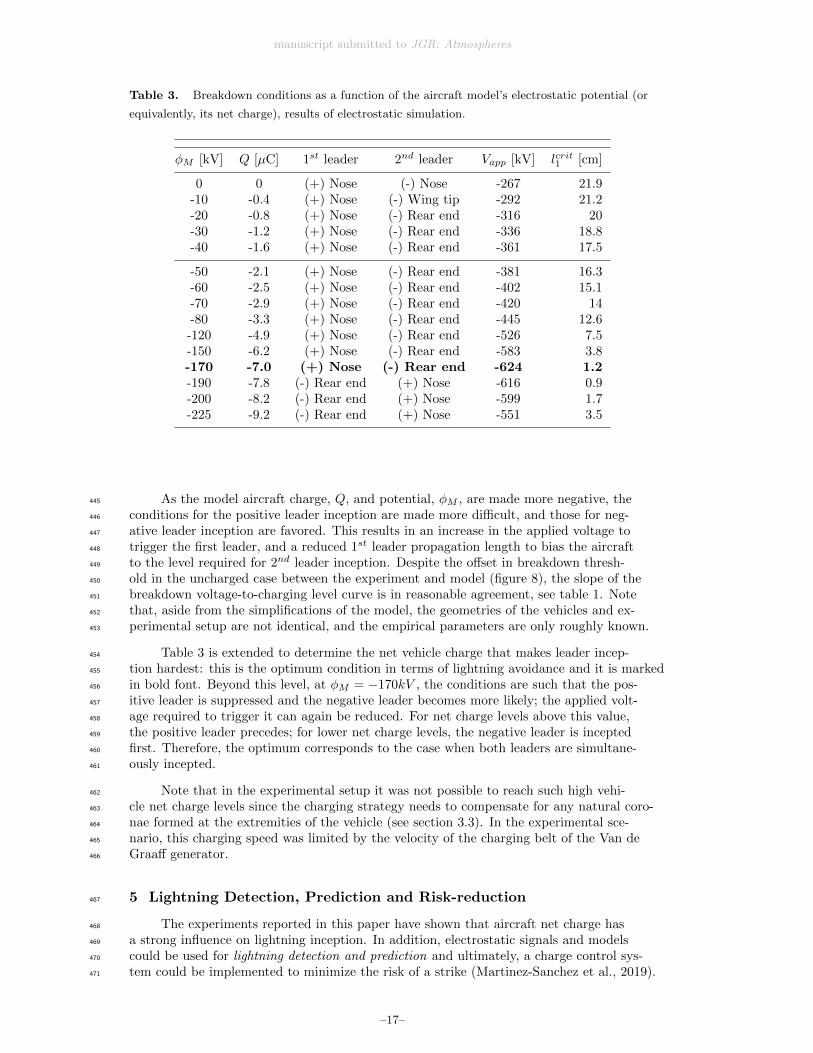
Table 3. Breakdown conditions as a function of the aircraft model’s electrostatic potential (or
equivalently, its net charge), results of electrostatic simulation.
φM [kV] Q [µC] 1st leader 2nd leader Vapp [kV] lcrit1 [cm]
0 0 (+) Nose (-) Nose -267 21.9-10 -0.4 (+) Nose (-) Wing tip -292 21.2-20 -0.8 (+) Nose (-) Rear end -316 20-30 -1.2 (+) Nose (-) Rear end -336 18.8-40 -1.6 (+) Nose (-) Rear end -361 17.5
-50 -2.1 (+) Nose (-) Rear end -381 16.3-60 -2.5 (+) Nose (-) Rear end -402 15.1-70 -2.9 (+) Nose (-) Rear end -420 14-80 -3.3 (+) Nose (-) Rear end -445 12.6-120 -4.9 (+) Nose (-) Rear end -526 7.5-150 -6.2 (+) Nose (-) Rear end -583 3.8-170 -7.0 (+) Nose (-) Rear end -624 1.2-190 -7.8 (-) Rear end (+) Nose -616 0.9-200 -8.2 (-) Rear end (+) Nose -599 1.7-225 -9.2 (-) Rear end (+) Nose -551 3.5
As the model aircraft charge, Q, and potential, φM , are made more negative, the445
conditions for the positive leader inception are made more difficult, and those for neg-446
ative leader inception are favored. This results in an increase in the applied voltage to447
trigger the first leader, and a reduced 1st leader propagation length to bias the aircraft448
to the level required for 2nd leader inception. Despite the offset in breakdown thresh-449
old in the uncharged case between the experiment and model (figure 8), the slope of the450
breakdown voltage-to-charging level curve is in reasonable agreement, see table 1. Note451
that, aside from the simplifications of the model, the geometries of the vehicles and ex-452
perimental setup are not identical, and the empirical parameters are only roughly known.453
Table 3 is extended to determine the net vehicle charge that makes leader incep-454
tion hardest: this is the optimum condition in terms of lightning avoidance and it is marked455
in bold font. Beyond this level, at φM = −170kV , the conditions are such that the pos-456
itive leader is suppressed and the negative leader becomes more likely; the applied volt-457
age required to trigger it can again be reduced. For net charge levels above this value,458
the positive leader precedes; for lower net charge levels, the negative leader is incepted459
first. Therefore, the optimum corresponds to the case when both leaders are simultane-460
ously incepted.461
Note that in the experimental setup it was not possible to reach such high vehi-462
cle net charge levels since the charging strategy needs to compensate for any natural coro-463
nae formed at the extremities of the vehicle (see section 3.3). In the experimental sce-464
nario, this charging speed was limited by the velocity of the charging belt of the Van de465
Graaff generator.466
5 Lightning Detection, Prediction and Risk-reduction467
The experiments reported in this paper have shown that aircraft net charge has468
a strong influence on lightning inception. In addition, electrostatic signals and models469
could be used for lightning detection and prediction and ultimately, a charge control sys-470
tem could be implemented to minimize the risk of a strike (Martinez-Sanchez et al., 2019).471
–17–
manuscript submitted to JGR: Atmospheres
One key element to the successful implementation of such a charge control strat-472
egy is the ability to charge the aircraft during flight to the desired levels. Lalande et al.473
(1999a) indicates that charges on the order of a millicoulomb can naturally develop on474
aircraft flying in an environment conducive to lightning strikes. The capacitance of the475
aircraft in question was on the order of a nanofarad, which implies a voltage on the or-476
der of a megavolt (typically negative relative to the surroundings). More interestingly,477
artificial charging of a B-17 research aircraft was demonstrated by Stimmel et al. (1946)478
and Waddel et al. (1946) using emission of positively charged droplets from the aircraft479
surface to a potential of about -0.5MV, which corresponds to a net charge of -0.4mC.480
Other experiments using smaller aircraft and ion emission have demonstrated artificial481
charging to 20-40 µC levels (negative) (Jones, 1990). Note that the charging levels that482
led to a measurable impact on the breakdown conditions for the 1m wingspan model ve-483
hicle in the laboratory setup were of the order of 1µC (negative), or -30kV. The mod-484
eling work in section 4 suggests a scaling of this charge quadratic with size, or equiva-485
lently a linear scaling of the potential with size: e.g., a ∼30m wingspan aircraft would486
require charging levels of the order of 1mC, or ∼1MV (Guerra-Garcia et al., 2018).487
Another necessary element of this strategy is the ability to have a reasonable pre-488
diction of leader inception before it occurs. Currently, aircraft operations in lightning489
conditions are informed by the onboard weather radar, communications between pilots,490
and contact with Air Traffic Control (ATC). Moreover, flight operations manuals rarely491
mention lightning, but rather thunderstorms alone.492
Aircraft weather radar typically display storm cell information although modern,493
proprietary, technologies integrate distinct ‘lightning icons’. These technologies are de-494
signed to detect electrical discharge activity that the radar cannot see and map the light-495
ning activity onto the weather radar display of the pilot (Honeywell, 2016).496
Contact with ATC provides additional weather data (mainly related to thunder-497
storm development), but may also include direct lightning observations by Lightning De-498
tection Networks (LDNs). For example, the National LDN detects cloud-to-ground flashes499
with an efficiency of 90-95%. Information of lightning detectors based on RF emissions500
are often included in METAR (MEteorological Terminal Aviation Routine) weather re-501
ports as an indicator of the nearby presence of a thunderstorm (Transportation Research502
Board and National Academies of Sciences, Engineering, and Medicine, 2008). Note that503
the information based on weather reports and LDN summarize the current or recent sce-504
nario, rather than what comes ahead. Prediction technologies include monitoring the growth505
and motion of convective systems that can develop into thunderstorms using nowcast-506
ing techniques by measuring, using radar and satellites, storm properties (Makela et al.,507
2013). These are used by the FAA for both en route and terminal air traffic management.508
Note that, around 40% of lightning strikes reported by airline pilots are experienced509
with no thunderstorms in the immediate area (Sweers et al., 2012), which suggests that510
the presence of thunderstorms alone is not a good indicator of the incidence of aircraft-511
triggered lightning.512
Other existing technologies, not currently used to predict lightning to aircraft, in-513
clude Total Lightning Systems, that are able to detect both cloud-to-ground (CG) light-514
ning and intra-cloud (IC) lightning. Optical detectors onboard geostationary meteoro-515
logical satellites (e.g. the Geostationary Lightning Mapper onboard the Geostationary516
weather satellites GEOS-16, and the Meteosat Third Generation Lightning Imager MTG-517
LI) are able to provide this information. In addition, electric field mills can be used to518
alert of a possible threat (predicting rather than detecting a strike after it occurs). For519
that reason, electric field mills are a key component of the launch evaluation systems em-520
ployed at NASA’s Kennedy Space Flight Center. Only research aircraft have carried elec-521
tric field mills onboard, and these sensors are not routinarily used in aviation (B. D. Fisher522
& Plumer, 1984).523
–18–
manuscript submitted to JGR: Atmospheres
6 Conclusions524
This paper presented an experimental study of the effect of aircraft net charge on525
its susceptibility of being struck by lightning. The threshold background electric field526
for leader initiation was shown to increase (in magnitude) as the aircraft accumulated527
a greater amount of negative electric charge. Note that the trend applies to the specific528
orientation of the electric field tested (vertical field, vehicle pitched at 50◦). This effect529
was observed for different rates of rise of the ambient electric field (from 90µs to 800µs),530
including one which is consistent with standard lightning leader attachment tests. Use531
of slower waveforms, e.g. representative of an aircraft entering an area of influence of a532
cloud charge center, was hindered by experimental constraints. For the waveforms tested,533
the breakdown threshold increased approximately linearly with the amount of charge ap-534
plied to the aircraft model, and showed reasonable agreement with simulations. These535
results verify both the validity of the methods employed in those simulations, and the536
potential of using charge control as a means of reducing the risk of aircraft-triggered light-537
ning. When implemented as part of a larger system of lightning detection and predic-538
tion, active charge control of aircraft is a promising strategy to help prevent costly strikes539
from occurring.540
Acknowledgments541
This collaboration was supported by the MIT-Spain La Caixa Foundation Seed Fund (MISTI542
Global Seed Funds grant program). The experiments were performed at Labelec Light-543
ning Labs, Terrassa (Barcelona), Spain, and the authors would like to thank G. Tobella544
for his contributions to the experimental campaign. The MIT team acknowledges par-545
tial support from The Boeing Company through the Strategic Universities for Boeing546
Research and Technology Program. This work was also supported in part by research547
grants from the Spanish Ministry of Economy and the European Regional Development548
Fund (FEDER): ESP2015-69909-C5-5-R and ESP2017-86263-C4-2-R. Also by ENE2017-549
91636-EXP. The authors would like to thank P. Kochkin (University of Bergen) for con-550
tributions to the preliminary experiments and O. van der Velde (U. Politecnica de Catalunya)551
for his help with the photography of the discharges. The data presented in this paper552
can be found in DSpace@MIT, in the ‘Data Related to Publications’ collection: https://553
dspace.mit.edu/handle/1721.1/122360.554
References555
Andreev, A. G., Bazelyan, E. M., Bulatov, M. U., Kuzhekin, I. P., Makalsky, L. M.,556
Sukharevskij, D. I., & Syssoev, V. S. (2008). Experimental study of the pos-557
itive leader velocity as a function of the current in the initial and final-jump558
phases of a spark discharge. Plasma Physics Reports, 34 (7), 609–615. doi:559
10.1134/S1063780X0807009X560
Arevalo, L., Cooray, V., Wu, D., & Jacobson, B. (2012). A new static calculation of561
the streamer region for long spark gaps. Journal of Electrostatics, 70 , 15-19.562
Bixler, J., & Sponholz, D. (2016). FT spear plans. Retrieved 2019-02-12, from563
https://store.flitetest.com/flite-test-spear-electric-airplane-kit564
-1041mm-flt-1043/p673707565
Castellani, A., Bondiou-Clergerie, A., Lalande, P., Bonamy, A., & Gallimberti, I.566
(1998). Laboratory study of the bi-leader process from an electrically floating567
conductor. Part 2: bi-leader properties. IEE Proc. Sci. Meas. Technol., 145 (5),568
193-199.569
EUROCAE. (2005). ED-105 Aircraft Lightning test Methods (Tech. Rep.). EURO-570
CAE.571
Fisher, B. D., & Plumer, J. A. (1984). Lightning attachment patterns and flight572
conditions experienced by the NASA F-106B airplane from 1980 to 1983.573
AIAA 22nd Aerospace Sciences Meeting (Reno, Nevada, Jan. 9-12), No. AIAA574
–19–

manuscript submitted to JGR: Atmospheres
84-0466.575
Fisher, F. A., & Plumer, J. A. (1977). Lightning protection of aircraft. NASA Ref-576
erence Publication 1008. Retrieved from https://ntrs.nasa.gov/archive/577
nasa/casi.ntrs.nasa.gov/19780003081.pdf578
Gallimberti, I. (1979). The mechanism of the long spark formation. Journal de579
Physique Colloques, 40 (C7), 193-250.580
Gallimberti, I., Bacchiega, G., Bondiou-Clergerie, A., & Lalande, P. (2002). Funda-581
mental processes in long air gap discharges. C. R. Physique, 3 , 1335-1359.582
Guerra-Garcia, C., Nguyen, N. C., Peraire, J., & Martinez-Sanchez, M. (2017). In-583
fluence of net charge on the probability of lightning initiation from aircraft.584
Proceedings of the 2017 International Conference on Lightning and Static585
Electricity (ICOLSE), Nagoya, Japan.586
Guerra-Garcia, C., Nguyen, N. C., Peraire, J., & Martinez-Sanchez, M. (2018).587
Charge control strategy for aircraft-triggered lightning strike risk reduction.588
AIAA Journal , 56 (5), 1988-2002.589
Honeywell. (2016). Technical white paper IntuVue(R) RDR-4000 3D Weather Radar590
Systems. Retrieved 2019-04-02, from https://aerospace.honeywell.com591
Jones, J. J. (1990). Electric charge acquired by airplanes penetrating thunder-592
storms. JGR. Journal of geophysical research. Part D, Atmospheres, 95 (10),593
16.589–16.600.594
Kasemir, H. W. (1950). Qualitative Uebersicht ueber Potential-Feldund Ladungsver-595
haltnisse bei einer Blitzentladung in der Gewitterwolke. In Das Gewitter, ed.596
Hans Israel, Akad. Verlags. Ges. Geest and Portig K.-G, Leipsig, Germany.597
Kuffel, E., Zaengl, W., & Kuffel, J. (2000). 8.4.7 laboratory test procedures. Elsevier.598
Retrieved from https://app.knovel.com/hotlink/khtml/id:kt00BJPES8/599
high-voltage-engineering/laboratory-test-procedures600
Lalande, P., Bondiou-Clergerie, A., & Laroche, P. (1999a). Analysis of available in-601
flight measurements of lightning strikes to aircraft. In Proceedings of the 1999602
international conference on lightning and static electricity (icolse), toulouse,603
france.604
Lalande, P., Bondiou-Clergerie, A., & Laroche, P. (1999b). Computations of the605
initial discharge initiation zones on aircraft or helicopter. Proceedings of the606
1999 International Conference on Lightning and Static Electricity (ICOLSE),607
Toulouse, France.608
Lalande, P., & Delannoy, A. (2012). Numerical methods for zoning computation.609
Journal Aerospace Lab Issue 5 , AL05-08.610
Les Renardieres Group. (1973). Research on long gap discharges at Les Renardieres.611
Electra, 35 .612
Makela, A., Saltikoff, E., Julkunen, J., Juga, I., Gregow, E., & Niemela, S. (2013,613
2019/04/02). Cold-season thunderstorms in Finland and their effect on avia-614
tion safety. Bulletin of the American Meteorological Society , 94 (6), 847–858.615
doi: 10.1175/BAMS-D-12-00039.1616
Martinez-Sanchez, M., Guerra-Garcia, C., Nguyen, N. C., Peraire, J., & Mouratidis,617
T. (2019). Charge control system to reduce risk of an aircraft-initiated lightning618
strike. Massachusetts Institute of Technology, Cambridge, MA, U. S. Patent619
No. 10450086, issued Oct. 22, 2019.620
Mazur, V. (1988). Lightning initiation on aircraft in thunderstorms. AIAA 26th621
Aerospace Sciences Meeting (Reno, Nevada, Jan. 11-14), No. AIAA 88-0391.622
Mazur, V. (1989). A physical model of lightning initiation on aircraft in thunder-623
storms. Journal of Geophysical Research, 94 (D3), 3326-3340.624
Montanya, J., van der Velde, O., & Williams, E. R. (2014). Lightning discharges625
produced by wind turbines. Journal of Geophysical Research: Atmospheres,626
119 , 1455-1462.627
Moreau, J. P., Alliot, J. C., & Mazur, V. (1992). Aircraft lightning initiation and628
interception from in situ electric measurements and fast video observations.629
–20–
manuscript submitted to JGR: Atmospheres
Journal of Geophysical Research, 95 (15), 903-12.630
Niemeyer, L. (1991). Gaseous dielectrics IV. Section on Leader breakdown in com-631
pressed SF6: recent concepts and understanding. In (p. 49-60). Plenum Press,632
New York.633
Plumer, J. A. (2012). Laboratory Test Results and Natural Lightning Strike Effects:634
How Well do They Compare. In International conference on lightning protec-635
tion. Vienna, Austria.636
Plumer, J. A. (2017). Lightning and aircraft: an incomplete history of research and637
standardization. Proceedings of the 2017 International Conference on Lightning638
and Static Electricity (ICOLSE), Nagoya, Japan.639
Rakov, V. A., & Uman, M. A. (2003). Lightning Physics and Effects. Cambridge640
University Press.641
Reazer, J. S., Serrano, A. V., Walko, L. C., & Burket, H. D. (1987). Analysis of642
correlated electromagnetic fields and current pulses during airborne lightning643
attachments. Electromagnetics, 7 , 509-39.644
Saba, M., Schumann, C., Warner, T. A., Ferro, M. A. S., Paiva, A. R., Jr, J. H., &645
Orville, R. E. (2016). Upward lightning flashes characteristics from high-speed646
videos. Journal of Geophysical Research: Atmospheres, 121 , 849-8505.647
SAE Aerospace. (2005). SAE ARP5416 (Tech. Rep.). SAE International. doi:648
https://doi.org/10.4271/ARP5416649
SAE Aerospace. (2012). SAE ARP5414A (Tech. Rep.). SAE International. doi:650
https://doi.org/10.4271/ARP5414A651
SAE Aerospace. (2013). SAE ARP5412B (Tech. Rep.). SAE International. doi:652
https://doi.org/10.4271/ARP5412B653
Stimmel, R. G., Rogers, E. H., Waterfall, F. E., & Gunn, R. (1946). Army-navy654
precipitation-static project: Part III-electrification of aircraft flying in precipi-655
tation areas. Proceedings of the IRE , 34 (4), 167-177.656
Sweers, G., Birch, B., & Gokcen, J. (2012). Lightning strikes: protection, inspec-657
tion, and repair. AERO Magazine, QTR 4, 2012 , 19–28. Retrieved from658
https://www.boeing.com/commercial/aeromagazine/articles/2015 q1/659
archive.html660
Transportation Research Board and National Academies of Sciences, Engineering,661
and Medicine. (2008). Lightning-warning systems for use by airports. Wash-662
ington, DC: The National Academies Press. Retrieved from https://www.nap663
.edu/catalog/14192/lightning-warning-systems-for-use-by-airports664
doi: 10.17226/14192665
Uman, M. A. (2008). The art and science of lightning protection. Cambridge Univer-666
sity Press.667
Vonnegut, B., & Little, A. D. (1965). Electrical behavior of an airplane in a thun-668
derstorm. Technical Report for Federal Aviation Agency , FAA-ADS-36.669
Waddel, R. C., Drutowski, R. C., & Blatt, W. N. (1946). Army-navy precipitation-670
static project: Part II-aircraft instrumentation for precipitation-static research.671
Proceedings of the IRE , 34 (4), 161-166.672
–21–


![The structure of Xray emissions from triggered lightning ...my.fit.edu/~nliu/papers/schaal-2014-xrayStructure.pdfJournal of Geophysical Research: Atmospheres 10.1002/2013JD020266 channelnearlysimultaneously.Furthermore,Hill[2012]showedthatX-raysarelocatedontheorderof10m](https://img.pdfslide.net/doc/110x75/5d05ffec88c99375438ce9f0/the-structure-of-xray-emissions-from-triggered-lightning-myfitedunliupapersschaal-2014-.jpg)