Embed Size (px)
Citation preview
W O R L D M E T E O R O L O G I C A L O R G A N I Z A T I O N
WMO-No. 958
Secretariat of the World Meteorological Organization — Geneva —Switzerland2003
Aircraft MeteorologicalData Relay(AMDAR)
Reference Manual

© 2003, World Meteorological Organization
ISBN 92–63–10958–3
NOTE
The designations employed and the presentation of material in this publication do not imply theexpression of any opinion whatsoever on the part of the Secretariat of the World MeteorologicalOrganization concerning the legal status of any country, territory, city or area, or of its authorities, orconcerning the delimitation of its frontiers or boundaries.
TABLE OF CONTENTS
1. General . . . . . . . . . . . . . . . . . . . . . . . . . . . . . . . . . . . . . . . . . . . . . . . . . . . . . 11.1 What is AMDAR? . . . . . . . . . . . . . . . . . . . . . . . . . . . . . . . . . . . . . . . . 11.2 Historical background . . . . . . . . . . . . . . . . . . . . . . . . . . . . . . . . . . . . 11.3 Purpose of this manual . . . . . . . . . . . . . . . . . . . . . . . . . . . . . . . . . . . 1
2. Sensors and Measurements . . . . . . . . . . . . . . . . . . . . . . . . . . . . . . . . . . . . . . . . . 22.1 Sensors for basic measurements . . . . . . . . . . . . . . . . . . . . . . . . . . . . . 22.2 Derived variables . . . . . . . . . . . . . . . . . . . . . . . . . . . . . . . . . . . . . . . . 22.3 Other data . . . . . . . . . . . . . . . . . . . . . . . . . . . . . . . . . . . . . . . . . . . . . 22.4 Data integration . . . . . . . . . . . . . . . . . . . . . . . . . . . . . . . . . . . . . . . . 22.5 Measurement accuracy . . . . . . . . . . . . . . . . . . . . . . . . . . . . . . . . . . . 2
3. Message Compilation . . . . . . . . . . . . . . . . . . . . . . . . . . . . . . . . . . . . . . . . . . . . . . 43.1 Meteorological requirements . . . . . . . . . . . . . . . . . . . . . . . . . . . . . . . 43.2 Aeronautical requirements . . . . . . . . . . . . . . . . . . . . . . . . . . . . . . . . . 5
4. Data Formats for Air-ground (Downlink) Communication. . . . . . . . . . . . . . . . . . . . . . . . 54.1 ACARS-based systems . . . . . . . . . . . . . . . . . . . . . . . . . . . . . . . . . . . . 54.2 Automatic Dependent Surveillance (ADS) . . . . . . . . . . . . . . . . . . . . . 6
5. AMDAR Data Management (AMDARDM). . . . . . . . . . . . . . . . . . . . . . . . . . . . . . . . . . 65.1 General . . . . . . . . . . . . . . . . . . . . . . . . . . . . . . . . . . . . . . . . . . . . . . . 65.2 GTS coding . . . . . . . . . . . . . . . . . . . . . . . . . . . . . . . . . . . . . . . . . . . . 65.3 Data dissemination . . . . . . . . . . . . . . . . . . . . . . . . . . . . . . . . . . . . . . 6
6. Quality Control (Q/C) . . . . . . . . . . . . . . . . . . . . . . . . . . . . . . . . . . . . . . . . . . . . . . 66.1 Real-time Q/C . . . . . . . . . . . . . . . . . . . . . . . . . . . . . . . . . . . . . . . . . . 66.2 Quality evaluation (QEV) . . . . . . . . . . . . . . . . . . . . . . . . . . . . . . . . . 6
AppendicesI AMDAR sensor data processing . . . . . . . . . . . . . . . . . . . . . . . . . . . . . 7II AMDAR downlink data specifications . . . . . . . . . . . . . . . . . . . . . . . . 19III AMDAR downlink data control specifications . . . . . . . . . . . . . . . . . . 44IV AMDAR Data Management . . . . . . . . . . . . . . . . . . . . . . . . . . . . . . . . 49V The AMDAR Panel . . . . . . . . . . . . . . . . . . . . . . . . . . . . . . . . . . . . . . . 73VI Acronyms and bibliography . . . . . . . . . . . . . . . . . . . . . . . . . . . . . . . 79
iii

Knowledge is of two kinds. We know a subject ourselves, or we knowwhere we can find information upon it
James Boswell Life of Samuel Johnson (1791)
AIRCRAFT METEOROLOGICAL DATA RELAY(AMDAR) REFERENCE MANUAL
The acronym for Aircraft Meteorological Data Relay is AMDAR. Modern commer-cial aircraft are equipped with meteorological sensors and associated sophisticateddata aquisition and processing systems. These provide input in real time to theaircraft flight management, control and navigation systems and other on-boardsystems such as the environmental control system. Data are also recorded in theflight data recorder for off-line analysis and special (e.g. accident) investigations.
The aircraft computers may be programmed to make meteorological observa-tions at predetermined times (or position) for automatic relay to the ground. This isusually accomplished through the Aircraft Communication and Reporting System(ACARS) and can provide worldwide data using either Very High Frequency (VHF) orsatellite radio links. These links are two-way, so it is possible to modify the reportingprogramme in flight by uplink command. Ground processing and dissemination ofdata are accomplished through systems provided by the appropriate air-carrier,communication service provider and meteorological message processing centres.
AMDAR was proposed for the First Global Atmospheric Research Programme (GARP)Global Experiment (FGGE) in the 1970s. Two systems were developed, one usingcommunications facilities available on the meteorological geo-synchronous satellites –the geostationary operational environmental satellite (GOES), Meteosat and geosta-tionary meteorological satellite (GMS); and one using a standard aircraft VHFcommunication system (ACARS) developed in the United States and rapidly gainingworldwide acceptance. The satellite system, Aircraft to Satellite Data Relay (ASDAR) wassponsored by a consortium of WMO Members and was developed into an operationalsystem by 1991. ACARS-based systems require no additional specialized equipment tobe fitted to the aircraft, whereas ASDAR uses a dedicated data processor and satellitetransmitter. Experience with both systems has led to the conclusion that ACARS-basedAMDAR systems are preferred, based on ease of implementation, worldwide applica-bility and overall cost. ASDAR operations reached a peak in the late 1990s with some20 of 23 purchased systems still in service. It is anticipated that some of these systemswill continue to provide useful data at least to 2003. No further ASDAR developmentsare envisaged, and consequently this manual does not give a technical description ofASDAR. Several new AMDAR systems are being developed using alternative methodsfor sensing and communications. New purpose-designed sensor modules are beingdeveloped and communications techniques are being built based on non-ACARS VHFcommunications and low Earth orbit (LEO) satellites. Global cooperation on AMDARis facilitated by the WMO AMDAR Panel established in 1998 by a number of WMOMembers operating or intending to operate AMDAR programmes. Further informationon the AMDAR Panel is given in Appendix V.
This manual is intended to provide a comprehensive technical description of AMDAR fromsensor systems and their characteristics to the final output product. The detailed technicalmaterial is arranged in a series of self-contained appendices. It is envisaged that theseappendices will be updated as the technology advances. Where appropriate, references areprovided to WMO, International Civil Aviation Organization (ICAO) and AeronauticalRadio Incorporated (ARINC) documents that are subject to issue and review by the respectiveorganizations. No recommendations or other information in this manual overrides orsupersedes the requirements contained in referenced WMO, ICAO or ARINC documents. Itis intended that the Manual will provide sufficient information to enable detailed technicalspecifications to be drawn up for individual AMDAR programmes with respect toobservational data requirements and data management issues. In the implementation of anoperational programme, these specifications would form part of a total package that wouldinclude (for example) contractual arrangements with the appropriate air carrier to providethe downlink data and the associated on-board data processing. The manual does not
1.3 PURPOSE OF THIS MANUAL
1.2 HISTORICAL BACKGROUND
1. GENERAL
1.1 WHAT IS AMDAR?
1
provide details of operational AMDAR programmes. For up-to-date information on AMDARprogrammes, reference should be made to the AMDAR Panel.
The basic meteorological measurements on board modern aircraft are made by:(a) Pitot-static head for static and total air pressure;(b) Immersion thermometer probe for total air temperature; and(c) Inertial reference platform for normal, longitudinal and lateral acceleration
of aircraft.Other measurements include:
(a) Relative humidity, measured on some aircraft using a solid state sensorexposed in a standard temperature sensor housing;
(b) Aircraft pitch (angle of attack), measured by flow angle sensor and used tocorrect static pressure; and
(c) Sensors with which some aircraft are equipped to measure the presence of iceon the flying surfaces.
In a typical system, data from the sensor transducers are processed in the Air DataComputer (ADC) or Inertial Reference Unit (IRU) as appropriate. Some aircraft areequipped with Global Positioning System (GPS) navigation systems. A GPS systemcan provide position and wind vector information with greater precision than thetypical IRU. It can also provide an independent, highly accurate time reference.
ADC outputs include:(a) Pressure altitude derived from static pressure; and(b) Static air temperature derived from total air temperature and Mach number,
where the Mach number itself is computed using static and total pressuremeasurements;IRU outputs include:
(a) Present position-latitude;(b) Present position-longitude;(c) Wind speed (derived from computed wind vectors using airspeed from the
ADC corrected for Mach number and temperature);(d) Wind direction (from computed wind vectors);(e) Normal or vertical acceleration; and(f) Roll angle.
Where relative humidity sensor data is available and/or turbulence reported, addi-tional processing is required, usually carried out in the Aircraft ConditionMonitoring System (ACMS).
Other data needed for attaching to the measured and processed meteorolog-ical data are available from other aircraft systems. These include:(a) Time (UTC);(b) Tail number; and(c) Flight number.
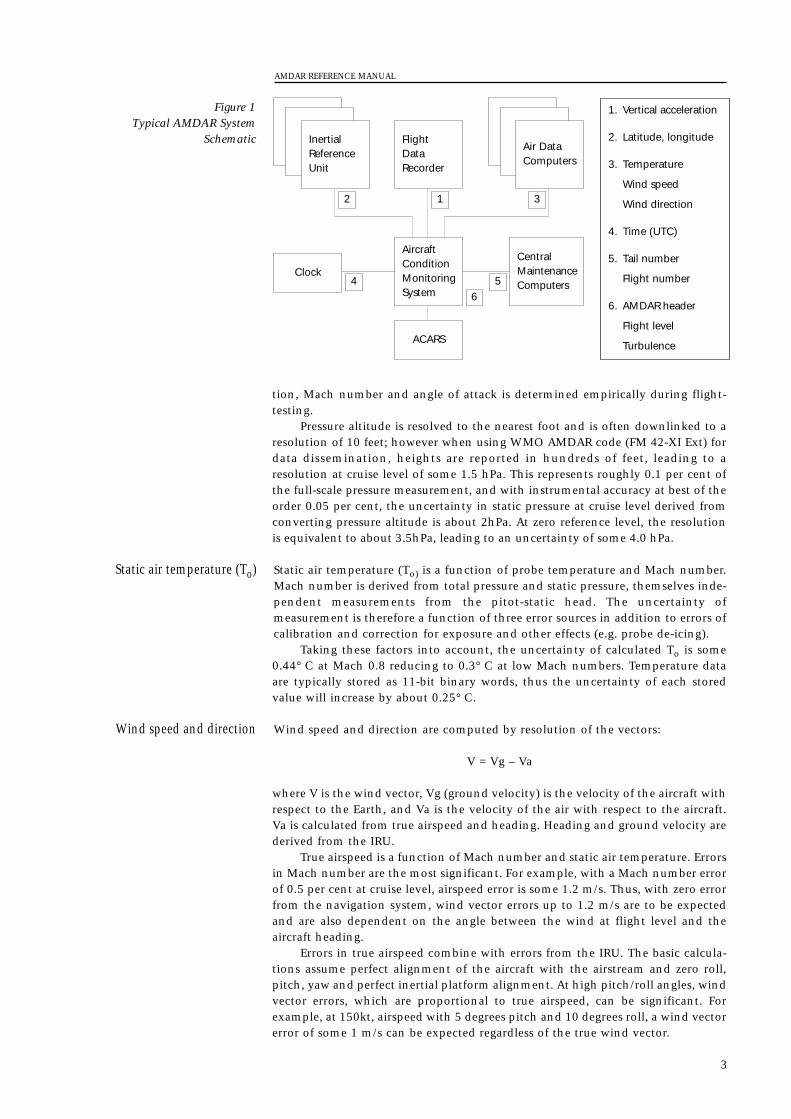
A typical system is illustrated in Figure 1. This shows schematically the principaldata sources feeding into the ACMS. In this diagram (based on the configurationused by the KLM AMDAR/ACARS/ACMS system) the vertical acceleration isshown routed via the Flight Data Recorder.
The aircraft altimeter is calibrated to indicate height according to the ICAO stan-dard atmosphere model. The basic sensor (pitot-static head) provides staticpressure as the fundamental measurement. Sources of error include: (a) Calibration error;(b) Short-term random instrument error;(c) Calibration drift; and(d) Exposure error or static source error.
Because aircraft safety separations are critical, these errors are corrected asmuch as possible in the ADC. Static source error which is a function of probe loca-
2.5MEASUREMENT ACCURACY
Pressure altitude
2.4DATA INTEGRATION
2.3OTHER DATA
2.2DERIVED VARIABLES
2. SENSORS AND
MEASUREMENTS2.1
SENSORS FOR BASICMEASUREMENTS
AMDAR REFERENCE MANUAL
2
tion, Mach number and angle of attack is determined empirically during flight-testing.
Pressure altitude is resolved to the nearest foot and is often downlinked to aresolution of 10 feet; however when using WMO AMDAR code (FM 42-XI Ext) fordata dissemination, heights are reported in hundreds of feet, leading to aresolution at cruise level of some 1.5 hPa. This represents roughly 0.1 per cent ofthe full-scale pressure measurement, and with instrumental accuracy at best of theorder 0.05 per cent, the uncertainty in static pressure at cruise level derived fromconverting pressure altitude is about 2hPa. At zero reference level, the resolutionis equivalent to about 3.5hPa, leading to an uncertainty of some 4.0 hPa.
Static air temperature (To) is a function of probe temperature and Mach number.Mach number is derived from total pressure and static pressure, themselves inde-pendent measurements from the pitot-static head. The uncertainty ofmeasurement is therefore a function of three error sources in addition to errors ofcalibration and correction for exposure and other effects (e.g. probe de-icing).
Taking these factors into account, the uncertainty of calculated To is some0.44° C at Mach 0.8 reducing to 0.3° C at low Mach numbers. Temperature dataare typically stored as 11-bit binary words, thus the uncertainty of each storedvalue will increase by about 0.25° C.
Wind speed and direction are computed by resolution of the vectors:
V = Vg – Va
where V is the wind vector, Vg (ground velocity) is the velocity of the aircraft withrespect to the Earth, and Va is the velocity of the air with respect to the aircraft.Va is calculated from true airspeed and heading. Heading and ground velocity arederived from the IRU.
True airspeed is a function of Mach number and static air temperature. Errorsin Mach number are the most significant. For example, with a Mach number errorof 0.5 per cent at cruise level, airspeed error is some 1.2 m/s. Thus, with zero errorfrom the navigation system, wind vector errors up to 1.2 m/s are to be expectedand are also dependent on the angle between the wind at flight level and theaircraft heading.
Errors in true airspeed combine with errors from the IRU. The basic calcula-tions assume perfect alignment of the aircraft with the airstream and zero roll,pitch, yaw and perfect inertial platform alignment. At high pitch/roll angles, windvector errors, which are proportional to true airspeed, can be significant. Forexample, at 150kt, airspeed with 5 degrees pitch and 10 degrees roll, a wind vectorerror of some 1 m/s can be expected regardless of the true wind vector.
Wind speed and direction
Static air temperature (To)
AMDAR REFERENCE MANUAL
3
1. Vertical acceleration
2. Latitude, longitude
3. Temperature
Wind speed
Wind direction
4. Time (UTC)
5. Tail number
Flight number
6. AMDAR header
Flight level
Turbulence
InertialReferenceUnit
Clock
ACARS
CentralMaintenanceComputers
AircraftConditionMonitoringSystem
Air DataComputers
FlightDataRecorder
12 3
4 56
Figure 1Typical AMDAR System
Schematic
At low wind speeds, vector errors can lead to large errors in wind direction.Thus, a more useful indication combining wind speed and direction error asvector error would suggest a typical uncertainty of 2 to 3 m/s.
Although various sensors have been used in research aircraft for the measurementof relative humidity (or a related variable), no suitable sensor was widely availablefor operational installation at the time this manual was prepared. A diode lasersensor under development in the United States, directly measuring water vapourmixing ratio , promises to measure to a few parts per million (ppm) by volume;however, when converting these measurements to relative humidity or dewpoint, accuracy is critically dependent on air temperature measurement.
Turbulence is reported in one or more of three ways:(a) As variation in vertical acceleration experienced by the aircraft;(b) As ‘derived equivalent vertical gust’; and(c) As an index related to eddy dissipation rate (EDR).
The accuracy of the finally reported variable depends on the output chosenand other assumptions. A discussion on the data processing methods and uncer-tainties involved is included in Appendix I.
Several types of sensor may detect ice buildup on the flying surfaces.Two types in use are:
(a) A thin film capacitive sensor attached to the airfoil; and(b) A mechanical (vibrating transducer) sensor exposed to the airstream in a
probe adjacent the relevant flying surface.The output of either sensor is essentially an ice/no ice signal, and error would
be described by a false alarm rate. At present, no data are available on false alarmrates for these sensors.
In order to meet, as far as possible, the requirements of WMO global and regionalprogrammes, and allow for the more stringent requirements of nationalprogrammes, data requirements have been developed that define:(a) The elements to be reported in a single observation, their ranges and
resolution;(b) The intervals in space and time between each observation;(c) The recommended averaging times for specific elements reported according
to operational environment (e.g. phase of flight);(d) The recommended data compression schemes to be employed to minimize
transmission time (and therefore cost);(e) The recommended data selection options for space and time including route
and airport selection; and(f) The recommended output code formats for widespread data dissemination
on the ground (e.g. Global Telecommunication System (GTS) distribution).
Elements to be reported in a single observation are summarized as follows:(a) Latitude;(b) Longitude;(c) Time;(d) Pressure altitude;(e) Temperature;(f) Wind direction;(g) Wind speed;(h) Turbulence ;(i) Humidity;(j) Icing;(k) Phase of flight;(l) Roll angle or roll and pitch angle; and(m) Aircraft identifier.
3.MESSAGE COMPILATION
3.1METEOROLOGICAL
REQUIREMENTS
Icing
Turbulence
Relative humidity
AMDAR REFERENCE MANUAL
4
Further details (including units, range, reported resolution and desired accu-racy) are given in Appendix II.
AMDAR observation intervals are linked to aircraft flight phase. Three phases arerecognized:(a) Ascent;(b) Level flight (or cruise or en-route); and(c) Descent.
Observations made during ascent and descent are designed to meet meteor-ological requirements for profiles of temperature, humidity and wind. Intervalscan be selected by time or, preferably, by pressure level above the terminal airfield.
Intervals between observations in level flight are determined mainly byrequirements for synoptic meteorology and large-scale numerical models.Intervals are most conveniently selected by time interval and geographical posi-tion. Specifications recommended by the AMDAR Panel are given in Appendix II.
At busy airfields it is possible to generate very large numbers of profiles, often veryclosely spaced or even overlapping in time. Some air routes are also congested andaircraft flying such routes might generate an excessive number of meteorologicalobservations. It is desirable, therefore, to provide a means of platform selectionaccording to airfield (profile selection) or geographical area (en-route report selec-tion). Selection could be pre-programmed or established by uplink command.Recommended selection options are given in Appendix III.
To meet the needs of global Air Traffic Services (ATS) for the efficient operationand weather routing of modern commercial aircraft, and to meet aviation weathersafety requirements, ICAO has drawn up requirements for in-flight weather obser-vation reporting. Of particular relevance to AMDAR is the requirement related tothe Automatic Dependent Surveillance (ADS) system, which concerns automaticreporting of aircraft meteorological measurements and their onward transmissionto the World Area Forecast Centres (WAFCs). These requirements are published inICAO documents and (where appropriate) in WMO Technical Regulations (WMO-No. 49). Relevant sections are discussed in Appendix II to this document.
There are many downlink formats for transmitting meteorological reports fromaircraft. In addition to many company-specific formats used mainly in NorthAmerica, there are several formats in operational use specified by meteorologicalservices. These include:(a) Australian AMDAR, the earliest operational AMDAR format, in service since
1986;(b) AAA (ACARS AMDAR ACMS) AMDAR version 1, developed by KLM for the
Royal Netherlands Meteorological Institute (KNMI) using ASDAR specifica-tions;
(c) AMDAR France, developed by Météo France in 1995 for operation on inter-nal (domestic) flights;
(d) AAA AMDAR version 2, developed for the European AMDAR Programme underthe European Meteorological Services Network (EUMETNET) umbrella; and
(e) ARINC 620, developed by ARINC to standardize formats for the United StatesMeteorological Data Collection and Reporting System (MDCRS).
Of the systems mentioned above, four are currently freely available for general use(a, b, d and e) and some newly delivered aircraft have ARINC 620 software loadedin the ACMS on delivery. In order to avoid the proliferation of future standards,this document will describe only two:(a) AMDAR Panel Format (APF), a generic output format providing a framework
for downlink encoding; and(b) ARINC 620 (Now under revision, incorporating many AMDAR Panel
recommendations).Full details of APF and ARINC 620 are given in Appendix II.
4.DATA FORMATS FOR AIR-
GROUND (DOWNLINK)COMMUNICATION
4.1ACARS BASED SYSTEMS
3.2 AERONAUTICALREQUIREMENTS
Platform selection
Observation intervals
AMDAR REFERENCE MANUAL
5
ADS meteorological reporting formats are specified by the ICAO ADS Panel. Theair-ground link is via the Aeronautical Telecommunications Network, an open,Wide Area Network (WAN) with data carried on various sub-networks, includingVHF, ACARS, SATCOM and terrestrial networks. ADS data format specificationsfor the meteorological messages are included in Annex IV to Appendix II.
AMDAR Data Management (AMDARDM) can be viewed within the context of theWMO World Weather Watch Data Management (WWWDM) programme. Thegoal of WWWDM is to carry out those activities required to optimize the inte-gration of the Global Observing System (GOS), GTS and Global Data-processingSystem (GDPS). WWWDM functions include:(a) Providing specifications for data representation, including codes and
exchange formats, guidelines for the design of databases and storage ofobservational data and processed information;
(b) Defining and designing proper procedures and interfaces, particularly in thearea of data processing and telecommunications, to allow Members to obtainthe coherent and appropriate sets of data and products required, despite thedisparity in the levels of sophistication of technology and techniques ofvarious WWW centres; and
(c) Monitoring of AMDAR operations and the quality of basic data and outputproducts.
Data are circulated globally on the GTS. The GTS code forms in common useinclude:(a) Alpha-numeric AMDAR code (WMO Code FM 42-XI Ext)(b) Binary (BUFR) AMDAR code (WMO Code FM 94)
Downlinked data must be converted to one or both of the above formats beforeinsertion into the GTS. AMDARDM is discussed in detail in Appendix IV.
Quality Control (Q/C) is embodied within AMDARDM and applies to all stages ofdata production and dissemination. The main requirements are discussed belowand dealt with in more detail in Appendix IV.
Real-time Q/C of AMDAR data is needed:(a) At the measurement stage on board the aircraft;(b) At the code conversion to GTS format stage; and(c) At the data assimilation stage for real-time applications.
The first two stages are necessary to ensure an adequate quality of data isreleased for general user applications. The third stage is desirable to eliminate orflag erroneous data from model or analyzed fields, or for subsequent climate orarchive purposes.
QEV is a process carried out in near- or non-real time to apply statistical tests toindividual or sets of AMDAR reports. This process will generally identify long-term sensor drift or constant measurement bias as well as highlighting platformsthat are consistently transmitting poor quality data. The QEV process is an impor-tant link in the total AMDAR quality system and provides the most importantfeedback path for remedial action. Guidelines for an AMDAR quality systemincluding Q/C, QEV and subsequent actions are given in Appendix IV.
6.2QUALITY EVALUATION (QEV)
6.1REAL-TIME Q/C
6.QUALITY CONTROL (Q/C)
5.AMDAR DATA
MANAGEMENT(AMDARDM)
5.1GENERAL
5.2GTS CODING
5.3DATA DISSEMINATION
4.2AUTOMATIC DEPENDENT
SURVEILLANCE (ADS)
AMDAR REFERENCE MANUAL
6
APPENDIX I
AMDAR SENSOR DATA PROCESSING
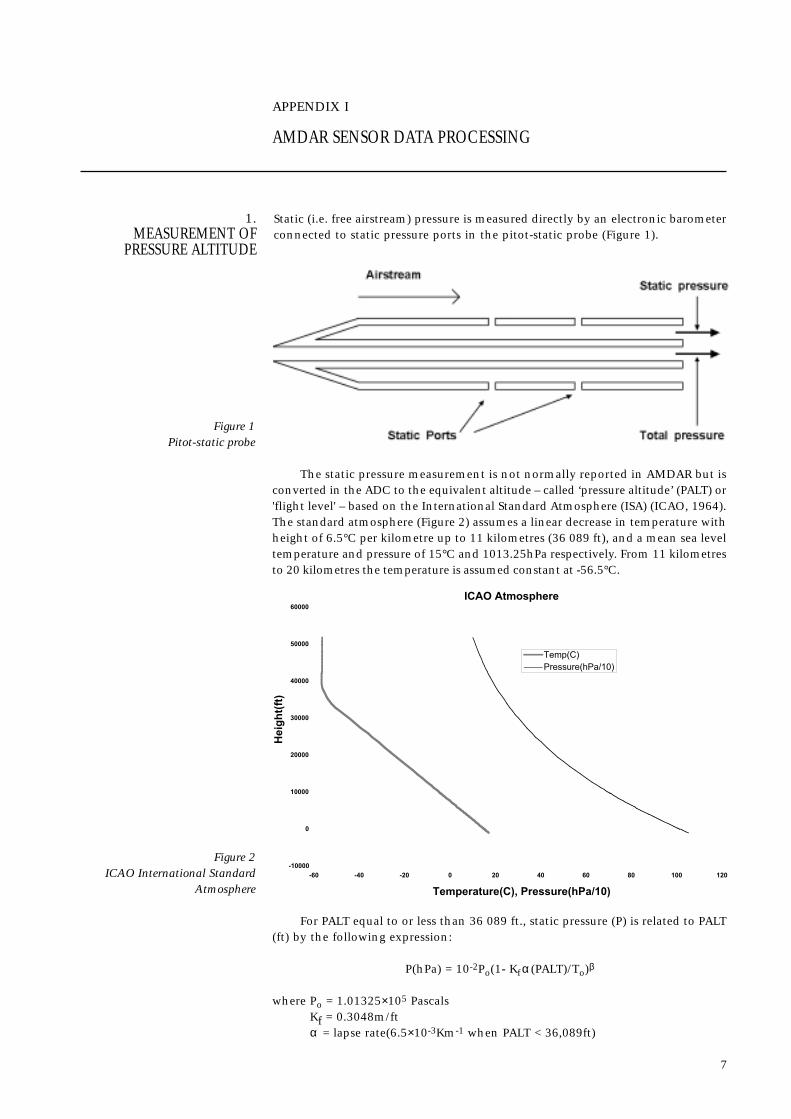
Static (i.e. free airstream) pressure is measured directly by an electronic barometerconnected to static pressure ports in the pitot-static probe (Figure 1).
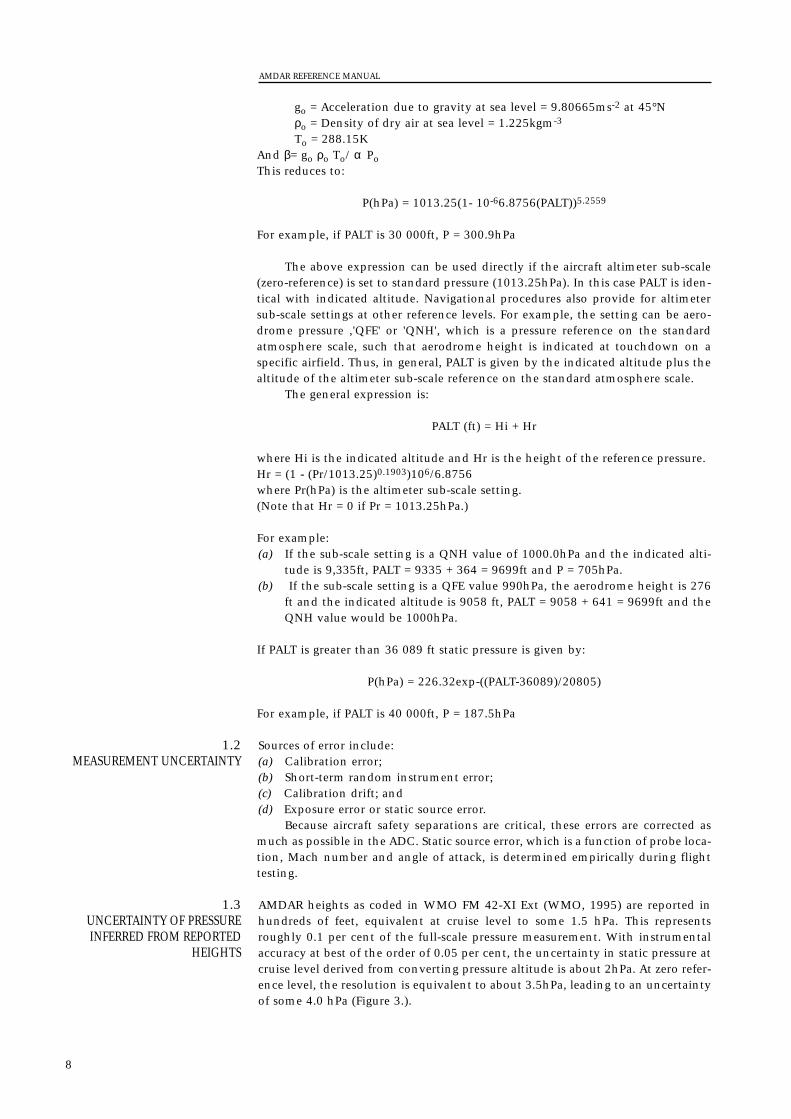
The static pressure measurement is not normally reported in AMDAR but isconverted in the ADC to the equivalent altitude – called ‘pressure altitude’ (PALT) or'flight level' – based on the International Standard Atmosphere (ISA) (ICAO, 1964).The standard atmosphere (Figure 2) assumes a linear decrease in temperature withheight of 6.5°C per kilometre up to 11 kilometres (36 089 ft), and a mean sea leveltemperature and pressure of 15°C and 1013.25hPa respectively. From 11 kilometresto 20 kilometres the temperature is assumed constant at -56.5°C.
For PALT equal to or less than 36 089 ft., static pressure (P) is related to PALT(ft) by the following expression:
P(hPa) = 10-2Po(1- Kfα (PALT)/To)β
where Po = 1.01325×10⁵ PascalsKf = 0.3048m/ftα = lapse rate(6.5×10⁻³Km-1 when PALT < 36,089ft)
1. MEASUREMENT OF
PRESSURE ALTITUDE
7
Figure 1Pitot-static probe
Figure 2ICAO International Standard
Atmosphere
ICAO Atmosphere
-10000
0
10000
20000
30000
40000
50000
60000
-60 -40 -20 0 20 40 60 80 100 120
Temperature(C), Pressure(hPa/10)
Hei
gh
t(ft
)
Temp(C)Pressure(hPa/10)
go = Acceleration due to gravity at sea level = 9.80665ms-2 at 45°Nρo = Density of dry air at sea level = 1.225kgm-3
To = 288.15KAnd β= go ρo To/ α PoThis reduces to:
P(hPa) = 1013.25(1- 10-66.8756(PALT))5.2559
For example, if PALT is 30 000ft, P = 300.9hPa
The above expression can be used directly if the aircraft altimeter sub-scale(zero-reference) is set to standard pressure (1013.25hPa). In this case PALT is iden-tical with indicated altitude. Navigational procedures also provide for altimetersub-scale settings at other reference levels. For example, the setting can be aero-drome pressure ,'QFE' or 'QNH', which is a pressure reference on the standardatmosphere scale, such that aerodrome height is indicated at touchdown on aspecific airfield. Thus, in general, PALT is given by the indicated altitude plus thealtitude of the altimeter sub-scale reference on the standard atmosphere scale.
The general expression is:
PALT (ft) = Hi + Hr
where Hi is the indicated altitude and Hr is the height of the reference pressure. Hr = (1 - (Pr/1013.25)0.1903)106/6.8756where Pr(hPa) is the altimeter sub-scale setting.(Note that Hr = 0 if Pr = 1013.25hPa.)
For example:(a) If the sub-scale setting is a QNH value of 1000.0hPa and the indicated alti-
tude is 9,335ft, PALT = 9335 + 364 = 9699ft and P = 705hPa.(b) If the sub-scale setting is a QFE value 990hPa, the aerodrome height is 276
ft and the indicated altitude is 9058 ft, PALT = 9058 + 641 = 9699ft and theQNH value would be 1000hPa.
If PALT is greater than 36 089 ft static pressure is given by:
P(hPa) = 226.32exp-((PALT-36089)/20805)
For example, if PALT is 40 000ft, P = 187.5hPa
Sources of error include:(a) Calibration error;(b) Short-term random instrument error;(c) Calibration drift; and(d) Exposure error or static source error.
Because aircraft safety separations are critical, these errors are corrected asmuch as possible in the ADC. Static source error, which is a function of probe loca-tion, Mach number and angle of attack, is determined empirically during flighttesting.
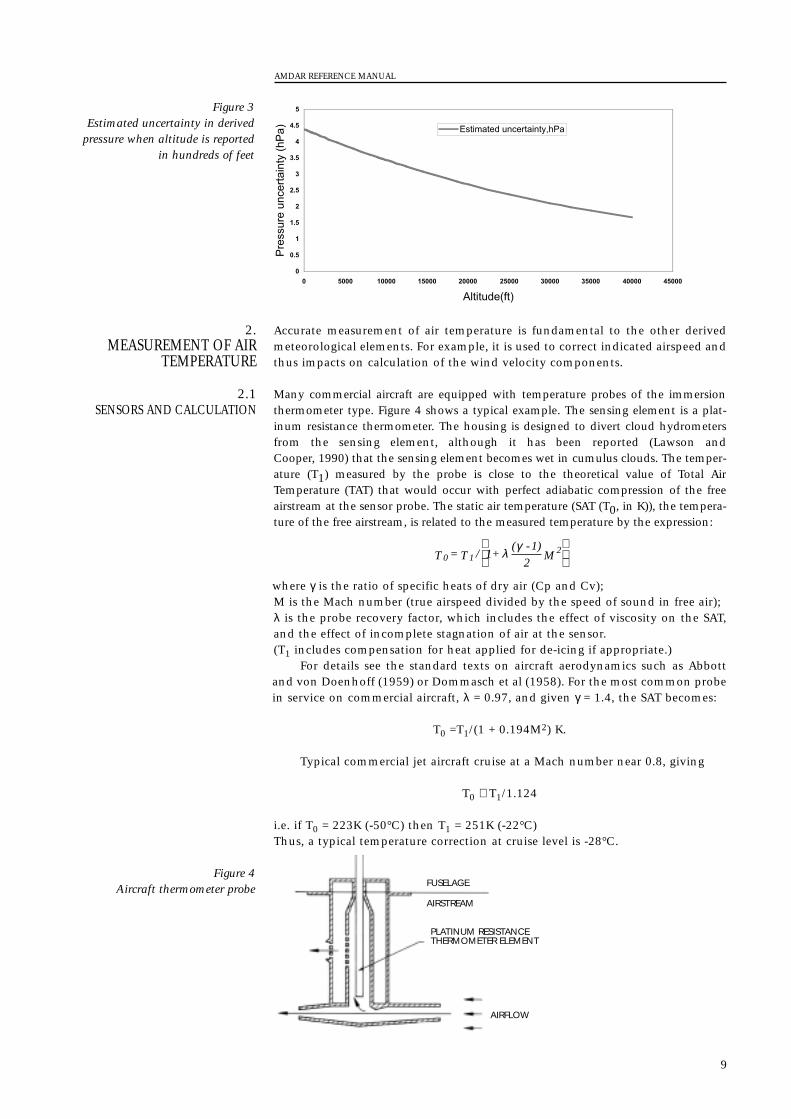
AMDAR heights as coded in WMO FM 42-XI Ext (WMO, 1995) are reported inhundreds of feet, equivalent at cruise level to some 1.5 hPa. This representsroughly 0.1 per cent of the full-scale pressure measurement. With instrumentalaccuracy at best of the order of 0.05 per cent, the uncertainty in static pressure atcruise level derived from converting pressure altitude is about 2hPa. At zero refer-ence level, the resolution is equivalent to about 3.5hPa, leading to an uncertaintyof some 4.0 hPa (Figure 3.).
1.3 UNCERTAINTY OF PRESSUREINFERRED FROM REPORTED
HEIGHTS
1.2 MEASUREMENT UNCERTAINTY
AMDAR REFERENCE MANUAL
8
Accurate measurement of air temperature is fundamental to the other derivedmeteorological elements. For example, it is used to correct indicated airspeed andthus impacts on calculation of the wind velocity components.
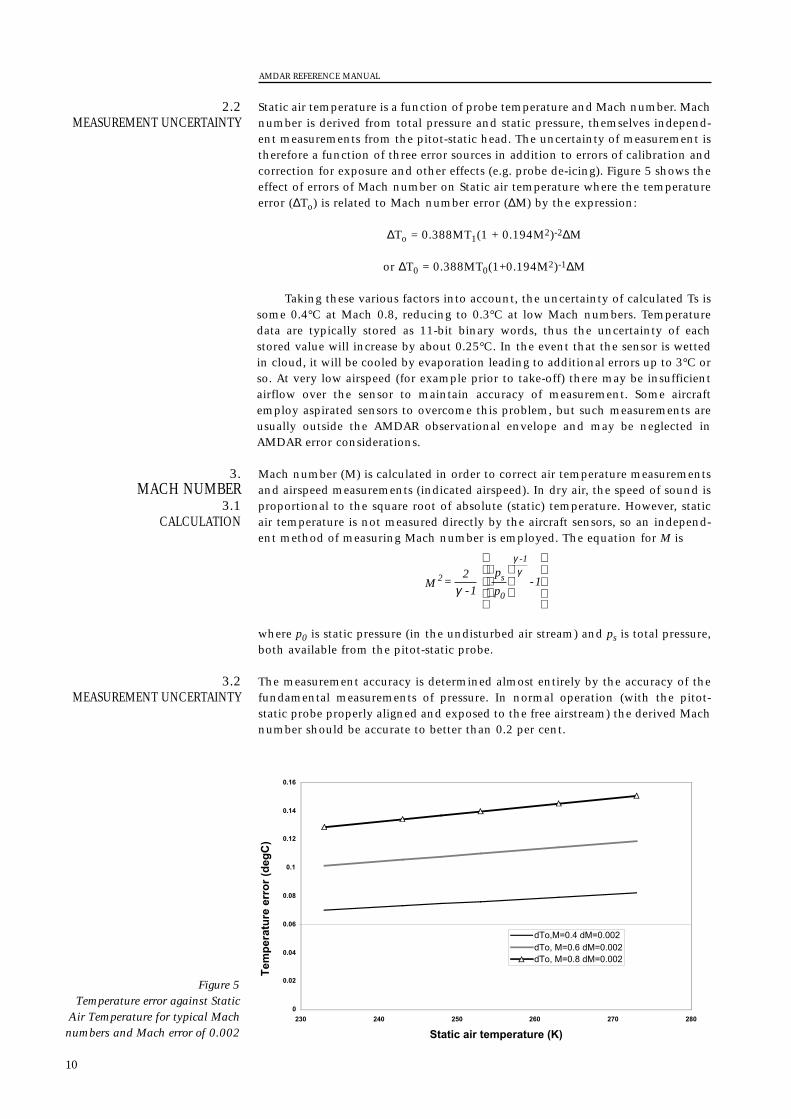
Many commercial aircraft are equipped with temperature probes of the immersionthermometer type. Figure 4 shows a typical example. The sensing element is a plat-inum resistance thermometer. The housing is designed to divert cloud hydrometersfrom the sensing element, although it has been reported (Lawson andCooper, 1990) that the sensing element becomes wet in cumulus clouds. The temper-ature (T1) measured by the probe is close to the theoretical value of Total AirTemperature (TAT) that would occur with perfect adiabatic compression of the freeairstream at the sensor probe. The static air temperature (SAT (T0, in K)), the tempera-ture of the free airstream, is related to the measured temperature by the expression:
where γ is the ratio of specific heats of dry air (Cp and Cv);M is the Mach number (true airspeed divided by the speed of sound in free air);λ is the probe recovery factor, which includes the effect of viscosity on the SAT,and the effect of incomplete stagnation of air at the sensor. (T1 includes compensation for heat applied for de-icing if appropriate.)
For details see the standard texts on aircraft aerodynamics such as Abbottand von Doenhoff (1959) or Dommasch et al (1958). For the most common probein service on commercial aircraft, λ = 0.97, and given γ = 1.4, the SAT becomes:
T0 =T1/(1 + 0.194M2) K.
Typical commercial jet aircraft cruise at a Mach number near 0.8, giving
T0 ≅ T1/1.124
i.e. if T0 = 223K (-50°C) then T1 = 251K (-22°C)Thus, a typical temperature correction at cruise level is -28°C.
0 12T = T / 1+
( -1)
2Mλ γ
2.MEASUREMENT OF AIR
TEMPERATURE
2.1 SENSORS AND CALCULATION
AMDAR REFERENCE MANUAL
9
Figure 3Estimated uncertainty in derived
pressure when altitude is reportedin hundreds of feet
0
0.5
1
1.5
2
2.5
3
3.5
4
4.5
5
0 5000 10000 15000 20000 25000 30000 35000 40000 45000
Altitude(ft)
Pre
ssur
e un
cert
aint
y (h
Pa) Estimated uncertainty,hPa
Figure 4 Aircraft thermometer probe FUSELAGE
AIRSTREAM
AIRFLOW
PLATINUM RESISTANCETHERMOMETER ELEMENT
Static air temperature is a function of probe temperature and Mach number. Machnumber is derived from total pressure and static pressure, themselves independ-ent measurements from the pitot-static head. The uncertainty of measurement istherefore a function of three error sources in addition to errors of calibration andcorrection for exposure and other effects (e.g. probe de-icing). Figure 5 shows theeffect of errors of Mach number on Static air temperature where the temperatureerror (∆To) is related to Mach number error (∆M) by the expression:
∆To = 0.388MT1(1 + 0.194M2)-2∆M
or ∆T0 = 0.388MT0(1+0.194M2)-1∆M
Taking these various factors into account, the uncertainty of calculated Ts issome 0.4°C at Mach 0.8, reducing to 0.3°C at low Mach numbers. Temperaturedata are typically stored as 11-bit binary words, thus the uncertainty of eachstored value will increase by about 0.25°C. In the event that the sensor is wettedin cloud, it will be cooled by evaporation leading to additional errors up to 3°C orso. At very low airspeed (for example prior to take-off) there may be insufficientairflow over the sensor to maintain accuracy of measurement. Some aircraftemploy aspirated sensors to overcome this problem, but such measurements areusually outside the AMDAR observational envelope and may be neglected inAMDAR error considerations.
Mach number (M) is calculated in order to correct air temperature measurementsand airspeed measurements (indicated airspeed). In dry air, the speed of sound isproportional to the square root of absolute (static) temperature. However, staticair temperature is not measured directly by the aircraft sensors, so an independ-ent method of measuring Mach number is employed. The equation for M is
where p0 is static pressure (in the undisturbed air stream) and ps is total pressure,both available from the pitot-static probe.
The measurement accuracy is determined almost entirely by the accuracy of thefundamental measurements of pressure. In normal operation (with the pitot-static probe properly aligned and exposed to the free airstream) the derived Machnumber should be accurate to better than 0.2 per cent.
3.2MEASUREMENT UNCERTAINTY
2
-1
s
0M =
2
-1
p
p-1
γ
γγ
3.MACH NUMBER
3.1CALCULATION
2.2MEASUREMENT UNCERTAINTY
AMDAR REFERENCE MANUAL
10
0
0.02
0.04
0.06
0.08
0.1
0.12
0.14
0.16
230 240 250 260 270 280
Static air temperature (K)
Tem
per
atu
re e
rro
r (d
egC
)
dTo,M=0.4 dM=0.002dTo, M=0.6 dM=0.002dTo, M=0.8 dM=0.002
Figure 5Temperature error against Static
Air Temperature for typical Machnumbers and Mach error of 0.002
The measurement of the three-dimensional wind vector from an aircraft is acomplicated problem. Using data from the aircraft navigation system (usually aninertial system) and the airspeed system (usually a pitot-static tube), together withdata from the temperature sensors, it is possible to estimate to a high degree ofaccuracy the velocity (Vg) of the aircraft with respect to the Earth and the veloc-ity of the air (Va) with respect to the aircraft. The wind vector (V) is thereforegiven by
V = Vg - Va
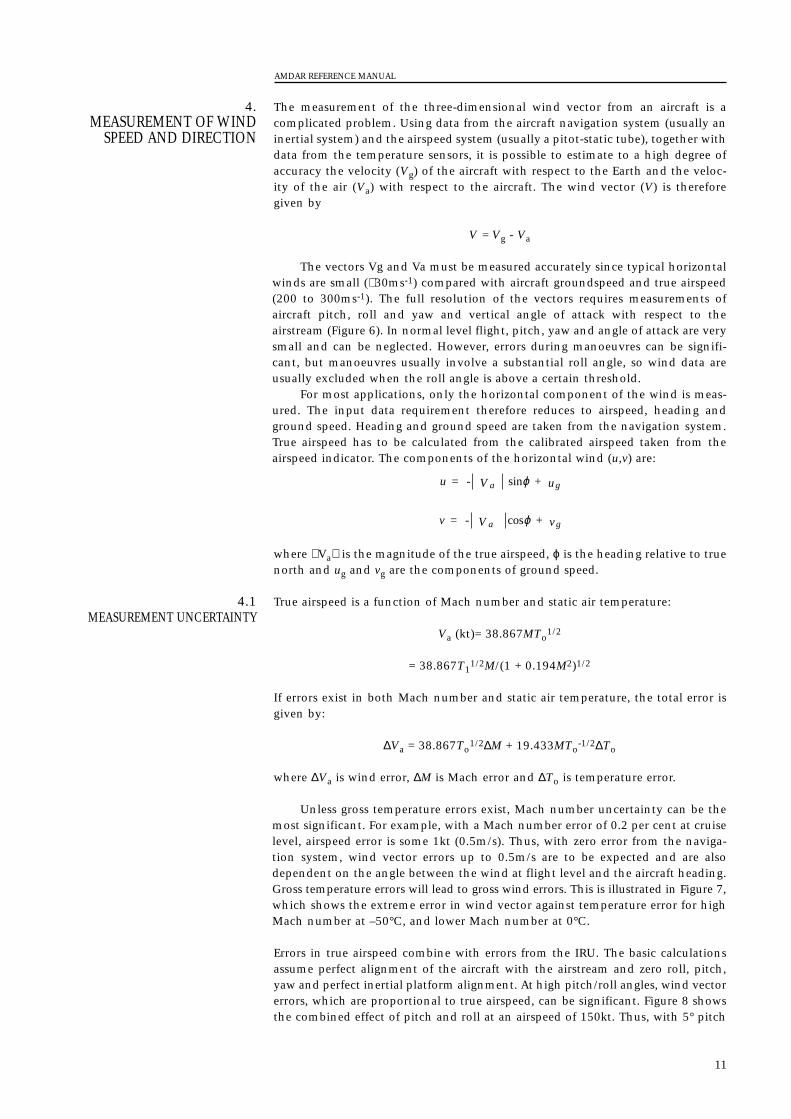
The vectors Vg and Va must be measured accurately since typical horizontalwinds are small (≅ 30ms-1) compared with aircraft groundspeed and true airspeed(200 to 300ms-1). The full resolution of the vectors requires measurements ofaircraft pitch, roll and yaw and vertical angle of attack with respect to theairstream (Figure 6). In normal level flight, pitch, yaw and angle of attack are verysmall and can be neglected. However, errors during manoeuvres can be signifi-cant, but manoeuvres usually involve a substantial roll angle, so wind data areusually excluded when the roll angle is above a certain threshold.
For most applications, only the horizontal component of the wind is meas-ured. The input data requirement therefore reduces to airspeed, heading andground speed. Heading and ground speed are taken from the navigation system.True airspeed has to be calculated from the calibrated airspeed taken from theairspeed indicator. The components of the horizontal wind (u,v) are:
where Va is the magnitude of the true airspeed, ϕ is the heading relative to truenorth and ug and vg are the components of ground speed.
True airspeed is a function of Mach number and static air temperature:
Va (kt)= 38.867MTo1/2
= 38.867T11/2M/(1 + 0.194M2)1/2
If errors exist in both Mach number and static air temperature, the total error isgiven by:
∆Va = 38.867To1/2∆M + 19.433MTo
-1/2∆To
where ∆Va is wind error, ∆M is Mach error and ∆To is temperature error.
Unless gross temperature errors exist, Mach number uncertainty can be themost significant. For example, with a Mach number error of 0.2 per cent at cruiselevel, airspeed error is some 1kt (0.5m/s). Thus, with zero error from the naviga-tion system, wind vector errors up to 0.5m/s are to be expected and are alsodependent on the angle between the wind at flight level and the aircraft heading.Gross temperature errors will lead to gross wind errors. This is illustrated in Figure 7,which shows the extreme error in wind vector against temperature error for highMach number at –50°C, and lower Mach number at 0°C.
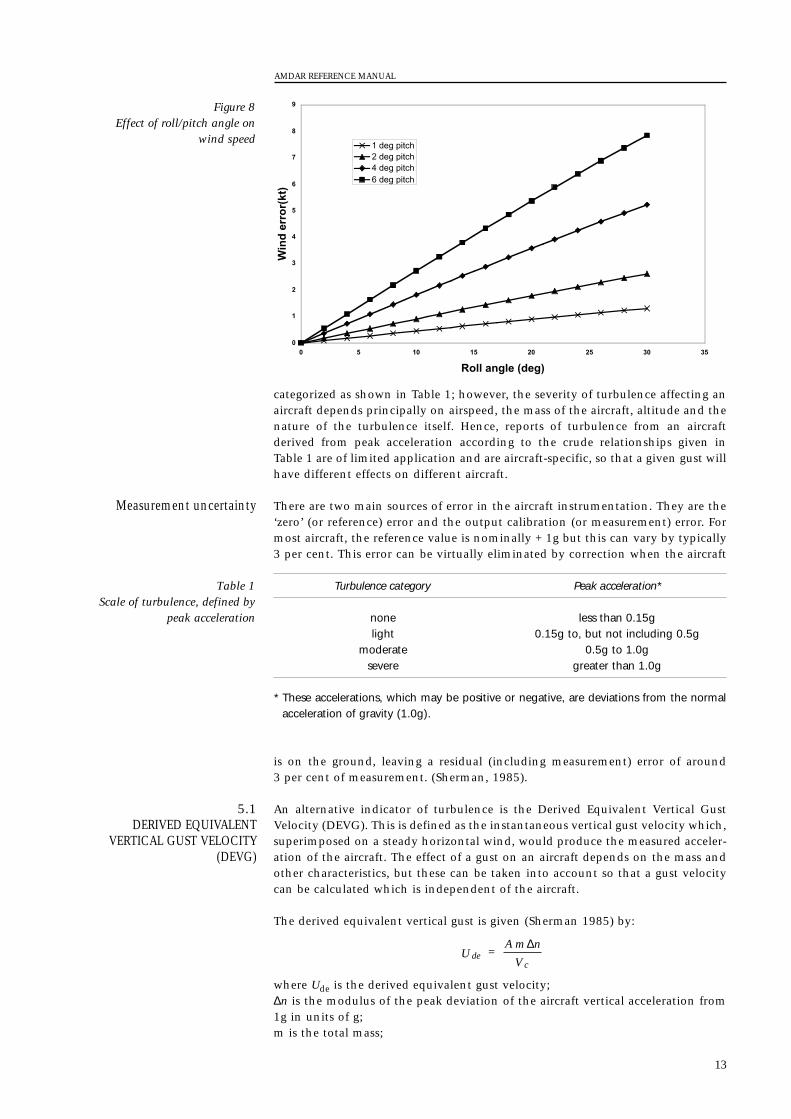
Errors in true airspeed combine with errors from the IRU. The basic calculationsassume perfect alignment of the aircraft with the airstream and zero roll, pitch,yaw and perfect inertial platform alignment. At high pitch/roll angles, wind vectorerrors, which are proportional to true airspeed, can be significant. Figure 8 showsthe combined effect of pitch and roll at an airspeed of 150kt. Thus, with 5° pitch
4.1MEASUREMENT UNCERTAINTY
v = - V + va gcosϕ
u = - V + ua gsinϕ
4.MEASUREMENT OF WIND
SPEED AND DIRECTION
AMDAR REFERENCE MANUAL
11
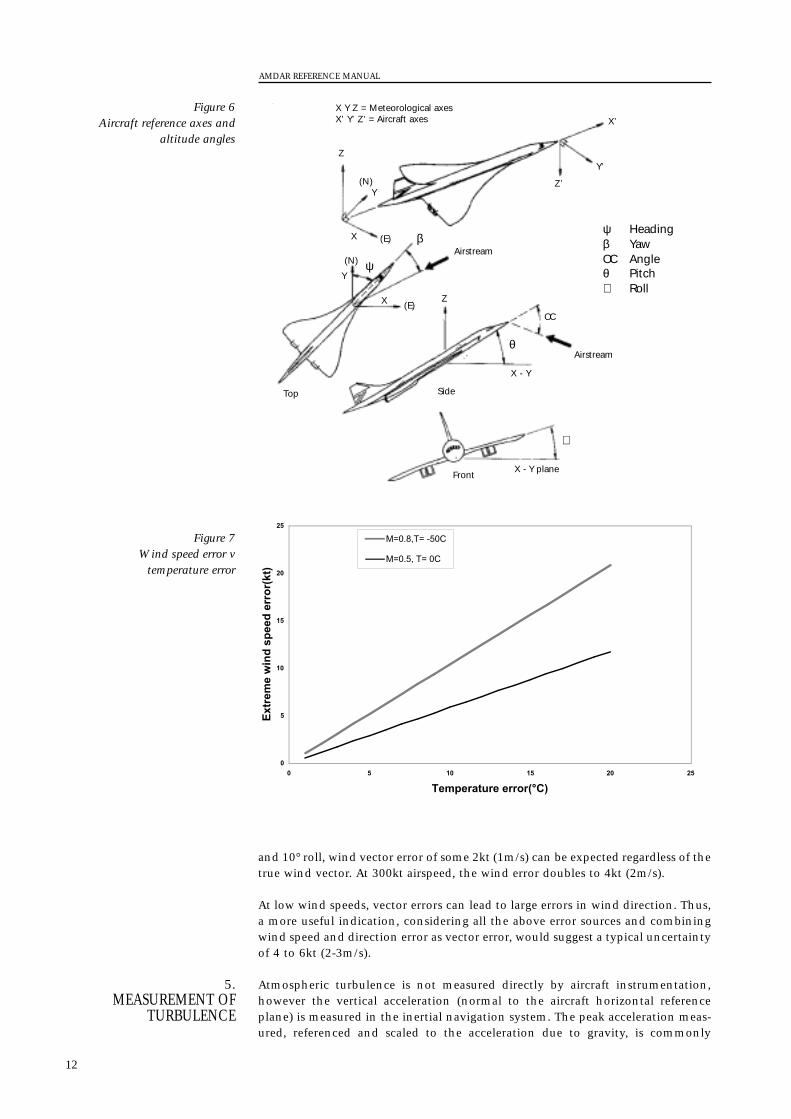
and 10° roll, wind vector error of some 2kt (1m/s) can be expected regardless of thetrue wind vector. At 300kt airspeed, the wind error doubles to 4kt (2m/s).
At low wind speeds, vector errors can lead to large errors in wind direction. Thus,a more useful indication, considering all the above error sources and combiningwind speed and direction error as vector error, would suggest a typical uncertaintyof 4 to 6kt (2-3m/s).
Atmospheric turbulence is not measured directly by aircraft instrumentation,however the vertical acceleration (normal to the aircraft horizontal referenceplane) is measured in the inertial navigation system. The peak acceleration meas-ured, referenced and scaled to the acceleration due to gravity, is commonly
5.MEASUREMENT OF
TURBULENCE
AMDAR REFERENCE MANUAL
12
Figure 6Aircraft reference axes and
altitude angles
Figure 7Wind speed error v
temperature error
0
5
10
15
20
25
0 5 10 15 20 25
Temperature error(°C)
Ext
rem
e w
ind
sp
eed
err
or(
kt)
M=0.8,T= -50C
M=0.5, T= 0C
X Y Z = Meteorological axesX’ Y’ Z’ = Aircraft axes X’
Y’
Z’
Z
Z
X - Y
X - Y plane
OC
θ
∅
X
X
(N)
(N)
(E)
(E)
Top Side
Front
β
ψAirstream
ψ Headingβ YawOC Angleθ Pitch∅ Roll
Airstream
Y
Y
categorized as shown in Table 1; however, the severity of turbulence affecting anaircraft depends principally on airspeed, the mass of the aircraft, altitude and thenature of the turbulence itself. Hence, reports of turbulence from an aircraftderived from peak acceleration according to the crude relationships given inTable 1 are of limited application and are aircraft-specific, so that a given gust willhave different effects on different aircraft.
There are two main sources of error in the aircraft instrumentation. They are the‘zero’ (or reference) error and the output calibration (or measurement) error. Formost aircraft, the reference value is nominally + 1g but this can vary by typically3 per cent. This error can be virtually eliminated by correction when the aircraft
is on the ground, leaving a residual (including measurement) error of around 3 per cent of measurement. (Sherman, 1985).
An alternative indicator of turbulence is the Derived Equivalent Vertical GustVelocity (DEVG). This is defined as the instantaneous vertical gust velocity which,superimposed on a steady horizontal wind, would produce the measured acceler-ation of the aircraft. The effect of a gust on an aircraft depends on the mass andother characteristics, but these can be taken into account so that a gust velocitycan be calculated which is independent of the aircraft.
The derived equivalent vertical gust is given (Sherman 1985) by:
where Ude is the derived equivalent gust velocity;∆n is the modulus of the peak deviation of the aircraft vertical acceleration from1g in units of g;m is the total mass;
dec
U = A m n
V
∆
5.1 DERIVED EQUIVALENT
VERTICAL GUST VELOCITY(DEVG)
Measurement uncertainty
AMDAR REFERENCE MANUAL
13
0
1
2
3
4
5
6
7
8
9
0 5 10 15 20 25 30 35
Roll angle (deg)
Win
d e
rro
r(kt
)
1 deg pitch2 deg pitch4 deg pitch6 deg pitch
Figure 8Effect of roll/pitch angle on
wind speed
Turbulence category Peak acceleration*
none less than 0.15glight 0.15g to, but not including 0.5g
moderate 0.5g to 1.0gsevere greater than 1.0g
* These accelerations, which may be positive or negative, are deviations from the normalacceleration of gravity (1.0g).
Table 1Scale of turbulence, defined by
peak acceleration
Vc is the calibrated airspeed at the time of the acceleration peak occurrence; andA is a parameter that depends on the aircraft type, and weakly on the mass, thealtitude, and the Mach number.
Errors in each of the elements contributing to Ude have been estimated. These aretypically less than 3 per cent maximum for each element in normal level flightand in the extreme could lead to a total error of 10 to 12 per cent. Assuming arandom distribution of errors, a typical uncertainty would be 3 or 4 per cent ofthe final value of Ude. Aircraft manoeuvres can also lead to large vertical acceler-ations of an aircraft and, conversely, active control techniques can dampen theacceleration due to gusts leading to serious underestimation of vertical gustvelocities.
This method (Cornman et al, 1995) seeks to describe the vertical gust spec-trum of the turbulent air around the aircraft by the single parameter ‘ε1/3’,the EDR.
The input gust energy spectrum, at the frequencies of interest, isapproximated by:
ϕi(ω) =0.7V 2/3ε2/3ω-5/3
where V is the true airspeed and ω is the turbulent frequency relative to the aircraft.ε1/3 is related to the total power in the gust spectrum (σ2) divided by a length scaleparameter (L1/3) such that:
ε1/3 ≡ [σ2/L1/3] 1/2 (m2/3s-1)
Given the aircraft vertical acceleration response function to vertical gusts H (ω),the output vertical gust energy spectrum ϕo (ω) is given by:
and the output vertical acceleration power σo2 (ω) is given by:
The limits of integration, ω1 and ω2, are chosen to remove the low frequencyamplification of the gust spectral approximation, low frequencies due toaircraft manoeuvres, noise and high frequency aircraft response not modelledby H (ω).
Denoting the integral above I (ω1, ω2, ω) and rearranging, we have:
ε2/3(ω) = σo2 (ω)/0.7V 2/3 I (ω1, ω2, ω)
The response integral can be determined for a particular aircraft and changes rela-tively slowly over time with changing aircraft weight and flight conditions.
As the EDR and output power will change with time as the aircraft encountersdifferent turbulent conditions, and noting that for a given time interval (T)σo
2(ω) = σo2 (t), we can write:
ε2/3(T) = σo2 (T)/0.7V 2/3 I (ω1, ω2, T)
where T is the measurement interval for each estimation of EDR.
σ ωο2
1
2
2 3 2 5 3
( ) = ( )
( )
∫
∫ −
ϕ ω ω
ε ω ω ω
ω
ω
o
2/3
d
= 0.7V H d/ /
ϕ ω ω ε ωο−5/3( ) = ( )H V 2/3 2/32
0 7.
5.2EDDY DISSIPATION RATE (EDR)
Measurement uncertainty
AMDAR REFERENCE MANUAL
14
The output vertical accelerations are band pass filtered to match the responseintegral and σo
2 is estimated from the standard deviation of running 10-secondsamples of the filtered values. The pass band is currently set at 0.1 to 0.8Hz.
The aircraft response integral is evaluated for a range of flight conditions andstored in look-up tables, thus reducing and simplifying the on-board computationrequirement.
For downlinking, the data can be reduced to a median and peak value overthe reporting interval. The peak value usually chosen is the 90-percentile value inthe reporting interval.
As for DEVG, there is a potentially large number of error sources contributing tomeasurement uncertainty. Based on the error analysis for DEVG, one wouldexpect an uncertainty of some 5 to 10 per cent in the calculation process. Afurther complication arises over the choices of sampling interval and averagingtime. Examination of typical time series of vertical acceleration data often indi-cates high variability of statistical properties over short distances. Variation ofairspeed for a single aircraft and between different aircraft types alter the samplingdistances and vary the wavelengths filtered.
Detailed field comparisons (Stickland, 1998) have been made between EDR andDEVG. These have shown a high correlation between peak EDR and DEVG for thesame turbulence incidents.
This result should be expected since EDR is directly proportional to the stan-dard deviation of vertical acceleration over the measurement interval chosen;hence, for a ‘normal’ distribution, the extreme value will correlate closely with thepeak vertical gust (proportional to the peak deviation of vertical acceleration).Clearly, this relationship will not apply to a singular event falling outside theassumed distribution, and the EDR filter cut-off at 0.8 Hz might well unduly atten-uate very sharp gust events.
Although various sensors have been used in research aircraft for the measurementof relative humidity (or a related variable) no suitable sensor was widely availableat the time this Manual was prepared. A diode laser/solid state detector instrumentunder development in the United States (May, 1998) directly measuring watervapour mixing ratio, promises to measure to a few parts per million by volume.
The method is based on absorption of narrow band electromagnetic radia-tion by water vapour. The intensity of radiation at the detector is related to theemitted radiation by Beer’s law such that:
I = Ioexp(-kxp/po)
where:I = received signal;Io = transmitted signal;k = absorption coefficient;x = path length;p = concentration of water in the sensing volume; andpo = concentration of water vapour at standard temperature and pressure.Since Io, k, x and po are known properties of the system, the concentration ofwater in the sampling volume is measured and readily converted to water vapourmixing ratio (WVMR).
By folding the path length, it has been possible to fit the complete sensor in astandard aircraft temperature probe. Differential measurement techniques areemployed, largely overcoming drift in the measuring circuits.
As WVMR is conserved with adiabatic compression in the sensor probe, themeasured value is suitable for direct downlinking without knowledge of static ortotal air temperature. This is also convenient in numerical atmospheric modelsusing specific humidity (numerically almost indistinguishable from WVMR) as
6.1PRACTICAL CONSIDERATIONS
6.RELATIVE HUMIDITY
Relationship betweenEDR and DEVG
Measurement uncertainty
AMDAR REFERENCE MANUAL
15
Practical application
the input variable. Numerical analysis fields often require relative humidity as themoisture field variable. This is readily computed from WVMR if static air temper-ature and ambient pressure are known.
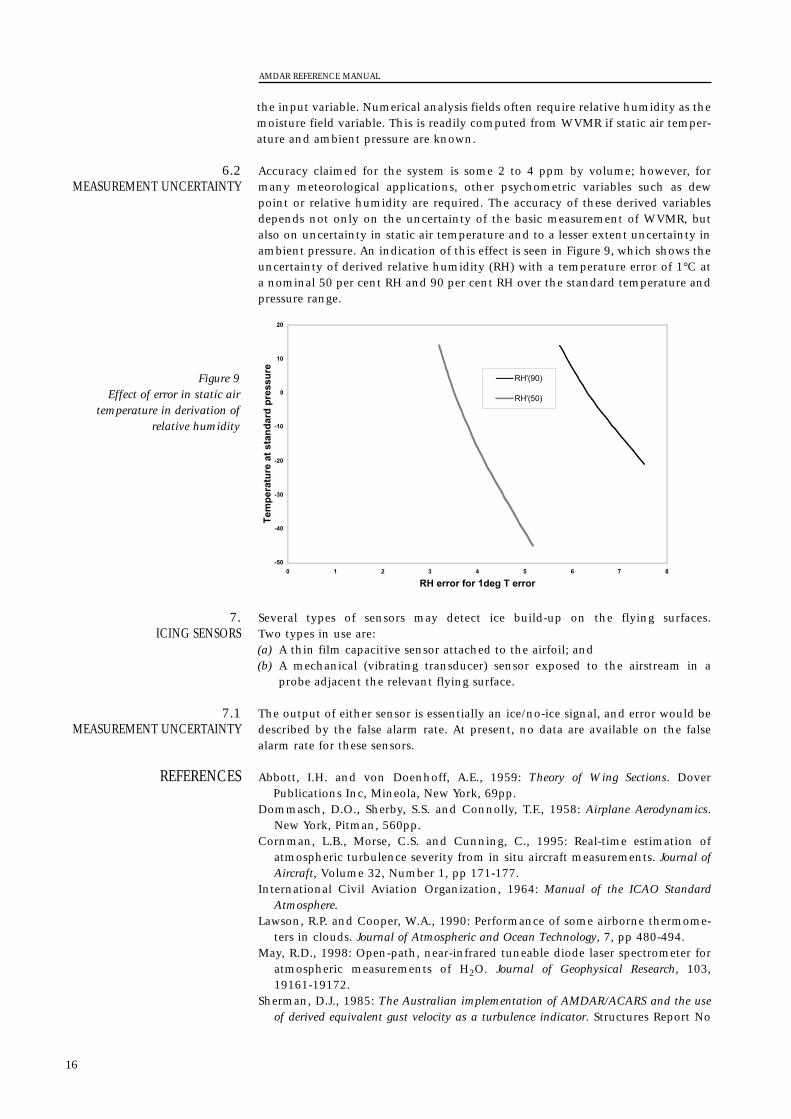
Accuracy claimed for the system is some 2 to 4 ppm by volume; however, formany meteorological applications, other psychometric variables such as dewpoint or relative humidity are required. The accuracy of these derived variablesdepends not only on the uncertainty of the basic measurement of WVMR, butalso on uncertainty in static air temperature and to a lesser extent uncertainty inambient pressure. An indication of this effect is seen in Figure 9, which shows theuncertainty of derived relative humidity (RH) with a temperature error of 1°C ata nominal 50 per cent RH and 90 per cent RH over the standard temperature andpressure range.
Several types of sensors may detect ice build-up on the flying surfaces. Two types in use are:(a) A thin film capacitive sensor attached to the airfoil; and(b) A mechanical (vibrating transducer) sensor exposed to the airstream in a
probe adjacent the relevant flying surface.
The output of either sensor is essentially an ice/no-ice signal, and error would bedescribed by the false alarm rate. At present, no data are available on the falsealarm rate for these sensors.
Abbott, I.H. and von Doenhoff, A.E., 1959: Theory of Wing Sections. DoverPublications Inc, Mineola, New York, 69pp.
Dommasch, D.O., Sherby, S.S. and Connolly, T.F., 1958: Airplane Aerodynamics.New York, Pitman, 560pp.
Cornman, L.B., Morse, C.S. and Cunning, C., 1995: Real-time estimation ofatmospheric turbulence severity from in situ aircraft measurements. Journal ofAircraft, Volume 32, Number 1, pp 171-177.
International Civil Aviation Organization, 1964: Manual of the ICAO StandardAtmosphere.
Lawson, R.P. and Cooper, W.A., 1990: Performance of some airborne thermome-ters in clouds. Journal of Atmospheric and Ocean Technology, 7, pp 480-494.
May, R.D., 1998: Open-path, near-infrared tuneable diode laser spectrometer foratmospheric measurements of H2O. Journal of Geophysical Research, 103,19161-19172.
Sherman, D.J., 1985: The Australian implementation of AMDAR/ACARS and the useof derived equivalent gust velocity as a turbulence indicator. Structures Report No
REFERENCES
7.1 MEASUREMENT UNCERTAINTY
7. ICING SENSORS
6.2 MEASUREMENT UNCERTAINTY
AMDAR REFERENCE MANUAL
16
-50
-40
-30
-20
-10
0
10
20
0 1 2 3 4 5 6 7 8
RH error for 1deg T error
Tem
per
atu
re a
t st
and
ard
pre
ssu
re
RH'(90)
RH'(50)
Figure 9Effect of error in static air
temperature in derivation ofrelative humidity

418, Department of Defence, Defence Science and Technology Organisation,Aeronautical Research Laboratories, Melbourne, Victoria.
Stickland, J.J., 1998: An Assessment of Two Algorithms for Automatic Measurementand Reporting of Turbulence from Commercial Public Transport Aircraft. A report tothe ICAO METLINK Study Group. Observations and Engineering Branch,Bureau of Meteorology, Melbourne.
World Meteorological Organization, 1995: Manual on Codes (WMO-No. 306),Volume 1 (Annex II to WMO Technical Regulations, (WMO-No. 49)),International Codes, Part A – Alphanumeric Codes.
AMDAR REFERENCE MANUAL
17

AMDAR REFERENCE MANUAL
18
APPENDIX II
AMDAR DOWNLINK DATA SPECIFICATIONS
This document contains specifications, recommended by the AMDAR Panel, formeteorological and related data, measured on board commercial aircraft, to berelayed to the ground in the form of individual observations or batches of obser-vations. The observation time and observation number uniquely identify eachobservation. The observation time is keyed to the basic measurements at a resolu-tion of one second. Requirement specifications for basic and other measurements,observation intervals and on-board processing are given in the following sections.These requirements are intended to be compatible where possible with ASDAR,E-AMDAR, ARINC 620 and other operational AMDAR specifications .
The following data are required to compile a meteorological report (observation)for automatic relay to a ground processing and data distribution network. Thedata are derived from the aircraft sensor and navigation data acquisition system,and further processed on board as appropriate.
3.1 Aircraft identifier shall comprise at least one of the following:(a) Tail number (element 1.1); or(b) Unique aircraft code (element 1.3).Note: Flight number (element 1.2) can be used for real-time applications but isnot suitable for data archiving or quality management.
3.2 Observation number (element 2), if included, shall be unique for an indi-vidual observation in any 24-hour period commencing at 00 UTC.
3. DETAILS OF ELEMENTS
Element Element Note 1 Note 2number
1 Aircraft identifier Section 3.1 M2 Observation number Section 3.2 O3 Phase of flight Section 3.3 M4 Latitude Table 1 and 3.4 M5 Longitude Table 1 and 3.5 M6 Day and time of observation Table 1 and 3.6 M7 Pressure altitude Table 1 and 3.7 M8 Static air temperature Table 1 and 3.8 M9 Humidity Table 2 and 3.9 O10 Wind direction Table 1 and 3.10 M11 Wind speed Table 1 and 3.11 M11a Maximum wind Table 2 and 3.11 M12 Turbulence Table 2 and 3.12 O13 Icing Section 3.13 O
Note 1:Further details of each element are given in the appropriate section or table referenced.Table 1 comprises basic data (basic measurements) normally available without furtherprocessing from the aircraft systems.Table 2 comprises data requiring additional on-board processing.
Note 2:‘M’ denotes mandatory requirement.‘O’ denotes optional requirement.
2. DATA REQUIREMENTS
1. GENERAL
19
3.3 Phase of flight shall be identified as follows:
3.4 Latitude (element 4) shall be taken from the aircraft navigation system asspecified in Table 1.
3.5 Longitude (element 5) shall be taken from the aircraft navigation system asspecified in Table 1.
3.6 Day of month and time (element 6, UTC, as specified in Table 1), shall referto the time of observation of the basic measurements.
3.7 Pressure altitude (element 7 and Table 1) is the indicated height with analtimeter setting of 1013.25 hPa (29.921 in Hg) according to the ICAO standardatmosphere. The standard atmosphere assumes a linear decrease in temperaturewith height of 6.5°C per kilometre up to 11 kilometres, and a mean sea leveltemperature and pressure of 15°C and 1013.25hPa, respectively. From 11 kilome-tres to 20 kilometres the temperature is assumed constant at -56.5°C.
3.8 Static air temperature (element 8) shall be taken from the aircraft dataacquisition system as specified in Table 1.
3.9 Humidity (element 9), if available, shall be expressed as dewpoint, relativehumidity or water vapour mixing ratio as specified in Table 2 according to thedowlink format chosen.
3.10 Wind direction (element 10) shall be taken from the aircraft data acquisi-tion system as specified in Table 1.
3.11 Wind speed (element 11) shall be taken from the aircraft data acquisitionsystem as specified in Table 1. Maximum wind (element 11a) is defined as thehighest wind speed measured between routine observations and shall be reportedonly if the:(a) Aircraft is in level flight (element 3, see section 3.3), above 600 hPa
(14,000ft);(b) Maximum wind exceeds 60kt;(c) Maximum wind exceeds by at least 10kt the value of wind speed measured
at the previous routine observation; and(d) Maximum wind exceeds by at least 10kt the value of wind speed at the
subsequent routine observation.
Routine observations are defined in section 4 below.
Phase of flight Definition Notes
Unsteady Roll or pitch/roll above threshold 1, 2Ascent Pressure Altitude >100ft higher 3
than at previous observation and <20 000ft
Descent Pressure Altitude >100ft below 3previous observation and <20,000ft
Level Not in Ascent/Descent phase
Notes:1. Phase of flight shall be assumed unsteady if roll angle exceeds 5° or roll and pitch
both exceed 3°.2. Unsteady and other flight phases may co-exist.3. The value 20 000ft is the nominal value. This can be changed according to typical
flight envelope (typically 15 000ft to 25 000ft). For simplicity, the nominal value isretained in this Appendix for describing reporting according to flight phase (Par. 4).
AMDAR REFERENCE MANUAL
20
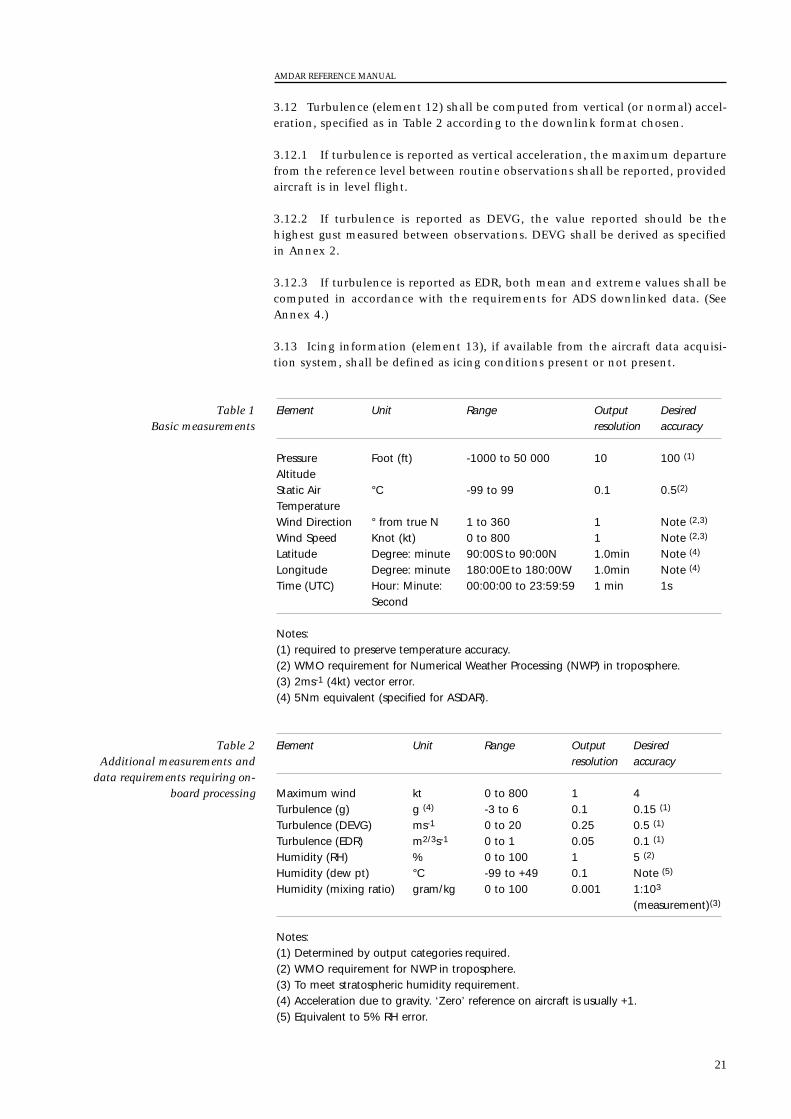
3.12 Turbulence (element 12) shall be computed from vertical (or normal) accel-eration, specified as in Table 2 according to the downlink format chosen.
3.12.1 If turbulence is reported as vertical acceleration, the maximum departurefrom the reference level between routine observations shall be reported, providedaircraft is in level flight.
3.12.2 If turbulence is reported as DEVG, the value reported should be thehighest gust measured between observations. DEVG shall be derived as specifiedin Annex 2.
3.12.3 If turbulence is reported as EDR, both mean and extreme values shall becomputed in accordance with the requirements for ADS downlinked data. (SeeAnnex 4.)
3.13 Icing information (element 13), if available from the aircraft data acquisi-tion system, shall be defined as icing conditions present or not present.
Element Unit Range Output Desired resolution accuracy
Maximum wind kt 0 to 800 1 4Turbulence (g) g (4) -3 to 6 0.1 0.15 (1)
Turbulence (DEVG) ms-1 0 to 20 0.25 0.5 (1)
Turbulence (EDR) m2/3s-1 0 to 1 0.05 0.1 (1)
Humidity (RH) % 0 to 100 1 5 (2)
Humidity (dew pt) °C -99 to +49 0.1 Note (5)
Humidity (mixing ratio) gram/kg 0 to 100 0.001 1:103
(measurement)(3)
Notes:(1) Determined by output categories required.(2) WMO requirement for NWP in troposphere.(3) To meet stratospheric humidity requirement.(4) Acceleration due to gravity. ‘Zero’ reference on aircraft is usually +1.(5) Equivalent to 5% RH error.
Table 2 Additional measurements and
data requirements requiring on-board processing
Element Unit Range Output Desired resolution accuracy
Pressure Foot (ft) -1000 to 50 000 10 100 (1)
AltitudeStatic Air °C -99 to 99 0.1 0.5(2)
TemperatureWind Direction ° from true N 1 to 360 1 Note (2,3)
Wind Speed Knot (kt) 0 to 800 1 Note (2,3)
Latitude Degree: minute 90:00S to 90:00N 1.0min Note (4)
Longitude Degree: minute 180:00E to 180:00W 1.0min Note (4)
Time (UTC) Hour: Minute: 00:00:00 to 23:59:59 1 min 1sSecond
Notes:(1) required to preserve temperature accuracy.(2) WMO requirement for Numerical Weather Processing (NWP) in troposphere.(3) 2ms-1 (4kt) vector error.(4) 5Nm equivalent (specified for ASDAR).
Table 1 Basic measurements
AMDAR REFERENCE MANUAL
21
4.1 Observations intervals are determined according to flight phase as follows:(a) Level Flight (en-route or cruise): Routine observations (see 4.2) shall be
made. In addition, if a ‘maximum wind event’ has occurred, an observationcontaining all the elements of a routine observation shall be made at thetime of occurrence of the maximum wind event. The first observation shallbe made when the level flight phase is entered.
(b) Ascent: Observations at target pressures or target time intervals, accordingto height above the take-off aerodrome or time from take-off, as appropri-ate, shall be made. In addition, if not disabled, routine observations shall bemade. Measurements shall commence at take-off or when the true airspeedexceeds 100kt.
(i) Pressure interval selection:The take-off pressure (Pref) shall be referenced to the pressure altitude attake-off and converted to hPa, according to the ICAO standard atmosphere.Pref is calculated from pressure altitude (h) as follows:
Pref = 1.0133×10³(1-6.8756×10⁻⁶h)5.2559
The target pressure intervals are as follows:The first observation shall be made when calculated pressure (P1) falls to thenearest multiple of 10hPa (or 5hPa if desired) below the reference pressure.For example, if Pref = 1002.5hPa, P1 = 1000hPa.
The next nine observations are made at 10 hPa intervals (or 19 at 5hPaintervals if 5hPa intervals is selected). For example, as in the above exampleat 990, 980, 970, 960, 950, 940, 930, 920 and 910 hPa.
The next (11th) observation is made at the nearest multiple of 50hPa belowthe 10th target pressure. For example, at 900hPa (or 25hPa intervals afterthe 20th 5hPa sample if so selected).
Subsequent observations are made at 50hPa (or 25hPa) intervals until thetop of the climb phase is reached (pressure altitude, element 7, exceeds 20 000ft (467.7hPa)). For example, at 850, 800, 750, 700, 650, 600, 550, 500and 450hPa. A table giving the equivalent pressure altitudes for all relevantpressure levels is given in Annex 1.
(ii) Time interval selection:If ascent observation intervals are selected by time (from take-off), it is desir-able that two climb phases should apply, consisting of a first phase at highresolution and a second phase at lower resolution until level flight phase isreached. Intervals shall be preset or selected by uplink command. Thismethod of selection applies to ARINC 620 format described in Annex 3.
(c) Descent: Observations shall be made at target pressures according to pres-sure altitude and height above the terminal aerodrome or at target timeintervals. In addition, if not disabled, routine observations shall be made.
(i) Pressure interval selection:The first observation shall be made when the aircraft passes through the500hPa level. The second and subsequent observations shall be made atintervals of 50 hPa (or 25hPa) until the aircraft lands. On passing throughthe 700hPa level, additional observations shall be made at 10hPa intervals(or 5hPa intervals) until the aircraft lands. On landing, the 10 most recent10hPa observations (or 20 most recent 5hPa observations) shall be retainedand any duplicates eliminated. The descent profile shall thus contain, atleast, a series of samples at 50 hPa (25hPa) intervals followed by 10 samplesat 10hPa (5hPa) intervals representing the lowest 100hPa above the
4. OBSERVATION INTERVALS
AMDAR REFERENCE MANUAL
22
terminal airfield. In the absence of an alternative indication, the aircraftwill be assumed to have landed when the true airspeed falls below 100kt.
(ii) Time interval selection:Observations shall be made at fixed time intervals, either preset or selec-table by uplink command. This method of selection applies to ARINC 620format described in Annex 3.
(Note: ARINC 620 format is in the process of being amended (November2001) to allow pressure or time interval selection for profile data. Pressureintervals of 5 or 10hPa and 25 or 50 hPa will be selectable.)
4.2 When routine observations are selected, they shall be made at set intervalsbetween three and 60 minutes. The interval chosen may be preset or adjustableby uplink command. The start of the time interval between successive routineobservations shall be reset when observations are made for any reason, exceptmaximum wind observations (e.g. during climb and descent phase). Thus, themaximum time between successive observations will be determined by the presetinterval for routine observations. The contents of routine, ascent and descentobservations are given in Tables 3a and 3b.
5.1 A message may consist of one or more observations according to a presetprogramme or by uplink command. A typical message will consist of at least 10observations.
5.2 Each observation shall be formed as follows:(a) Check for maximum wind conditions. Store maximum wind observation
keyed to time of occurrence of maximum wind. (b) At target time or when passing through a target height, read observational
data keyed to time that target was reached:(i) Establish flight phase;(ii) Check maximum wind conditions and discard stored observation if
wind speed is equal to or greater than stored value(Note: Observation is no longer ‘max wind’ observation);
(iii) Reset routine time interval;(iv) Store observation; and(v) Discard oldest 10hPa (5hPa if selected) descent phase observation if
number stored is greater than 10 (20 if 5hPa intervals selected).
The above actions shall be taken at intervals not greater than one second.
5.3 Batching observations:Observations are usually batched according to requirements for real-time
applications. Thus, if feasible, profile observations (ascent and descent) are down-linked as single messages. (See, for example, ARINC 620 format). Limitationsimposed by some communications management units can restrict the number ofcharacters in a single message and in these cases more than one message may benecessary to downlink a single profile. En-route data are usually accumulated andtransmitted to the ground at intervals not greater than one hour, however onlong-haul flights over water, it is not unusual to be outside VHF ground stationcoverage. For most real-time applications, delays of up to three hours in datareception are acceptable, hence data to be transmitted by VHF data link can bestored on board for at least three hours before establishing a ground link and stillbe considered useful in real-time applications. Longer delays can be tolerated fornon-real time use. These problems can be avoided by the use of satellite data link,but this incurs significantly higher communications charges than VHF data link.
5. FORMING A MESSAGE
AMDAR REFERENCE MANUAL
23
6.1 In order to ensure, as far as possible, that observations consist of data ofacceptable quality, it is desirable to carry out a simple set of checks on eachelement to be reported. The recommended minimal level of checking is as follows:(a) Gross error check:
Data values falling outside the ‘range’ intervals given in Tables 1 and 2 oralready flagged in the aircraft data acquisition system shall be replaced byvalues representing missing or erroneous data as specified in the downlinkcode form chosen.
(b) Sequential check:On most modern aircraft, the data are updated several times per second andindividual samples may be smoothed and/or subjected to quality checks inthe avionics system. It is desirable that this process is standardized to ensureconsistency between observations from different data acquisition anddifferent on-board computing systems. The recommended procedures areoutlined below:(i) To remove ‘spikes’ from noisy data, a sequential quality check
can be employed. This check is especially important when amaximum value is to be observed (e.g. maximum wind). A suit-able algorithm is given in Annex 5.
(ii) Data should be smoothed as shown in the table below to reducerandom error and standardize representativeness.
6.2 Additional Quality Checks
6.2.1 Most aircraft carry multiple sensor arrays (e.g. up to four temperatureprobes and at least two pitot-static heads. Thus it is possible to make more sophis-ticated checks by comparing data with the alternative sensor or sensors.
6.2.2 Because the measured elements are highly interdependent, it is possible toflag doubtful data computed from two or more basic measurements. For example,if comparison checks show that static air temperature is doubtful, then windspeed and wind direction can be flagged as doubtful.
7. DOWNLINK FORMATS 7.1 AMDAR panel format (APF)
7.1.1 This format is designed to be compatible with WMO AMDAR charactercode (FM 42-XI Ext), ARINC 620 and ADS ‘met-info’ reports. APF as shown inTable 3a is a generic format intended to provide a basis for downlink encoding.Use of all the group identifiers would not be efficient for the air-ground link,however various methods for reducing message length can be utilized and exam-ples are provided in paragraph 7.1.4 below. For cross-comparison purposes, theequivalent FM 42-XI Ext, ARINC 620 and ADS formats are shown for eachelement. For ARINC 620 and ADS, downlink codes refer to the appropriatedetailed descriptions in Annex 3 and Annex 4 respectively.
Element Averaging Time(s)Ascent/descent phase Level flight phase,> 20 000ft
7 Pressure altitude 10s 30s8 Static air temperature 10s 30s9 Humidity,RH 10s 30s10 Wind direction 10s 30s11 Wind speed 10s 30s
Note: The smoothing time is the arithmetic averaging time to be applied. An alternative,continuous, exponential smoothing function with time constant 3s or10s respec-tively can be used. A suitable algorithm for this function is given in Annex 6.
6. DATA QUALITY CONTROL
AMDAR REFERENCE MANUAL
24
AMDAR REFERENCE MANUAL
25
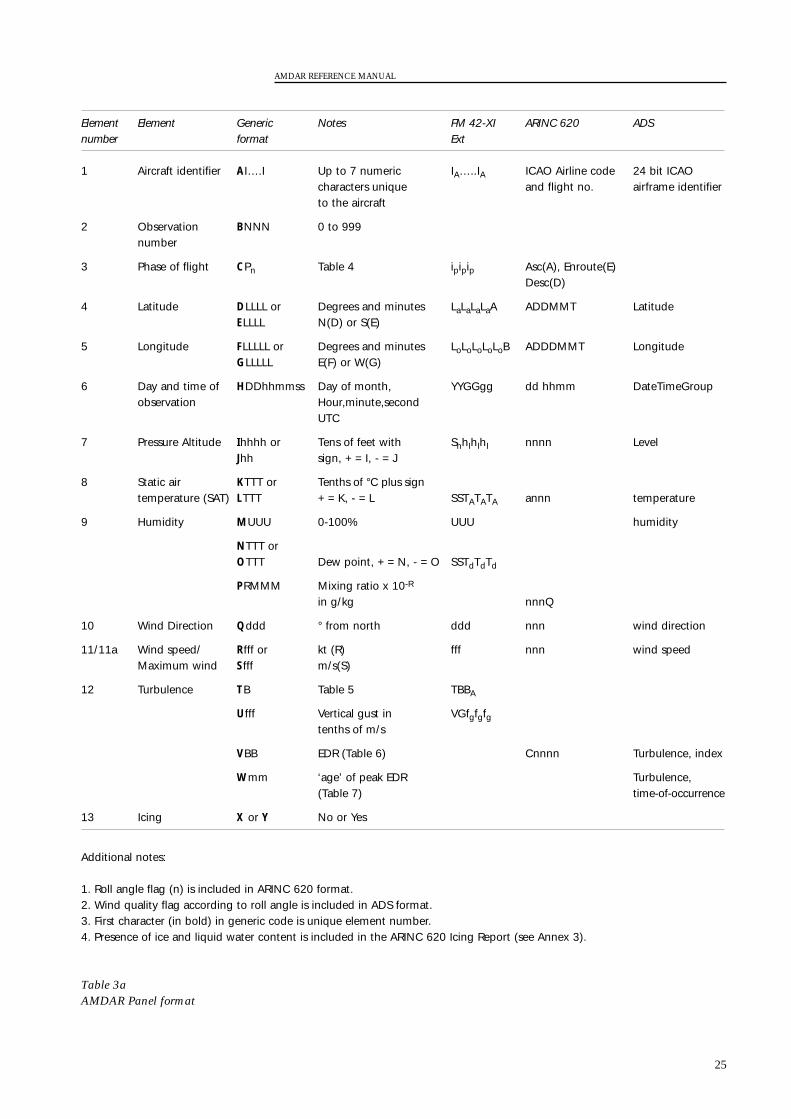
Element Element Generic Notes FM 42-XI ARINC 620 ADSnumber format Ext
1 Aircraft identifier AI….I Up to 7 numeric IA…..IA ICAO Airline code 24 bit ICAOcharacters unique and flight no. airframe identifierto the aircraft
2 Observation BNNN 0 to 999number
3 Phase of flight CPn Table 4 ipipip Asc(A), Enroute(E)Desc(D)
4 Latitude DLLLL or Degrees and minutes LaLaLaLaA ADDMMT LatitudeELLLL N(D) or S(E)
5 Longitude FLLLLL or Degrees and minutes LoLoLoLoLoB ADDDMMT LongitudeGLLLLL E(F) or W(G)
6 Day and time of HDDhhmmss Day of month, YYGGgg dd hhmm DateTimeGroupobservation Hour,minute,second
UTC
7 Pressure Altitude Ihhhh or Tens of feet with ShhIhIhI nnnn LevelJhh sign, + = I, - = J
8 Static air KTTT or Tenths of °C plus signtemperature (SAT) LTTT + = K, - = L SSTATATA annn temperature
9 Humidity MUUU 0-100% UUU humidity
NTTT orOTTT Dew point, + = N, - = O SSTdTdTd
PRMMM Mixing ratio x 10-R
in g/kg nnnQ
10 Wind Direction Qddd ° from north ddd nnn wind direction
11/11a Wind speed/ Rfff or kt (R) fff nnn wind speedMaximum wind Sfff m/s(S)
12 Turbulence TB Table 5 TBBA
Ufff Vertical gust in VGfgfgfgtenths of m/s
VBB EDR (Table 6) Cnnnn Turbulence, index
Wmm ‘age’ of peak EDR Turbulence, (Table 7) time-of-occurrence
13 Icing X or Y No or Yes
Additional notes:
1. Roll angle flag (n) is included in ARINC 620 format.2. Wind quality flag according to roll angle is included in ADS format.3. First character (in bold) in generic code is unique element number.4. Presence of ice and liquid water content is included in the ARINC 620 Icing Report (see Annex 3).
Table 3aAMDAR Panel format
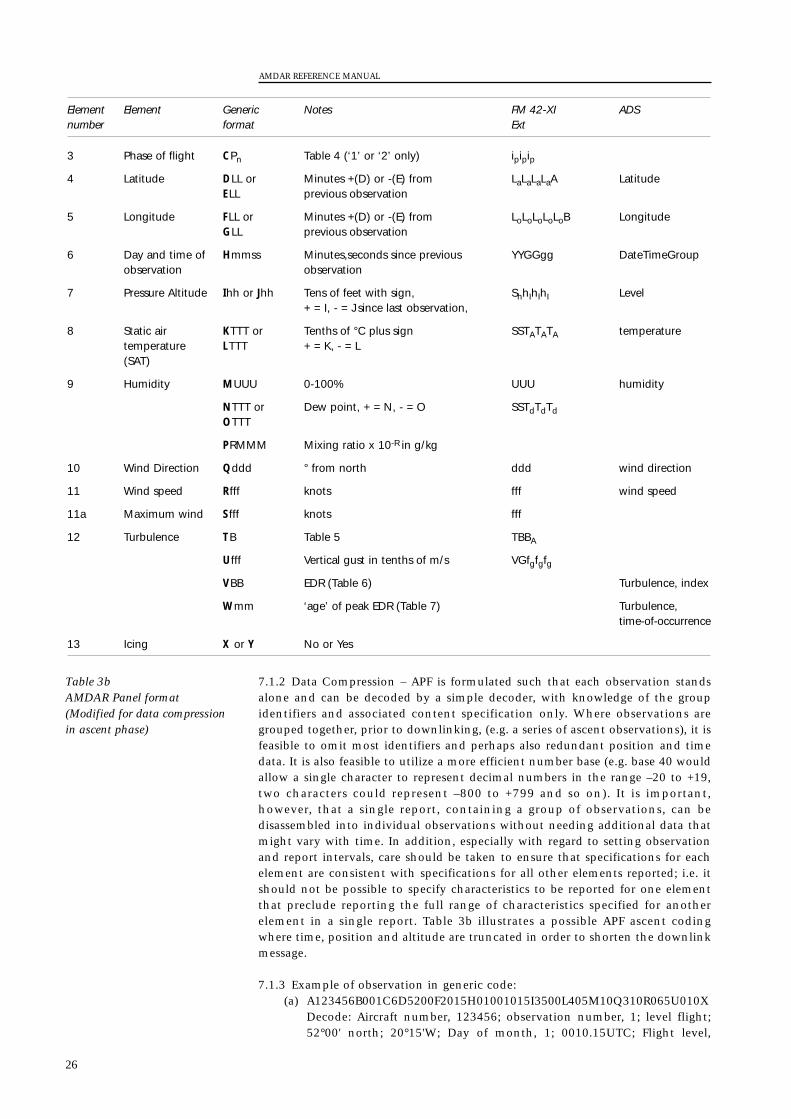
7.1.2 Data Compression – APF is formulated such that each observation standsalone and can be decoded by a simple decoder, with knowledge of the groupidentifiers and associated content specification only. Where observations aregrouped together, prior to downlinking, (e.g. a series of ascent observations), it isfeasible to omit most identifiers and perhaps also redundant position and timedata. It is also feasible to utilize a more efficient number base (e.g. base 40 wouldallow a single character to represent decimal numbers in the range –20 to +19,two characters could represent –800 to +799 and so on). It is important,however, that a single report, containing a group of observations, can bedisassembled into individual observations without needing additional data thatmight vary with time. In addition, especially with regard to setting observationand report intervals, care should be taken to ensure that specifications for eachelement are consistent with specifications for all other elements reported; i.e. itshould not be possible to specify characteristics to be reported for one elementthat preclude reporting the full range of characteristics specified for anotherelement in a single report. Table 3b illustrates a possible APF ascent codingwhere time, position and altitude are truncated in order to shorten the downlinkmessage.
7.1.3 Example of observation in generic code:(a) A123456B001C6D5200F2015H01001015I3500L405M10Q310R065U010X
Decode: Aircraft number, 123456; observation number, 1; level flight;52°00' north; 20°15'W; Day of month, 1; 0010.15UTC; Flight level,
AMDAR REFERENCE MANUAL
26
Element Element Generic Notes FM 42-XI ADSnumber format Ext
3 Phase of flight CPn Table 4 (‘1’ or ‘2’ only) ipipip
4 Latitude DLL or Minutes +(D) or -(E) from LaLaLaLaA LatitudeELL previous observation
5 Longitude FLL or Minutes +(D) or -(E) from LoLoLoLoLoB LongitudeGLL previous observation
6 Day and time of Hmmss Minutes,seconds since previous YYGGgg DateTimeGroupobservation observation
7 Pressure Altitude Ihh or Jhh Tens of feet with sign, ShhIhIhI Level+ = I, - = J since last observation,
8 Static air KTTT or Tenths of °C plus sign SSTATATA temperaturetemperature LTTT + = K, - = L(SAT)
9 Humidity MUUU 0-100% UUU humidity
NTTT or Dew point, + = N, - = O SSTdTdTdOTTT
PRMMM Mixing ratio x 10-R in g/kg
10 Wind Direction Qddd ° from north ddd wind direction
11 Wind speed Rfff knots fff wind speed
11a Maximum wind Sfff knots fff
12 Turbulence TB Table 5 TBBA
Ufff Vertical gust in tenths of m/s VGfgfgfg
VBB EDR (Table 6) Turbulence, index
Wmm ‘age’ of peak EDR (Table 7) Turbulence, time-of-occurrence
13 Icing X or Y No or Yes
Table 3bAMDAR Panel format(Modified for data compressionin ascent phase)
35 000ft; SAT, -40.5°C; RH, 10%; Wind direction, 310°; Wind speed, 65kt;Equivalent vertical gust, 1.0m/s; no icing.
(b) Example of minimized ascent message coded as in table 3b, where dataidentifiers are omitted after first observation. For the first line, the obser-vation number is replaced by the number of observations in the message,coded BNN where NN is 0 to 99:A2123456B10C2D5145G0045H19073100I0000L013Q097R0062 00 02 0015 10 L010 114 0022 00 00 0015 20 L002 097 003(For clarity, each observation here is allocated a new line and omittedindicators shown as spaces.)
(c) Example of ascent message with leading zeroes suppressed and all indi-cators included:A2123456B10C2D5145G45H19073100I0L13Q97R6C2D0G2H15I10L10Q114R2C2D0G0H15I20L2 Q97R3
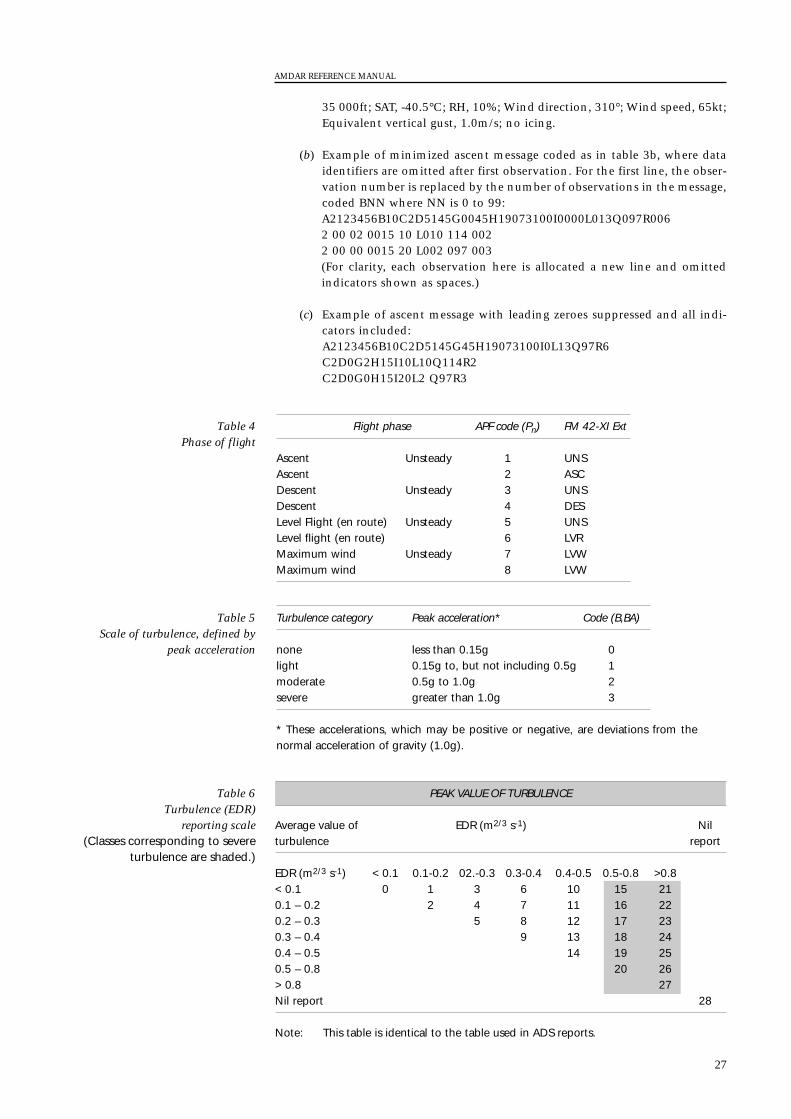
Turbulence category Peak acceleration* Code (B,BA)
none less than 0.15g 0light 0.15g to, but not including 0.5g 1moderate 0.5g to 1.0g 2severe greater than 1.0g 3
* These accelerations, which may be positive or negative, are deviations from thenormal acceleration of gravity (1.0g).
Table 5Scale of turbulence, defined by
peak acceleration
Flight phase APF code (Pn) FM 42-XI Ext
Ascent Unsteady 1 UNSAscent 2 ASCDescent Unsteady 3 UNSDescent 4 DESLevel Flight (en route) Unsteady 5 UNSLevel flight (en route) 6 LVRMaximum wind Unsteady 7 LVWMaximum wind 8 LVW
Table 4Phase of flight
AMDAR REFERENCE MANUAL
27
PEAK VALUE OF TURBULENCE
Average value of EDR (m2/3 s-1) Nil turbulence report
EDR (m2/3 s-1) < 0.1 0.1-0.2 02.-0.3 0.3-0.4 0.4-0.5 0.5-0.8 >0.8< 0.1 0 1 3 6 10 15 210.1 – 0.2 2 4 7 11 16 220.2 – 0.3 5 8 12 17 230.3 – 0.4 9 13 18 240.4 – 0.5 14 19 250.5 – 0.8 20 26> 0.8 27Nil report 28
Note: This table is identical to the table used in ADS reports.
Table 6Turbulence (EDR)
reporting scale(Classes corresponding to severe
turbulence are shaded.)
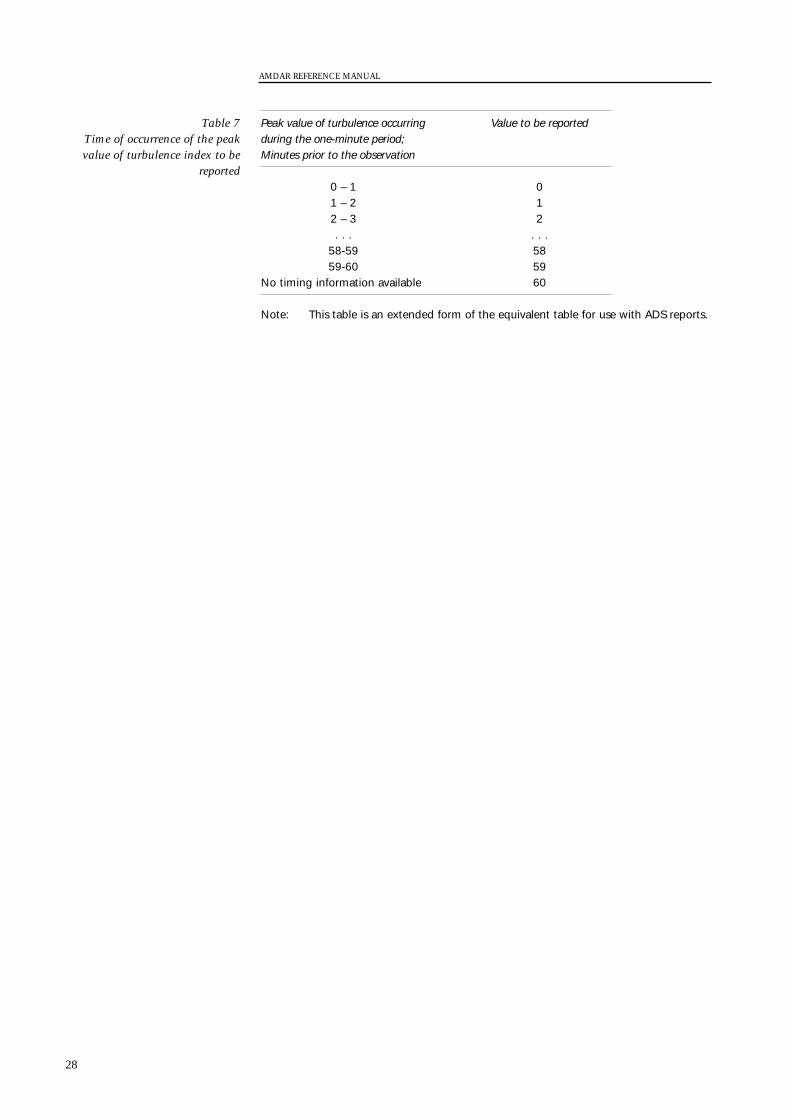
Peak value of turbulence occurring Value to be reportedduring the one-minute period;Minutes prior to the observation
0 – 1 01 – 2 12 – 3 2. . . . . .
58-59 5859-60 59
No timing information available 60
Note: This table is an extended form of the equivalent table for use with ADS reports.
Table 7Time of occurrence of the peakvalue of turbulence index to be
reported
AMDAR REFERENCE MANUAL
28
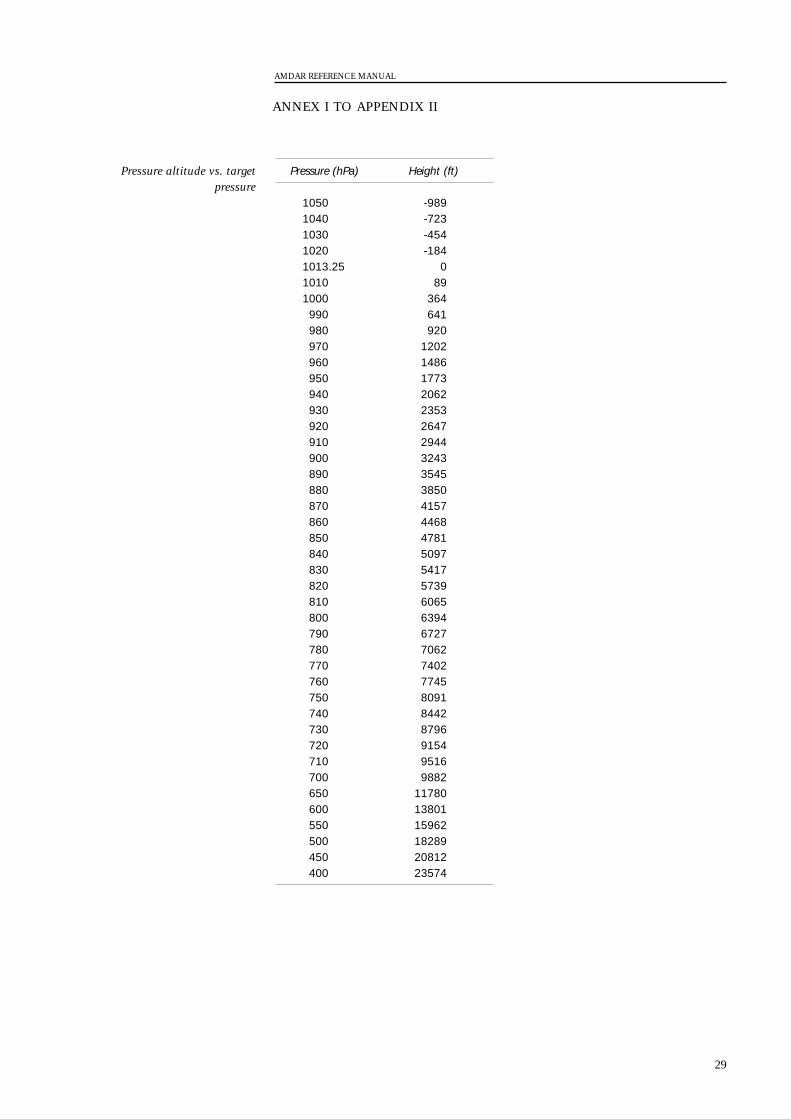
ANNEX I TO APPENDIX II
Pressure altitude vs. targetpressure
AMDAR REFERENCE MANUAL
29
Pressure (hPa) Height (ft)
1050 -9891040 -7231030 -4541020 -1841013.25 01010 891000 364990 641980 920970 1202960 1486950 1773940 2062930 2353920 2647910 2944900 3243890 3545880 3850870 4157860 4468850 4781840 5097830 5417820 5739810 6065800 6394790 6727780 7062770 7402760 7745750 8091740 8442730 8796720 9154710 9516700 9882650 11780600 13801550 15962500 18289450 20812400 23574
ANNEX II TO APPENDIX II
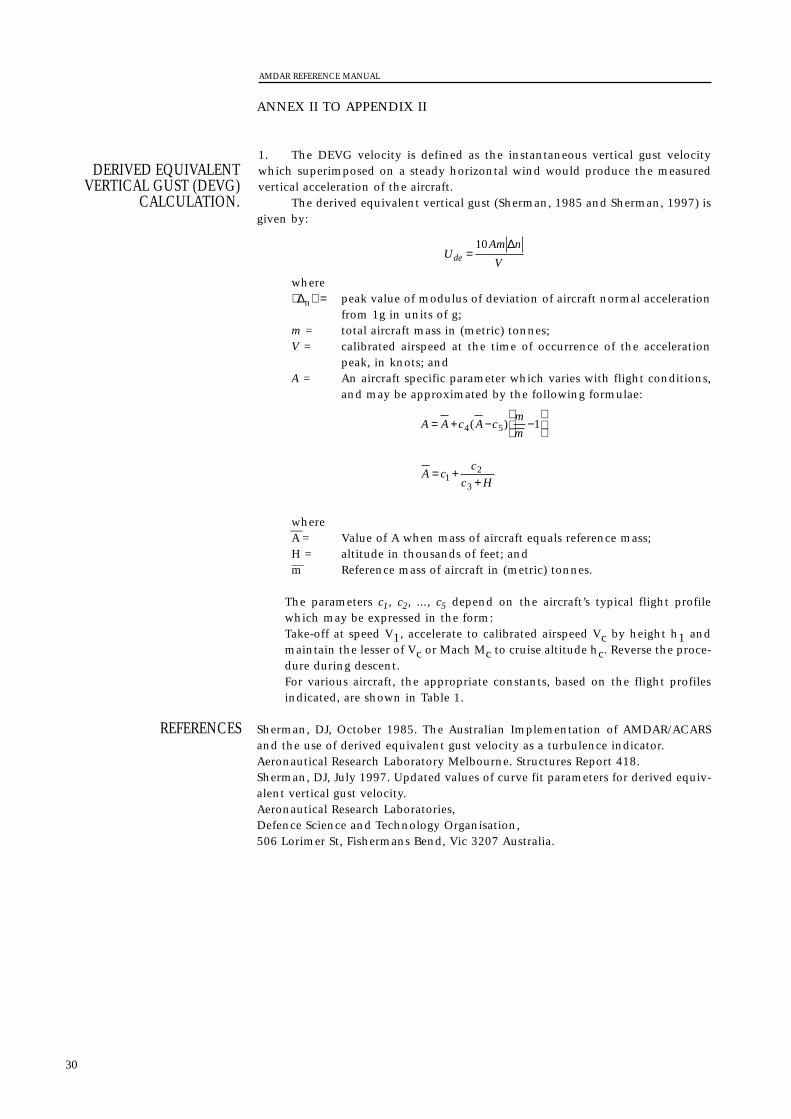
1. The DEVG velocity is defined as the instantaneous vertical gust velocitywhich superimposed on a steady horizontal wind would produce the measuredvertical acceleration of the aircraft.
The derived equivalent vertical gust (Sherman, 1985 and Sherman, 1997) isgiven by:
where∆ n = peak value of modulus of deviation of aircraft normal acceleration
from 1g in units of g;m = total aircraft mass in (metric) tonnes;V = calibrated airspeed at the time of occurrence of the acceleration
peak, in knots; andA = An aircraft specific parameter which varies with flight conditions,
and may be approximated by the following formulae:
whereA—
= Value of A when mass of aircraft equals reference mass;H = altitude in thousands of feet; and—m Reference mass of aircraft in (metric) tonnes.
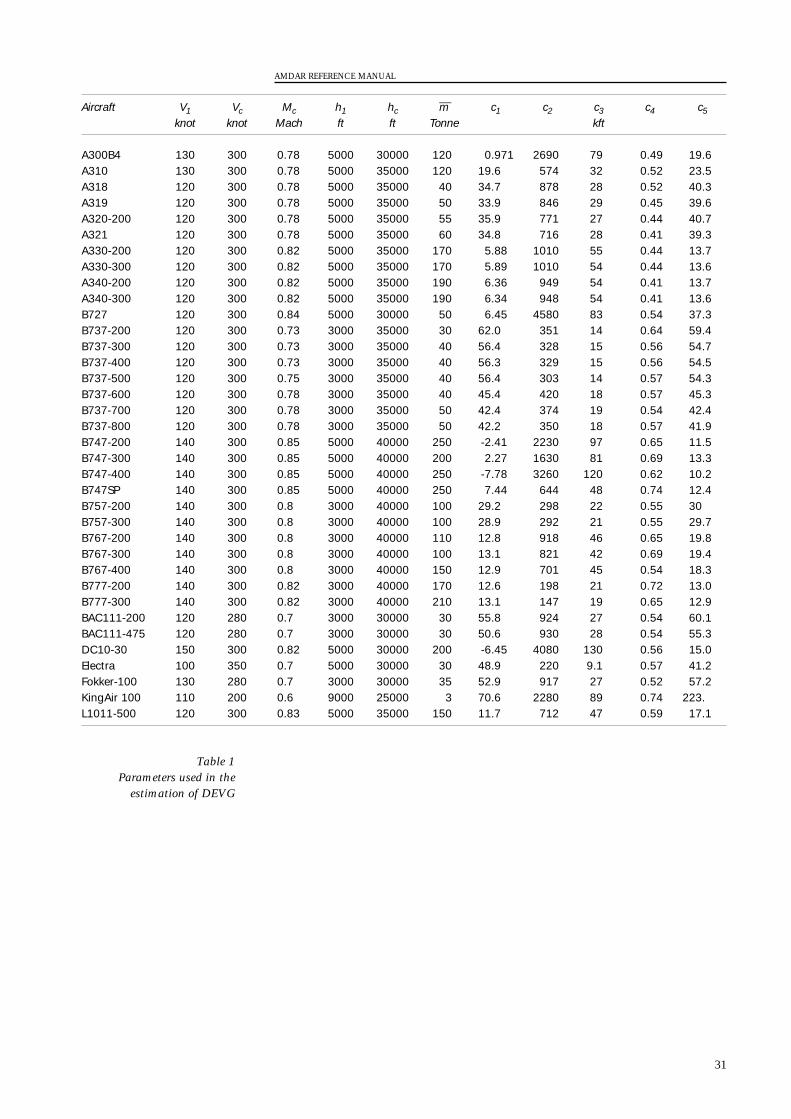
The parameters c1, c2, ..., c5 depend on the aircraft’s typical flight profilewhich may be expressed in the form:Take-off at speed V1, accelerate to calibrated airspeed Vc by height h1 andmaintain the lesser of Vc or Mach Mc to cruise altitude hc. Reverse the proce-dure during descent.For various aircraft, the appropriate constants, based on the flight profilesindicated, are shown in Table 1.
Sherman, DJ, October 1985. The Australian Implementation of AMDAR/ACARSand the use of derived equivalent gust velocity as a turbulence indicator.Aeronautical Research Laboratory Melbourne. Structures Report 418.Sherman, DJ, July 1997. Updated values of curve fit parameters for derived equiv-alent vertical gust velocity.Aeronautical Research Laboratories,Defence Science and Technology Organisation, 506 Lorimer St, Fishermans Bend, Vic 3207 Australia.
A cc
c H= +
+12
3
A A c A cm
m= + − −
4 5 1( )
UAm n
Vde =10 ∆
DERIVED EQUIVALENTVERTICAL GUST (DEVG)
CALCULATION.
AMDAR REFERENCE MANUAL
30
REFERENCES
AMDAR REFERENCE MANUAL
31
Aircraft V1 Vc Mc h1 hc—m c1 c2 c3 c4 c5
knot knot Mach ft ft Tonne kft
A300B4 130 300 0.78 5000 30000 120 0.971 2690 79 0.49 19.6A310 130 300 0.78 5000 35000 120 19.6 574 32 0.52 23.5A318 120 300 0.78 5000 35000 40 34.7 878 28 0.52 40.3A319 120 300 0.78 5000 35000 50 33.9 846 29 0.45 39.6A320-200 120 300 0.78 5000 35000 55 35.9 771 27 0.44 40.7A321 120 300 0.78 5000 35000 60 34.8 716 28 0.41 39.3A330-200 120 300 0.82 5000 35000 170 5.88 1010 55 0.44 13.7A330-300 120 300 0.82 5000 35000 170 5.89 1010 54 0.44 13.6A340-200 120 300 0.82 5000 35000 190 6.36 949 54 0.41 13.7A340-300 120 300 0.82 5000 35000 190 6.34 948 54 0.41 13.6B727 120 300 0.84 5000 30000 50 6.45 4580 83 0.54 37.3B737-200 120 300 0.73 3000 35000 30 62.0 351 14 0.64 59.4B737-300 120 300 0.73 3000 35000 40 56.4 328 15 0.56 54.7B737-400 120 300 0.73 3000 35000 40 56.3 329 15 0.56 54.5B737-500 120 300 0.75 3000 35000 40 56.4 303 14 0.57 54.3B737-600 120 300 0.78 3000 35000 40 45.4 420 18 0.57 45.3B737-700 120 300 0.78 3000 35000 50 42.4 374 19 0.54 42.4B737-800 120 300 0.78 3000 35000 50 42.2 350 18 0.57 41.9B747-200 140 300 0.85 5000 40000 250 -2.41 2230 97 0.65 11.5B747-300 140 300 0.85 5000 40000 200 2.27 1630 81 0.69 13.3B747-400 140 300 0.85 5000 40000 250 -7.78 3260 120 0.62 10.2B747SP 140 300 0.85 5000 40000 250 7.44 644 48 0.74 12.4B757-200 140 300 0.8 3000 40000 100 29.2 298 22 0.55 30B757-300 140 300 0.8 3000 40000 100 28.9 292 21 0.55 29.7B767-200 140 300 0.8 3000 40000 110 12.8 918 46 0.65 19.8B767-300 140 300 0.8 3000 40000 100 13.1 821 42 0.69 19.4B767-400 140 300 0.8 3000 40000 150 12.9 701 45 0.54 18.3B777-200 140 300 0.82 3000 40000 170 12.6 198 21 0.72 13.0B777-300 140 300 0.82 3000 40000 210 13.1 147 19 0.65 12.9BAC111-200 120 280 0.7 3000 30000 30 55.8 924 27 0.54 60.1BAC111-475 120 280 0.7 3000 30000 30 50.6 930 28 0.54 55.3DC10-30 150 300 0.82 5000 30000 200 -6.45 4080 130 0.56 15.0Electra 100 350 0.7 5000 30000 30 48.9 220 9.1 0.57 41.2Fokker-100 130 280 0.7 3000 30000 35 52.9 917 27 0.52 57.2KingAir 100 110 200 0.6 9000 25000 3 70.6 2280 89 0.74 223.L1011-500 120 300 0.83 5000 35000 150 11.7 712 47 0.59 17.1
Table 1Parameters used in the
estimation of DEVG
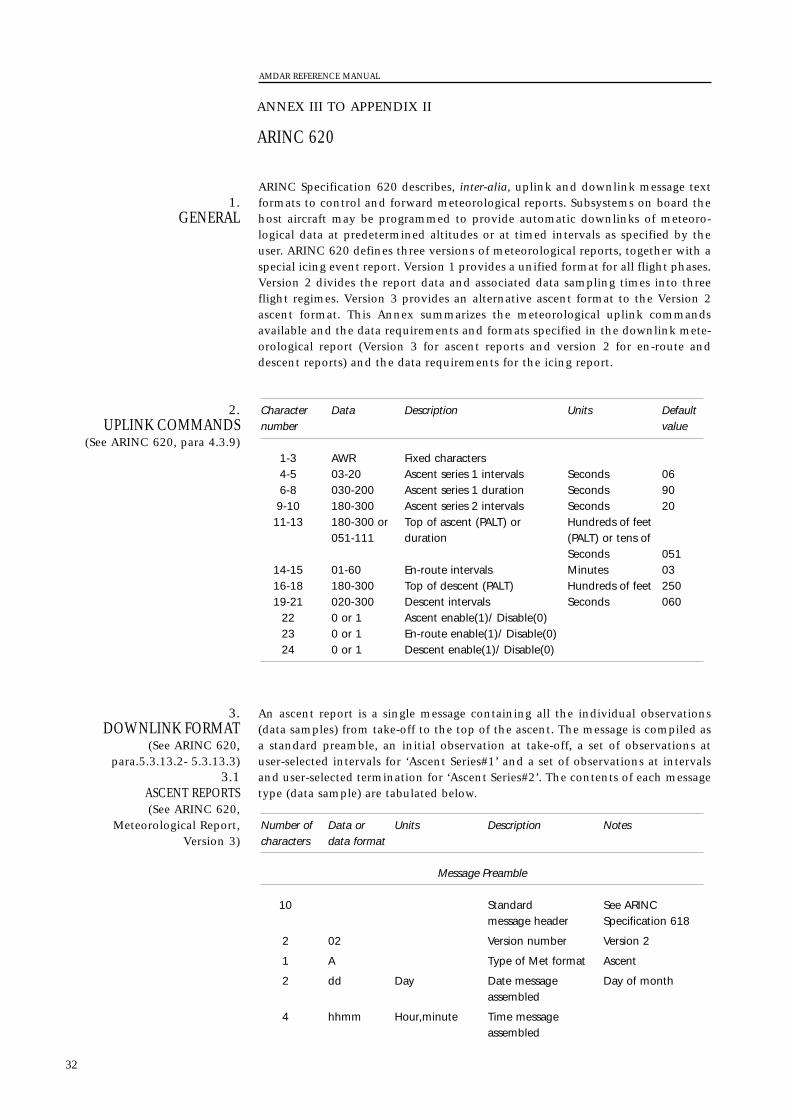
ANNEX III TO APPENDIX II
ARINC 620
ARINC Specification 620 describes, inter-alia, uplink and downlink message textformats to control and forward meteorological reports. Subsystems on board thehost aircraft may be programmed to provide automatic downlinks of meteoro-logical data at predetermined altitudes or at timed intervals as specified by theuser. ARINC 620 defines three versions of meteorological reports, together with aspecial icing event report. Version 1 provides a unified format for all flight phases.Version 2 divides the report data and associated data sampling times into threeflight regimes. Version 3 provides an alternative ascent format to the Version 2ascent format. This Annex summarizes the meteorological uplink commandsavailable and the data requirements and formats specified in the downlink mete-orological report (Version 3 for ascent reports and version 2 for en-route anddescent reports) and the data requirements for the icing report.
An ascent report is a single message containing all the individual observations(data samples) from take-off to the top of the ascent. The message is compiled asa standard preamble, an initial observation at take-off, a set of observations atuser-selected intervals for ‘Ascent Series#1’ and a set of observations at intervalsand user-selected termination for ‘Ascent Series#2’. The contents of each messagetype (data sample) are tabulated below.
Number of Data or Units Description Notescharacters data format
Message Preamble
10 Standard See ARINCmessage header Specification 618
2 02 Version number Version 2
1 A Type of Met format Ascent
2 dd Day Date message Day of monthassembled
4 hhmm Hour,minute Time message assembled
3.DOWNLINK FORMAT
(See ARINC 620,para.5.3.13.2- 5.3.13.3)
3.1ASCENT REPORTS (See ARINC 620,
Meteorological Report,Version 3)
Character Data Description Units Default number value
1-3 AWR Fixed characters4-5 03-20 Ascent series 1 intervals Seconds 066-8 030-200 Ascent series 1 duration Seconds 909-10 180-300 Ascent series 2 intervals Seconds 2011-13 180-300 or Top of ascent (PALT) or Hundreds of feet
051-111 duration (PALT) or tens of Seconds 051
14-15 01-60 En-route intervals Minutes 0316-18 180-300 Top of descent (PALT) Hundreds of feet 25019-21 020-300 Descent intervals Seconds 060
22 0 or 1 Ascent enable(1)/ Disable(0)23 0 or 1 En-route enable(1)/ Disable(0)24 0 or 1 Descent enable(1)/ Disable(0)
2.UPLINK COMMANDS
(See ARINC 620, para 4.3.9)
1.GENERAL
AMDAR REFERENCE MANUAL
32
Number of Data or Units Description Notescharacters data format
Message Preamble (cont.)
4 xxxx Departure station 4-character code
4 xxxx Destination station 4-character code
2 ss Seconds Series #1 timeinterval
2 ss Seconds Series #2 timeinterval
Initial report
6 ADDMMT Degrees, Latitude A=’N’ or’S’minutes,tenths DD=degreesof minutes MM=minutes
T=tenths of minutes
7 ADDDMMT Degrees, Longitude A=’E’ or ‘W’minutes,tenths DDD=degreesof minutes MM=minutes
T=tenths of minutes
2 dd Day Date of observation Day of month
4 hhmm Hour,minute Time of observation
4 nnnn Tens of feet Pressure altitude
4 annn Tenths of °C Static air a=’P’ (plus) ortemperature a=’M’ (minus)
4 n1n2nQ Gram/kg WV mixing ratio Value = n1n2 x 10-n
g/kgQ=quality indicator(to be defined)
Series#1(repeated as defined by uplink command or to default duration)
4 nnnn Tens of feet Pressure altitude
4 annn Tenths of °C Static Air a=’P’ (plus) orTemperature a=’M’ (minus)
3 nnn Degrees true Wind Direction
3 nnn Knots Wind Speed
1 n Roll angle flag ‘B’ if roll angle > 5°otherwise ‘G’
4 n1n2nQ Gram/kg WV mixing ratio Value = n1n2 x 10-n
gram/kgQ = quality indicator(to be defined)
Delimiter
1 / Slash Character toindicate end ofseries#1 data andbeginning ofseries#2 data
AMDAR REFERENCE MANUAL
33
En-route data measurements commence at the conclusion of ascent datasampling and terminate when descent report measurements commence. Eachreport consists of a standard preamble plus six consecutive observations (datameasurement samples) at user-defined intervals by uplink command or at thedefault intervals. If ascent and descent reports are inhibited by uplink command,en-route reports commence at take off and continue to touchdown unless modi-fied by subsequent uplink command.
The contents of a single en-route report are tabulated below.
The preamble is followed by six observations (data samples) unless truncatedby entering the descent phase. The format for each observation is shown below.
Number of Data or Units Description Notescharacters data format
Message Preamble(repeated as defined by uplink command or to default duration)
10 Standard See ARINCmessage header Specification 618
2 02 Version number Version 21 E Type of Met format En-route2 dd Day Date message Day of month
Assembled4 xxxx Departure station 4-character code5 xxxx Destination station 4-character code
3.2ENROUTE REPORTS
(See ARINC 620,Meteorological Report,
Version 2)
Number of Data or Units Description Notescharacters data format
Series#2(repeated as defined by uplink command or to default duration)
6 ADDMMT Degrees, Latitude A=’N’ or’S’minutes, DD = degreestenths of MM = minutesminutes T = tenths of
minutes
7 ADDDMMT Degrees, Longitude A=’E’ or ‘W’minutes, DDD = degreestenths of MM = minutesminutes T = tenths of
minutes
4 nnnn Tens of feet Pressure altitude
4 annn Tenths of °C Static air a = ’P’ (plus) ortemperature a = ’M’ (minus)
3 nnn Degrees true Wind direction
3 nnn Knots Wind speed
1 n Roll angle flag ‘B’ if roll angle > 5°otherwise ‘G’
4 n1n2nQ Gram/kg WV mixing ratio Value = n1n2 x 10-n
gram/kgQ = quality indicator(to be defined)
AMDAR REFERENCE MANUAL
34
During the descent phase, reports are assembled after every 10 observations (datasamples). Descent sampling starts at the ‘top of the descent’ and at fixedintervals, both determined by uplink command or at the default values, andcontinues to touchdown. The final report is sent at touchdown and thus maycontain less than 10 observations. As for ascent and en-route reports, eachdescent report contains a standard preamble. The contents of a single downlinkreport are identical to the en-route format except that the ‘type of met format’ inthe preamble is coded ‘D’ and the turbulence report consists of one group ‘nnnn’where the first two hexadecimal characters represent the average of the
3.3DESCENT REPORTS
(See ARINC 620,Meteorological Report,
Version 2)
Number of Data or Units Description Notescharacters data format
Series#1 (enroute)(six data samples to format below at user-defined intervals by
uplink command or at default intervals)
6 ADDMMT Degrees, Latitude A=’N’ or’S’minutes, DD = degreestenths of MM = minutesminutes T = tenths of
minutes
7 ADDDMMT Degrees, Longitude A=’E’ or ‘W’minutes, DDD = degreestenths of MM = minutesminutes T = tenths of
minutes
4 hhmm Hours,minutes Time of observation
4 nnnn Tens of feet Pressure altitude
4 annn Tenths of °C Static Air a = ’P’ (plus) orTemperature a = ’M’ (minus)
3 nnn Degrees true Wind Direction
3 nnn Knots Wind Speed
1 n Roll angle flag ‘B’ if roll angle > 5°otherwise ‘G’
4 n1n2Q Gram/kg WV mixing ratio Value = n1n2 x 10-n
gram/kgQ = quality indicator(to be defined)
5 Cnnnn Turbulence See table below
Turbulence code
Value of C Meaning Content of nnnn Notes
Z Turbulence below No dataminimum threshold
Q Data error No data
n = 0 to 9 4n hex characters n1n2 = average(nnnn) follow n1n2n3n4 value of turbulence
metric. n3n4 = peak value ofturbulence metric,both over oneminute period.
AMDAR REFERENCE MANUAL
35
turbulence metric in the observation interval and the second two hexadecimalcharacters represent the peak turbulence in the observation interval.
4.1 When programmed to provide automatic icing reports, the followingreport is transmitted every 5 minutes for the duration of icing conditions.
Number of Data or Units Description Notescharacters data format
Icing Report
10 Standard message See ARINCheader Specification 618
2 01 Version Number Version 1
7 XXXxxxx Flight identifier Airline code andflight number
7 xxxxxxx Aircraft registration no
31 Data Sample 1 See table below
31 Data Sample 2 See table below
31 Data Sample 3 See table below
31 Data Sample 4 See table below
31 Data Sample 5 See table below
Icing Report — Content of data samples 1-5
6 ADDMMT Degrees, Latitude A=’N’ or’S’minutes, DD = degreestenths of MM = minutesminutes T = tenths of
minutes
7 ADDDMMT Degrees, Longitude A=’E’ or ‘W’minutes, DDD = degreestenths of MM = minutesminutes T = tenths of
minutes
6 ddhhmm Day, hours, Date/time of minutes(UTC) observation
4 Fnnn Hundreds of Flight level F = fixed characterfeet
4 AAnn °C Static air AA = ’PS’ (plus) ortemperature AA = ’MS’ (minus)
1 n Icing ‘0’ = no ice, ‘1’ =icing conditionspresent
2 nn 0.1gram/m3 Peak liquid water content
2 nn 0.1gram/m3 Average liquid water content
1 n Supercooled large ‘0’ = no SLD, ‘1’ = droplet (SLD) SLD conditionsconditions present
4.ICING REPORTS
(See ARINC 620,para 5.3.52)
AMDAR REFERENCE MANUAL
36
ANNEX IV TO APPENDIX II
AUTOMATIC REPORTING OF AIRCRAFT METEOROLOGICALOBSERVATIONS AS A METEOROLOGICAL SERVICE FORINTERNATIONAL AIR NAVIGATION.
1.1 Standards and Recommended Practices Relating to Meteorological Service forInternational Air Navigation are published in ICAO - Annex 3 to the Conventionon International Civil Aviation. Annex 3, Chapter 5 includes requirements foraircraft observations and reports both by voice and data link. The regulatory mate-rial contained in Annex 3 is, except for a few minor editorial differences, identicalwith that appearing in Technical Regulations (WMO-No. 49), [C.3.1], hereafterreferred to as [C.3.1].
1.2 This Annex deals with data and reporting requirements using digital datalink only. As appropriate, references are given to the relevant part, appendix andparagraph of [C.3.1]/Annex 3 and other related ICAO documents.
1.3 Meteorological reports by data link may be made as ‘routine air-reports’ atregular, pre-designated times or positions or as ‘special air-reports’ according toprescribed meteorological conditions encountered. Air-ground data link may beemployed whether or not Automatic Dependent Surveillance (ADS) is beingapplied, however the precise data formats and downlink codes depend on thereporting mode in use. The standards and recommended practices relating toboth modes of reporting are summarized in the following paragraphs.
2.1 Each contracting State is obliged to arrange, according to the provisions of Annex3, Chapter 5, for observations to be made by aircraft of its registry operating oninternational air routes as well as for the recording and reporting of these observations. [C.3.1]/Annex 3, Part I, 5.1
2.2 Observations required are:(a) Routine aircraft observations during en-route and climb-out phases of the
flight; and(b) Special and other non-routine aircraft observations during any phase of the
flight.[C.3.1]/Annex 3, Part I, 5.2
2.3 Observations are required to be reported during flight at the time the obser-vation is made or as soon thereafter as is practicable.[C.3.1]/Annex 3, Part I, 5.7.2
2.4 Selection of aircraft to make observations.2.4.1 For air routes with high-density air traffic (e.g. organized tracks), routineobservations are to be made by an aircraft from among the aircraft operating ateach flight level. The designation of aircraft, at approximately hourly intervals, issubject to regional air navigation agreement.[C.3.1]/Annex 3, Part I, 5.3.4
2.4.2 When routine observations are required during ascent, at each aerodrome,aircraft are required to be designated, at approximately hourly intervals, to makeroutine observations every 30 seconds for the first 10 minutes of the flight.[C.3.1]/Annex 3, Part I, 5.3.5
2.5. Special air-reports.2.5.1 All aircraft are required to make special observations whenever any of thefollowing conditions are encountered or observed:(a) Severe turbulence;
2.GENERAL REQUIREMENTS
1.INTRODUCTION
AMDAR REFERENCE MANUAL
37
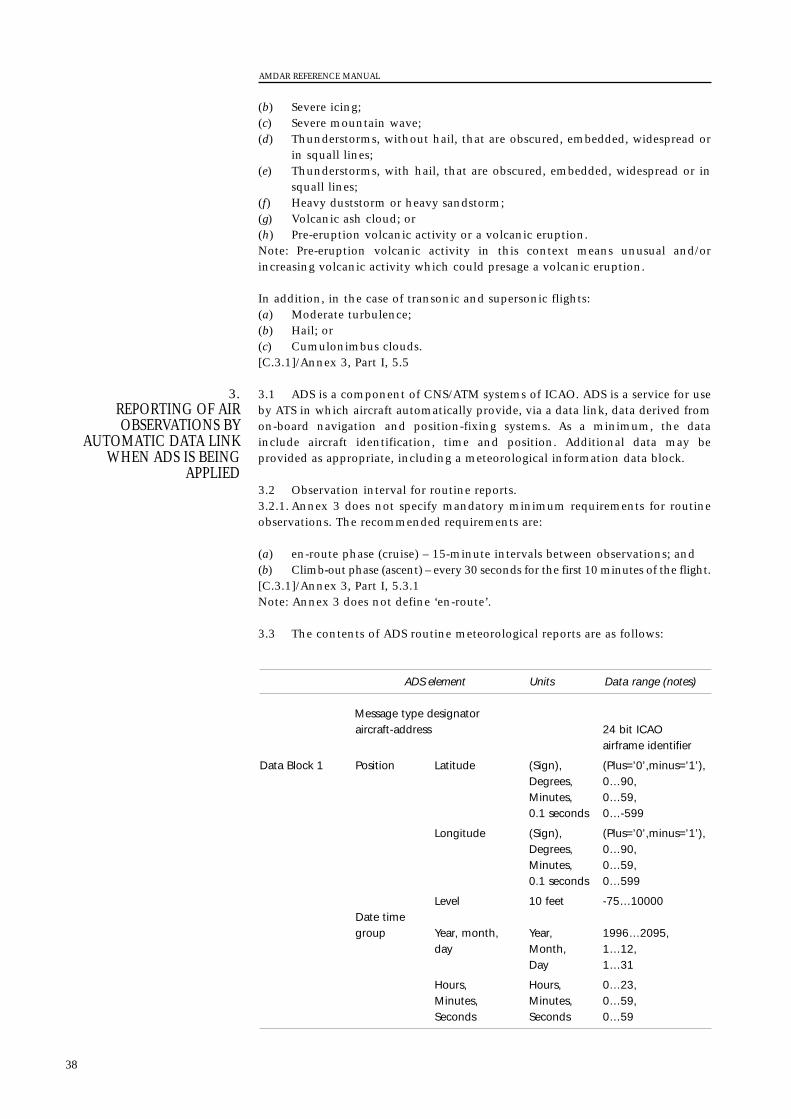
(b) Severe icing;(c) Severe mountain wave; (d) Thunderstorms, without hail, that are obscured, embedded, widespread or
in squall lines; (e) Thunderstorms, with hail, that are obscured, embedded, widespread or in
squall lines; (f) Heavy duststorm or heavy sandstorm; (g) Volcanic ash cloud; or(h) Pre-eruption volcanic activity or a volcanic eruption.Note: Pre-eruption volcanic activity in this context means unusual and/orincreasing volcanic activity which could presage a volcanic eruption.
In addition, in the case of transonic and supersonic flights:(a) Moderate turbulence; (b) Hail; or(c) Cumulonimbus clouds.[C.3.1]/Annex 3, Part I, 5.5
3.1 ADS is a component of CNS/ATM systems of ICAO. ADS is a service for useby ATS in which aircraft automatically provide, via a data link, data derived fromon-board navigation and position-fixing systems. As a minimum, the datainclude aircraft identification, time and position. Additional data may beprovided as appropriate, including a meteorological information data block.
3.2 Observation interval for routine reports.3.2.1. Annex 3 does not specify mandatory minimum requirements for routineobservations. The recommended requirements are:
(a) en-route phase (cruise) – 15-minute intervals between observations; and(b) Climb-out phase (ascent) – every 30 seconds for the first 10 minutes of the flight. [C.3.1]/Annex 3, Part I, 5.3.1Note: Annex 3 does not define ‘en-route’.
3.3 The contents of ADS routine meteorological reports are as follows:
3.REPORTING OF AIROBSERVATIONS BY
AUTOMATIC DATA LINKWHEN ADS IS BEING
APPLIED
AMDAR REFERENCE MANUAL
38
ADS element Units Data range (notes)
Message type designatoraircraft-address 24 bit ICAO
airframe identifier
Data Block 1 Position Latitude (Sign), (Plus=’0’,minus=’1’),Degrees, 0…90,Minutes, 0…59,0.1 seconds 0…-599
Longitude (Sign), (Plus=’0’,minus=’1’),Degrees, 0…90,Minutes, 0…59,0.1 seconds 0…599
Level 10 feet -75…10000Date timegroup Year, month, Year, 1996…2095,
day Month, 1…12,Day 1…31
Hours, Hours, 0…23,Minutes, Minutes, 0…59,Seconds Seconds 0…59
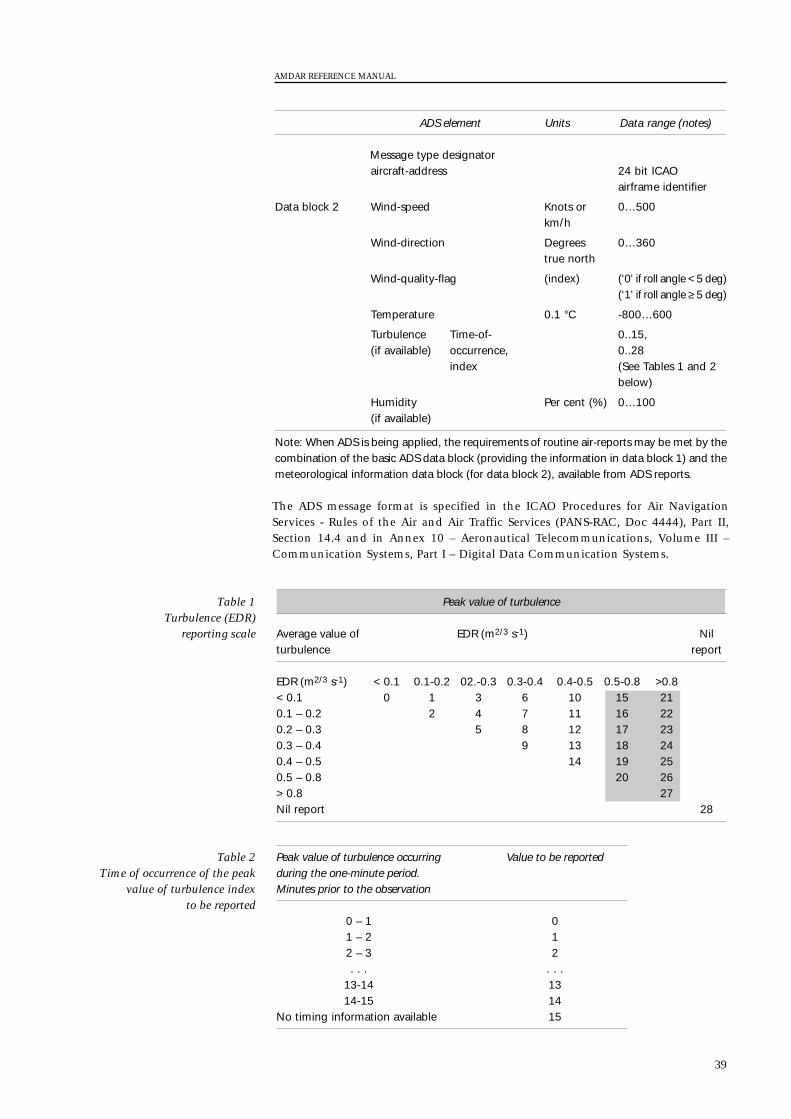
The ADS message format is specified in the ICAO Procedures for Air NavigationServices - Rules of the Air and Air Traffic Services (PANS-RAC, Doc 4444), Part II,Section 14.4 and in Annex 10 – Aeronautical Telecommunications, Volume III –Communication Systems, Part I – Digital Data Communication Systems.
Peak value of turbulence occurring Value to be reportedduring the one-minute period. Minutes prior to the observation
0 – 1 01 – 2 12 – 3 2. . . . . .
13-14 1314-15 14
No timing information available 15
Table 2Time of occurrence of the peak
value of turbulence indexto be reported
Peak value of turbulence
Average value of EDR (m2/3 s-1) Nil turbulence report
EDR (m2/3 s-1) < 0.1 0.1-0.2 02.-0.3 0.3-0.4 0.4-0.5 0.5-0.8 >0.8< 0.1 0 1 3 6 10 15 210.1 – 0.2 2 4 7 11 16 220.2 – 0.3 5 8 12 17 230.3 – 0.4 9 13 18 240.4 – 0.5 14 19 250.5 – 0.8 20 26> 0.8 27Nil report 28
Table 1Turbulence (EDR)
reporting scale
AMDAR REFERENCE MANUAL
39
ADS element Units Data range (notes)
Message type designatoraircraft-address 24 bit ICAO
airframe identifier
Data block 2 Wind-speed Knots or 0…500km/h
Wind-direction Degrees 0…360true north
Wind-quality-flag (index) (‘0’ if roll angle < 5 deg)(‘1’ if roll angle ≥ 5 deg)
Temperature 0.1 °C -800…600
Turbulence Time-of- 0..15,(if available) occurrence, 0..28
index (See Tables 1 and 2below)
Humidity Per cent (%) 0…100(if available)
Note: When ADS is being applied, the requirements of routine air-reports may be met by thecombination of the basic ADS data block (providing the information in data block 1) and themeteorological information data block (for data block 2), available from ADS reports.
4.1 Observation intervals for routine reports.4.1.1 Annex 3 does not specify observation intervals for non-ADS data link appli-cations. By inference the specifications for voice reporting might be assumed asfollows:
When voice communications are used, routine observations shall be madeduring the en-route phase in relation to those air traffic services reporting pointsor intervals:(a) At which the applicable air traffic services procedures require routine posi-
tion reports; and(b) Which are separated by distances corresponding most closely to intervals of
one hour of flying time.[C.3.1]/Annex 3, Part I, 5.3.2
4.2 Content of routine reports.4.2.1 When air-ground data link is used while ADS is not applied, the elementsto be included in routine reports are as follows:[C.3.1]/Annex 3, Part II, Appendix 4, 1.3/1.1.2
Routine air-reportMessage type designator
Section 1 Aircraft identification(Position information) Position or latitude and longitude
TimeFlight level or altitudeNext position and time over ensuing significantpoint
Section 2 Estimated time of arrival(Operational information) Endurance
Section 3 Air temperature(Meteorological information) Wind direction
Wind speedTurbulenceAircraft icingHumidity (if available)
Note: When air-ground data link is used while ADS is not being applied, the requirementsof routine air-reports may be met by the Controller Pilot Data Link Communication(CPDLC) application entitled ‘Position report’ The details of this data link application arespecified in ICAO’s Manual of Air Traffic Services (ATS) Data Link Applications(Doc 9694) and in Annex 10 – Aeronautical Telecommunications, Volume III –Communication Systems, Part I – Digital Data Communication Systems.
4.REPORTING BY AIR-
GROUND DATA LINKWHEN ADS IS NOT BEING
APPLIED
AMDAR REFERENCE MANUAL
40
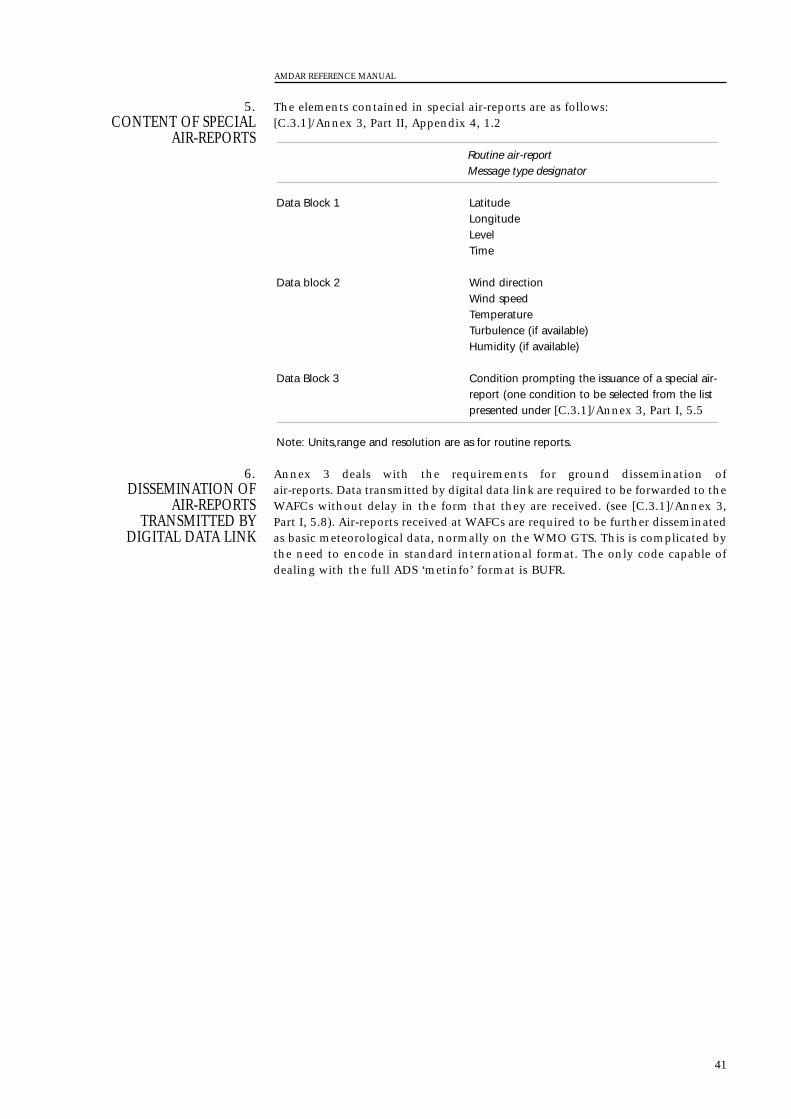
The elements contained in special air-reports are as follows:[C.3.1]/Annex 3, Part II, Appendix 4, 1.2
Annex 3 deals with the requirements for ground dissemination of air-reports. Data transmitted by digital data link are required to be forwarded to theWAFCs without delay in the form that they are received. (see [C.3.1]/Annex 3,Part I, 5.8). Air-reports received at WAFCs are required to be further disseminatedas basic meteorological data, normally on the WMO GTS. This is complicated bythe need to encode in standard international format. The only code capable ofdealing with the full ADS ‘metinfo’ format is BUFR.
6.DISSEMINATION OF
AIR-REPORTSTRANSMITTED BY
DIGITAL DATA LINK
Routine air-reportMessage type designator
Data Block 1 LatitudeLongitudeLevelTime
Data block 2 Wind directionWind speedTemperatureTurbulence (if available)Humidity (if available)
Data Block 3 Condition prompting the issuance of a special air-report (one condition to be selected from the listpresented under [C.3.1]/Annex 3, Part I, 5.5
Note: Units,range and resolution are as for routine reports.
5.CONTENT OF SPECIAL
AIR-REPORTS
AMDAR REFERENCE MANUAL
41
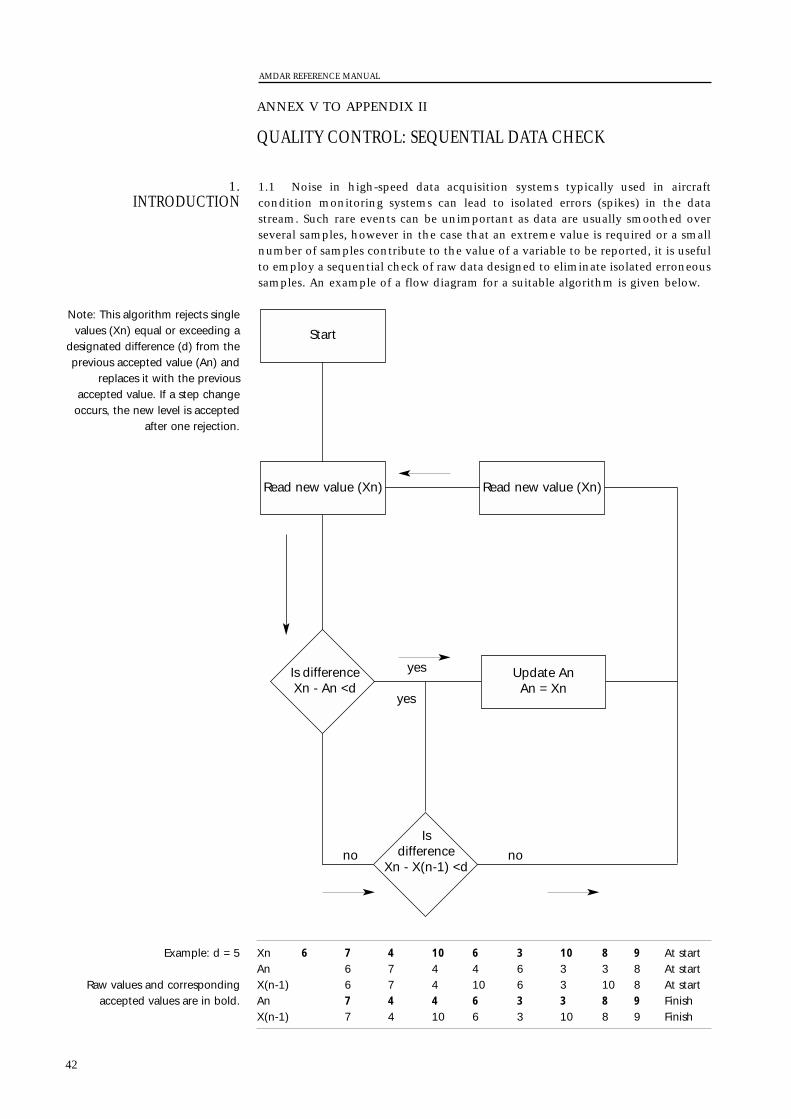
ANNEX V TO APPENDIX II
QUALITY CONTROL: SEQUENTIAL DATA CHECK
1.1 Noise in high-speed data acquisition systems typically used in aircraftcondition monitoring systems can lead to isolated errors (spikes) in the datastream. Such rare events can be unimportant as data are usually smoothed overseveral samples, however in the case that an extreme value is required or a smallnumber of samples contribute to the value of a variable to be reported, it is usefulto employ a sequential check of raw data designed to eliminate isolated erroneoussamples. An example of a flow diagram for a suitable algorithm is given below.
Xn 6 7 4 10 6 3 10 8 9 At startAn 6 7 4 4 6 3 3 8 At startX(n-1) 6 7 4 10 6 3 10 8 At startAn 7 4 4 6 3 3 8 9 FinishX(n-1) 7 4 10 6 3 10 8 9 Finish
1.INTRODUCTION
AMDAR REFERENCE MANUAL
42
Start
no no
yes
yes
Is difference
Xn - X(n-1) <d
Read new value (Xn)Read new value (Xn)
Update AnAn = Xn
Is differenceXn - An <d
Note: This algorithm rejects singlevalues (Xn) equal or exceeding a
designated difference (d) from theprevious accepted value (An) and
replaces it with the previousaccepted value. If a step change
occurs, the new level is acceptedafter one rejection.
Example: d = 5
Raw values and correspondingaccepted values are in bold.
ANNEX VI TO APPENDIX II
DATA SMOOTHING
1.1 Raw data available from aircraft condition monitoring systems are sampledat various rates, principally to meet the operator’s requirements. Data rates typi-cally vary from one to 16 samples per second. Some data acquisition systemsprovide data smoothing, but standards vary widely with different avionics manu-facturers. It is desirable, where feasible, to ensure that meteorological data aresmoothed in a consistent way to ensure compatibility between measurements onindividual and different aircraft. An example of a simple and efficient algorithmto be applied to raw data samples is shown below:
If yn is the nth raw data sample, t the sampling interval, T the averaging time andYn the corresponding smoothed value, then:
Yn = 3t(yn – Yn-1)/ T + Yn-1
Note: It is assumed that T is much larger than t; e.g. T=10s, t<1s.
AMDAR REFERENCE MANUAL
43
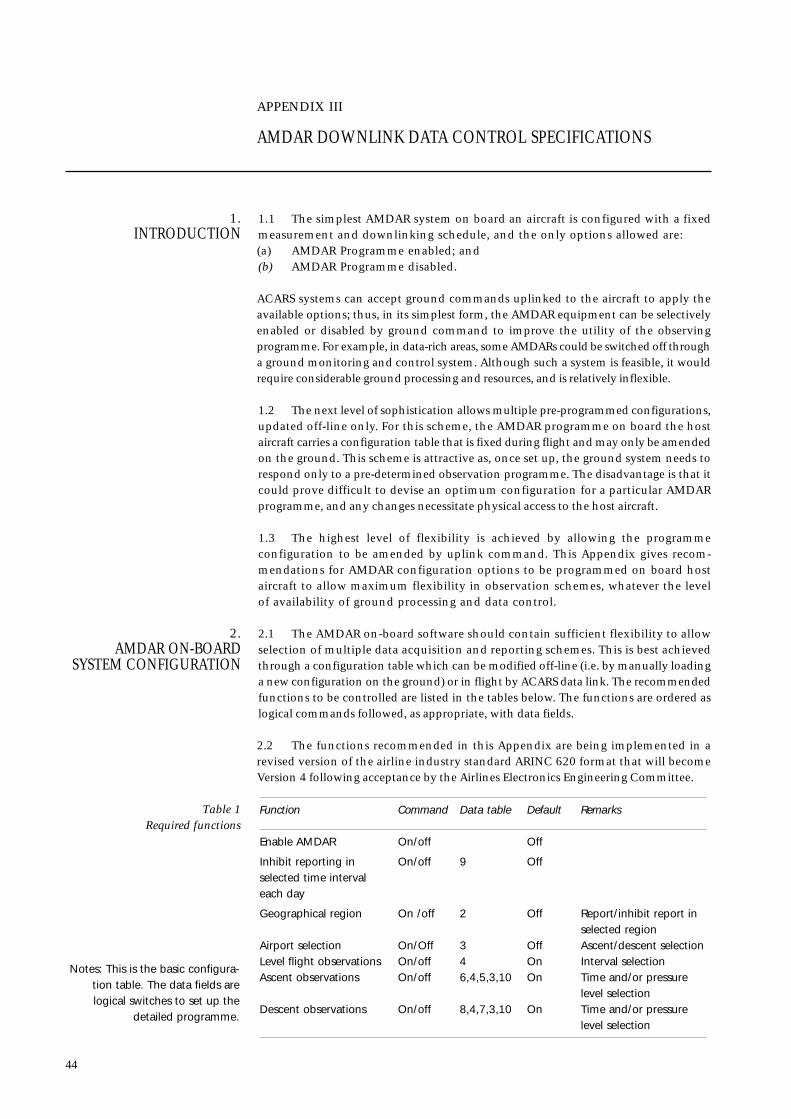
APPENDIX III
AMDAR DOWNLINK DATA CONTROL SPECIFICATIONS
1.1 The simplest AMDAR system on board an aircraft is configured with a fixedmeasurement and downlinking schedule, and the only options allowed are: (a) AMDAR Programme enabled; and(b) AMDAR Programme disabled.
ACARS systems can accept ground commands uplinked to the aircraft to apply theavailable options; thus, in its simplest form, the AMDAR equipment can be selectivelyenabled or disabled by ground command to improve the utility of the observingprogramme. For example, in data-rich areas, some AMDARs could be switched off througha ground monitoring and control system. Although such a system is feasible, it wouldrequire considerable ground processing and resources, and is relatively inflexible.
1.2 The next level of sophistication allows multiple pre-programmed configurations,updated off-line only. For this scheme, the AMDAR programme on board the hostaircraft carries a configuration table that is fixed during flight and may only be amendedon the ground. This scheme is attractive as, once set up, the ground system needs torespond only to a pre-determined observation programme. The disadvantage is that itcould prove difficult to devise an optimum configuration for a particular AMDARprogramme, and any changes necessitate physical access to the host aircraft.
1.3 The highest level of flexibility is achieved by allowing the programmeconfiguration to be amended by uplink command. This Appendix gives recom-mendations for AMDAR configuration options to be programmed on board hostaircraft to allow maximum flexibility in observation schemes, whatever the levelof availability of ground processing and data control.
2.1 The AMDAR on-board software should contain sufficient flexibility to allowselection of multiple data acquisition and reporting schemes. This is best achievedthrough a configuration table which can be modified off-line (i.e. by manually loadinga new configuration on the ground) or in flight by ACARS data link. The recommendedfunctions to be controlled are listed in the tables below. The functions are ordered aslogical commands followed, as appropriate, with data fields.
2.2 The functions recommended in this Appendix are being implemented in arevised version of the airline industry standard ARINC 620 format that will becomeVersion 4 following acceptance by the Airlines Electronics Engineering Committee.
Function Command Data table Default Remarks
Enable AMDAR On/off Off
Inhibit reporting in On/off 9 Offselected time interval each day
Geographical region On /off 2 Off Report/inhibit report inselected region
Airport selection On/Off 3 Off Ascent/descent selectionLevel flight observations On/off 4 On Interval selection Ascent observations On/off 6,4,5,3,10 On Time and/or pressure
level selectionDescent observations On/off 8,4,7,3,10 On Time and/or pressure
level selection
Table 1Required functions
2. AMDAR ON-BOARD
SYSTEM CONFIGURATION
1. INTRODUCTION
44
Notes: This is the basic configura-tion table. The data fields arelogical switches to set up the
detailed programme.
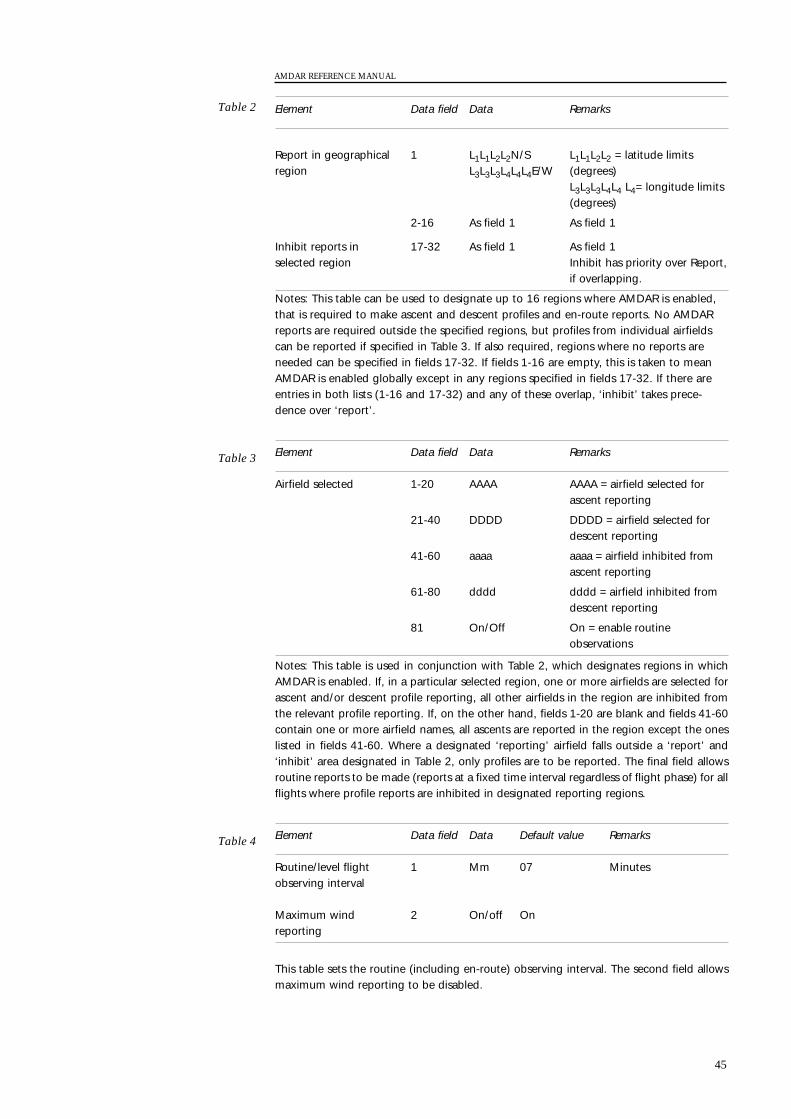
Element Data field Data Default value Remarks
Routine/level flight 1 Mm 07 Minutesobserving interval
Maximum wind 2 On/off Onreporting
This table sets the routine (including en-route) observing interval. The second field allowsmaximum wind reporting to be disabled.
Table 4
Element Data field Data Remarks
Airfield selected 1-20 AAAA AAAA = airfield selected forascent reporting
21-40 DDDD DDDD = airfield selected fordescent reporting
41-60 aaaa aaaa = airfield inhibited fromascent reporting
61-80 dddd dddd = airfield inhibited fromdescent reporting
81 On/Off On = enable routineobservations
Notes: This table is used in conjunction with Table 2, which designates regions in whichAMDAR is enabled. If, in a particular selected region, one or more airfields are selected forascent and/or descent profile reporting, all other airfields in the region are inhibited fromthe relevant profile reporting. If, on the other hand, fields 1-20 are blank and fields 41-60contain one or more airfield names, all ascents are reported in the region except the oneslisted in fields 41-60. Where a designated ‘reporting’ airfield falls outside a ‘report’ and‘inhibit’ area designated in Table 2, only profiles are to be reported. The final field allowsroutine reports to be made (reports at a fixed time interval regardless of flight phase) for allflights where profile reports are inhibited in designated reporting regions.
Table 3
Element Data field Data Remarks
Report in geographical 1 L1L1L2L2N/S L1L1L2L2 = latitude limitsregion L3L3L3L4L4L4E/W (degrees)
L3L3L3L4L4 L4= longitude limits(degrees)
2-16 As field 1 As field 1
Inhibit reports in 17-32 As field 1 As field 1selected region Inhibit has priority over Report,
if overlapping.
Notes: This table can be used to designate up to 16 regions where AMDAR is enabled,that is required to make ascent and descent profiles and en-route reports. No AMDARreports are required outside the specified regions, but profiles from individual airfieldscan be reported if specified in Table 3. If also required, regions where no reports areneeded can be specified in fields 17-32. If fields 1-16 are empty, this is taken to meanAMDAR is enabled globally except in any regions specified in fields 17-32. If there areentries in both lists (1-16 and 17-32) and any of these overlap, ‘inhibit’ takes prece-dence over ‘report’.
Table 2
AMDAR REFERENCE MANUAL
45
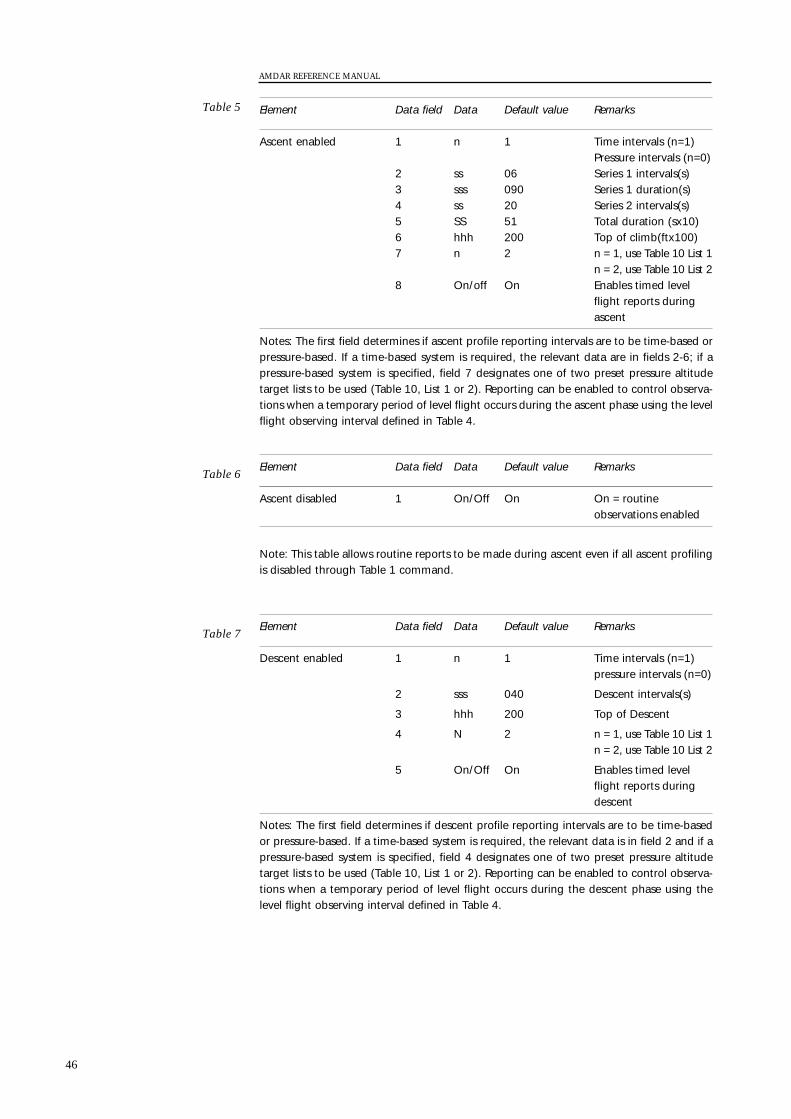
Element Data field Data Default value Remarks
Descent enabled 1 n 1 Time intervals (n=1)pressure intervals (n=0)
2 sss 040 Descent intervals(s)
3 hhh 200 Top of Descent
4 N 2 n = 1, use Table 10 List 1n = 2, use Table 10 List 2
5 On/Off On Enables timed levelflight reports duringdescent
Notes: The first field determines if descent profile reporting intervals are to be time-basedor pressure-based. If a time-based system is required, the relevant data is in field 2 and if apressure-based system is specified, field 4 designates one of two preset pressure altitudetarget lists to be used (Table 10, List 1 or 2). Reporting can be enabled to control observa-tions when a temporary period of level flight occurs during the descent phase using thelevel flight observing interval defined in Table 4.
Table 7
Element Data field Data Default value Remarks
Ascent disabled 1 On/Off On On = routineobservations enabled
Note: This table allows routine reports to be made during ascent even if all ascent profilingis disabled through Table 1 command.
Table 6
Element Data field Data Default value Remarks
Ascent enabled 1 n 1 Time intervals (n=1)Pressure intervals (n=0)
2 ss 06 Series 1 intervals(s)3 sss 090 Series 1 duration(s)4 ss 20 Series 2 intervals(s)5 SS 51 Total duration (sx10)6 hhh 200 Top of climb(ftx100)7 n 2 n = 1, use Table 10 List 1
n = 2, use Table 10 List 28 On/off On Enables timed level
flight reports duringascent
Notes: The first field determines if ascent profile reporting intervals are to be time-based orpressure-based. If a time-based system is required, the relevant data are in fields 2-6; if apressure-based system is specified, field 7 designates one of two preset pressure altitudetarget lists to be used (Table 10, List 1 or 2). Reporting can be enabled to control observa-tions when a temporary period of level flight occurs during the ascent phase using the levelflight observing interval defined in Table 4.
Table 5
AMDAR REFERENCE MANUAL
46
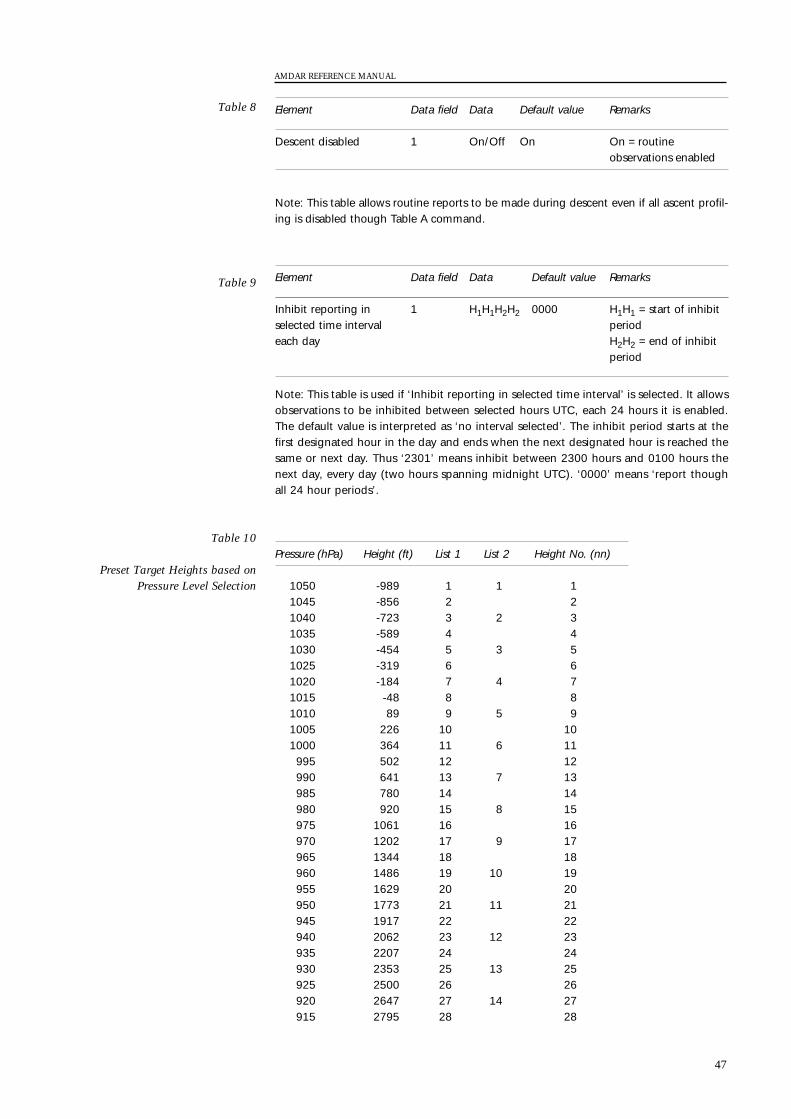
Pressure (hPa) Height (ft) List 1 List 2 Height No. (nn)
1050 -989 1 1 11045 -856 2 21040 -723 3 2 31035 -589 4 41030 -454 5 3 51025 -319 6 61020 -184 7 4 71015 -48 8 81010 89 9 5 91005 226 10 101000 364 11 6 11995 502 12 12990 641 13 7 13985 780 14 14980 920 15 8 15975 1061 16 16970 1202 17 9 17965 1344 18 18960 1486 19 10 19955 1629 20 20950 1773 21 11 21945 1917 22 22940 2062 23 12 23935 2207 24 24930 2353 25 13 25925 2500 26 26920 2647 27 14 27915 2795 28 28
Table 10
Preset Target Heights based onPressure Level Selection
Element Data field Data Default value Remarks
Inhibit reporting in 1 H1H1H2H2 0000 H1H1 = start of inhibit selected time interval periodeach day H2H2 = end of inhibit
period
Note: This table is used if ‘Inhibit reporting in selected time interval’ is selected. It allowsobservations to be inhibited between selected hours UTC, each 24 hours it is enabled.The default value is interpreted as ‘no interval selected’. The inhibit period starts at thefirst designated hour in the day and ends when the next designated hour is reached thesame or next day. Thus ‘2301’ means inhibit between 2300 hours and 0100 hours thenext day, every day (two hours spanning midnight UTC). ‘0000’ means ‘report thoughall 24 hour periods’.
Table 9
Element Data field Data Default value Remarks
Descent disabled 1 On/Off On On = routineobservations enabled
Note: This table allows routine reports to be made during descent even if all ascent profil-ing is disabled though Table A command.
Table 8
AMDAR REFERENCE MANUAL
47
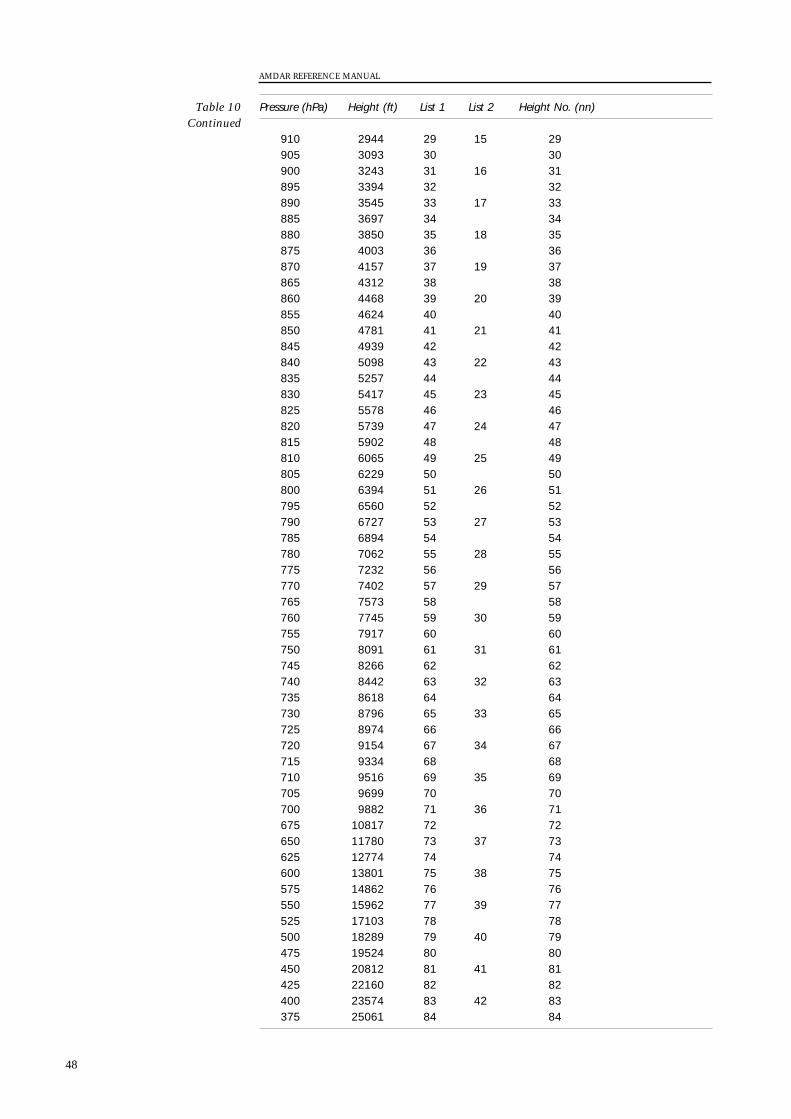
Pressure (hPa) Height (ft) List 1 List 2 Height No. (nn)
910 2944 29 15 29905 3093 30 30900 3243 31 16 31895 3394 32 32890 3545 33 17 33885 3697 34 34880 3850 35 18 35875 4003 36 36870 4157 37 19 37865 4312 38 38860 4468 39 20 39855 4624 40 40850 4781 41 21 41845 4939 42 42840 5098 43 22 43835 5257 44 44830 5417 45 23 45825 5578 46 46820 5739 47 24 47815 5902 48 48810 6065 49 25 49805 6229 50 50800 6394 51 26 51795 6560 52 52790 6727 53 27 53785 6894 54 54780 7062 55 28 55775 7232 56 56770 7402 57 29 57765 7573 58 58760 7745 59 30 59755 7917 60 60750 8091 61 31 61745 8266 62 62740 8442 63 32 63735 8618 64 64730 8796 65 33 65725 8974 66 66720 9154 67 34 67715 9334 68 68710 9516 69 35 69705 9699 70 70700 9882 71 36 71675 10817 72 72650 11780 73 37 73625 12774 74 74600 13801 75 38 75575 14862 76 76550 15962 77 39 77525 17103 78 78500 18289 79 40 79475 19524 80 80450 20812 81 41 81425 22160 82 82400 23574 83 42 83375 25061 84 84
Table 10Continued
AMDAR REFERENCE MANUAL
48
Appendix IV
APPENDIX IV
AMDAR DATA MANAGEMENT
1.1 AMDAR Data Management (AMDARDM) can be viewed within the contextof the WMO World Weather Watch Data Management (WWWDM) programme.The concept of WWWDM is one of carrying out those activities required to opti-mize the integration of the Global Observing System (GOS), GlobalTelecommunications System (GTS) and Global Data Processing System (GDPS).WWWDM functions include:
(a) Providing specifications for data representation, including codes andexchange formats, guidelines for the design of databases and storage ofobservational data and processed information;
(b) Defining and designing proper procedures and interfaces, particularly inthe area of data processing and telecommunications, to allow Members toobtain the coherent and appropriate sets of data and products required,despite the disparity in the levels of sophistication of technology and tech-niques of various WWW centres; and
(c) Monitoring AMDAR operations and the quality of basic data and outputproducts.
1.2 AMDARDM applies to all the processes in the AMDAR operational system.This is shown schematically in Figure 1 below. It will be noted that the globalsystem consists of several national or regional programmes with overall coordi-nation facilitated by the WMO AMDAR Panel through its Technical Coordinator.In this appendix, each function is described with special attention given toquality management. In addition, detailed information is provided on recom-mended GTS codes that are subject to WMO Technical Regulations.
2.1 Observing platform:(a) Compute and assemble observational data;(b) Perform basic quality control (Q/C); and(c) Transmit to ground in approved code.
2.2 Communications Service:(a) Relay observations to ground network (to airline or data reception and
switching centre (DRSC));(b) Maintain error-free transmission;(c) Process uplink commands; and(d) Ensure timely delivery of data.
2.3 DRSC:(a) Ingest real-time data, including data from cooperating programmes;(b) Perform real-time Q/C;(c) Assemble rejected data;(d) Assemble bulletin;(e) Eliminate duplicates;(f) Pass all data (except duplicates) to QEV centre;(g) Pass all data (except duplicates) to Archive centre;(h) Eliminate additional rejects from QEV list;(i) Pass accepted data bulletins to GTS and Numerical Processing Centre; and(j) Assemble and forward reports to System manager.
2. DATA MANAGEMENT
FUNCTIONS
1. INTRODUCTION
AMDAR REFERENCE MANUAL
49
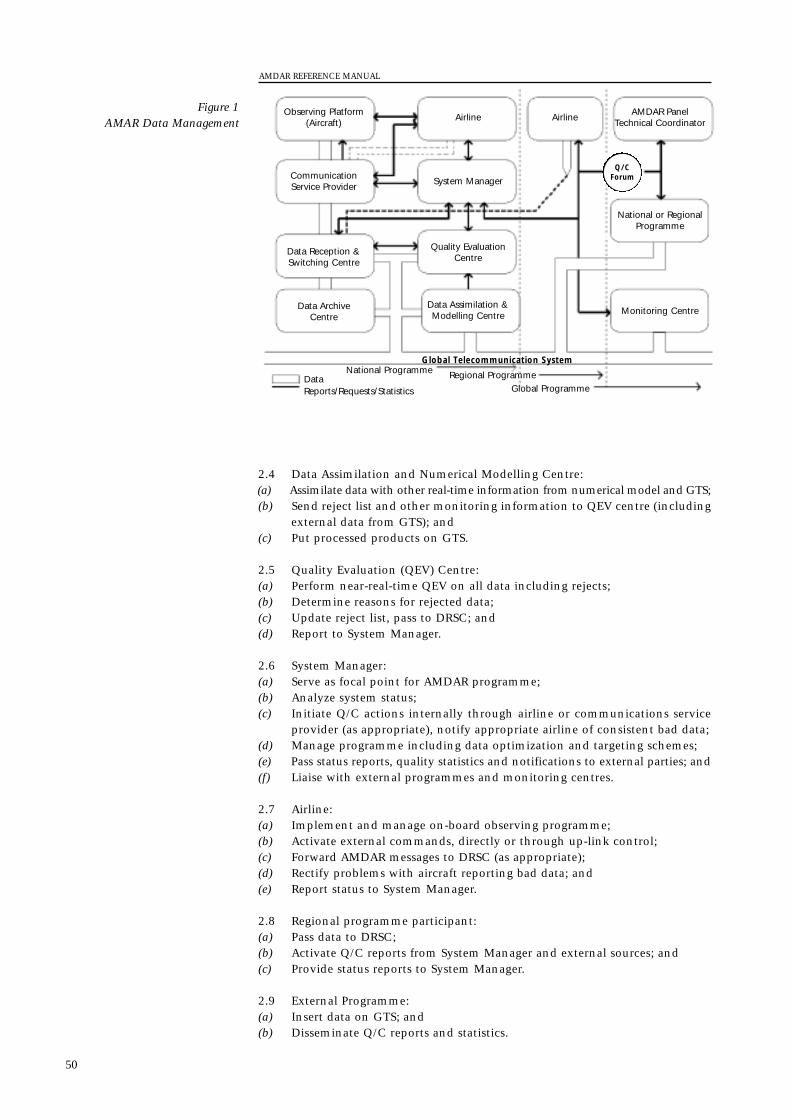
2.4 Data Assimilation and Numerical Modelling Centre:(a) Assimilate data with other real-time information from numerical model and GTS;(b) Send reject list and other monitoring information to QEV centre (including
external data from GTS); and(c) Put processed products on GTS.
2.5 Quality Evaluation (QEV) Centre:(a) Perform near-real-time QEV on all data including rejects;(b) Determine reasons for rejected data;(c) Update reject list, pass to DRSC; and(d) Report to System Manager.
2.6 System Manager:(a) Serve as focal point for AMDAR programme;(b) Analyze system status;(c) Initiate Q/C actions internally through airline or communications service
provider (as appropriate), notify appropriate airline of consistent bad data;(d) Manage programme including data optimization and targeting schemes;(e) Pass status reports, quality statistics and notifications to external parties; and(f) Liaise with external programmes and monitoring centres.
2.7 Airline:(a) Implement and manage on-board observing programme;(b) Activate external commands, directly or through up-link control;(c) Forward AMDAR messages to DRSC (as appropriate);(d) Rectify problems with aircraft reporting bad data; and(e) Report status to System Manager.
2.8 Regional programme participant:(a) Pass data to DRSC;(b) Activate Q/C reports from System Manager and external sources; and(c) Provide status reports to System Manager.
2.9 External Programme:(a) Insert data on GTS; and(b) Disseminate Q/C reports and statistics.
AMDAR REFERENCE MANUAL
50
Observing Platform(Aircraft)
CommunicationService Provider
Data Reception &Switching Centre
Data ArchiveCentre
DataReports/Requests/Statistics
National Programme Regional ProgrammeGlobal Programme
Global Telecommunication System
Airline AirlineAMDAR Panel
Technical Coordinator
National or RegionalProgramme
Monitoring Centre
Quality EvaluationCentre
System Manager
Data Assimilation &Modelling Centre
Q/CForum
Figure 1AMAR Data Management
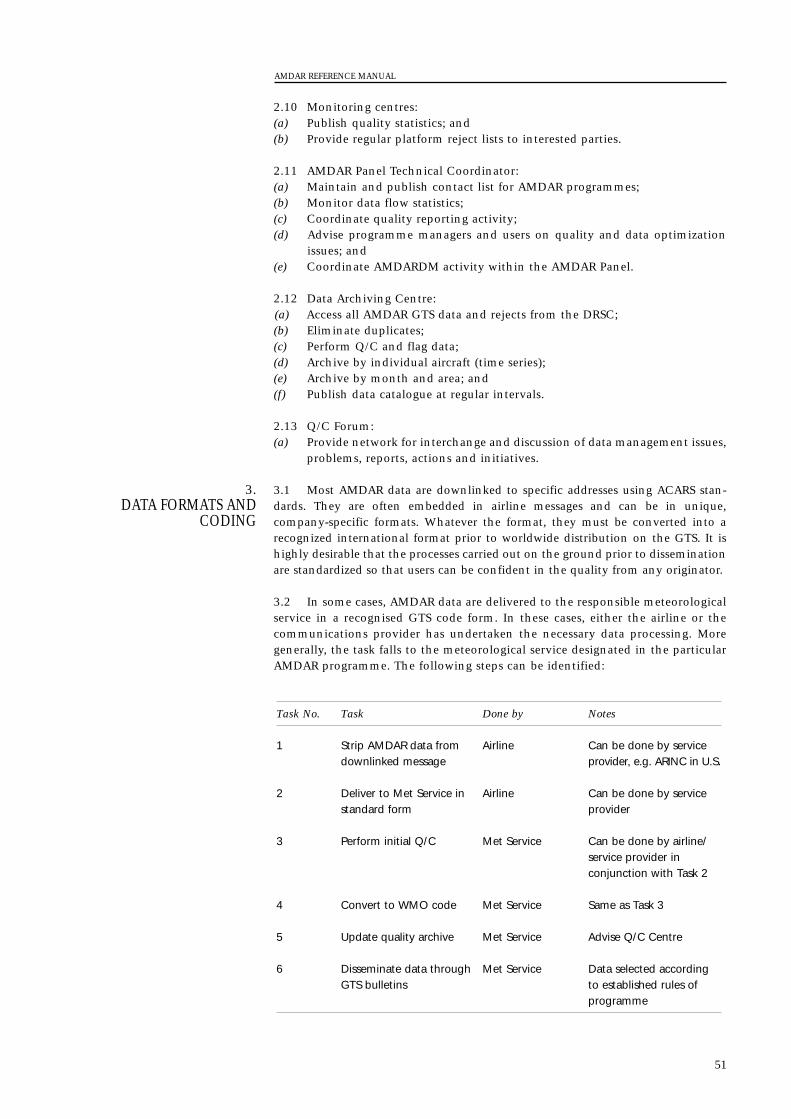
2.10 Monitoring centres:(a) Publish quality statistics; and(b) Provide regular platform reject lists to interested parties.
2.11 AMDAR Panel Technical Coordinator:(a) Maintain and publish contact list for AMDAR programmes;(b) Monitor data flow statistics;(c) Coordinate quality reporting activity;(d) Advise programme managers and users on quality and data optimization
issues; and(e) Coordinate AMDARDM activity within the AMDAR Panel.
2.12 Data Archiving Centre:(a) Access all AMDAR GTS data and rejects from the DRSC;(b) Eliminate duplicates;(c) Perform Q/C and flag data;(d) Archive by individual aircraft (time series);(e) Archive by month and area; and(f) Publish data catalogue at regular intervals.
2.13 Q/C Forum:(a) Provide network for interchange and discussion of data management issues,
problems, reports, actions and initiatives.
3.1 Most AMDAR data are downlinked to specific addresses using ACARS stan-dards. They are often embedded in airline messages and can be in unique,company-specific formats. Whatever the format, they must be converted into arecognized international format prior to worldwide distribution on the GTS. It ishighly desirable that the processes carried out on the ground prior to disseminationare standardized so that users can be confident in the quality from any originator.
3.2 In some cases, AMDAR data are delivered to the responsible meteorologicalservice in a recognised GTS code form. In these cases, either the airline or thecommunications provider has undertaken the necessary data processing. Moregenerally, the task falls to the meteorological service designated in the particularAMDAR programme. The following steps can be identified:
Task No. Task Done by Notes
1 Strip AMDAR data from Airline Can be done by servicedownlinked message provider, e.g. ARINC in U.S.
2 Deliver to Met Service in Airline Can be done by servicestandard form provider
3 Perform initial Q/C Met Service Can be done by airline/service provider inconjunction with Task 2
4 Convert to WMO code Met Service Same as Task 3
5 Update quality archive Met Service Advise Q/C Centre
6 Disseminate data through Met Service Data selected accordingGTS bulletins to established rules of
programme
3. DATA FORMATS AND
CODING
AMDAR REFERENCE MANUAL
51
3.3 GTS code conversion3.3.1 There are four code forms available for the dissemination of AMDAR data:(a) FM 42-XI Ext. AMDAR;(b) FM 94 BUFR;(c) FM 96-XI Ext. CREX; and(d) AIREP.
3.3.2 FM 42 is an alphanumeric code in a series used for many years for the inter-national exchange of meteorological data. The code consists of a series ofsymbolic words, letters, figures and groups. It is designed to be readily decodedmanually with most data coded in easily recognized units. The code is relativelyinflexible and not well suited to modern data-processing systems. Changes aredifficult to accommodate and may take a long time to implement. At present, FM 42 cannot handle all the requirements of AMDAR. It is described in moredetail in section 4.1.
3.3.3 FM 94 BUFR (Binary Universal Form for the Representation of meteorolog-ical data, WMO 1995) is a self-describing binary code designed to represent anymeteorological data, employing a continuous binary stream. The code form maybe applied to any numerical or qualitative data type. BUFR is ideally suited to thecoding of AMDAR data and has the advantage of easily accommodating changeor variations in observing practice. AMDAR coding in FM 94 BUFR is described indetail in section 4.2.
3.3.4 FM 96 CREX (Character form for the Representation and Exchange of data)is a self-describing code of similar design to BUFR. The essential feature of bothBUFR and CREX is the use of a standard structure for each code with data descrip-tors provided in tabular form. The tables are easily expanded to accommodatecode changes and new requirements without changing the basic code structure.New specially-adapted CREX AMDAR codes have been developed to provideAMDAR data in a form that makes it appear as a radiosonde sounding.
3.3.5 AIREP is a code designed originally for encoding manual (pilot) aircraftobservations according to ICAO aviation meteorological requirements. It is notrecommended for encoding AMDAR observations.
4.1 FM 42-XI Ext. AMDAR - Aircraft report (aircraft meteorological data relay)[This code is described in detail in the Manual on Codes (WMO-no 306). Sections ofthis document relevant to AMDAR data encoding are copied or summarized below.]
CODE FORM:
SECTION 1 AMDAR YYGG
SECTION 2 ipipip IA. . . IA LaLaLaLaA LoLoLoLoLoB YYGGgg ShhIhIhI SSTATATA {SSTdTdTd or UUU} ddd/fff TBBA Ss1s2s3
SECTION 3 333 Fhdhdhd VGfgfgfg
Note: The WMO Manual on Codes contains ‘regulations’ concerning the reportingand definitions of the various code groups in FM 42; however FM 42 is commonlyused for encoding aircraft reports that do not conform precisely to the writtenregulations. This practice is so common that the description following will desig-nate certain rules as ‘recommended’.
4. GTS CODE DESCRIPTIONS
AMDAR REFERENCE MANUAL
52
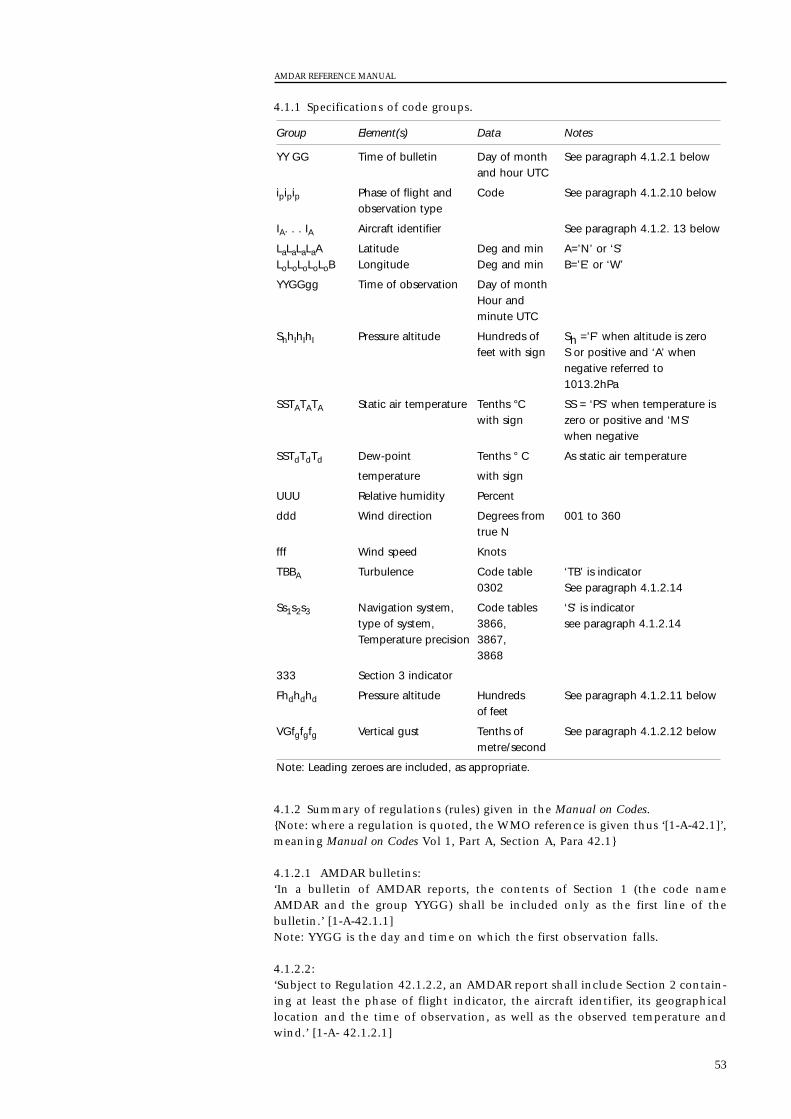
4.1.1 Specifications of code groups.
4.1.2 Summary of regulations (rules) given in the Manual on Codes.{Note: where a regulation is quoted, the WMO reference is given thus ‘[1-A-42.1]’,meaning Manual on Codes Vol 1, Part A, Section A, Para 42.1}
4.1.2.1 AMDAR bulletins:‘In a bulletin of AMDAR reports, the contents of Section 1 (the code nameAMDAR and the group YYGG) shall be included only as the first line of thebulletin.’ [1-A-42.1.1] Note: YYGG is the day and time on which the first observation falls.
4.1.2.2:‘Subject to Regulation 42.1.2.2, an AMDAR report shall include Section 2 contain-ing at least the phase of flight indicator, the aircraft identifier, its geographicallocation and the time of observation, as well as the observed temperature andwind.’ [1-A- 42.1.2.1]
Group Element(s) Data Notes
YY GG Time of bulletin Day of month See paragraph 4.1.2.1 belowand hour UTC
ipipip Phase of flight and Code See paragraph 4.1.2.10 belowobservation type
IA. . . IA Aircraft identifier See paragraph 4.1.2. 13 below
LaLaLaLaA Latitude Deg and min A=’N’ or ‘S’LoLoLoLoLoB Longitude Deg and min B=’E’ or ‘W’
YYGGgg Time of observation Day of month Hour and minute UTC
ShhIhIhI Pressure altitude Hundreds of Sh =’F’ when altitude is zerofeet with sign S or positive and ‘A’ when
negative referred to1013.2hPa
SSTATATA Static air temperature Tenths °C SS = ‘PS’ when temperature iswith sign zero or positive and ‘MS’
when negative
SSTdTdTd Dew-point Tenths ° C As static air temperature
temperature with sign
UUU Relative humidity Percent
ddd Wind direction Degrees from 001 to 360 true N
fff Wind speed Knots
TBBA Turbulence Code table ‘TB’ is indicator0302 See paragraph 4.1.2.14
Ss1s2s3 Navigation system, Code tables ‘S’ is indicatortype of system, 3866, see paragraph 4.1.2.14Temperature precision 3867,
3868
333 Section 3 indicator
Fhdhdhd Pressure altitude Hundreds See paragraph 4.1.2.11 belowof feet
VGfgfgfg Vertical gust Tenths of See paragraph 4.1.2.12 belowmetre/second
Note: Leading zeroes are included, as appropriate.
AMDAR REFERENCE MANUAL
53
4.1.2.3:‘An AMDAR report from an ASDAR system shall include all data groups containedin Section 2 and shall not include Section 3.’ [1-A- 42.1.2.2]
4.1.2.4 [Recommendation]:‘An AMDAR report from an ACARS system shall include Section 3.’ [1-A- 42.1.2.3]
4.1.2.5:‘Use of solidiData shall be encoded as solidi when not available, when the data collection plat-form cannot acquire correct data, or in the event of parity errors.’ [1-A-42.1.2.4]
4.1.2.6:‘Frequency of observationsThe frequency of observations shall vary according to the phase of the flight(ascent, level flight or descent).’ [1-A- 42.1.3]
4.1.2.7 [Recommendation]:‘Observations during ascentDuring ascent, observations shall be made as the aircraft passes through certainpressure levels, as follows. The first level shall be the nearest multiple of 10 hPaless than pressure at take-off. The next nine observations shall be at intervals of10 hPa. The 11th level shall be the first multiple of 50 hPa less than the 10th level.Observations shall continue at 50-hPa intervals until ascent is completed. Note: For example, If the pressure at take-off was 1012 hPa, the first level to bereported would be 1010 hPa.’ [1-A-42.1.3.1]
4.1.2.8 [Recommendation]:‘Routine observationsRoutine observations during level flight shall be made at set intervals of time. Thefirst observation shall be made at the first integral minute after the level flightphase has been continuously occupied for at least 15 seconds. Subsequent obser-vations shall be made at seven-minute intervals. If level flight is interrupted byunsteady flight, the timing sequence shall begin again upon resumption of levelflight.’ [1-A-42.1.3.2.1]
4.1.2.9 [Recommendation]:‘Highest wind encounteredHighest wind encountered shall be reported when the aircraft is in level flight ata pressure level less than 600 hPa, according to the following scheme. Smoothedwind speed shall be sampled at one-second intervals, and a wind speed maximumshall be reported if and only if the wind speed: (a) Is greater than 60 knots;(b) Exceeds the observed wind speed at the previous routine observation by
10 knots or more; and(c) Exceeds the observed wind speed at the subsequent routine observation by
10 knots or more.’ [1-A-42.1.3.2.2]
4.1.2.10 [Recommendation]:‘Observations during descentDuring descent, observations shall be made as the aircraft passes through certainpressure levels, as follows. The first level shall be the nearest multiple of 50 hPagreater than the pressure at the last observation before descent. Subsequent obser-vations shall be at intervals of 50 hPa, until a pressure level of 700 hPa is reached.From that level, observations shall continue at 50-hPa intervals, but supple-mented by observations at intervals of 10 hPa.’ [1-A-42.1.3.3]
AMDAR REFERENCE MANUAL
54
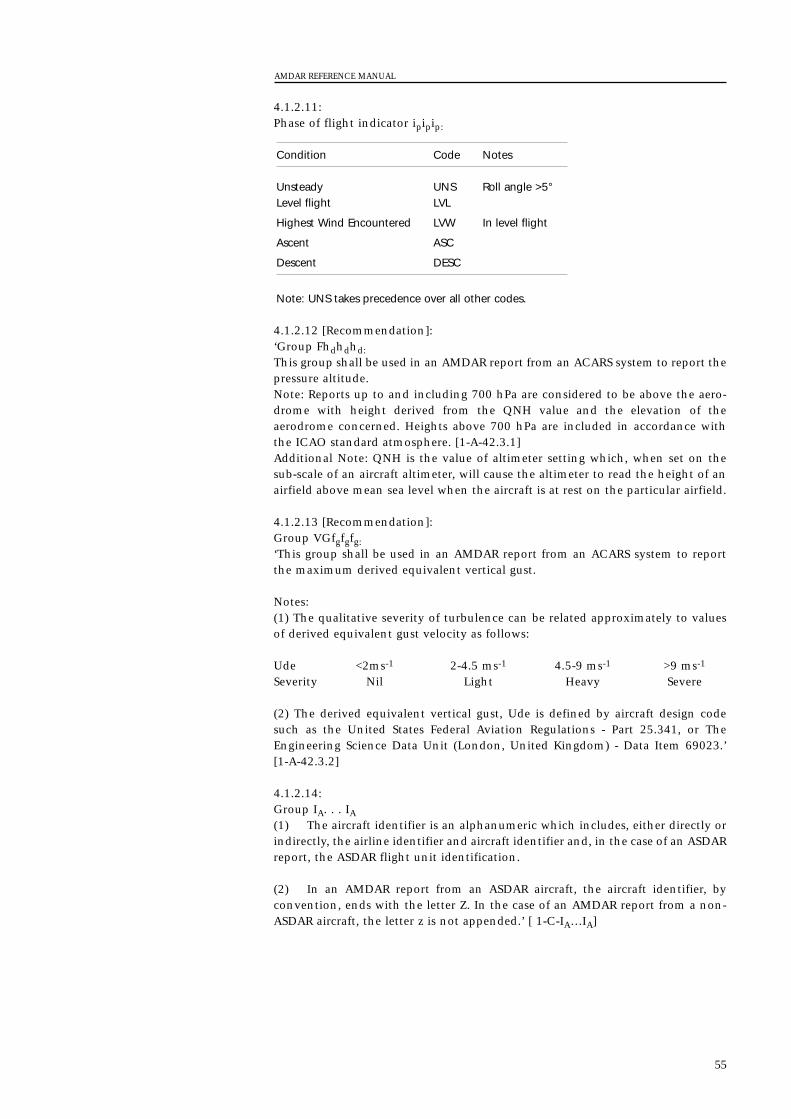
4.1.2.11:Phase of flight indicator ipipip:
4.1.2.12 [Recommendation]:‘Group Fhdhdhd:This group shall be used in an AMDAR report from an ACARS system to report thepressure altitude.Note: Reports up to and including 700 hPa are considered to be above the aero-drome with height derived from the QNH value and the elevation of theaerodrome concerned. Heights above 700 hPa are included in accordance withthe ICAO standard atmosphere. [1-A-42.3.1]Additional Note: QNH is the value of altimeter setting which, when set on thesub-scale of an aircraft altimeter, will cause the altimeter to read the height of anairfield above mean sea level when the aircraft is at rest on the particular airfield.
4.1.2.13 [Recommendation]:Group VGfgfgfg:‘This group shall be used in an AMDAR report from an ACARS system to reportthe maximum derived equivalent vertical gust.
Notes:(1) The qualitative severity of turbulence can be related approximately to valuesof derived equivalent gust velocity as follows:
Ude <2ms-1 2-4.5 ms-1 4.5-9 ms-1 >9 ms-1
Severity Nil Light Heavy Severe
(2) The derived equivalent vertical gust, Ude is defined by aircraft design codesuch as the United States Federal Aviation Regulations - Part 25.341, or TheEngineering Science Data Unit (London, United Kingdom) - Data Item 69023.’ [1-A-42.3.2]
4.1.2.14:Group IA. . . IA(1) The aircraft identifier is an alphanumeric which includes, either directly orindirectly, the airline identifier and aircraft identifier and, in the case of an ASDARreport, the ASDAR flight unit identification.
(2) In an AMDAR report from an ASDAR aircraft, the aircraft identifier, byconvention, ends with the letter Z. In the case of an AMDAR report from a non-ASDAR aircraft, the letter z is not appended.’ [ 1-C-IA…IA]
Condition Code Notes
Unsteady UNS Roll angle >5°Level flight LVL
Highest Wind Encountered LVW In level flight
Ascent ASC
Descent DESC
Note: UNS takes precedence over all other codes.
AMDAR REFERENCE MANUAL
55
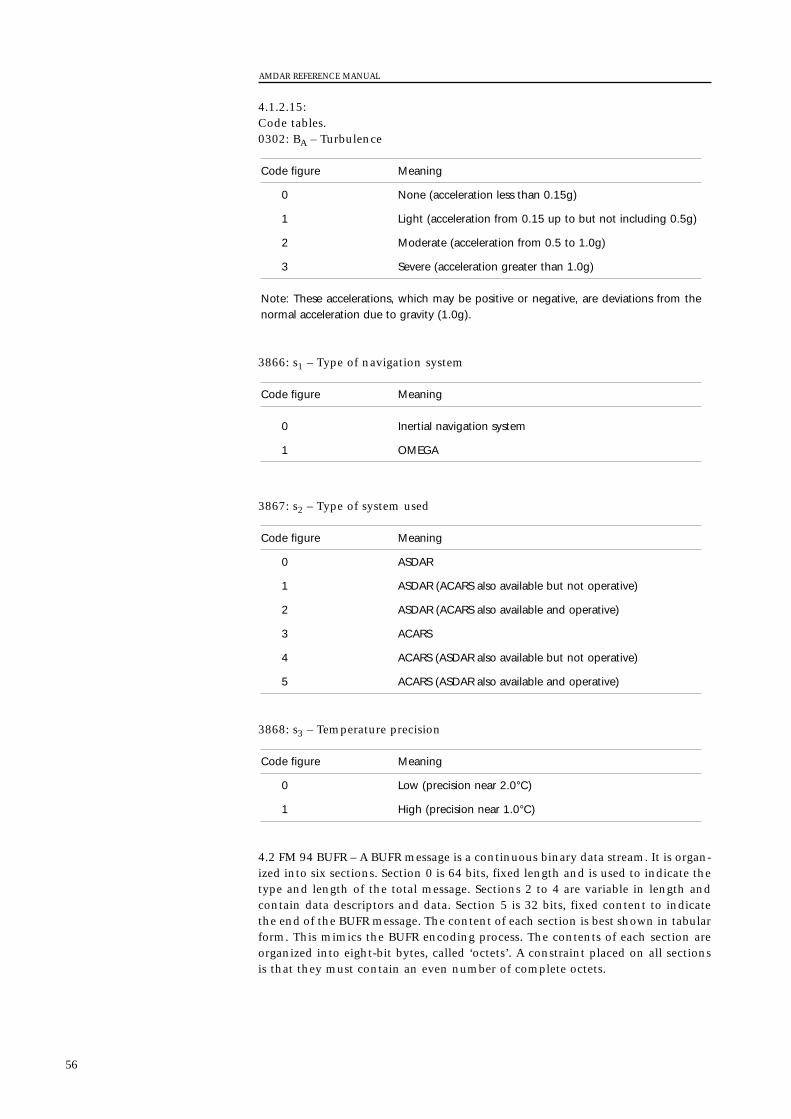
4.1.2.15:Code tables.0302: BA – Turbulence
3866: s1 – Type of navigation system
3867: s2 – Type of system used
3868: s3 – Temperature precision
4.2 FM 94 BUFR – A BUFR message is a continuous binary data stream. It is organ-ized into six sections. Section 0 is 64 bits, fixed length and is used to indicate thetype and length of the total message. Sections 2 to 4 are variable in length andcontain data descriptors and data. Section 5 is 32 bits, fixed content to indicatethe end of the BUFR message. The content of each section is best shown in tabularform. This mimics the BUFR encoding process. The contents of each section areorganized into eight-bit bytes, called ‘octets’. A constraint placed on all sectionsis that they must contain an even number of complete octets.
Code figure Meaning
0 Low (precision near 2.0°C)
1 High (precision near 1.0°C)
Code figure Meaning
0 ASDAR
1 ASDAR (ACARS also available but not operative)
2 ASDAR (ACARS also available and operative)
3 ACARS
4 ACARS (ASDAR also available but not operative)
5 ACARS (ASDAR also available and operative)
Code figure Meaning
0 Inertial navigation system
1 OMEGA
Code figure Meaning
0 None (acceleration less than 0.15g)
1 Light (acceleration from 0.15 up to but not including 0.5g)
2 Moderate (acceleration from 0.5 to 1.0g)
3 Severe (acceleration greater than 1.0g)
Note: These accelerations, which may be positive or negative, are deviations from thenormal acceleration due to gravity (1.0g).
AMDAR REFERENCE MANUAL
56
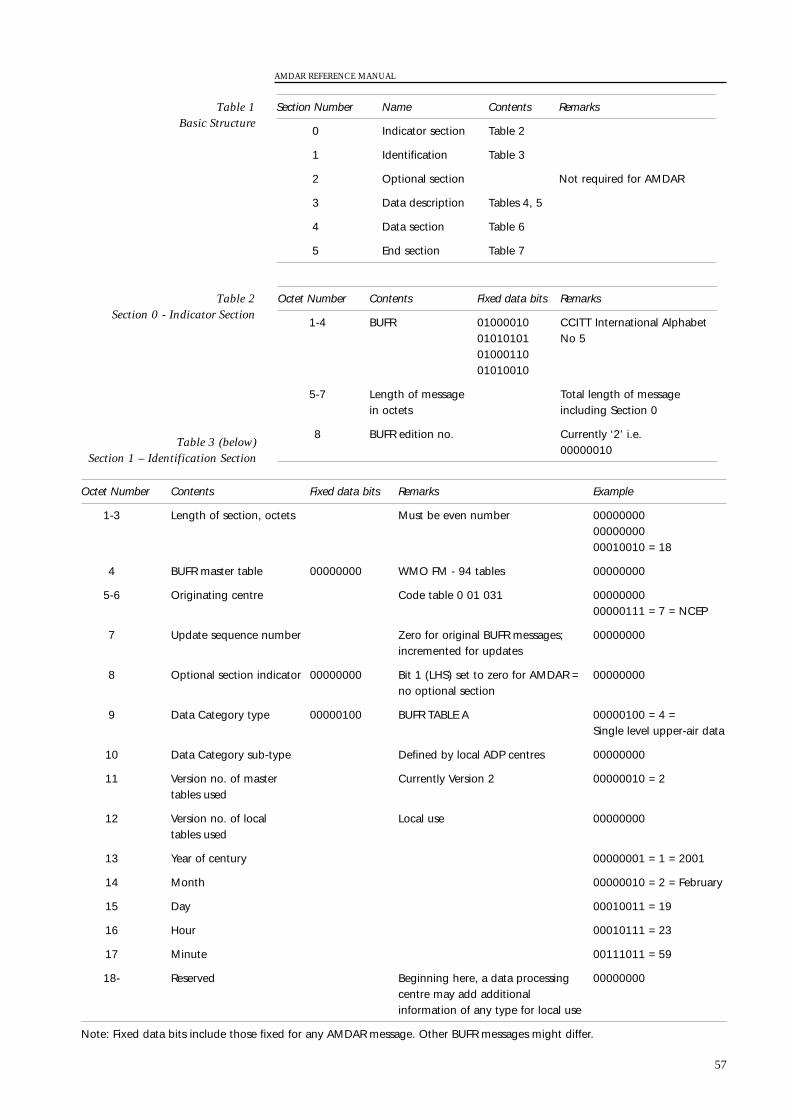
Octet Number Contents Fixed data bits Remarks
1-4 BUFR 01000010 CCITT International Alphabet01010101 No 50100011001010010
5-7 Length of message Total length of messagein octets including Section 0
8 BUFR edition no. Currently ‘2’ i.e.00000010
Section Number Name Contents Remarks
0 Indicator section Table 2
1 Identification Table 3
2 Optional section Not required for AMDAR
3 Data description Tables 4, 5
4 Data section Table 6
5 End section Table 7
AMDAR REFERENCE MANUAL
57
Table 1Basic Structure
Table 2Section 0 - Indicator Section
Table 3 (below)Section 1 – Identification Section
Octet Number Contents Fixed data bits Remarks Example
1-3 Length of section, octets Must be even number 000000000000000000010010 = 18
4 BUFR master table 00000000 WMO FM - 94 tables 00000000
5-6 Originating centre Code table 0 01 031 0000000000000111 = 7 = NCEP
7 Update sequence number Zero for original BUFR messages; 00000000incremented for updates
8 Optional section indicator 00000000 Bit 1 (LHS) set to zero for AMDAR = 00000000no optional section
9 Data Category type 00000100 BUFR TABLE A 00000100 = 4 =Single level upper-air data
10 Data Category sub-type Defined by local ADP centres 00000000
11 Version no. of master Currently Version 2 00000010 = 2tables used
12 Version no. of local Local use 00000000tables used
13 Year of century 00000001 = 1 = 2001
14 Month 00000010 = 2 = February
15 Day 00010011 = 19
16 Hour 00010111 = 23
17 Minute 00111011 = 59
18- Reserved Beginning here, a data processing 00000000centre may add additional information of any type for local use
Note: Fixed data bits include those fixed for any AMDAR message. Other BUFR messages might differ.
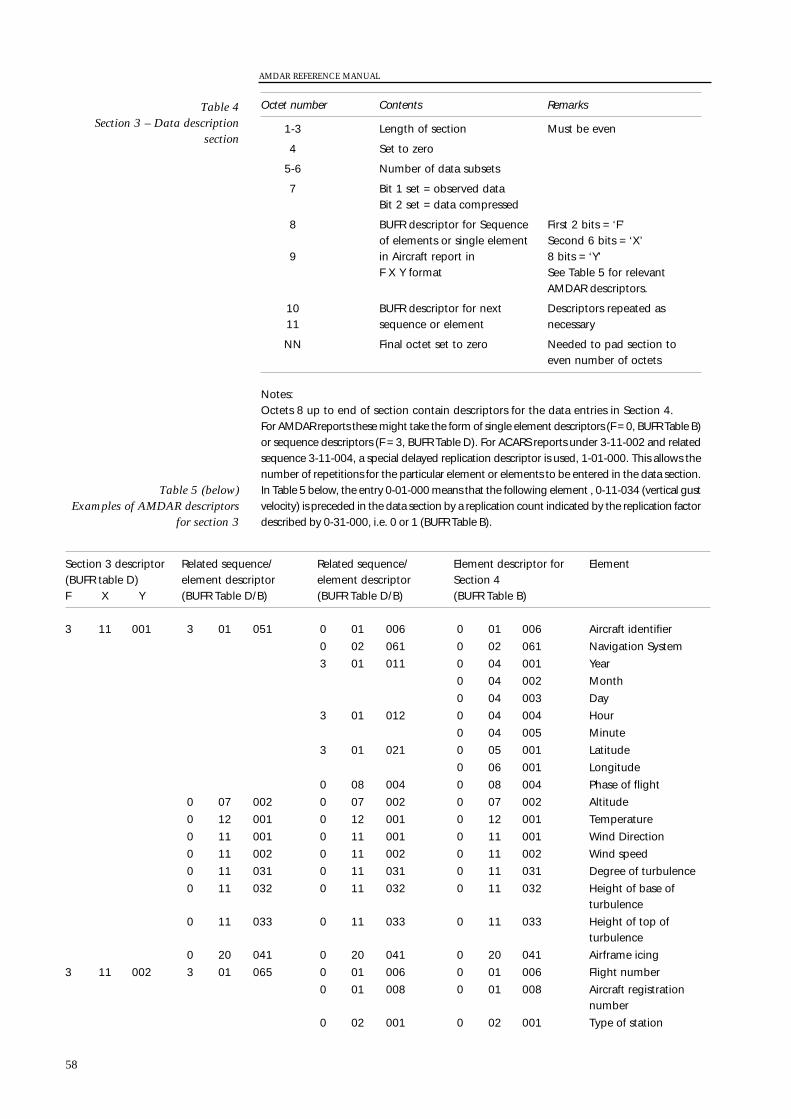
AMDAR REFERENCE MANUAL
58
Octet number Contents Remarks
1-3 Length of section Must be even
4 Set to zero
5-6 Number of data subsets
7 Bit 1 set = observed dataBit 2 set = data compressed
8 BUFR descriptor for Sequence First 2 bits = ‘F’ of elements or single element Second 6 bits = ‘X’
9 in Aircraft report in 8 bits = ‘Y’ F X Y format See Table 5 for relevant
AMDAR descriptors.
10 BUFR descriptor for next Descriptors repeated as11 sequence or element necessary
NN Final octet set to zero Needed to pad section toeven number of octets
Notes:Octets 8 up to end of section contain descriptors for the data entries in Section 4.For AMDAR reports these might take the form of single element descriptors (F = 0, BUFR Table B)or sequence descriptors (F = 3, BUFR Table D). For ACARS reports under 3-11-002 and relatedsequence 3-11-004, a special delayed replication descriptor is used, 1-01-000. This allows thenumber of repetitions for the particular element or elements to be entered in the data section.In Table 5 below, the entry 0-01-000 means that the following element , 0-11-034 (vertical gustvelocity) is preceded in the data section by a replication count indicated by the replication factordescribed by 0-31-000, i.e. 0 or 1 (BUFR Table B).
Table 4Section 3 – Data description
section
Table 5 (below)Examples of AMDAR descriptors
for section 3
Section 3 descriptor Related sequence/ Related sequence/ Element descriptor for Element(BUFR table D) element descriptor element descriptor Section 4F X Y (BUFR Table D/B) (BUFR Table D/B) (BUFR Table B)
3 11 001 3 01 051 0 01 006 0 01 006 Aircraft identifier
0 02 061 0 02 061 Navigation System
3 01 011 0 04 001 Year
0 04 002 Month
0 04 003 Day
3 01 012 0 04 004 Hour
0 04 005 Minute
3 01 021 0 05 001 Latitude
0 06 001 Longitude
0 08 004 0 08 004 Phase of flight
0 07 002 0 07 002 0 07 002 Altitude
0 12 001 0 12 001 0 12 001 Temperature
0 11 001 0 11 001 0 11 001 Wind Direction
0 11 002 0 11 002 0 11 002 Wind speed
0 11 031 0 11 031 0 11 031 Degree of turbulence
0 11 032 0 11 032 0 11 032 Height of base ofturbulence
0 11 033 0 11 033 0 11 033 Height of top ofturbulence
0 20 041 0 20 041 0 20 041 Airframe icing
3 11 002 3 01 065 0 01 006 0 01 006 Flight number
0 01 008 0 01 008 Aircraft registrationnumber
0 02 001 0 02 001 Type of station
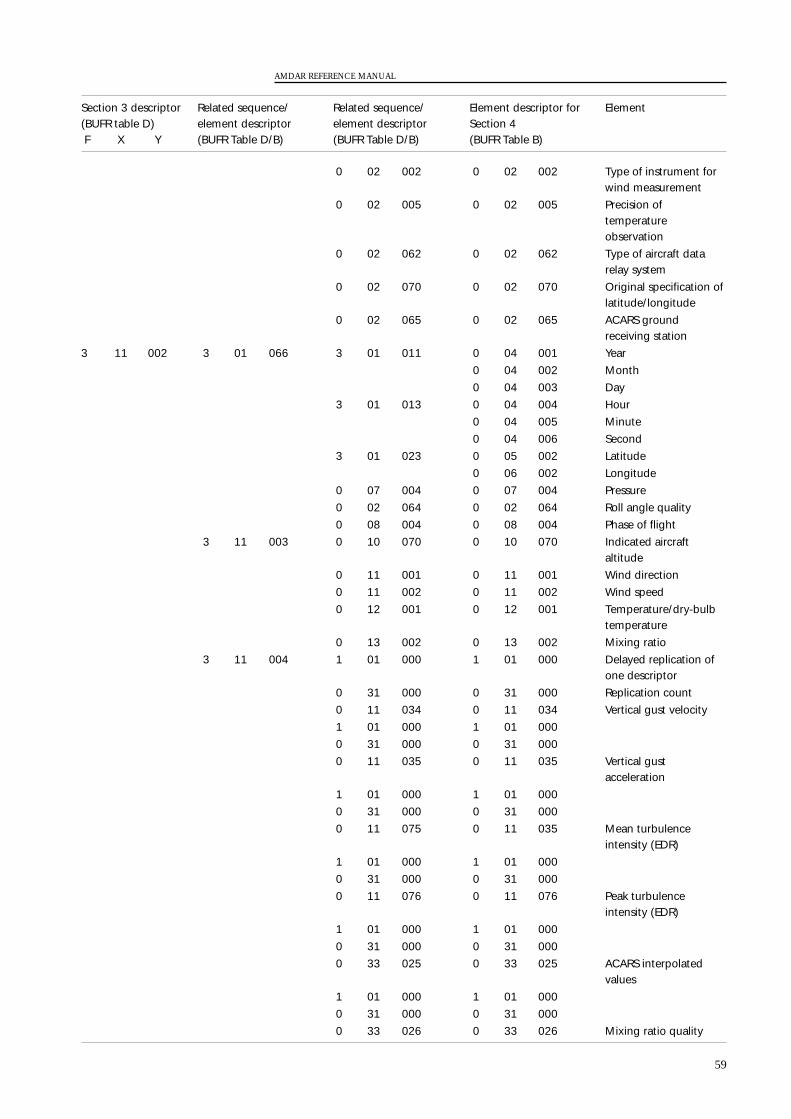
AMDAR REFERENCE MANUAL
59
Section 3 descriptor Related sequence/ Related sequence/ Element descriptor for Element(BUFR table D) element descriptor element descriptor Section 4F X Y (BUFR Table D/B) (BUFR Table D/B) (BUFR Table B)
0 02 002 0 02 002 Type of instrument forwind measurement
0 02 005 0 02 005 Precision oftemperatureobservation
0 02 062 0 02 062 Type of aircraft datarelay system
0 02 070 0 02 070 Original specification oflatitude/longitude
0 02 065 0 02 065 ACARS groundreceiving station
3 11 002 3 01 066 3 01 011 0 04 001 Year
0 04 002 Month
0 04 003 Day
3 01 013 0 04 004 Hour
0 04 005 Minute
0 04 006 Second
3 01 023 0 05 002 Latitude
0 06 002 Longitude
0 07 004 0 07 004 Pressure
0 02 064 0 02 064 Roll angle quality
0 08 004 0 08 004 Phase of flight
3 11 003 0 10 070 0 10 070 Indicated aircraftaltitude
0 11 001 0 11 001 Wind direction
0 11 002 0 11 002 Wind speed
0 12 001 0 12 001 Temperature/dry-bulbtemperature
0 13 002 0 13 002 Mixing ratio
3 11 004 1 01 000 1 01 000 Delayed replication ofone descriptor
0 31 000 0 31 000 Replication count
0 11 034 0 11 034 Vertical gust velocity
1 01 000 1 01 000
0 31 000 0 31 000
0 11 035 0 11 035 Vertical gustacceleration
1 01 000 1 01 000
0 31 000 0 31 000
0 11 075 0 11 035 Mean turbulenceintensity (EDR)
1 01 000 1 01 000
0 31 000 0 31 000
0 11 076 0 11 076 Peak turbulenceintensity (EDR)
1 01 000 1 01 000
0 31 000 0 31 000
0 33 025 0 33 025 ACARS interpolatedvalues
1 01 000 1 01 000
0 31 000 0 31 000
0 33 026 0 33 026 Mixing ratio quality
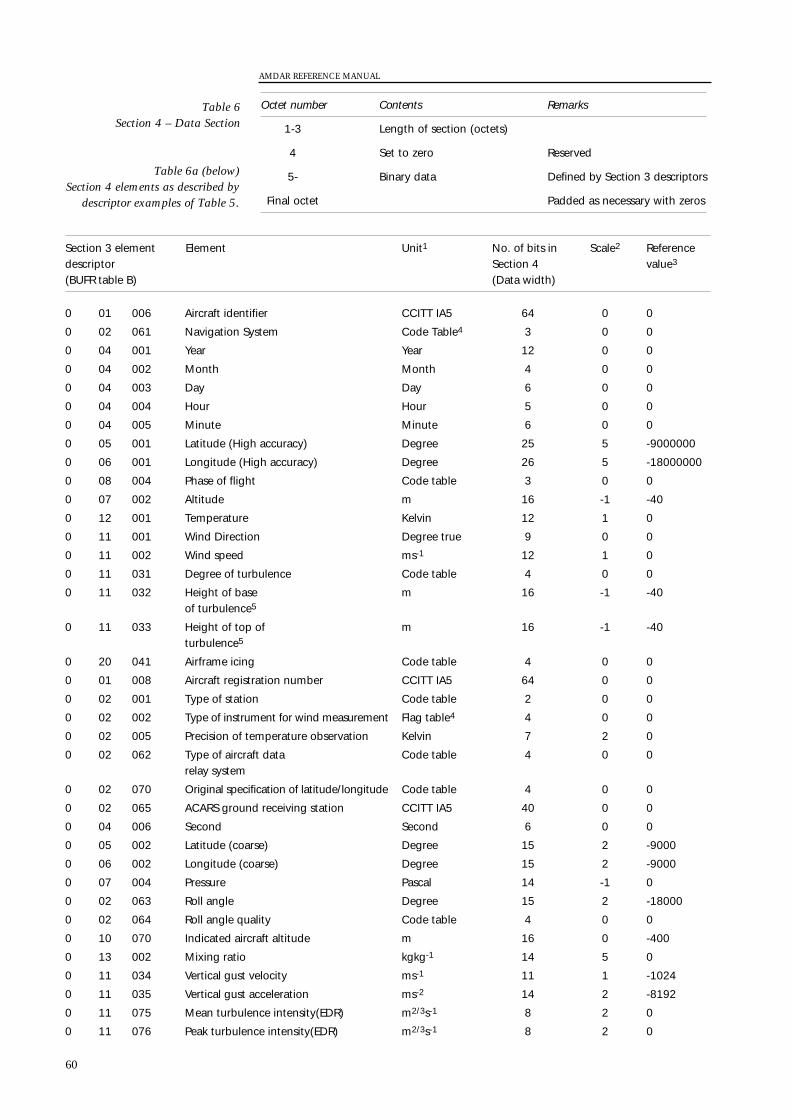
Octet number Contents Remarks
1-3 Length of section (octets)
4 Set to zero Reserved
5- Binary data Defined by Section 3 descriptors
Final octet Padded as necessary with zeros
AMDAR REFERENCE MANUAL
60
Table 6Section 4 – Data Section
Table 6a (below)Section 4 elements as described by
descriptor examples of Table 5.
Section 3 element Element Unit1 No. of bits in Scale2 Reference descriptor Section 4 value3
(BUFR table B) (Data width)
0 01 006 Aircraft identifier CCITT IA5 64 0 0
0 02 061 Navigation System Code Table4 3 0 0
0 04 001 Year Year 12 0 0
0 04 002 Month Month 4 0 0
0 04 003 Day Day 6 0 0
0 04 004 Hour Hour 5 0 0
0 04 005 Minute Minute 6 0 0
0 05 001 Latitude (High accuracy) Degree 25 5 -9000000
0 06 001 Longitude (High accuracy) Degree 26 5 -18000000
0 08 004 Phase of flight Code table 3 0 0
0 07 002 Altitude m 16 -1 -40
0 12 001 Temperature Kelvin 12 1 0
0 11 001 Wind Direction Degree true 9 0 0
0 11 002 Wind speed ms-1 12 1 0
0 11 031 Degree of turbulence Code table 4 0 0
0 11 032 Height of base m 16 -1 -40of turbulence5
0 11 033 Height of top of m 16 -1 -40turbulence5
0 20 041 Airframe icing Code table 4 0 0
0 01 008 Aircraft registration number CCITT IA5 64 0 0
0 02 001 Type of station Code table 2 0 0
0 02 002 Type of instrument for wind measurement Flag table4 4 0 0
0 02 005 Precision of temperature observation Kelvin 7 2 0
0 02 062 Type of aircraft data Code table 4 0 0relay system
0 02 070 Original specification of latitude/longitude Code table 4 0 0
0 02 065 ACARS ground receiving station CCITT IA5 40 0 0
0 04 006 Second Second 6 0 0
0 05 002 Latitude (coarse) Degree 15 2 -9000
0 06 002 Longitude (coarse) Degree 15 2 -9000
0 07 004 Pressure Pascal 14 -1 0
0 02 063 Roll angle Degree 15 2 -18000
0 02 064 Roll angle quality Code table 4 0 0
0 10 070 Indicated aircraft altitude m 16 0 -400
0 13 002 Mixing ratio kgkg-1 14 5 0
0 11 034 Vertical gust velocity ms-1 11 1 -1024
0 11 035 Vertical gust acceleration ms-2 14 2 -8192
0 11 075 Mean turbulence intensity(EDR) m2/3s-1 8 2 0
0 11 076 Peak turbulence intensity(EDR) m2/3s-1 8 2 0
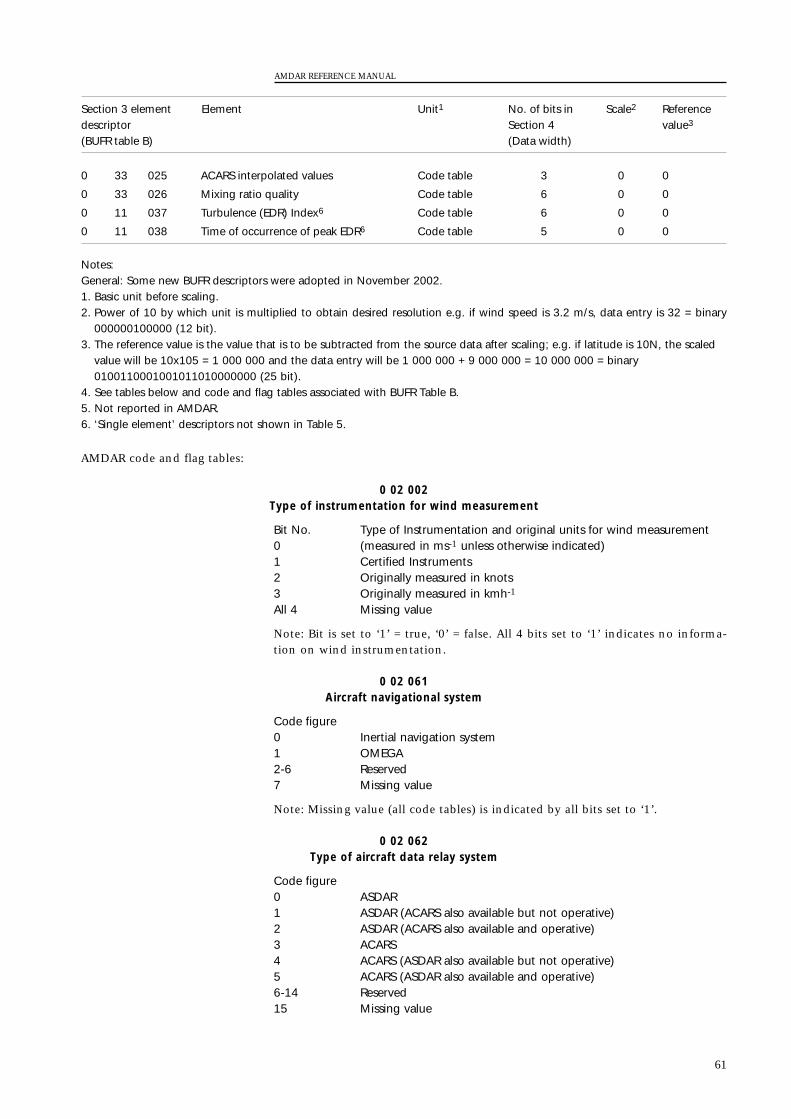
AMDAR code and flag tables:
0 02 002Type of instrumentation for wind measurement
Bit No. Type of Instrumentation and original units for wind measurement0 (measured in ms-1 unless otherwise indicated)1 Certified Instruments2 Originally measured in knots3 Originally measured in kmh-1
All 4 Missing value
Note: Bit is set to ‘1’ = true, ‘0’ = false. All 4 bits set to ‘1’ indicates no informa-tion on wind instrumentation.
0 02 061Aircraft navigational system
Code figure0 Inertial navigation system1 OMEGA2-6 Reserved7 Missing value
Note: Missing value (all code tables) is indicated by all bits set to ‘1’.
0 02 062Type of aircraft data relay system
Code figure0 ASDAR1 ASDAR (ACARS also available but not operative)2 ASDAR (ACARS also available and operative)3 ACARS4 ACARS (ASDAR also available but not operative)5 ACARS (ASDAR also available and operative)6-14 Reserved15 Missing value
AMDAR REFERENCE MANUAL
61
Section 3 element Element Unit1 No. of bits in Scale2 Reference descriptor Section 4 value3
(BUFR table B) (Data width)
0 33 025 ACARS interpolated values Code table 3 0 0
0 33 026 Mixing ratio quality Code table 6 0 0
0 11 037 Turbulence (EDR) Index6 Code table 6 0 0
0 11 038 Time of occurrence of peak EDR6 Code table 5 0 0
Notes:General: Some new BUFR descriptors were adopted in November 2002.1. Basic unit before scaling.2. Power of 10 by which unit is multiplied to obtain desired resolution e.g. if wind speed is 3.2 m/s, data entry is 32 = binary
000000100000 (12 bit).3. The reference value is the value that is to be subtracted from the source data after scaling; e.g. if latitude is 10N, the scaled
value will be 10x105 = 1 000 000 and the data entry will be 1 000 000 + 9 000 000 = 10 000 000 = binary0100110001001011010000000 (25 bit).
4. See tables below and code and flag tables associated with BUFR Table B.5. Not reported in AMDAR.6. ‘Single element’ descriptors not shown in Table 5.
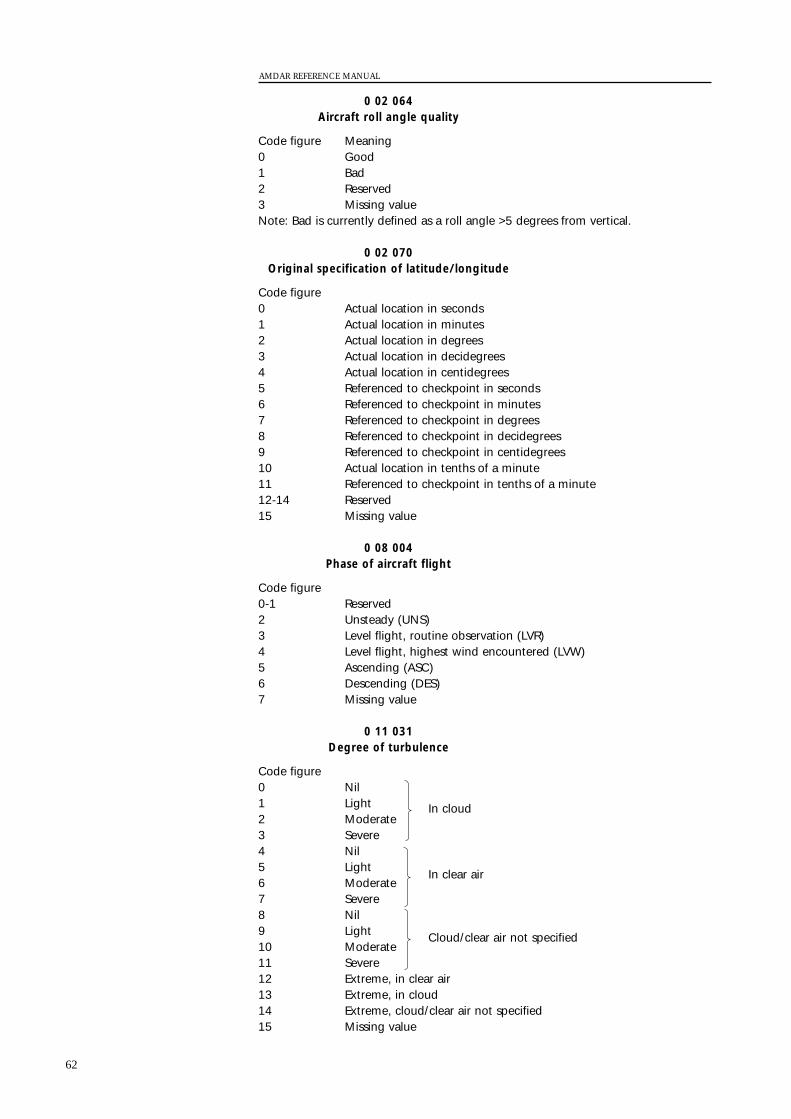
0 02 064Aircraft roll angle quality
Code figure Meaning0 Good1 Bad2 Reserved3 Missing valueNote: Bad is currently defined as a roll angle >5 degrees from vertical.
0 02 070Original specification of latitude/longitude
Code figure0 Actual location in seconds1 Actual location in minutes2 Actual location in degrees3 Actual location in decidegrees4 Actual location in centidegrees5 Referenced to checkpoint in seconds6 Referenced to checkpoint in minutes7 Referenced to checkpoint in degrees8 Referenced to checkpoint in decidegrees9 Referenced to checkpoint in centidegrees10 Actual location in tenths of a minute11 Referenced to checkpoint in tenths of a minute12-14 Reserved15 Missing value
0 08 004Phase of aircraft flight
Code figure0-1 Reserved2 Unsteady (UNS)3 Level flight, routine observation (LVR)4 Level flight, highest wind encountered (LVW)5 Ascending (ASC)6 Descending (DES)7 Missing value
0 11 031Degree of turbulence
Code figure0 Nil1 Light2 Moderate3 Severe4 Nil5 Light6 Moderate7 Severe8 Nil9 Light10 Moderate11 Severe12 Extreme, in clear air13 Extreme, in cloud14 Extreme, cloud/clear air not specified15 Missing value
AMDAR REFERENCE MANUAL
62
In cloud
In clear air
Cloud/clear air not specified
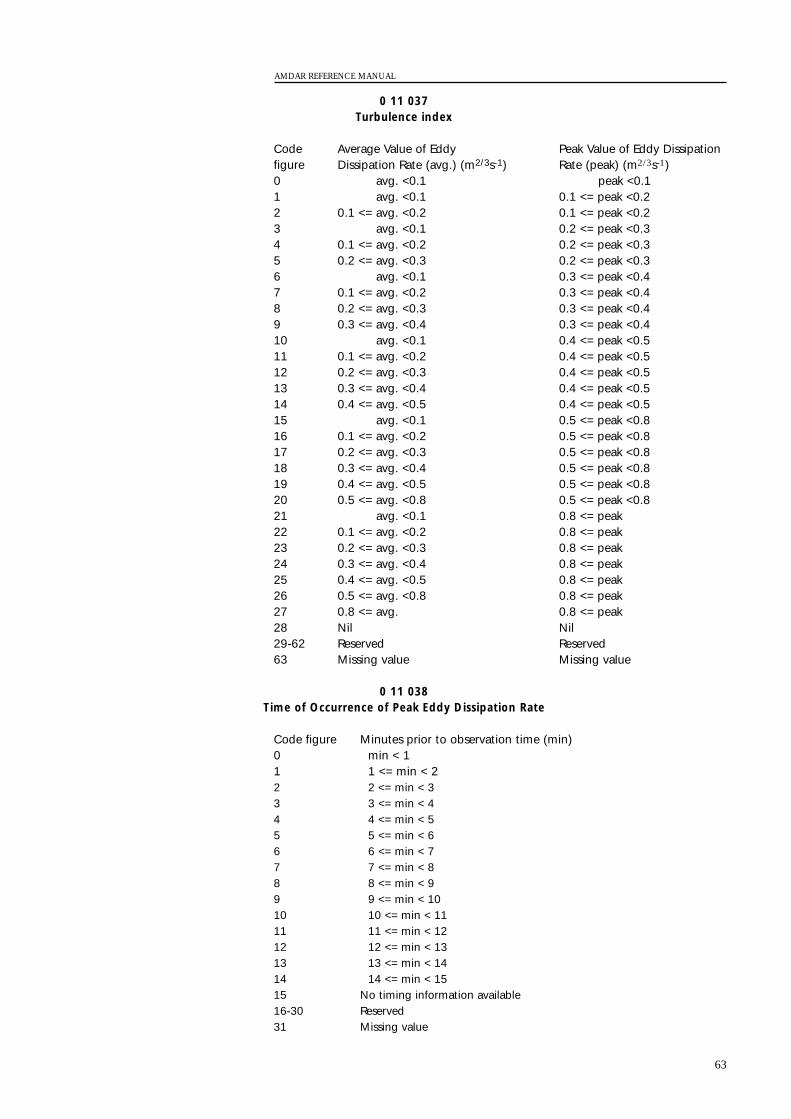
0 11 037Turbulence index
Code Average Value of Eddy Peak Value of Eddy Dissipationfigure Dissipation Rate (avg.) (m2/3s-1) Rate (peak) (m2/3s-1)0 avg. <0.1 peak <0.11 avg. <0.1 0.1 <= peak <0.22 0.1 <= avg. <0.2 0.1 <= peak <0.23 avg. <0.1 0.2 <= peak <0.34 0.1 <= avg. <0.2 0.2 <= peak <0.35 0.2 <= avg. <0.3 0.2 <= peak <0.36 avg. <0.1 0.3 <= peak <0.47 0.1 <= avg. <0.2 0.3 <= peak <0.48 0.2 <= avg. <0.3 0.3 <= peak <0.49 0.3 <= avg. <0.4 0.3 <= peak <0.410 avg. <0.1 0.4 <= peak <0.511 0.1 <= avg. <0.2 0.4 <= peak <0.512 0.2 <= avg. <0.3 0.4 <= peak <0.513 0.3 <= avg. <0.4 0.4 <= peak <0.514 0.4 <= avg. <0.5 0.4 <= peak <0.515 avg. <0.1 0.5 <= peak <0.816 0.1 <= avg. <0.2 0.5 <= peak <0.817 0.2 <= avg. <0.3 0.5 <= peak <0.818 0.3 <= avg. <0.4 0.5 <= peak <0.819 0.4 <= avg. <0.5 0.5 <= peak <0.820 0.5 <= avg. <0.8 0.5 <= peak <0.821 avg. <0.1 0.8 <= peak22 0.1 <= avg. <0.2 0.8 <= peak23 0.2 <= avg. <0.3 0.8 <= peak24 0.3 <= avg. <0.4 0.8 <= peak25 0.4 <= avg. <0.5 0.8 <= peak26 0.5 <= avg. <0.8 0.8 <= peak27 0.8 <= avg. 0.8 <= peak28 Nil Nil29-62 Reserved Reserved63 Missing value Missing value
0 11 038Time of Occurrence of Peak Eddy Dissipation Rate
Code figure Minutes prior to observation time (min)0 min < 11 1 <= min < 22 2 <= min < 33 3 <= min < 44 4 <= min < 55 5 <= min < 66 6 <= min < 77 7 <= min < 88 8 <= min < 99 9 <= min < 1010 10 <= min < 1111 11 <= min < 1212 12 <= min < 1313 13 <= min < 1414 14 <= min < 1515 No timing information available16-30 Reserved31 Missing value
AMDAR REFERENCE MANUAL
63
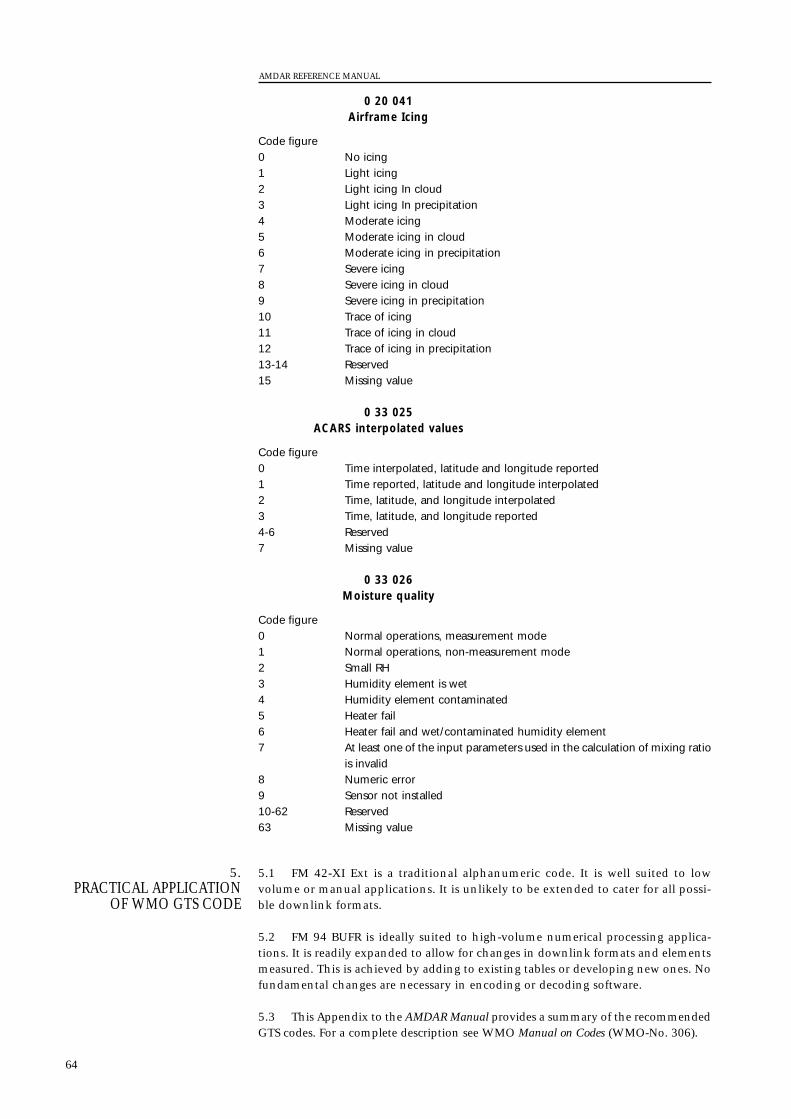
0 20 041Airframe Icing
Code figure0 No icing1 Light icing2 Light icing In cloud3 Light icing In precipitation4 Moderate icing5 Moderate icing in cloud6 Moderate icing in precipitation7 Severe icing8 Severe icing in cloud9 Severe icing in precipitation10 Trace of icing11 Trace of icing in cloud12 Trace of icing in precipitation13-14 Reserved15 Missing value
0 33 025ACARS interpolated values
Code figure0 Time interpolated, latitude and longitude reported1 Time reported, latitude and longitude interpolated2 Time, latitude, and longitude interpolated3 Time, latitude, and longitude reported4-6 Reserved7 Missing value
0 33 026Moisture quality
Code figure0 Normal operations, measurement mode1 Normal operations, non-measurement mode2 Small RH3 Humidity element is wet4 Humidity element contaminated5 Heater fail6 Heater fail and wet/contaminated humidity element7 At least one of the input parameters used in the calculation of mixing ratio
is invalid8 Numeric error9 Sensor not installed10-62 Reserved63 Missing value
5.1 FM 42-XI Ext is a traditional alphanumeric code. It is well suited to lowvolume or manual applications. It is unlikely to be extended to cater for all possi-ble downlink formats.
5.2 FM 94 BUFR is ideally suited to high-volume numerical processing applica-tions. It is readily expanded to allow for changes in downlink formats and elementsmeasured. This is achieved by adding to existing tables or developing new ones. Nofundamental changes are necessary in encoding or decoding software.
5.3 This Appendix to the AMDAR Manual provides a summary of the recommendedGTS codes. For a complete description see WMO Manual on Codes (WMO-No. 306).
5. PRACTICAL APPLICATION
OF WMO GTS CODE
AMDAR REFERENCE MANUAL
64
6.1 Once encoded in a suitable GTS code, AMDAR data are organized into‘bulletins’ at the data reception centres. A bulletin might consist of a batch ofobservations from a single aircraft or observations from several aircraft. Bulletinsare usually compiled at regular intervals such that delays in data reception arekept as far as possible within model cut-off times. As a further aid to data manage-ment, it is desirable to batch data in specific geographical regions. This will allowswitching centres to direct data to appropriate users without the need to sort indi-vidual observations.
6.2 AMDAR GTS bulletin headers should take the form:(a) For FM 42 data: UDAAII<<originating centre>>
where: UD signifies FM42 AMDAR; andAA indicates geographical region appropriate for the first observation inthe bulletin, according to the table below.
(b) For FM 94 BUFR data, the GTS bulletin headers should take the form: IUAX01 <<originating centre>>.
where: I signifies BUFR code;U signifies upper air data;A signifies single level AMDAR data; andX signifies the geographical region, according to the following table:
Note: If the BUFR bulletin contains data from several aircraft flying in differentsectors of the globe, X should be coded ‘X’.
6. DATA DISSEMINATION
AMDAR REFERENCE MANUAL
65
0 180E180W
90N
70N
30N
0
60S
90S
140W 100W 60W 50E 110E 150E20W
AC
PN NT PNNA AS
EU
AF
PS SA IO OC
AA
90E180W
90N
90S
23.5N
23.5S
90W 0 180E
B A D C
J I L K
F E H G
7.1 An important element of AMDARDM is data quality control (Q/C). Q/Capplies to all stages of the data management chain, from on-board data process-ing, message compilation, air-ground data link, coding, data dissemination, dataassimilation and data archiving.
7.2 AMDAR Quality Management (AMDARQM) is a subset of AMDARDM andis designed as a closed feedback system. Q/C activities take place on varioustimescales according to data application. The basic building blocks are:(a) On-board quality control;(b) Real-time quality control prior to bulletin assembly and data dissemination;(c) Real-time quality control for numerical model assimilation;(d) Near real-time quality evaluation;(e) Quality control for data archiving; and(f) Quality feedback and reporting system.
The AMDAR Panel guidelines appropriate to each of the above elements are givenin sections 7.3 to 7.8.
7.3 On-board quality control.(a) Range or gross error check:
Data values falling outside the ‘range’ intervals given in the table below or alreadyflagged in the aircraft data acquisition system shall be replaced by values repre-senting missing or erroneous data.
(b) Smoothing and sequential checks:On most modern aircraft the data are updated several times per second and indi-vidual samples may have been smoothed and/or subjected to quality checks inthe avionics system. It is desirable that this process is standardized to ensureconsistency between observations from different data acquisition and on-boardcomputing systems. The recommended procedures are outlined below.
(i) Data should be smoothed as shown in the table below to reduce randomerror and standardise representativeness;
Element Unit Range
Pressure altitude Foot (ft) -1000 to 50 000Static air temperature °C -99 to 99Wind direction ° from true N 1 to 360Wind speed Knot (kt) 0 to 800Latitude Degree: minute 90:00S to 90:00NLongitude Degree: minute 180:00E to 180:00WTime (UTC) Hour: Minute: Second 00:00:00 to 23:59:59Turbulence (g) g -3 to 6Turbulence (DEVG) ms-1 0 to 20Turbulence (EDR) m2/3s-1 0 to 1Humidity (RH) % 0 to 100Humidity (dew pt.) °C -99 to +49Humidity (mixing ratio) gram/kg 0 to 100
Note: Time (UTC) should be checked routinely against the aircraft master clock.
7. DATA QUALITY CONTROL
AMDAR REFERENCE MANUAL
66
An alternative, efficient approach is to use a continuous exponential smoothingalgorithm such as that given below:
If yn is the nth raw data sample, t the sampling interval, T the averaging time andYn the corresponding smoothed value, then:
Yn = 3t(yn – Yn-1)/ T + Yn-1
Note: It is assumed that T is much larger than t e.g. T=10s, t<1s.
(ii) To remove ‘spikes’ from noisy data, a sequential quality check can beemployed. This check is especially important when a maximum value is tobe observed (e.g. maximum wind). A suitable algorithm is given below:
Element Averaging Time(s)Ascent/descent phase Level flight phase,>20 000ft
7 Pressure altitude 10s 30s8 Static air temperature 10s 30s9 Humidity, RH 10s 30s10 Wind direction 10s 30s11 Wind speed 10s 30s
Note: The smoothing time is the arithmetic averaging time to be applied.
AMDAR REFERENCE MANUAL
67
Start
no no
yes
yes
Is difference
Xn - X(n-1) <d
Read new value (Xn)Read new value (Xn)
Update AnAn = Xn
Is differenceXn - An <d
Xn 6 7 4 10 6 3 10 8 9 At startAn 6 7 4 4 6 3 3 8 At startX(n-1) 6 7 4 10 6 3 10 8 At startAn 7 4 4 6 3 3 8 9 FinishX(n-1) 7 4 10 6 3 10 8 9 Finish
Note: This algorithm rejects single values (Xn) equal or exceeding a designated difference(d) from the previous accepted value (An) and replaces it with the previous accepted value.If a step change occurs, the new level is accepted after one rejection.
(iii) ‘Buddy’ checks:Most aircraft carry multiple sensor arrays. For example, up to four temperatureprobes and at least two pitot-static heads might be installed, thus making itpossible to make more sophisticated checks by comparing data with the alterna-tive sensor or sensors.
(iv) Interdependence:Because the measured elements are highly interdependent, it is possible to flagdoubtful data computed from two or more basic measurements. For example, ifcomparison checks show that static air temperature is doubtful, then wind speedand wind direction can be flagged as doubtful.
7.4 Quality control prior to bulletin assembly and data dissemination.
7.4.1 This process should be carried out in real time. The principal objective is topass high-quality data to the GTS and to the local data assimilation and numeri-cal modelling centre with a minimum of delay.
The recommended Q/C checks to be applied are:(a) Check for transmission errors;(b) Check for duplicates;(c) Range check (as given in 7.3 above);(d) Sequential position and time check for time series data from single aircraft; and(e) Check against QEV reject list.
7.4.2 Data passing these checks are inserted into the GTS and to any local numer-ical processing centre or operational centre as appropriate. All data (exceptduplicates) are passed to the QEV centre.
7.5 Quality Evaluation (QEV)
7.5.1 Here data are checked in near real time against forecast fields (typically thebackground field in a numerical model). Various reports and/or statistics areproduced for each aircraft contributing data to specific internal programmes orperhaps to external programmes as resources allow. The variables subjected to themodel comparisons are usually temperature and wind vector.
7.5.2 For those programmes for which the QEV centre has responsibility, thefollowing actions are recommended:(a) Data availability check;(b) Data timeliness check;(c) Gross error check; and(d) Systematic error check.
7.5.3 For each aircraft, monthly or (preferably) weekly statistics are produced andregular reports provided to the System Manager and to other interested parties.(Daily reports of gross errors are highly desirable at the System Manager level.)
AMDAR REFERENCE MANUAL
68
Example: d = 5
Raw values and correspondingaccepted values are in bold.
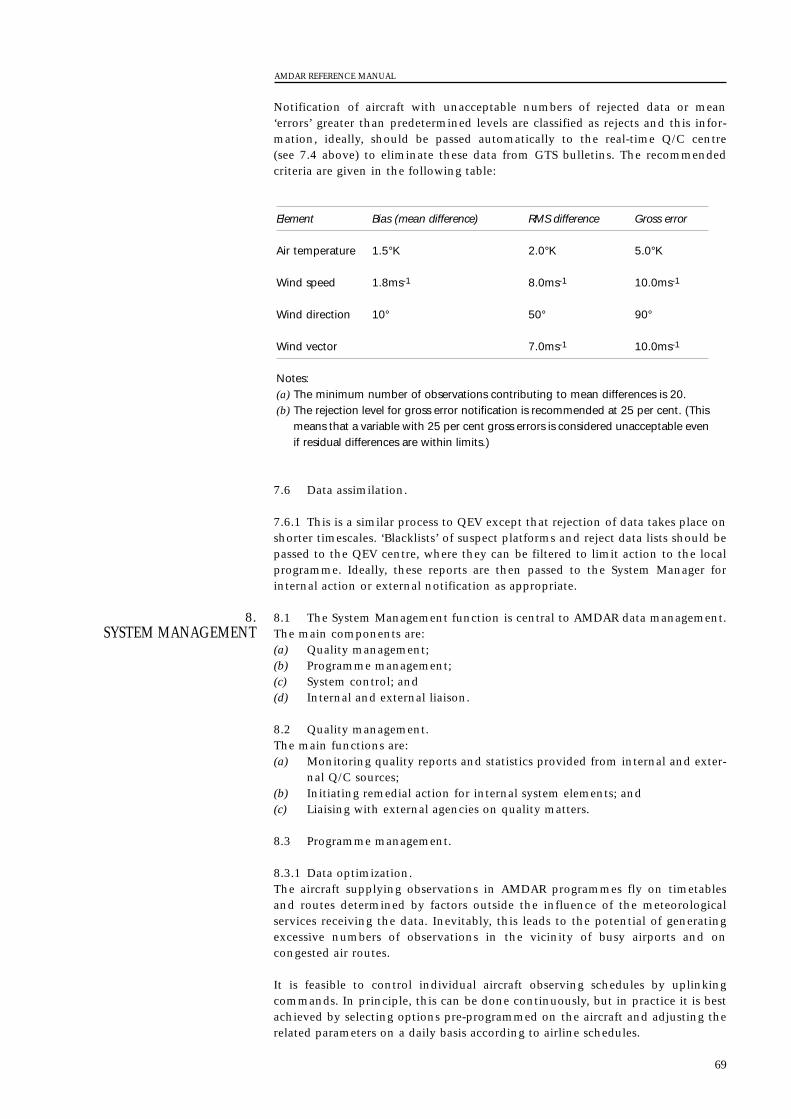
Notification of aircraft with unacceptable numbers of rejected data or mean‘errors’ greater than predetermined levels are classified as rejects and this infor-mation, ideally, should be passed automatically to the real-time Q/C centre(see 7.4 above) to eliminate these data from GTS bulletins. The recommendedcriteria are given in the following table:
7.6 Data assimilation.
7.6.1 This is a similar process to QEV except that rejection of data takes place onshorter timescales. ‘Blacklists’ of suspect platforms and reject data lists should bepassed to the QEV centre, where they can be filtered to limit action to the localprogramme. Ideally, these reports are then passed to the System Manager forinternal action or external notification as appropriate.
8.1 The System Management function is central to AMDAR data management.The main components are:(a) Quality management;(b) Programme management;(c) System control; and(d) Internal and external liaison.
8.2 Quality management. The main functions are:(a) Monitoring quality reports and statistics provided from internal and exter-
nal Q/C sources;(b) Initiating remedial action for internal system elements; and(c) Liaising with external agencies on quality matters.
8.3 Programme management.
8.3.1 Data optimization.The aircraft supplying observations in AMDAR programmes fly on timetablesand routes determined by factors outside the influence of the meteorologicalservices receiving the data. Inevitably, this leads to the potential of generatingexcessive numbers of observations in the vicinity of busy airports and oncongested air routes.
It is feasible to control individual aircraft observing schedules by uplinkingcommands. In principle, this can be done continuously, but in practice it is bestachieved by selecting options pre-programmed on the aircraft and adjusting therelated parameters on a daily basis according to airline schedules.
8. SYSTEM MANAGEMENT
Element Bias (mean difference) RMS difference Gross error
Air temperature 1.5°K 2.0°K 5.0°K
Wind speed 1.8ms-1 8.0ms-1 10.0ms-1
Wind direction 10° 50° 90°
Wind vector 7.0ms-1 10.0ms-1
Notes:(a) The minimum number of observations contributing to mean differences is 20.(b) The rejection level for gross error notification is recommended at 25 per cent. (This
means that a variable with 25 per cent gross errors is considered unacceptable evenif residual differences are within limits.)
AMDAR REFERENCE MANUAL
69
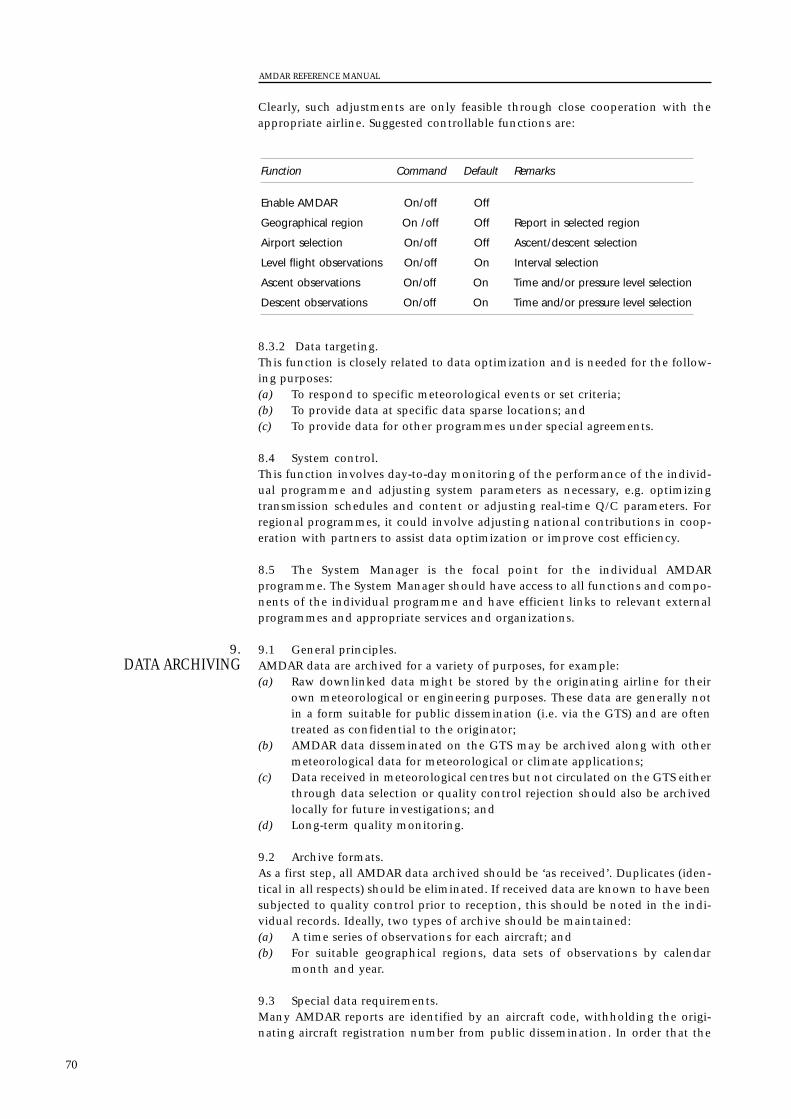
Clearly, such adjustments are only feasible through close cooperation with theappropriate airline. Suggested controllable functions are:
8.3.2 Data targeting.This function is closely related to data optimization and is needed for the follow-ing purposes:(a) To respond to specific meteorological events or set criteria;(b) To provide data at specific data sparse locations; and(c) To provide data for other programmes under special agreements.
8.4 System control.This function involves day-to-day monitoring of the performance of the individ-ual programme and adjusting system parameters as necessary, e.g. optimizingtransmission schedules and content or adjusting real-time Q/C parameters. Forregional programmes, it could involve adjusting national contributions in coop-eration with partners to assist data optimization or improve cost efficiency.
8.5 The System Manager is the focal point for the individual AMDARprogramme. The System Manager should have access to all functions and compo-nents of the individual programme and have efficient links to relevant externalprogrammes and appropriate services and organizations.
9.1 General principles.AMDAR data are archived for a variety of purposes, for example:(a) Raw downlinked data might be stored by the originating airline for their
own meteorological or engineering purposes. These data are generally notin a form suitable for public dissemination (i.e. via the GTS) and are oftentreated as confidential to the originator;
(b) AMDAR data disseminated on the GTS may be archived along with othermeteorological data for meteorological or climate applications;
(c) Data received in meteorological centres but not circulated on the GTS eitherthrough data selection or quality control rejection should also be archivedlocally for future investigations; and
(d) Long-term quality monitoring.
9.2 Archive formats.As a first step, all AMDAR data archived should be ‘as received’. Duplicates (iden-tical in all respects) should be eliminated. If received data are known to have beensubjected to quality control prior to reception, this should be noted in the indi-vidual records. Ideally, two types of archive should be maintained:(a) A time series of observations for each aircraft; and(b) For suitable geographical regions, data sets of observations by calendar
month and year.
9.3 Special data requirements.Many AMDAR reports are identified by an aircraft code, withholding the origi-nating aircraft registration number from public dissemination. In order that the
9. DATA ARCHIVING
Function Command Default Remarks
Enable AMDAR On/off Off
Geographical region On /off Off Report in selected region
Airport selection On/off Off Ascent/descent selection
Level flight observations On/off On Interval selection
Ascent observations On/off On Time and/or pressure level selection
Descent observations On/off On Time and/or pressure level selection
AMDAR REFERENCE MANUAL
70
particular aircraft might be identified in the future (subject to owner agreement)it is desirable to store linking information to the data origins (e.g. programmename, contact organization, etc.) with each record.
10.1 Q/C forum.This is a loose network linking programmes, users and programme managers toinformation on AMDAR programmes and data. Central coordination is providedby the WMO AMDAR Panel mainly through its Technical Coordinator and facili-tated though the AMDAR Panel Web Page on the WMO web server. This page willbe developed to provide links to other sources of AMDAR Q/C data and providecontact lists for AMDAR programmes.
WMO, 1993. Guide on World Weather Watch Data Management (WMO-No. 788).WMO, 1995. Manual on Codes (WMO-No. 306), International Codes, Volume I.1,
Part A-Alphanumeric Codes. WMO, 1995. Manual on Codes (WMO-No. 306), International Codes, Volume I.2,
Part B-Binary Codes.
REFERENCES
10. GLOBAL COOPERATION
AMDAR REFERENCE MANUAL
71

APPENDIX V
THE AMDAR PANEL
1.1 Following on from the successful ASDAR programme, the AMDAR Panelwas formally established in March 1998. At the inaugural meeting the goal, termsof reference, membership and operating procedures were agreed upon. (These arereproduced in full in Annex I and Annex II, respectively) The goal of the AMDARPanel is to enhance the upper-air component of the Composite Observing Systemof the WWW. This is to be achieved through cooperation among Members in theacquisition, exchange and quality control of meteorological observations fromaircraft using automated reporting systems.
1.2 The Panel recognized a fundamental principle of WMO to broaden andenhance the free and unrestricted international exchange of data, and noted theincreasing availability of aircraft platforms with suitable sensors, avionics andcommunications systems. The Panel was established to take advantage of theopportunity to use these new cost-effective global data sources to better respond tothe needs of WMO and WMO-sponsored programmes such as the WWW, WorldClimate Research Programme (WCRP), Global Climate Observing System (GCOS)and Global Ocean Observing System (GOOS), and to bring potential benefits toend-users in aviation and other communities. The Panel is considered necessary toensure a coordinated approach to the development of AMDAR as an operationalglobal programme with particular benefits in data-sparse areas of the world.
1.3 The Panel has held four annual meetings since the Inaugural meeting inMarch 1998. To help facilitate the work of the Panel, a Technical Coordinator (TC)was appointed in April 1999. An AMDAR Trust Fund was established to assist withthe work of the Panel and is reliant on voluntary contributions from Panel members.
2.1 Chairperson: The Panel is supported by an elected chairperson. The current (April 2003) chairperson is:
Mr A.T.F. GrootersRoyal Netherlands Meteorological InstituteWilhelminalaan 10P.O. Box 2013730 AE De BiltThe NetherlandsTel: +31 302 206 691Fax: +31 302 210 407E-mail: [email protected]
2.2 Technical Coordinator:The Panel is supported by a full-time TC, currently:
Mr. J.J. SticklandObservations and Engineering Branch, Bureau of MeteorologyP.O. Box 1289KGPO Melbourne 3001VictoriaAustraliaTel: +613 9669 TBAFax: +613 9669 4168E-mail: [email protected]
2. AMDAR PANEL –
INFORMATION ANDPOINTS OF CONTACT
1. INTRODUCTION
73
The TC is a central point of contact on AMDAR technical issues, especially thoserelating to data quality and availability. The TC assists AMDAR programmemanagers and developers on day-to-day operational matters and technical issues,and provides a link between users and AMDAR Panel facilities and activities.
2.3 WMO Secretariat support:This is provided by the Aeronautical Meteorology Unit of the WMO World Weather Watch Applications Department. Currently, the designated officer is:
Mr N. T. DialloChief, Aeronautical MeteorologyWorld Weather Watch Applications DepartmentWorld Meteorological Organization7 bis, avenue de la PaixCH-1211 Geneva 2SwitzerlandTel: +41 22 730 82 83Fax: +41 22 730 80 21E-mail: [email protected]
AMDAR REFERENCE MANUAL
74
ANNEX I TO APPENDIX V
GOAL AND TERMS OF REFERENCE FOR THE PANEL ON
AIRCRAFT METEOROLOGICAL DATA RELAY (AMDAR PANEL)
The goal of the Panel shall be to enhance the upper-air component of theComposite Observing System of the World Weather Watch through cooperationamong Members in the acquisition, exchange and quality control of meteorolog-ical observations from aircraft using automated reporting systems.
Recognizing a fundamental principle of WMO to broaden and enhance the freeand unrestricted international exchange of data, and noting the increasing avail-ability of aircraft platforms with suitable sensors, avionics and communicationsystems, the Panel is established to take advantage of the opportunity to use thesenew cost-effective global data sources to better respond to the needs of WMO andWMO-sponsored programmes such as the WWW, WCRP, GCOS and GOOS, andto bring potential benefits to end-users in aviation and other communities. ThePanel is considered necessary to ensure a coordinated approach to the develop-ment of AMDAR as an operational global programme with particular benefits indata-sparse areas of the world.
To achieve the goal, the AMDAR Panel shall:
1. Consider the expressed needs of the international meteorological andclimatological communities for data from automated meteorological reports fromaircraft and initiate action from its members, or others as appropriate, to meetthese needs;
2. Facilitate the coordination of existing national and internationalprogrammes of automated meteorological reporting from aircraft so as to opti-mize the provision and timely exchange of high-quality data at minimum cost;
3. Propose, organize and implement, through the coordination of nationaland regional efforts, the expansion of the current and future AMDAR Programme,to obtain such data, particularly in data-sparse areas of the world;
4. Promote the exchange and dissemination of all appropriate automatedmeteorological reports from aircraft through the GTS and other systems asappropriate;
5. Promote the dissemination, exchange and use of information on AMDARdata availability and quality among Members and data providers, with a view toinitiating appropriate corrective action;
6. Promote the exchange of information on AMDAR and encourage the devel-opment and transfer of appropriate technology;
7. Ensure that other bodies actively involved in automated meteorologicalreporting from aircraft are informed of the workings of the Panel and encourage,as appropriate, their participation in Panel deliberations;
8. Make and regularly review administrative arrangements as necessary,including securing the services of a Technical Coordinator when necessary;
9. Promote joint funding arrangements, as appropriate, for the development,implementation and operation of the AMDAR Programme;
AMDAR REFERENCE MANUAL
75

10. Liaise and interact as appropriate with the relevant sections of the aviationcommunity on issues of common concern, such as data acquisition, data manage-ment, communications and costs; and
11. Submit annual progress reports to WMO’s Executive Council.
AMDAR REFERENCE MANUAL
76
ANNEX II TO APPENDIX V
MEMBERSHIP AND OPERATING PROCEDURES FOR THE PANEL
ON AIRCRAFT METEOROLOGICAL DATA RELAY (AMDAR PANEL)
The Panel is recognized as a body within the WMO structure, with the endorse-ment of the WMO Executive Council, fostering active cooperation amongMembers in the implementation and operation of AMDAR as a component of theWWW Composite Observing System.
Members:
Panel members shall be Members of WMO that operate or intend to operateAMDAR programmes and are willing to contribute to the Panel’s activities.
Observers:
Representatives of any organization or programme actively involved in the use,development, collection or provision of automated meteorological reports fromaircraft, or which specifically require such data, may be invited to participate asobservers in meetings of the Panel.
Operating procedures of the Panel:
1. The Panel will normally meet annually. It will elect a chairperson and vice-chairperson from among the representatives of the Panel members, and willappoint working groups as necessary to carry out the agreed work programme ofthe Panel between sessions. The chairperson will prepare reports for WMO, asrequired;
2. The chairperson may call on representatives of individual Panel membersfor assistance in matters such as the representation of the Panel at meetings ofother bodies, the preparation of reports on specific topics, etc.;
3. A Technical Coordinator may be appointed to support the work of thePanel. The costs associated with this position will be supported through contri-butions to a trust fund;
4. A biennial budget will be developed and approved by the Panel. This budgetand associated income and expenditure will be reviewed at the annual meeting ofthe Panel;
5. The WMO Secretary-General will provide appropriate support to the Paneland manage any trust fund established;
6. The working language of the Panel shall be English;
7. The Panel’s Terms of Reference, membership and operating procedures shallbe reviewed and revised as necessary at the annual meeting. The chairperson shallprepare recommendations to be distributed before the meeting.
AMDAR REFERENCE MANUAL
77


APPENDIX VI
ACRONYMS AND BIBLIOGRAPHY
ACARS Aircraft Communication Addressing and Reporting SystemACMS Aircraft Condition Monitoring SystemADC Air Data ComputerADS Automatic Dependent SurveillanceAEEC Airlines Electronic Engineering CommitteeAIREP air reportAMDAR Aircraft Meteorological Data RelayAMDARDM AMDAR Data ManagementAPF AMDAR Panel FormatARINC Aeronautical Radio, IncorporatedASDAR Aircraft to Satellite Data RelayATC Air Traffic ControlATM Air Traffic ManagementATS Air Traffic ServicesCAeM Commission for Aeronautical MeteorologyCAT Clear Air TurbulenceCBS Commission for Basic SystemsCIMO Commission for Instruments and Methods of ObservationCMM Commission for Marine MeteorologyCOADS Comprehensive Ocean-Atmosphere Data SetCPDLC Controller Pilot Data Link CommunicationDEVG Derived Equivalent Vertical GustDRSC Data Reception and Switching CentreEDR Eddy Dissipation RateFGGE First GARP Global ExperimentGARP Global Atmospheric Research ProgrammeGCOS Global Climate Observing SystemGDPS Global Data Processing SystemGMS Geostationary Meteorological Satellite (Japan)GOES Geostationary Operational Environmental Satellite (United States)GOOS Global Ocean Observing SystemGOS Global Observing SystemGPS Global Positioning SystemGTS Global Telecommunication SystemIATA International Air Transport AssociationICAO International Civil Aviation OrganizationIDCS International Data Collection SystemIRU Inertial Reference UnitKNMI Royal Netherlands Meteorological InstituteMDCRS Meteorological Data Collection and Reporting SystemNASA National Aeronautics and Space Administration (United States)NOAA National Oceanic and Atmospheric Administration (United States)NWP Numerical Weather PredictionNWS National Weather Service (United States)OCAP Operating Consortium of ASDAR ParticipantsOGP Office of Global Programs (NOAA)PIREP Pilot ReportQ/C Quality ControlQEV Quality EvaluationRAFC Regional Area Forecast CentreRMS Root Mean SquareRTH Regional Telecommunications Hub
1. LIST OF ACRONYMS
AMDAR REFERENCE MANUAL
79
SAT Static Air TemperatureTAT Total Air TemperatureUTC Universal Time CoordinateWAFC World Area Forecast CentreWMO World Meteorological OrganizationVHF Very High FrequencyWCRP World Climate Research ProgrammeWVMR Water Vapour Mixing RatioWWW World Weather WatchWWWDM WWW Data Management
Guide to Meteorological Instruments and Methods of Observation (WMO-No. 8), 1996.
Technical Regulations (WMO-No. 49), Volume II- Meteorological Service forInternational Air Navigation, 1992.
Manual on Codes – International Codes (WMO-No. 306), Volume I.1 Part A:Alphanumeric Codes, Volume I.2 Part B: Binary Codes, 1995.
Manual on the Global Telecommunication System (WMO-No. 386), Volume I - GlobalAspects, 1992, Volume II - Regional Aspects, 1991.
Manual on the Global Data Processing System, (WMO-No. 485), Volume I - GlobalAspects, 1991, Volume II - Regional Aspects, 1992.
Manual on the Global Observing System, (WMO-No. 544), Volume I - GlobalAspects, Volume II - Regional Aspects, 1981.
Guide to WMO Binary Code Forms (WMO/TD-No. 611 (WWW-17)): Part 1- Guideto FM 94 BUFR, 1994.
Annex 3 – Meteorological Service for International Air Navigation, 1998.
Rules of the air and air traffic services, Procedures for Air Navigation Services, (Doc4444-RAC/501) 1996.
2.3ICAO DOCUMENTS
2.2WMO TECHNICAL
REPORTS
2. BIBLIOGRAPHY
2.1WMO PUBLICATIONS
AMDAR REFERENCE MANUAL
80