Embed Size (px)
Citation preview
Aircraft Performance
Aircraft performance includes many aspects of the airplane operation. Here we deal with a few of the most important performance measures including airfield performance, climb, and cruise. The following sections describe how each of these may be calculated at the early stages of design, by combining fundamental calculations with statistical data from actual aircraft.
Each of these performance measures will be used as a constraint in the airplane optimization process and are among many constraints imposed by the FARs.
• Take-off field length • Landing field length • Climb performance • Cruise performance and range
Take-Off Field Length
Introduction
Although the take-off field length may seem like a performance characteristic of secondary importance, it is very often one of the critical design constraints. If the required runway length is too long, the aircraft cannot take-off with full fuel or full payload and the aircraft economics are compromised. For example, In some cases aircraft take-off from San Jose and fly all the way to San Francisco (about 40 miles) before making their first refueling stop. This is because the field length is insufficient to take-off with full fuel in San Jose and the tanks are topped off at SFO where the runways are longer. Since this kind of operating restriction is not desirable, the aircraft is designed to meet take-off field length requirements for selected airports with full payload and fuel. This constraint often sets the aircraft wing area, engine size, or high lift system design. To compute the required take-off distance, we consider the take-off profile shown below.
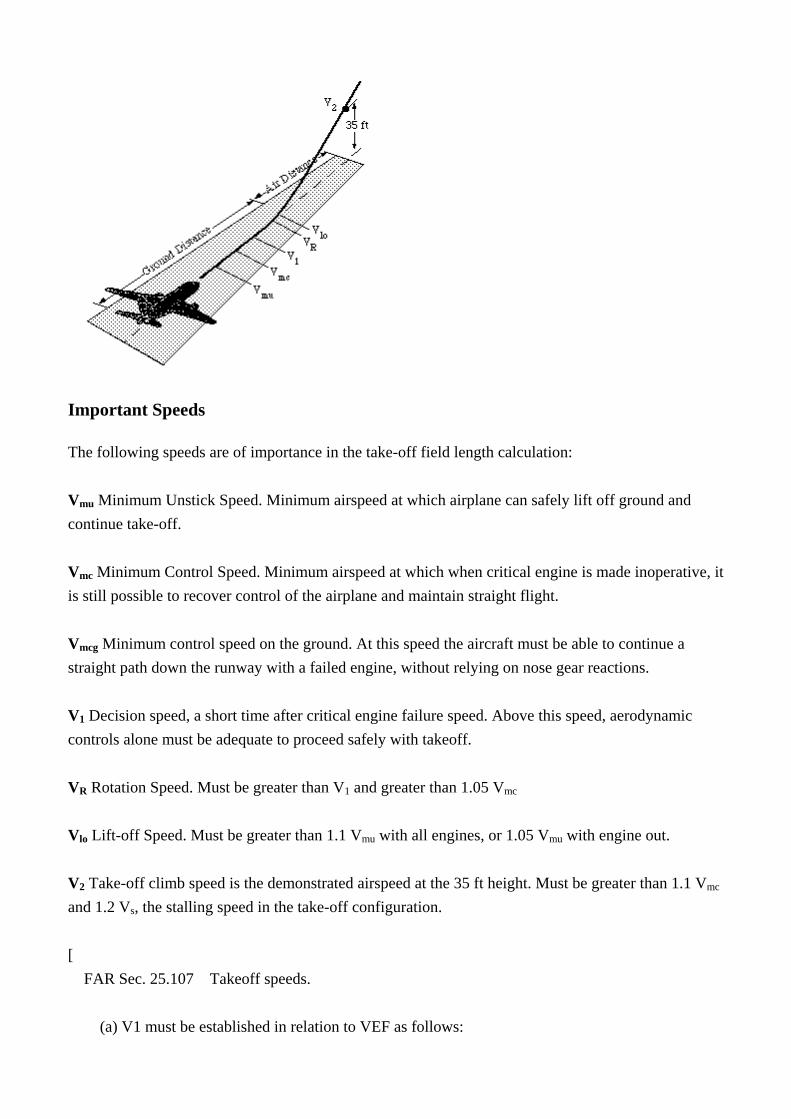
Important Speeds
The following speeds are of importance in the take-off field length calculation: Vmu Minimum Unstick Speed. Minimum airspeed at which airplane can safely lift off ground and continue take-off. Vmc Minimum Control Speed. Minimum airspeed at which when critical engine is made inoperative, it is still possible to recover control of the airplane and maintain straight flight. Vmcg Minimum control speed on the ground. At this speed the aircraft must be able to continue a straight path down the runway with a failed engine, without relying on nose gear reactions. V1 Decision speed, a short time after critical engine failure speed. Above this speed, aerodynamic controls alone must be adequate to proceed safely with takeoff. VR Rotation Speed. Must be greater than V1 and greater than 1.05 Vmc Vlo Lift-off Speed. Must be greater than 1.1 Vmu with all engines, or 1.05 Vmu with engine out. V2 Take-off climb speed is the demonstrated airspeed at the 35 ft height. Must be greater than 1.1 Vmc and 1.2 Vs, the stalling speed in the take-off configuration. [ FAR Sec. 25.107 Takeoff speeds. (a) V1 must be established in relation to VEF as follows:
(1) VEF is the calibrated airspeed at which the critical engine is assumed to fail. VEF must be selected by the applicant, but may not be less than VmcG determined under Sec. 25.149(e). (2) V1, in terms of calibrated airspeed, is the takeoff decision speed selected by the applicant; however, V1 may not be less than VEF plus the speed gained with the critical engine inoperative during the time interval between the instant at which the critical engine is failed, and the instant at which the pilot recognizes and reacts to the engine failure, as indicated by the pilot's application of the first retarding means during accelerate-stop tests. (b) V2MIN, in terms of calibrated airspeed, may not be less than-- (1) 1.2 VS for-- (i) Two-engine and three-engine turbopropeller and reciprocating engine powered airplanes; and (ii) Turbojet powered airplanes without provisions for obtaining a significant reduction in the one-engine-inoperative power-on stalling speed; (2) 1.15 VS for-- (i) Turbopropeller and reciprocating engine powered airplanes with more than three engines; and (ii) Turbojet powered airplanes with provisions for obtaining a significant reduction in the one-engine-inoperative power-on stalling speed; and (3) 1.10 times VMC established under Sec. 25.149. (c) V2, in terms of calibrated airspeed, must be selected by the applicant to provide at least the gradient of climb required by Sec. 25.121(b) but may not be less than-- (1) V2MIN, and (2) VR plus the speed increment attained (in accordance with Sec. 25.111 (c)(2)) before reaching a height of 35 feet above the takeoff surface. (d) VMU is the calibrated airspeed at and above which the airplane can safely lift off the ground, and continue the takeoff. VMU speeds must be selected by the applicant throughout the range of thrust-to-weight ratios to be certificated. These speeds may be established from free air data if these data are verified by ground takeoff tests. (e) VR, in terms of calibrated airspeed, must be selected in accordance with the conditions of paragraphs (e) (1) through (4) of this section: (1) VR may not be less than-- (i) V1; (ii) 105 percent of VMC; (iii) The speed (determined in accordance with Sec. 25.111(c)(2)) that allows reaching V2 before reaching a height of 35 feet above the takeoff surface; or (iv) A speed that, if the airplane is rotated at its maximum practicable rate, will result in a VLOF of not less than 110 percent of VMU in the all-engines-operating condition and not less than 105 percent of VMU determined at the thrust-to-weight ratio corresponding to the one-engine-inoperative condition. (2) For any given set of conditions (such as weight, configuration, and temperature), a single value of VR, obtained in accordance with this paragraph, must be used to show compliance with both the one-engine-inoperative and the all-engines-operating takeoff provisions.
(3) It must be shown that the one-engine-inoperative takeoff distance, using a rotation speed of 5 knots less than VR established in accordance with paragraphs (e)(1) and (2) of this section, does not exceed the corresponding one-engine-inoperative takeoff distance using the established VR. The takeoff distances must be determined in accordance with Sec. 25.113(a)(1). (4) Reasonably expected variations in service from the established takeoff procedures for the operation of the airplane (such as over-rotation of the airplane and out-of-trim conditions) may not result in unsafe flight characteristics or in marked increases in the scheduled takeoff distances established in accordance with Sec. 25.113(a). (f) VLOF is the calibrated airspeed at which the airplane first becomes airborne. ]
Estimating the Required Field Length
The calculation of take-off field length involves the computation of the distance required to accelerate from a stop to the required take-off speed, plus a climb segment. Since the acceleration distance is typically about 80% of the total distance, we first consider this portion. The distance required to accelerate to the speed Vlo can be computed by noting that: dV = a dt and dx = V dt = V/a dV so:
If the acceleration is assumed to vary as: 1/a = 1/a0 + kV2 then:
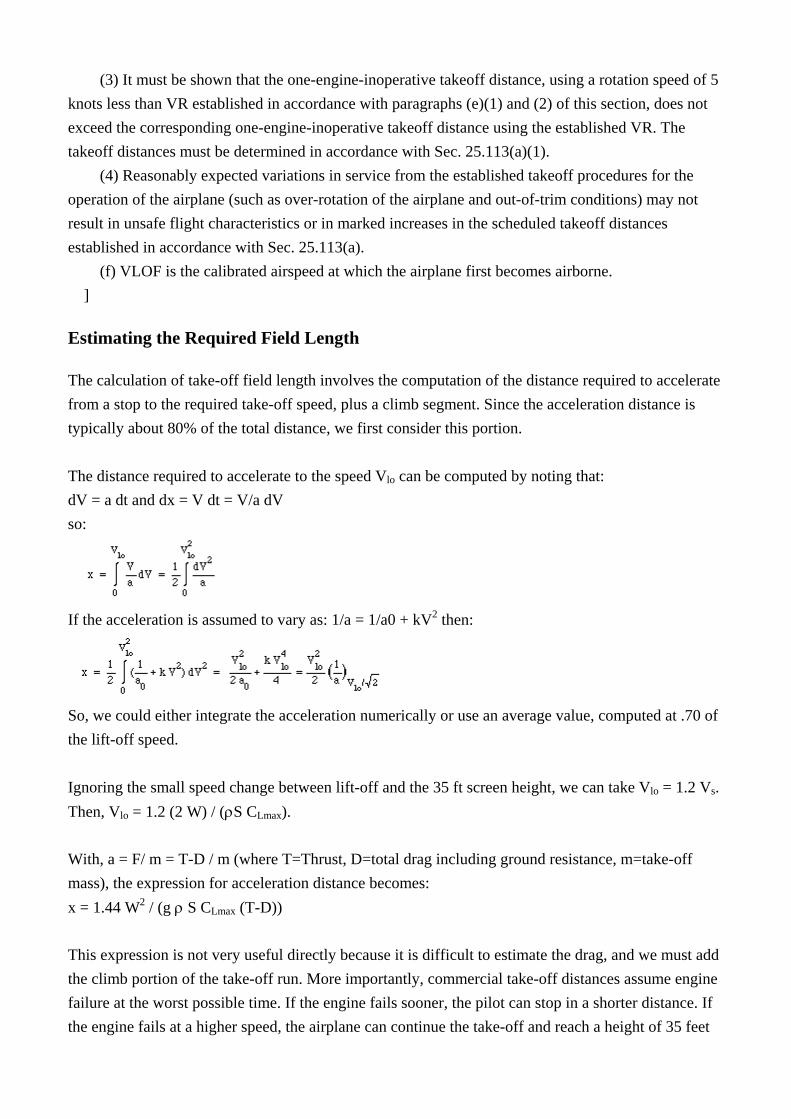
So, we could either integrate the acceleration numerically or use an average value, computed at .70 of the lift-off speed. Ignoring the small speed change between lift-off and the 35 ft screen height, we can take Vlo = 1.2 Vs. Then, Vlo = 1.2 (2 W) / (ρS CLmax). With, a = F/ m = T-D / m (where T=Thrust, D=total drag including ground resistance, m=take-off mass), the expression for acceleration distance becomes: x = 1.44 W2 / (g ρ S CLmax (T-D)) This expression is not very useful directly because it is difficult to estimate the drag, and we must add the climb portion of the take-off run. More importantly, commercial take-off distances assume engine failure at the worst possible time. If the engine fails sooner, the pilot can stop in a shorter distance. If the engine fails at a higher speed, the airplane can continue the take-off and reach a height of 35 feet
in a shorter distance. This worst time corresponds to the critical engine failure speed VEFcrit. It is assumed that the pilot recognizes the engine failure and takes action a short time* later, at which time the speed is called the decision speed, V1. At a speed higher than V1, the pilot must continue the take-off; at a lower speed he or she must stop. The commercial take-off problem is very complex, involving acceleration on all engines, acceleration with one engine inoperative, deceleration after engine failure, and climb with one engine inoperative. This means that the design of spoilers, braking system, and rudder will affect the FAR take-off field length.
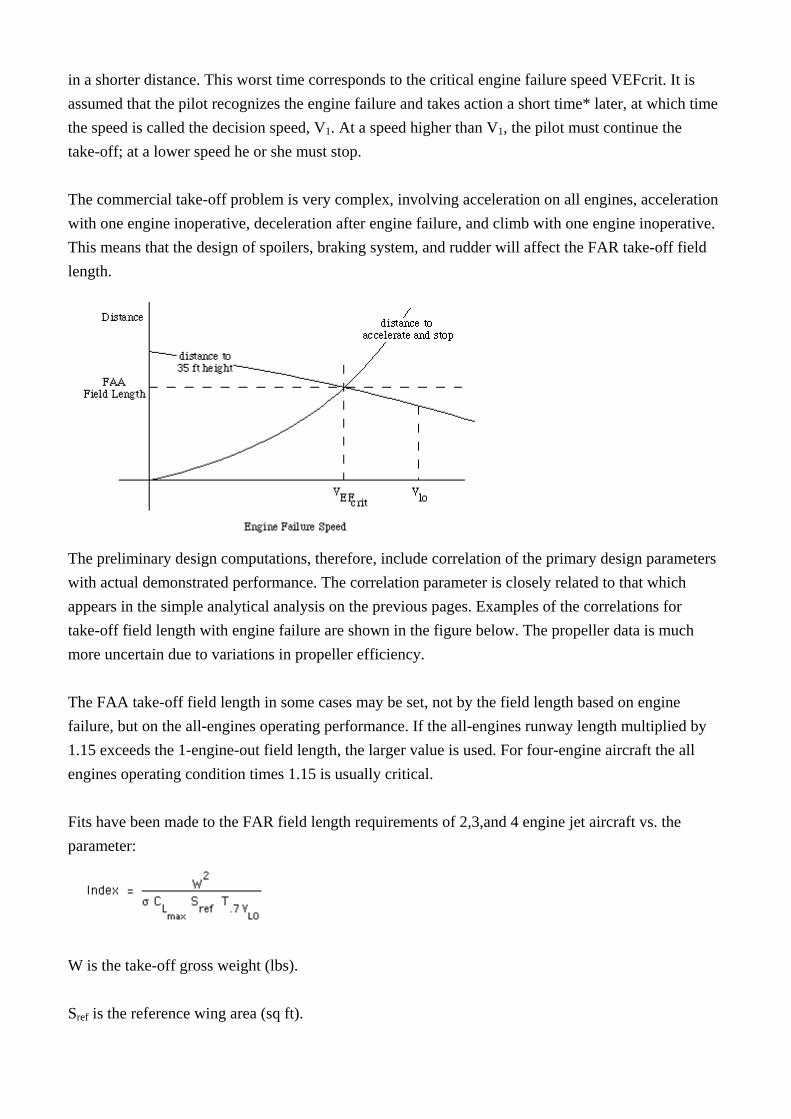
The preliminary design computations, therefore, include correlation of the primary design parameters with actual demonstrated performance. The correlation parameter is closely related to that which appears in the simple analytical analysis on the previous pages. Examples of the correlations for take-off field length with engine failure are shown in the figure below. The propeller data is much more uncertain due to variations in propeller efficiency. The FAA take-off field length in some cases may be set, not by the field length based on engine failure, but on the all-engines operating performance. If the all-engines runway length multiplied by 1.15 exceeds the 1-engine-out field length, the larger value is used. For four-engine aircraft the all engines operating condition times 1.15 is usually critical. Fits have been made to the FAR field length requirements of 2,3,and 4 engine jet aircraft vs. the parameter:
W is the take-off gross weight (lbs). Sref is the reference wing area (sq ft).
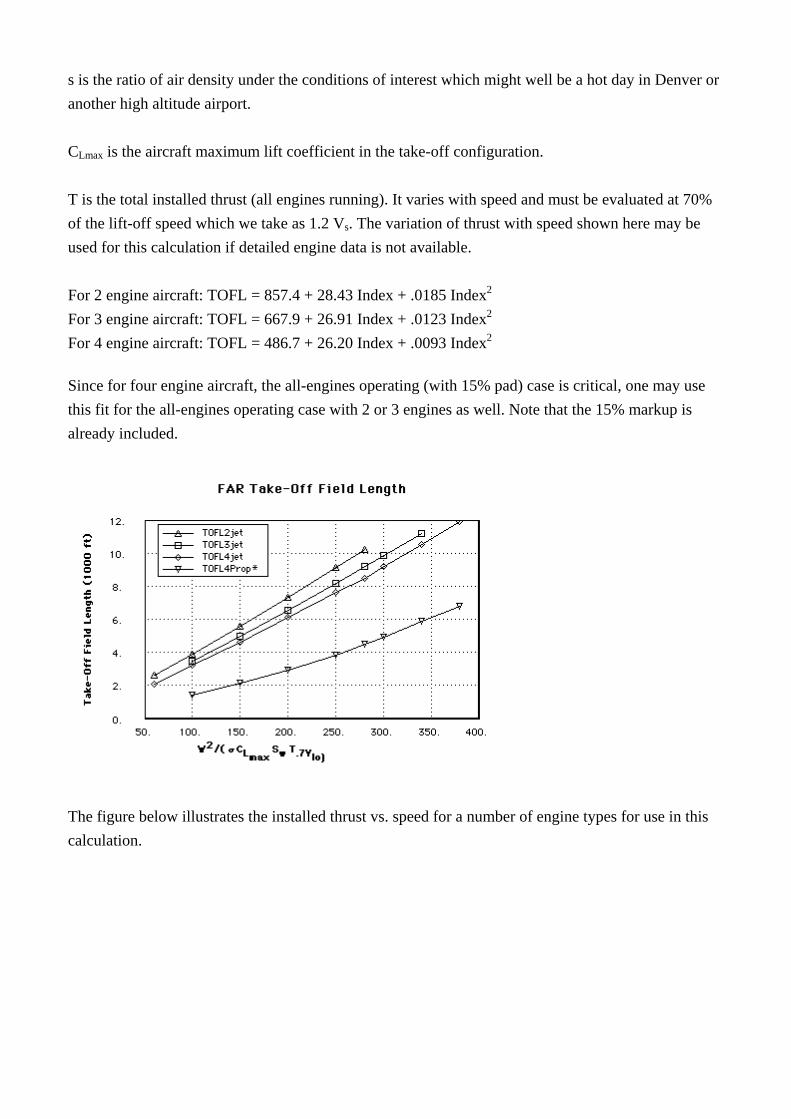
s is the ratio of air density under the conditions of interest which might well be a hot day in Denver or another high altitude airport. CLmax is the aircraft maximum lift coefficient in the take-off configuration. T is the total installed thrust (all engines running). It varies with speed and must be evaluated at 70% of the lift-off speed which we take as 1.2 Vs. The variation of thrust with speed shown here may be used for this calculation if detailed engine data is not available. For 2 engine aircraft: TOFL = 857.4 + 28.43 Index + .0185 Index2 For 3 engine aircraft: TOFL = 667.9 + 26.91 Index + .0123 Index2 For 4 engine aircraft: TOFL = 486.7 + 26.20 Index + .0093 Index2
Since for four engine aircraft, the all-engines operating (with 15% pad) case is critical, one may use this fit for the all-engines operating case with 2 or 3 engines as well. Note that the 15% markup is already included.
The figure below illustrates the installed thrust vs. speed for a number of engine types for use in this calculation.
Landing Field Length
Introduction
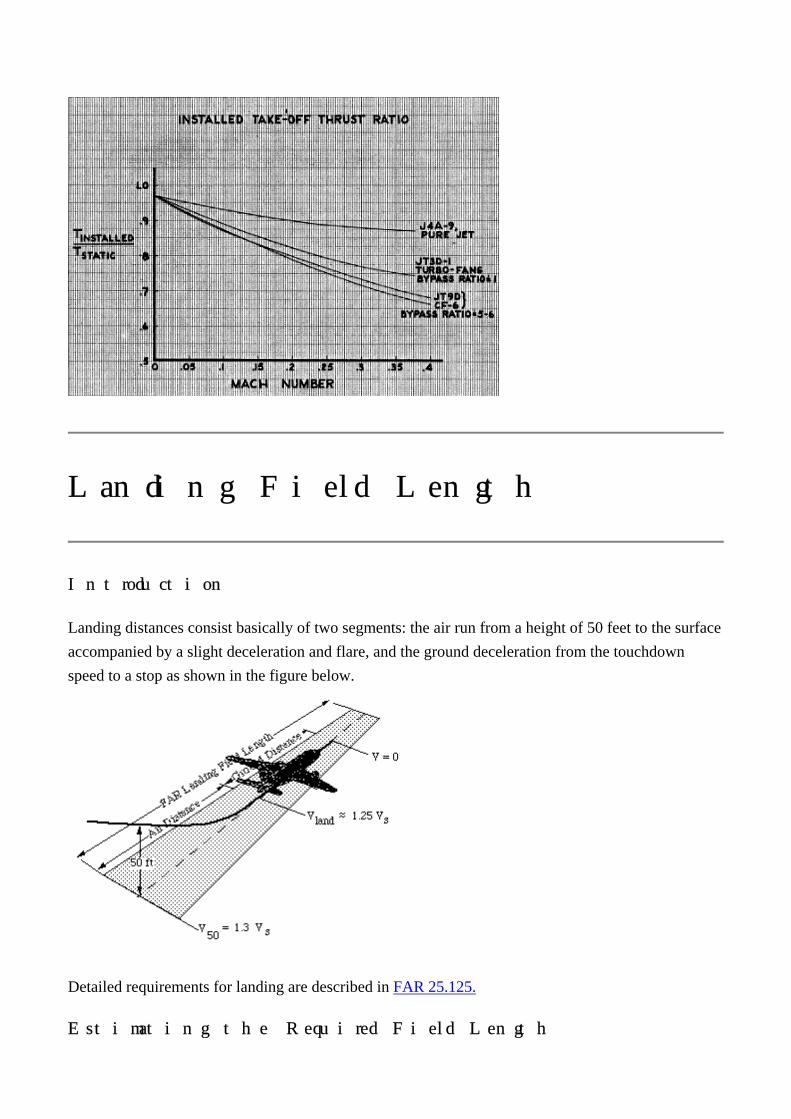
Landing distances consist basically of two segments: the air run from a height of 50 feet to the surface accompanied by a slight deceleration and flare, and the ground deceleration from the touchdown speed to a stop as shown in the figure below.
Detailed requirements for landing are described in FAR 25.125.
Estimating the Required Field Length
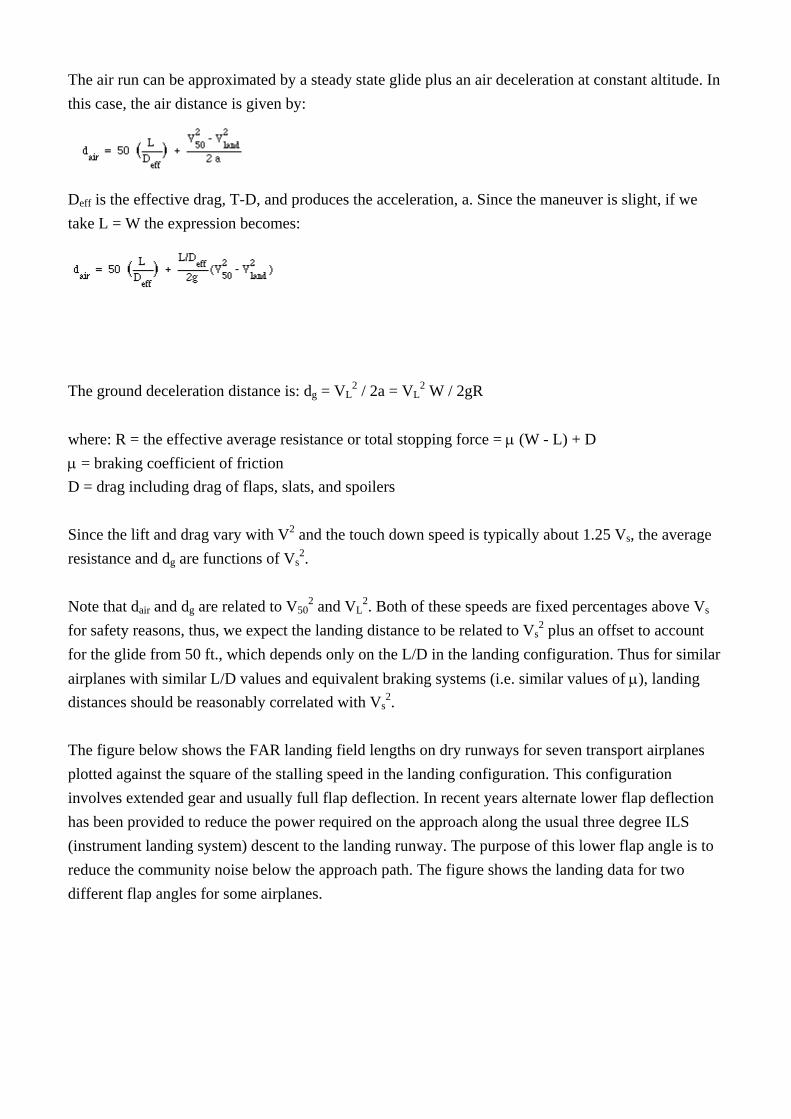
The air run can be approximated by a steady state glide plus an air deceleration at constant altitude. In this case, the air distance is given by:
Deff is the effective drag, T-D, and produces the acceleration, a. Since the maneuver is slight, if we take L = W the expression becomes:
The ground deceleration distance is: dg = VL
2 / 2a = VL2 W / 2gR
where: R = the effective average resistance or total stopping force = µ (W - L) + D µ = braking coefficient of friction D = drag including drag of flaps, slats, and spoilers Since the lift and drag vary with V2 and the touch down speed is typically about 1.25 Vs, the average resistance and dg are functions of Vs
2. Note that dair and dg are related to V50
2 and VL2. Both of these speeds are fixed percentages above Vs
for safety reasons, thus, we expect the landing distance to be related to Vs2 plus an offset to account
for the glide from 50 ft., which depends only on the L/D in the landing configuration. Thus for similar airplanes with similar L/D values and equivalent braking systems (i.e. similar values of µ), landing distances should be reasonably correlated with Vs
2. The figure below shows the FAR landing field lengths on dry runways for seven transport airplanes plotted against the square of the stalling speed in the landing configuration. This configuration involves extended gear and usually full flap deflection. In recent years alternate lower flap deflection has been provided to reduce the power required on the approach along the usual three degree ILS (instrument landing system) descent to the landing runway. The purpose of this lower flap angle is to reduce the community noise below the approach path. The figure shows the landing data for two different flap angles for some airplanes.
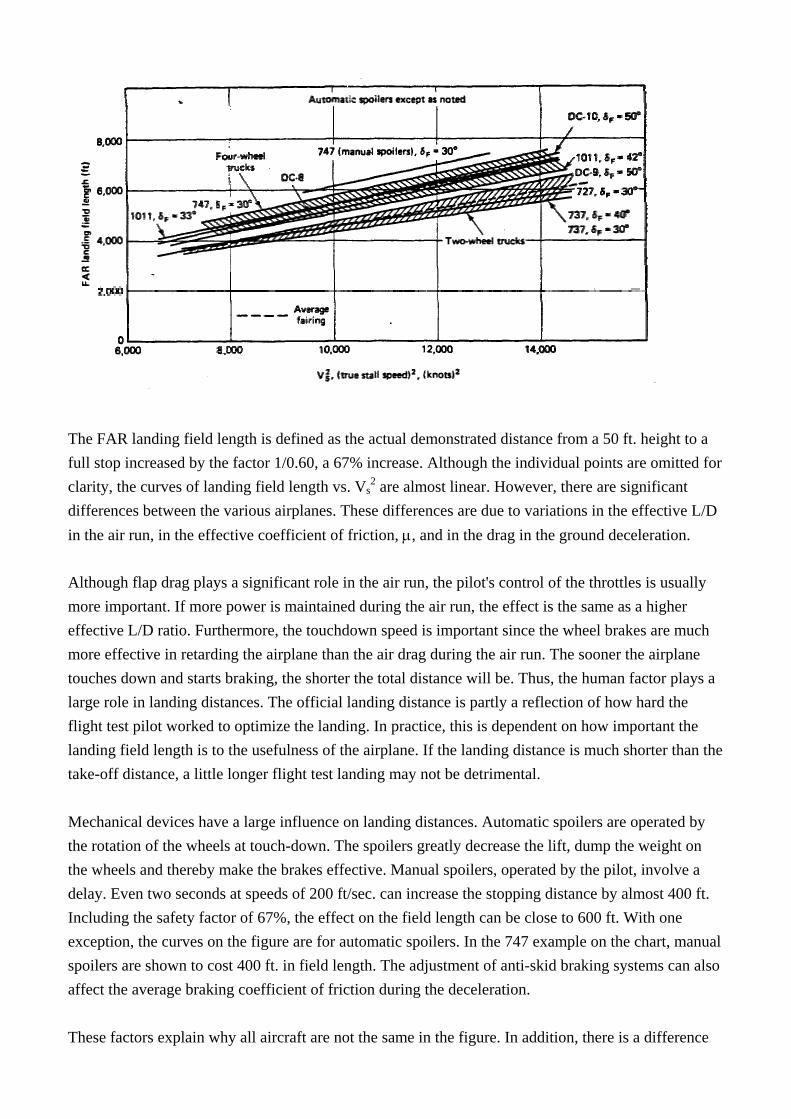
The FAR landing field length is defined as the actual demonstrated distance from a 50 ft. height to a full stop increased by the factor 1/0.60, a 67% increase. Although the individual points are omitted for clarity, the curves of landing field length vs. Vs
2 are almost linear. However, there are significant differences between the various airplanes. These differences are due to variations in the effective L/D in the air run, in the effective coefficient of friction, µ, and in the drag in the ground deceleration. Although flap drag plays a significant role in the air run, the pilot's control of the throttles is usually more important. If more power is maintained during the air run, the effect is the same as a higher effective L/D ratio. Furthermore, the touchdown speed is important since the wheel brakes are much more effective in retarding the airplane than the air drag during the air run. The sooner the airplane touches down and starts braking, the shorter the total distance will be. Thus, the human factor plays a large role in landing distances. The official landing distance is partly a reflection of how hard the flight test pilot worked to optimize the landing. In practice, this is dependent on how important the landing field length is to the usefulness of the airplane. If the landing distance is much shorter than the take-off distance, a little longer flight test landing may not be detrimental. Mechanical devices have a large influence on landing distances. Automatic spoilers are operated by the rotation of the wheels at touch-down. The spoilers greatly decrease the lift, dump the weight on the wheels and thereby make the brakes effective. Manual spoilers, operated by the pilot, involve a delay. Even two seconds at speeds of 200 ft/sec. can increase the stopping distance by almost 400 ft. Including the safety factor of 67%, the effect on the field length can be close to 600 ft. With one exception, the curves on the figure are for automatic spoilers. In the 747 example on the chart, manual spoilers are shown to cost 400 ft. in field length. The adjustment of anti-skid braking systems can also affect the average braking coefficient of friction during the deceleration. These factors explain why all aircraft are not the same in the figure. In addition, there is a difference
between the large aircraft with four wheel landing trucks and those with two wheel trucks. It appears that the effective coefficient of friction is less for wheels rolling immediately behind other wheels. Thus, we have shown a scatter band for the four wheel truck aircraft and another band for the two wheel truck aircraft. The dashed fairings are in the center of the bands and are within 6% of the extremes of the scatter bands. The dashed average fairings in the figure represent a reasonable way to estimate landing field lengths. The landing field length prediction is a function only of the square of the true stall speed. This data is based on transport aircraft with highly developed anti-skid braking systems. Aircraft with simple brakes and without spoilers will have considerably longer stopping distances than are built into the curves. However, quoted landing distances for small aircraft are sometimes based only on the ground run without a safety factor. The total distance over a 50 ft. height with the 1/0.6 factor is about 2.5 times as long. Reverse thrust is not used in determining the dry runway field length, either for landing or for the accelerate and stop portion of the take-off problem. It is considered a 'pad'. To establish wet runway landing performance one may either add 15% to the dry runway results (which already have the 67% safety factor), or one may perform a very realistic test with 3° glide slope approach, 80% worn tires, a higher than normal approach speed and thrust reversers on all but one engine. A 15% pad is then added to that test.
Climb Performance
Introduction
Constraints on aircraft climb performance are also specified in the federal air regulations. These include a minimum landing climb gradient with all engines running, and minimum climb gradients with one engine inoperative during three take-off segments, an approach segment, and an enroute case. These regulations are discussed in the section of FAR Part 25 included in these notes. They are summarized in the table below:
Required Climb Gradient
Number of Engines: 4 3 2
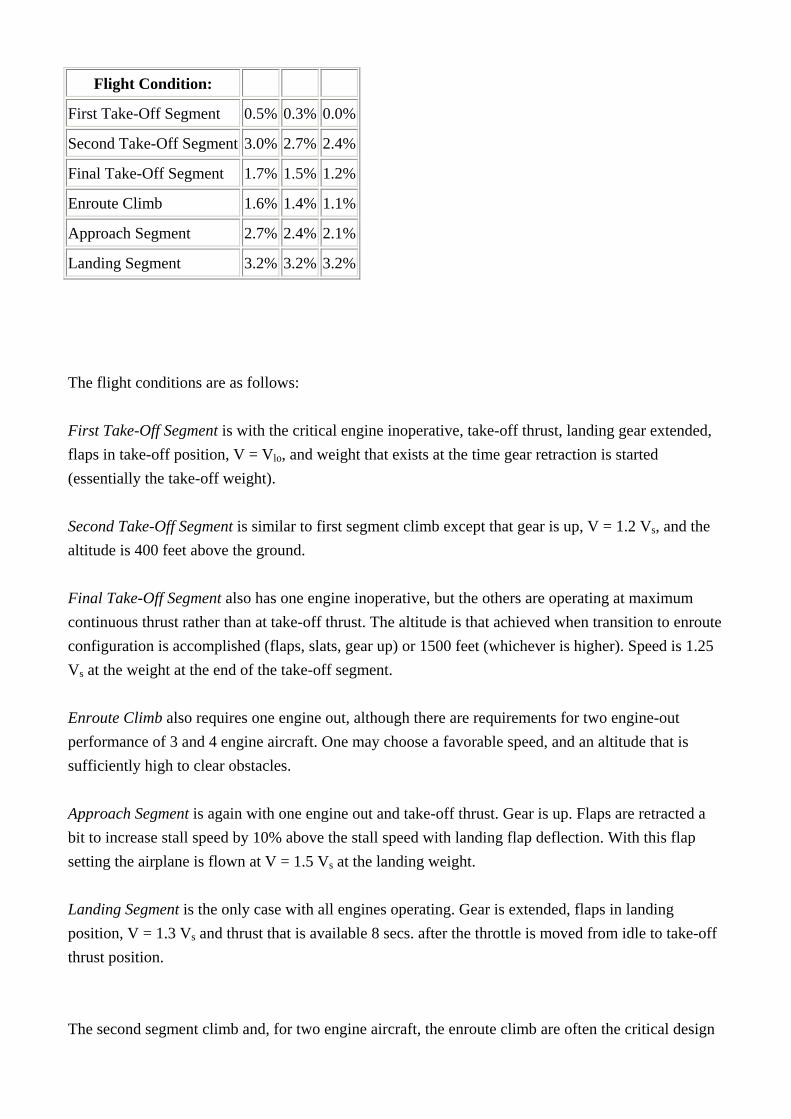
Flight Condition:
First Take-Off Segment 0.5% 0.3% 0.0%
Second Take-Off Segment 3.0% 2.7% 2.4%
Final Take-Off Segment 1.7% 1.5% 1.2%
Enroute Climb 1.6% 1.4% 1.1%
Approach Segment 2.7% 2.4% 2.1%
Landing Segment 3.2% 3.2% 3.2%
The flight conditions are as follows: First Take-Off Segment is with the critical engine inoperative, take-off thrust, landing gear extended, flaps in take-off position, V = Vlo, and weight that exists at the time gear retraction is started (essentially the take-off weight). Second Take-Off Segment is similar to first segment climb except that gear is up, V = 1.2 Vs, and the altitude is 400 feet above the ground. Final Take-Off Segment also has one engine inoperative, but the others are operating at maximum continuous thrust rather than at take-off thrust. The altitude is that achieved when transition to enroute configuration is accomplished (flaps, slats, gear up) or 1500 feet (whichever is higher). Speed is 1.25 Vs at the weight at the end of the take-off segment. Enroute Climb also requires one engine out, although there are requirements for two engine-out performance of 3 and 4 engine aircraft. One may choose a favorable speed, and an altitude that is sufficiently high to clear obstacles. Approach Segment is again with one engine out and take-off thrust. Gear is up. Flaps are retracted a bit to increase stall speed by 10% above the stall speed with landing flap deflection. With this flap setting the airplane is flown at V = 1.5 Vs at the landing weight. Landing Segment is the only case with all engines operating. Gear is extended, flaps in landing position, V = 1.3 Vs and thrust that is available 8 secs. after the throttle is moved from idle to take-off thrust position. The second segment climb and, for two engine aircraft, the enroute climb are often the critical design
requirements affecting the required engine thrust and wing aspect ratio. Detailed requirements for climb are described in FAR 25.115.
Estimating the Climb Gradient
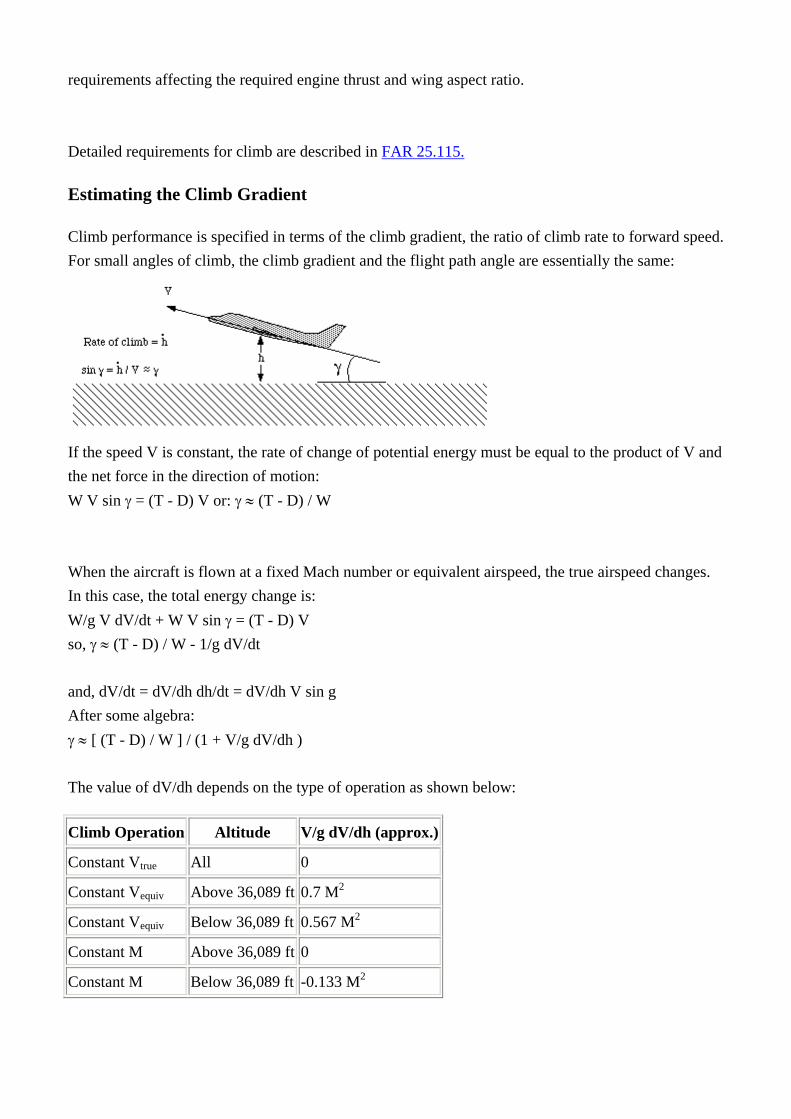
Climb performance is specified in terms of the climb gradient, the ratio of climb rate to forward speed. For small angles of climb, the climb gradient and the flight path angle are essentially the same:
If the speed V is constant, the rate of change of potential energy must be equal to the product of V and the net force in the direction of motion: W V sin γ = (T - D) V or: γ ≈ (T - D) / W When the aircraft is flown at a fixed Mach number or equivalent airspeed, the true airspeed changes. In this case, the total energy change is: W/g V dV/dt + W V sin γ = (T - D) V so, γ ≈ (T - D) / W - 1/g dV/dt and, dV/dt = dV/dh dh/dt = dV/dh V sin g After some algebra: γ ≈ [ (T - D) / W ] / (1 + V/g dV/dh ) The value of dV/dh depends on the type of operation as shown below:
Climb Operation Altitude V/g dV/dh (approx.)
Constant Vtrue All 0
Constant Vequiv Above 36,089 ft 0.7 M2
Constant Vequiv Below 36,089 ft 0.567 M2
Constant M Above 36,089 ft 0
Constant M Below 36,089 ft -0.133 M2
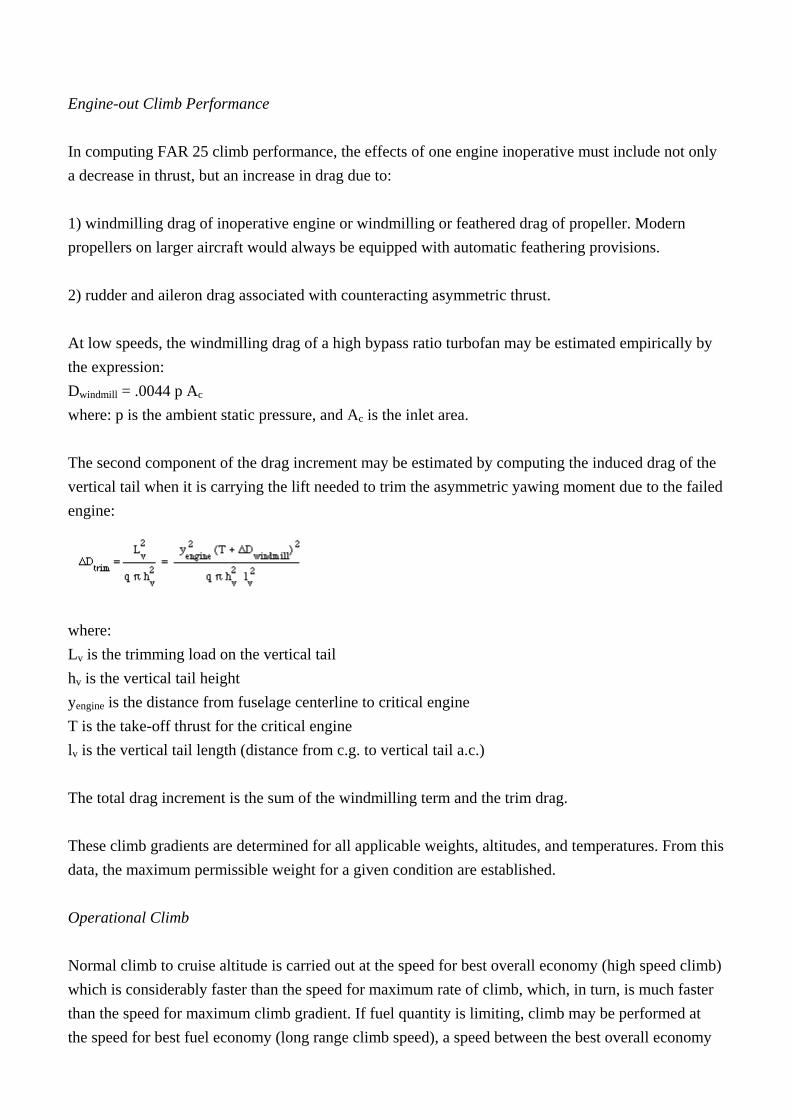
Engine-out Climb Performance In computing FAR 25 climb performance, the effects of one engine inoperative must include not only a decrease in thrust, but an increase in drag due to: 1) windmilling drag of inoperative engine or windmilling or feathered drag of propeller. Modern propellers on larger aircraft would always be equipped with automatic feathering provisions. 2) rudder and aileron drag associated with counteracting asymmetric thrust. At low speeds, the windmilling drag of a high bypass ratio turbofan may be estimated empirically by the expression: Dwindmill = .0044 p Ac where: p is the ambient static pressure, and Ac is the inlet area. The second component of the drag increment may be estimated by computing the induced drag of the vertical tail when it is carrying the lift needed to trim the asymmetric yawing moment due to the failed engine:
where: Lv is the trimming load on the vertical tail hv is the vertical tail height yengine is the distance from fuselage centerline to critical engine T is the take-off thrust for the critical engine lv is the vertical tail length (distance from c.g. to vertical tail a.c.) The total drag increment is the sum of the windmilling term and the trim drag. These climb gradients are determined for all applicable weights, altitudes, and temperatures. From this data, the maximum permissible weight for a given condition are established. Operational Climb Normal climb to cruise altitude is carried out at the speed for best overall economy (high speed climb) which is considerably faster than the speed for maximum rate of climb, which, in turn, is much faster than the speed for maximum climb gradient. If fuel quantity is limiting, climb may be performed at the speed for best fuel economy (long range climb speed), a speed between the best overall economy
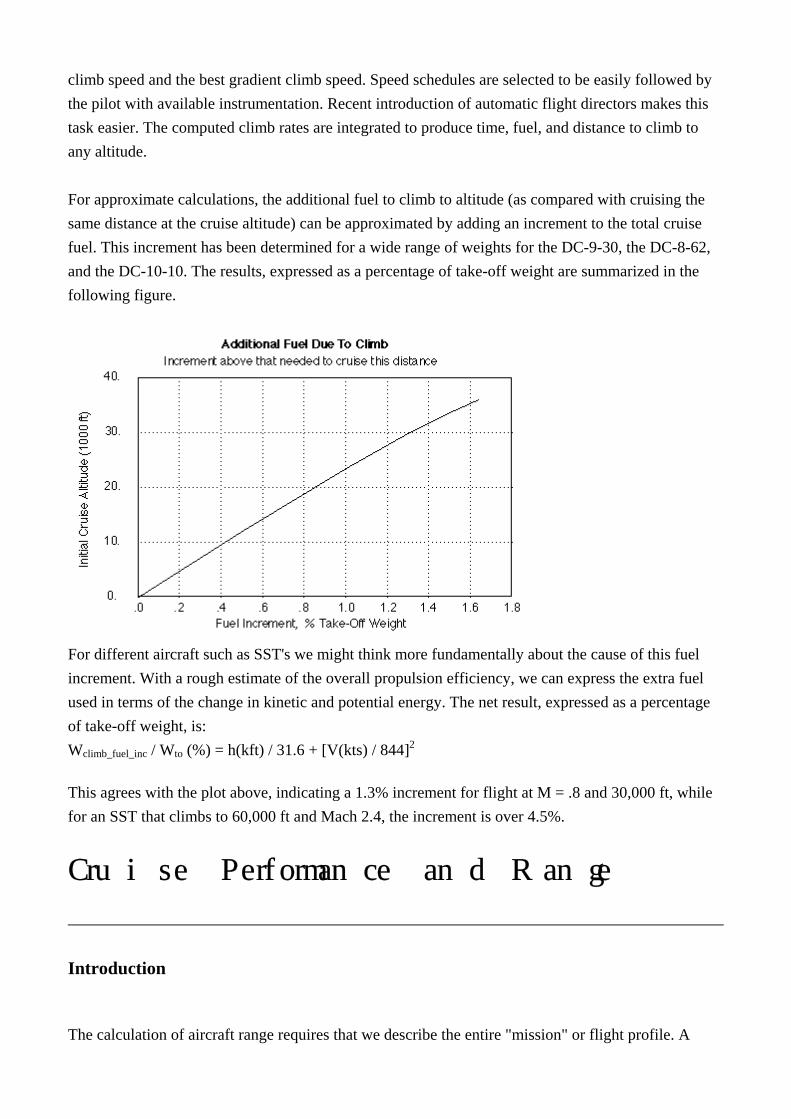
climb speed and the best gradient climb speed. Speed schedules are selected to be easily followed by the pilot with available instrumentation. Recent introduction of automatic flight directors makes this task easier. The computed climb rates are integrated to produce time, fuel, and distance to climb to any altitude. For approximate calculations, the additional fuel to climb to altitude (as compared with cruising the same distance at the cruise altitude) can be approximated by adding an increment to the total cruise fuel. This increment has been determined for a wide range of weights for the DC-9-30, the DC-8-62, and the DC-10-10. The results, expressed as a percentage of take-off weight are summarized in the following figure.
For different aircraft such as SST's we might think more fundamentally about the cause of this fuel increment. With a rough estimate of the overall propulsion efficiency, we can express the extra fuel used in terms of the change in kinetic and potential energy. The net result, expressed as a percentage of take-off weight, is: Wclimb_fuel_inc / Wto (%) = h(kft) / 31.6 + [V(kts) / 844]2
This agrees with the plot above, indicating a 1.3% increment for flight at M = .8 and 30,000 ft, while for an SST that climbs to 60,000 ft and Mach 2.4, the increment is over 4.5%.
Cruise Performance and Range
Introduction
The calculation of aircraft range requires that we describe the entire "mission" or flight profile. A
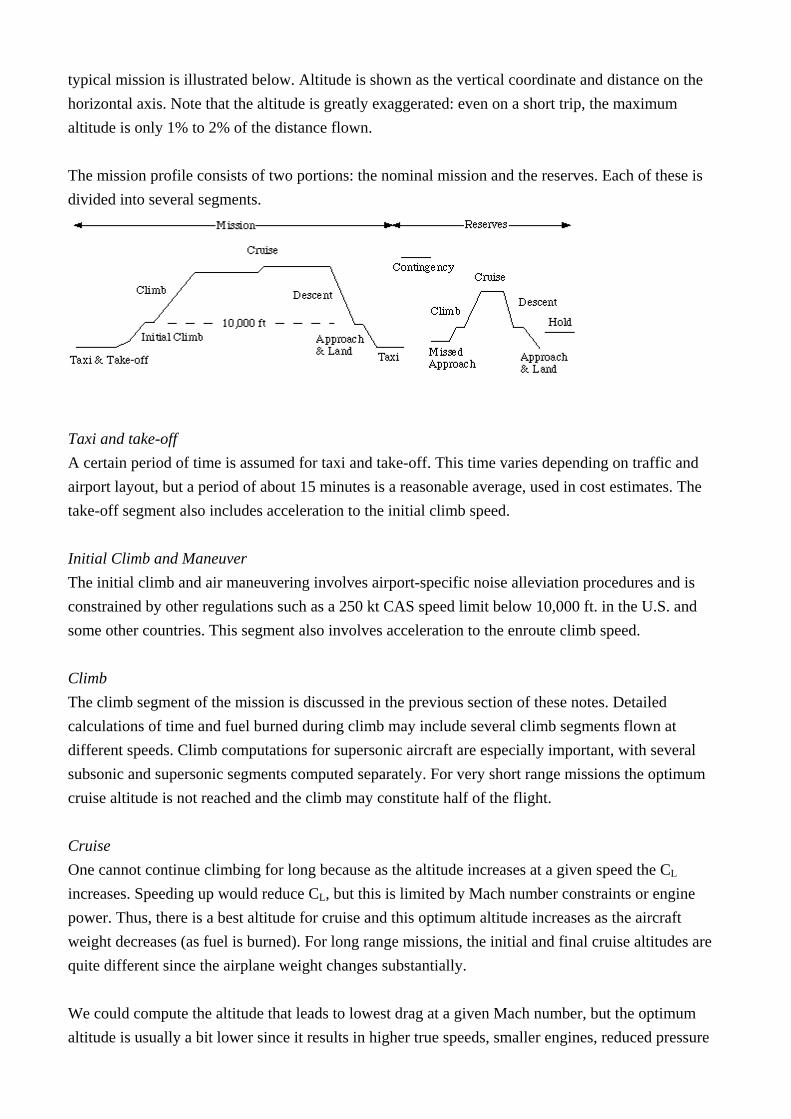
typical mission is illustrated below. Altitude is shown as the vertical coordinate and distance on the horizontal axis. Note that the altitude is greatly exaggerated: even on a short trip, the maximum altitude is only 1% to 2% of the distance flown. The mission profile consists of two portions: the nominal mission and the reserves. Each of these is divided into several segments.
Taxi and take-off A certain period of time is assumed for taxi and take-off. This time varies depending on traffic and airport layout, but a period of about 15 minutes is a reasonable average, used in cost estimates. The take-off segment also includes acceleration to the initial climb speed. Initial Climb and Maneuver The initial climb and air maneuvering involves airport-specific noise alleviation procedures and is constrained by other regulations such as a 250 kt CAS speed limit below 10,000 ft. in the U.S. and some other countries. This segment also involves acceleration to the enroute climb speed. Climb The climb segment of the mission is discussed in the previous section of these notes. Detailed calculations of time and fuel burned during climb may include several climb segments flown at different speeds. Climb computations for supersonic aircraft are especially important, with several subsonic and supersonic segments computed separately. For very short range missions the optimum cruise altitude is not reached and the climb may constitute half of the flight. Cruise One cannot continue climbing for long because as the altitude increases at a given speed the CL increases. Speeding up would reduce CL, but this is limited by Mach number constraints or engine power. Thus, there is a best altitude for cruise and this optimum altitude increases as the aircraft weight decreases (as fuel is burned). For long range missions, the initial and final cruise altitudes are quite different since the airplane weight changes substantially. We could compute the altitude that leads to lowest drag at a given Mach number, but the optimum altitude is usually a bit lower since it results in higher true speeds, smaller engines, reduced pressure
loads on the fuselage, and more margin against buffet. Thus, we will consider both initial and final cruise altitudes as design variables in the aircraft optimization. Except in a few lightly-traveled regions, variable altitude, or climbing cruise is not practical from a traffic control standpoint. Thus the true optimum is not generally attainable. In the U.S. ATC rules specify that aircraft be flown at specific flight altitudes so that the aircraft must cruise at constant altitude, and request clearance to climb to the next highest available altitude when sufficient fuel is consumed. This leads to "step cruise" profiles shown on the previous page, with 1 to 3 steps of 4000 ft in altitude due to airway requirements. Such stepped profiles lead to reductions in cruise range by 1%-2% if the altitudes are chosen to be optimal for the weight at the beginning of the step. Descent, Approach, and Landing Like the climb segment, the descent is performed according to a specified airspeed schedule with speed limit restrictions below 10,000 ft and extra fuel associated with maneuvers on approach. Reserves Reserve fuel is carried to allow for deviations from the original flight plan, including a requirement for diversion to an alternate airport when the planned destination is unavailable. The FAA specifies a minimum amount of reserve fuel as described below, but many airlines have additional requirements that result in reserves usually being somewhat higher than the FAA minimums. The FAR's establish different requirements for domestic and international flights as shown below. There are also other "reserve" requirements such as those associated with "ETOPS" (extended twin engine operations). ETOPS rules currently require that the airplane be capable of flying with one engine inoperative to the nearest "suitable" airport. Some operators are certified for 180 minute ETOPS. Some are allowed 120 minutes, some 90, some only 75. Some aren't allowed to fly ETOPS under any circumstances. (Typically this is an economic decision made by the airline - not a reflection of relative safety - because of the onerous bookkeeping requirements.) Domestic Reserves: 1. Climb from sea level to cruise altitude 2. Cruise to alternate airport at best speed and altitude (typ. 250 n.mi.) 3. Descend to sea level 4. Cruise for 45 minutes at long range cruise speed and altitude International Reserves: 1. Fuel to fly 10% of planned block time at long range cruise speed 2. Climb from sea level to cruise altitude 3. Cruise to alternate 4. Descend to 1500 ft and hold for 30 minutes 5. Descend to sea level
Estimating the Aircraft Range
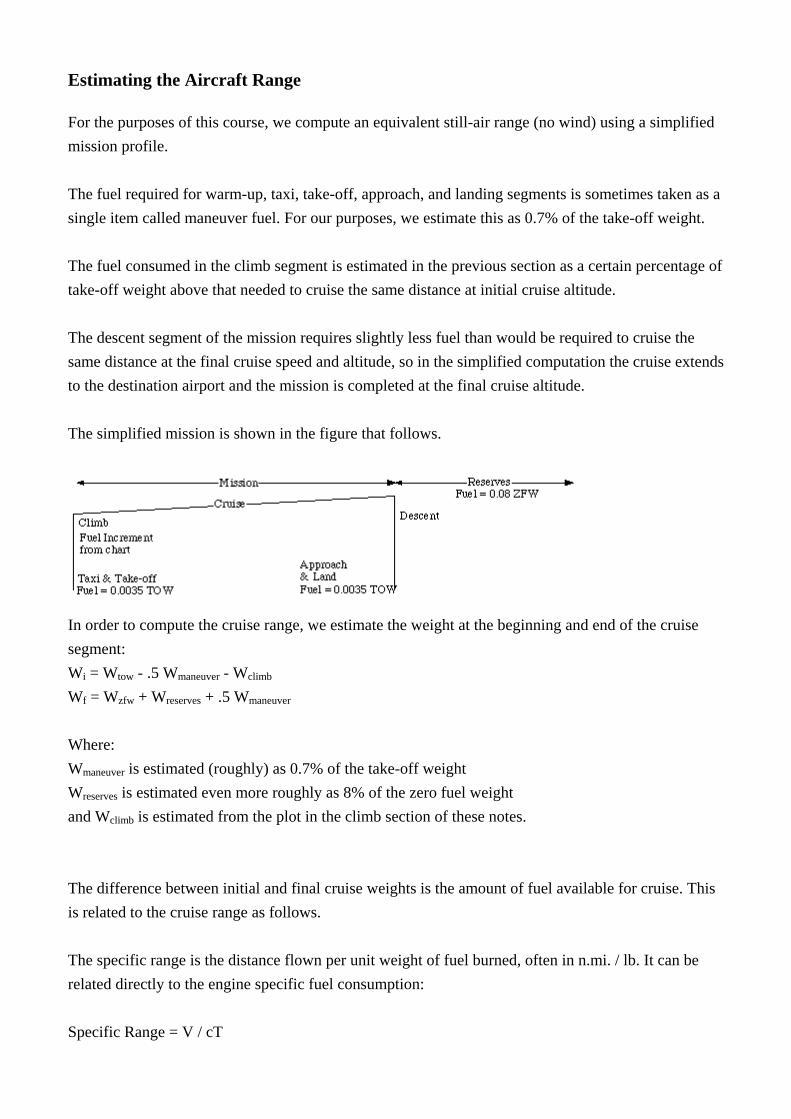
For the purposes of this course, we compute an equivalent still-air range (no wind) using a simplified mission profile. The fuel required for warm-up, taxi, take-off, approach, and landing segments is sometimes taken as a single item called maneuver fuel. For our purposes, we estimate this as 0.7% of the take-off weight. The fuel consumed in the climb segment is estimated in the previous section as a certain percentage of take-off weight above that needed to cruise the same distance at initial cruise altitude. The descent segment of the mission requires slightly less fuel than would be required to cruise the same distance at the final cruise speed and altitude, so in the simplified computation the cruise extends to the destination airport and the mission is completed at the final cruise altitude. The simplified mission is shown in the figure that follows.
In order to compute the cruise range, we estimate the weight at the beginning and end of the cruise segment: Wi = Wtow - .5 Wmaneuver - Wclimb Wf = Wzfw + Wreserves + .5 Wmaneuver Where: Wmaneuver is estimated (roughly) as 0.7% of the take-off weight Wreserves is estimated even more roughly as 8% of the zero fuel weight and Wclimb is estimated from the plot in the climb section of these notes. The difference between initial and final cruise weights is the amount of fuel available for cruise. This is related to the cruise range as follows. The specific range is the distance flown per unit weight of fuel burned, often in n.mi. / lb. It can be related directly to the engine specific fuel consumption: Specific Range = V / cT
where V is the true speed, c is the thrust specific fuel consumption, and T is the thrust. In level flight (or approximately when the climb angle is very small): T = D = W / (L/D), so, Specific Range = V/c L/D 1/W V/c L/D is sometimes called the range factor. It is related to the aerodynamic (L/D) and propulsion system (V/c) efficiencies. The cruise range is then computed by integrating the specific range:
If the airplane is flown at a constant angle of attack (constant CL) and Mdiv in the isothermal atmosphere (above 36,089 ft) where the speed of sound is constant, then V, L/D, and c are nearly constant and:
This is known as the Breguet Range Equation. When the altitude variation is such that L/D, V, or c is not constant, the integral may be evaluated numerically. When the value of brake power specific fuel consumption is assumed constant (propeller aircraft), the range equation becomes:
where h is the propeller efficiency and BSFC is the power specific fuel consumption in consistent units. Range / Payload Diagram An aircraft does not have a single number that represents its range. Even the maximum range is subject to interpretation, since the maximum range is generally not very useful as it is achieved with no payload. To represent the available trade-off between payload and range, a range-payload diagram may be constructed as shown in the figure below.
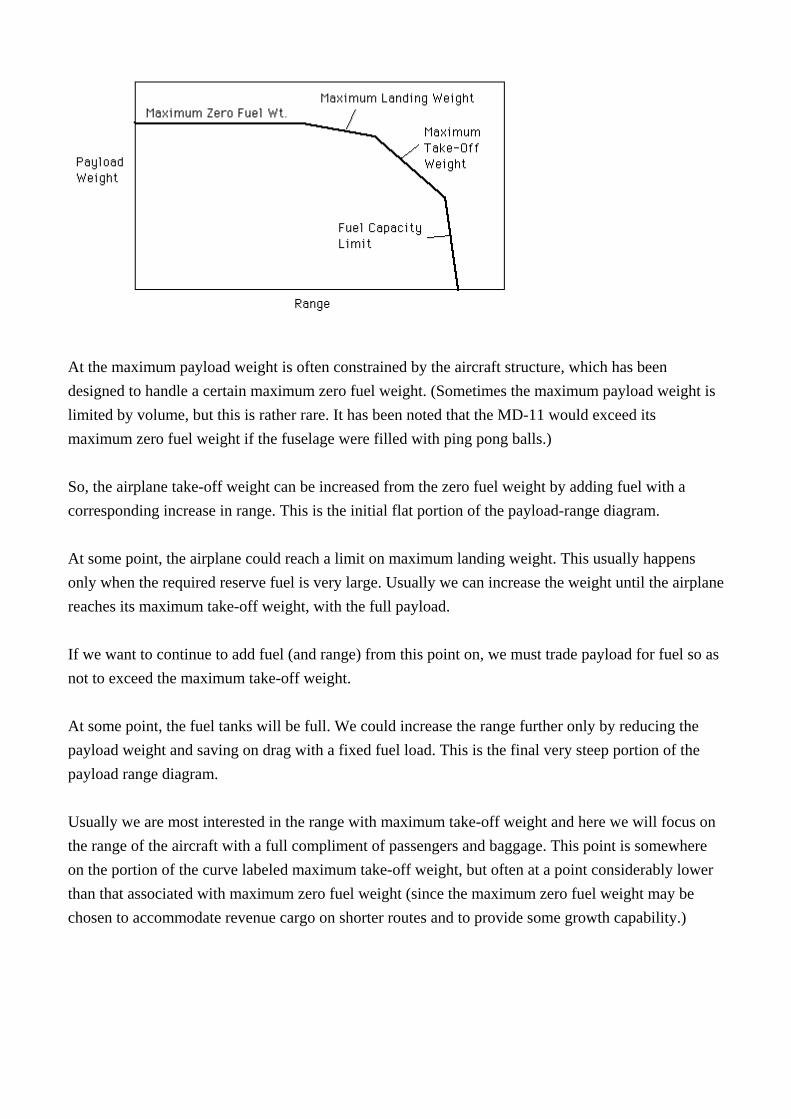
At the maximum payload weight is often constrained by the aircraft structure, which has been designed to handle a certain maximum zero fuel weight. (Sometimes the maximum payload weight is limited by volume, but this is rather rare. It has been noted that the MD-11 would exceed its maximum zero fuel weight if the fuselage were filled with ping pong balls.) So, the airplane take-off weight can be increased from the zero fuel weight by adding fuel with a corresponding increase in range. This is the initial flat portion of the payload-range diagram. At some point, the airplane could reach a limit on maximum landing weight. This usually happens only when the required reserve fuel is very large. Usually we can increase the weight until the airplane reaches its maximum take-off weight, with the full payload. If we want to continue to add fuel (and range) from this point on, we must trade payload for fuel so as not to exceed the maximum take-off weight. At some point, the fuel tanks will be full. We could increase the range further only by reducing the payload weight and saving on drag with a fixed fuel load. This is the final very steep portion of the payload range diagram. Usually we are most interested in the range with maximum take-off weight and here we will focus on the range of the aircraft with a full compliment of passengers and baggage. This point is somewhere on the portion of the curve labeled maximum take-off weight, but often at a point considerably lower than that associated with maximum zero fuel weight (since the maximum zero fuel weight may be chosen to accommodate revenue cargo on shorter routes and to provide some growth capability.)