Embed Size (px)
Citation preview

Wright State University Wright State University
CORE Scholar CORE Scholar
Browse all Theses and Dissertations Theses and Dissertations
2016
Aircraft Thermal Management using Liquefied Natural Gas Aircraft Thermal Management using Liquefied Natural Gas
Sean Robert Nuzum Wright State University
Follow this and additional works at: https://corescholar.libraries.wright.edu/etd_all
Part of the Mechanical Engineering Commons
Repository Citation Repository Citation Nuzum, Sean Robert, "Aircraft Thermal Management using Liquefied Natural Gas" (2016). Browse all Theses and Dissertations. 1480. https://corescholar.libraries.wright.edu/etd_all/1480
This Thesis is brought to you for free and open access by the Theses and Dissertations at CORE Scholar. It has been accepted for inclusion in Browse all Theses and Dissertations by an authorized administrator of CORE Scholar. For more information, please contact [email protected].

Aircraft Thermal Management using Liquefied Natural Gas
A thesis submitted in partial fulfillment of the requirements for the degree of Master of Science in Mechanical Engineering
By:
Sean Robert Nuzum BS Mechanical Engineering, Ohio Northern University, 2014
2016 Wright State University
WRIGHT STATE UNIVERSITY

GRADUATE SCHOOL
April 27, 2016
I HEREBY RECOMMEND THAT THE THESIS PREPARED UNDER MY SUPERVISION BY Sean Nuzum ENTITLED Using Liquefied Natural Gas as a Thermal Management Tool for Coping with the Problems Posed by Advanced Electronics on Aircraft with MatLab/Simulink BE ACCEPTED IN PARTIAL FULFILLMENT OF THE REQUIREMENTS FOR THE DEGREE OF Master of Science in Mechanical Engineering.
Rory Roberts, Ph.D
Thesis Director
Mitch Wolff, Ph.D
Thesis Director
George Huang, Ph.D
Chair, Department of Mechanical and
Materials Engineering
Rory Roberts, Ph.D
Ed Alyanak, Ph.D
Scott Thomas, Ph.D
Mitch Wolff, Ph.D
Committee of Final Examination
Robert E.W. Fyffe, Ph.D
Vice President for Research and Dean
of the Graduate School
WRIGHT STATE UNIVERSITY

iii
Abstract: Nuzum, Sean Robert. M.S.M.E Department of Mechanical and Materials Engineering, Wright State University, 2016. Aircraft Thermal Management using Liquefied Natural Gas Many technological advances are expected to increase the capabilities of the future aircraft, both
civilian and military. These improvements come in many forms such as new wing or fuselage shapes to
improve lift or decrease drag. Other improvements are internal. One of these areas is the inclusion of
advanced electronic systems for various roles. These changes affect a wide range of aircraft systems
including, but not limited to avionics, power generation and thermal management. While these
modifications promise to increase aircraft capabilities such as its range, payload or other key
performance parameters, there are some significant drawbacks. One drawback is the thermal and
power requirements needed to meet these needs. This problem will only be amplified by the addition of
a High Energy Pulsed System (HEPS). This improvement, along with existing electronic systems that
could be featured on next generation aircraft could cause a significant thermal load on an aircraft,
where heat dissipation is already a problem. HEPS of this sort generate excessive amounts of heat
during operation, creating an aircraft integration problem that might overwhelm the vehicles thermal
management systems. Using the innovative solution of cryogenically cooling the HEPS, the proposed
system would use Liquefied Natural Gas (LNG) as the system’s primary coolant. In order to accomplish
this, preliminary studies were carried out which indicated that the cryogenic cooling system for a HEPS
could possibly be of a reasonable size for an aircraft application. Following this, detailed
MatLab/Simulink models were made of the required cryogenic components so that they could be
integrated into a T2T model to analyze the vehicle level effects of the LNG system. An initial aircraft
integrated LNG HEPS system was designed and the results showed the HEPS was cooled and the rest of
the aircraft also received a cooling effect. Further studies have enhanced that effect and attempted to

iv
accomplish the same cooling capability as the baseline aircraft, while using the LNG more efficiently.
These studies show that LNG is indeed capable of thermally managing the entire aircraft effectively with
a reasonable amount of LNG. Additionally, the designed architecture that cooled the entire aircraft with
LNG showed that it could cope with the anticipated increase in thermal demands over time by simply
adding additional LNG capacity. Finally, an architecture was designed that would take full advantage of
LNG as a fuel. This palletized system uses the LNG to fuel a micro gas-turbine which in turn provides
electricity to the HEPS and other systems directly connected to the LNG system. This proposed
architecture is a good platform to investigate the transient concerns of startup, shutdown and other
operating points of the system for various missions. In summary, LNG has shown itself to be an effective
coolant and a distinct possibility as a solution to rapidly increasing power and thermal demands aboard
aircraft, which deserves further in depth experimentation and study to develop a viable system.

v
Table of Contents: Abstract: ....................................................................................................................................................... iii
Table of Contents: ......................................................................................................................................... v
Table of Figures: ........................................................................................................................................... vi
Table of Tables: .......................................................................................................................................... viii
Nomenclature (Text): ................................................................................................................................... ix
Nomenclature (Equations): .......................................................................................................................... ix
Acknowledgements:.................................................................................................................................... xii
Introduction: ................................................................................................................................................. 1
Problem Overview: ................................................................................................................................... 1
Proposed LASER Operation: ...................................................................................................................... 2
Tip to Tail (T2T) Modeling: ........................................................................................................................ 5
Literature Review: ......................................................................................................................................... 7
Tip-to-Tail Modeling: ................................................................................................................................. 7
Aviation LNG: ............................................................................................................................................ 9
Cryogenic Laser Operation: ..................................................................................................................... 10
Preliminary Study and Research: ................................................................................................................ 11
MatLab/Simulink Model Components Developed: .................................................................................... 23
Cryogenic Storage Tank: ......................................................................................................................... 23
Cryogenic HEPS: ...................................................................................................................................... 28
Mixing Chamber: ..................................................................................................................................... 31
Results: ........................................................................................................................................................ 34
Basic LNG System Operation: ................................................................................................................. 34
Integrated LNG System: .......................................................................................................................... 36
Enhanced Integrated LNG System: ......................................................................................................... 42
Total LNG:................................................................................................................................................ 52
Palletized System – Gas Turbine Powerplant: ........................................................................................ 63
Conclusions: ................................................................................................................................................ 85
References: ................................................................................................................................................. 90

vi
Table of Figures: Figure 1: Thermal and Power Demands aboard Military Aircraft2 ............................................................... 2
Figure 2: Laser Efficiency with Respect to Operating Temperature8,9 .......................................................... 4
Figure 3: Total Power and Thermal Load on Aircraft .................................................................................... 5
Figure 4: Multi-view drawing of conceptual simulated aircraft in T2T model14 ........................................... 6
Figure 5: Hvap of LNG and LN2 for variations in pressure22 .......................................................................... 12
Figure 6: Schematic of the baseline proposed palletized HEPS system ..................................................... 14
Figure 7: Mass and volume of HEPS thermal and power management system, 300kW turbine case ....... 16
Figure 8: Mass and volume of HEPS thermal and power management system, 3MW turbine case ......... 17
Figure 9: SOFC-GT Schematic35 ................................................................................................................... 18
Figure 10: Mass and volume of the HEPS thermal and power management system. (SOFC/GT case) ...... 19
Figure 11: Schematic of the proposed integrated HEPS system ................................................................. 20
Figure 12: Mass and volume of the HEPS thermal and power management system. (Integrated case) ... 21
Figure 13: Mission Profile ........................................................................................................................... 34
Figure 14: Cold plate temperature during laser activation......................................................................... 35
Figure 15: Architecture of LNG System for the Integrated Case Study ...................................................... 36
Figure 16: TMS Architecture for the Integrated Case Study ....................................................................... 37
Figure 17: Cockpit Temperature of the Integrated LNG Case ..................................................................... 38
Figure 18: Liquid Cooled Avionics Temperature of the Integrated LNG Case ............................................ 39
Figure 19: Cockpit Temperature of the Integrated LNG Case with High Heat Load ................................... 40
Figure 20: Liquid Cooled Avionics Temperature of the Integrated LNG Case with High Heat Loads ......... 41
Figure 21: TMS Architecture for Cooling Recirculating Fuel with LNG ....................................................... 43
Figure 22: Fuel Tank Temperatures Comparing Baseline Cooling and LNG Cooling................................... 44
Figure 23: TMS Architecture for Cooling the Engine Bypass Flow with LNG .............................................. 45
Figure 24: Third Stream Temperatures Comparing Baseline Cooling and LNG Cooling ............................. 46
Figure 25: Cockpit Temperature of the Enhanced Integrated LNG Case .................................................... 47
Figure 26: Liquid Cooled Avionics Temperature of the Enhanced Integrated LNG Case ............................ 48
Figure 27: IPP and VCS Usage during Mission ............................................................................................. 49
Figure 28: Cockpit Temperature of Enhanced Integrated LNG Case for High Heat Loads ......................... 50
Figure 29: Liquid Cooled Avionics Temperature of Enhanced Integrated LNG Case for High Heat Loads . 51
Figure 30: TMS Architecture for Cooling the Entire Aircraft with LNG ....................................................... 53
Figure 31: Architecture of LNG System in the Total LNG Case Study ......................................................... 54
Figure 32: Cockpit Temperature for the Total LNG System ........................................................................ 55
Figure 33: Liquid Cooled Avionics Temperature for the Total LNG System ................................................ 56
Figure 34: Bleed Air from Engine in the Total LNG Case vs. the Baseline ................................................... 57
Figure 35: Cockpit Temperature for the Total LNG System at a High Heat Load ....................................... 58
Figure 36: Liquid Cooled Avionics Temperature for the Total LNG System at a High Heat Load ............... 59
Figure 37: Bleed Air from Engine in the Total LNG Case vs. the Baseline with High Heat Load ................. 60
Figure 38: Detailed Architecture for a Palletized LNG system with a Micro Gas-Turbine .......................... 64
Figure 39: Example of Expanding Volume Tank Design .............................................................................. 65
Figure 40: LNG HEPS Transient Operation Example ................................................................................... 66

vii
Figure 41: Palletized Mission 1 Profile ........................................................................................................ 67
Figure 42: Laser Temperature Profile for Mission 1 ................................................................................... 68
Figure 43: Main LNG Tank Fluid Level for Mission 1 ................................................................................... 69
Figure 44: Expanding Volume Tank Fluid Level for Mission 1 ..................................................................... 70
Figure 45: Gas Turbine Power in Mission 1 ................................................................................................ 71
Figure 46: Battery Charge for Mission 1 ..................................................................................................... 72
Figure 47: Palletized Mission 2 Profile ........................................................................................................ 73
Figure 48: Laser Temperature Profile for Mission 2 ................................................................................... 74
Figure 49: Main LNG Tank Fluid Level for Mission 2 ................................................................................... 75
Figure 50: Expanding Volume Tank Fluid Level for Mission 2 ..................................................................... 76
Figure 51: Gas Turbine Power in Mission 2 ................................................................................................ 77
Figure 52: Battery Charge for Mission 2 ..................................................................................................... 78
Figure 53: Palletized Mission 3 Profile ........................................................................................................ 79
Figure 54: Laser Temperature Profile for Mission 3 ................................................................................... 80
Figure 55: Main LNG Tank Fluid Level for Mission 3 ................................................................................... 81
Figure 56: Expanding Volume Tank Fluid Level for Mission 3 ..................................................................... 82
Figure 57: Gas Turbine Power in Mission 3 ................................................................................................ 83
Figure 58: Battery Charge for Mission 3 ..................................................................................................... 84

viii
Table of Tables:
Table 1: Cryogen Hvap Properties................................................................................................................. 12
Table 2: Mass and volume of HEPS thermal and power management system, 300kW turbine case ........ 16
Table 3: Mass and volume of HEPS thermal and power management system, 3MW turbine case .......... 18
Table 4: Mass and volume of HEPS thermal and power management system, SOFC-GT case .................. 19
Table 5: Thermal sink capability comparison of LNG to JP8 in integrated system ..................................... 21
Table 6: LNG flow comparison for changing altitude ................................................................................. 22
Table 7: Mass and volume of HEPS thermal and power management system, Integrated case ............... 22
Table 8: Case comparison for one hour of lasing ........................................................................................ 22
Table 9: Integrated LNG system TMS sizing ................................................................................................ 38
Table 10: Heat Load Multiplier ................................................................................................................... 39
Table 11: Integrated LNG system TMS Sizing for Increased Heat Load ...................................................... 41
Table 12: Basic LNG System Mass and Volume Estimates .......................................................................... 42
Table 13: Enhanced Integrated LNG system TMS ....................................................................................... 47
Table 14: Enhanced LNG System Mass and Volume Estimates .................................................................. 49
Table 15: Enhanced Integrated LNG system TMS Sizing for Increased Heat Load .................................... 50
Table 16: Engine Bleed Comparison ........................................................................................................... 60
Table 17: Sizing of Removed Components from Legacy System ................................................................ 61
Table 18: Total LNG Component Masses .................................................................................................... 61
Table 19: Total LNG Component Volumes .................................................................................................. 61
Table 20: Fuel HComb Properties40–42 ............................................................................................................ 62
Table 21: JP8 able to be replaced by LNG ................................................................................................... 62
Table 22: Total Sizing Change by Changing Aircraft from Legacy TMS to Total LNG .................................. 63
Table 23: Palletized LNG System LNG Consumption Comparison .............................................................. 84

ix
Nomenclature (Text): ACA = Air Cooled Avionics AFRL = Air Force Research Laboratories AIAA = American Institute of Aeronautics and Astronautics APTMS = Adaptive Power and Thermal Management System APU = Auxiliary Power Unit AVS = Air Vehicle System DARPA = Defense Advanced Research Projects Agency EOA = Energy Optimized Aircraft FTMS = Fuel Thermal Management System Hvap = Heat of Vaporization HELLADS = High Energy Liquid Laser Area Defense System HEPS = High Energy Pulsed System HPEAS = High Performance Electrical Actuation System IPP = Integrated Power Pack (Air Cycle Machine) LCA = Liquid Cooled Avionics LN2 = Liquid Nitrogen LNG = Liquefied Natural Gas MEA = More Electric Aircraft MLI = Multi-Layer Insulation NPSS = Numerical Propulsion System Simulation PAO = Polyalphaolefin Oil REPS = Robust Electrical Power System SOFC = Solid Oxide Fuel Cell SOFC-GT = Solid Oxide Fuel Cell Gas Turbine Hybrid UAV = Unmanned Aerial Vehicle VCS = Vapor Compression System
Nomenclature (Equations): 𝑎𝑣 = First Van der Waals Constant 𝐴 = Cross Sectional Area of Plumbing
𝐴𝑝𝑙𝑎𝑡𝑒 = Area of Cold Plate
𝑏𝑣 = Second Van der Waals Constant 𝐶𝑝𝑃𝐴𝑂 = Specific Heat of PAO
𝐶𝑝𝑝𝑙𝑎𝑡𝑒 = Specific Heat of Cold Plate 𝐷 = Diameter of Plumbing Section
𝐷𝑖𝑛𝑠𝑖𝑑𝑒 = Diameter of the Interior of the Tank 𝐷𝑡𝑎𝑛𝑘 = Diameter of the Exterior of the Tank
𝐸𝑛𝑒𝑟𝑔𝑦𝑒𝑙𝑒𝑐𝑡 = Electrical Energy in Battery 𝑓 = Darcy Friction Factor ℎ = Specific Enthalpy ℎ1 = Specific Enthalpy of First Flow into Mixing Chamber ℎ2 = Specific Enthalpy of Second Flow into Mixing Chamber ℎ3 = Specific Enthalpy of Third Flow into Mixing Chamber
ℎ𝑜𝑢𝑡 = Specific Enthalpy of Flow Exiting the Mixing Chamber

x
ℎ𝑠𝑎𝑡𝑙𝑖𝑞 = Specific Enthalpy of a Saturated Liquid
ℎ𝑠𝑎𝑡𝑙𝑖𝑞𝐻𝐸𝑃𝑆 = Specific Enthalpy of a Saturated Liquid at HEPS Conditions
ℎ𝑠𝑎𝑡𝑙𝑖𝑞𝑡𝑎𝑛𝑘 = Specific Enthalpy of a Saturated Liquid at Tank Conditions
ℎ𝑠𝑎𝑡𝑣𝑎𝑝 = Specific Enthalpy of a Saturated Vapor
ℎ𝑠𝑎𝑡𝑣𝑎𝑝𝐻𝐸𝑃𝑆 = Specific Enthalpy of a Saturated Vapor at HEPS Conditions
ℎ𝑣𝑎𝑝 𝐿𝑁𝐺 = Specific Enthalpy of LNG Vapor
𝐻𝐶𝑜𝑚𝑏,𝐽𝑃8 = Heat of Combustion of JP8
𝐻𝐶𝑜𝑚𝑏,𝐿𝑁𝐺 = Heat of Combustion of LNG 𝐻𝑣𝑎𝑝 = Enthalpy of Vaporization
𝑘𝑖𝑛𝑠𝑢𝑙𝑎𝑡𝑖𝑜𝑛 = Conductivity of Insulation
𝐿𝑖𝑛𝑠𝑖𝑑𝑒 = Length of the Inside of the Tank
𝐿𝑖𝑛𝑠𝑢𝑙𝑎𝑡𝑖𝑜𝑛 = Thickness of Insulation
𝐿𝑝𝑙𝑎𝑡𝑒 = Thickness of Cold Plate
𝐿𝑠𝑘𝑖𝑛 = Thickness of the Skin 𝐿𝑡𝑎𝑛𝑘 = Total Length of Tank
∆𝐿 = Plumbing Length Over Which Pressure Drops 𝑚 = Mass
𝑚𝑓𝑙𝑢𝑖𝑑 = Mass of Fluid (liquid and vapor)
𝑚𝑓𝑙𝑢𝑖𝑑𝑀𝑋 = Mass of Fluid in the Mixing Chamber
𝑚𝐽𝑃8 = Mass of JP8
𝑚𝑙𝑖𝑞 = Mass of Liquid
𝑚𝐿𝑁𝐺 = Mass of LNG 𝑚𝑡𝑎𝑛𝑘 = Mass of LNG Contained in the Tank
𝑚𝑇𝑜𝑡𝑎𝑙 = Total Mass of Liquid and Fluid
𝑚𝑣𝑎𝑝𝑜𝑟 = Mass of Vapor �̇� = Mass Flow Rate
�̇�1 = First Mass Flow Rate into Mixing Chamber �̇�2 = Second Mass Flow Rate into Mixing Chamber �̇�3 = Third Mass Flow Rate into Mixing Chamber �̇�𝑖𝑛 = Mass Flow Rate In
�̇�𝑙𝑖𝑞 = Mass Flow Rate of Liquid
�̇�𝑙𝑖𝑞𝑢𝑖𝑑𝐼𝑁 = Mass Flow Rate of Liquid In
�̇�𝑙𝑖𝑞𝑢𝑖𝑑𝑂𝑈𝑇 = Mass Flow Rate of Liquid Out
�̇�𝐿𝑁𝐺 = Mass Flow Rate of LNG �̇�𝑜𝑢𝑡 = Mass Flow Rate Out �̇�𝑃𝐴𝑂 = Mass Flow Rate of PAO
�̇�𝑟𝑒𝑞𝑢𝑖𝑟𝑒𝑑 = Mass Flow Rate Required
�̇�𝑣𝑎𝑝𝑜𝑟 = Mass Flow Rate of Vapor
�̇�𝑣𝑎𝑝𝑜𝑟𝑂𝑈𝑇 = Mass Flow Rate of Vapor Out
𝑃 = Pressure 𝑃𝑐𝑟𝑖𝑡 = Critical Pressure
𝑃𝑜𝑤𝑒𝑟𝑖𝑛 = Power Entering Battery 𝑃𝑜𝑤𝑒𝑟𝑜𝑝𝑡𝑖𝑐𝑎𝑙 = Optical Power of the Laser
𝑃𝑜𝑤𝑒𝑟𝑜𝑢𝑡 = Power Exiting Battery ∆𝑃 = Pressure Drop in Plumbing
�̇�𝑐𝑜𝑛𝑑𝑢𝑐𝑡𝑖𝑜𝑛𝐼𝑁 = Heat Transfer by Conduction Into System

xi
�̇�𝑐𝑜𝑛𝑡𝑟𝑜𝑙𝐼𝑁 = Heat Transfer into the Tank by the Heater for Pressure Control
�̇�𝑖𝑛 = Heat Transfer Rate into System
�̇�𝑜𝑢𝑡 = Heat Transfer Rate out of the System
�̇�𝐿𝑎𝑠𝑒𝑟 𝑡ℎ𝑒𝑟𝑚𝑎𝑙 = Heat Transfer Rate from the Laser Thermal Energy
𝑅 = Ideal Gas Constant 𝑆𝐴𝑖𝑛𝑠𝑢𝑙𝑎𝑡𝑖𝑜𝑛 = Surface Area of the Insulation
𝑆𝐴𝑠𝑘𝑖𝑛 = Surface Area of the Skin 𝑆𝐴𝑡𝑎𝑛𝑘 = Surface Area of Tank
𝑡 = Time 𝑇 = Temperature
𝑇𝑐𝑟𝑖𝑡 = Critical Temperature
𝑇𝑓𝑙𝑢𝑖𝑑 = Temperature of the Fluid
𝑇𝑖𝑛𝑠𝑖𝑑𝑒 = Temperature of Inside of Tank 𝑇𝑜𝑢𝑠𝑖𝑑𝑒 = Temperature of Outside of Tank 𝑇𝑃𝐴𝑂 𝑖𝑛 = Temperature of PAO Fluid Entering Phase Change Heat Exchanger
𝑇𝑃𝐴𝑂 𝑜𝑢𝑡 = Temperature of PAO Fluid Leaving Phase Change Heat Exchanger
𝑇𝑝𝑙𝑎𝑡𝑒 = Temperature of the Cold Plate
𝑈 = Heat Transfer Coefficient of Fluid on Cold Plate 𝑉 = Volume
𝑉𝑙𝑖𝑞 = Volume of Liquid
𝑉𝑓𝑎𝑐𝑡𝑜𝑟 = Volume Correction Factor - % of Initial Empty Space in Tank
𝑉𝑖𝑛𝑖𝑡𝑖𝑎𝑙 = Volume that the LNG Would Fill Under its Initial Conditions 𝑉𝑖𝑛𝑠𝑖𝑑𝑒 = Actual Interior Volume of Tank 𝑉𝑡𝑎𝑛𝑘 = Exterior Volume of the Tank 𝑉𝑇𝑜𝑡𝑎𝑙 = Total Volume of System That Fluid Can Fill
𝑉𝑣𝑎𝑝𝑜𝑟 = Volume of Vapor
𝑥 = Quality 𝜂𝑙𝑎𝑠𝑒𝑟 = Efficiency of the Laser
𝜌 = Density
𝜌𝑝𝑙𝑎𝑡𝑒
= Density of the Cold Plate
𝜌𝑖𝑛𝑠𝑢𝑙𝑎𝑡𝑖𝑜𝑛 = Density of the Insulation
𝜌𝑠𝑎𝑡𝑙𝑖𝑞𝑢𝑖𝑑
= Density of Saturated Liquid
𝜌𝑠𝑘𝑖𝑛 = Density of the Skin
𝜌𝑣𝑎𝑝𝑜𝑟
= Density of Vapor

xii
Acknowledgements: Without my advisors, Drs. Mitch Wolff and Rory Roberts, I would never have been able to accomplish so
much towards this research. They supported my work and myself at every turn; always pushing me that
one step further that created convincing and realistic results to the research. This document would not
exist had it not been for them.
Additionally, my fellow students in the thermal modeling group headed by Dr. Wolff and Dr. Roberts
were indispensable for their support as well. These students include Marcus Bracey, Robert Buettner,
Adi Chakravarthula, Adam Donovan, Nate McGillivray and Sam Tilmann. In particular Adam Donovan, for
his work in MatLab/Simulink T2T modeling, and Robert Buettner, for his work on MatLab/Simulink gas-
turbine modeling, were exceptionally helpful during several phases of this research.
Furthermore, this work has been aided by people outside of Wright State. For their technical support
throughout this process I thank the following people: Darcy Allison, Ed Alyanak, Steve Iden, Robert
Reuter, Greg Russell, and Jon Zumberge.
I would also like to thank the Center of Thermal Management for Aerospace Vehicles based at Purdue
University for the financial support. Some of this material is based on research sponsored by Air Force
Research Laboratory under agreement number FA8650-14-2-2419. Support for this project was also
supplied by the Dayton Area Graduate Studies Institute under research grant 669778. The U.S.
Government is authorized to reproduce and distribute reprints for Governmental purposes
notwithstanding any copyright notation thereon.
The views and conclusions contained herein are those of the authors and should not be interpreted as
necessarily representing the official policies or endorsements, either expressed or implied, of Air Force
Research Laboratory or the U.S. Government.
Finally, I would like to thank my family for their unwavering support throughout my education from
grade school to my current degree. They have been a true inspiration for my life and work; I don’t know
where or what I would be without them.

1
Introduction: In order to understand the details of the project, some preliminary information must be covered. This
information will explain the original inspiration to the project. On any engineering project, especially one
that is heavily based on modeling and simulation, there should always be a clear problem to solve. The
engineering method shows that after the problem is defined, the engineer should gather information
regarding the project. The basic research is meant to educate the engineer about the issues surrounding
the problem and to lead to an understanding of whether the project is feasible and deserves more
investigation.
Problem Overview:
As aircraft become more advanced, new problems crop up that cannot be remedied by legacy or
traditional solutions. Currently, aircraft systems are growing in number and complexity. In order to fulfill
their increasing mission requirements, aircraft designers have to add many systems and upgrade the
existing ones with the most modern electronics and materials. Which systems are added or changed
depends on the specific mission requirements. These requirements could aim to increase
maneuverability, top speed, range, survivability, or any combination of these and more. In response to
desires for increased maneuverability, high powered actuators are replacing mechanical control surface
manipulators1. With a higher powered electro-mechanical actuator in place, the control surface might
be moved further, quicker or with more force to assist the pilot in controlling the aircraft. These
actuators are controlled by fast reacting computers to adjust for the inherent instability that give many
modern aircraft a boost to their maneuverability. Furthermore, existing systems are being upgraded to
include more and higher powered electronics. The avionics systems to relay more information to the
pilot and ground centers require more power to monitor and control more factors. The on-board
systems such as radar and other targeting systems are being upgraded to more powerful versions of
themselves to increase the effectiveness of the vehicle and likelihood of pilot survivability. Additionally,
to decrease detection possibilities, engineers are changing the aircraft skins to advanced materials that
limit radar reflection. They are limiting the infrared signature of the aircraft by limiting the heat transfer
out of the aircraft to include only the exhaust to increase mission survivability.
The advancements of aircraft subsystems give the vehicles increased capabilities, but as with any design
decision, there is a tradeoff. A major problem being created is significantly higher thermal loads on
aircraft generated by these higher powered systems. These thermal and power demands aboard the
aircraft are expected to grow exponentially in the near future as demonstrated in Figure 12.

2
Figure 1: Thermal and Power Demands aboard Military Aircraft2
Figure 1 shows the dilemma facing future aircraft. Many legacy (4th generation) aircraft such as the F-16
and F-15 can properly manage their thermal loads themselves using ram air, fuel heat sinks and systems
such as a VCS (Vapor Compression System) or IPP (Integrated Power Pack). Aircraft that are more
recently debuting like the F-22 and F-35 (5th generation) still use fuel as a primary heat sink, but do not
employ the ram air heat sinks for drag and thermal signature reasons. The difference is that these
aircraft are reaching the limit of what can be thermally managed with the systems that they were
designed and equipped (i.e. there is no thermal margin). In order to manage larger thermal loads, the
IPP and/or VCS systems would have to be enlarged or added. Obviously, an innovative solution is
required. Figure 1 suggests a few solutions such as fan duct heat exchangers with various aviation fluids,
thermal energy storage or an expendable material.
The thermal and power demand problem will only be compounded by the inclusion of a HEPS into the
available arsenal. The addition of a HEPS, which could more than double the thermal load on the aircraft
and also put a significant drain on the power supply aboard the vehicle, would be difficult and possibly
lead to an overall reduction in the aircraft’s capability or mission survivability. In order to more
effectively manage the thermal loads generated by a HEPS, revolutionary aircraft designs should be
considered.
Proposed LASER Operation:
In its most basic form, a HEPS is simply a high powered laser. Lasers were first invented in 1960 by
Theodore Maiman of Hughes Laboratories3. The early lasers were also used for military purposes, but in
this case, for rangefinding3. From there, the laser was developed rapidly for more power and efficiency
among other qualities as more possible applications were envisioned. These devices, originally an
acronym for Light Amplification by Stimulated Emission of Radiation, have become common in the daily

3
life of most people. However, the general public is typically exposed to low powered lasers in their
barcode scanners, DVD players and laser pointers. For example, laser pointers cannot exceed a power
rating of 5W whereas a laser used as a HEPS will have to be about 30,000 times more powerful with a
rating of 150kW4.
There are several different classifications and types of lasers, one of which are dubbed solid state lasers.
The early development that made the solid state ruby crystal laser possible was the Q-switch3. This
improvement helped to collate the beam into a single pulse, thus increasing the lasing power of the
laser. Typically, these large powered lasers use the Q-switch to limit their pulse width to a few
nanoseconds3. This gives the laser ample time to build up energy and the energy is released over a
shorter time giving it more power. The way that a laser builds up power is through the excitation of the
laser materials. Exciting them causes the particles to move to a higher energy level, then when they
drop back to their base or previous energy levels, this energy is released, captured and collected into a
laser beam. For solid state lasers, the excited material is either crystal or glass doped with rare earth
metals3. It is these solid gain mediums which give the solid-state lasers their classification name. The
excitation energies are bounced back and forth between two mirrors and released by the Q-switch. The
ultimate output power of the laser is considered the optical power. There are several factors to consider
when designing a solid-state laser besides the final optical power. These include parameters such as
beam quality, which itself is a combination of factors, while a significant parameter compares how close
the sampled beam is to a true Gaussian beam. However, another key consideration is the overall
efficiency of the laser. That is how much of the electrical power input is converted into output light. This
factor is also key in describing the heat generated, which must be managed to prevent damaging the
laser crystals, pumping medium and other optical components3.
Lasers of higher power, in the kW range, are primarily used for manufacturing purposes3. Because these
lasers are used in manufacturing, their design constraints are different than those that would be used as
an airborne HEPS. Typically speaking, manufacturing lasers are large and heavy because these
characteristics make for a stable platform for working with. The laser will be less likely to shift during
operation and result in more consistent performance which is vital for manufacturing. Additionally, the
increased size acts as an excellent thermal sink for the laser allowing for it to operate at a reasonably
constant temperature during use. If the usage time needs to be extended and maintain that constant
operating temperature, the industrial lasers are typically designed to be cooled using deionized water.
The water is pumped through designed channels in the laser housing to maintain the laser at its
operating temperature, room temperature. Unfortunately, while these solutions are effective, they
make the laser system less applicable to airborne applications due to the increase in mass as the
solution to the thermal issues.
There have been several attempts at creating an airborne laser weapon system. One of these is a
government program called HELLADS (High Energy Liquid Laser Area Defense System)5,6. The goal of this
system is to allow an aircraft to face and defeat a large number of threats of different types. Examples of
these threats are other manned aircraft, smaller UAV systems, or ground targets5. The Defense
Advanced Research Projects Agency (DARPA) describes HELLADS as a 150kW laser that is an order of
magnitude smaller and lighter than existing systems, about 5kg/kW5. This laser will then be integrated

4
into a variety of aircraft platforms. Testing is expected to begin during 2015 and continue for many
years5,6. Another airborne laser program is called the YAL-17. This system was a precursor to the
HELLADS system, where its main goal was intercepting of missiles7. In this program, a large laser was
mounted to a heavily modified Boeing 747-400 with the laser exiting through a rotating turret mounted
in its nose7. Extensive testing has occurred starting in 20047. Unfortunately, the laser design used for this
program was massive, approximately 6500 lbs and composed of about 3600 different parts7. Regardless
of the power that the chemical laser in this program yielded, its size and complexity make it an
unrealistic design for smaller tactical aircraft.
Instead of these systems which tend to be either underpowered or too large and heavy for practical use,
the ideal case would be to create laser output of high power, but with a feasible mass and volume. A
way to accomplish this would be to increase the efficiency of the laser. This would enable a laser of a
higher output power to generate less thermal load. Research into solid state lasers has shown that when
they are cooled from room temperature operation to cryogenic temperatures around 100 K, their
efficiency increases to approximately 60%. Figure 2 is from this study by Chen8,9 (which can be found
also in the literature review) shows the effect that temperature has on laser efficiency.
Obviously a laser operating at a cooler temperature is more efficient between input and output powers.
The impact of this increase in efficiency on the total power and thermal load on the aircraft is shown in
Figure 3. Because the efficiency changes along with temperature, not only the thermal load is
decreased, but the laser now requires less overall electrical power. The reduction in electrical load is just
as significant as the reduction in thermal load as it requires less of a drain on the aircraft power systems
during laser operation. Shown in Figure 1, the total power and thermal load on the aircraft is a concern,
but using the laser at cryogenic temperatures decreases both the power and thermal demands on the
Figure 2: Laser Efficiency with Respect to Operating Temperature8,9

5
aircraft. A 150kW laser would normally require 750kW of electricity and generate 600kW of waste heat
during normal operation. At a cryogenic operating temperature, those numbers are significantly reduced
to requiring a mere 250kW of electricity and generating 100kW of heat. This reduction in total power
and thermal load on the aircraft is shown in Figure 3.
Figure 3: Total Power and Thermal Load on Aircraft
Laser operation at cryogenic temperatures has been successfully demonstrated10. As the laser crystal
operational temperature decreases, testing shows that the laser efficiency does increase sharply.
Another key effect that cooling has on the laser is the reduction of the coefficient of thermal expansion.
The thermal expansion of the laser crystals, in these solid state lasers, causes a shift in the wavelength
that the laser is operating. The laser crystals are designed to emit at a single specific frequency for
maximum optical power and if this frequency is shifted due to the laser crystal expanding and changing
shape during operation, then the laser optical power will drop off significantly. The reduction in this
thermal expansion coefficient means that for each degree the laser crystals heat up, they will expand
less. Therefore, the crystals can change in temperature approximately three times more for the same
crystal expansion and power drop. During lasing, the crystals can change by 6K instead of a mere 2K if
they are cryogenically cooled. While this is still a small change in temperature, it is wider and enables
the use of a smaller cooling system with less flow since it does not have to be so tightly regulated.
Tip to Tail (T2T) Modeling:
In order to evaluate the overall effect that a proposed LNG laser system would have on an aircraft, it
would have to be modeled in a complete aircraft model. This would enable the user to optimize the
0
200
400
600
800
1000
1200
1400
1600
To
tal
Lo
ad
on
Air
cra
ft (
kW
)
Thermal Load
Electrical Load
Room Temp
(20% Efficiency)
Cryo Cooled
(60% Efficiency)

6
entire aircraft system rather than each subsystem individually and risk an off-optimum total design.
These models are called Tip to Tail (T2T) models because they model subsystems over the entire aircraft.
In this thesis the T2T model will simulate the power and thermal subsystems aboard the aircraft. The
model also accounts for subsystem power, thermal and mechanical interactions. The T2T model used
has been used in other similar thermal system optimization studies11,12. The model is separated into
several major component subsystems11–13.
The modeled aircraft itself is a conceptual plane with an estimated take-off weight of 85,000 lbs, length
of 78 ft and wing span of 50 ft14. The aircraft is also in a tailless configuration for which the stability is
addressed through thrust vectoring. Figure 4 shows the conceptual aircraft used in the simulation.
Figure 4: Multi-view drawing of conceptual simulated aircraft in T2T model14
In addition to this study, the conceptual aircraft model has been used previously to perform thermal and
power studies by simulating a tactical military fighter aircraft15. The aircraft is modeled using a drag
polar calculated using inviscid CFD and includes equations of motion in each of the three coordinate
directions: X,Y, and Z. The propulsion for the aircraft is a tabular based three stream engine model,
which was developed in NPSS (Numerical Propulsion System Simulation) with collaboration with AFRL.15–
17 The engine is based on a table of steady state engine performance curves. The three stream engine
differs from the standard low-bypass turbofan in that a second bypass or third stream is initiated after
the fan and before the low pressure compressor. The second bypass is then mixed back into the main
flow at the nozzle. The so-called third stream is used in the model as a sink for thermal energy.
The aircraft thermal management system (TMS) is separated into a couple of sections. One is the Fuel
Thermal Management System (FTMS). This system includes the various heat loads which add thermal
energy to the fuel on its way to the engine. These loads include the heat exchangers associated with the
hydraulics, pumps, engine oil and generator. Additionally, the fuel pumps are modeled along with the
fuel tanks and recirculation flows. The Adaptive Power and Thermal Management System (APTMS)
includes the remainder of the thermal management systems. The APTMS is primarily made up of a
polyalphaolefin (PAO) loop which is used to cool the liquid cooled avionics and a heat exchanger with
the bleed air to cool the cockpit and air cooled avionics. In order to provide cooling to the PAO loop and

7
elsewhere, there are two mechanical systems used to lift heat from the PAO loop to the engine bypass.
The Vapor Compression System (VCS) is a Rankine cycle refrigeration system that works in conjunction
with the Integrated Power Pack (IPP) which is a Brayton cycle refrigeration system. The IPP is powered
by bleed air from the engine which spins the power turbine. The compressor and other turbine are used
in conjunction with a heat exchanger in the third stream to cool the working air. The turbines and
compressor are modeled using generalized maps. The heat exchangers in the model are documented
counter-flow plate-fin heat exchangers11,12. Finally, the electrical systems and loads are simplified into
heat loads and used in the FTMS and APTMS. These loads are derived from constants based on different
parts of the mission.
Using the described T2T model as a tool, the LNG laser system can be properly evaluated. The T2T model
enables the LNG’s total effect to be analyzed. The LNG system can be optimized for each case to
minimize its negative effects on the aircraft. Additionally, the T2T model shows the potential positive
side effects that the LNG system might have on the rest of the aircraft. For a power and thermal system
such as the LNG laser that is years away from a working prototype, using a T2T model such as this is an
effective method to evaluate it.
Literature Review: Since this thesis involves a wide range of topics, the literature review will cover several areas. The laser
operation at varying temperatures including cryogenic will be covered. Additionally, since one of the
project outcomes will be to integrate the LNG model into a vehicle level model and study its
interactions, the concept of T2T modeling will also be reviewed from a few sources.
Tip-to-Tail Modeling:
Reuter, Iden, Snyder and Allison of AFRL and Optimal Flight Sciences compiled a paper regarding design
and multidisciplinary optimization for the 2016 AIAA Science and Technology Forum and Exposition18.
One of the primary reasons for the need to have multidisciplinary design is the increasing capabilities.
These capabilities place extra loads on the aircraft that need to be designed for. One of these extra loads
is the thermal load generated by an increased number of higher powered electronic systems. Other
systems that require this optimization approach is the controls for each subsystem onboard next
generation aircraft. Aircraft of the current generation already show that significant redesign costs in
both time and dollar amounts are caused by designing subsystems independently and then integrating
them together at a later date. When each subsystem is optimized independently, the larger vehicle level
system is likely not optimal and will underperform expectations. Redesigning the vehicle late in the
design process to meet these expectations can become a drawn out, expensive process. Wouldn’t it be
better to begin the design process looking at a vehicle level design and generate the proper
specifications for each of the component subsystems? A big question in this process is the fidelity of the
subsystem computer models used in the optimization routine. If the component models are too
complex with too high of fidelity, the vehicle level model will be rather large and take a significant
amount of computing power and time to run, let alone optimize. The reason to use model based
multidisciplinary optimization is to enable more certainty in the final capabilities of the aircraft earlier in
the design process. If it were found that the plane was not going to meet requirements, the earlier this

8
is discovered, the quicker and cheaper it will be to remedy the situation. Furthermore, a vehicle level
model would enable designers to optimize the subsystems and overall vehicle over a wider range of
operating conditions, not just the design point. The principals behind multidisciplinary optimization and
design are immolated in the T2T model and any other model developed for this thesis.
While with the AFRL INVENT program, Wolff wrote a paper detailing the motivation and development of
a Tip to Tail (T2T) model13. This paper reinforces the exponentially increasing power and thermal loads
that will be present aboard future aircraft and proposes the need for an Energy Optimized Aircraft (EOA)
by using a vehicle level design approach when it comes to power and thermal management instead of
optimizing subsystems independently. In order to optimize on a vehicle level during the conceptual
design and primary design phases, a vehicle level model describing the power and thermal demands of
the aircraft would be required. It should include a multi-degree of freedom vehicle model, the power
and thermal management systems as well as all of the power and thermal loads that are present. In
addition to optimization, this model could be used to see the high level reactions to changing small
subsystems or merely portions of subsystems. The model that resulted from this paper and research had
six major subsystem groups: Engine, Fuel Thermal Management System (FTMS), Adaptive Power and
Thermal Management System (APTMS), Air Vehicle System (AVS), High Performance Electrical Actuation
Systems (HPEAS) and Robust Electrical Power System (REPS). With this model constructed, the authors
were able to compare three different thermal management architectures. In this paper, the
architectures were compared based on fuel burn and fuel tank thermal management among other
factors. Additionally, the model allowed the authors to analyze the transient properties, including
electrical power demands, throughout the mission to better identify where to focus their efforts on
improving the theoretical aircraft architecture/design to better optimize the system.
Roberts at Wright State University has written two technical papers discussing the concept of Tip to Tail
(T2T) modeling11,12. In the Journal of Thermodynamics paper, the author describes in detail the
components that make up the T2T model11. The methodology and equations that are behind the
Simulink models are presented. This paper describes each major T2T component and the equations that
make up their logic. Basic results are also presented in this paper; they describe the types of results that
can be garnered from this model. The model tracked the temperatures of the various components and
ensured that they were properly thermally managed with allowed variances that can be tuned by the
user to get superior performance from other parts of the model. Changing the control parameters were
shown to have the ability to improve the aircrafts fuel consumption rate among other key factors. The
Journal of Dynamic Systems, Measurement, and Control paper further advances this research field12.
Specifically working with a nearly identical model, the authors used the T2T model described to do
comparison studies with different control architectures for the Integrated Power Pack (IPP). The IPP is
the Brayton cycle refrigeration system that is used to cool several avionics systems aboard the T2T
simulated aircraft. In the paper, the IPP was controlled such that the shaft speed of the turbomachinery
was either constant or could vary while being controlled with engine bleed or was simply controlled by
an electric motor for the desired speed depending on the thermal loads at that specific time. It was
found that the fuel consumption of the whole aircraft over the entire mission was reduced for both of
the variable speed cases when compared to the constant speed case with the electrically controlled case

9
performing the best. The same results might not have been reached had just the IPP been modeled, or
just the APTMS been modeled. It was only by looking at the entire aircraft that this dynamically
integrated system could be considered and evaluated. In fact, the authors state that the main drawback
of the variable speed cases was a fuel temperature rise at the engine injectors and that this result would
not have been found had the FTMS and engine models not been included in the T2T model12. This
proves the T2T model concept as a valid optimization tool and a near requirement for improving the
performance of an entire air vehicle rather than just improving individual systems while potentially
harming the overall vehicle.
Chakraborty et al wrote a paper for the Journal of Aerospace Engineering which is part of the Institution
of Mechanical Engineers19. This paper primarily focuses on a new approach to system level modeling for
aircraft with more electronics. This approach will involve devising a system to analyze the system sizing
of all of the required subsystems given the limited information available about what a More Electric
Aircraft (MEA) might include. The authors begin by analyzing a conventional aircraft today and breaking
down the basic functional requirements that need to be met. This method of simplification can be
beneficial to use in any optimization project. If one simply breaks down the system into its basic needs it
is easier to imagine novel methods to meet those needs or a simplified architecture to accomplish the
same task that a hodge-podge of legacy systems are working to manage. By breaking down the aircraft
requirements, the authors were able to model replacing some of the mechanical systems with electric
ones. Examples of some of these systems are the control surfaces, landing gear retraction brakes and
the cabin environmental control. The weight of these new electric systems were then estimated and
included in the overall design model. The power requirements were then analyzed and power
generators were sized to be able to deliver adequate power to the systems throughout a simulated
typical mission. The authors performed an interesting study of a MEA, which could only be done with
the concept of T2T modeling. Otherwise, the complex interactions of all these new parameters would
have caused a great deal of uncertainty in their results. This approach to T2T modeling, breaking each
component down into its basic functions, is a good idea and should be used by any group attempting
such a model. It can help the modeler to devise new ways of organizing the aircraft and potentially
simplifying the system greatly which has the possibility to create a more optimized aircraft.
Aviation LNG:
Some work has been completed analyzing the space exploration applications of LNG by Tomsik et al for
2010 AIAA SpaceOps.20 This study was conducted with the Altair Lunar Lander and Orion spacecraft
originally in mind. Densification of fuels for spacecraft show promise as a weight savings approach to
fuels in space and on other worlds. In their vehicle design, they are using the LNG (referred to as liquid
methane) in the assent stage of the lunar lander. The spherical tanks were oversized by 15% to allow for
thermal expansion during the mission from the initial subcooled state. The primary insulation material is
multi-layer insulation (MLI), with as many as 80 layers used. This paper studies 23 methods of
densification methods to primarily maintain the LNG throughout the mission. These methods ranged
from using other super cooled liquids to cool the LNG through boiling or heat exchanger to mechanical
refrigeration pumps in various configurations. For each system, a hypothetical architecture was
developed and analyzed for mass. After each method was described, they were compared using a

10
decision matrix including factors such as cost, flight impact, ground impact and a special focus on safety
when the factors were weighted. Over the sequence of weighting scenarios, the Modified X33 system
performed the best. This system uses a compressor and heat exchanger on the flow to recover some of
the LNG as it is sent to the two primary storage tanks on board the spacecraft. In general, this study is a
deep analysis of a large variety of methods for employing LNG aboard a spacecraft. Some of this
information such as the tank design factors including insulation types and thicknesses and the general
tank shape will be helpful in the vastly different aircraft application that this research is pursuing.
Exploring the usage of LNG, Roberts of Wright State University wrote a paper for the 2015 AIAA
Propulsion and Energy Forum.21 This paper studies replacing the fuel on a F-22 Raptor with LNG. The
author addresses many benefits that the alternative fuel would have on aircraft design from a few
viewpoints. Thermal management, mass, volume and cost are the primary factors that are analyzed. The
study calculates the required amount of LNG to thermally manage the thermal load from a High Energy
Pulsed System (HEPS), the normal thermal loads on a F-22, and to power the main engines. Using this
quantity of LNG, the author was able to estimate the mass and volume of a LNG storage tank and TMS
system. This sizing was compared to the IPP, VCS and related components that could be removed.
Additionally, since JP8 was removed from the aircraft and the engine was converted to LNG, the mass
and volume of the JP8 tanks could be removed as well. The volume balance showed a gain of 1.92 m3.
However, this does not include the volume reduction by removal of the VCS because the author was
unable to reliably estimate its volume. The mass balance shows a net mass reduction by 1884 kg. The
mass is reduced even without the mass savings by removal of the TMS components. The mass and
volume aspect of this study demonstrate the advantages of using LNG aboard an aircraft as not only a
thermal management tool, but also as a primary fuel. Unfortunately, this academic study looks good on
paper, and might eventually lead to more practical studies and prototypes, but the logistics of switching
even a few legacy aircraft the LNG would be overwhelming. The best approach would be to plan on
using LNG as the primary fuel on an aircraft at the beginning of its design, and then also design the
massive infrastructure changes that would be required at airfields to accommodate the large quantity of
LNG that would be required to fuel a fleet of aircraft.
Cryogenic Laser Operation:
Chen et al from the nLight Corp in Vancouver Washington have written two papers describing efficiency
of high powered solid state lasers.8,9 These papers describe two kinds of solid state lasers, InP Diode and
Er doped, while operating over a range of temperatures. They found that both kinds of solid state laser
operate with a greater efficiency at cryogenic temperatures. As the plot in Figure 2 shows, this is due to
a reduction in the voltage, slope and threshold losses, but primarily the threshold losses. Chen also
experimented with optimizing the laser design for cryogenic operation. Solid state lasers are typically
optimized to operate at room temperature, but at lower temperatures, these lasers use an energy band
that is no longer optimal. The authors were able to further increase the efficiency of cryogenic lasers
over the 70% mark “reducing the energy band offsets and mitigating carrier freeze-out”. This shows that
future lasers could be even more efficient at lower temperatures if properly optimized for the role. This
whole new field of research could be opened up and show great potential once a cryogenic laser
application has been realized and supported.

11
Fan et al from MIT Lincoln Labs has conducted research into cryogenically cooled lasers10. This research
has been focused on the properties of the laser beam as the temperature is decreased. Specifically
interesting is the research conducted on how the laser wavelength is altered as the temperature
changes. As the temperature decreases, so does the thermal expansion coefficient of the laser crystals.
This affects the wavelength shift during operation allowing for a larger temperature variation while the
laser is active with the same wavelength shift. This is critical because the laser is optimized to emit peak
optical power at a certain wavelength and if the laser wavelength is shifted, it will output less optical
energy and more thermal energy.
Preliminary Study and Research:
After the efficiency benefits of a cryogenically cooled HEPS thermal management system were seen,
some preliminary studies were required to test the feasibility of this technology. These studies focused
mainly on the mass and volume of the system as well as a few other factors. If the mass of the system is
too great for the desired aircraft to lift or the system is too large to adequately fit on the aircraft, then
the whole system would have to be re-evaluated. In order for these studies to be carried out, some
preliminary architectures and comparisons were made.
The first study was to compare the two primary cryogenic fluids of interest, Liquid Nitrogen (LN2) and
Liquefied Natural Gas (LNG). The obvious cryogenic fluid is LN2 since it has a boiling temperature at 77 K,
which results in a laser efficiency of 60%. However, another very promising cryogenic fluid is proposed in
this research, LNG, which has a boiling temperature at 112 K, also keeping the efficiency at 60% as
shown in Figure 2. The boiling temperature is important because the proposed system uses the heat sink
capability that is locked in the phase change to cool the laser system. Additionally, using the phase
change will help to maintain the laser at the proper operating temperature since the fluid temperature
won’t vary during the phase change.
When comparing the two cryogenic fluids, several factors must be considered, including the density and
heat of vaporization (Hvap). The heat of vaporization directly relates to how much of the liquid is required
to cool the system. The Hvap of each liquid is dependent on pressure. At sea level atmospheric pressure,
the Hvap of LNG is 510 kJ/kg, compared to LN2 at 199 kJ/kg (61% lower than LNG)22. For a flight based
system, these values must be considered as pressure may change in the system. Figure 5 compares the
Hvap for each liquid over a range of pressures.

12
Figure 5: Hvap of LNG and LN2 for variations in pressure22
As Figure 5 shows, the heat of vaporization for both fluids increase as pressure decreases, but the LNG is
consistently higher than the LN2 by a significant margin. This means that the LNG is a more efficient
coolant using a phase change for the same mass of coolant for any operating pressure. Also, marked on
the chart with vertical lines are the pressures at aerospace related points of interest to be discussed
later, but an important note is that as the altitude increases from sea level to 30 and 60 thousand feet,
the Hvap increases, making each kg of liquid more effective at cooling.
The density is vital because of the importance of weight on an aircraft. The lighter this system is, the
more other aspects of the aircraft could be improved including maneuverability, payload, range and
speed to name a few. LNG has a density of 456 kg/m3, compared to LN2’s density of 809 kg/m3. When
the density and the Hvap are considered together one can analyze the Hvap in relation to volume of fluid.
LNG provides a 30% reduction in volume compared to LN2 when considering Hvap on a volume basis,
proving that LNG is a more effective coolant per kilogram and per cubic meter as seen in Table 1.
Table 1: Cryogen Hvap Properties
Hvap (kJ/kg) Hvap (kJ/L)
LN2 200 161
LNG 510 200
Finally, when comparing the two cryogenics, their usefulness aboard the vehicle must be considered.
After the LN2 has been boiled and possibly used to thermally manage other systems, it must be vented
0
100
200
300
400
500
600
0 200 400 600 800 1000
Hva
p (
kJ/k
g)
Pressure (kPa)
Hvap LNG
Hvap LN2
5Bar 1Bar
Pressure at 30,000ft Pressure at 60,000ft

13
to the environment as it has reached the end of its usefulness after it has been heated to a certain
temperature. However, it should be noted that since the atmosphere is already 79% nitrogen, this will
pose absolutely no danger to the environment or people in the vicinity. In comparison, the LNG can also
be used to cool additional systems after it has boiled, but after it reaches its upper temperature, it can
be used as a fuel source. The gas could be burned as a supplementary fuel in the primary propulsion
system or used to drive a power source that will generate power for the vehicle.
With an important aspect of LNG being a combustible and can be used as fuel, the basic LNG
architecture was designed, which can be seen in Figure 6. This palletized system is self-sufficient for
power and thermal management. It will use the LNG as a fuel source for a micro-gas turbine which will
in turn generate the required power for the system. The HEPS will be a 150kW solid state laser cooled
directly by the phase change of LNG using a cold plate. This means that ideally the LNG will enter the
laser as a saturated liquid and exit as a saturated vapor thus allowing the flowrate to be calculated by
comparing the Hvap of LNG to the amount of heat that needs to be dissipated. Additionally, the system
model will include a fluid handling system for plumbing the LNG thru either a fuel pump or by
pressurization of the system. In the calculations, this plumbing system had an assumed equivalent
length of 15m to account for the pressure losses in the pipes and elbows. Using this estimated length
and equation 1, the pressure drop could be calculated23.
∆𝑃
∆𝐿=
(�̇�𝐴
)2
𝑓
(2)(9.81)𝜌𝐷
1
The estimated plumbing pressure losses were found to be approximately 2.2kPa when considering the
friction factor of LNG flow through a 5/8 inch inside diameter pipe. A cryogenic fuel tank will also be
estimated along with the HEPS and finally, the micro gas turbine.

14
Research was conducted into micro gas turbines that are designed to use LNG as a fuel. Capstone makes
several models that employ natural gas as the fuel24–28. These devices require an inlet pressure of 520
kPa to operate. This value, added to the pressure losses in the plumbing was used to set the LNG tank
pressure. Unfortunately, the Capstone micro gas turbines were designed to be used in an auxiliary
ground station role, which means that their mass and volume is excessively conservative for an aviation
design. Thus, the mass and volume estimates were found using helicopter and UAV turboshaft engines
since these are designed specifically for aviation and employ the same basic turbomachinery29–33. These
engines were found to have an average mass to power ratio of 0.173 kg/kW and density of 1125.2
kg/m3.
The HEPS also required a few approximations. First, on the thermal side, the laser efficiency was
assumed to be 60%. Knowing this and knowing the Hvap of LNG at the required tank pressure of 522kPa,
the required flowrate can be determined with the following equation.
�̇�𝑟𝑒𝑞𝑢𝑖𝑟𝑒𝑑 =(𝜂𝑙𝑎𝑠𝑒𝑟)𝑃𝑜𝑤𝑒𝑟𝑜𝑝𝑡𝑖𝑐𝑎𝑙
𝐻𝑣𝑎𝑝
2
This equation assumes that 100% of the energy from the laser, with the assumed efficiency is used to
change the LNG from a saturated liquid to a saturated vapor. This would not account for any heat
transfer coefficient or heating of the fluid above the saturation temperature. Additionally, there are no
considerations made for the transient effects of turning the laser on and off. For the mass of the HEPS,
the HELLADS target mass was used as a reasonable estimate of a 5kg/kW HEPS5. This yielded a 750 kg
HEPS for the mass estimate. Unfortunately, a reliable estimate for the volume for such a system was
unavailable thus no volume estimate was made for any of the preliminary case studies.
Figure 6: Schematic of the baseline proposed palletized HEPS system

15
Finally, the fuel tank mass and volume was estimated. This was accomplished by comparing the HLNG
tank products made by Chart Industries34. These tanks are designed for automotive usage, primarily for
semi-trucks. Due to this they are likely over designed for an aerospace application and thus provide a
conservative estimate for both mass and volume. Additionally, concern was raised about the ability of
these tanks to withstand the pressure difference at operating pressures. These tanks are rated at 230psi,
which is 1586kPa. The maximum difference between the internal and external pressure will be 516kPa,
if the aircraft is at 60,000 ft and the tank is at its 5bar operating pressure. Using the information
provided by the manufacturer’s brochure, a rough estimate of the mass and overall volume of the
cryogenic tank could be estimated based on the volume of LNG that it can hold. The mass and volume
relations to the tank capacities were graphed and a linear fit line was found. This relation was used to
find the mass and volume of tanks as their capacity requirements varied. In each of the cases, the
horizontal axis is not in mission time, it is in lasing time, the amount of time for which the laser is
activated.
The first case, which is used as a baseline to compare the other cases, scaled the micro gas-turbine to
provide only the power required by the HEPS, with a small margin for a few other systems. This will
mean that a 300kW gas-turbine will be used to consume the LNG and provide power to the HEPS.

16
Figure 7: Mass and volume of HEPS thermal and power management system, 300kW turbine case
Figure 7 shows the total mass and volume for the system, and its components. The mass and volume will
both linearly increase as the total desired lasing time increases. Table 2 shows the total mass and
volume of the system for several intervals of continuous lasing.
Table 2: Mass and volume of HEPS thermal and power management system, 300kW turbine case
Time (Hr) Mass (kg) Volume (m3)
0.25 1252 0.69
0.5 1651 1.34
1 2450 2.63
The second study is to evaluate a system using the LNG completely. It was noted that the required LNG
flow rate to cool the laser has a significant amount of fuel potential. Even assuming a 25% efficient gas
turbine generator efficiency, the electrical power that can be generated would exceed 10 times the
0
500
1000
1500
2000
2500
3000
3500
4000
4500
0 0.5 1 1.5 2
Mas
s (k
g)
Operating Time (hrs)
LNG (Initial)
LNG Tank
DEW
Turbine
0
1
2
3
4
5
6
0 0.5 1 1.5 2
Vo
lum
e (
m3 )
Operating Time (hrs)
LNG Tank
DEW
Turbine
HEPS
HEPS
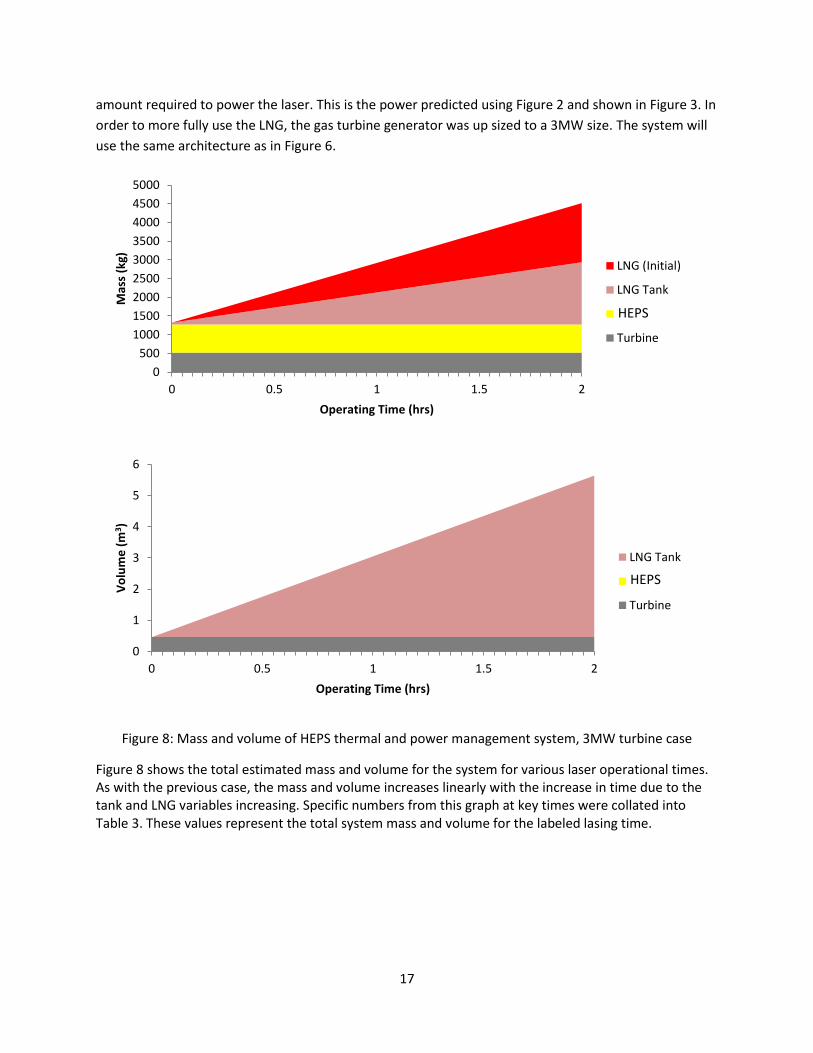
17
amount required to power the laser. This is the power predicted using Figure 2 and shown in Figure 3. In
order to more fully use the LNG, the gas turbine generator was up sized to a 3MW size. The system will
use the same architecture as in Figure 6.
Figure 8: Mass and volume of HEPS thermal and power management system, 3MW turbine case
Figure 8 shows the total estimated mass and volume for the system for various laser operational times. As with the previous case, the mass and volume increases linearly with the increase in time due to the tank and LNG variables increasing. Specific numbers from this graph at key times were collated into Table 3. These values represent the total system mass and volume for the labeled lasing time.
0
500
1000
1500
2000
2500
3000
3500
4000
4500
5000
0 0.5 1 1.5 2
Mas
s (k
g)
Operating Time (hrs)
LNG (Initial)
LNG Tank
DEW
Turbine
0
1
2
3
4
5
6
0 0.5 1 1.5 2
Vo
lum
e (
m3 )
Operating Time (hrs)
LNG Tank
DEW
Turbine
HEPS
HEPS

18
Table 3: Mass and volume of HEPS thermal and power management system, 3MW turbine case
Time (Hr) Mass (kg) Volume (m3)
0.25 1720 1.1
0.5 2119 1.8
1 2918 3.0
As both Table 3 and Figure 8 show, the mass and volume of the 3MW case is a significant increase for any time due to the significant growth in the gas turbine size. This case shows that the system has the potential to get large and heavy if it were to burn all of the LNG for power. Therefore, it would be best to size the gas turbine to 300kW, which will power the HEPS and allow the extra LNG to either be vented or to be burned in the primary engine. But will this hold true for other forms of powerplant? Another case was suggested where a 300kW solid oxide fuel cell gas turbine hybrid (SOFC-GT) were used as the powerplant. Otherwise the architecture will be identical to that in Figure 6. This system combines a SOFC and gas turbine. The SOFC-GT can simply be described as a gas turbine engine where the combustor is either mostly or entirely replaced with a SOFC to combust the fuel. The exhaust from the SOFC or SOFC and combustor are then expanded in a turbine which drives both the inlet compressor and a generator. Figure 9 shows an example diagram of the SOFC-GT.
Figure 9: SOFC-GT Schematic35
Generally, if properly implemented and designed the SOFC-GT is thought to be a more efficient system
than the gas turbine alone35. As Figure 9 shows, this system generates electricity at both the SOFC and at
the turbine generator. The mass and volume of the SOFC/GT is estimated using a power density of 2.273
kg/kW and 0.00435 m3/kW.35 Unlike the gas turbines estimated for the first 2 cases, the SOFC-GT has an
inlet pressure requirement of 3.5 times the ambient atmospheric pressure. This means that the required
amount of LNG will vary based on the altitude due to the pressure change affecting the Hvap of the LNG.
As the altitude increases and the atmospheric pressure decreases, then the LNG becomes a more
effective coolant potentially reducing the quantity that will have to be carried by the aircraft. Figure 10

19
shows the mass and volume of the LNG SOFC-GT system for sea level operation at different lengths of
operating time.
Figure 10: Mass and volume of the HEPS thermal and power management system. (SOFC/GT case)
Figure 10 shows the mass and volume change for differing operating times at sea level. As mentioned
before the mass and volume will decrease as the altitude increases. Table 4 shows the mass and volume
of the system at different operating times and different altitudes of operation.
Table 4: Mass and volume of HEPS thermal and power management system, SOFC-GT case
Sea Level 30,000 ft 60,000 ft
Time (Hr)
Mass (kg)
Volume (m3)
Mass (kg)
Volume (m3)
Mass (kg)
Volume (m3)
0.25 1865.5 1.92 1838.4 1.88 1828.7 1.86
0.5 2248.8 2.54 2194.6 2.45 2175.3 2.42
1 3015.5 3.78 2907.0 3.61 2868.4 3.55
0
500
1000
1500
2000
2500
3000
3500
4000
4500
0 0.5 1 1.5 2
Mas
s (k
g)
Operating Time (hrs)
LNG (Initial)
LNG Tank
DEW
SOFC
0
0.5
1
1.5
2
2.5
3
3.5
4
4.5
5
0 0.5 1 1.5 2
Vo
lum
e (
m3)
Operating Time (hrs)
LNG Tank
DEW
SOFC
HEPS
HEPS

20
As the table shows, the mass and volume of this SOFC-GT case are higher than the equivalently sized gas
turbine. It seems that the efficiency gains by using the SOFC-GT are offset by an increase in the
hardware mass and volume which is far greater than the mass and volume saved by an efficiency
increase. As a result, the logical conclusion to be made is that a gas turbine would be a more effective
powerplant for this LNG HEPS system.
The fact that the LNG became a more effective coolant while at lower pressures led to a fourth case
study. This case study would assume that the aircraft could supply the required electrical power to the
laser when it is needed. This would eliminate the mass and volume of the powerplant as well as the inlet
pressure requirements of the powerplant. The proposed architecture for the fourth case can be seen in
Figure 11.
This case was called the integrated case since it is more closely integrated into the rest of the aircraft
systems. With the inlet pressure requirement removed, the tank may be held at a pressure only 3kPa
above ambient atmospheric pressure. Furthermore, since the HEPS system no longer has a powerplant
to burn the LNG, it will be able to serve the rest of the aircraft in two different ways. First, it will provide
a secondary fuel source for the primary engine. The LNG can be burned and supplement some of the JP8
which the engine typically burns, thus reducing the amount of JP8 that will be burned for a given
mission. Furthermore, the LNG can provide additional cooling to the aircraft systems. After leaving the
HEPS, the LNG is still at the same temperature as it was when it boiled.
Figure 11: Schematic of the proposed integrated HEPS system

21
Table 5: Thermal sink capability comparison of LNG to JP8 in integrated system
Cp(kJ/kg K) THot (K) TCold (K) Heat Sink (kJ/kg)
LNG 2.25 873 112 1715.1
JP8 2.01 395 298 194.97
Table 5 shows the increased heat sink capability of LNG when compared to JP8, which is currently used
as one method of removing heat from the aircraft. The JP8 is heated and then burned which transfers
the heat energy off board. Since the LNG has a higher specific heat and a larger temperature range at
which it can be safely heated, its heat sink capability is nearly an order of magnitude larger. That means
that the used LNG can be an effective coolant to assist the current aircraft TMS to thermally manage the
systems. It will provide assistance to the existing VCS and/or IPP to cool items such as the PAO loop or
FTMS before it is burned in the primary engine, which provides the electrical power to the laser.
Figure 12: Mass and volume of the HEPS thermal and power management system. (Integrated case)
0
500
1000
1500
2000
2500
3000
3500
4000
0 0.5 1 1.5 2
Mas
s (k
g)
Operating Time (hrs)
LNG (Initial)
LNG Tank
DEW
0
0.5
1
1.5
2
2.5
3
3.5
0 0.5 1 1.5 2
Vo
lum
e (
m3 )
Operating Time (hrs)
LNG Tank
DEW
HEPS
HEPS

22
The graphs in Figure 12 show that the integrated system has the same linear mass and volume trend in
relation to time as the other case studies. As with the SOFC-GT case, this case will have different results
at different altitudes, this is due to the Hvap changing and thus the required flow rate will change. This is
reflected in Table 6.
Table 6: LNG flow comparison for changing altitude
Hvap (kJ/kg) Mass Flow Rate (kg/s) Volumetric Flow Rate (gal/min)
0 ft (Sea Level) 510 0.196 6.8
30,000 ft 524 0.191 6.6
60,000 ft 528 0.189 6.6
With the decreasing mass flow rate required to cool the laser for any given time. Table 7 shows the
effect this has on the mass and volume of the entire system at different altitudes.
Table 7: Mass and volume of HEPS thermal and power management system, Integrated case
Sea Level 30,000 ft 60,000 ft
Time (Hr) Mass (kg) Volume (m3) Mass (kg) Volume (m3) Mass (kg) Volume (m3)
0.25 1157.2 0.57 1147.9 0.56 1145.1 0.55
0.5 1514.1 1.15 1495.4 1.12 1489.9 1.11
1 2227.9 2.31 2190.6 2.25 2179.4 2.23
As with the SOFC-GT case, the system had less mass and volume when it was operated at higher
altitudes. Furthermore, it can be seen that the mass and volume for this case, the integrated case is the
smallest of any of the cases. This is due to the system not having the mass and volume of a powerplant
and it being able to accomplish the same mission with less LNG due to an increase in the Hvap. The
various cases are compared on their mass and volume in Table 8.
Table 8: Case comparison for one hour of lasing
Case Mass (kg) Volume (m3)
300kW Gas Turbine (baseline) 2450 2.63
3MW Gas Turbine 2918 (+19.1%) 3.0 (+14.1%)
SOFC/GT (at sea level) 3015.5 (+23.1%) 3.79 (+44.1%)
Integrated System (at sea level) 2227.9 (-9.1%) 2.31 (-12.2%)
As Table 8 shows, the integrated case had the lowest mass and volume when at sea level and at altitude
the mass and volume will only decrease further. Of the palletized systems, the 300kW gas turbine
performed the best, which indicates that with the current data, this would be the optimal design for a
standalone system; however, as newer and better data becomes available the SOFC-GT case could look
more appealing if the power density of those units could be improved.

23
These preliminary studies do not show the complete picture of the system. As mentioned before, the
volume of the HEPS has not been included in any estimate and the other components are just that,
estimates. Furthermore, this study did not take any transients of cooling the laser or the HEPS cold plate
effectiveness into account. What this study did accomplish was show that the thermals of a laser could
be managed with a system of reasonable size for a variety of architectures using LNG as the cooling
fluid. With this now known, it was decided to further investigate such a system and its effect on an
aircraft. Each of the components in the LNG system would be modeled in MatLab/Simulink with the
ultimate goal of integrating the LNG system into a T2T model to analyze its effect on the rest of the
aircraft.
MatLab/Simulink Model Components Developed:
The MatLab/Simulink model of this system was designed using the principles of lumped parameter
subsystems. The goal of this modeling approach was to design self-contained blocks that represent real
world self-contained systems. This will allow the system to be more readily modified and improved if
newer models of any of the major components are developed or found. For example, the LNG HEPS
system will be contained within a single subsystem. But inside that subsystem will be the cryogenic tank,
HEPS and other critical components. That way, the whole HEPS system could be changed out or just
certain parts like on a real system. Ultimately, like the T2T model, this HEPS system will be upgradable
and easily integrated with other systems to explore system configuration options. Satisfactory
documentation is also a major requirement so that future users can be readily familiar with the models,
their equations, assumptions, and coding. Ultimately, the models constructed are based on
assumptions. These are educated guesses based on engineering experience and the laws of
thermodynamics, but at the end of the day they are just assumptions. As a result, fully understanding
what information, equations and assumptions were used in the model is critical to its proper usage as a
modeling, simulation and optimization tool. Otherwise a model could be used in an incorrect situation
where it is not valid, or misused another way leading to incorrect results in a much larger system. Each
major component developed for this project will be described in detail.
Cryogenic Storage Tank:
The cryogenic storage tank was designed as a vessel to hold the LNG at the beginning of the mission and
to manage the LNG throughout the mission. The models primary function will be to continuously track
the amount of LNG within its walls and the various physical properties of the LNG. Tracking the
properties such as quality and specific enthalpy are critical because the liquid LNG is likely near or within
the vapor dome. As a result, to track the thermal properties such as quality, the enthalpy will have to be
known as the temperature will not change as the fluid boils and thus cannot be used to track its
properties during the phase change.
Furthermore, in order to ultimately reduce mass and volume of the proposed system, the decision was
made to delete the pump from the system and instead to pressurize the tank in order to force the LNG
to flow to the other components. The goal behind this plan was to use LNG’s tendency to vaporize while

24
near the boiling temperature to pressurize the tank. The tank model will have to include a method of
adding energy to the tank in order to stimulate the boiling of LNG to pressurize the vessel.
The tank model must also account for heat being conducted into the tank from the outside. A concern
with the cryogenic tank is how well insulated will it be and what increase in mass and volume will that
insulation cause. The model was designed to use the thickness, surface area and conductivity of both
the insulation and tank skin to calculate the heat conducted into the tank from the outside. This is
accomplished by equation 3.
�̇�𝑐𝑜𝑛𝑑𝑢𝑐𝑡𝑖𝑜𝑛𝐼𝑁 = (𝑘𝑖𝑛𝑠𝑢𝑙𝑎𝑡𝑖𝑜𝑛
𝐿𝑖𝑛𝑠𝑢𝑙𝑎𝑡𝑖𝑜𝑛) (𝑇𝑜𝑢𝑠𝑖𝑑𝑒 − 𝑇𝑖𝑛𝑠𝑖𝑑𝑒)(𝑆𝐴𝑡𝑎𝑛𝑘) 3
Additionally, in order to find the surface area of the tank, a sizing routine is required. The mass of the
tank will be calculated to include the mass contributed by the skin and the insulation. This is reflected in
equation 4.
𝑚𝑡𝑎𝑛𝑘 = (𝜌𝑖𝑛𝑠𝑢𝑙𝑎𝑡𝑖𝑜𝑛)(𝑆𝐴𝑖𝑛𝑠𝑢𝑙𝑎𝑡𝑖𝑜𝑛)(𝐿𝑖𝑛𝑠𝑢𝑙𝑎𝑡𝑖𝑜𝑛) + (𝜌𝑠𝑘𝑖𝑛)(𝑆𝐴𝑠𝑘𝑖𝑛)(𝐿𝑠𝑘𝑖𝑛) 4
The total volume of the tank must also be calculated. This is done by calculating how much volume the
fluid will occupy and then multiplying that value by a correction factor. This correction factor represents
the small amount of empty space that must be left in the tank so that the cryogenic fluid has room to
vaporize and pressurize the tank. The equation that represents this can be seen in equation 5.
(𝑉𝑖𝑛𝑖𝑡𝑖𝑎𝑙)(𝑉𝑓𝑎𝑐𝑡𝑜𝑟) + 𝑉𝑖𝑛𝑖𝑡𝑖𝑎𝑙 = 𝑉𝑖𝑛𝑠𝑖𝑑𝑒 5
This model sizing routine has two modes, one for spherical tank and the other for a cylindrical tank. The
equations to describe the spherical tank are shown in equations 6, 7, 8, and 10. These equations will
calculate the diameter, volume, and surface area of a spherical tank that will hold the specified amount
of cryogen while accounting for the volume correction factor and the volume taken up by the skin and
insulation.
𝐷𝑖𝑛𝑠𝑖𝑑𝑒 = [6𝜋(𝑉𝑖𝑛𝑠𝑖𝑑𝑒)]13 6
𝐷𝑡𝑎𝑛𝑘 = 𝐷𝑖𝑛𝑠𝑖𝑑𝑒 + 2𝐿𝑠𝑘𝑖𝑛 + 2𝐿𝑖𝑛𝑠𝑢𝑙𝑎𝑡𝑖𝑜𝑛 7
𝑉𝑡𝑎𝑛𝑘 = (4
3) 𝜋 (
𝐷𝑡𝑎𝑛𝑘3
8) 8
𝐿𝑡𝑎𝑛𝑘 = 𝐿𝑖𝑛𝑠𝑖𝑑𝑒 + 2𝐿𝑠𝑘𝑖𝑛 + 2𝐿𝑖𝑛𝑠𝑢𝑙𝑎𝑡𝑖𝑜𝑛 9
𝑆𝐴𝑡𝑎𝑛𝑘 = 𝜋𝐷𝑡𝑎𝑛𝑘𝐿𝑡𝑎𝑛𝑘 +1
2𝜋𝐷𝑡𝑎𝑛𝑘
2 10
The spherical sizing equations require the initial amount of LNG to be specified and the volume of the
interior of the tank is calculated using equation 5 which allows for a certain amount of empty space for
the LNG to vaporize. Using this interior volume, the inside diameter is calculated in equation 6, which

25
allows for the exterior diameter to be calculated in equation 7. Then the exterior volume and surface
area can easily be calculated in equations 8 and 10 respectively.
The other sizing mode is for a cylindrical tank. As with the spherical tank, this mode requires a defined
amount of initial LNG, but it also needs the interior diameter in order to prevent an iterative loop. The
following series of equations are used to define the key sizing parameters of the tank.
𝐿𝑖𝑛𝑠𝑖𝑑𝑒 =4 𝑉𝑖𝑛𝑠𝑖𝑑𝑒
𝜋 𝐷𝑖𝑛𝑠𝑖𝑑𝑒2 11
𝐷𝑡𝑎𝑛𝑘 = 𝐷𝑖𝑛𝑠𝑖𝑑𝑒 + 2𝐿𝑠𝑘𝑖𝑛 + 2𝐿𝑖𝑛𝑠𝑢𝑙𝑎𝑡𝑖𝑜𝑛 12
𝑉𝑡𝑎𝑛𝑘 =𝜋
4(𝐿𝑡𝑎𝑛𝑘)(𝐷𝑡𝑎𝑛𝑘
2 ) 13
𝑆𝐴𝑡𝑎𝑛𝑘 = 𝜋𝐷𝑡𝑎𝑛𝑘2 14
With the user defined quantities of initial volume of LNG as defined by equation 5 and the inside
diameter of the tank, the length of the inside of the tank can be found using equation 11. The exterior
length and diameter is calculated using equations 9 and 12 respectively. The total exterior volume,
including the thicknesses of the insulation and skin is calculated using equation 13. Finally, the exterior
surface area is found using equation 14.
Besides the sizing routine, the tank model also has to account for conservation of energy. This is
accomplished by accounting for all of the energy entering or leaving the system by heat or mass transfer
as shown by equation 15.
�̇�𝑖𝑛 − �̇�𝑜𝑢𝑡 =𝑑ℎ
𝑑𝑡 15
This general equation shows the relationship between the key parameter of enthalpy to the heat and
mass transfer. One of the methods of heat transfer into the tank is by conduction through the skin and
insulation. Equation 3 shows the equation for conduction using the conduction and thickness for the
insulation. It was assumed in this case that the skin is a perfect conductor of heat into the tank;
therefore the skin conduction is not included into the equation. As a result, this equation will
overestimate the heat conducted into the tank. This makes it a conservative estimate when working on
managing the temperatures in the tank since a system designed to cope with more heat transfer can
usually cope with less. Using the heat transfer by conduction, the rest of the conservation of energy can
be seen in equation 16.
𝑑ℎ
𝑑𝑡= �̇�𝑐𝑜𝑛𝑑𝑢𝑐𝑡𝑖𝑜𝑛𝐼𝑁 + �̇�𝑐𝑜𝑛𝑡𝑟𝑜𝑙𝐼𝑁 − (�̇�𝑣𝑎𝑝𝑜𝑟)(ℎ𝑠𝑎𝑡𝑣𝑎𝑝) − (�̇�𝑙𝑖𝑞)(ℎ𝑠𝑎𝑡𝑙𝑖𝑞) 16
This equation accounts for the heat transfer by conduction and by the heater used to control the
pressure within the tank. Also, the energy leaving the system by mass transfer is accounted for in the

26
final two terms in the integral. These two terms represent the mass leaving as a vapor to prevent over
pressurization and as a liquid to cool other components in the larger system.
Additionally, the conservation of mass must also be satisfied. Since this tank has the ability to track and
manage the LNG as a liquid and a vapor, the fluid properties must be used in the calculation; specifically,
the quality in this case. The general conservation of mass equation used is listed in equation 17.
𝑑𝑚
𝑑𝑡= �̇�𝑖𝑛 − �̇�𝑜𝑢𝑡 17
There is no mass flow into the tank, so that term can be ignored. To track the amount of liquid in the
tank, it must be calculated using the quality as shown in equation 18.
𝑚𝑙𝑖𝑞 = (1 − 𝑥)𝑚𝑇𝑜𝑡𝑎𝑙 18
Using the known mass of liquid and the related mass of vapor, the pressure will ultimately be found.
This is accomplished by equations 19 and 20.
𝑉𝑣𝑎𝑝𝑜𝑟 = 𝑉𝑖𝑛𝑠𝑖𝑑𝑒 −𝑚𝑙𝑖𝑞
𝜌𝑠𝑎𝑡𝑙𝑖𝑞𝑢𝑖𝑑
19
𝜌𝑣𝑎𝑝𝑜𝑟
=𝑚𝑣𝑎𝑝𝑜𝑟
𝑉𝑣𝑎𝑝𝑜𝑟
20
The volume that the vapor can fill is simply found by subtracting the volume that the liquid inhabits from
the total interior volume of the tank. The volume that the liquid fills is found with the liquid mass and
the density of the saturated liquid. Once the volume of the vapor and its mass are found, its density is
then found. The assumption is made that the vapor is in a saturated state. The density of the vapor is
then used as the input for a property relation that will give the pressure of the vapor. This pressure
represents the pressure inside the entire tank since the liquid portion of the LNG is assumed to be
incompressible.
Also, the physical properties of the LNG were found using a lookup table which required specific
enthalpy and pressure as inputs. This is why the enthalpy was found in the conservation of energy.
Along with the pressure, this is used to find the overall density of the LNG, its temperature, and quality.
The tank maintains excessive pressure by manipulating a control valve to vent or release vapor in order
to prevent over pressurization. There are other control inputs that give demands to the tank model, but
this is the only one contained solely within the tank. The heater control is outside the tank model and
only provides the heat amount. This was done so that eventually, if another heat source was found to
pressurize the tank, it could more easily be integrated into the tank model.
In addition to the myriad of parameters that are set by thermal fluid properties of LNG, there are many
user defined parameters that are tunable to improve the performance of the model. For the tank, many

27
of these factors involve the sizing routine. The user can decide upon the material properties and
thicknesses of the skin and insulation. These properties affect both the overall mass and volume of the
tank, but also its heat conduction. Another factor that affects the heat conduction is the exterior
temperature of the tank. Without a complete model or understanding of what the exterior of the tank
will be exposed to, the best estimation is a user defined constant exterior tank temperature. Obviously,
the higher the exterior temperature, the more heat will ultimately get conducted into the tank over the
course of the mission. The last major user defined input is the pressure release buffer. In early
development, the heater control and the vapor vent control was set to operate at the exact same
pressure. This was found to be inadvisable and caused excessive LNG venting by the vent controller. The
user can define the pressure difference between where the heater set point is and where the tank
vents. Current tests show that a 1kPa buffer is sufficient to prevent almost all venting due to the heater
and venting control systems interfering with one another. However, if the pressure set point is
significantly altered, then the buffer might have to be altered in order to ensure there is no over
pressurization and efficient LNG usage. Finally, the user can define the empty volume at the beginning of
the mission. When the mission begins, there must be a certain empty volume in the tank to allow the
LNG space to boil and pressurize the tank. Otherwise, the incompressible LNG can never boil. The size of
this volume affects how long it takes the tank to pressurize, with a larger volume increasing the
pressurization time. Also, a larger empty space obviously makes the tank generally larger and heavier. As
a result, the goal is to minimize the size of the empty space.
Like all models, this subsystem makes a few assumptions in order to function. One of the primary
assumptions made was that the LNG exits either as a saturated liquid or a saturated vapor depending on
whether it is drained out or vented respectively. This assumption means that the flows of liquid to the
HEPS will not be two phase flow, which would limit the flow’s cooling effectiveness in the HEPS block.
Unfortunately, this assumption makes it apparent that this model cannot easily include sloshing factors
from aircraft maneuvers or use while in an inverted orientation. Also, an effect of this assumption and
simplification is that there will be no stratification of either liquid or vapor LNG within the tank. There is
a defined volume for liquid, but there will be no temperature gradients or stratification within that liquid
section. The same assumption can be seen in the vapor section. In order to accomplish this, a complex
CFD analysis would have to be done of the fluid and the movements of the tank to analyze the mixing,
sloshing and general movement of both the liquid and vapor.
Finally, this model has the potential and capability to be continually improved for different uses and
cases or for changes targeted at improving the fidelity of the model. A simple change that might be
useful for another case study is allowing LNG to flow into the tank. What if LNG was reclaimed and
recondensed in order to replenish the LNG supply onboard the aircraft? In order to account for this
interesting idea, an inflow of LNG would simply have to be added to the conservation of mass and the
conservation of energy equations, a simple change. There are also some areas that might be changed in
an attempt to increase fidelity. One of these is to change the tank exterior temperature to some sort of
function based on mission data or a better estimate based on the rest of the model and a potential
aircraft layout design. Another change that would affect the conservation of energy would be the
addition of more ways for heat to enter the tank. This would mean adding convection terms and

28
radiation equations. More tank configurations could also be added to give the users more ability to
specialize the model to their specific application. These configurations could be other simple shapes
(cube, rectangular prism, or cylinder with domed ends) or a complicated shape that would better
approximate the actual tank that will be used in an aircraft.
Cryogenic HEPS:
The cryogenic HEPS model was designed specifically to model the thermal management of a solid state
laser using the phase change of a cryogenic liquid. This model was intended to be used in conjunction
with the aforementioned cryogenic tank model and as a result the input ports and data streams were
designed to work with the outputs from the tank. In order to model the phase change of the LNG and its
effect on the laser temperature, this model must have several key features. First, the model must be
able to track the LNG properties accurately, like the tank model could. Also, using principles grounded in
thermodynamics, the temperature of the laser crystals must be estimated using the temperature of the
cryogenic fluid as it is used to cool the HEPS. The crystal temp must be actively controlled by the
subsystem to prevent the laser crystals from changing in temperature by more than 6K during
operation. This should be accomplished by changing the mass flow rate of the LNG. Furthermore, the
HEPS subsystem should be able to deal with the LNG vapor and any LNG that condenses back into liquid.
The vapor and liquid amounts and flow rate should be controlled.
Using the laser efficiency from Figure 2, the heat generated by the laser during operation can be
calculated. It is assumed that all of the input electrical energy to the laser which does not become light is
heat.
�̇�𝐿𝑎𝑠𝑒𝑟 𝑡ℎ𝑒𝑟𝑚𝑎𝑙 = (𝑃𝑜𝑤𝑒𝑟𝑜𝑝𝑡𝑖𝑐𝑎𝑙)(𝜂𝑙𝑎𝑠𝑒𝑟) − 𝑃𝑜𝑤𝑒𝑟𝑜𝑝𝑡𝑖𝑐𝑎𝑙 21
Where (𝑃𝑜𝑤𝑒𝑟𝑜𝑝𝑡𝑖𝑐𝑎𝑙)(𝜂𝑙𝑎𝑠𝑒𝑟) is the electrical power required by the laser. The �̇�𝑡ℎ𝑒𝑟𝑚𝑎𝑙 is the thermal
energy that the laser generates and as a result will have to be dissipated by the LNG in order to maintain
the laser within its allowed operating temperature range. A part of this calculation is the conservation of
energy which is represented in general form in equation 22.
�̇�𝑖𝑛 − �̇�𝑜𝑢𝑡 =𝑑ℎ
𝑑𝑡 22
The energy flowing into the subsystem is due to the mass flow from the tank to the HEPS of liquid LNG
and the heat from the laser. The energy leaves the subsystem by mass transfer of liquid and vaporized
LNG. The specific conservation of energy equation can be seen in equation 23.
𝑑ℎ
𝑑𝑡= (�̇�𝑙𝑖𝑞𝑢𝑖𝑑𝐼𝑁 ∗ ℎ𝑠𝑎𝑡𝑙𝑖𝑞𝑡𝑎𝑛𝑘) + �̇�𝐿𝑎𝑠𝑒𝑟 𝑡ℎ𝑒𝑟𝑚𝑎𝑙 − (�̇�𝑣𝑎𝑝𝑜𝑟𝑂𝑈𝑇 ∗ ℎ𝑠𝑎𝑡𝑣𝑎𝑝𝐻𝐸𝑃𝑆)
− (�̇�𝑙𝑖𝑞𝑢𝑖𝑑𝑂𝑈𝑇 ∗ ℎ𝑠𝑎𝑡𝑙𝑖𝑞𝐻𝐸𝑃𝑆) 23

29
In this conservation equation, the heat flows into and out of the subsystem can be seen and how they
are used to calculate the specific enthalpy of the fluid in the HEPS. Along with the conservation of
energy, the conservation of mass must also be satisfied. Equation 24 shows this conservation.
𝑑𝑚
𝑑𝑡= �̇�𝑙𝑖𝑞𝑢𝑖𝑑𝐼𝑁 − �̇�𝑙𝑖𝑞𝑢𝑖𝑑𝑂𝑈𝑇 − �̇�𝑣𝑎𝑝𝑜𝑟𝑂𝑈𝑇 24
The mass flow in as liquid is balanced against the mass flow out as vapor and liquid. This is used to find
the mass accumulated within the HEPS volume at any one time. With the accumulated mass known and
the quality calculated later, the volume of liquid inside of the HEPS can be calculated. This liquid is LNG
that has condensed after first being boiled against the cold plate.
𝑉𝑙𝑖𝑞 =𝑚𝑓𝑙𝑢𝑖𝑑 − (𝑚𝑓𝑙𝑢𝑖𝑑 ∗ 𝑥)
𝜌𝑠𝑎𝑡𝑙𝑖𝑞𝑢𝑖𝑑 25
Where 𝑚𝑓𝑙𝑢𝑖𝑑 is the total mass of fluid (liquid and vapor) as calculated by Equation 24. The volume of
liquid is a key parameter for managing the HEPS subsystem. It is vital for the code to allow LNG to
condense after it has been vaporized by the cold plate, otherwise the fidelity of the model would be
called into question. Unfortunately, if too much LNG liquid is allowed to accumulate, it will fill the
volume that is used to contain the LNG vapor until it reaches a certain pressure and is released to the
next subsystem. If the volume is totally filled with incompressible liquid, then the model cannot function
properly and an error is caused. A control system was designed to drain the liquid LNG from the HEPS
subsystem after it has reached a max level within the HEPS, usually around 10% full. It drains the LNG
and maintains it at the maximum level.
Using the volume of liquid and comparing that to the total volume which the LNG can fill within the
HEPS, the density of the vapor in the HEPS can be found as shown in equation 26.
𝜌𝑣𝑎𝑝𝑜𝑟 =𝑚𝑣𝑎𝑝𝑜𝑟
𝑉𝑇𝑜𝑡𝑎𝑙 − 𝑉𝑙𝑖𝑞 26
Then the LNG pressure in the HEPS can be calculated through a relation comparing the density of a
saturated vapor to its pressure. Using the pressure inside the HEPS and the specific enthalpy of the fluid
in the HEPS, all of the other two phase properties of the fluid can be found using the same look up
tables from the cryogenic tank model. The quality, which is used in equation 25, is one of the
parameters found in the tables. Another one of the properties found is the temperature of the LNG.
From the flow temperature, the temperature of the cold plate can be found using equation 27.
𝑑𝑇𝑝𝑙𝑎𝑡𝑒
𝑑𝑡=
𝑈(𝑇𝑓𝑙𝑢𝑖𝑑 − 𝑇𝑝𝑙𝑎𝑡𝑒)
𝐴𝑝𝑙𝑎𝑡𝑒 ∗ 𝐿𝑝𝑙𝑎𝑡𝑒 ∗ 𝜌𝑝𝑙𝑎𝑡𝑒 ∗ 𝐶𝑝𝑝𝑙𝑎𝑡𝑒 27

30
Where 𝑈 36is the heat transfer coefficient for the two-phase impingement flow against the cold plate.
The plate temperature is the factor that is used by the flowrate control. A PI controller compares the
current plate temperature to the desired plate temperature and changes the flowrate of LNG in order to
manage the temperature.
Also, another control system was designed to release the vapor from the HEPS subsystem to the next
one. For this, a PI controlled ideal gas valve was used. The PI controller operated based on the pressure
inside the HEPS volume. The vaporizing LNG expands and exerts pressure on the volume. Once it
reaches the desired pressure, the valve opens and maintains the pressure at that desired pressure. The
desired pressure is the saturation pressure of LNG at the desired operating temperature of the laser
crystals. If the pressure is different from the saturation pressure, more LNG is required to cool the same
laser heat load. Having the desired HEPS pressure be the saturation pressure allows for the most
efficient operation.
There are several factors which were programed to be tunable so that the user can optimize the system
or increase its realism when future data becomes available. One of the more critical factors that this
applies to is the heat transfer coefficient that can be achieved using the 2 phase impingement flow. This
heat transfer coefficient is critical for calculating the temperature of the cold plate and thus the laser
crystals. That means that it is also a direct factor on the controller that manages the plate temperature
and will affect the LNG flow rate as well. In that same area, the cold plate itself has controllable factors
which could yield a similar affect. The user can change the cold plate area, its thickness and material
properties. Changing these could also cause the LNG flow rate and plate temperature controls to
change, thus affecting the performance of the entire LNG system. Additionally, the volume which LNG is
allowed to expand in the HEPS subsystem to pressurize the system can be changed. This value affects
how fast the chamber fills with LNG vapor and thus how fast the HEPS subsystem is pressurized.
Generally speaking the smaller the volume, the less LNG is used during any given mission because there
will be less accumulation of LNG in the HEPS at the end of the mission. Another factor is the HEPS
temperature setpoint. While this factor is not directly contained in the HEPS block but is in the control
system block, it does have a significant effect on the HEPS block. This temperature setpoint determines
the temperature of the cold plate. By setting this temperature for the LNG to boil at, the pressure set
point is also determined for the HEPS block. This pressure is the saturation pressure of LNG at the
determined set point temperature. Finally, the last of the main tunable factors is the amount of liquid
LNG that is allowed to accumulate in the HEPS subsystem. If this value is the same as the total HEPS
volume, then it will allow the HEPS subsystem to fill with liquid LNG and prevent any LNG from
vaporizing and pressurizing the vessel. These factors, along with several more minor ones, allow the user
to customize the model and simulation to whatever case they require.
As with any model, there are some assumptions made. Understanding and stating these assumptions
will allow future users the ability to use this model in correct situations and show why the model may
vary from any experimental data. One assumption is in how the laser crystals are cooled. These are
mounted to a large cold plate which will be maintained at a certain defined temperature, thus
maintaining the crystals at that same temperature. This is only possible if the plate is assumed to be
cooled as a lumped capacitance. This means that the program calculates an average temperature of the

31
plate based on its size and mass and this is assumed to be the temperature of the entire plate. Another
major assumption is that the LNG in the HEPS subsystem will be at saturation at all times. This is a good
assumption because there is always going to be some liquid and some vaporized LNG in the HEPS, as a
result it is a two phase system which has a temperature and pressure at saturation. This assumption
affects the exiting vapor and liquid. The exit signals also carry the exiting enthalpy, which is in this case
either the saturated liquid or saturated vapor. Additionally, the assumption was made that any of the
electrical energy going to the laser that is not converted to optical power is heat. This efficiency is
defined by Figure 2. Finally, the HEPS subsystem is assumed to be well insulated and as a result, no
energy is transferred in or out along its skin. This assumption was made due to the conduction of energy
through the skin was likely to be negligible when compared to the heat generated by the laser.
Finally, based on the potential for this model to be used in other design cases, some suggestions for
areas to improve will be discussed. Currently, for the cases that are being explored in this thesis, the
model is sufficient. One area that the model could be changed is a more realistic temperature gradient
across the cold plate instead of using lumped capacitance. This would yield a more accurate picture of
the actual temperature at the cost of computational time. Also, if a more complete physical design of
the HEPS could be made, then the size could be estimated. With a proper estimate, the surface area and
heat conduction through that area could be found and included into the model. This would be a simple
matter of adding a line to the conservation of energy equation. These changes and others could improve
the models fidelity when more information becomes available about the physical design of the system
that the model represents.
Mixing Chamber:
The purpose of the mixing chamber was to consolidate the three separate flows coming from the tank
and HEPS subsystems. They were a flow of vented vapor LNG from the tank to prevent tank over
pressurization, a flow of liquid LNG drained from the HEPS and the main flow of vaporized LNG from the
HEPS. These three flows would be directed into a single mixing chamber and be combined into a single
flow which could be used later to cool other systems. The model was designed to have input ports that
work with the other two cryogenic models described here, the tank and HEPS subsystems. As with the
other cryogenic blocks, the mixing chamber was designed around to concept of tracking the two phase
properties of the LNG. The model could track whether the LNG inside it was a liquid or a vapor or in
between. Additionally, besides tracking the quality, other properties such as temperature and pressure
must be tracked for the fluid. These two properties are critical information for use in later blocks such as
heat exchangers which will be used to further increase the usefulness of the LNG. Finally, this model
must be robust enough to operate under a variety of conditions since there will be no control as to the
input flows for this block. The flow rates for each of the streams are controlled by different blocks for
parameters outside the mixing chamber. In fact the only control system that the mixing chamber needs
is to release the resultant mixture at a certain pressure, like the vent valve on the tank or HEPS work.
The LNG will be vented from the mixing chamber in a single stream to the next subsystem that will use
it.
As mentioned, the purpose of this block is the combination of three flows of LNG into a single flow. One
of the key parts in doing this is the conservation of mass.
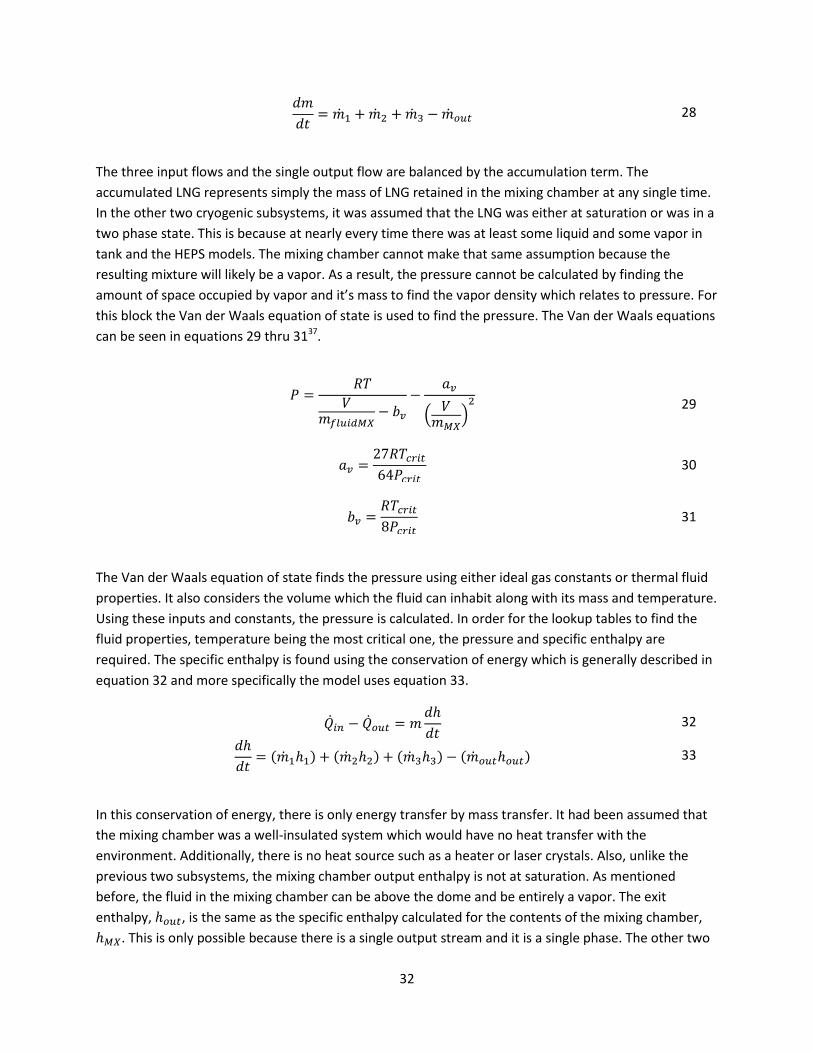
32
𝑑𝑚
𝑑𝑡= �̇�1 + �̇�2 + �̇�3 − �̇�𝑜𝑢𝑡 28
The three input flows and the single output flow are balanced by the accumulation term. The
accumulated LNG represents simply the mass of LNG retained in the mixing chamber at any single time.
In the other two cryogenic subsystems, it was assumed that the LNG was either at saturation or was in a
two phase state. This is because at nearly every time there was at least some liquid and some vapor in
tank and the HEPS models. The mixing chamber cannot make that same assumption because the
resulting mixture will likely be a vapor. As a result, the pressure cannot be calculated by finding the
amount of space occupied by vapor and it’s mass to find the vapor density which relates to pressure. For
this block the Van der Waals equation of state is used to find the pressure. The Van der Waals equations
can be seen in equations 29 thru 3137.
𝑃 =𝑅𝑇
𝑉𝑚𝑓𝑙𝑢𝑖𝑑𝑀𝑋
− 𝑏𝑣
−𝑎𝑣
(𝑉
𝑚𝑀𝑋)
2 29
𝑎𝑣 =27𝑅𝑇𝑐𝑟𝑖𝑡
64𝑃𝑐𝑟𝑖𝑡 30
𝑏𝑣 =𝑅𝑇𝑐𝑟𝑖𝑡
8𝑃𝑐𝑟𝑖𝑡 31
The Van der Waals equation of state finds the pressure using either ideal gas constants or thermal fluid
properties. It also considers the volume which the fluid can inhabit along with its mass and temperature.
Using these inputs and constants, the pressure is calculated. In order for the lookup tables to find the
fluid properties, temperature being the most critical one, the pressure and specific enthalpy are
required. The specific enthalpy is found using the conservation of energy which is generally described in
equation 32 and more specifically the model uses equation 33.
�̇�𝑖𝑛 − �̇�𝑜𝑢𝑡 = 𝑚𝑑ℎ
𝑑𝑡 32
𝑑ℎ
𝑑𝑡= (�̇�1ℎ1) + (�̇�2ℎ2) + (�̇�3ℎ3) − (�̇�𝑜𝑢𝑡ℎ𝑜𝑢𝑡) 33
In this conservation of energy, there is only energy transfer by mass transfer. It had been assumed that
the mixing chamber was a well-insulated system which would have no heat transfer with the
environment. Additionally, there is no heat source such as a heater or laser crystals. Also, unlike the
previous two subsystems, the mixing chamber output enthalpy is not at saturation. As mentioned
before, the fluid in the mixing chamber can be above the dome and be entirely a vapor. The exit
enthalpy, ℎ𝑜𝑢𝑡, is the same as the specific enthalpy calculated for the contents of the mixing chamber,
ℎ𝑀𝑋. This is only possible because there is a single output stream and it is a single phase. The other two

33
subsystems had to have different enthalpies for each outlet stream depending on whether the flow was
a liquid or vapor.
When compared to the cryogenic HEPS and tank blocks, the control system for the mixing chamber is
rather simple. There is a single PI controlled ideal gas valve which is used to regulate the pressure inside
the mixing chamber by venting vapor. This is exactly the same mechanism that prevents over
pressurization in the cryogenic tank and vents the vapor out of the HEPS. The pressure is maintained at a
user determined set point which could represent the inlet pressure requirements for some component
further downstream.
The mixing chamber is the least complicated subsystem of the three in terms of the number of tunable
factors. Most of the constants used in the calculations are material depended such as the critical
pressure and temperature used in Van der Waals equation of state. Other than those, there are only a
few user defined constants that are alterable. One of these is the volume in which the LNG is allowed to
expand within the mixing chamber. This value directly defines the size of the mixing chamber. It also
acts as a capacitance to collect more LNG before sending it to the next subsystem. In general, this value
has been kept at a minimum as the less volume that the LNG can expand into, the less it will contain at
the end of the mission. All of the LNG trapped in the mixing chamber is simply wasted, thus reduction in
the mixing chamber LNG accumulation reduces the amount of LNG used over the mission. Another
constant that can be tuned is the pressure set point. This value should be decided based on where the
output flow of the LNG is going. If it is going to some sort of powerplant, there is usually an inlet
pressure requirement. Also, the length of plumbing and pressure losses along the piping should be
considered when setting the pressure set point.
This is the initial design of the mixing chamber, but there are changes that can be made for other
circumstances. For example, in future modeling efforts and cases, it might be desired to mix more than 3
streams of a cryogen. This mixing chamber is capable of that with a little modification. Additional
changes could be for the desire to increase fidelity or garner more information from the subsystem. An
example of this would be studying the equation of state used for the pressure calculation. There are
several different equations of state besides Van der Waals that might prove to be more relevant for the
flow region, just above the vapor dome. A study might be done in order to compare the performance of
these other equations of state to see which give the most accurate results or which are the most
computationally efficient. Additionally, there could be a sizing routine that calculated the actual size,
both mass and volume, of the mixing chamber to provide a better estimate of the overall system size.
Another area that could be addressed is the assumption that the mixing chamber is well insulated. If the
mixing chamber were sized, then another term could be added to equation 33 to represent heat
conducting through the skin. If the environment on the exterior of the mixing chamber could be
adequately estimated, then this addition would definitely improve the fidelity of the model. Ultimately,
the decision to upgrade the model would have to be based on whether the new assumptions such as
mixing chamber construction are valid enough to warrant replacing the current set of assumptions.

34
Results: The models described in the previous section were used in larger more complex architectures in order
to evaluate their effectiveness. One of the goals of this project was to see the overall effect of placing a
high energy HEPS system on board an aircraft and seeing its overall effect. In order to accomplish this,
the LNG system was integrated into a T2T model of a generalized small strike military aircraft. The
simulated aircraft was put through a simulated mission that covered a range of altitudes and speeds as
well as activating the HEPS at different points of the mission. As a general statement, the mission was
created not based on any actual mission, but just to simulate the aircraft in a variety of altitude and
speed scenarios. The missions give the modeler a feel for how the aircraft would react to a variety of
environments. This mission is defined by Figure 13.
Figure 13: Mission Profile
The laser is active at a variety of mission points, at a variety of altitude and speed points. Additionally,
the laser is only activated at points on the mission where the altitude and speed are not changing, but at
a steady state. At the 30 minute mark, the aircraft in the mission has reached a relatively low altitude
and high speed, which causes that part of the mission to be thermally constrictive. This means that the
baseline aircraft had the most difficult time with thermal management at this point. With that in mind, a
laser firing cluster was placed at this time. The mission detailed in Figure 13 was used for each of the
cases unless otherwise stated. Additionally, the LNG system was operated in several configurations and
levels of integration with the base aircraft. The results of these studies are presented by case study.
Basic LNG System Operation:
Before any cases can be studied, the LNG components described in the coding section must be tested as
a group to ensure that they function as expected. This goes back to the system level integration and
optimization. Each individual component was designed and tested independently but testing needs to
be conducted to ensure that they work together and the control systems do not interfere with one
Time (min)
HEPS

35
another. One of the key parameters that needed to be tested is the cold plate temperature during laser
activation. As mentioned before, the laser crystal temperature cannot change by more than 6K during
firing to prevent excessive optical power loss by wavelength change.
Figure 14: Cold plate temperature during laser activation
Figure 14 shows the temperature of the cold plate rather than the temperature of the LNG flow in the
HEPS subsystem. The test represented in Figure 14 is a cluster of laser activations. The laser was
activated 6 times. Each time, the activation period lasted 6 seconds with a 6 second time gap between
activations, which means that during the cluster the laser was active for 50% of the time. The graph also
shows that the temperature change during activation is less than 6K. The temperature oscillation is an
artifact of the control system. The PI controller managing the temperature by altering the flowrate of
LNG was designed to use the maximum possible temperature variation, which translates also to the
minimum usage of LNG during the mission. If the plate temperature is allowed to vary more, then its
temperature can be managed using less LNG. Furthermore, a trend should be observed, during the final
three laser fires, the average temperature during the fire is a constant and the temperature curves are
nearly identical. Meaning that the LNG thermal management system could operate for three or more
laser activations without any concern of a thermal runaway as some room temperature laser systems
exhibit38. If thermal runaway is allowed to occur, the laser crystal temp will increase with each fire, and
not fully cool to the pre-firing temperature. As a result, of thermal runaway, the laser temperature will
increase, thus decreasing its efficiency requiring more cooling and more electrical power to operate. To
HEPS
HE
PS

36
solve thermal runaway, it is necessary to reset the laser in a way, to shut it off until it is able to be
cooled back to the initial temperature.
With this information, it can be determined that the HEPS subsystem functions properly in conjunction
with the tank model. The control system adequately manages the laser crystal temperature in such a
way to prevent any thermal runaway and would allow the laser to be repeatedly fired provided that
there is sufficient LNG. Additional testing shows that the signals from each of the three developed
subsystems communicate well. Each of the systems controls functioned properly moving the LNG from
subsystem to subsystem and maintaining the desired pressures.
Integrated LNG System:
The first case studied is an integrated system. This system is designed to draw the electrical power
required for the HEPS from the aircraft in which it is mounted. This means that it will most closely
resemble the final preliminary study case as shown in Figure 11. The preliminary study showed that this
case was the smallest and lightest, due mostly to the lack of a powerplant, but also due to a more
effective usage of the LNG since it can be kept at a lower pressure. The architecture for this case is
shown in Figure 15.
Figure 15: Architecture of LNG System for the Integrated Case Study
The LNG is stored in the tank and can exit either as a vented vapor or as a liquid. The liquid flow travels
to the 150kW laser where it is vaporized. The laser LNG flows are then routed to the mixing chamber
where they are mixed with the tank vapor vent. The single unified flow then travels to the heat
Fuel Tank
150kW HEPS
Aircraft TMS
PAO Loop, VCS, IPP, Avionics
Systems
Mixing Chamber
Tank Vent
Heat Exchanger
LNG Flow
PAO Flow

37
exchanger which is where the LNG system connects to the aircraft’s existing APTMS. The LNG system
integration with the rest of the TMS is illustrated in Figure 16.
Figure 16: TMS Architecture for the Integrated Case Study
The LNG system connects to the APTMS and FTMS through the PAO loop. This is illustrated in Figure 15
by the use of the grey box labeled ‘Aircraft TMS’ and shown in Figure 16 by its placement on the PAO
cooling loop. The LNG tank, HEPS, mixing chamber and heat exchanger are all contained in the single
block on the TMS diagram in Figure 16. The PAO loop in green runs clockwise. It can be seen that the
LNG system was placed after the VCS as to not significantly interfere with the VCS controls. Unlike the
other subsystems attached to the PAO loop, the LNG HEPS system provides cooling to the PAO rather
than increasing its temperature. The LNG flow is controlled by the HEPS plate temperature, therefore,
besides venting; the LNG only flows while the laser is activated. This means that the LNG system only
provides additional cooling to the PAO loop while the laser is active. The laser follows the mission profile
detailed in Figure 13. The performance of the LNG system was to be measured in a few ways. Primarily,
the system would be judged on its effect on the TMS. This will be judged by the temperatures of the
various avionics systems included in the TMS. Specifically, for this case, the cockpit and the liquid cooled
avionics temperatures will the tracked since they have direct interaction with the LNG system. The
temperatures of other components are tracked and checked to ensure that no limits are breached, but
the graphs are not shown as they bring limited or no new information to the study.

38
Figure 17: Cockpit Temperature of the Integrated LNG Case
Figure 17 shows the temperature of the cockpit air throughout the mission. Graphed is the solid line
representing the temperature with the described LNG system. The dotted line represents the baseline
system which has no HEPS of any kind nor does it have any LNG system components. This baseline is a
version of the T2T model before the HEPS was included. This T2T model version was deemed acceptable
in its performance with its sizing of all thermal management systems and architecture11,12. The biggest
difference between the two systems, besides the inclusion of a LNG HEPS, is the sizing for the IPP and
VCS. Since the LNG system is providing additional cooling, the current TMS systems could be downsized,
thus reducing their mass and volume. Specifically, the IPP size was reduced by 20%.
Table 9: Integrated LNG system TMS sizing
Baseline LNG Cooled
VCS Size (kW) 100 100
IPP Size (%) 100 80
In the cockpit temperature graph, the two systems perform very similarly, with both keeping the cockpit
at a fairly steady comfortable temperature.

39
Figure 18: Liquid Cooled Avionics Temperature of the Integrated LNG Case
Figure 18 shows the temperature of the liquid cooled avionics (LCA) using the same legend as Figure 17.
This system is directly cooled by the PAO loop, whereas the cockpit is only indirectly cooled by this loop.
The cockpit temperature is managed by using a heat exchanger with the PAO loop and the bleed air that
feeds the cockpit. This is illustrated in Figure 16. This fact is indicative as to way the LNG has a much
larger effect on the LCA temperature than compared to the cockpit temperature. In this graph, the LNG
system clearly outperforms the baseline system in thermal management by keeping the LCA cooler.
Also, an interesting temperature trend can be seen in Figure 18, where the laser firing clusters can
clearly be seen. These are the distinct temperature drops around 7, 20, 30 and 37 minutes. It can be
concluded from the LCA temperature graph that the LNG system performs on par with the baseline
system until the laser fires and then the LNG system drastically outperforms the baseline with a smaller
IPP size.
It was then decided to look towards the future. As the graph in Figure 1 shows, the power and thermal
demands aboard aircraft are increasing exponentially. As a result, the LNG system would need to be
tested to ensure that it is capable with coping with these increased heat loads. Therefore, every one of
the heat loads in the FTMS and APTMS besides the HEPS itself had a multiplication factor added. Table
10 shows the amount of energy that is involved with a heat load multiplication.
Table 10: Heat Load Multiplier
1X Heat Load (kW) 4X Heat Load (kW)
Load 41.9 167.6

40
Figure 17 and Figure 18 show the temperatures at a 1X heat load. The 4X heat load for a hypothetical
future aircraft with expansive thermal loads generated by a myriad of advanced systems is shown for
the APTMS systems analyzed.
Figure 19: Cockpit Temperature of the Integrated LNG Case with High Heat Load
Clearly neither of these systems maintains the cockpit temperatures within reasonable ranges. The LNG
system far outperforms the baseline system, but the LNG still maxes out at 390K (242°F) and averages
about 350K (170°F). Both of these performances would have prevented a pilot from completing the
mission. However, the LNG system clearly out performs the traditional TMS, especially after the first set
of firing. Additionally, the LCA temperatures are shown.

41
Figure 20: Liquid Cooled Avionics Temperature of the Integrated LNG Case with High Heat Loads
As with the cockpit temperatures, the LCA temperatures get fairly high with the LNG system
outperforming the baseline system. These plots demonstrate that a 4X heat load based on future needs
would require an even larger thermal management systems than are modeled here; however, since the
LNG system did perform better it wouldn’t require the scale of size increase that the baseline would.
These results show that the LNG did thermally manage the APTMS temperatures to a major extent.
However, in order to manage these temperatures, the IPP and VCS were upsized to accommodate the
drastic heat load that was added to the aircraft. This increase is reflected in Table 11.
Table 11: Integrated LNG system TMS Sizing for Increased Heat Load
Baseline LNG Cooled
VCS Size (kW) 150 150
IPP Size (%) 150 150
As Table 11 shows, the IPP and VCS were upsized from both the baseline and LNG cooled system. It
turns out that the LNG flowing only during firing does not provide enough cooling effect to manage the
APTMS temperature over the entire mission. As a result, the IPP and VCS sizes had to be increased;
otherwise there would have been significant thermal problems. This means that the TMS would have
increased in mass and volume due to the addition of the LNG system and the upsizing of the legacy TMS
components. The mass and volume of the LNG system, for both the original amount of thermal energy
and for the 4X multiplier, is shown in Table 12.

42
Table 12: Basic LNG System Mass and Volume Estimates
Component Mass (kg) Volume (m3)
LNG 50 -
Cryogenic Tank 11.83 0.126
Heat Exchanger 13.96 0.0052
Total 75.8 0.131
The system is sized to represent the amount of LNG used in the mission described in Figure 13. The LNG
tank mass and volume was derived from the sizing routine which includes factors such as the density
and thickness of both the insulation and tank skin. The heat exchanger sizing was accomplished through
the built in optimization routine. The routine used user defined parameters such as the temperatures
and flowrates for each fluid, as well as the desired energy to transfer between the two, to size the heat
exchanger11,12. Also, it should be noted that the mass and volume of the laser itself is not estimated
since the cryogenic lasers used in this study are still in testing and development phases. Additionally, the
existing laser systems which could be used to gauge the mass and volume are of different laser types
and are prohibitively large and heavy for the proposed application.5–7 Furthermore, 50kg of LNG, which
translates to approximately 29 gallons (0.11 m3), is relatively small for this much of a capability increase.
This system does require that the host aircraft supply the electrical power for the laser unlike some of
the palletized systems explored in the preliminary study. Considering the overall effects on the aircraft,
this integrated LNG system shows promise as a viable system on a small tactical military air vehicle.
Enhanced Integrated LNG System:
Using the information learned from the previous case, an expanded version of that system was
developed. Seeing that the LNG system really shines while the laser is firing indicates that while the LNG
is flowing, the LNG system can supplement more of the aircrafts legacy TMS. As a result, an architecture
was devised where a secondary flow of liquid LNG flows from the tank to cool other TMS components.
The LNG liquid to vapor phase change can be used to cool one system and then increasing its
temperature can be used to cool additional systems. Since the fuel recirculation temperature has been
shown to get too hot and threaten the capability of the aircraft, it was the first target of this additional
cooling capability15.

43
Figure 21: TMS Architecture for Cooling Recirculating Fuel with LNG
In this architecture the LNG is boiled in a heat exchanger with the recirculating fuel. After it has been
boiled the vaporized LNG travels back to the LNG system where it is mixed in the mixing chamber with
the flows from the HEPS and the tank and then routed into the main heat exchanger with the PAO loop.
For this study, it was decided not to interfere with the control systems already in place for the IPP and
VCS. Therefore, no control system was implemented for the secondary flow of LNG going to the
recirculating fuel. It will simply flow at a constant flowrate of 0.3 kg/s for the entire mission.
Unfortunately, this means that the LNG boiling will not be used in its most effective way and will be
cooling the fuel recirc when it doesn’t necessarily need cooled. However, this study will show the effect
of having a higher flowrate of vaporized LNG going to cool the PAO loop. It can then be seen how much
of the VCS and IPP work the LNG replaces. First, the temperature in the fuel tank should be analyzed.
Fuel
Engine Oil
Bleed Air to Avionics
PAO Oil Bleed Air to IPP LNG
Fuel Tanks
FADEC & ESG ICC
PAO Fuel HX
Hyd. HX
ESG HX
Engine Pumps
Engine Oil HX
Fan Comp
Comb
Comb
TurbFanFan CompComp
CombComb
CombComb
TurbTurb
Fan Stream Fan Comp Turb
PTu
Tur
Co
m IPP Comb
M/G
Liq Cool Avionics
Fuel-Air HX
LNG HEPS
VCS
Cockpit
Air Cool Avionics
POA-Cond HX
Fuel-LNG HX

44
Figure 22: Fuel Tank Temperatures Comparing Baseline Cooling and LNG Cooling
Figure 22 shows the fuel tank temperature throughout the mission for the baseline case without LNG or
a HEPS system compared to the case where the recirculating fuel is cooled by a constant flowrate of
LNG. As the graph shows, the LNG provided a significant cooling force to the fuel tank. The LNG cooled
temperature at the end of the mission was 20K cooler than the baseline. It prevented the thermal
runaway that started to occur in the tank towards the end of the mission when there is little fuel in the
tank and it is being recirculated from the FTMS heat loads15. If the fuel becomes too hot in the tank,
then when it is pumped through the FTMS it cannot absorb as much heat from those heat loads which
might lead to them overheating. Additionally, JP8 cannot exceed 395K21. If it does, the fuel will begin to
break down and will not be as effective of a fuel.
Another option for an enhanced integration system would be to use the phase change to cool the
engine bypass air instead of the recirculating fuel. In this iteration of the T2T model, this would mean
cooling the third stream. While theoretically the engine bypass should be cool air to begin with and
shouldn’t need to be cooled, this study is being done to show LNG’s capability to cool engine
components as an alternative example.

45
Figure 23: TMS Architecture for Cooling the Engine Bypass Flow with LNG
In this architecture, the secondary LNG flow is routed to the engine bypass instead of the recirculating
fuel. The secondary LNG flow is at a constant 0.3 kg/s like the recirculating flow case. This flow is boiled
in the engine bypass flow and then returned to the mixing chamber to be used to cool the PAO loop. As
in the recirculating fuel case, this is not the most effective method of using LNG, since the secondary
LNG flowrate is not controlled by the temperature of either the PAO loop or the engine bypass
temperature.
Fuel Tanks
FADEC & ESG ICC
PAO Fuel HX
Hyd. HX
ESG HX
Engine Pumps
Engine Oil HX
Fan Comp
Comb
Comb
TurbFanFan CompComp
CombComb
CombComb
TurbTurb
Fan Duct HX
Fan Stream Fan Comp Turb
Fuel
Engine Oil
PTu
IPP
Fan Duct HX
Bleed Air to Avionics
PAO Oil
Bleed Air to IPP
Comb
M/G
Fan Duct
Liq Cool Avionics
Fuel-Air HX
LNG HEPS
VCS
Cockpit
Air Cool Avionics
POA-Cond HX
Fan Duct HX
LNG

46
Figure 24: Third Stream Temperatures Comparing Baseline Cooling and LNG Cooling
The third stream was cooled by boiling a constant flowrate of LNG in a heat exchanger. The temperature
change from the baseline to the cooled versions differs throughout the mission due to the flowrate
changing. The maximum temperature difference occurs at a bypass air flowrate of 14.5 kg/s with a
temperature difference of about 10K. This is demonstrating the significant thermal effect that boiling
the LNG can have, even on a large flowrate system such as the engine bypass.
The LNG cooling the recirculating fuel case and the cooling the engine bypass case yield the same
APTMS temperature profiles. Therefore, the results will be identical and only one line from this
enhanced LNG integration scheme will be shown. As mentioned before, this study is meant to
demonstrate the positive effect that the increased LNG flowrate will have on the APTMS temperatures.

47
Figure 25: Cockpit Temperature of the Enhanced Integrated LNG Case
The three cases performed in a very similar manner throughout the mission. This was surprising since
the enhanced LNG is providing a significantly higher level of LNG flow. As Table 13 shows, the enhanced
system used the same sizing for the IPP and VCS as the basic LNG system.
Table 13: Enhanced Integrated LNG system TMS
Baseline Basic LNG Enhanced LNG
VCS Size (kW) 100 100 100
IPP Size (%) 100 80 80
Additionally, the LCA temperatures were compared, like in the previous case to see if the enhanced
system will outperform the basic system.

48
Figure 26: Liquid Cooled Avionics Temperature of the Enhanced Integrated LNG Case
The LCA temperatures in Figure 26 show the enhanced LNG system outperforming the basic LNG case.
This is what was expected considering the higher LNG flowrate. An explanation as to why the LCA
temperatures showed the enhanced LNG system being colder is that the LCA’s are directly cooled on the
PAO loop, while the cockpit is cooled indirectly by a heat exchanger with engine bleed air. This could
cause a diluted effect of the LNG. Another observation with the LCA temperatures is that the
temperatures during firing of LNG are equivalent to those of the enhanced system’s constant LNG flow.
This could indicate that there is a minimum temperature that the LNG can cool the system to, and
during firing the extra flow from the enhanced system is being wasted as it cannot cool the PAO any
further. This would indicate that a better control system for the LNG flow could reduce the LNG usage by
properly regulating flow based on temperature.
The constant flowrate of LNG shows temperature improvement over the baseline system and the
previous LNG system where the LNG is only flowing during laser firing. This system thoroughly manages
the temperatures in the APTMS with the assistance of the IPP and VCS. For this study the VCS was
downsized from the baseline of 100kW to 80kW, with the IPP remaining at the baseline size.
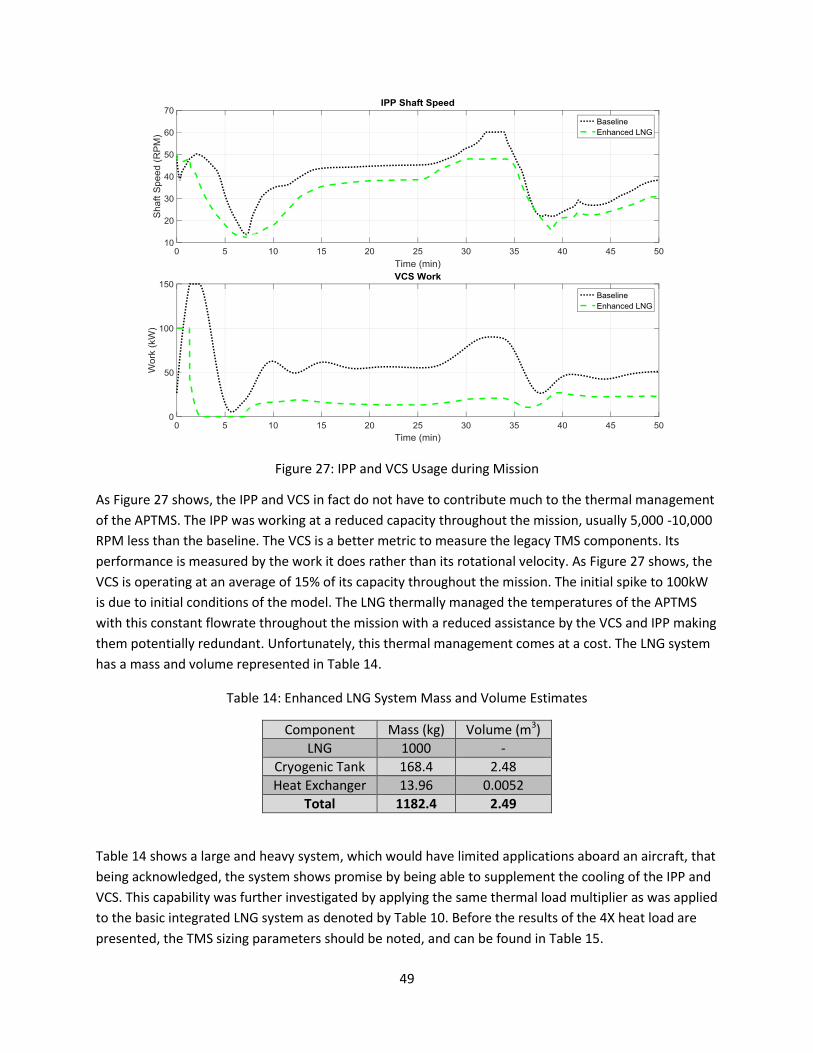
49
Figure 27: IPP and VCS Usage during Mission
As Figure 27 shows, the IPP and VCS in fact do not have to contribute much to the thermal management
of the APTMS. The IPP was working at a reduced capacity throughout the mission, usually 5,000 -10,000
RPM less than the baseline. The VCS is a better metric to measure the legacy TMS components. Its
performance is measured by the work it does rather than its rotational velocity. As Figure 27 shows, the
VCS is operating at an average of 15% of its capacity throughout the mission. The initial spike to 100kW
is due to initial conditions of the model. The LNG thermally managed the temperatures of the APTMS
with this constant flowrate throughout the mission with a reduced assistance by the VCS and IPP making
them potentially redundant. Unfortunately, this thermal management comes at a cost. The LNG system
has a mass and volume represented in Table 14.
Table 14: Enhanced LNG System Mass and Volume Estimates
Component Mass (kg) Volume (m3)
LNG 1000 -
Cryogenic Tank 168.4 2.48
Heat Exchanger 13.96 0.0052
Total 1182.4 2.49
Table 14 shows a large and heavy system, which would have limited applications aboard an aircraft, that
being acknowledged, the system shows promise by being able to supplement the cooling of the IPP and
VCS. This capability was further investigated by applying the same thermal load multiplier as was applied
to the basic integrated LNG system as denoted by Table 10. Before the results of the 4X heat load are
presented, the TMS sizing parameters should be noted, and can be found in Table 15.

50
Table 15: Enhanced Integrated LNG system TMS Sizing for Increased Heat Load
Baseline Basic LNG Enhanced LNG
VCS Size (kW) 150 150 100
IPP Size (%) 150 150 100
The baseline and basic LNG numbers remain unchanged from the previous section’s study of heat load
multipliers. The cockpit temperatures for the 4X heat load can be seen in Figure 28.
Figure 28: Cockpit Temperature of Enhanced Integrated LNG Case for High Heat Loads
Figure 28 shows a 4X heat load comparison between the baseline system and the two types of LNG
systems investigated thus far, the basic integrated system and its enhanced cousin. As this graph shows,
along with Figure 19, the baseline and basic LNG system were not able to thermally manage the cockpit
temperature. The enhanced LNG temperature does max out at 320K (116°F), but the bulk of the mission
has a temperature at about 295K (71°F) which is the desired temperature. Looking at this graph alone, it
could be said that the enhanced nearly manages a futuristic heat load that neither the oversized legacy
system nor the basic LNG system with oversized IPP and VCS’s could. It achieved this, with smaller IPP
and VCS components than the other two systems.
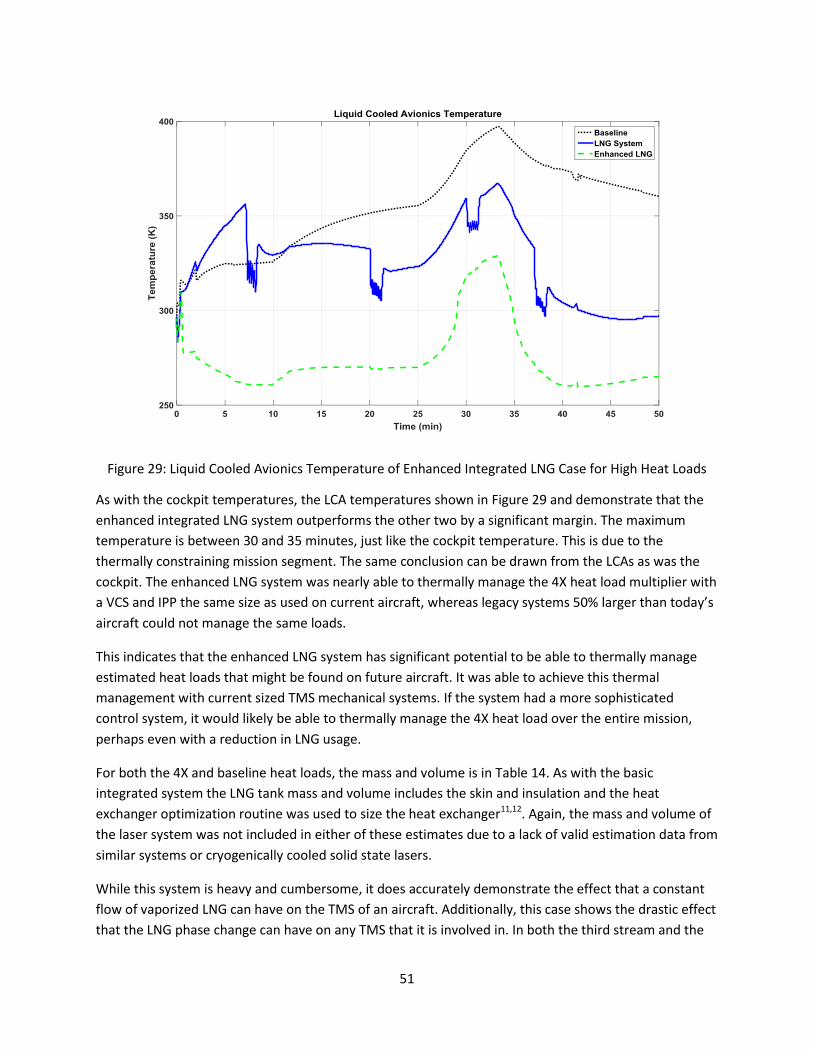
51
Figure 29: Liquid Cooled Avionics Temperature of Enhanced Integrated LNG Case for High Heat Loads
As with the cockpit temperatures, the LCA temperatures shown in Figure 29 and demonstrate that the
enhanced integrated LNG system outperforms the other two by a significant margin. The maximum
temperature is between 30 and 35 minutes, just like the cockpit temperature. This is due to the
thermally constraining mission segment. The same conclusion can be drawn from the LCAs as was the
cockpit. The enhanced LNG system was nearly able to thermally manage the 4X heat load multiplier with
a VCS and IPP the same size as used on current aircraft, whereas legacy systems 50% larger than today’s
aircraft could not manage the same loads.
This indicates that the enhanced LNG system has significant potential to be able to thermally manage
estimated heat loads that might be found on future aircraft. It was able to achieve this thermal
management with current sized TMS mechanical systems. If the system had a more sophisticated
control system, it would likely be able to thermally manage the 4X heat load over the entire mission,
perhaps even with a reduction in LNG usage.
For both the 4X and baseline heat loads, the mass and volume is in Table 14. As with the basic
integrated system the LNG tank mass and volume includes the skin and insulation and the heat
exchanger optimization routine was used to size the heat exchanger11,12. Again, the mass and volume of
the laser system was not included in either of these estimates due to a lack of valid estimation data from
similar systems or cryogenically cooled solid state lasers.
While this system is heavy and cumbersome, it does accurately demonstrate the effect that a constant
flow of vaporized LNG can have on the TMS of an aircraft. Additionally, this case shows the drastic effect
that the LNG phase change can have on any TMS that it is involved in. In both the third stream and the

52
recirculating fuel, the LNG phase change caused a significant temperature drop during the mission. If
this powerful heat sink could be used more effectively, then the LNG system could use less LNG to
perform the same cooling functions within the APTMS. Achieving this would require the creating of a
control system and also potentially a reworked TMS architecture.
Total LNG:
After seeing the cooling capability of the LNG with phase and temperature change to the entire TMS,
another case was made where the LNG would play the central role in the TMS. In the enhanced
integration scheme, the LNG was used at a constant flowrate to thermally manage either the
recirculating fuel or engine bypass with the phase change. Only the temperature change was used to
cool the PAO loop, which will cool the various avionics loads. Also, the enhanced LNG system was
operated in conjunction with a VCS and IPP. But with the LNG so effectively cooling the TMS, is it
possible to remove the mechanical systems (IPP and VCS)? The VCS and IPP were used in conjunction to
cool the PAO loop and its avionics loads. But if the LNG phase change and temperature change were
used to cool just the PAO loop, then less LNG would be needed than for the enhanced integration
system. Further reduction in LNG requirements might be achieved by an effective controller that will
only flow LNG to the PAO loop when cooling is needed.
The first step for implementation of a solely LNG system is to modify the existing architecture. The TMS
for this case was designed based on the TMS for the previous cases; however, with significant
modifications. First, the IPP and VCS were eliminated. Because these two systems were eliminated, their
associated heat exchangers could also be eliminated. The heat exchangers that are being referred to are
in the engine bypass and in the fuel recirculation system. Additionally, the air cooled avionics (ACA)
were removed and their load included in the LCA. Overall, these changes have streamlined the TMS by
significantly reducing the complexity. The reduction can be seen in Figure 30.

53
Figure 30: TMS Architecture for Cooling the Entire Aircraft with LNG
This figure shows the TMS with the additional parts for the LNG system. A heat exchanger was added to
the recirculating fuel. Instead of sending LNG there to be boiled and thermally manage the recirculating
fuel that way, this line sends the vaporized LNG after it has already cooled the PAO loop since it is still
cold enough to have a significant thermal capacity. That is why there is no return line. As with the
previous cases, the ‘LNG HEPS’ block includes the entire LNG cooling and laser system. However, in
order to more effectively manage the temperature of the PAO loop, an analog two phase heat
exchanger was used. The new LNG system can be seen in Figure 31.
Fuel Tanks
FADEC & ESG ICC
PAO Fuel HX
Hyd. HX
ESG HX
Engine Pumps
Engine Oil HX
Fan Comp
Comb
Comb
TurbFanFan CompComp
CombComb
CombComb
TurbTurb
Fan Stream
Fan Comp Turb
Liq Cool Avionics
LNG HEPS
Cockpit
POA-Cond HX
Fuel
Engine Oil
Bleed Air to Avionics
PAO Oil
LNG
Fuel Recirc HX

54
Figure 31: Architecture of LNG System in the Total LNG Case Study
On a basic level, this system is identical to the one in Figure 15. A second flow of saturated liquid LNG
goes first to a phase change heat exchanger. This heat exchanger is highly idealized, taking all of the Hvap
from the LNG and reducing the enthalpy of the PAO by that same amount. Equation 34 shows the
process to find the exit temperature of the PAO in the phase change heat exchanger using this method.
𝑇𝑃𝐴𝑂 𝑜𝑢𝑡 = 𝑇𝑃𝐴𝑂 𝑖𝑛 − �̇�𝐿𝑁𝐺ℎ𝑣𝑎𝑝 𝐿𝑁𝐺
�̇�𝑃𝐴𝑂 𝐶𝑝𝑃𝐴𝑂 34
After the now vaporized LNG leaves the phase change heat exchanger, it passes to the mixing chamber.
It is then used, in conjunction with the other LNG flows, in the normal single phase heat exchanger. The
PAO flow is first cooled in the single phase heat exchanger. This is because the heat exchanger will
operate most effectively where the temperature gradient between the LNG and PAO flows is the
greatest. The LNG flow must be used in the single phase heat exchanger after it has been combined in
the mixing chamber. There the PAO is hottest when it enters the LNG system and will transfer more heat
because the temperature variation between fluids is higher. Therefore, the PAO is first cooled by LNG
vapor and then it is cooled again by vaporizing LNG in the phase change heat exchanger.
In order to control the temperature of the APTMS, a control system had to be implemented. Because
the PAO loop temperature is maintained by a single simple system, this control system can also be
simplified. When the IPP and VCS were included, the control system to manage the temperature in the
PAO loop had to control other factors as well to prevent the mechanical systems from failing. These
factors include the inlet and exit temperatures for all flows in the VCS and IPP to prevent overheating.
Additionally, the RPM of the IPP had to be controlled as well as the VCS work. Balancing all of these
factors created a complex cascade control system. Contrastingly, the LNG system simply has a PI
controller which manages the secondary liquid LNG flowrate out of the tank. It controls this by
Phase Change
HX
150 kW HEPS
Mixing Chamber
PAO
HX
LNG Flow
PAO Flow
Fuel Tank
From PAO Loop
To PAO Loop

55
comparing a set point to the temperature for the PAO flow entering the LNG system. By more effectively
controlling the temperatures with the flowrate of LNG, the usage of LNG was reduced to a mere 140kg
over the entire mission to cool the laser and the APTMS.
This system was tested to see its effectiveness at thermally managing the entire APTMS. As with the
previous studies, the temperatures of the APTMS were compared.
Figure 32: Cockpit Temperature for the Total LNG System
The graph in Figure 32 shows that the LNG based TMS thermally managed the cockpit in a similar
temperature range to the original system. The temperature using LNG maxed out at about 303K (85°F)
which is slightly above the desired range, but within limits. The both systems keep the temperature in a
comfortable range throughout the bulk of the mission.

56
Figure 33: Liquid Cooled Avionics Temperature for the Total LNG System
Figure 33 shows that the LNG system manages the LCA temperatures in a more exact manner. The
temperature is much more constant than the cockpit temperature and more consistent than the
baseline legacy system was able to produce. Also, looking back to the other integrated LNG systems, this
total LNG system yielded a much more constant LCA temperature. This is because the total LNG system
directly thermally manages the LCA temperature by changing the LNG flowrate based on the PAO loop
temperature, which is primarily affected by the LCA heat load. The cockpit temperature on the other
hand is indirectly managed through a heat exchanger with bleed air. The cockpit temperature is not a
controlling variable to the LNG flowrate as the PAO temperature is. As a general statement, the total
LNG system performed on par with the original system.
Additionally, even if two systems perform comparably, there would have to be some extra advantage
gained by the alternative total LNG solution in order to justify the research and development costs of a
new system. Because the T2T model contains many of the aircraft’s subsystems and their complex
interactions the total LNG’s effect can also be observed on other systems not directly connected to the
APTMS. One of these is the engine bleed air. Engine bleed air was taken from the high pressure
compressor and routed to the IPP to spin the turbine. Without the IPP, this bleed is no longer required.

57
Figure 34: Bleed Air from Engine in the Total LNG Case vs. the Baseline
With a lower engine bleed as shown in Figure 34, the engine’s performance increases by using less fuel
to achieve equivalent propulsion as the baseline system. This is because the engine had to perform work
to compress the air and removing that air reduces the energy in the engine, thus reducing its efficiency.
The baseline system had a significantly higher bleed rate during the vast majority of the mission. This
means that for most of the mission, the engine was wasting energy with the non-LNG system. The
addition of the total LNG system not only was able to replace the existing systems, but also shows
benefits to the performance of other systems.
As with the previous studies, the Total LNG system was tested to see its ability to cope with the
expected increase in thermal load aboard the aircraft. The same 4X heat load was applied to the APTMS.
The amount of initial LNG was increased for the Total LNG case to deal with the higher heat loads, while
the legacy systems of the baseline case were left unaltered.

58
Figure 35: Cockpit Temperature for the Total LNG System at a High Heat Load
Figure 35 demonstrates that the Total LNG system is able to completely cope with the high heat loads,
while the baseline system is unable to do so. While it is not shown in this figure, the total LNG system
outperformed the basic LNG and enhanced LNG systems as well for the 4X heat load for the cockpit
temperature. Furthermore, the LCA temps were also compared.

59
v
Figure 36: Liquid Cooled Avionics Temperature for the Total LNG System at a High Heat Load
Again, the total LNG system is shown to be far superior in coping with a high heat load while managing
the LCA temperatures. That combined with the cockpit temperature plot implies that the total LNG
system would be a superior choice in a future aircraft over the current baseline configuration because it
can deal with the expanding heat loads by simply enlarging the LNG storage capacity. These capacities
are addressed in Table 18. Finally, the bleed flow was also compared for the high heat load case.

60
Figure 37: Bleed Air from Engine in the Total LNG Case vs. the Baseline with High Heat Load
Figure 37 shows that in order to cope with the higher heat loads, the baseline system required
significantly more bleed air to supply the IPP. Even with this increased load on the engine, the baseline
TMS was still unable to cope with the 4X heat load. In comparison, the total LNG required no increase in
bleed to cope with the higher heat loading. This means that if an aircraft is equipped with the total LNG
system and its electronic systems are upgraded, no additional unexpected bleed load will be added. The
total LNG system can cope with these increased heat loads by merely adding LNG capacity. Table 16
shows a comparison of the total air bleed amount.
Table 16: Engine Bleed Comparison
Architecture Bleed (1X Heat Load) [kg] Bleed (4X Heat Load) [kg]
Baseline 1627 3474 (+114%)
Total LNG 1063 1103 (+3.8%)
The values in Table 16 represent the area beneath the bleed air graphs in Figure 34 for the original heat
load and Figure 37 for the high heat load. These values were generated by integrating graphs in Figure
34 and Figure 37 to yield a single number representing the mass of air bleed from the engine over the
mission. Table 16 clearly shows the superiority of the total LNG system over the original design when it
comes to engine bleed amounts. The original design bled more air under the baseline heat load and
more than doubled the bleed amount when the heat load was quadrupled while still not cooling either
the cockpit or the LCA temperatures sufficiently. In contrast, the total LNG system increased by only 4%
bleed when the heat load was quadrupled while still maintaining the temperature of the critical avionics
systems.

61
One important metric that will be used to compare the total LNG system to the conventional legacy
system which it is replacing is the sizing. This factor will be estimated for both systems in mass and
volume.
Table 17: Sizing of Removed Components from Legacy System
Component Mass [kg] Volume [m3]
Engine Heat Exchanger 586 0.52
VCS (100kW) 488
IPP 337.4 0.7
ACA - -
Control System - -
IPP – FTMS Heat Exchanger 61.64 0.023
Total 1473 1.24
The heat exchangers that connected the IPP to the bleed air from the engine were removed and
estimated using the T2T model heat exchanger sizing11,12. Next, the VCS was removed. This 100kW VCS
had an estimated 488kg mass39. In sufficient information regarding the VCS volume in this application
was available to accurately estimate it. Also, the IPP could be removed and this mass and volume
reduction is estimated using the sizing information provided by the T2T model11,12. Furthermore, using
the T2T HX sizing information the IPP HX that connects the IPP to the FTMS in the traditional
architecture can be removed11,12. Finally, the control systems for the IPP and VCS were removed but
these did not have a size associated with them, nor were any estimates available. They were deemed to
be negligible in size. The air cooled avionics (ACA’s) were not removed but were lumped into the LCA’s
to further simplify the model, but the mass and volume of these components would still be aboard the
aircraft. This large mass and volume that is removable frees up a significant amount of space for the
Total LNG system. After these components are removed, the LNG components would have to be added.
Table 18: Total LNG Component Masses
Heat Load LNG Used[kg] LNG in Tank[kg] Tank Mass[kg] Heat Exchanger Mass[kg] Total [kg]
1X 139.5 175 32.29 95.66 303.0
4X 609.5 625 106.1 95.66 826.8
Table 19: Total LNG Component Volumes
Heat Load Tank [m3] Heat Exchanger [m3] Mixing Chamber[m3] HEPS [m3] Total [m3]
1X 0.43 0.035 0.01 0.095 0.57
4X 1.54 0.035 0.01 0.095 1.68
Table 18 and Table 19 show the sizing for the various components of the LNG system, which would be
added to the aircraft. For the mixing chamber and the HEPS, the volume listed is only the volume in
which the cryogenic vapor can expand. For the mixing chamber this is the interior volume without

62
consideration for any other internal components, nor is the skin or insulation taken into account. The
HEPS volume does not account for the laser components, cold plate, skin or insulation that might be
included in a final design. The HEPS volume is only the space in which the natural gas is allowed to
expand into after boiling against the cold plate.
When accounting for most of the cooling equipment for the Total LNG system, the mass and volume
added by the Total LNG system is much less than the components that can be removed. Unfortunately,
the mass and volume of the laser itself is not included for lack of valid data. For the current heat load
and components that can be analyzed, the weight reduction is 1170kg and the volume difference is
0.67m3. This frees up space and weight for other systems or provides other benefits. Even for the
futuristic heat load there is a mass savings of 646kg, but a volume increase of 0.44m3 for switching to
Total LNG. While this volume increase might be a problem, it should be noted that the Total LNG system
did successfully thermally manage the aircraft at this level of heat load, while the smaller but heavier
legacy system failed to cope with the estimated future heat load.
An additional method of evaluating this LNG system variant is to evaluate how much JP8 can be
displaced by burning the natural gas in the primary engine. In order to accomplish this, it was assumed
that the engine was designed to be able to use both LNG and JP8 as fuels simultaneously and no
problems would arise to spontaneously switching between fuels. This was accomplished by calculating
the amount of heating value that the natural gas would contribute to the engine.
Table 20: Fuel HComb Properties40–42
Hcomb (MJ/kg) Hcomb (MJ/L)
JP8 42.8 34.6
LNG 55.2 25.2
It is important to use the Hcomb to calculate the equivalent JP8 which can be replaced by LNG. The heat of
combustion represents the amount of energy that the fuel can provide to the engine’s power via
combustion. The LNG has superior Hcomb when compared on a mass basis, but the JP8’s higher density
means that it has a better Hcomb on a volume basis.
𝑚𝐽𝑃8 = 𝑚𝐿𝑁𝐺 (𝐻𝐶𝑜𝑚𝑏,𝐿𝑁𝐺
𝐻𝐶𝑜𝑚𝑏,𝐽𝑃8) 35
Equation 35 was used to calculate the equivalent mass of JP8 that could be replaced by LNG which is
presented in tabular form in Table 21.
Table 21: JP8 able to be replaced by LNG
JP8 Mass Replaced by LNG JP8 Volume Replaced by LNG
1X 179.9kg (396.6 lbs) 0.39m3 (104.2 gal)
4X 786.1kg (1733 lbs) 1.72m3 (455.4 gal)

63
The values in Table 21 show that a significant amount of JP8 could be removed from the aircraft if it
were also configured to burn LNG that is used to cool the TMS. These estimates were made so that the
engine would still receive the same amount of chemical energy by whichever fuel is supplied at the
moment. This means that if the 139.5kg of LNG used to cool the TMS in the 1X heat load case were then
routed to the engine and burned, then the engine would have required 179.9kg less of JP8.This mass
and volume savings would come on top of those due to component replacement.
Table 22: Total Sizing Change by Changing Aircraft from Legacy TMS to Total LNG
Total Mass Change Total Volume Change
1X -1349.9kg (-2976.1 lb) -1.06 m3 (-281.2 gal)
4X -1432.3kg (-3157.6 lb) -1.28 m3 (-339.2 gal)
Table 22 shows the total mass and volume reductions possible over the mission suggested in Figure 13.
The table also shows that the total LNG system yields a net mass and volume reduction for the 4X heat
load case. The mass and volume of the Total LNG system which adequately thermally managed the
aircraft for this large heat load was less than that of the legacy system which failed to account for the
increase in heat load. While not tested or shown here, had the baseline system been increased in
cooling capacity and size, the total mass and volume change between the Total LNG system and the
baseline would have been far greater in the 4X heat load case.
In addition to the advantages shown using the total LNG system to thermally manage a HEPS; this
system doesn’t require the HEPS. This system could be used on civilian aircraft, or transports which do
not require the HEPS device, but still face a thermal management situation. Using both the phase
change and the temperature change, any aircraft can be thermally managed. An example system would
still remove the traditional TMS architecture and replace it with a LNG based TMS employing two phase
and single phase heat exchangers, a mixing chamber and finally using the LNG as a supplemental fuel for
the primary propulsion system. Obviously, the mass and volume comparison as well as its related
controls comparison would require detailed knowledge and models of aircraft. These studies were not
specifically pursued in this work since it is focused on a more tactical platform, but it is noted that the
total LNG system could show promise in a wide range of applications and environments.
Palletized System – Gas Turbine Powerplant:
The previous studies all incorporated the concept of an integrated LNG system which was shown by the
preliminary studies to have the smallest mass and volume. However, as noted, the integrated systems
have one major drawback; the aircraft is required to supply electrical power to the HEPS. The palletized
systems did not have this problem as they burned the vaporized LNG that was used for cooling to
generate power. The best performing of these palletized options was to use a micro-gas turbine sized to
300kW. This power rating would supply just enough electrical power to power the HEPS. The preliminary
study shows that using a gas turbine of larger size would simply add mass and volume to the system.
The MatLab/Simulink model of this system was designed to be composed of existing parts, many of
which were developed and described earlier in this thesis.
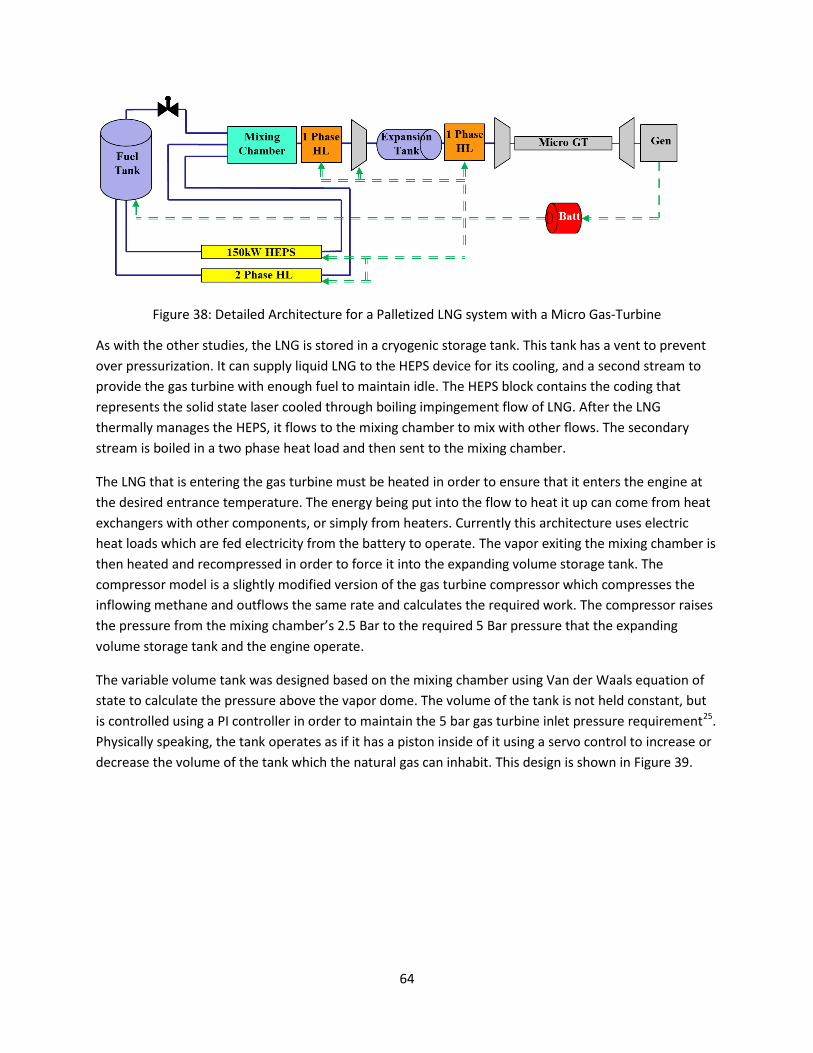
64
Figure 38: Detailed Architecture for a Palletized LNG system with a Micro Gas-Turbine
As with the other studies, the LNG is stored in a cryogenic storage tank. This tank has a vent to prevent
over pressurization. It can supply liquid LNG to the HEPS device for its cooling, and a second stream to
provide the gas turbine with enough fuel to maintain idle. The HEPS block contains the coding that
represents the solid state laser cooled through boiling impingement flow of LNG. After the LNG
thermally manages the HEPS, it flows to the mixing chamber to mix with other flows. The secondary
stream is boiled in a two phase heat load and then sent to the mixing chamber.
The LNG that is entering the gas turbine must be heated in order to ensure that it enters the engine at
the desired entrance temperature. The energy being put into the flow to heat it up can come from heat
exchangers with other components, or simply from heaters. Currently this architecture uses electric
heat loads which are fed electricity from the battery to operate. The vapor exiting the mixing chamber is
then heated and recompressed in order to force it into the expanding volume storage tank. The
compressor model is a slightly modified version of the gas turbine compressor which compresses the
inflowing methane and outflows the same rate and calculates the required work. The compressor raises
the pressure from the mixing chamber’s 2.5 Bar to the required 5 Bar pressure that the expanding
volume storage tank and the engine operate.
The variable volume tank was designed based on the mixing chamber using Van der Waals equation of
state to calculate the pressure above the vapor dome. The volume of the tank is not held constant, but
is controlled using a PI controller in order to maintain the 5 bar gas turbine inlet pressure requirement25.
Physically speaking, the tank operates as if it has a piston inside of it using a servo control to increase or
decrease the volume of the tank which the natural gas can inhabit. This design is shown in Figure 39.

65
Figure 39: Example of Expanding Volume Tank Design
Another method of accomplishing this would be to design an accordion style tank whose size is
controlled by the PI controller or a soft walled tank which can expand in any direction. The tank releases
natural gas to the engine according to its demand, where it is preheated before entering the turbine.
The gas turbine model itself is a ‘simple GT’ which has a single staged compressor and turbine.35 The
gas-turbine is controlled to output the desired power to maintain the battery at full charge and
additional control is used to maintain the engine at a constant RPM. The power generated by the gas
turbine is transferred to the battery with a generator assumption of 90% gas turbine power to
electricity.
The battery in this model is a simplified electricity storage unit. The particular complex interactions
inside of the battery can be added later to increase the realism of the transients analysis. It employs a
simple conservation equation which is in equation 36.
𝑑𝐸𝑛𝑒𝑟𝑔𝑦𝑒𝑙𝑒𝑐𝑡
𝑑𝑡= 𝑃𝑜𝑤𝑒𝑟𝑖𝑛 − 𝑃𝑜𝑤𝑒𝑟𝑜𝑢𝑡 36
Equation 36 tracks the electricity being sent to the battery by the gas-turbine generator as the 𝑃𝑜𝑤𝑒𝑟𝑖𝑛.
The 𝑃𝑜𝑤𝑒𝑟𝑜𝑢𝑡 term represents the sum of electrical loads placed on the battery. As in Figure 38, those
loads include the two-phase heat loads, single phase heat loads, tank heater and the compressor power
as well as the electrical demand by the laser itself. All of these electrical loads are changing with time
based on the LNG flowrates in various conduits, heat demands, laser demands and pressure
requirements. This is obviously a very fluid situation throughout the mission, not to mention the start-up
procedure. The engine control system was designed to maintain the battery at 95% of full charge.
A critical factor in the development of the LNG HEPS system is the transient action of the interacting
components. The palletized system is an excellent testbed to further understand these interactions.
How does the system cope with step changes in power demand and thermal energy? How does the
system startup, or shutdown?

66
Figure 40: LNG HEPS Transient Operation Example
When considering complex interrelated systems, the transient operation is critical. How do the
connected systems respond to various stimuli? While these factors are considered to a certain extent in
the previous integrated cases, they are not fully explored. One reason for this is that the T2T model is a
thermal model with limited electrical modeling. This means that it is unknown how the power demands
of the LNG HEPS system and its related components affect the rest of the aircraft during the mission.
That is why the palletized system is well suited to exploring the transient operation of the LNG system. It
is simpler and enables the creation of a model that explores the thermal as well as the electrical aspects
of a mission.
The startup procedures can be analyzed to enable the gas turbine to start, while at the same time
boiling and heating the LNG to the proper temperature to be used as fuel. In this architecture the
turbine was started at 600 RPM which is 0.5% of the setpoint RPM. A load representing a motor was
placed on the gas turbine shaft to spin it up to the setpoint speed. Control logic was implemented to
shut off fuel flow until the turbine has reached sufficient speed. The motor power is drawn from the
initially fully charged battery. During the laser firing, the engine power demands can be tracked and
managed so that the HEPS is provided with enough electricity to operate. Power demands from the
other heater systems can also be tracked and they in turn add additional power demands to the power
generator. The lessons learned with this model in terms of transient operation can then be applied
when the T2T model is expanded to also include more detailed electrical models. Understanding the
transients of operation is critical to moving forward with designing a system of this type.
Unlike the integrated systems, the palletized system performance cannot be evaluated by the
temperature of other components in the APTMS. Other metrics will have to be found and used. The
palletized system has its own engine to provide power, and that engine will be able to give indications
HEPS

67
on the performance of the system. As with the previous cases, the HEPS temperature itself will be
monitored to ensure that the laser remains within the 6K margin of operation. Furthermore, the LNG
tank level will be monitored to see not only the final amount of LNG used, but also when the LNG is
leaving the tank.
Since the palletized system is not integrated into the aircraft, the basic system is versatile and can be
applied to a number of applications. The palletized system is a self-contained power and thermal
management solution to a laser which can be put on a variety of platforms. As such, the mission
parameters can be varied to show this versatility. The first mission will use the same laser profile as the
previous integrated cases. This laser profile without the aircraft speed and altitude plots can be seen in
Figure 41.
The figure shows a laser firing profile that is 4 clusters of 6 activations. Each laser activation is
represented by 6 seconds of full power lasing and 6 seconds cool down time, giving a grand total of 144
seconds of lasing. At each lasing cluster, the temperature rise due to laser activation must be checked to
ensure that it does not rise more than the allowed 6K. The temperature over one cluster is shown in
Figure 42.
Figure 41: Palletized Mission 1 Profile

68
Figure 42: Laser Temperature Profile for Mission 1
Figure 42 shows that the initial temperature rise is over the 6K margin by about 1K, but the subsequent
laser activations show a temperature rise within margin. This same pattern is reflected in all clusters in
this mission and clusters from the previous integrated study. Also, as with the integrated study the
temperature increases during each activation level out by the third activation indicating that the system
could lase more than the 6 times depicted here without fearing a thermal overload.
The main LNG tank level is also monitored to see if the system is functioning correctly. The plot of the
LNG level in the main tank is shown in Figure 43

69
Figure 43: Main LNG Tank Fluid Level for Mission 1
In Figure 43, the times of the laser activation are clearly shown by the sharp decreases in LNG levels over
the mission. According to the figure, 53.6kg of LNG was consumed over the mission. This is only
considering the LNG which leaves the main storage tank. Any natural gas accumulated in various other
subsystems at the end of the mission is considered as used. An interesting observation is that unlike the
Total LNG system, where LNG is used from this tank throughout the mission, there are long portions of
time where the LNG level remains constant. These times are between the laser activations when the
engine is using LNG that is contained in the expanding volume tank described earlier in this section. This
is why that apart from the laser activation times, the LNG level only decreases at the beginning of the
mission. At this time, the expanding volume tank is near empty and the engine requires fuel from this
main tank rather than the expanding volume feeder tank. Proof of this is found in the mass of natural
gas contained in the expanding volume tank as demonstrated by Figure 44.

70
Figure 44: Expanding Volume Tank Fluid Level for Mission 1
Figure 44 shows the reasons for the main LNG Tank level remaining constant between laser activations.
At the beginning of the mission, before the first laser cluster, the expanding volume tank has a minimum
of LNG inside it. Therefore, during this segment of the mission, the gas turbine must be fed from the
main fuel tank, which causes that slow level drop at the left side of Figure 43. Then as soon as the laser
activation cluster happens, there is a surplus of natural gas in the expanding volume tank. This is
because more LNG is required to cool the laser during its operation than is required to fuel the gas
turbine. In Figure 44, it can also be seen that after the laser activation cluster, the engine is using the
expanding volume tank as the fuel source rather than the main LNG tank. This is shown by the
decreasing level in the expanding volume tank, while the main LNG tank remains at a constant level
between the clusters. Also, a point to note, the expanding volume tank clearly ends the mission
containing some natural gas that is not burned, but no longer is in the main fuel tank. For this analysis, I
am considering this LNG trapped in the expanding volume tank as used, since it is no longer in a liquid
state in the main LNG storage tank.
In addition to the fuel levels, the engine performance is also a critical evaluation parameter in the
palletized system cases. Two of the engine performance parameters are shown in Figure 45.

71
Figure 45: Gas Turbine Power in Mission 1
Figure 45 shows the power demanded of the engine by its controller and then the actual power
generated by the engine. Obviously, the peak power demands are during the times of laser activation.
This is not only because the laser is a big draw on the palletized system’s electrical system, but also all of
the heaters and the compressor that draw more power when the flowrate is increased. Another
important point of this graph is to notice that the demands peak at about 225kW, while the actual
power generated peaks at only 200kW. This is due to a certain amount of lag in the gas turbine and its
control system. The engine model is incapable of instantly achieving the power demands when they
increase as quickly as these do. Therefore, the controller on the fuel flow brings up the generated power
as quickly as possible, but by the time it is nearing the demanded power, the power demand drops as
the laser turns off. This is the reason that the battery was incorporated into this model. The battery
accounts for any shortcoming of power generation that the gas turbine cannot provide. This is an
important lesson for any model being designed for transient operation. The battery’s contribution
during mission 1 is shown in Figure 46.

72
Figure 46: Battery Charge for Mission 1
Figure 46 shows that the battery has a high amount of discharge at the beginning of the mission due to
the starter motor. The gas turbine then replenishes the power back up to a setpoint of 95% of the
battery maximum charge. The battery was sized to have a maximum charge of 4000kJ. The power
generation deficit during the laser activation periods is clearly shown in Figure 46 when the battery runs
down in power.
The second mission that was developed to show the versatility of the palletized system incorporates a
shorter laser pulse, but activated more times. Figure 47 shows this profile.

73
Figure 47: Palletized Mission 2 Profile
The second considered palletized mission uses 6 clusters of 6 laser activations. But this time, the laser is
only activated for 2 seconds and off for 2 seconds giving a total lasing time of 72 seconds. In this case
the laser clusters were evenly spaced out throughout the mission. This mission is intended to show that
the palletized system can handle an increased number of shorter activations where the constant
switching from on to off might cause a problem.
Since this mission has a different lasing time, the laser temperature profile during the mission was
checked to ensure the 6K range of operation. This is reflected in Figure 48.

74
Figure 48: Laser Temperature Profile for Mission 2
The laser temperature profile graph in Figure 48 is different looking than the Mission 1 plot in Figure 42.
The mission 2 laser temperature graph clearly shows the sharp temperature rise during the initial
activation, which is less than the 6K margin. But, unlike the previous cases, the temperature fails to drop
all the way back to the starting temperature during the cool off period. Fortunately, the temperature is
trending downward after the second laser activation which indicates that this system will not succumb
to a thermal runaway situation. Each laser activation also remains within the allowed temperature
margin using the same controls as the palletized system from mission 1.
Once the laser was checked for its operation, the rest of the palletized system could be evaluated.
Figure 49 shows the LNG level in the main LNG storage tank throughout the mission.

75
Figure 49: Main LNG Tank Fluid Level for Mission 2
Figure 49 shows many of the same trends that the mission 1 fuel level graph showed. According to the
figure, 34kg of LNG was consumed over the mission. The laser activations are clearly marked by the
sharp decreases in fluid level. In Figure 49, this occurs 6 times rather than the 4 times in the previous
mission due to the increased number of laser activation clusters. Also, before the first laser activation,
LNG is used from the main tank to power the gas turbine, while after the first laser activation the gas
turbine can be fueled from the expanding volume tank. The contents of this tank can be seen in Figure
50.

76
Figure 50: Expanding Volume Tank Fluid Level for Mission 2
Figure 50 shows that at the beginning of the mission, the expanding volume tank is empty. This explains
why the engine had to draw natural gas from the main storage tank and why that level is decreasing at
the beginning. Figure 50 also shows that after the first laser activation, there is sufficient natural gas in
the expanding volume tank to fulfill the gas-turbine’s requirements. These requirements by the gas-
turbine are determined by the power demand based on the battery charge level. Figure 51 shows the
gas turbine power generation and demands.

77
Figure 51: Gas Turbine Power in Mission 2
Figure 51 shows that the gas turbine power demand had lower peak values when compared to the
previous mission. This is due to the laser’s short pulses in mission 2. The power demanded of the turbine
greatly increases during the laser activation clusters. This is also represented in the power generation
plot. As with the previous mission case, the power generated is slightly lower than the power demanded
representing the transient aspects of the gas turbine and its control system. The engine demand is
based on the battery charge level, which is Figure 52.

78
Figure 52: Battery Charge for Mission 2
The mission 2 battery charge chart in Figure 52 shows the electrical drain at the beginning of the mission
due to the gas turbine starter motor. The engine controller then recharges the battery and the next
drains are from the laser activation clusters. The charge drops due to the gas turbine not quite
generating as much power as is demanded, but the battery charge levels do recover in short order after
the clusters.
A third and final mission configuration was developed which used longer lasing pulses. The profile for this case is in Figure 53.

79
Figure 53: Palletized Mission 3 Profile
The third palletized mission reduces the number of activation clusters to 4. Each cluster is 6 activations
of a longer 8 seconds on and 8 seconds off giving a total lasing time of 192 seconds. In this case the laser
clusters were evenly spaced out throughout the mission. The purpose of this mission is to show the
capabilities of the system to manage longer laser pulses. The thermal management system might have
difficulties with the longer lasing pulses. Figure 54 shows the temperature profile for the laser cold plate
during one of the laser clusters on mission 3.

80
Figure 54: Laser Temperature Profile for Mission 3
On the surface, the laser profile in Figure 54 looks similar to that of Figure 42 from mission 1. Due to the
longer laser pulses, the temperature does rise a bit more than the 6K allowed by about 0.5K. A reason
for this is that the temperature control and all the sizing values remained unchanged from the previous
two missions. Had the sizing and controls been updated, then the 6K margin could have remained
unviolated, but the values were held constant across all mission cases in order to make the system
performance directly comparable. Therefore, though the temperature is slightly out of range, the other
parameters of the system will be compared for mission 3. Figure 55 shows the fluid level in the main
LNG storage tank.

81
Figure 55: Main LNG Tank Fluid Level for Mission 3
The general trend shown in Figure 55 is similar to those from the previous two missions. According to
the figure, 67.7kg of LNG was consumed over the mission. The initial portion of the mission is also
characterized by a slow draining of the LNG from the main storage tank until the expanding volume tank
is filled during the laser activation. The laser activation times are clearly discernable by the sharp drops
at for evenly spaced times throughout the mission. These high usage times are reflected by a sharp
increase in mass contained in the expanding volume tank shown in Figure 56.

82
Figure 56: Expanding Volume Tank Fluid Level for Mission 3
Figure 56 confirms the observations made regarding Figure 55. The expanding volume tank begins at a
nearly empty state and as a result the gas turbine must draw fuel from the primary LNG storage tank.
This is true until the first laser activation cluster, which adds a significant amount of LNG into the
expanding volume tank. The LNG stored as a vapor in the expanding volume tank is then used to fuel the
engine for the remainder of the mission, which is why the main tank shows no level change between the
laser activation clusters. Figure 57 examines the engine performance during mission 3.

83
Figure 57: Gas Turbine Power in Mission 3
Figure 57 demonstrates the high demands on the power system while the laser is active. The power
demands in this system were higher than the other two systems because the laser is active for longer
during each pulse. The power must be provided to the laser itself and to all the other flow systems such
as the compressor and various heating systems. As with the previous cases, the power demand isn’t
quite met by the actually generated value due to the transient nature of the control system. But this
power lacking is made up for by the battery which will continue to provide power to the electronic
systems as long as it has charge. The charge was monitored and plotted in Figure 58.

84
Figure 58: Battery Charge for Mission 3
Figure 58 reiterates the trends noticed in the previous battery charge plots. The initial battery drain
from the gas turbine starter and the large charge drops during the laser activation time periods are still
clearly noticeable. This graph shows that compared to the previous mission cases the charge drain
during laser activation clusters was much more. This is attributable to the increased lasing time of
mission 3, which will cause the laser to use more power and the increased flowrate of LNG throughout
the architecture will also draw more power.
The three missions can be compared based on the amount of LNG used in each mission. This is shown in
Table 23.
Table 23: Palletized LNG System LNG Consumption Comparison
Mission Lasing Time [sec] LNG Used [kg]
1 144 53.6
2 72 34.0
3 192 69.7
Mission 2 used the least LNG because it had the shortest lasing time, while the mission 3 case used the
most. Each of the three missions used a surprisingly small amount of LNG compared to the integrated
cases explored earlier. While this architecture did not require the LNG to cool other external systems,
the LNG also had to adequately supply a gas turbine with fuel throughout the mission. Less natural gas is
required to power the system that is required to cool the HEPS device. This is why there is a surplus of
natural gas contained in the expanding volume tank at the end of the mission which must be considered
as used.

85
This palletized system demonstrated several critical concepts which are important results in themselves
and vital for future research into this technology. The architecture described in Figure 38 and its related
control system was found to be robust. The exact same system, architecture and controls, was used in
all three missions. No PI controller constants were changed, the battery and LNG tank sizing remained
constant and the engine controls and sizing parameters were unchanged. This allows for good
comparisons to be made between the mission results and suggests that the same architecture could be
subjected to more rigorous missions. It was able to thermally manage the HEPS and manage the power
system as well using the gas turbine. The other key result from this study is that while difficult to
control, transient modeling of a similar system is clearly possible. Not only does this model consider the
thermal and power requirements of the system, but also completes a gas turbine startup routine. At the
beginning of each mission, the engine is at a very low RPM (600RPM) relative to its steady state set
point. An electrical motor is then used to spin up the turbine to operating speed where the other engine
controllers take over and manage it as normal. The electrical motor draws its power from the battery,
which begins the mission at a full charge. This sort of transient engine modeling is critical for T2T studies
which model not only the thermal systems, but also the power too.
The concept of a palletized system would open the doors to easy implementation of a LNG HEPS.
Variants of the general palletized design could be adopted to fulfill a wide range of roles on different
platforms from land to sea to air based systems. Rather than having to design an aircraft or ship with an
LNG HEPS in mind from the beginning, the palletized system allows for easy retrofitting of this capability
to existing hardware. Also, any platforms currently being designed using legacy TMS systems wouldn’t
have to be removed from service. The palletized system would make these vehicles more easily
upgradable and enable them to remain in service thus not requiring the high costs of vehicle redesign
and replacement.
Conclusions: The future of aircraft is bright. Cutting edge advancements are improving aircraft performance across
the spectrum of vital parameters. These include speed, range, endurance, maneuverability and
capability among others. Improvements come in different forms; more sensors to communicate
information to the ground and pilot, electronic actuation for control surfaces enabling quicker and
further movement, larger and more complex systems giving the aircraft more detailed information and
control over its actions, among others. Unfortunately, each one of these improvements comes at a cost.
A cost associated with many of these advancements in technology is an increased power requirement
and an increased amount of heat generated. The power onboard the aircraft comes from the generator
which is powered by the main propulsion system. Obviously, if more electrical power is required, this
generator will need to be sized up, increasing is mass and volume and the generator will take more
energy from the engine’s propulsive power to convert into electricity. Furthermore, a goal is to transfer
all the thermal loads of the aircraft to a signal sink, the engine exhaust. Typically this is done by either
heat exchangers into the engine air flow, or transferring the heat into the fuel before it is burned. One
way that heat is transferred to either the engine flow or the fuel is through the use of either a VCS or
IPP11,12. Besides adding mass and volume to the aircraft, these systems also pose a drain on the engine.

86
The IPP draws bleed air or requires electricity to spin it and the VCS also requires electrical power to
operate. Unfortunately, the limit of the amount of heat that can be transferred by the aforementioned
systems while keeping them at a reasonable size is being reached. A new, novel method of transferring
this heat is needed if the loads continue increasing as projected2.
One particular advancement that is studied in this thesis is the addition of a HEPS device, an example of
which is a high powered laser. In this case, the laser being modeled is a solid state laser sized to 150kW.
Like many of the other aircraft improvements, this one will potentially be a significant drain on the
power system of the aircraft and its thermal management system as evidenced by Figure 3. In order to
mitigate this load increase, while maintaining the same increase in capability that a high powered laser
would give and aircraft, the laser efficiency should be increased. Solid state lasers show a trend of
increased efficiency when they are operated at cryogenic temperatures, up to 60%, which is a significant
improvement over the 20% efficiency at room temperature8,9. The proposed solution is to use the Hvap of
LNG to maintain the laser at cryogenic temperatures and maintain its higher efficiency.
This proposal would require the design of an entire LNG storage and delivery system since LNG is not a
usual aircraft fluid. In order to perform some preliminary mass and volume studies, a system design was
compiled for four cases. The initial system design included several key components, including a
cryogenic tank. After the LNG leaves the cryogenic tank it passes through the HEPS laser device where it
is boiled. Then, three of the four preliminary cases employed the LNG’s capability as a fuel for a power
plant which would feed electricity to the HEPS. The powerplant is where the LNG flows after the HEPS,
or in the integrated case, it flows into heat exchangers with the traditional aircraft TMS. For each case,
the mass and volume of the system was calculated in relation to the desired amount of lasing time. The
size of the system was found to increase linearly with the lasing time. Using one hour of lasing time as
the comparison metric, the integrated case without a powerplant was found to be the smallest and
lightest, followed by the palletized 300kW micro gas-turbine. The integrated system is the lightest for
two reasons: the lack of a heavy powerplant, and the fact that the LNG can be used at a lower pressure
where it has a higher Hvap. Regardless, the preliminary results showed enough promise that continued
study was warranted.
The more detailed studies were conducted using MatLab/Simulink. Using this program enabled the LNG
systems to be studied with a T2T model of a generic aircraft. The T2T model integration helped with
optimization to maximize the benefits of the LNG system to the entire aircraft, or at least minimize its
negative effects. For this study to be conducted, models of each of the LNG components were
developed. The cryogenic storage tank was developed to obey the conservations of mass and volume. It
has the capability to track the quality and specific enthalpy of the LNG inside it which is maintained at
saturation. The HEPS model also has to obey the conservation laws. It was designed to model heat
transfer from a cold plate by two phase impingement flow and track the two phase properties of the
LNG contained within it. The final block developed is a mixing chamber to combine liquid and vapor
flows from the aforementioned blocks into a single flow for either the powerplant or TMS heat
exchangers. These blocks were designed in such a way that they can be easily integrated into a T2T
model to see the vehicle level effects of the entire aircraft.

87
The first MatLab/Simulink studies were conducted on a system that became known as the ‘Basic LNG’
system. The LNG system was fully integrated into the aircraft’s existing TMS, which means that the
aircraft will have to supply the electrical power. This system’s sole responsibility was to cool the HEPS.
This means that LNG flowed only during the laser’s operation. The HEPS operation itself and the effect
that the LNG had on the overall aircraft were analyzed. It successfully managed the HEPS temperature
within the allowed range of variance. Furthermore, it was shown that the LNG provided a significant
amount of cooling capability to the aircraft PAO loop while the LNG was flowing, while the laser was
activated. Further testing of higher heat loads that might be found in future aircraft showed that the
LNG does help with the thermal management, but does not succeed in preventing the aircraft systems
from overheating. These results initiated another set of testing to see if the LNG can be used more to
manage the heat in the aircraft PAO loop of its TMS.
The secondary study architectures were called the ‘Enhanced LNG’ system. This was because the basic
LNG system was expanded to not only service the HEPS, but also flow a secondary stream of LNG at 0.3
kg/s to another system where it is boiled. The LNG then returns from either the fuel recirculation line or
the engine bypass stream to be mixed in the mixing chamber and used to cool the aircraft PAO loop. The
phase change in the fuel recirc or the third stream was shown to have a significant effect on the
temperatures of either of those systems. Then the constant flow of LNG cooling for the PAO loop
showed a large drop in temperature from the baseline without LNG or a HEPS. This result was echoed
when the heat load was increased. Where the basic LNG system totally failed to thermally manage the
higher loads, the enhanced system coped throughout the bulk of the mission, only failing at the
thermally constraining point. The conclusion that can be drawn from this is that with a flow dedicated to
cooling any additional systems, these additional heat loads can be managed successfully by the use of
LNG. Another key fact found in this study was that since the LNG was providing a significant heat sink to
the TMS, the legacy TMS mechanical systems (IPP and VCS) did not have to provide nearly as much work
to cool the aircraft. Does this mean that if the LNG system were modified and improved, could it
thermally manage the entire aircraft without the need for assistance from the IPP or VCS?
In order to investigate the full potential of the LNG cooling system, another LNG TMS architecture was
developed to thermally manage the entire aircraft using LNG as the primary coolant. This design was
called the ‘Total LNG’ system because of the scope of its cooling. For this study the IPP and VCS were
eliminated along with many of their heat exchanger systems. This change thoroughly simplified the
aircraft TMS. This system, an improvement over the enhanced LNG system because of a more
sophisticated control system, was able to thermally manage the entire aircraft without the legacy
components. Furthermore, it was able to do this while boasting a mass reduction of 1333kg and volume
reduction of 1.03m3 if one takes the legacy components removed and the JP8 that can be replaced into
account. Unlike all of the previous cases including all of the LNG systems, the total LNG design was able
to cope with the simulated futuristic heat load by simply increasing the volume of LNG carried. There
were no changes to architecture nor controls. On this higher heat load case, the total LNG system
carried a significant mass and volume reduction when the same considerations are made for component
removal and JP8 replacement. Besides the sizing gains and the thermal management potential, the total
LNG system also showed that the aircraft powerplant would perform better under this architecture. The

88
total LNG system required significantly less bleed air from the engine to operate. This is due to the
removal of the IPP, which demanded a large amount of bleed air. Reducing the engine bleed will
improve engine performance because it is reducing a drain on engine power. Finally, this design shows
significant promise for all classes of aircraft. A total LNG system could be designed to be used on a
commercial aircraft which does not feature a HEPS, but still requires significant thermal management.
This design is also more easily upgradable than the legacy system. If an aircraft receives electronics
upgrades that increase the heat load, it is simpler to increase the volume of LNG stored on board than to
increase the cooling capability of an IPP or VCS which requires major redesign of systems. The total LNG
system has shown itself to be capable in a wide range of applications while effectively thermally
managing a variety of heat loads and providing a size reduction and simplification to the TMS system.
A final architecture was considered. This design took full advantage of the LNG as a fuel as well as a
coolant. It used the LNG to cool the HEPS system and then burn it in a gas-turbine to provide power to
the laser and other components. This design explored the transient operation of the system by using a
start-up procedure and incorporating the power system in addition to the thermal system explored in
the previous studies. In order to accomplish these goals, several components were added to the model
such as one and two phase heat loads, a compressor, a gas turbine and generator, and a battery. The
architecture, along with its control system, was designed and tested to operate from startup through a
mission. Three different missions were designed with laser activation clusters of various laser activation
lengths to see how the thermal and power system reacted to changes in how the laser was used. The
system, unchanged, was able to cope with the transient operation and all three missions. The lessons
learned in the development of this architecture can be applied to making more complex model systems
transient and improving the transient response of this system. The palletized system as a concept shows
promise for several reasons. Unlike the integrated systems also examined in this document, the
palletized system could be added to any existing vehicle with negligible changes to the vehicle itself. This
is because the palletized system requires nothing from the parent craft, no electrical power or cooling.
Enabling any vehicle to be upgraded with this power and HEPS unit would lengthen the lifecycle of
existing vehicles, not requiring costly design and development of new vehicles to include HEPS type
devices or other high heat loads.
This novel method of thermal management shows promise to being either the solution or part of the
solution to the increasing problem of thermal management aboard aircraft. Each of the LNG systems
showed that they could adequately thermally manage the HEPS device and the integrated systems
showed that they could provide significant cooling to the other aircraft systems. The results on the
integrated architectures, especially the total LNG system, show promise for solving the problems of
future aircraft. The total LNG system showed that if properly integrated, the LNG system could thermally
manage a whole aircraft. This system also showed that it could cope with increased thermal loads that
will be on future aircraft from upgraded avionics systems. Unfortunately, the total LNG system would
only be a viable system to be placed on an aircraft either currently in the conceptual stage or one that is
merely in preliminary design since it requires a totally different thermal management architecture. The
total LNG system would be difficult to integrate into an existing vehicle that is currently using the legacy
thermal management systems. To solve this problem, the palletized system was developed. Because the

89
palletized system does not require any connections from the parent aircraft, it can be added to the
existing vehicle easily. This addition will add the benefits of a HEPS device without forcing a redesign on
the rest of the vehicle. Thinking of natural gas as a coolant rather than simply as a fuel can open the
doors to many future technologies. The results from the architectures and cases analyzed in this thesis
prove that this concept has promise and further investigation into its actual design and implementation
is warranted.

90
References: 1 Derrien, J., “Electromechanical Actuator (EMA) Advanced Technologies for Flight Controls,”
International Congress of the Aeronautical Sciences, pp. 1–10.
2 Iden, S., “Integrated Vehicle Energy Technology (INVENT) Overview,” IEEE Annual Meeting, Cincinnati, Ohio: 2012, pp. 1–19.
3 Bass, M., and Koechner, W., Solid-State Lasers : A Graduate Text, 2002.
4 FDA, U., “CFR - Code of Federal Regulations Title 21” Available: http://www.accessdata.fda.gov/scripts/cdrh/cfdocs/cfcfr/CFRSearch.cfm?fr=1040.10.
5 Shaver, D., “High Energy Liquid Laser Area Defense System (HELLADS)” Available: http://www.darpa.mil/program/high-energy-liquid-laser-area-defense-system.
6 Warwick, G., “General Atomics: Third-Gen Electric Laser Weapon Now Ready,” Aviation Week Available: http://aviationweek.com/technology/general-atomics-third-gen-electric-laser-weapon-now-ready.
7 Grill, E. M., “Airborne Laser Returns for More Testing” Available: http://www.afmc.af.mil/news/story.asp?id=123038913.
8 Chen, Z., Dong, W., Guan, X., Elim, S., Zhang, S., Grimshaw, M., Leisher, P., and Kanskar, M., “76 % efficient cryogenically-cooled eyesafe diode laser for resonant pumping of Er-doped gain media,” SPIE 8640 Novel In-Plane Semiconductor Lasers XII, 2013.
9 Chen, Z., Dong, W., Grimshaw, M., Defranza, M., and Leisher, P., “Conversion Efficiency Optimization of Cryogenically Cooled 15xx nm InP Diode Lasers,” Optical Society of America, 2011, pp. 1–2.
10 Fan, T. Y., Member, S., Ripin, D. J., Aggarwal, R. L., Ochoa, J. R., Chann, B., Tilleman, M., and Spitzberg, J., “Cryogenic Yb 3 + -Doped Solid-State Lasers,” IEEE Journal of Selected Topics in Quantum Electronics, vol. 13, 2007, pp. 448–459.
11 Roberts, R. a, and Eastbourn, S. M., “Vehicle Level Tip-to-Tail Modeling of an Aircraft,” International Journal of Thermodynamics, vol. 17, Mar. 2014, pp. 107–115.
12 Roberts, R. a., and Decker, D. D., “Control Architecture Study Focused on Energy Savings of an Aircraft Thermal Management System,” Journal of Dynamic Systems, Measurement, and Control, vol. 136, Mar. 2014, p. 041003.
13 Wolff, M., “Integrated Thermal / Power / Propulsion / Vehicle Modeling Issues Related to a More Electric Aircraft Architecture,” pp. 1–26.
14 Shimmin, K., Russell, G., Reuter, R., and Iden, S., “Development and Performance of a Reduced Order Dynamic Aircraft Model,” SAE Technical Paper 2015-01-2415, 2015.
15 Donovan, A. B., Roberts, R. A., and Wolff, M., “Fuel Pump Trade Study for a Conceptual Design of an Integrated Air Vehicle System,” Propulsion and Energy Forum 2015, 2015, pp. 1–9.
16 Donovan, A. B., Nuzum, S. R., Roberts, R. A., and Wolff, M., “Impact of High Energy Pulsed Systems on an Aircraft’s Power and Thermal Management System,” AIAA Science and Technology Forum and Exposition 2016, 2016.
17 Corbett, M. W., “Effects of Large-Scale Transient Loading and Waste Heat Rejection on a Three

91
Stream Variable Cycle Engine,” Wright State University, 2011.
18 Reuter, R. A., Iden, S., Snyder, R. D., and Allison, D. L., “An Overview of the Optimized Integrated Multidisciplinary Systems Program,” AIAA Science and Technology Forum and Exposition, 2016, pp. 1–11.
19 Chakraborty, I., Mavris, D. N., Emeneth, M., and Schneegans, a., “An integrated approach to vehicle and subsystem sizing and analysis for novel subsystem architectures,” Proceedings of the Institution of Mechanical Engineers, Part G: Journal of Aerospace Engineering, vol. 0, 2015, pp. 1–19.
20 Tomsik, T. M., Johnson, W. L., Smudde, T. D., Femminineo, M. F., and Schnell, A. R., “A Densified Liquid Methane Delivery System for the Altair Ascent Stage,” AIAA SpaceOps 2010, 2010.
21 Roberts, R. A., Nuzum, S. R., and Wolff, M., “Liquefied Natural Gas as the Next Aviation Fuel,” Propulsion and Energy Forum 2015, 2015, pp. 1–10.
22 Klein, S. A., “Engineering Equation Solver,” 2014.
23 Cengel, Y. A., and Cimbala, J. M., Fluid Mechanics: Fundamentals and Applications, New York: 2010.
24 Capstone, “C15 MicroTurbine Natural Gas,” vol. 3, pp. 14–15.
25 Capstone, “C65 ICHP MicroTurbine Natural Gas,” pp. 6–7.
26 Capstone, “C200 MicroTurbine High-pressure Natural Gas,” vol. 2, pp. 4–5.
27 Capstone, “C600 600kW Power Package High-pressure Natural Gas,” vol. 2, pp. 4–5.
28 Capstone, “C1000 Megawatt Power Package High-pressure Natural Gas,” vol. 2, pp. 4–5.
29 GE Aviation, “T700-401C / -701C” Available: http://www.geaviation.com/military/engines/t700/.
30 GE Aviation, “T700-701D” Available: http://www.geaviation.com/military/engines/t700/.
31 GE Aviation, “T700-701K” Available: http://www.geaviation.com/military/engines/t700/.
32 GE Aviation, “T700/t6a & t700/6a1” Available: http://www.geaviation.com/military/engines/t700/.
33 Rolls-Royce, “CTS800” Available: http://www.rolls-royce.com/customers/defence-aerospace/products/uav/cts800.aspx#engine-specifications.
34 Chart Industries INC, “HLNG VEHICLE TANKS,” 2014.
35 Sinnamon, R. R., “Analysis of a Fuel Cell Combustor in a Solid Oxide Fuel Cell Hybrid Gas Turbine Power System for Aerospace Application,” Wright State University, 2014.
36 Browne, E. A., Jensen, M. K., and Peles, Y., “Microjet array flow boiling with R134a and the effect of dissolved nitrogen,” International Journal of Heat and Mass Transfer, vol. 55, 2012, pp. 825–833.
37 Cengel, Y. A., and Boles, M. A., Thermodynamics: An Engineering Approach, 1998.
38 Nuzum, S. R., Donovan, A., Roberts, R. A., and Wolff, M., “Dynamic Modeling at a Vehicle Level of a Cryogenic Based Thermal System for a High Powered System,” AIAA Science and Technology Forum and Exposition 2016, 2016, pp. 1–15.

92
39 Ghanekar, M., “Vapor Cycle System for the F-22 Raptor,” 30th International Conference on Environmental Systems, Toulouse, France: 2000.
40 Schmitigal, J., and Tebbe, J., “JP-8 and other Military Fuels,” DTIC Document, 2011.
41 Coordinating Reseach Council Incorperated, Aviation Fuel Properties, Atlanta, Georgia: 1983.
42 U.S Deparment of Energy, “Alternative Fuels Data Center – Fuel Properties Comparison,” 2014, pp. 1–4.