Embed Size (px)
Citation preview

novembro 2015
Ferdi Iulian Osman
Airport pavements evaluation
Dissertação para obtenção do Grau de Mestre em Estruturas e
Geotecnia
Orientador: Prof. Doutora Simona Fontul
Júri: Prof. Doutor João C. G. R. Almeida
Arguente: Prof. Luís M. T. Quaresma
Vogal: Prof Doutora Simona Fontul


I
Airport pavements evaluation
Abstract
The airport pavement deteriorates during service due to traffic and climate effects therefore
systematic monitoring is required in order to assess their structural and functional condition.
The aim of this work is to present the methodologies used nowadays for airport pavement
evaluation and to contribute to their improvement in structural analysis area
The main aspects that are addressed are the application of the Ground Penetrating Radar (GPR)
and the use of the Falling Weight Deflectometer (FWD) tests, for structural evaluation, and the
use of the GRIP tester and the measurement of texture depth of the wearing course layer, for the
functional evaluation of the runway.
Also, freeware computer softwares used to design new runways (FAARFIELD and COMFAA)
are presented and examples are given.
Case studies are described both for structural and functional evaluation.

II

III
Avaliação de pavimentos aeroportuários
Resumo
Os pavimentos aeroportuários sofrem ao longo do tempo degradações das suas características
funcionais e estruturais. A monitorização destas características e o planeamento das medidas de
reabilitação requerem campanhas periódicas de auscultação.
O objetivo do presente trabalho foi de analisar as metodologias utilizadas atualmente para a
caracterização funcional e estrutural de pavimentos aeroportuários.
Procurou-se ainda avaliar a eficiência da utilização de equipamentos de auscultação de alto
rendimento desenvolvidos nos últimos anos, aperfeiçoar as técnicas de interpretação e as
metodologias de ensaio e elaborar recomendações relativas a utilização destes métodos. Assim
para avaliação estrutural são apresentados os equipamentos Radar de Prospeção e Defletómetro
de Impacto e para avaliação de características funcionais o GRIP tester e a medição da
profundidade de textura.
Dois programas livre FAARFIELD e COMFAA, desenvolvidos recentemente, para avaliação de
pavimentos são também apresentados, junto com exemplos para a sua melhor utilização.
São apresentados exemplos de casos de estudo, para uma melhor exemplificação tanto para a
avaliação estrutural como para funcional.

IV
Acknowledgements
This work has been developed at Laboratório Nacional de Engenharia Civil (LNEC), under the
supervision of Dr. Prof. Simona Fontul, Research Officer at LNEC.
The Institutions who contributed to the completion of this thesis are gratefully acknowledged:
The Laboratório Nacional de Engenharia Civil for providing material for this research.
The Universidade „Nova” Lisboa, Departatmento de Engenharia Civil of Faculdade de
Ciências e Tecnologia for the continuous support.
The author wishes to express his gratitude to all persons who have given help and advice in this
research, in particular, to Dr. Prof. Simona Fontul and Dr. Prof. Corneliu Cismasiu, for their
excellent supervision, guidance, support and continued encouragement during this study.
The author highly acknowledges the assistance, support and patience of his family, in particular
to his parents, Venera and Nazif. A special thanks goes to his soul mate, Bianca, and to her
parents, Liana and Marin, for the encouragement shown during these years and for make him
feel like home.
The author wishes to dedicate this work to his grandparents, Steliana and Dumitru.

V
Airport pavements evaluation
Index
1 INTRODUCTION ............................................................................................................................................ 1
1.1 BACKGROUND ..................................................................................................................................................... 1
1.2 OBJECTIVES ......................................................................................................................................................... 2
1.3 OUTLINE OF THE DISSERTATION ............................................................................................................................... 2
2 AIRPORT PAVEMENT EVALUATION ............................................................................................................... 4
2.1 AIRPORT PAVEMENTS – FUNCTIONS AND PURPOSES .................................................................................................... 4
2.2 SOIL INVESTIGATION AND EVALUATION ..................................................................................................................... 5
2.3 DESIGN CONSIDERATIONS. FAARFIELD SOFTWARE PRESENTATION ................................................................................ 8
2.4 PURPOSES OF PAVEMENT EVALUATION ................................................................................................................... 12
2.4.1 Flexible pavement evaluation .............................................................................................................. 19
2.4.2 Rigid pavement evaluation .................................................................................................................. 19
2.5 SYNOPSIS .......................................................................................................................................................... 20
3 FUNCTIONAL EVALUATION ......................................................................................................................... 22
3.1 GENERAL PRESENTATION OF THE CASE STUDY ........................................................................................................... 22
3.2 BRIEF DESCRIPTION OF THE FLEXIBLE RUNWAY .......................................................................................................... 23
3.3 VISUAL INSPECTION OF THE RUNWAY ...................................................................................................................... 23
3.4 FRICTION COEFFICIENT MEASUREMENT ................................................................................................................... 24
3.4.1 Methodology ........................................................................................................................................ 24
3.4.2 Results .................................................................................................................................................. 24
3.5 MEASUREMENT OF RUNWAYS TEXTURE DEPTH ......................................................................................................... 25
3.5.1 Methodology ........................................................................................................................................ 25
3.5.2 Results .................................................................................................................................................. 26
3.6 SUMMARY OF RESULTS ........................................................................................................................................ 27
4 STRUCTURAL EVALUATION OF FLEXIBLE PAVEMENTS ................................................................................ 28
4.1 LOAD TESTS USING THE FALLING WEIGHT DEFLECTOMETER ........................................................................................ 28
4.2 TESTS USING THE GROUND PENETRATING RADAR ..................................................................................................... 30
4.3 DIVISION IN SUBSECTIONS .................................................................................................................................... 30

VI
4.4 ASPHALT BORING TESTS ....................................................................................................................................... 33
4.5 DEFINING THE STRUCTURAL BEHAVIOUR MODEL ....................................................................................................... 33
5 STRUCTURAL EVALUATION OF RIGID PAVEMENTS ..................................................................................... 36
5.1 BRIEF DESCRIPTION OF THE STUDIED RIGID PAVEMENTS .............................................................................................. 36
5.2 LOAD TESTS USING THE FALLING WEIGHT DEFLECTOMETER ........................................................................................ 37
5.3 CORE SAMPLES AND LABORATORY TESTS ................................................................................................................. 38
5.4 LAYERS DEFORMABILITY CHARACTERISTICS ............................................................................................................... 39
5.5 JOINT LOAD TRANSFER EFFICIENCY .......................................................................................................................... 41
6 CLASSIFICATION ACN-PCN .......................................................................................................................... 42
6.1 METHODOLOGY ACN-PCN ................................................................................................................................. 42
6.1.1 Definition ............................................................................................................................................. 42
6.1.2 System methodology ........................................................................................................................... 42
6.1.3 Application ........................................................................................................................................... 42
6.2 DETERMINATION OF AIRCRAFT CLASSIFICATION NUMBER ............................................................................................ 43
6.2.1 Definition ............................................................................................................................................. 43
6.2.2 Methodology ........................................................................................................................................ 43
6.2.3 Operational Frequency......................................................................................................................... 43
6.2.4 Variables Involved in Determination of ACN Values ............................................................................ 44
6.3 DETERMINATION OF PCN NUMERICAL .................................................................................................................... 44
6.3.1 Definition ............................................................................................................................................. 44
6.3.2 Methodology ........................................................................................................................................ 45
6.3.3 PCN classification ................................................................................................................................. 46
6.4 CASE STUDY ...................................................................................................................................................... 50
6.4.1 Subgrade classification ........................................................................................................................ 50
6.4.2 Finding ACN values for the operating aircrafts with COMFAA 3.0 ...................................................... 50
6.4.3 Failure criteria ...................................................................................................................................... 51
6.4.4 Determination of PCN using BISAR 3.0 ................................................................................................ 53
6.4.5 Structural life ....................................................................................................................................... 55
6.5 FINAL CONSIDERATIONS ....................................................................................................................................... 56
7 CONCLUSIONS ............................................................................................................................................ 58
8 BIBLIOGRAPHY............................................................................................................................................ 62

VII
List of Figures
FIGURE 2.1 – LNEC`S FWD (ON THE LEFT) AND GPR (ON THE RIGHT) EQUIPMENT ...................................................................... 18
FIGURE 3.1 – LOCATION OF THE RUNWAY AND THE MAIN APRONS ............................................................................................. 22
FIGURE 3.2 - RUBBER DEPOSITS ON THE CONTACT AREA NEAR THE THRESHOLD 36 ........................................................................ 23
FIGURE 4.1 - LOAD TEST USING THE FWD - MEASURED DEFLECTIONS - CENTER LINE RUNWAY 18-36 ............................................. 30
FIGURE 7.1 – THE BIGGEST WORLD AIRCRAFTS (DAILY MAIL, 2015) ......................................................................................... 58

VIII
List of Tables
TABLE 2.1 – CDF CLASSIFICATION ....................................................................................................................................... 10
TABLE 2.2 – TEXTURE SIZE RANGE........................................................................................................................................ 14
TABLE 3.1 - AVERAGE FRICTION COEFFICIENT VALUES BY ALIGNMENTS AND BY ZONES .................................................................... 25
TABLE 3.2 - DEPTH TEXTURE VALUES OBTAINED BY “SAND PATCH” METHOD ................................................................................ 26
TABLE 5.1 - STANDARD DEVIATION AND AVERAGE VALUES OF DEFLECTION OF THE RIGID PAVEMENTS MEASURED IN THE CENTRE OF THE
SLAB ..................................................................................................................................................................... 37
TABLE 5.2 - THICKNESSES OF CORES AND TEST RESULTS IN DIAMETRICAL COMPRESSION .................................................................. 38
TABLE 5.3 - STRUCTURAL BEHAVIOUR MODEL DEDUCTED FROM LOAD TESTS ON RIGID PAVEMENTS – ELASTIC LAYERS MODEL ................ 40
TABLE 6.1 - PAVEMENT CODES FOR REPORTING PCN ............................................................................................................. 47
TABLE 6.2 - STANDARD SUBGRADE SUPPORT CONDITIONS FOR RIGID AND FLEXIBLE PAVEMENT ACN CALCULATION ........................... 48
TABLE 6.3 - TIRE PRESSURE CODES FOR REPORTING PCN ........................................................................................................ 48
TABLE 6.4 - AIRCRAFTS ACN THAT OPERATE THE RUNWAY AND ACN OF BOEING 737-100 ......................................................... 51
TABLE 6.5 - MAXIMUM ADMISSIBLE TENSIONS DUE TO THE LOAD ON THE CONCRETE SLABS ............................................................. 53
TABLE 6.6 - LOAD-BEARING CAPACITY OF THE RUNWAY ............................................................................................................ 54
TABLE 6.7 - LOAD BEARING CAPACITY OF THE RIGID PAVEMENTS OF THE APRONS .......................................................................... 55
TABLE 6.8 - LOAD-BEARING CAPACITY OF THE RUNWAY – ADMISSIBLE PASSAGES OF THE CONDITIONING AIRCRAFT............................... 56

IX

X
List of abbreviations and symbols
Abbreviations
GPR – Ground Penetrating Radar
FWD – Falling Weight Deflectometer
CBR – California Bearing Ratio
LNEC – Laboratório Nacional de Engenharia Civil
NDT – Non-destructive Tests
ACN – Aircraft Classification Number
PCN – Pavement Classification Number
FAA – Federal Aviation Administration
CDF – Cumulative Damage Factor
AC – Advisory Circular
P/C – Pass to Coverage Ratio
TC – Traffic Cycle
P/TC – Pass to Cycle Ratio
HWD - Heavy Weight Deflectometer
PCI – Pavement Condition Index
ICAO – International Civil Aviation Organization
PCC – Portland Cement Concrete
HMA – Hot Mix Asphalt

XI


1
1 Introduction
1.1 Background
Nowadays, roads and airfields are the most used communication means to connect people
around the world. The infrastructure of a country is an important parameter for the economic
and social health of a country. The number of people using this mean of communication is
growing every year. Better and long lasting pavements are needed to meet the present
requirements for transport infrastructure (Fontul, 2004).
As the road traffic volumes and vehicle loads are growing, the need for maintaining the
pavement`s characteristics are also growing. More efficient methods for pavement
monitoring and structural evaluation are required in order to ensure a good serviceability and
to provide adequate maintenance solutions for the pavements.
The structural condition is one of the main factors to be taken into consideration for
pavement maintenance planning. In order to evaluate the bearing capacity of a pavement, two
solutions can be adopted, destructive tests (core drillings and pits) and non-destructive tests
(NDT), such as Falling Weight Deflectometer (FWD) and Ground Penetrating Radar (GPR).
Using the non-destructive tests, a mechanistic approach can be used, a structural model of the
pavement is required for the estimation of its residual life. Using layer thickness data as
input, the elasticity moduli of the pavement`s layers are “back calculated” from the deflection
basin measured with non-destructive load testing equipment. In this way, the pavement
bearing capacity is evaluated, and the remaining pavement life can be estimated, taking into
consideration the future traffic (Irwin, 2002) (Fontul, 2004).
With the drastic increase in traffic over the last years, the stationary or slow moving and
destructive tests procedures have become, not only dangerous for operators and difficult to
perform but also with a significant impact on the traffic flow, mainly on road pavements.

2
It is a general concern nowadays to provide means that can improve safety of road workers
and users, during testing and road maintenance works. For this purpose, the GPR and the
FWD combined can provide a more accurate picture of the pavement`s structural condition,
without conditioning the safety or the traffic or delaying the airport operation.
1.2 Objectives
The main purpose of this work is to show the importance of all steps in order to evaluate
properly the pavements of an airport, not only the runway.
This study incorporates two main evaluation methods, functional and structural. The
structural evaluation regards the use of the GPR and the use of the FWD with the
corresponding interpretation of the results. The interpretation of FWD data together with
layer thickness data obtained from GPR contributes to the improvement of the methodology
for structural pavement evaluation.
As for the functional evaluation, the use of the GRIP Tester is a very important test,
performed to find the friction coefficient of the runway. The safety of the aircrafts depends on
this functional characteristic. Also the “sand patch” method used to find the depth texture of
the surface layer of the runway is critical, as influences the safety of the aircrafts, the
operation costs, the comfort, as well as the ambient is a very important evaluation
characteristic.
An improved methodology for pavement evaluation represents an important tool for
maintenance and rehabilitation of pavements.
1.3 Outline of the dissertation
The dissertation is organised in 7 chapters, including the Introduction presented in Chapter 1
and the Conclusions presented in Chapter 7.
Chapter 2 presents the main aspects to follow when an airport evaluation is required, as well
as the main reasons for doing that. Starting with the classification of the pavements and

3
continuing with the design considerations, the reader can make an idea of what is an
evaluation and why is necessary.
Chapter 3 presents the functional characteristics and an example of determining them. The
visual inspection is incorporated here; including the use of the GRIP tester for finding the
friction coefficient of the surface layer as well as finding the depth texture using the “sand
patch” method is shown in an example.
Chapter 4 consists of a state-of the art review of techniques for structural pavement
evaluation of the flexible pavement (runway) using mechanistic approach, with special
attention given to the procedures and interpretation of the non-destructive tests. These tests
are the ones obtained using the GPR and the FWD equipment. Considerations are made on
the influence of external factors such as the air and pavement temperature. The methodology
for dividing the pavement into homogeneous sub-sections is mentioned here as well as the
procedures for selection of a structural model for pavement evaluation.
The rigid pavement evaluation is addressed in Chapter 5. The respective tests are made in
order to find a structural model for the pavement evaluation. The GPR and the FWD are also
used for the characterization of the rigid pavements. The load transfer efficiency between the
concrete slabs is calculated in this chapter.
In the next chapter, Chapter 6, the classification ACN-PCN is presented. All the steps in
order to classify the runway are presented in detail in this chapter. The ACN-PCN
methodology, the ACN classification as well as the PCN classification are carefully
explained. After the ACN-PCN classification is done, a structural life is calculated, in order
to find a remaining life of the runway. Conclusions are presented in the end of this chapter
(AC:150/5320-6E, 2009)

4
2 Airport pavement evaluation
2.1 Airport Pavements – Functions and purposes
Airport pavements are constructed to provide adequate support for the loads imposed by
airplanes and to produce a firm, stable, smooth, all-year, all-weather surface free of debris or
other particles that may be blown or picked up by propeller wash or jet blast. In order to
satisfactorily fulfil these requirements, the pavement must be of such quality and thickness
that it will not fail under the load imposed. In addition, it must possess sufficient inherent
stability to withstand, without damage, the abrasive action of traffic, adverse weather
conditions, and other deteriorating influences. To produce such pavements requires a
coordination of many factors of design, construction, and inspection to assure the best
possible combination of available materials and a high standard of workmanship
(AC:150/5320-6E, 2009)
These pavements can be flexible, rigid, or semi rigid (composite), depending on the type of
materials that constitute them. The most important factor is the economic analysis along the
life cycle, taking into account the traffic and climate. Besides the economical factor, there can
be other factors like, operational constraints, funding limitation or future expansion.
The main materials of the different pavement layer are briefly described herein:
Wearing course
The materials that constitute the wearing surface courses include Portland cement concrete
(PCC) and hot mix asphalt (HMA). Generally, the sand-bituminous mixture and bituminous
surface treatments are forbidden for airport pavements due to the risk of debris.
Base course
Base courses consist of a variety of different materials, which generally fall into two main
classes, treated and untreated. An untreated base consists of crushed or uncrushed aggregates.

5
A treated base normally consists of a crushed or uncrushed aggregate mixed with a stabilizer
such as cement, bitumen, etc.
Subgrade course
Subgrade courses consist of granular material, stabilized granular material, or stabilized soil
(AC:150/5320-6E, 2009).
2.2 Soil investigation and evaluation
Soil strength tests
Soil classification for engineering purposes provides an indication of the expected behaviour
of the soil as a pavement subgrade. This indication of behaviour is, however, approximate.
Performance different from that expected can occur due to a variety of reasons such as degree
of compaction, degree of saturation, height of over layers, etc. The possibility of incorrectly
predicting subgrade behaviour can be significantly reduced by measuring the soil strength.
The strength of materials intended for use in flexible pavement substructures is measured by
the CBR tests. Materials intended for use in rigid pavement structures are tested by the plate
bearing method. Each of these tests is discussed below. Resilient modulus is used for rigid
pavement design because of the variable stress states. Elastic modulus is estimated from CBR
and k using the correlations E = 1500 x CBR and E = 26 x k1.284
(AC:150/5320-6E, 2009).
California Bearing Ratio (CBR)
The CBR test is basically a penetration test conducted at a uniform rate of strain. The force
required to produce a given penetration in the material under test is compared to the force
required to produce the same penetration in a standard crushed limestone. The result is
expressed as a ratio of the two forces. Thus a material with a CBR value of 15 means the
material in question offers 15 per cent of the resistance to penetration that the standard
crushed stone offers. Laboratory CBR tests should be performed in accordance with ASTM D
1883, Bearing Ratio of Laboratory-Compacted Soils. Field CBR tests should be conducted in
accordance with the ASTM D 4429, Standard Test Method for Bearing Ratio of Soils in
Place (AC:150/5320-6E, 2009).

6
This method is generally used in order to determine the foundation class of flexible
pavements, information needed for ACN/PCN classification (Fontul and Antunes, 2006).
Plate Bearing Test
As the name indicates the plate bearing test measures the bearing capacity of the pavement
foundation. It is a test that it is performed in site (in situ). The result, k value, can be
envisioned as the pressure required to produce a unit deflection of the pavement foundation.
The plate bearing test result, k value, has the units of Mega-Newton per cubic meter. Plate
bearing tests should be performed in accordance with the procedures contained in AASHTO
T 222. For the ACN/PCN values determination for rigid pavements it is used to classify the
subgrade category (AC:150/5320-6E, 2009).
Table 2.1 shows the pertinent types of soil suitable as foundations soils.

7
Table 2.1 – Soil characteristics pertinent to pavement foundations

8
2.3 Design considerations. FAARFIELD software presentation
The main objective of this work is the airfield evaluation. But, in order to understand the
evaluation, which is essentially the reverse of the design, here are the main ideas of an
airfield`s design.
The design of airport pavements is a complex engineering problem that involves a large
number of interacting variables.
The design method of an airfield pavement is computationally intense, so the FAA developed
a computer program called FAARFIELD (Federal Aviation Administration Rigid and
Flexible Iterative Elastic Layered Design) to help pavement engineers implement it.
FAARFIELD is a software free to use.
The design procedure provides a method of design based on layered elastic and three-
dimensional finite element-based structural analysis developed to calculate design
thicknesses for airfield pavements. Layered elastic and three-dimensional finite element-
based design theories were adopted to address the impact of new complex gear and wheel
arrangements.
Details on the development of the FAA method of design are as follows:
a. Flexible Pavements
For flexible pavement design, FAARFIELD uses the maximum vertical strain at the top of
the subgrade and the maximum horizontal strain at the bottom of the asphalt layer for the
predictors of pavement structural life. FAARFIELD provides the required thickness for all
individual layers of flexible pavement (surface, base, and subgrade) needed to support a
given airplanes traffic over a particular subgrade (ICAO, 1999).
b. Rigid Pavements
For rigid pavement design, FAARFIELD uses the maximum horizontal stress at the bottom
of the PCC slab for the predictor of pavement structural life. The maximum horizontal stress
for design is determined using an edge loading condition. FAARFIELD provides the required

9
thickness of the rigid pavement slab needed to support a given airplane traffic mix
(combination) over a particular subgrade.
An airfield pavement and the airplanes that operate on it represent an interactive system that
must be studied in the pavement design process. Design considerations associated with both
the airplanes and the pavement must be recognized in order to produce a satisfactory design.
Producing a pavement that will achieve the intended design life will require careful
construction control and proper maintenance. Pavements are designed to provide a finite life
and fatigue limits are anticipated. Poor construction and a lack of maintenance reduce the
service life of even the best-designed pavement (AC:150/5320-6E, 2009).
FAARFIELD is based on the cumulative damage factor (CDF) concept, in which the
contribution of each airplane in a given traffic mix to total damage is separately analysed.
Therefore, the FAARFIELD program should not be used to compare individual airplane
pavement thickness requirements with the design methods contained in previous versions of
the AC that are based on the “design aircraft” concept. Likewise, due care should be used
when using FAARFIELD to evaluate pavement structures originally designed with the
thickness design curves in previous versions of this AC. Any comparison between
FAARFIELD and the design curve methodology from previous versions of this AC must be
performed using the entire traffic mix.
Airplane Traffic Mixture
FAARFIELD was developed and calibrated specifically to produce pavement thickness
designs consistent with previous methods based on a mixture (combination) of different
airplanes rather than an individual airplane. If a single airplane is used for design, a warning
will appear in the Airplane Window indicating a non-standard airplane list is used in the
design. This warning is intended to alert the user that the program was intended for use with a
mixture of different airplane types. Nearly any traffic mix can be developed from the
airplanes in the program library. Solution times are a function of the number of airplanes in
the mix. The FAARFIELD design procedure deals with mixed traffic differently than did
previous design methods. Determination of a design aircraft is not required to operate
FAARFIELD. Instead, the program calculates the damaging effects of each airplane in the
traffic mix. The damaging effects of all airplanes are summed in accordance with Miner’s

10
law. When the cumulative damage factor (CDF) sums to a value of 1.0, the design conditions
have been satisfied (AC:150/5320-6E, 2009).
Cumulative Damage Factor
In FAARFIELD, the “design aircraft” concept has been replaced by design for fatigue failure
expressed in terms of a cumulative damage factor (CDF) using Miner’s rule, CDF is the
amount of the structural fatigue life of a pavement that has been used up. It is expressed as
the ratio of applied load repetitions to allowable load repetitions to failure. For a single
airplane and constant annual departures, CDF is expressed as:
Or,
( ) ( )
(
⁄ ) ( )
Or,
Table 2.2 – CDF classification
CDF value Pavement remaining life
1 The pavement has used up all its fatigue life
<1 The pavement has some life remaining, and the value of CDF gives the fraction
of the life used
>1 The pavement has exceeded its fatigue life
In the program implementation, CDF is calculated for each 254 mm wide strip along the
pavement over a total width of 20 828 mm. Pass-to-coverage ratio is computed for each strip
based on a normally distributed airplane wander pattern with standard deviation of 773 mm
(equivalent to airplane operation on a taxiway) and used in the above equation for Miner’s
rule.

11
The CDF for design is taken to be the maximum over all 82 strips. Even with the same gear
geometry, therefore, airplanes with different main gear track widths will have different pass-
to-coverage ratios in each of the 254 mm strips and may show little cumulative effect on the
maximum CDF (AC:150/5320-6E, 2009).
Removing the airplanes with the lowest stress or strain may then have little effect on the
design thickness, depending on how close the gear tracks are to each other and the number of
departures.
Pass-to-Coverage Ratio
As an airplane moves along a pavement section it seldom travels in a perfectly straight path
or along the exact same path as before. This lateral movement is known as airplane wander
and is modelled by a statistically normal distribution. As an airplane moves along a taxiway
or runway, it may take several trips or passes along the pavement for a specific point on the
pavement to receive a full-load application. The ratio of the number of passes required to
apply one full load application to a unit area of the pavement is expressed by the pass-to-
coverage (P/C) ratio. It is easy to observe the number of passes an airplane may make on a
given pavement, but the number of coverages must be mathematically derived based upon the
established P/C ratio for each airplane. By definition, one coverage occurs when a unit area
of the pavement experiences the maximum response (stress for rigid pavement, strain for
flexible pavement) induced by a given airplane. For flexible pavements, coverages are a
measure of the number of repetitions of the maximum strain occurring at the top of subgrade.
For rigid pavements, coverages are a measure of repetitions of the maximum stress occurring
at the bottom of the PCC layer.
Coverages resulting from operations of a particular airplane type are a function of the number
of airplane passes, the number and spacing of wheels on the airplane main landing gear, the
width of the tire-contact area and the lateral distribution of the wheel-paths relative to the
pavement centreline or guideline markings.
In calculating the P/C ratio, FAARFIELD uses the concept of effective tire width. For rigid
pavements, the effective tire width is defined at the surface of the pavement and is equal to a
nominal tire contact patch width. For flexible pavements, for the failure mode of shear in the
subgrade layer, the effective tire width is defined at the top of the subgrade. “Response lines”
are drawn at 1:2 slope from the edges of the contact patches to the top of the subgrade. Tires
are considered to be either separate or combined, depending on whether the response lines
12
overlap. All effective tire width and P/C ratio calculations are performed internally within the
FAARFIELD program.
Annual Departures and Traffic Cycles
Airport pavement design using FAARFIELD considers only departures and ignores the
arrival traffic when determining the number of airplane passes. This is because in most cases
airplanes arrive at an airport at a significantly lower weight than at take-off due to fuel
consumption.
During touchdown impact, remaining lift on the wings further alleviates the dynamic vertical
force that is actually transmitted to the pavement through the landing gears.
The FAA has defined a standard traffic cycle (TC) as one take-off and one landing of the
same airplane. In the situation described above, one traffic cycle produces one pass of the
airplane which results in a pass-to-traffic cycle ratio (P/TC (Alves, 2007)) of 1.
To determine annual departures for pavement design purposes multiply the number of
departing airplanes by the P/TC. For most airport pavement design purposes, a P/TC of 1
may be used.
2.4 Purposes of pavement evaluation
Airport pavement evaluation is necessary to assess the ability of an existing pavement to
support different types, weights or volumes of airplane traffic. The load carrying capacity of
existing bridges, culverts, rain drains, and other structures should also be considered in these
evaluations.
Evaluations may be also necessary to determine the condition of existing pavements for use
in the planning or design of improvements to the airport. Evaluation procedures are
essentially the reverse of design procedures, so called back-calculation.
Evaluation process
The evaluation of airport pavements should be a methodical step-by-step process. The
recommended steps in the evaluation process described below should be used regardless of
the type of pavement.
a. Records Research

13
A thorough review of construction data and history, design considerations, specifications,
testing methods and results, as-built drawings, and maintenance history should be performed.
Weather records and the most complete traffic history available are also parts of a usable
records file.
b. Site Inspection. Functional evaluation
The site in question should be visited and the condition of the pavements noted by visual
inspection. This should include, in addition to the inspection of the pavements, an
examination of the existing drainage conditions and drainage structures at the site. Evidence
of the adverse effects of frost action, swelling soils, reactive aggregates, etc., should also be
noted.
Beside the visual inspection, there are evaluated the following surface characteristics of the
pavement:
1. Friction coefficient
2. Longitudinal regularity
3. Transversal regularity
4. Depth of texture
The main function of a pavement is to create a free and plane surface, designed for aircraft
traffic in adequate safety, economy and comfort conditions. Therefore, the pavement surface
must have certain characteristics, such as geometrical regularity, adherence and the capacity
to drain surface waters. These characteristics, that affect directly the user of the pavement, are
called functional characteristics. Also, more and more importance is given to the
environmental issues that affect not only the user but also the surrounding, such as: mitigate
the traffic noise and the landscape aspects.
1. Friction coefficient
The safety depends on the geometrical characteristics of the pavement, as well as on the
friction coefficient between the tire and the pavement. The friction coefficient is affected by a
number of factors such as the texture depth (ASTM 1996) and the drainage, which in its turn
is directly related with the geometrical characteristics, like the longitudinal and transversal
profile of the pavement. The longitudinal irregularity has a great influence on the user`s
comfort and safety.
2. Longitudinal irregularity

14
The longitudinal irregularity of a pavement can be defined by the variation in depth of its
surface, compared to an ideal profile. The wavelengths associated to the longitudinal
irregularity are generally comprised between 0.5 m and 40 m. The vehicle driving conditions
are more affected by the longitudinal irregularity as the vehicle velocity is higher.
3. Transversal irregularity
It is an essential characteristic used to ensure a good performance of the road. It affects the
conditions of comfort, safety and it is a degradation factor when the surface of the pavement
is wet. This parameter is, in general, a good indicator of the superficial degradation of the
pavement.
4. Depth of texture
The texture depth of the surface layer of a runway plays a decisive role for its functional
quality, as it is related to the following aspects: development of friction forces at the
tire/pavement contact in adverse conditions – wet surface, resistance to the aircraft motion
(high consumption of fuel), wear of the tires at the contact tire/pavement, low frequency
noise (inside and outside of the aircraft).
Thus, the texture depth influences the safety of the aircrafts, the operation costs, the comfort,
as well as the ambient, making it a very important evaluation characteristic (Alves, 2007)
The texture of a pavement is determined by its superficial irregularities, which goes from the
finer details of the micro texture, through the particularities of macro texture, until the largest
undulations of the mega texture.
The distinction between various areas or texture scales is in function of the considered
wavelength. In the next table is shown the approximate texture size range for pavements.
Table 2.3 – Texture size range
Designation Approximate dimensions range
Wavelength Amplitudes
Micro texture 0 - 0.5 mm 0 - 0.2 mm
Macro texture 0.5 - 50 mm 0.2 - 10 mm
Mega texture 50 -500 mm 1.0 - 50 mm
c. Sampling and Testing. Structural evaluation

15
The need of physical test and materials analyses is based on the findings made from the site
inspection, records research, and type of evaluation. Herein are presented the main methods
of evaluating the runway through sampling and testing.
1. Direct Sampling Procedures
The basic evaluation procedure for planning and design are visual inspection and reference to
the FAA design criteria, supplemented by the additional sampling, testing and research.
2. Non-destructive Testing
Several methods of non-destructive testing (NDT) of pavements are available. For purposes
of this work, NDT means observing pavement response to a controlled dynamic load, as in
the case of the Falling Weight Deflectometer (FWD), or other physical stimulus such as a
mechanical wave. NDT provides a means of evaluating pavements that tends to remove some
of the subjective judgment used during empirical evaluation procedures.
The main advantages of non-destructive testing are: the pavement is tested in place under
actual conditions of moisture, density, etc.; the disruption of traffic is minimal; and the need
for destructive tests is minimized. Research efforts are on-going in the area of non-destructive
testing to broaden its application.
The common NDT tools available for pavement evaluation include: FWD, Ground
Penetrating Radar (GPR), infrared thermography, which are presented herein (AC:150/5320-
6E, 2009) :
a. Falling Weight Deflectometer (FWD)
The FWD was first build in France in the early 60`s, but its development was interrupted due
to difficulties in achieving adequate deflection measurements at that time. Presently, the most
used models are produced by DYNATEST, CARL-BRO (Denmark) and KUAB (Sweden).
In the earlier versions, the load pulse rose difficulties due to the internal oscillation of the
spring system and its sensibility to the pavement`s deflection effects. The “spring” systems in
the current machines consist of a set of rubber buffers, whose characteristics were designed to
minimize these effects (COST 2002) (Fontul, 2004).
This system provides not only a drastic reduction of internal oscillation but also linearity
between the peak force and the pavement`s deflection (Tholen, 1980).
The load pulse generated by the FWD during testing is different for each drop. The peak load
values are not very different from the target value. However, in order to compare the results

16
obtained in different locations, it is necessary to transform, through a simple mathematic
operation, the deflections measured into “normalised” deflections corresponding to the target
load. This process is called “normalisation”. In this way, the results in different test points
can be compared and statistically analysed (Fontul, 2004).
Falling Weight Deflectometer apply an impulse load to the pavement with a free-falling
weight. The magnitude of the dynamic load depends on the mass of the weight and the height
from which it is dropped. The resulting deflections of the pavement surface are typically
measured using an array of sensors. The Heavy Falling Weight Deflectometer (HWD) uses a
greater dynamic load than FWD and may be more suitable for some airport applications.
FWD and HWD can be used in conjunction with appropriate software to estimate pavement
layer properties. AC 150/5370-11 gives guidance for the use of FWD and HWD equipment
(AC:150/5320-6E, 2009).
The main issues taken into account in order to ensure the measurement accuracy are the
stability of the signal to environmental effects and to pulse duration. Even more important is
to be sure that the maximum value of the deflection is picked and recorded.
In the later versions of FWD (see Figure 2.1), the deflection measuring system is isolated, as
much as possible, from the loading system, in order to avoid the influence of the dropping
weight in the deflections measured.
There are two main types of deflection transducers used in the current FWD devices
(Sorensen, 2004):
Geophones (seismic velocity transducers), which measure velocities of the
pavement`s surface and convert them into deflections, by integrating the signal;
Seismometers (seismic displacement transducers), which measure directly the
deflections of the pavement`s surface.
The measured values of the load and deflections are automatically recorded for each impact.
Using a laptop, the user can control the load level, drop sequence, distance between testing
points, etc. The output files are easy to import to Excel for processing. Although there are
FWDs installed on dedicated vehicles, the majority are still mounted on trailers. (Fontul,
2004).

17
LNEC has a “KUAB 150” FWD since the early 80`s and a Carl Bro Pri 2100 since 2007. The
deflection transducers` location can be modified, for a better adaptability to the condition of
the pavement section under study.
b. Ground Penetrating Radar
Ground penetrating radar can be useful in studying subsurface conditions non-destructively.
Ground penetrating radar depends on differences in dielectric constants to discriminate
between materials. The technique is sometimes used to locate voids or foreign objects, such
as, abandoned fuel tanks, tree stumps, etc. (AC:150/5320-6E, 2009).
GPR is non-destructive equipment; performing continuous assessment of pavement structure
and giving information about layer thickness and structure changes.
The GPR was developed in the late 1920`s , by the military, for use in detecting subsurface
non-metallic mines, although successful measurements applied to earth science problems
were performed only in the late 1950`s. Geotechnical applications of ground penetrating
radar to rock and soil did not occur until 1970`s (Ulriksen, 1982).
There are several GPR manufacturers, such as Geophysical Survey System Inc. (GSSI), Pulse
Radar Inc. (Pulse Radar), Penetradar Corporation (IRIS) [U.S.A], Road Radar Inc., Sensor &
Software Inc. (Pulse EKKO) [Canada], Auscult` (EURADAR, Scanroad) [France].
Each equipment has its own software for data processing and there are also soft wares
developed by GPR users, such as ROADDOCTOR (Finland) (FORMAT 2004).
LNEC`s equipment has two pairs of air-launched antennas (1000 MHz and 1800 MHz). In
the same figure (right hand side picture) four air-coupled antennas are seen suspended above
the pavement (Fontul and Antunes, 2000) (Fontul, 2004). The two in line antennas on the
right side of the trailer are a pair of transmitter-receiver having a frequency of 1 GHz (1000
MHz), while those on the left side are another pair of antennas of 1.8 GHz (1800 MHz).
The actual GPR system of LNEC is shown in the figure 2.1 :

18
Figure 2.1 – LNEC`s FWD (on the left) and GPR (on the right) equipment
c. Infrared Thermography
Infrared thermography is a non-destructive testing procedure whereby differences in infrared
emissions are observed allowing certain physical properties of the pavement to be
determined. Infrared thermography is purportedly capable of detecting delamination in
bonded rigid overlay pavements and in reinforced rigid pavements.
3. Pavement Condition Index
The determination of the Pavement Condition Index (PCI) is often a useful tool in the
evaluation of airport pavements. The PCI is a numerical rating of the surface condition of a
pavement and is a measure of functional performance with implications of structural
performance. PCI values range from 100 for a pavement with no defects to 0 for a pavement
with no remaining functional life. The index is useful in describing distress and comparing
pavements on an equal basis.
4. Evaluation Report
The analyses, findings, and test results should be incorporated in an evaluation report, which
becomes a permanent record for future reference. While evaluation reports need not be in any
particular form, it is recommended as a drawing identifying limit of the evaluation is
included. Analysis of information gained in the above steps should culminate in the
assignment of load carrying capacity to the pavement sections under consideration. When
soil, moisture, and weather conditions conductive to detrimental frost action exist, an
adjustment to the evaluation may be required (AC:150/5320-6E, 2009).
19
2.4.1 Flexible pavement evaluation
Evaluation of flexible pavements requires, as a minimum, the determination of the thickness
of the component layers, and the CBR of the subgrade.
a. Layer Thicknesses
The thickness of the various layers in the flexible pavement structure must be known in order
to evaluate the pavement. Thicknesses may be determined from borings, test pits or NDT.
As-built drawings and records can also be used to determine thicknesses if the records are
sufficiently complete and accurate.
b. Subgrade CBR
Laboratory CBR tests should be performed on soaked specimens in accordance with ASTM
D 1883, Bearing Ratio of Laboratory-Compacted Soils. Field CBRs should be performed in
accordance with the procedure given in The Asphalt Institute Manual Series 10 (MS-10),
Soils Manual. Field CBR tests on existing pavements less than 3 years old may not be
representative unless the subgrade moisture content has stabilized.
The evaluation process assumes a soaked CBR is and will not give reliable results if the
subgrade moisture content has not reached the ultimate in situ condition.
In situations where it is impractical to perform laboratory or field CBR tests, a back
calculated subgrade elastic modulus value may be obtained from NDT test results. The
FAARFIELD program assumes that CBR is related to the subgrade modulus as E =
1500xCBR (E in psi), so that the back calculated modulus value can be input directly into
FAARFIELD without manually converting to CBR.
2.4.2 Rigid pavement evaluation
Evaluation of rigid pavements requires, as a minimum, the determination of the thickness of
the component layers, the flexural strength of the concrete, and the subgrade modulus.
a. Layer Thicknesses

20
The thickness of the component layers is sometimes available from construction records.
Where information is not available or of questionable accuracy, thicknesses may be
determined by borings or test pits in the pavement.
b. Concrete Flexural Strength
The flexural strength of the concrete is most accurately determined from test beams extracted
from the existing pavement and tested. Quite often this method is impractical as extracted
beams are expensive to obtain and costs incurred in obtaining sufficient numbers of beams to
establish a representative sample is prohibitive.
Construction records, if available, may be used as a source of concrete flexural strength data.
The construction data may require adjustment due to the age of the concrete.
c. Subgrade Modulus
The modulus of subgrade reaction, k, is ideally determined by plate bearing tests performed
on the subgrade. These tests should be made in accordance with the procedures established in
AASHTO T 222. An important part of the test procedure for determining the subgrade
reaction modulus is the correction for soil saturation, which is contained in the prescribed
standard.
The normal application utilizes a correction factor determined by the consolidation testing of
samples at in situ and saturated moisture content. For evaluation of older pavement, where
evidence exists that the subgrade moisture has stabilized or varies through a limited range,
the correction for saturation is not necessary.
If a field plate bearing test is not practical, a back calculated subgrade elastic modulus value
may be obtained from NDT test results.
2.5 Synopsis
The soil investigation and evaluation is a very important part of the runway evaluation, as we
seen in this chapter 2.2. The purpose of this evaluation is very clearly stated in 2.4, as this
evaluation is enabling a classification in function of the load carrying capacity.
In order to effectuate a thoroughly pavement evaluation, the following steps must be
followed:

21
Records research;
Site inspection;
Sampling and testing.

22
3 Functional evaluation
3.1 General presentation of the case study
The pavements studied are the ones shown in the Figure 3.1:
The runway;
The rigid aprons: Charlie R., Delta 1, Delta 2, Echo 1, Echo 2.
Figure 3.1 – Location of the runway and the main aprons
The methodology used for the study of superficial pavements characteristics evaluation
consisted of:
- visual inspection of the superficial layer:
- measuring the continuous friction coefficient, with GRIP TESTER (FAA 1997);
- measuring the texture depth of the superficial layer with the “sand patch” test method;
- evaluating the state of the superficial layer of the runway based on the obtained
results, applying the recommendations of the International Civil Aviation
Organization (ICAO) and Federal Aviation Administration (FAA) for the active
runways.
Runway 18-36
Apron Echo 1
Apron Echo 2
Apron Delta 2
Apron Delta 1
Apron Charlie R.

23
3.2 Brief description of the flexible runway
The runway with an orientation of 18-36 has the following geometrical dimensions:
o Total length: 1700 m;
o length between thresholds 1190 m;
o width 30 m;
o width of thresholds 2.5 m.
3.3 Visual inspection of the runway
The visual inspection was done in October and was found in good conditions. The next
problems were found:
- The existence of slight disintegration phenomena usually associated with
finishing deficiencies in some of the construction joints.
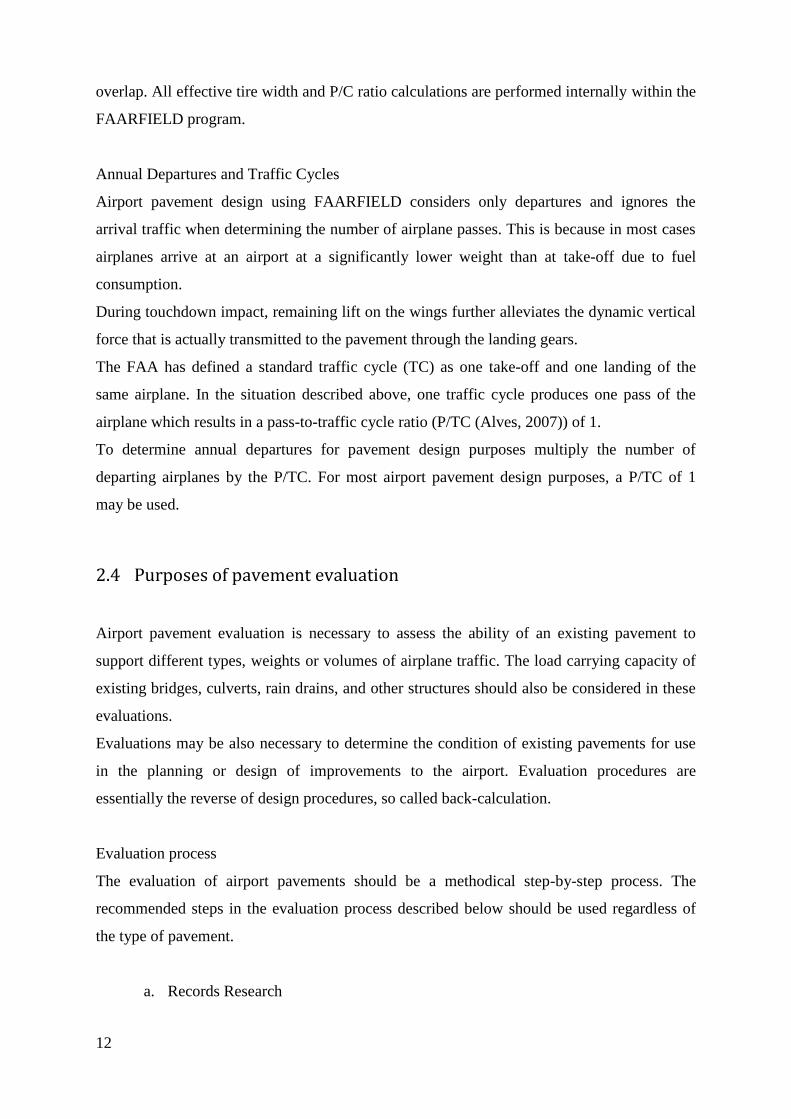
- Rubber deposits on the surface layer; this phenomenon was not creating any
difficulties because the deposits are not significant
Figure 3.2 - Rubber deposits on the contact area near the threshold 36

24
The anomalies found do not interfere with the runways functionality. During the visual
inspection, effectuated after a rainy period, was possible to note that the superficial layer has
some water accumulation areas because of the superficial irregularity. This phenomenon was
already noted in the previous visual inspection, performed 4 years before.
3.4 Friction coefficient measurement
3.4.1 Methodology
The survey for measuring the friction coefficient was done in October, during the day, using
the “Grip-Tester” equipment from LNEC. This equipment allows the friction coefficient
measurement between the runway and an especial tire, that is, partial blocked. To allow a
standard conditions test, the equipment has a watering system, which distributes a water flow
directly in the front of the measuring wheel. The friction coefficient it is measured from 10 to
10 m, on the entire length of the runway, along several parallel alignments.
The survey was done in 12 alignments parallel to the axis, at a distance of 1.5; 3.0; 4.5; 6.0;
9.0 and 10.0 m on each side. The survey conditions were in conformity with the ones
specified by ICAO, as follows:
- test speed: 65 km/h;
- wet surface simulation with 1 mm of water.
For these conditions, ICAO recommends the following limit values of the friction coefficient:
- new runways 0.74;
- planning threshold of rehabilitation measures for operating runways 0.53;
- minimum acceptable limit for operating runways 0.43.
3.4.2 Results
For each alignment, the friction coefficient was registered for sections of 10 m.

25
According to ICAO, for a proper analysis of the friction coefficient of airport runways, they
shall be divided in three sections, two landing zones and one central zone. Thus, the
following areas were considered:
Zone A, from 0 to 400 m starting from threshold 18, corresponding to the
landing area beside 18;
Zone B, from 400 to 800 m starting from threshold 18, corresponding to the
central landing area;
Zone C, from 800 to 1200 m starting from threshold 18, corresponding to the
landing area beside 36.
The results revealed that the average values of the friction coefficient for 100 m are above the
ICAO recommended value as threshold planning rehabilitation measures for active runways.
Table 3.1 - Average friction coefficient values by alignments and by zones
Zones
Alignment
12.0 m 9.0 m 6.0 m 4.5 m 3.0 m 1.5 m 1.5 m 3.0 m 4.5 m 6.0 m 9.0 m 12.0 m
A 0.82 0.67 0.74 0.83 0.77 0.78 0.77 0.72 0.77 0.67 0.67 0.76
B 0.84 0.85 0.84 0.83 0.77 0.8 0.74 0.77 0.86 0.79 0.78 0.82
C 0.84 0.81 0.8 0.76 0.7 0.75 0.77 0.71 0.84 0.76 0.76 0.7
Media 0.83 0.76 0.79 0.8 0.75 0.78 0.76 0.73 0.82 0.74 0.74 0.76
Left side of the axis Right side of the axis
3.5 Measurement of runways texture depth
3.5.1 Methodology
The measurements were made along 4 alignments parallel to the axis, at 1.5 m and 3.0 m on
both sides of the axis, at 100 m apart.
Although there are usually requirements for the texture depth values for paving works, ICAO
does not establishes any recommendations whatsoever regarding active runways.
The FAA recommendations for the texture depth of active runways are as follows:
Periodic measurements 0.76 to 1.14 mm;
Scheduled rehabilitation measurement in one year 0.40 to 0.76 mm;

26
Rehabilitation measurements in maximum two months under 0.25 mm.
3.5.2 Results
The depth texture obtained values are shown in the table below, for each alignment. Also the
standard deviation of the values per alignment is shown in the table. From these results, we
can note that the values of medium depth texture are between the planning rehabilitation
measures range values (0.40 mm to 0.76mm) in conformity with FAA recommendations
(1997). This can affect its drainage capacity in intense rain periods and favour the
accumulation of water on the surface of the pavement.
Table 3.2 - Depth texture values obtained by “sand patch” method
RUNWAY 18-36
Distance from
threshold 17 (m)
Alignment
3.0 m left 1.5 m left 1.5 m right 3.0 m right
0
0.6
0.6
50 0.33
0.53
100
0.45
0.55
150 0.55
0.47
200
0.6
0.6
250 0.66
0.66
300
0.6
0.58
350 0.55
0.66
400
0.72
0.51
450 0.51
0.63
500
0.72
0.53
550 0.66
0.51
600
0.88
0.63
650 0.58
0.66
700
0.69
0.6
750 0.55
0.63
800
0.6
0.51
850 0.53
0.63
900
0.58
0.55
950 0.55
0.55
1000
0.51
0.55
1050 0.55
0.58
1100
0.58
0.6
1150 0.6
0.72
1200
0.8
0.69
Average values 0.55 0.64 0.6 0.58
Standard deviation 0.08 0.12 0.07 0.04

27
3.6 Summary of results
This study analysed the visual inspection of the runway, the friction coefficient measurement
and the measurement of runways texture depth. Summarizing the main results obtained in this
study:
The visual inspection of the runway, permitted to find that it is in a good
general condition, presenting however some phenomena of surface
breakdown, mainly along the construction joints. Still, there were verified the
water accumulation on the runway after rain periods.
The values obtained for the friction coefficient of the runway, measured with
GRIP-TESTER, at a velocity of 65 km/h, with 1 mm of water, were superior
to the planning threshold rehabilitation measures to active runways (>0.53),
being generally above the recommended value of ICAO for new runways
(>0.74).
The values obtained for the depth texture are, in general, between 0.40 and
0.76 mm.
According to the criteria established by FAA, it is recommended the planning of
rehabilitation measures when the depth texture lies in that interval. However, according to the
same institution, when the friction coefficient is high, the measurement of the depth texture of
runways can be dispensed. Thus, taking into account the results obtained of the friction
coefficient of this runway, it is considered that the runway`s surface is in adequate conditions.
It is recommended that visual inspection will be made after rain periods, in order to identify
any water accumulation areas.
As a final conclusion, it can be stated that the runway 18-36 it has satisfactory anti-skip
characteristics even if it presents a few deficiencies at surface drainage.

28
4 Structural evaluation of flexible pavements
4.1 Load tests using the Falling Weight Deflectometer
In this case was used the FWD (Falling Weight Deflectometer) in points from 50 to 50 m, in
5 alignments parallels with the centre line of the runway, including the centre line.
In each test point were made 3 impacts, that corresponds to a maximum force of 150 kN,
using the load plate of 0.45 m diameter. During this process the air and soil temperatures
have been recorded. The deflections from the last fall were recorded at 7 seismometers
located as follows: D0 centre of the load plate, D1 at 0.30 m from the centre, D2 at 0.45 m, D3
at 0.60 m, D4 at 0.90 m, D5 at 1.20 m and D6 at 1.80 m, respectively.
Example of using the program BISAR 3.0:
Zone: z1
Table 4.1 – Layer characteristics
Layer number Thickness
(m)
Modulus of Elasticity
(MPa) Poisson's ratio
1 0.19 5000.00 0.4
2 0.35 220.00 0.35
3 1.20 120.00 0.35
4
1000.00 0.35
Here are introduced in the program the characteristics of the layers: thickness, elasticity
modulus and Poisson`s ratio.
29
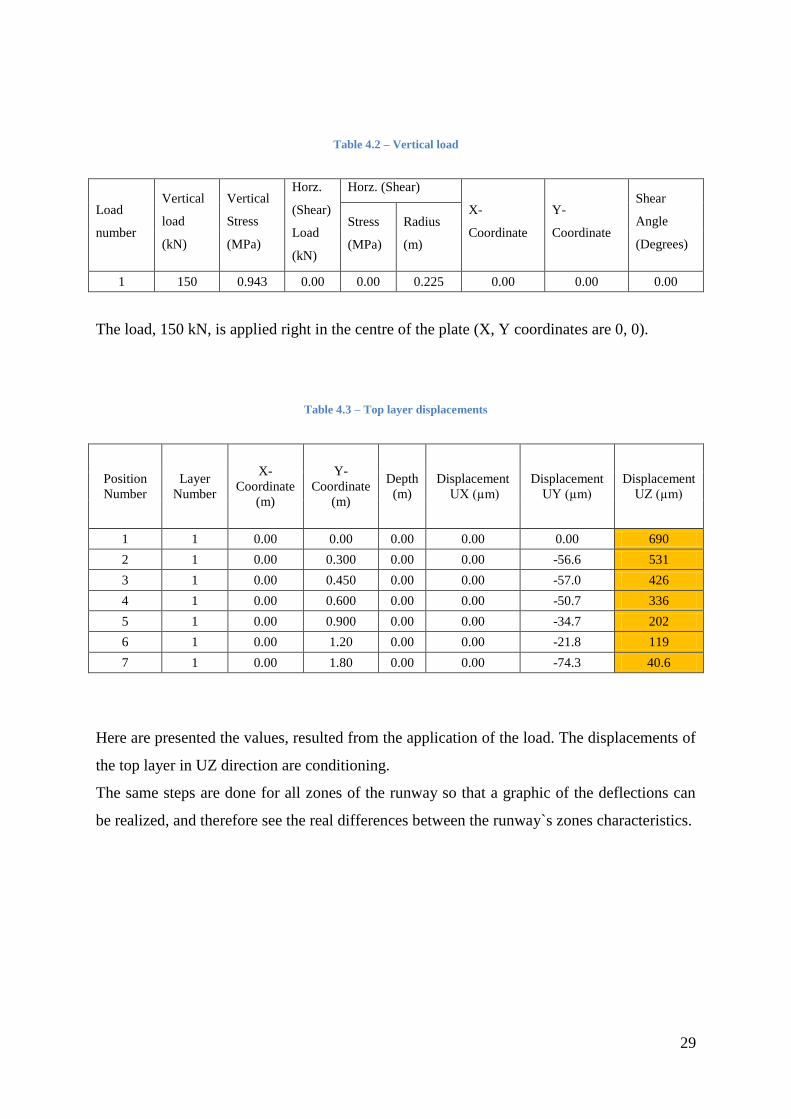
Table 4.2 – Vertical load
Load
number
Vertical
load
(kN)
Vertical
Stress
(MPa)
Horz.
(Shear)
Load
(kN)
Horz. (Shear)
X-
Coordinate
Y-
Coordinate
Shear
Angle
(Degrees)
Stress
(MPa)
Radius
(m)
1 150 0.943 0.00 0.00 0.225 0.00 0.00 0.00
The load, 150 kN, is applied right in the centre of the plate (X, Y coordinates are 0, 0).
Table 4.3 – Top layer displacements
Position
Number
Layer
Number
X-
Coordinate
(m)
Y-
Coordinate
(m)
Depth
(m)
Displacement
UX (µm)
Displacement
UY (µm)
Displacement
UZ (µm)
1 1 0.00 0.00 0.00 0.00 0.00 690
2 1 0.00 0.300 0.00 0.00 -56.6 531
3 1 0.00 0.450 0.00 0.00 -57.0 426
4 1 0.00 0.600 0.00 0.00 -50.7 336
5 1 0.00 0.900 0.00 0.00 -34.7 202
6 1 0.00 1.20 0.00 0.00 -21.8 119
7 1 0.00 1.80 0.00 0.00 -74.3 40.6
Here are presented the values, resulted from the application of the load. The displacements of
the top layer in UZ direction are conditioning.
The same steps are done for all zones of the runway so that a graphic of the deflections can
be realized, and therefore see the real differences between the runway`s zones characteristics.

30
Figure 4.1 - Load test using the FWD - Measured deflections - Center Line Runway 18-36
4.2 Tests using the Ground Penetrating Radar
The radar was used to perform tests on the same path as the falling weight deflectometer. The
sampling interval was 0.25 m, so that the obtained results will provide a continuous survey of
the interfaces between layers. The tests were made with an antenna of 1 GHz, which due to
its greater depth of penetration allowed detecting the granular layers thickness.
4.3 Division in subsections
Dividing a pavement into numerous subsections should take in consideration the following
parameters:
Surface distress
Subgrade type, earthworks
Drainage condition
Layer thicknesses
Traffic volumes
Construction records
0
100
200
300
400
500
600
700
800
900
1000
1100
1200
1300
1400
1500
1600
0 100 200 300 400 500 600 700 800 900 1000 1100 1200 1300 1400 1500 1600 1700
De
fle
cti
on
s (m
m)
Distance to threshold 18
D0 D1 D2 D3 D4 D5 D6
Load impact: 150kN Plate diameter: 45 cm

31
Measured deflections and deflection bowl parameters
Number of measuring points of the subsection.
Besides the above factors, other more elaborate parameters may be used for sub-division:
Surface modulus plots
Layer moduli
Residual pavement life
Overlay requirement, if the method used calculates the overlay needed at every test
point of the road.
The division in subsections can be performed, either by engineering judgment using visual
assessment of the variation of parameters or by statistical methods or by combination of both.
“Visual assessment” is used for analysis of construction records, subgrade type, and drainage
condition and traffic volumes. A “visual assessment” for other variables such as deflections
and layer thickness is very useful when a statistical method is used, as a complement to this
one. For large databases the visual assessment delineation can be time-consuming and
confusing. In this case, there are statistical methods that can be used, allowing for a better
interpretation of the variability of several parameters along the pavement (Fontul, 2004).
Cumulative difference method
Using this method we can divide our pavement into subsections. It is widely used for
identification and delimitation of statistically homogeneous sub-sections along the pavement,
and can be applied for a variety of pavement parameters or response variables such as:
deflections, layer thickness, serviceability, surface distresses, etc. The cumulative difference
slope changes whenever there is a change in pavements characteristics. Those points are
called “borders” between two consecutive subsections. The division into subsections was
made as follows:

32
Figure 4.2 – Example of Cumulative Difference Method
Table 4.4 - Standard deviation and average values of deflections on the runway 18-36
Zone Location
Normalized deflections for 150 kN (μm)
D0 D1 D2 D3 D4 D5 D6
M σ M σ M σ M σ M σ M σ M σ
z1 80-250 m 504 155 372 133 290 114 211 92 113 57 58 32 17 11
z2 250-350 m e
900-1400 m 653 103 522 85 442 77 357 69 240 56 159 44 77 28
z3 350-600 m 275 102 200 81 156 69 114 55 65 36 38 25 16 13
z4 600-900 m 418 95 286 70 210 58 144 46 69 29 32 18 9 7
z5 1400-1630 m 400 89 304 54 246 38 192 32 125 31 85 29 49 19
Legend:
M – average value of deflections
σ - standard deviation

33
4.4 Asphalt Boring tests
In each zone of homogenous behaviour that have already been divided there have been made
a boring test so that we can compare with the data collected with the GPR.
Table 4.5 - Bituminous layers thicknesses of the flexible pavement
Sampling Location Thickness of the bituminous layer
(m)
Average value obtained with GPR
(m)
P1
Pista 18-36
0,19 0,21
P2 0,19 0,2
P3 0,12 0,12
P4 0,165 0,17
P5 0,18 0,18
4.5 Defining the structural behaviour model
After obtaining the results with the FWD in each defined zone, there were selected a
representative point for each one of them. The points that were approximately close to D85
were the points selected.
D85 = M + 1.04 * σ
Where:
M – deflection value
σ – standard deviation
The results of the FWD tests, allowed establishing a structural behaviour model of the
runway in each representative zone.
In order to do that, using the methodology usually used in evaluating the bearing capacity of
runways studies, proceeded to estimate the deformability layers modules. It was used the
program BISAR 3.0 to calculate the deflections. The layers thicknesses used were in
conformity with the results obtained with the ground penetrating radar and the test pits.
Regarding the layers Poisson ratio, were used typically values for the respective material:
0.40 for the asphaltic concrete layer and 0.35 for the other layers (Antunes, 1993). As usual,

34
the foundation layer was divided in two layers: one upper layer, whose thickness was
determined in function of the tests results, and a bottom layer, semi-infinite, which is called
“rigid layer” (Fontul, 2004).
Table 4.6 – Structural behaviour model
Zone BM GM FS
E1 T(°C) h1 E2 h2 E3 h3 E4
z1 5000 19 0.19 220 0.35 120 1.2 1000
z2 5000 19 0.20 240 0.20 100 1.5 1000
z3 5700 19 0.20 400 0.35 180 0.5 1000
z4 5700 19 0.17 420 0.45 160 0.4 1000
z5 5400 19 0.19 420 0.27 160 0.8 1000
Where:
BM - layers of bituminous mixtures;
GM – layers of granular material;
FS – foundation soil;
T (°C) – recorded temperature in the bituminous layer, at 2.5 cm depth;
E1, E2, E3, E4 – deformability modulus (MPa) of pavement layers;
h1, h2, h3 – layer thicknesses.
The bituminous layers moduli of each zone were corrected to take into account the project
temperature of bituminous layers for the region where the airport is located. This temperature
is calculated using the SHELL methodology based on the air`s monthly averages
temperatures values published by the Instituto Nacional de Meteorologia e Geofisica, having
obtained an annual air temperature in this region of 17°C. To this temperature corresponds a
project temperature of the bituminous layers of 24°C.
The project values of the bituminous layers moduli were found using the ratio proposed in a
study conducted in Lisbon airport (Antunes, 1993):
( )
Et – deformability modulus at temperature T (°C)
E20 – deformability modulus at temperature of 20 °C.

35
The following table shows the deformability modulus values of the bituminous layers, for the
respective tests temperature, and the correspondent deformability modulus values for the
project temperature.
Table 4.7 - Deformability modulus of bituminous layers corrected for the project temperature
Zone FWD Tests Project values
E1 T T E1
z1 5000 19 24 4230
z2 5000 19 24 4230
z3 5700 19 24 4820
z4 5700 19 24 4820
z5 5400 21 24 4870
36
5 Structural evaluation of rigid pavements
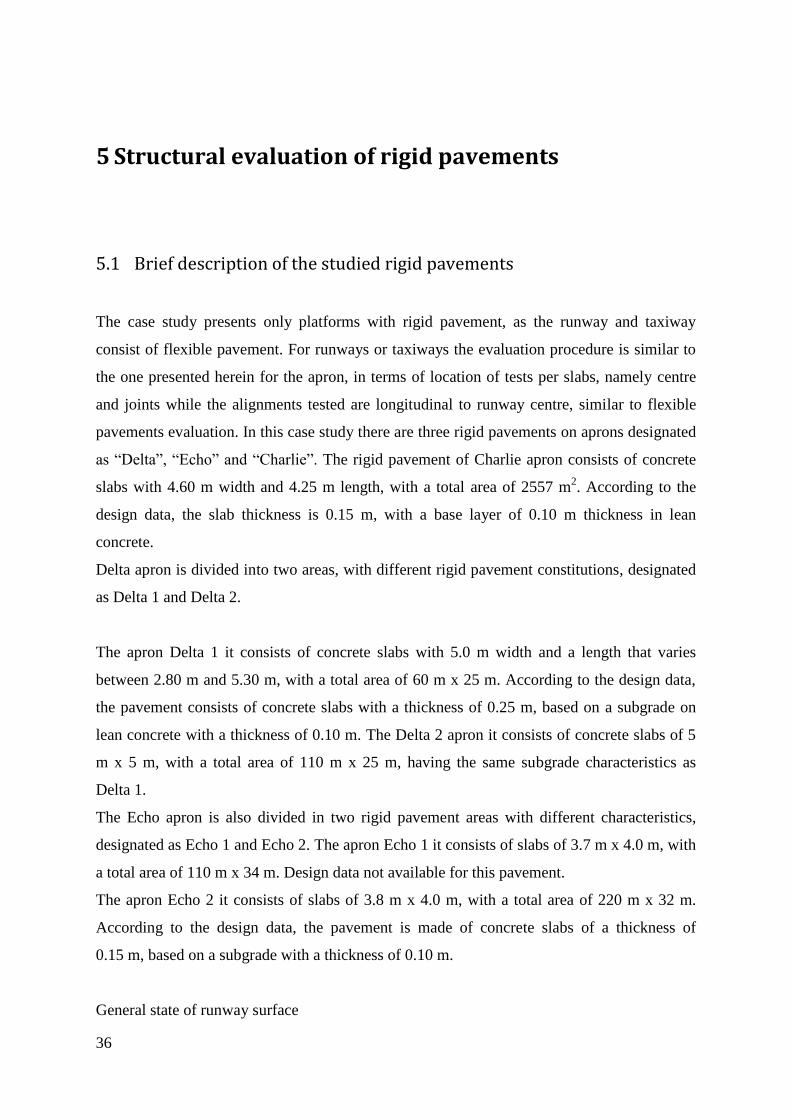
5.1 Brief description of the studied rigid pavements
The case study presents only platforms with rigid pavement, as the runway and taxiway
consist of flexible pavement. For runways or taxiways the evaluation procedure is similar to
the one presented herein for the apron, in terms of location of tests per slabs, namely centre
and joints while the alignments tested are longitudinal to runway centre, similar to flexible
pavements evaluation. In this case study there are three rigid pavements on aprons designated
as “Delta”, “Echo” and “Charlie”. The rigid pavement of Charlie apron consists of concrete
slabs with 4.60 m width and 4.25 m length, with a total area of 2557 m2. According to the
design data, the slab thickness is 0.15 m, with a base layer of 0.10 m thickness in lean
concrete.
Delta apron is divided into two areas, with different rigid pavement constitutions, designated
as Delta 1 and Delta 2.
The apron Delta 1 it consists of concrete slabs with 5.0 m width and a length that varies
between 2.80 m and 5.30 m, with a total area of 60 m x 25 m. According to the design data,
the pavement consists of concrete slabs with a thickness of 0.25 m, based on a subgrade on
lean concrete with a thickness of 0.10 m. The Delta 2 apron it consists of concrete slabs of 5
m x 5 m, with a total area of 110 m x 25 m, having the same subgrade characteristics as
Delta 1.
The Echo apron is also divided in two rigid pavement areas with different characteristics,
designated as Echo 1 and Echo 2. The apron Echo 1 it consists of slabs of 3.7 m x 4.0 m, with
a total area of 110 m x 34 m. Design data not available for this pavement.
The apron Echo 2 it consists of slabs of 3.8 m x 4.0 m, with a total area of 220 m x 32 m.
According to the design data, the pavement is made of concrete slabs of a thickness of
0.15 m, based on a subgrade with a thickness of 0.10 m.
General state of runway surface

37
The aprons Delta 2 and Echo 2 are presenting cracking phenomena. Also, it was observed
some joints with poor finishing and lack of sealing on the Charlie R. pavement, as well as,
longitudinal cracks on Echo 1 and Delta 1 aprons.
5.2 Load tests using the Falling Weight Deflectometer
In each apron (Charlie R., Delta 1, Delta 2, Echo 1 and Echo 2), squared mesh was used to
test the slabs, in order to cover all areas in question. On each slab three tests were made: one
applying the load in the centre of the slab, and the other two close to a transversal or
longitudinal joint, in order to characterize their respective efficiency of load transfer.
In the next table are presented the average values and the standard deviation obtained for the
deflections in the centre of the slab in each one of the aprons.
Table 5.1 - Standard deviation and average values of deflection of the rigid pavements measured in the centre of the
slab
Pavement
Deflections (μm)
D0 D1 D2 D3 D4 D5 D6
M σ M σ M σ M σ M σ M σ M σ
Charlie R. 172 65 142 58 119 53 93 46 57 33 31 21 7 6
Delta 1 197 44 179 42 162 39 141 35 108 29 78 23 35 13
Delta 2 171 32 153 28 138 26 119 24 87 19 60 16 25 10
Echo 1 430 83 375 59 338 59 288 50 210 37 146 29 61 19
Echo 2 374 108 330 94 299 85 258 75 195 58 414 47 61 31
Legend:
D0 to D6 – measured deflections due to the load in the centre of the slab, normalized for
150 kN;
M – average deflection value;
σ – standard deviation of deflections.

38
5.3 Core samples and laboratory tests
In each apron were made boring tests to determine the layer thicknesses and samples were
collected to determine the traction resistance in diametrical compression of concrete samples.
The location of extracted cores and their thickness are presented in the next table.
Table 5.2 - Thicknesses of cores and test results in diametrical compression
Core Apron Location
N° slab
Concrete layers
thicknesses (m)
Subgrade
layer thickness
(m)
Breaking
load (kN)
Breaking
traction
tension
(MPa)
H15 Charlie
R.
15 0.15 0.08 93.8 5.8
H18 18 0.13 0.08 87.2 5.4
D2 Delta 1 13 0.23 - 75.2 4.8
D1 Delta 2 9 0.235 - 74.7 4.8
E13
Echo 1
13 0.155 - 59 3.7
E15 15 0.155 - 79.1 4.9
E23* 23 0.125 - - -
E1 Echo 2 21 0.145 0.075 62.2 4
* - cracked core
The results presented above confirm that the slabs thicknesses are close to the values of the
design data. It is observed that the slabs thicknesses of aprons Charlie R. and Echo are quite
low comparing with the usual thicknesses in airport pavements.
Using the cores collected from the concrete slabs samples were prepared to determine the
concrete strength, more specifically its tensile strength in diametrical compression. The
respective results are also presented in the table above; it can be observed that the values for
the respective resistance vary between 3.7 MPa and 5.8 MPa.

39
5.4 Layers deformability characteristics
Following the usual methodology for rigid pavements, a first attempt was made to determine
the concrete elasticity moduli and the reaction moduli of the foundations of rigid pavements,
using Westergaard model.
It is recalled that in the Westergaard model the pavement is treated as a slab on elastic
supports, whereby the sub base layer, usually in soil-cement or in lean concrete is grouped
together with the foundation soil layer. So, the reaction modulus refers to the assembly made
of the sub-base and the soil layer, which is generally designates as foundation.
Given the peculiarity of the structure of rigid pavements Charlie R., Echo 1 and Echo 2, in
particular because the cement concrete slabs are thin (around 0.15 m), the subjacent soil-
cement layers have a significant contribution for the structural pavement behaviour, making
the Westergaard model inadequate. Therefore, the first results obtained by direct application
of the Westergaard model were not considered in this study.
So, it was first determined the deformability characteristics of the rigid layers, following the
same methodology used for flexible pavements, using the program BISAR 3.0. This program
uses an multilayer layers elastic model and allows considering various interface conditions
between layers, being considered for this study, at the interface between concrete slab and
soil cement layer, a tangential deformability (shear compliance) of:
1/KT = 12 x 10-10
m3/ N
The layers deformability characteristics were determined based on the results of tests carried
out in the centre of the slabs and that are presented in the next table.
As for the Poisson coefficient, it was adopted a value of 0.20 for concrete and 0.25 for the
soil-cement.

40
Table 5.3 - Structural behaviour model deducted from load tests on rigid pavements – elastic layers model
Zone CC LC FS
E1 h1 E2 h2 E3 h3 E4
Charlie R. 42000 0.150 7500 0.080 300 1.20 1000
Delta 1 40000 0.235 7000 0.080 105 1.10 1000
Delta 2 38000 0.230 6500 0.080 200 1.20 1000
Echo 1 32000 0.155 7500 0.080 60 1.00 1000
Echo 2 40000 0.145 7500 0.075 80 1.20 1000
Legend
CC – Concrete cement
LC – Lean concrete
FS – Foundation soil
E1, E2, E3, E4 – Deformability moduli
h1, h2, h3, h4 – Thicknesses
The obtained results, especially the deformability modulus, were used in a Westergaard
model to estimate an equivalent reaction moduli of the subjacent layers in order to obtain a
maximum tension equal to the one obtained previously with the elastic layers model. The
equivalent reaction moduli are presented in the next table.
Table 5.4 - Equivalent reaction moduli for Westergaard application
Zone Cement concrete Foundation
h (m) E* (MPa) k (MN/m3)
Charlie R. 0,150 42000 1500
Delta 1 0,235 40000 570
Delta 2 0,230 38000 630
Echo 1 0,155 32000 530
Echo 2 0,145 40000 460
Legend
h – layers thickness;
E* - deformability modulus;
k - equivalent reaction modulus of the foundation.

41
5.5 Joint load transfer efficiency
In the next table are presented the average values, the standard deviation and the
characteristics values of the joint load transfer, in terms of deflections, for the rigid
pavements joints.
Table 5.5 – Joint load transfer (Ed)
Platforms Joint type Ed (%)
α M σ E
85d
Charlie R. Transversal 64 23 40 86
Longitudinal 80 15 64 -
Delta 1 Transversal 43 28 14 93
Longitudinal 62 14 47 -
Delta 2 Transversal 43 18 24 91
Longitudinal 65 12 53 -
Echo 1 Transversal 75 22 52 82
Longitudinal 70 8 61 -
Echo 2 Transversal 68 18 49 83
Longitudinal 77 10 67 -
Legend:
M – Average value of Ed;
σ – standard deviation of Ed;
E85
d – Characterisic vlaue of joint load transfer in ters of deflections;
α - tension reduction factor.
Based on the results presented in the above table, it is observed that the transversal joints are,
in a general way, in worse conditions, presenting variability in its behaviour. For calculus
reasons, it was selected the most unfavourable values, for each platform.
According to Witczak`s methodology (1989), the joint load transfer in terms of tensions, Eσ,
relates to the joint load transfer in terms of deflections, Ed, through the relation:
( ) ( )
From this value, it can be calculated the tension reduction factor acting next to a free edge, by
the next expression:
. The value of α, determined like this it is used to estimate
the tension value induced by the aircraft’s wheels, when these circulate close to the edge of
the slabs, from the values calculated for the free edge joint load case using the Westergaard
formulas. These values are presented in the table 5.5.

42
6 Classification ACN-PCN
6.1 Methodology ACN-PCN
6.1.1 Definition
The ACN-PCN method of classification was introduced by ICAO in the early eighties
(ICAO, 1983). The system is used to classify the aircrafts and the bearing strength capacity of
a pavement. It is possible to express the effect of an aircraft on a runway`s pavement, by a
single numerical value.
6.1.2 System methodology
The ACN-PCN system is structured so a pavement with a particular PCN value can support,
without weight restrictions, an airplane that has an ACN value equal to or less than the
pavement’s PCN value (Transport Canada, 2004). This is possible because ACN and PCN
values are computed using the same technical basis.
6.1.3 Application
The use of the standardized method of reporting pavement strength applies only to pavements
with bearing strengths of 5 700 kg or greater. The method of reporting pavement strength for
pavements of less than 5 700 kg bearing strength remains unchanged (AC:150/5335-5C,
2014).

43
6.2 Determination of aircraft classification number
6.2.1 Definition
The airplane manufacturer provides the official computation of an ACN value. Computation
of the ACN requires detailed information on the operational characteristics of the airplane
such as maximum aft centre of gravity, maximum ramp weight, wheel spacing, tire pressure,
and other factors (AC:150/5335-5C, 2014)
6.2.2 Methodology
For flexible pavements, airplane landing gear flotation requirements are determined by the
California Bearing Ratio (CBR) method for each subgrade support category. The CBR
method employs a Boussinesq solution for stresses and displacements in a homogeneous,
isotropic elastic half-space. For rigid pavements, the airplane landing gear flotation
requirements are determined by the Westergaard solution for a loaded elastic plate on a
Winkler foundation (interior load case), assuming a concrete working stress of 2.75 MPa.
Using the parameters defined for each type of pavement section, a mathematically derived
single wheel load is calculated to define the landing gear/pavement interaction. The derived
single wheel load implies equal stress to the pavement structure and eliminates the need to
specify pavement thickness for comparative purposes. This is achieved by equating the
thickness derived for a given airplane landing gear to the thickness derived for a single wheel
load at a standard tire pressure of 1.25 MPa. The ACN is defined as two times the derived
single wheel load (expressed in thousands of kilograms) (AC:150/5335-5C, 2014).
6.2.3 Operational Frequency
Operational frequency is defined in terms of coverage that represents a full-load application
on a point in the pavement. Coverage must not be confused with other common terminology
used to reference movement of aircraft. As an aircraft moves along a pavement section it
seldom travels in a perfectly straight path or along the exact same path as before. This
movement is known as aircraft wander and is assumed to be modelled by a statistically

44
normal distribution. As the aircraft moves along a taxiway or runway, it may take several
trips or passes along the pavement for a specific point on the pavement to receive a full-load
application. It is easy to observe the number of passes an aircraft may make on a given
pavement, but the number of coverage must be mathematically derived based upon the
established pass-to-coverage ratio for each aircraft.
6.2.4 Variables Involved in Determination of ACN Values
Because aircrafts can be operated at various weight and centre of gravity combinations,
ICAO adopted standard operating conditions for determining ACN values. The ACN is to be
determined at the weight and centre of gravity combination that creates the maximum ACN
value. Tire pressures are assumed to be those recommended by the manufacturer for the
noted conditions. Aircraft manufacturers publish maximum weight and centre of gravity
information in their Aircraft Characteristics for Airport Planning (ACAP) manuals. To
standardize the ACN calculation and to remove operational frequency from the relative rating
scale, the ACN-PCN method specifies that ACN values be determined at a frequency of
10,000 coverages.
6.3 Determination of PCN numerical
6.3.1 Definition
The determination of a pavement rating in terms of PCN is a process of (1) determining the
ACN for each aircraft considered to be significant to the traffic mixture operating of the
subject pavement and (2) reporting the ACN value as the PCN for the pavement structure.
Under these conditions, any aircraft with an ACN equal to or less than the reported PCN
value can safely operate on the pavement subject to any limitations on tire pressure.

45
6.3.2 Methodology
Determination of the numerical PCN value for a particular pavement can be based upon one
of two procedures: the “Using” aircraft method or the “Technical” evaluation method. ICAO
procedures permit member states to determine how PCN values will be determined based
upon internally developed pavement evaluation procedures. Either procedure may be used to
determine a PCN, but the methodology used must be reported as part of the posted rating.
According to ICAO, a pavements PCN value represents the load capacity as the maximum
allowable load per single wheel, with a tire pressure of 1.25 MPa, for 10000 coverages.
Using Aircraft Method to Determine PCN
The Using aircraft method is a simple procedure where ACN values for all aircraft currently
permitted to use the pavement facility are determined and the largest ACN value is reported
as the PCN. This method is easy to apply and does not require detailed knowledge of the
pavement structure. The subgrade support category is not a critical input when reporting PCN
based on the Using Aircraft Method. The recommended subgrade support category when
information is not available should be Category B.
Technical Evaluation Method to Determine PCN
The strength of a pavement section is difficult to summarize in a precise manner and will
vary depending on the unique combination of aircraft loading conditions, frequency of
operation, and pavement support conditions. The technical evaluation method attempts to
address these and other site-specific variables to determine reasonable pavement strength. In
general terms, for a given pavement structure and given aircraft, the allowable number of
operations (traffic) will decrease as the intensity of pavement loading increases (increase in
aircraft weight). It is entirely possible that two pavement structures with different cross-
sections will report similar strength. However, the permissible aircraft operations will be
considerably different. This discrepancy must be acknowledged by the airport operator and
may require operational limitations administered outside of the ACN-PCN system. All of the
factors involved in determining a pavement rating are important, and it is for this reason that
pavement ratings should not be viewed in absolute terms, but rather as estimations of a

46
representative value. A successful pavement evaluation is one that assigns a pavement
strength rating that considers the effects of all variables on the pavement.
The accuracy of a technical evaluation is better than that produced with the Using aircraft
procedure but requires a considerable increase in time and resources. Pavement evaluation
may require a combination of on-site inspections, load-bearing tests, and engineering
judgment. It is common to think of pavement strength rating in terms of ultimate strength or
immediate failure criteria. However, pavements are rarely removed from service due to
instantaneous structural failure. A decrease in the serviceability of a pavement is commonly
attributed to increases in surface roughness or localized distress, such as rutting or cracking.
Determination of the adequacy of a pavement structure must not only consider the magnitude
of pavement loads but the impact of the accumulated effect of traffic volume over the
intended life of the pavement. The subgrade support category is a necessary input when
reporting PCN based on the Technical Method.
6.3.3 PCN classification
The PCN system uses a coded format to maximize the amount of information contained in a
minimum number of characters and to facilitate computerization. The PCN for a pavement is
reported as a five-part number where the following codes are ordered and separated by
forward slashes: Numerical PCN value / Pavement type / Subgrade category / Allowable
tire pressure / Method used to determine the PCN.
Numerical PCN value
The PCN numerical value indicates the load-carrying capacity of a pavement in terms of a
standard single wheel load at a tire pressure of 1.25 MPa (181 psi). The PCN value should be
reported in whole numbers, rounding off any fractional parts to the nearest whole number.
Pavement type
For the purpose of reporting PCN values, pavement types are considered to function as either
flexible or rigid structures.

47
Table 6.1 lists the pavement codes for the purposes of reporting PCN.
Table 6.1 - Pavement Codes for Reporting PCN
Pavement type Pavement code
Flexible F
Rigid R
a. Flexible pavement
Flexible pavements support loads through bearing rather than flexural action. They comprise
several layers of selected materials designed to gradually distribute from the surface to the
layers beneath. The design ensures that load transmitted to each successive layer does not
exceed the layer’s load-bearing capacity (AC:150/5335-5C, 2014).
b. Rigid pavement
Rigid pavements employ a single structural layer, which is very stiff or rigid in nature, to
support the pavement loads. The rigidity of the structural layer and resulting beam action
enable rigid pavement to distribute loads over a large area of the subgrade. The load-carrying
capacity of a rigid structure is highly dependent upon the strength of the structural layer,
which relies on uniform support from the layers beneath (AC:150/5335-5C, 2014).
Subgrade category
The ACN-PCN method adopts four standard levels of subgrade strength for rigid pavements
and four levels of subgrade strength for flexible pavements. These standard support
conditions are used to represent a range of subgrade conditions as shown in the following
table.

48
Table 6.2 - Standard Subgrade Support Conditions for Rigid and Flexible Pavement ACN Calculation
Subgrade Strength
Catergory CBR k (MN/m3)
Code Designation
High CBR≥13 k≥120 A
Medium 8≤CBR≤13 60<k<120 B
Low 4≤CBR≤8 25<k≤60 C
Ultra Low CBR≤4 k<25 D
Allowable tire pressure
Table 6.3 lists the allowable tire pressure categories identified by the ACN-PCN system. The
tire pressure codes apply equally to rigid or flexible pavement sections; however, the
application of the allowable tire pressure differs substantially for rigid and flexible
pavements.
Table 6.3 - Tire Pressure Codes for Reporting PCN
Category Code Tire pressure range
Unlimited W No pressure limit
High X Pressure limited to 1.75 Mpa
Medium Y Pressure limited to 1.25 Mpa
Low Z Pressure limited to 0.50 Mpa
a. Tire Pressures on Flexible Pavements
Tire pressures may be restricted on asphaltic concrete (asphalt), depending on the quality of
the asphalt mixture and climatic conditions. Tire pressure effects on an asphalt layer relate to
the stability of the mix in resisting shearing or densification. A poorly constructed asphalt
pavement can be subject to rutting due to consolidation under load. The principal concern in
resisting tire pressure effects is with stability or shear resistance of lower quality mixtures. A
properly prepared and placed mixture that conforms to FAA specification can withstand
substantial tire pressure in excess of 218 psi (1.5 Mpa). Improperly prepared and placed
mixtures can show distress under tire pressures of 100 psi (0.7 MPa) or less. Although these

49
effects are independent of the asphalt layer thickness, pavements with well-placed asphalt of
10.2 to 12.7 cm in thickness can generally be rated with code X or W, while thinner
pavement of poorer quality asphalt should not be rated above code Y (AC:150/5335-5C,
2014).
b. Tire Pressures on Rigid Pavements
Aircraft tire pressure will have little effect on pavements with Portland cement concrete
(concrete) surfaces. Rigid pavements are inherently strong enough to resist tire pressures
higher than currently used by commercial aircraft and can usually be rated as code W
(AC:150/5335-5C, 2014).
Method used to determine PCN
T – Technical evaluation method
U – Using aircraft method
The PCN system recognizes two pavement evaluation methods. If the evaluation represents
the results of a technical study, the evaluation method should be coded T. If the evaluation is
based on “Using aircraft” experience, the evaluation method should be coded U. Technical
evaluation implies that some form of technical study and computation were involved in the
determination of the PCN. Using aircraft evaluation means the PCN was determined by
selecting the highest ACN among the aircraft currently using the facility and not causing
pavement distress.
Example PCN reporting
An example of a PCN code is 80/R/B/W/T, with 80 expressing the PCN numerical value, R
for rigid pavement, B for medium strength subgrade, W for high allowable tire pressure, and
T for a PCN value obtained by a technical evaluation.

50
6.4 Case study
6.4.1 Subgrade classification
In conformity with the results obtained for in 3.5, the subgrade layer was classified as
follows:
1. High Strength
Zones z3, z4 and z5 were classified as high subgrade strength (CBR>13%).
The rigid parking aprons Charlie R. and Delta 2;
2. Medium Strength
Zones z1 and z2 of the runway 18-36 (8 %< CBR<13%);
The remaining rigid parking aprons: Delta 1, Echo 1 and Echo 2;
3. Low Strength
6.4.2 Finding ACN values for the operating aircrafts with COMFAA 3.0
According to the information provided by the aerodrome management, the most frequently
aircrafts that use the runway are ATP, ATR72, FOKKER 50 and FOKKER 100. In the next
table the ACN values of the respective aircrafts are displayed, but also the ACN of the
BOEING 737-100 aircraft, which is considered, besides FOKKER 100, the representative
aircraft with a maximum take-off weight of 400 kN.
Steps to follow in order to determine ACN values using COMFAA 3.0:
1. Select aircraft group
2. Select aircraft from library
3. Confirm aircraft parameters
4. Click ACN calculation button
5. Click to calculate flexible ACN
6. Click to calculate rigid ACN
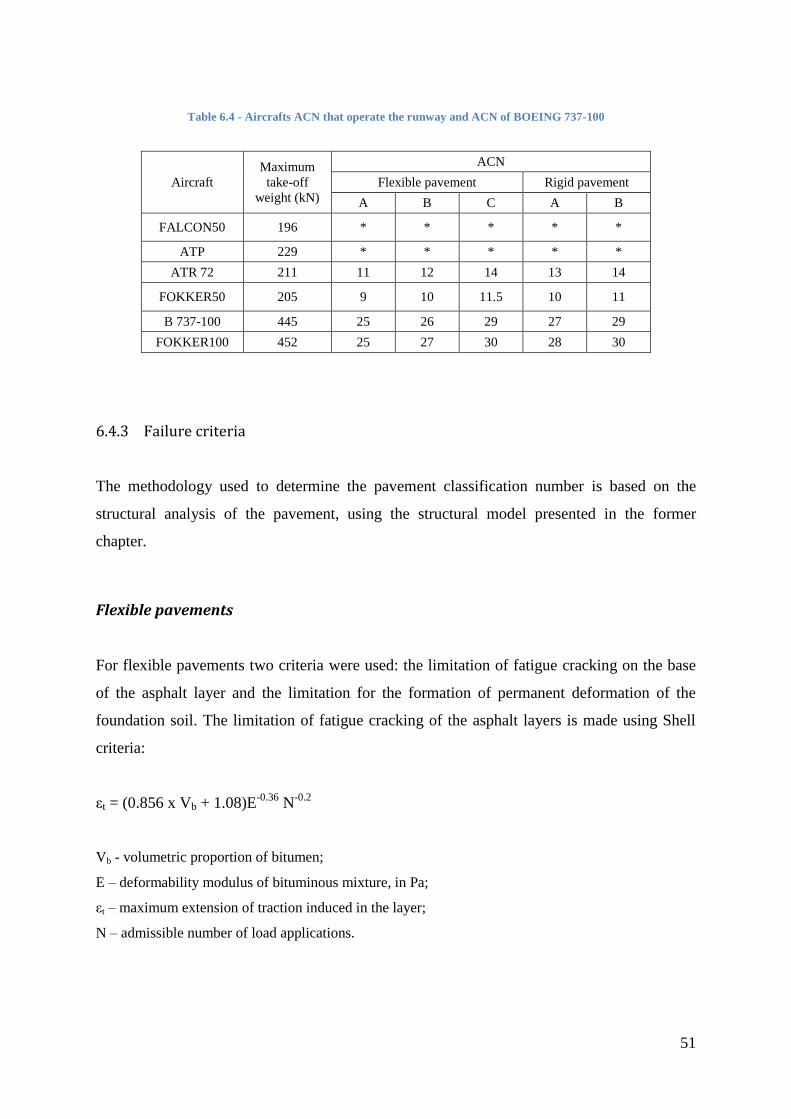
51
Table 6.4 - Aircrafts ACN that operate the runway and ACN of BOEING 737-100
Aircraft
Maximum
take-off
weight (kN)
ACN
Flexible pavement Rigid pavement
A B C A B
FALCON50 196 * * * * *
ATP 229 * * * * *
ATR 72 211 11 12 14 13 14
FOKKER50 205 9 10 11.5 10 11
B 737-100 445 25 26 29 27 29
FOKKER100 452 25 27 30 28 30
6.4.3 Failure criteria
The methodology used to determine the pavement classification number is based on the
structural analysis of the pavement, using the structural model presented in the former
chapter.
Flexible pavements
For flexible pavements two criteria were used: the limitation of fatigue cracking on the base
of the asphalt layer and the limitation for the formation of permanent deformation of the
foundation soil. The limitation of fatigue cracking of the asphalt layers is made using Shell
criteria:
εt = (0.856 x Vb + 1.08)E-0.36
N-0.2
Vb - volumetric proportion of bitumen;
E – deformability modulus of bituminous mixture, in Pa;
εt – maximum extension of traction induced in the layer;
N – admissible number of load applications.

52
It is considered that the percentage of volumetric proportion of bitumen in the layers of
bituminous mixtures is around 9%, knowing that the maximum extension of traction was
calculated at the base of the bitumen macadam layer.
Foundation contribution of limitation for the formation of excessive permanent deformation
was made using the Chou criteria (1982) for airport pavements:
εc = 0.00539N-0.1436
εc – the vertical extension of compression on top of the foundation soil;
N – corresponding number of admissible passes.
Rigid pavements
According to ICAO`s recommendations for ACN-PCN classification of rigid pavements, the
PCN can be calculated by a equivalent load per single wheel that induces a traction tension in
the concrete of 2.75 MPa. It is admitted that for this tension level, the pavement will be able
to support an unlimited number of load applications.
The result value obtained of the diametrical compression tests performed on the samples of
rigid pavements platforms was a minimum value of 3.70 MPa for the traction resistance in
diametrical compression of the concrete.
According to the recommended expressions by Cement and Concrete Association (Australia),
if the ratio between the installed tension in concrete and the traction resistance at flexion is
0.64, then the admissible load applications are above 10 000. This criterion is used, in PCN
calculations, in order to limit the tensions due to the load applications in the centre of the
slab.
In order to limit the tensions due to the load applications along the edges of the slabs,
considering the load transference presented in TABLE 6.5, an additional calculation was
made. The ratio between the installed tension in concrete and its tensile resistance is 0.67,
corresponding to 5 000 coverages.

53
Table 6.5 - Maximum admissible tensions due to the load on the concrete slabs
σcd
(MPa)
σf
(MPa)
σf,calculation
(MPa) σcenter,max (MPa) σedge,max (MPa)
Charlie R 5.4 8.1
5.5 0.64x5.50=3.53 0.67x5.50=3.67
Delta 1 3.96 5.94
Delta 2 4.79 7.19
Echo 1 3.7 5.55
Echo 2 3.96 5.94
Legend:
σcd – tensile resistance in diametrical compression of the concrete sample collected in situ;
σf – estimated tensile resistance at flexion based on the previous value;
σf,calculation – tensile resistance at flexion adopted for calculation effects;
σcenter,max – maximum admissible tension value due to the loads applied in the center of the slabs,
corresponding to a number of load applications superior to 10000;
σbordo,max – maximum admissible tension value due to the loads applied near the edge of the slabs,
corresponding to a number of load applications superior to 5000.
6.4.4 Determination of PCN using BISAR 3.0
The runway was divided in 5 zones with similar characteristics. So, we are going to calculate
the PCN for each zone and select the most conditioning one.
Flexible pavements
Using the behaviour model found in the previous chapter, were determined the strains made
by a standard single wheel load at a tire pressure of 1.25 MPa (181psi) for 10000 coverages.
The conditioning strains (εt – tensile strain on the bituminous layers and εc - compression
strain on the top of the foundation soil), were compared with the respective maximum
allowable values for 10000 coverages. The results are shown in the next table.

54
Table 6.6 - Load-bearing capacity of the runway
Zone P (kN)
Strains limit(10-6
)
(10000 coverages)
Strains (10-6
)
load induced PCN
εt εc εt εc
Pis
ta 1
8-3
6
z1 230 477
1444
475 1120 42/F/B/W/T
z2 209 477 454 1440 42/F/B/W/T
z3 400 455 396 1280 >80/F/A/W/T
z4 400 455 408 1330 >80/F/A/W/T
z5 348 453 405 1440 70/F/A/W/T
Legend:
P – single wheel load at a tire pressure of 1.25 MPa
εt – tensile strain in the bituminous layer
εc – compression extension in the foundation soil
As can be seen, for each subsection with similar characteristics we have a similar PCN value.
The most conditioning zones are z1 and z2, with a medium subgrade strength category, which
leads to a smaller PCN of: 42/F/B/W/T. This PCN value is bigger than ACN of the aircrafts
that use the runway.
Rigid pavements
In the next table are presented the load bearing capacity values for the rigid pavements of the
aprons, in terms of a maximum admissible single wheel load, with a tire pressure of 1.25
MPa and the corresponding maximum induced tensile tensions in the slabs by applying the
load in the middle and at the joints of the slabs. The limit values for these tensions and the
corresponding PCN values are also presented in Table 6.7.

55
Table 6.7 - Load bearing capacity of the rigid pavements of the aprons
Zone P (kN) Limit tensions (MPa) Load induced tensions (MPa)
PCN σ
centre(1) σ
joint(2) σ
centre σ
joint
Charlie 63 3.53 3.67 2.37 3.66 13/R/A/W/T
Delta 1 112 3.53 3.67 2.05 3.65 23/R/B/W/T
Delta 2 104 3.53 3.67 2.06 3.65 21/R/A/W/T
Echo 1 58 3.53 3.67 2.34 3.64 12/R/B/W/T
Echo 2 44 3.53 3.67 2.23 3.65 9/R/B/W/T
Legend:
P – single wheel load at a tire pressure of 1.25 MPa
σcentre
– tension due to the center slab load application
σjoint
– tension due to the joint slab load application
(1) – value corresponding to 10 000 coverages
(2) - value corresponding to 5 000 coverages
The PCN values of the rigid aprons are not above the ACN of the aircrafts. The biggest
aircraft, FOKKER 100, has an ACN value of 28 and 30, for rigid pavements with subgrade
category A and B, respectively. The rest of the fleet can use all the aprons except Echo 2,
which has a PCN value smaller than the ACN value of all the aircrafts that usually use the
aprons.
6.4.5 Structural life
In addition to the ACN-PCN classification, the runway was evaluated remaining structural
life, in terms of an admissible numbers of passages, for aircrafts that have maximum take-off
weight of 400 kN.
So, the runway`s ability to operate aircrafts with a maximum take-off weight of 400 kN and
the potential reinforcement requirements. Fokker 100 and Boeing 737-100 were used for this
study, both of them with a take-off weight superior than 400 kN.
The next table presents the structural life of the runway, in terms of admissible coverages
number and the admissible passages number. The conversion between the coverages number,
Nr, and the passages number, Np, was made in conformity with FAA regulations.

56
Np = 3.48 x Nr
The calculation was made in BISAR 3.0, using the same deformability modulus and layer
thicknesses as in the PCN determination. The same dimensioning criteria were used.
Table 6.8 - Load-bearing capacity of the runway – admissible passages of the conditioning aircraft
Zone
Maximum strain Maximum number of
coverages Maximum number of passages
Fokker100 B 737-100 Fokker 100 Boeing
737-100 Fokker 100
Boeing 737-
100
Runway
18-36
z1 3.39E-04 3.14E-04 5.50E+04 8.00E+04 1.91E+05 2.78E+05
z2 3.43E-04 3.17E-04 5.20E+04 7.70E+04 1.81E+05 2.68E+05
z3 2.29E-04 2.29E-04 3.10E+05 4.50E+05 1.08E+06 1.57E+06
z4 2.50E-04 2.37E-04 2.00E+05 2.60E+05 6.96E+05 9.05E+05
z5 2.45E-04 2.29E-04 2.15E+05 3.00E+05 7.48E+05 1.04E+06
As the table shows, the worst-case corresponds to 1.8 x 10⁵ passages of the Fokker 100
aircraft for a life of the runway of 20 years. So, the maximum number of passages per year by
aircrafts with the take-off weight of 400kN is 9000 passages.
6.5 Final considerations
In this study was evaluated the load-bearing capacity of the flexible runway and rigid aprons.
There were made load tests using the falling weight to cover the whole area of study. After
this the ground penetrating radar was used, combined with coring tests, we could divide our
pavements into zones with homogeneous structural behaviour.
With this knowledge we could establish a structural behaviour model, which was used to
calculate the PCN, using the structural analyse methodology.
For the runway 18-36 the PCN values are superior to the ACN values of the aircrafts that use
the airfield, considering appropriate reporting a PCN = 42/F/B/W/T.
The rigid pavements of the parking aprons have PCN values inferior to the ACN of the
heaviest aircraft (Fokker 100), but superior to the ACN of the rest of the fleet.

57
Besides the ACN-PCN classification, the assessment of the possibility of operation on the
runway of aircrafts with the maximum take-off weight of 400 kN is presented in this chapter.
Two aircrafts with a maximum take-off weight of 400 kN were chosen in order to calculate
the load-bearing capacity of the runway in terms of admissible coverages number. It was
concluded that the most unfavourable case corresponds to 1.8 x 10⁵ movements of Fokker
100 for a structural life of 20 years, which transforms into 9000 coverages per year of the
same aircraft. So the airport can operate aircrafts with maximum take-off weight of 400 kN
without any reinforcement.

58
7 Conclusions
Nowadays, the need of air transportation is growing rapidly. The aircrafts are getting bigger
and bigger, the aircraft traffic flow is higher than always and the number of passengers has
reached an incredible high number. From commuters to around the globe passengers, from
the smallest aircrafts to the biggest ones, the runways needs to be able to support as many
types of aircrafts that are available now, but also the ones that will be developed in the future.
Figure 7.1 shows the four biggest aircrafts available in this moment around the world.
Figure 7.1 – The biggest world aircrafts (Daily Mail, 2015)

59
The evaluation of an airport runway is the most important process in the designing and
execution of new runways, or in reinforcing an already existing runway in order to support
new aircrafts.
This dissertation intended to explain the whole evaluation process of an airport runway. It is
divided into two main evaluations, structural and functional. Both of them were explained for
flexible and rigid pavements.
This study enables the reader to follow the steps presented, to calculate all the necessary
mathematical expressions and to use the respective soft wares, including FAARFIELD,
COMFAA or BISAR3.0.
The evaluation process is a combination of visual inspection, records research and non-
destructive tests. Also, a computational process is required, this allows a greater precision and
with a good interpretation and application of the results, the runway will be evaluated very
close to its real characteristics.
The structural evaluation regards the use of the GPR and the use of the FWD with the
corresponding interpretation of the results. The interpretation of FWD data together with
layer thickness data obtained from GPR contributes to the improvement of the methodology
for structural pavement evaluation.
As for the functional evaluation, the use of the GRIP Tester is a very important test,
performed to find the friction coefficient of the runway. The safety of the aircrafts depends on
this functional characteristic. Also the “sand patch” method was used to find the depth texture
of the surface layer. There were analysed load tests performed with the falling weight
deflectometer in flexible and rigid pavements. After this, the ground penetrating radar was
used, combined with soil boring tests. In this way, it became possible to divide the pavements
into zones with homogeneous structural behaviour.
With this knowledge structural behaviour models were established, which were used to
calculate the PCN, based on structural analysis methodology.
This evaluation concludes into a PCN number, or even better into an ACN/PCN
classification, which is the ratio between the Aircraft Classification Number and the
Pavement Classification Number. This ratio is the most common condition that a specific
aircraft may use a certain runway. It is expressed so that the aircraft pilots can relate their

60
Aircraft Classification Number with the runway’s Pavement Classification Number. All that
is required is to search for the ACN that is presented in the aircraft’s manual and to compare
it with the PCN of the airport’s runway; this information is available and should be reported
by the airport’s authorities. So a pilot that compares these two numbers and concludes that
the PCN is bigger than the ACN, he can land safely.
Besides this classification, a structural lifetime expectation of the runway is calculated. This
is possible using the same computer program as before, BISAR3.0; but this time is calculated
the number of passages of some specific aircrafts that can be operated safely on the
respective runway. This way we can predict a possible reinforcement of the runway, or the
construction of a new one. All of this is included in what is called, airport pavements
evaluation.
The evaluation of airport pavements is critical, as influences the safety of the aircrafts, the
operation costs, the comfort, as well as the enviroment.

61

62
8 Bibliography
AC:150/5320-6E. (2009, 09 14). Airport Pavement Design and Evaluation.
AC:150/5335-5C. (2014, 08 14). Standardized Method of Reporting Airport Pavement
Strength - PCN.
Alves. (2007). Metodologias de auscultacao de pavimentos rodoviarios. Lisbon: M. Sc.
dissertation. IST.
Antunes. (1993). Avaliacao da capacidade de carga de pavimentos utilizando ensaios
dinamicos. Lisbon: Ph.D Thesis. IST.
ASTM. (1996). Standard Test Method for Measuring Pavement Macrotexture Depth using a
Volumetric Technique International Standards and Recommended Practices. ASTM E
965.
Chou. (1982) Structural Behaviour of Flexible Airfield Pavements – Proc. Bearing Capacity
of Roads and Airfields, Trondheim, June 1982.
COST. (2002). Falling Weight Deflectometer, Final report of the Action, Final Draft, 2002.
Daily mail (2015). Mail online, http://www.dailymail.co.uk/news/article-2227304/Spruce-
Goose-Howard-Hughes-On-65th-anniversary-brief-flight-history-monumental-
folly.html. Consulted on 2015
Federal Aviation Administration (FAA). (1997). Measurements, Construction and
Maintenance of Skid Resistant Airport Pavement Surfaces.
Fontul. (2004). Structural evaluation of flexible pavements using non-destructive tests.
Coimbra: Ph.D. Thesis. University of Coimbra.
Fontul, Antunes. (2000). Utilização do Equipamento Radar na Caracterização Estrutural de
Pavimentos 1º Congresso Rodoviário Português, Lisboa, 2000.
Fontul, Antunes. (2006). Classificação ACN/PCN dos Pavimentos dos Caminhos de
Circulação e da Plataforma de Estacionamento do Aeroporto do Pico, Relatório 409
LNEC Lisboa, Dezembro de 2006.
63
FORMAT. (2004). Assessment of high speed monitoring prototype equipment, Fully
Optimised Road Maintenance report D12, 2004.
International Civil Aviation Organization (ICAO) (1999) International Standards and
Recommended Practices. Aerodromes. Annex 14 to the International Civil Aviation.
Volume I. Aerodrome Design and Operations”, 3rd Ed., Julho 1999.
Irwin. (2002). Backcalculation: An Overview and Perspective” FWD / Backcalculation
Workshop 3 – 6th International Conference on the Bearing Capacity of Roads,
Railways and Airfields - BCRA 2002, Cascais, 2002.
Sorensen. (2004). Seismic Transducers for Monitoring FWD Deflections. Denmark: Dynatest
International.
Tholen. (1980). Falling Weight Deflectometer – A Devise for Bearing Capacity
Measurement. Properties and Performance. Stockholm: Department of Highway
Engineering Royal Institute of Technology.
Transport Canada. (2004). Aircraft Classification Numbers (ACN’s) – Transport Canada,
Technical Programs (AARJD), Ottawa, Canada (www.tc.gc.ca), June 2004.
Ulriksen. (1982). Application of impulse radar to civil engineering . Lund University of
Technology.
Witczak. (1989). Uses and Misuses of Pavement Deflection Data – 2nd Int. Symposium on
Pavement Evaluation and Overlay Design– Rio de Janeiro, 1989.