Embed Size (px)
Citation preview
30 TRANSPORTATION RESEARCH RECORD 1273
Airport Terminal Designs with Automated People Movers
Existing terminal designs generally require excessive passenger walking distances at the nation's major airports. Airport terminal designs with automated people mover (APM) systems to eliminate this problem are discussed. Data are presented describing the effects of eight existing APM systems on terminal designs and operations. Minimum and maximum walking distances at 18 airport terminals with and without APM systems are presented. The evolution of airport terminal design is also discussed. Two new centralized terminal designs with APM systems to improve airport operations, remote satellites and remote piers, are analyzed. The average passenger travel time was the measure of effectiveness for the analysis. Six prototype designs serving 10 to 30 million annual passengers each are used. The effects of using different percentages of transfer passengers on average travel time and terminal design are also analyzed. Remote satellite design is found to be better when the percentage of transfer passengers is lower but the remote pier is a better design when the percentage of transfer passengers is higher. However, unit terminal design with the APM system is found to be obsolete because its layout is inefficient and difficult for the first-time user.
The function of an airport terminal is to effect the transfer of passengers and goods from surface transportation to air transportation quickly with a minimum of confusion and discomfort. Most airport terminals in the United States were designed during the 1950s and 1960s when air transportation was undergoing rapid growth. However, because of increasing concern over environmental issues, not one major airport has been built in the United States since the Dallas-Fort Worth International Airport opened in 1974. In the meantime, the Airline Deregulation Act of 1978 has produced a tremendous increase in air travel. The number of passengers increased 63 percent between 1978 and 1987, from 275 to 447 million passengers. The trend is expected to continue well into the next century.
In 1987 the 16 most active airports accounted for half of the enplanements in the United States (J). As airport terminals grew to accommodate increasing passenger traffic, excessive passenger walking distances have been created at the nation's major airports. Passengers must move from terminals to aircraft, within the terminals themselves, or between terminals that can be miles apart. Delays and complications at these old terminals cause missed connections and passenger irritation, and result in poor airline equipment use. New terminal design with speedy and comfortable ground transportation, on the other hand, pleases passengers and boosts airline and airport revenues by minimizing aircraft ground time. It is clear that old terminal design concepts, widely used
Department of Civil and Environmental Engineering, Florida International University, The State University of Florida at Miami, Miami, Fla. 33199.
20 or 30 years ago, are no longer effective in these rapidly changing times.
An innovative Automated People Mover (APM) system has recently gained popularity in airport terminal design to solve this ground transportation problem. With APM, new airport terminal design and existing terminal modifications that were impossible 20 years ago have become common. Unfortunately, few studies have researched this new system's impact on airport terminal design. An application of two airport terminal designs with APMs to improve airport operations and efficiency is presented in this paper. It is believed that these designs will be useful for major airport expansions and new airport construction.
TERMINAL DESIGN CONCEPTS
The design of an airport terminal depends on the nature of air traffic to be accommodated at the airport. The design concept chosen is a function of a number of factors, including the size and nature of traffic demand, the number of participating airlines, the traffic split between international and domestic, the number of scheduled and charter flights, the available physical site, the principal access modes, and the type of financing (2 ,3). There are two different design concepts that describe the way passenger terminal facilities are physically arranged for passenger processing. "Centralized" means that all the elements in the passenger processing sequence are located as much as possible in one area. An example of a centralized concept is the pier design. "Decentralized," on the other hand, means that passenger processing facilities are arranged in smaller modular units and repeated in one or more buildings. An example of a decentralized concept is the unit terminal design in New York's John F. Kennedy International Airport. This unit terminal design is heavily decentralized and duplication of facilities is common.
Designs Before APM
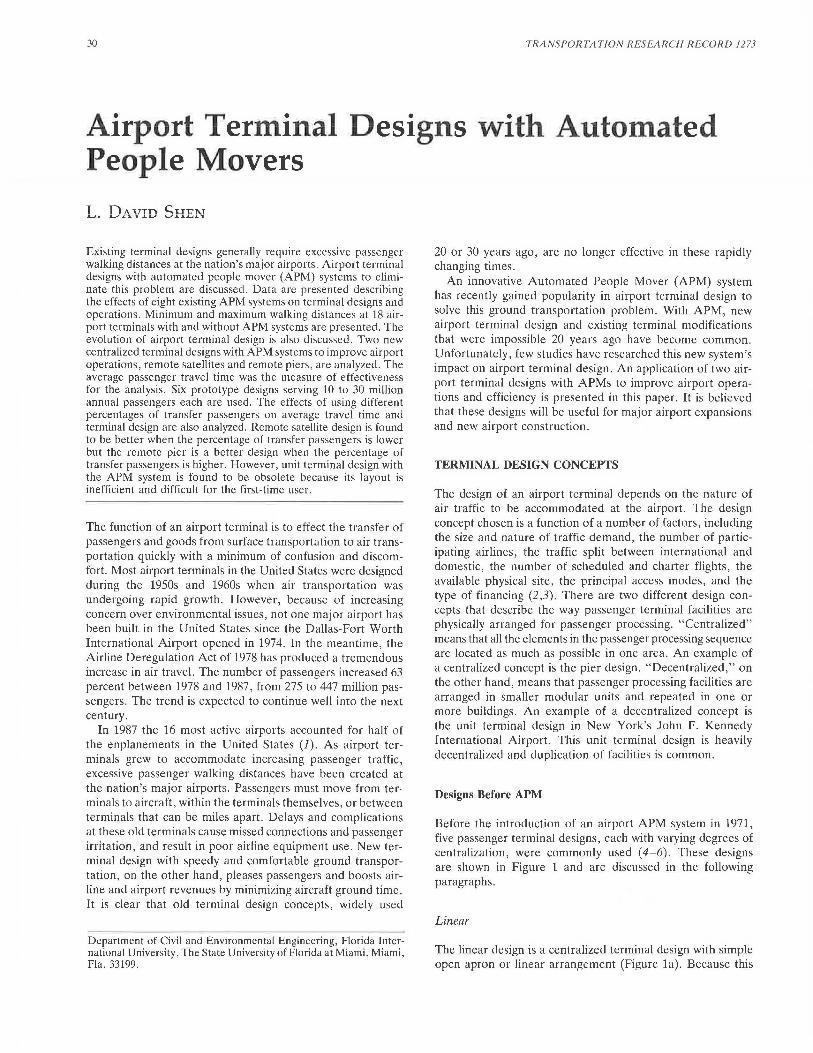
Before the introduction of an airport APM system in 1971, five passenger terminal designs, each with varying degrees of centralization, were commonly used (4-6). These designs are shown in Figure 1 and are discussed in the following paragraphs.
Linear
The linear design is a centralized terminal design with simple open apron or linear arrangement (Figure la). Because this
Shen
SUrfaoo -
(a) Linear
(b) Linear - Gate Arrival
SUrfa .. AoaNo
(c) Pier
( d) Satelllte
(e) Unit Terminal
·••+•+++• ++++++-t++
1iiroldo .I Aoc-
JirmlOol I
( f) Transporter
31
FIGURE 1 Typical airport terminal designs before APM systems.
type of arrangement has a small length of airside interface in relation to the size of the terminal, it is frequently used for low-volume airports such as Greenville-Spartanburg Airport in South Carolina where the number of gates required does not necessitate an inconvenient, long terminal. An extension of the linear design is the gate arrival design (Figure lb). The terminal is arranged in a circular fashion so that the traveler can park at a point opposite his departure gate to minimize walking distance. However, if more than one circular unit is used in the design, it becomes a decentralized processing design. This design can cause severe problems for interlining passengers. An example of this design is the Kansas City Airport.
Pier
The pier design is a centralized processing design. It is probably the most common system found at airports (Figure le). With central passenger processing, the facilities may not have sufficient perimeter to accommodate the corresponding number of aircraft gate positions. Therefore, a pier is added to the building to increase the perimeter without increasing the total floor area substantially. This design is capable of providing high passenger-processing capacity without excessive land requirements. This design is economical to build; how-
ever, excessive passenger walking distances are frequently required. Miami International Airport is an example of pier terminal design.
Satellite
The satellite design is a modification of the basic pier concept. Aircraft are parked around a rotunda at the end rather than along the side of the finger (Figure ld). The satellite design represents a move toward decentralization in the pier design and easily permits assembly of passengers as well as ticketing activities near the aircraft gates. Excessive passenger walking distance is a major problem for this design. San Francisco International Airport is an example of a combination pier and satellite design.
Unit Terminal
The unit terminal design uses two or more separate, selfcontained buildings. Each houses a single airline or group of airlines, and each has direct access to ground transportation (Figure le). New York's John F. Kennedy International Airport is an example of the unit terminal design. This design is usually justified at high-volume airports where walking dis-
32
tance is excessive for originating passengers with pier or satellite nesien Hnwr.vr.r, this rlr.,ign rnn create serious problems for interlining passengers. Therefore, unit terminals should not be used if a significant number of passengers at the airport are connecting passengers.
Trunspurrer
The transporter design uses a mobile conveyance system such as a bus or mobile lounge to take passengers to and from aircraft (Figure lf). This design can reduce walking distance significantly. However, it can also increase passenger processing time and create traffic problems on the aprons. Many studies indicate that transporters are best used for peak-period loads as supplements either to gate arrival or to pier terminal designs (7,8). The Dulles International Airport in Washington, D.C., is an example of a transporter design.
Design Problems
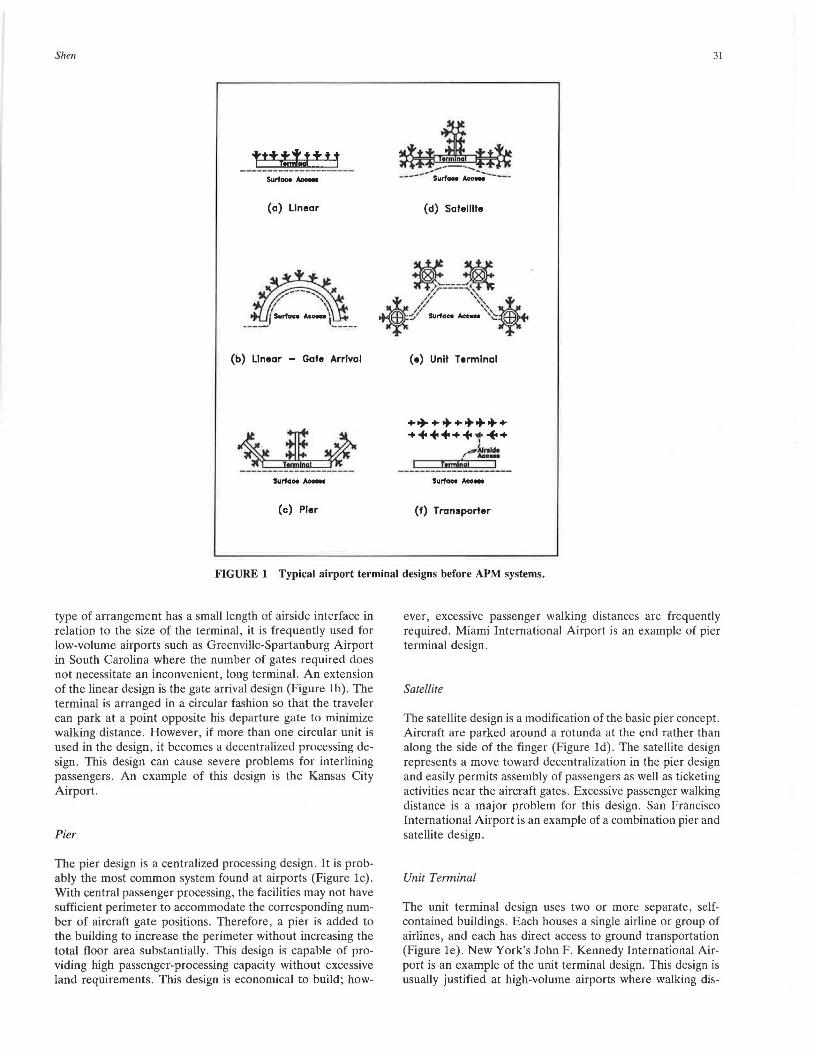
An airport commonly uses more than one design configuration in its passenger terminal layout to accommodate increased passenger volume and reduce passenger walking distance. Figure 2 shows the evolution of airport terminal design in the United States (9). Terminal designs at 27 major airports in the United States before APM was adopted are given in Table 1 ( 4). It is clear that the pier terminal design dominates at major airports, probably because this design generally provides good service to all passengers and expansion can be accomplished efficiently and flexibly. Because of their centralized design, pier terminals simplify airport security control. Basic terminal designs before APM was adopted are evaluated in Table 2.
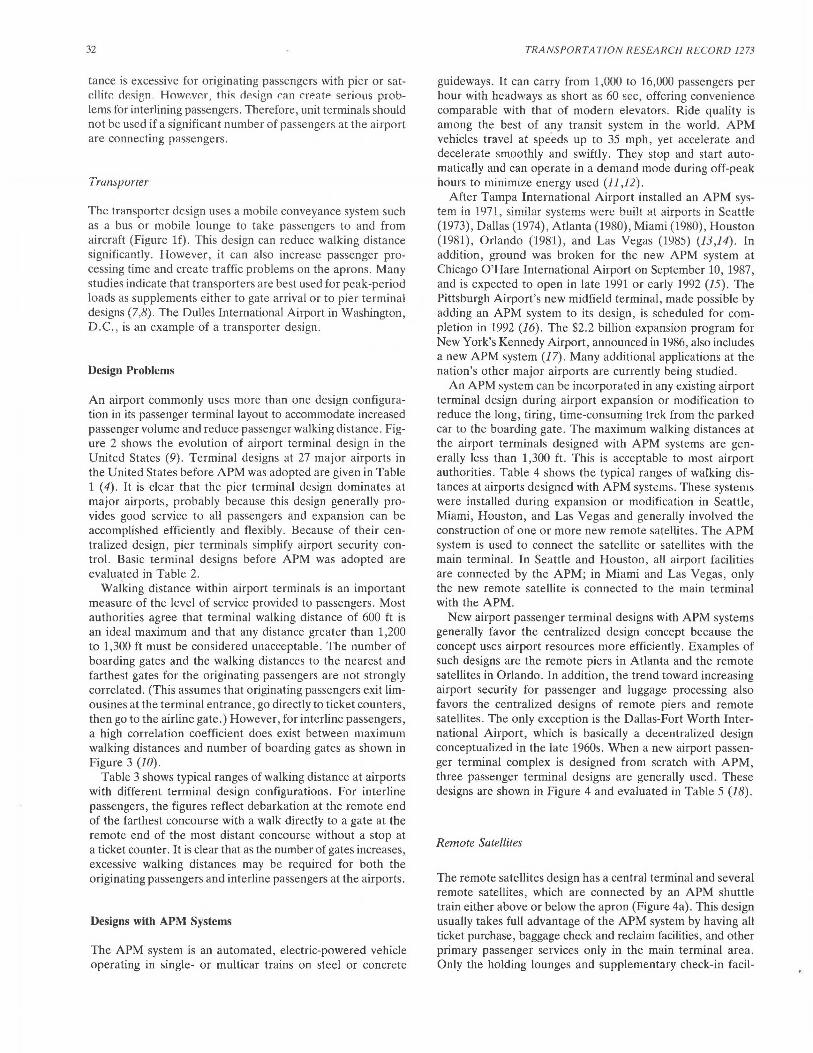
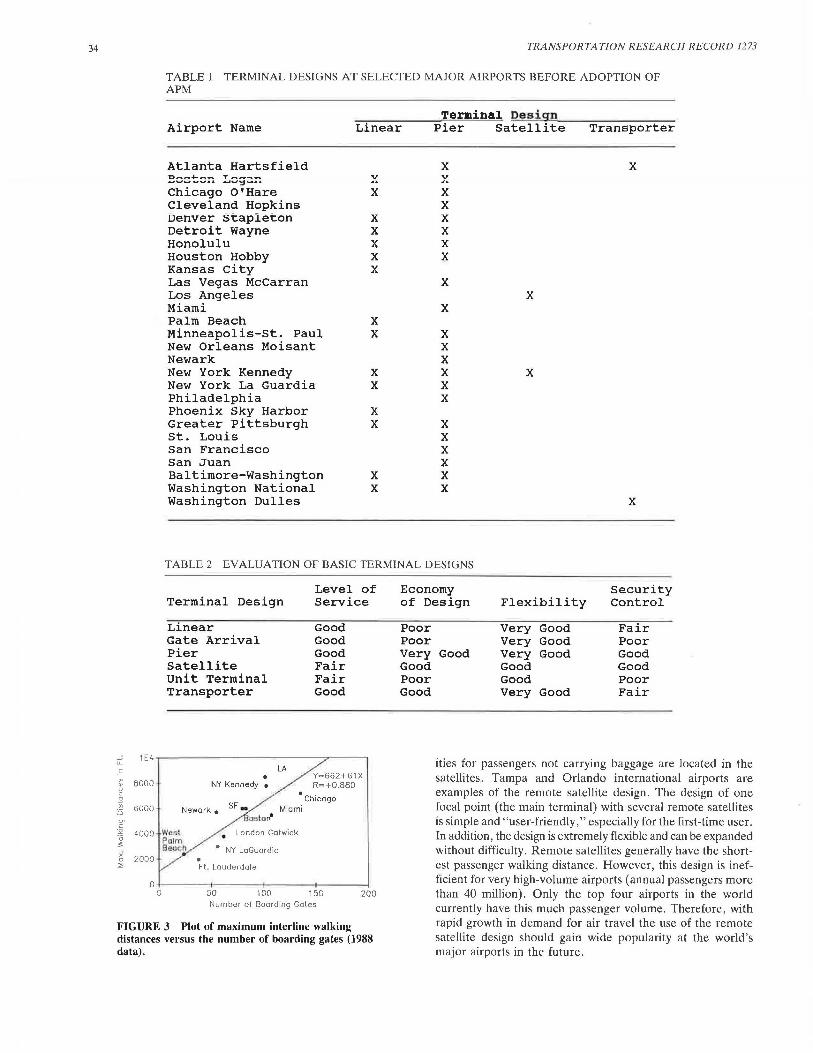
Walking distance within airport terminals is an important measure of the level of service provided to passengers. Most authorities agree that terminal walking distance of 600 ft is an ideal maximum and that any distance greater than 1,200 to 1,300 ft must be considered unacceptable. The number of boarding gates and the walking distances to the nearest and farthest gates for the originating passengers are not strongly correlated. (This assumes that originating passengers exit limousines at the terminal entrance, go directly to ticket counters, then go to the airline gate.) However, for interline passengers, a high correlation coefficient does exist between maximum walking distances and number of boarding gates as shown in Figure 3 (10).
Table 3 shows typical ranges of walking distance at airports with different terminal design configurations. For interline passengers, the figures reflect debarkation at the remote end of the farthest concourse with a walk directly to a gate at the remote end of the most distant concourse without a stop at a ticket counter. It is clear that as the number of gates increases, excessive walking distances may be required for both the originating passengers and interline passengers at the airports.
Designs with APM Systems
The APM system is an automated, electric-powered vehicle operating in single- or multicar trains on steel or concrete
TRANSPORTATION RESEARCH RECORD 1273
guideways. It can carry from 1,000 to 16,000 passengers per hour with headways as short as 60 sec, offering convenience comparable with that of modern elevators. Ride quality is among the best of any transit system in the world. APM vehicles travel at speeds up to 35 mph, yet accelerate and decelerate smoothly and swiftly. They stop and start automatically and can operate in a demand mode during off-peak hours to minimize energy used (Ji ,12).
After Tampa International Airport installed an APM system in 1971, similar systems were built at airports in Seattle (1973), Dallas (1974), Atlanta (1980), Miami (1980), Houston (1981), Orlando (1981), and Las Vegas (1985) (13,14) . ln addition, ground was broken for the new APM system at Chicago O'Hare International Airport on September 10, 1987, and is expected to open in late 1991 or early 1992 (15). The Pittsburgh Airport's new midfield terminal, made possible by adding an APM system to its design, is scheduled for completion in 1992 (16). The $2.2 billion expansion program for New York's Kennedy Airport, announced in 1986, also includes a new APM system (17). Many additional applications at the nation's other major airports are currently being studied.
An APM system can be incorporated in any existing airport terminal design during airport expansion or modification to reduce the long, tiring, time-consuming trek from the parked car to the boarding gate. The maximum walking distances at the airport terminals designed with APM systems are generally less than 1,300 ft. This is acceptable to most airport authorities. Table 4 shows the typical ranges of walking distances at airports designed with APM systems. These systems were installed during expansion or modification in Seattle, Miami, Houston, and Las Vegas and generally involved the construction of one or more new remote satellites. The APM system is used to connect the satellite or satellites with the main terminal. In Seattle and Houston, all airport facilities are connected by the APM; in Miami and Las Vegas, only the new remote satellite is connected to the main terminal with the APM.
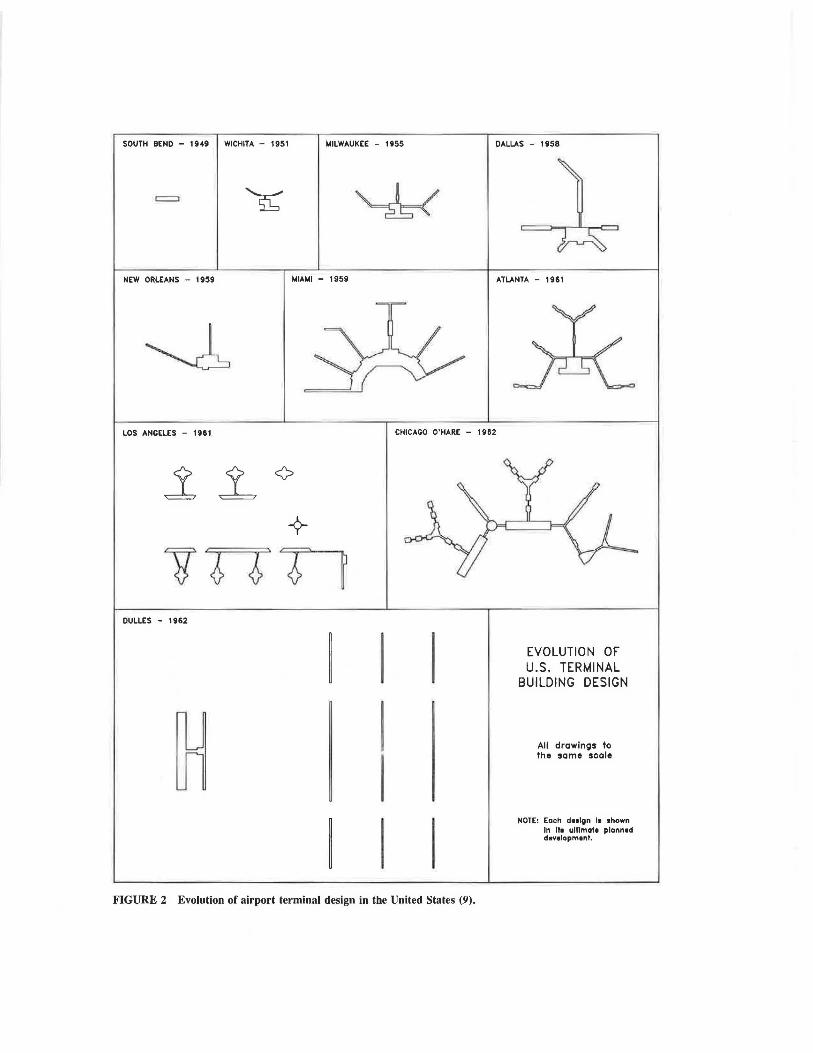
New airport passenger terminal designs with APM systems generally favor the centralized design concept because the concept uses airport resources more efficiently. Examples of such designs are the remote piers in Atlanta and the remote satellites in Orlando. In addition, the trend toward increasing airport security for passenger and luggage processing also favors the centralized designs of remote piers and remote satellites. The only exception is the Dallas-Fort Worth International Airport, which is basically a dt:ct:11lralizt:u uesign conceptualized in the late 1960s. When a new airport passenger terminal complex is designed from scratch with APM, three passenger terminal designs are generally used. These designs are shown in Figure 4 and evaluated in Table 5 (18).
Remote Satellites
The remote satellites design has a central terminal and several remote satellites, which are connected by an APM shuttle train either above or below the apron (Figure 4a). This design usually takes full advantage of the APM system by having all ticket purchase, baggage check and reclaim facilities, and other primary passenger services only in the main terminal area. Only the holding lounges and supplementary check-in facil-
SOUTH BEND - 1949 WICHITA - 1951 t.llLWAUKEE - 1955 DALLAS - 1958
=
NEW ORLEANS - 1959 MIAMI - 1959 ATLANTA - 1961
LOS ANGELES - 1961 CHICAGO O'HARE - 1962
DULLES - 1952
FIGURE 2 Evolution of airport terminal design in the United States (9).
EVOLUTION OF U.S. TERMINAL
BUILDING DESIGN
Alt drawings to the same scale
NOTE: Each dHlgn Is shown In Ito ultlmaf1 plannod development.
34
12 c
~
g 0
<;; ::s "' c ·~
0 ~
x 0
:;;>
1E4
8000
6000
4000
2000
TRANSPORTATION RESEARCH RECORD 1273
TABLE 1 TERMINAL DESIGNS AT SELECTED MAJOR AIRPORTS BEFORE ADOPTION OF APM
Terminal =D~e~s~i~g~n=-----------Airport Name Linear Pier Satellite Transporter
Atlanta Hartsfield o-,...~-- T --"'3-~-- """"".. ....,-~- .... Chicago O'Hare Cleveland Hopkins Denver Stapleton Detroit Wayne Honolulu Houston Hobby Kansas City Las Vegas McCarran Los Angeles Miami Palm Beach Minneapolis-St. Paul New Orleans Moisant Newark New York Kennedy New York La Guardia Philadelphia Phoenix Sky Harbor Greater Pittsburgh St. Louis San Francisco San Juan Baltimore-Washington Washington National Washington Dulles
x
x x x x x
x x
x x
x x
x x
x
x x x x x x
x
x
x x x x x x
x x x x x x
TABLE 2 EVALUATION OF BASIC TERMINAL DESIGNS
Level of Economy Terminal Design Service of Design
Linear Good Poor Gate Arrival Good Poor Pier Good Very Good Satellite Fair Good Unit Terminal Fair Poor Transporter Good Good
LA . Y=662+61 X NY Kennedy 0 R=+0.880 .
Chicago
Newark • SF• Miami osto n•
West London Gatwick ~aim
. eoch . NY LaGuordia
• Ft. Lauderdale
x
x
x
x
Security Flexibility Control
Very Good Fair Very Good Poor Very Good Good Good Good Good Poor Very Good Fair
0 -1----;~---t---------<-----l 0 50 100 150 200
Number of Boarding Gates
FIGURE 3 Plot of maximum interline walking distances versus the number of boarding gates (1988 data).
ities for passengers not carrying baggage are located in the satellites. Tampa and Orlando international airports are examples of the remote satellite design. The design of one focal point (the main terminal) with several remote satellites is simple and "user-friendly," especially for the first-time user. In addition, the design is extremely flexible and can be expanded without difficulty. Remote satellites generally have the shortest passenger walking distance. However, this design is inefficient for very high-volume airports (annual passengers more than 40 million). Only the top four airports in the world currently have this much passenger volume. Therefore, with rapid growth in demand for air travel the use of the remote satellite design should gain wide popularity at the world's major airports in the future.
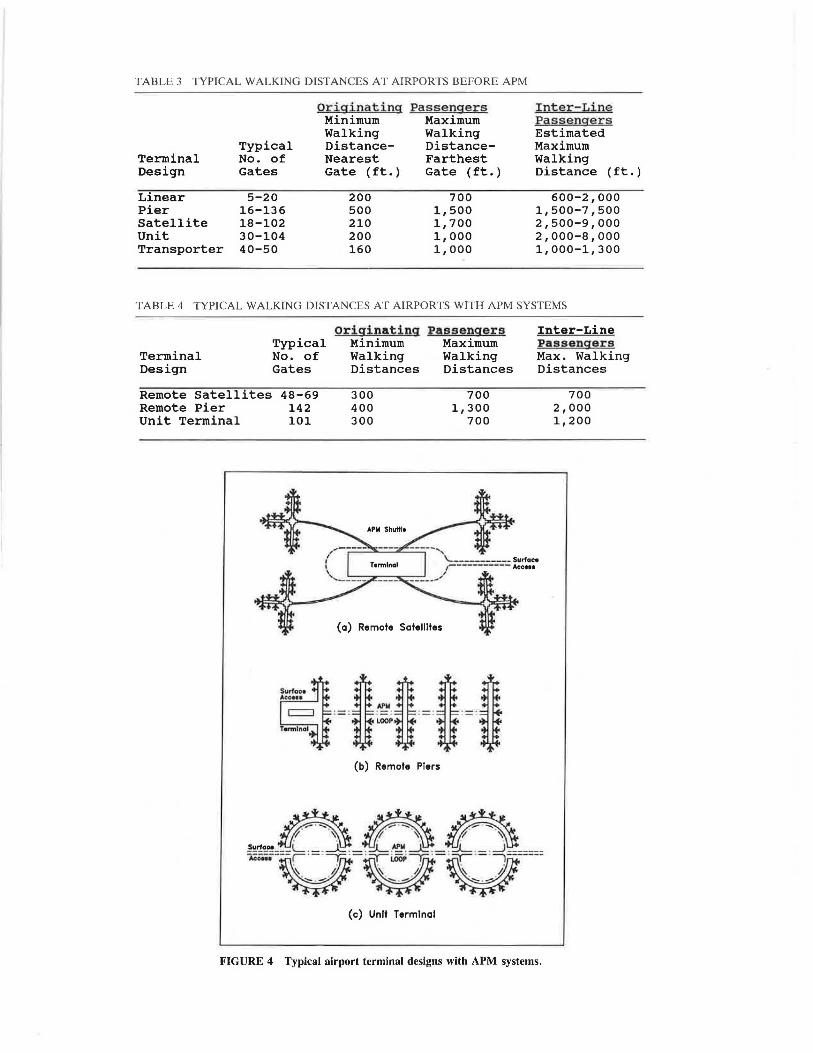
TABLE 3 TYPICAL WALKING DISTANCES AT AIRPORTS BEFORE APM
Terminal Design
Linear Pier Satellite Unit Transporter
Typical No. of Gates
5-20 16-136 18-102 30-104 40-50
Or iginat i ng Minimum Walking DistanceNearest Gate (ft.)
200 500 210 200 160
Passengers Maximum Walking DistanceFarthest Gate (ft.)
700 1,500 1,700 1,000 1,000
Inter- Li ne Passengers Estimated Maximum Walking Distance (ft. )
600-2,000 1,500-7,500 2,500-9,000 2,000-8,000 1,000-1,300
TABLE 4 TYPICAL WALKING DISTANCES AT AIRPORTS WITH APM SYSTEMS
originating Passengers Inter-Line Typical Minimum Maximum Passengers
Terminal No. of Walking Walking Max. Walking Design Gates Distances Distances Distances
Remote Satellites 48-69 300 700 700 Remote Pier 142 400 1,300 2,000 Unit Terminal 101 300 700 1,200
(a) Remote Satellltes
· - ·n ·~·n ·- ·D · - ·D ·- · ·- · ·- · ·- · lOOP
(b) Remote Piers
A/f:\A 1!!!.rlaa• __ L . _ _ ~. _ . !::J._ .lo!l'. ~. _ . !::J._ __ . _J _____ _ .w-a---I. - . ---y,:; . - . ;:;,.- i.OOP ---y,:; . - • ;:;,.- . - • 1------
v~v (c) Unit Termfnal
FIGURE 4 Typical airport terminal designs with APM systems.
36 TRANSPORTATION RESEARCH RECORD 1273
TABLE 5 EVALUATION OF TERMINAL DESIGNS WITH APM SYSTEMS
T .e.ve.l of Economy Sacurity Terminal Design Service of Design Flexibility Control
Remote Satellites Excellent Good Remote Piers Excellent Very Unit Terminal Good Poor
Remote Piers
The remote piers design is a new design completely based on the proven effectiveness of APM. Remote piers (concourses) are linked with a central terminal via APMs under the apron (Figure 4b). The terminal complex is located in the middle of the airfield between parallel runway systems. This facilitates aircraft movement between gates and runways, makes for short taxiing time, and alleviates congestion. This design allows efficient use of airport land: one of the highest volume airports in the world-Atlanta's Hartsfield International Airport-was built on an area of less than 3,800 acres using this design. Parallel alignment of the piers ensures efficient use of apron space. One thousand ft of apron separates the twin parallel piers so that two widebody jets can taxi between them at the same time, even as two other widebodies are parked at their gates (9). This design is ideal for high-volume airports, especially where there is a significant amount of domestic transfer and interlining. The proposed new Denver International Airport will use this design.
One major problem with remote piers is that extremely long piers may result in longer-than-desirable walking distances for transferring passengers. This is the case in Atlanta where the maximum walking distance for interline passengers-2,000 ft-is the same as the length of one remote pier. This problem can be overcome by using a design with a greater number of shorter piers.
Unit Terminal
The unit terminal design (Figure 4c) is the same as the previous unit terminal design before APM was adopted. The only difference is that the APM system is built into the terminal design to connect different unit buildings, therefore providing a high level of interline ground connection service. DallasFort Worth International Airport is an example of this design.
Very Good Excellent Good Very Good Excellent
Good Poor
This design is not efficient in iand use and requires an extraordinary amount of APM guideways to make it work. In addition, the design lacks a single focal point for transfer passengers and is too complex for the first-time user. Subsequently, no new airport has adopted this design since Dallas-Fort Worth Airport opened in 1974.
COST OF AIRPORT APM SYSTEMS
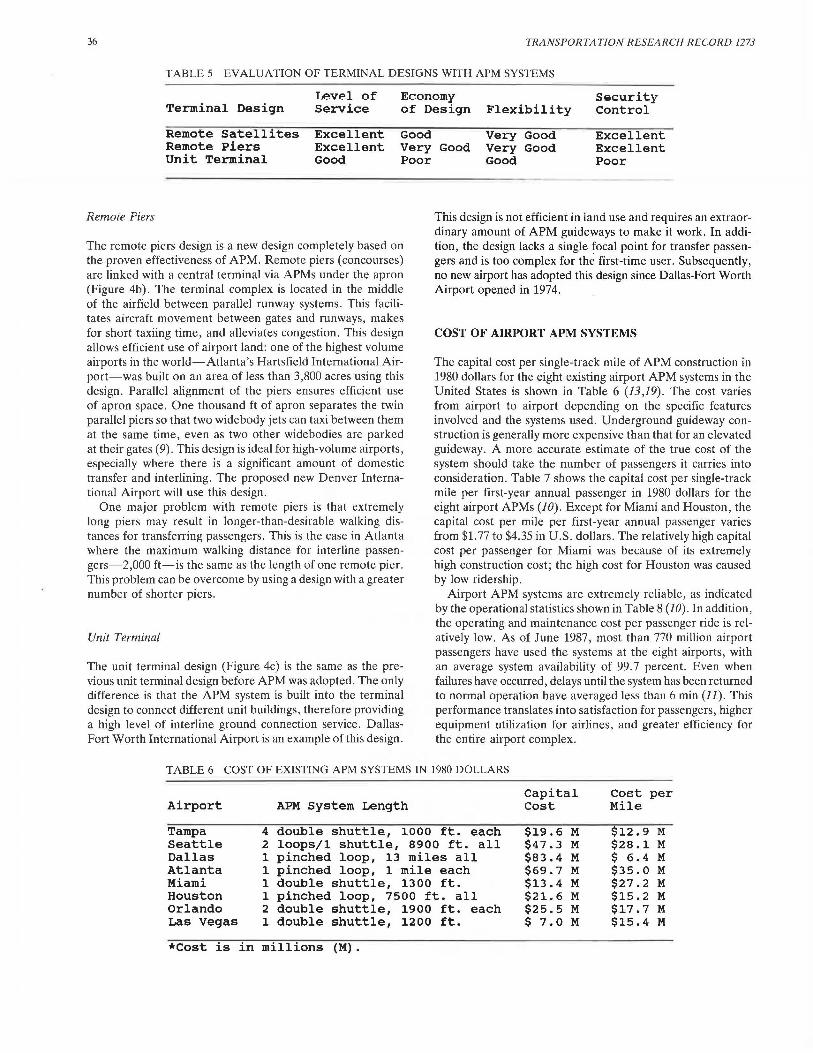
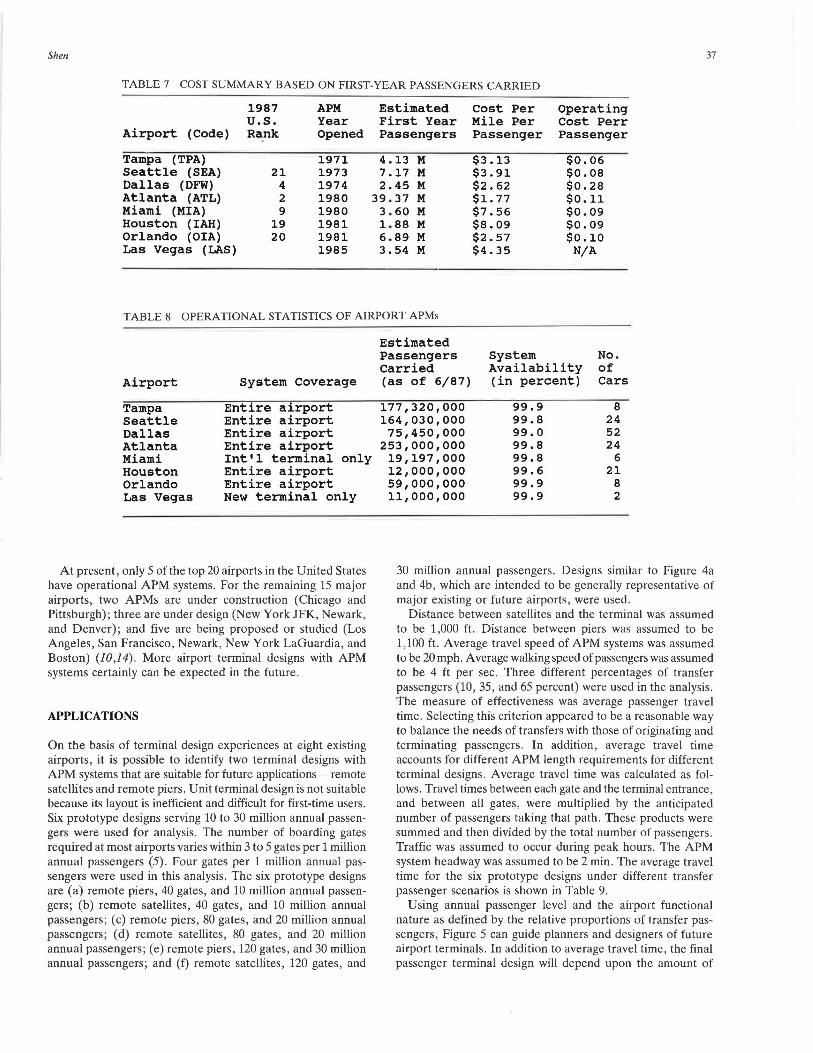
The capital cost per single-track mile of APM construction in 1980 dollars for the eight existing airport APM systems in the United States is shown in Table 6 (13,19). The cost varies from airport to airport depending on the specific features involved and the systems used. Underground guideway construction is generally more expensive than that for an elevated guideway. A more accurate estimate of the true cost of the system should take the number of passengers it carries into consideration. Table 7 shows the capital cost per single-track mile per first-year annual passenger in 1980 dollars for the eight airport APMs (10). Except for Miami and Houston, the capital cost per mile per first-year annual passenger varies from $1.77 to $4.35 in U.S. dollars. The relatively high capital cost per passenger for Miami was because of its extremely high construction cost; the high cost for Houston was caused by low ridership.
Airport APM systems are extremely reliable, as indicated by the operational statistics shown in Table 8 (10). In addition, the operating and maintenance cost per passenger ride is relatively low. As of June 1987, most than 770 million airport passengers have used the systems at the eight airports, with an average system availability of 99. 7 percent. Even when failures have occurred, delays until the system has been returned to normal operation have averaged less than 6 min (11). This performance translates into satisfaction for passengers, higher equipment utilization for airlines, and greater efficiency for the entire airport complex.
TABLE 6 COST OF EXISTING APM SYSTEMS IN 1980 DOLLARS
Capital Cost per Airport APM System Length Cost Mile
Tampa 4 double shuttle, 1000 ft. each $19.6 M $12.9 M Seattle 2 loops/1 shuttle, 8900 ft. all $47.3 M $28.l M Dallas 1 pinched loop, 13 miles all $83.4 M $ 6.4 M Atlanta 1 pinched loop, 1 mile each $69.7 M $35.0 M Miami 1 double shuttle, 1300 ft. $13.4 M $27.2 M Houston 1 pinched loop, 7500 ft. all $21. 6 M $15.2 M Orlando 2 double shuttle, 1900 ft. each $25.5 M $17.7 M Las Vegas 1 double shuttle, 1200 ft. $ 7.0 M $15.4 M
*Cost is in millions (M).
Shen 37
TABLE 7 COST SUMMARY BASED ON FIRST-YEAR PASSENGERS CARRIED
1987 APM Estimated cost Per Operating U.S. Year First Year Mile Per Cost Perr
Airport (Code) Rank Opened Passengers Passenger Passenger
Tampa (TPA) 1971 4.13 M $3.13 $0.06 Seattle {SEA) 21 1973 7.17 M $3.91 $0.08 Dallas (DFW) 4 1974 2.45 M $2.62 $0.28 Atlanta (ATL) 2 1980 39 . 37 M $1.77 $0.11 Miami (MIA) 9 1980 3.60 M $7.56 $0.09 Houston (IAH) 19 1981 1.88 M $8.09 $0.09 Orlando {OIA) 20 1981 6.89 M $2.57 $0.10 Las Vegas (LAS) 1985 3.54 M $4.35 N/A
TABLE 8 OPERATIONAL STATISTICS OF AIRPORT APMs
Airport System Coverage
Tampa Entire airport Seattle Entire airport Dallas Entire airport Atlanta Entire airport Miami Int'l terminal only Houston Entire airport Orlando Entire airport Las Vegas New terminal only
At present, only 5 of the top 20 airports in the United States have operational APM systems. For the remaining 15 major airports, two APMs are under construction (Chicago and Pittsburgh); three are under design (New York JFK, Newark, and Denver); and five are being proposed or studied (Los Angeles, San Francisco, Newark, New York LaGuardia, and Boston) (10,14). More airport terminal designs with APM systems certainly can be expected in the future.
APPLICATIONS
On the basis of terminal design experiences at eight existing airports, it is possible to identify two terminal designs with APM systems that are suitable for future applications-remote satellites and remote piers. Unit terminal design is not suitable because its layout is inefficient and difficult for first-time users. Six prototype designs serving 10 to 30 million annual passengers were used for analysis. The number of boarding gates required at most airports varies within 3 to 5 gates per 1 million annual passengers (5). Four gates per 1 million annual passengers were used in this analysis. The six prototype designs are (a) remote piers, 40 gates, and 10 million annual passengers; (b) remote satellites, 40 gates, and 10 million annual passengers; ( c) remote piers, 80 gates, and 20 million annual passengers; (d) remote satellites, 80 gates , and 20 million annual passengers; (e) remote piers, 120 gates, and 30 million annual passengers; and (f) remote satellites, 120 gates, and
Estimated Passengers system No. carried Availability of (as of 6/87) (in percent) Cars
177,320,000 99.9 8 164,030,000 99.8 24 75,450,000 99.0 52
253,000,000 99.8 24 19,197,000 99.8 6 12,000,000 99.6 21 59,000,000 99.9 8 11,000,000 99.9 2
30 million annual passengers. Designs similar to Figure 4a and 4b, which are intended to be generally representative of major existing or future airports, were used .
Distance between satellites and the terminal was assumed to be 1,000 ft. Distance between piers was assumed to be 1,100 ft. Average travel speed of APM systems was assumed to be 20 mph. Average walking speed of passengers was assumed to be 4 ft per sec. Three different percentages of transfer passengers (10, 35, and 65 percent) were used in the analysis. The measure of effectiveness was average passenger travel time. Selecting this criterion appeared to be a reasonable way to balance the needs of transfers with those of originating and terminating passengers. In addition, average travel time accounts for different APM length requirements for different terminal designs . Average travel time was calculated as follows. Travel times between each gate and the terminal entrance, and between all gates, were multiplied by the anticipated number of passengers taking that path. These products were summed and then divided by the total number of passengers. Traffic was assumed to occur during peak hours. The APM system headway was assumed to be 2 min . The average travel time for the six prototype designs under different transfer passenger scenarios is shown in Table 9.
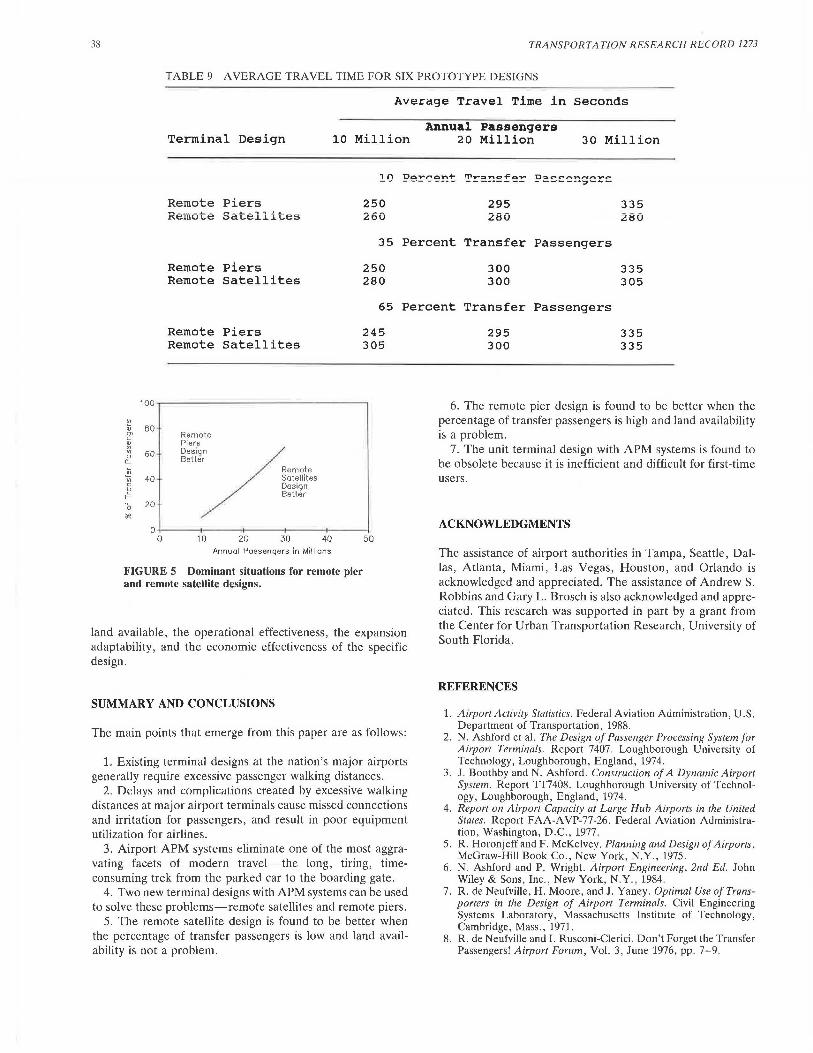
Using annual passenger level and the airport functional nature as defined by the relative proportions of transfer passengers, Figure 5 can guide planners and designers of future airport terminals. In addition to average travel time, the final passenger terminal design will depend upon the amount of
38 TRANSPORTATION RESEARCH RECORD 1273
TABLE 9 AVERAGE TRAVEL TIME FOR SIX PROTOTYPE DESIGNS
Average Travel Time in Seconds
Annual Passengers Terminal Design 10 Million 20 Million 30 Million
Remote Piers Remote Satellites
!IJ
250 260
295 280
U:::a C!' eo.onrt.o,,...c.. -----··-:.---335 280
35 Percent Transfer Passengers
Remote Piers Remote Satellites
250 280
300 300
335 305
65 Percent Transfer Passengers
100
i" BO " CJ>
c :x "' 60 D
[)._
~
-2! 40 ~ D
t-'= 0 20 ~
0 0
Remote Piers Remote Satellites
Remote Piers ,.,;,/ Better
Remote Satellites Design Better
I 10 20 30 40
Annual Passengers in Millions
FIGURE S Dominant situations for remote pier and remote satellite designs.
245 305
50
land available, the operational effectiveness, the expansion adaptability, and the economic effectiveness of the specific design.
SUMMARY AND CONCLUSIONS
The main points that emerge from this paper are as follows:
1. Existing terminal designs at the nation's major airports generally require excessive passenger walking distances.
?.. Del"ys "nci complic"tions created hy excessive walking distances at major airport terminals cause missed connections and irritation for passengers, and result in poor equipment utilization for airlines.
3. Airport APM systems eliminate one of the most aggravating facets of modern travel-the long, tiring, timeconsuming trek from the parked car to the boarding gate.
4. Two new terminal designs with APM systems can be used to solve these problems-remote satellites and remote piers.
5. The remote satellite design is found to be better when the percentage of transfer passengers is low and land availability is not a problem.
295 300
335 335
6. The remote pier design is found to be better when the percentage of transfer passengers is high and land availability is a problem.
7. The unit terminal design with APM systems is found to be obsolete because it is inefficient and difficult for first-time users.
ACKNOWLEDGMENTS
The assistance of airport authorities in Tampa, Seattle, Dallas, Atlanta, Miami, Las Vegas, Houston, and Orlando is acknowledged and appreciated. The assistance of Andrew S. Robbins and Gary L. Brosch is also acknowledged and appreciated. This research was supported in part by a grant from the Center for Urban Transportation Research, University of South Florida.
REFERENCES
1. Airport Activity Statistics. Federal Aviation Administration, U.S. Department of Transportation, 1988.
2. N. Ashford et al. The Design of Passenger Processing System for Airport Terminals. Report 7407. Loughborough University of Technology, Loughborough, England, 1974.
3. J. Boothby and N. Ashford. Construction of A Dynamic Airport System. Report TT7408. Loughborough University of Technology, Loughborough, England, 1974.
4. Report on Airport Capacity at Large Hub Airports in the United States. Report FAA-AVP-77-26. Federal Aviation Administration, Washington, D.C., 1977.
5. R. Horonjeff and F. McKelvey. Planning and Design of Airports. McGraw-Hill Book Co., New York, N.Y., 1975.
6. N. Ashford and P. Wright. Airport Engineering, 2nd Ed. John Wiley & Sons, Inc., New York, N.Y., 1984.
7. R. de Neufville, H. Moore, and J. Yaney. Optimal Use of Transporters in the Design of Airport Terminals. Civil Engineering Systems Laboratory, Massachusetts Institute of Technology, Cambridge, Mass., 1971.
8. R. de Neufville and I. Rusconi-Clerici. Don't Forget the Transfer Passengers! Airport Forum, Vol. 3, June 1976, pp. 7-9.
Shen
9. Airline Airporl Terminal Design Possibilities. Leigh Fisher Associates, Inc., San Francisco, Calif., 1963.
10. L. D. Shen. Aulomated People Mover's Impact on Airport Circulation. ITE Compendium of 1989 Technical Papers, Institute of Transportation Engineers, San Diego, Calif., 1989.
11. Automated People Mover and Regional Development. Westinghouse Electric Corp., West Mifflin, Pa., 1980.
12. Automated Transit System Planning Guide. Westinghouse Transportation Systems and Support Division, West Mifflin, Pa., 1981.
13. D. Elliot. Applications of Automated People Mover Systems at Airports. In Automated People Movers: Engineering and Management in Major Activity Centers . ASCE, New York, N.Y., 1985, pp. 384-398.
14. D . Elliot. Automated People Movers: A Gateway for Growth. In Proc. , 2nd International Conference on Automated People Movers, Miami, Fla., 1989.
15. Chicago O'Hare International Airport Factsheet. Chicago Department of Aviation, 1988.
39
16. APM Systems. AEG Westinghouse Transportation Systems, Inc., Pittsburgh, Pa., 1988.
17. D. Maddison, P. Mandie, and K. Godfrey, Jr. Crunch Time for Airport Engineering. Civil Engineering, ASCE, April 1987.
18. L. D. Shen. Airport Planning and Design with New Technology. Proceedings of ASEE Southeast Section Annual Meeting, Tuscaloosa, Ala., March 1989.
19. Westinghouse AGT Systems Installed. AEG Westinghouse Transportation Systems, Inc., Pittsburgh, Pa., 1988.
The statements and opinions expressed in this paper are the sole responsibility of the author.
Publication of this paper sponsored by Committee on Airport Landside Operations.