Embed Size (px)
Citation preview

Airtel Africa plc
H1’20 Financial Results
25 October 2019
Disclaimer
Important Information
By reading this presentation you agree to be bound by the following conditions.The information contained in this presentation in relation to Airtel Africa plc ("Airtel Africa") and its subsidiaries has been prepared solely for use at this presentation. The presentation is not directed to, or intended fordistribution to or use by, any person or entity that is a citizen or resident or located in any jurisdiction where such distribution, publication, availability or use would be contrary to law or regulation or which would requireany registration or licensing within such jurisdiction.References in this presentation to "Airtel Africa", "Group", "we", "us" and "our" when denoting opinion refer to Airtel Africa and its subsidiaries.
Forward-looking statements
This document contains certain forward-looking statements including "forward-looking" statements made within the meaning of Section 21E of the United States Securities Exchange Act of 1934, regarding our intentions,beliefs or current expectations concerning, amongst other things, our results of operations, financial condition, liquidity, prospects, growth, strategies and the economic and business circumstances occurring from time totime in the countries and markets in which the Group operates.These statements are often, but not always, made through the use of words or phrases such as "believe," "anticipate," "could," "may," "would," "should," "intend," "plan," "potential," "predict," "will," "expect," "estimate,""project," "positioned," "strategy," "outlook", "target" and similar expressions.It is believed that the expectations reflected in this document are reasonable, but they may be affected by a wide range of variables that could cause actual results to differ materially from those currently anticipated.All such forward-looking statements involve estimates and assumptions that are subject to risks, uncertainties and other factors that could cause actual future financial condition, performance and results to differmaterially from the plans, goals, expectations and results expressed in the forward-looking statements and other financial and/or statistical data within this communication.Among the key factors that could cause actual results to differ materially from those projected in the forward-looking statements are uncertainties related to the following: the impact of competition from illicit trade; theimpact of adverse domestic or international legislation and regulation; changes in domestic or international tax laws and rates; adverse litigation and dispute outcomes and the effect of such outcomes on Airtel Africa’sfinancial condition; changes or differences in domestic or international economic or political conditions; the ability to obtain price increases and the impact of price increases on consumer affordability thresholds; adversedecisions by domestic or international regulatory bodies; the impact of market size reduction and consumer down-trading; translational and transactional foreign exchange rate exposure; the impact of serious injury,illness or death in the workplace; the ability to maintain credit ratings; the ability to develop, produce or market new alternative products and to do so profitably; the ability to effectively implement strategic initiatives andactions taken to increase sales growth; the ability to enhance cash generation and pay dividends and changes in the market position, businesses, financial condition, results of operations or prospects of Airtel Africa.Past performance is no guide to future performance and persons needing advice should consult an independent financial adviser. The forward-looking statements contained in this document reflect the knowledge andinformation available to Airtel Africa at the date of preparation of this document and Airtel Africa undertakes no obligation to update or revise these forward-looking statements, whether as a result of new information,future events or otherwise. Readers are cautioned not to place undue reliance on such forward-looking statements.No statement in this communication is intended to be, nor should be construed as, a profit forecast or a profit estimate and no statement in this communication should be interpreted to mean that earnings per share ofAirtel Africa plc for the current or any future financial periods would necessarily match, exceed or be lower than the historical published earnings per share of Airtel Africa plc.Financial data included in this document are presented in US$ rounded to the nearest millions. Therefore, discrepancies in the tables between totals and the sums of the amounts listed may occur due to such rounding.
Audience
The material in this presentation is provided for the purpose of giving information about Airtel Africa and its subsidiaries to investors only and is not intended for general consumers. Airtel Africa, its directors, employees,agents or advisers do not accept or assume responsibility to any other person to whom this material is shown or into whose hands it may come and any such responsibility or liability is expressly disclaimed.All numbers are reported currency unless stated differently. All numbers are reported currency numbers unless indicated differently. The growth numbers YoY are provided on constant currency basis unless stateddifferently.
2
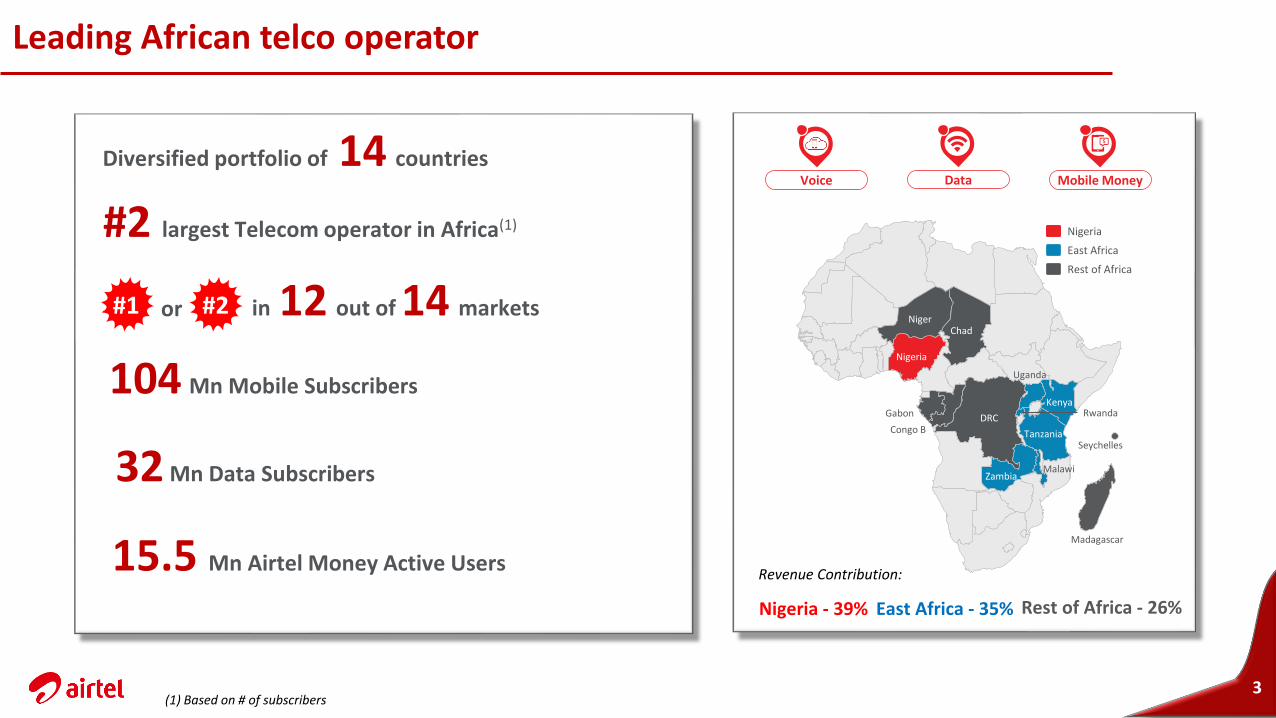
Leading African telco operator
(1) Based on # of subscribers
Diversified portfolio of 14 countries
in 12 out of 14 markets
#2 largest Telecom operator in Africa(1)
#1 or
Voice Data Mobile Money
Zambia
Nigeria
Gabon
Chad
Malawi
DRC
Niger
Madagascar
Uganda
Congo B Tanzania
KenyaRwanda
Seychelles
Nigeria
Rest of Africa
East Africa
3
104 Mn Mobile Subscribers
32 Mn Data Subscribers
15.5 Mn Airtel Money Active Users
Nigeria - 39% East Africa - 35% Rest of Africa - 26%
Revenue Contribution:
#2

Operational Performance
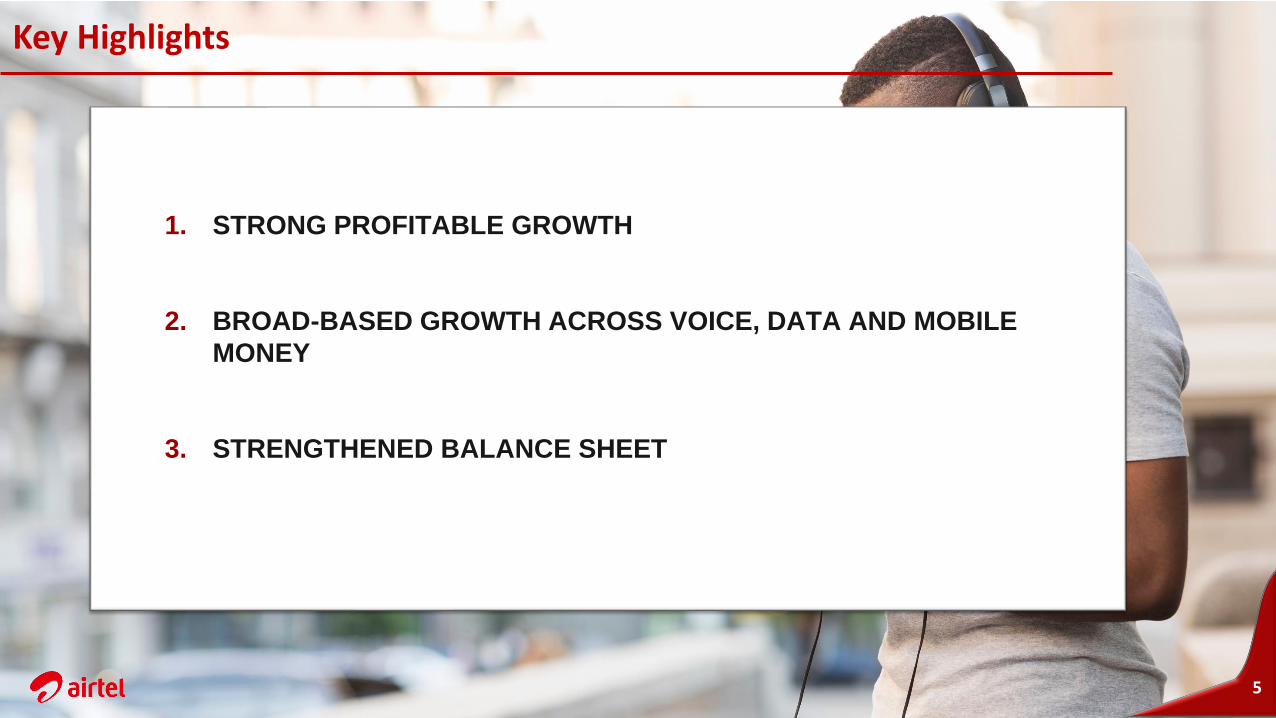
Key Highlights
5
1. STRONG PROFITABLE GROWTH
2. BROAD-BASED GROWTH ACROSS VOICE, DATA AND MOBILE
MONEY
3. STRENGTHENED BALANCE SHEET
6
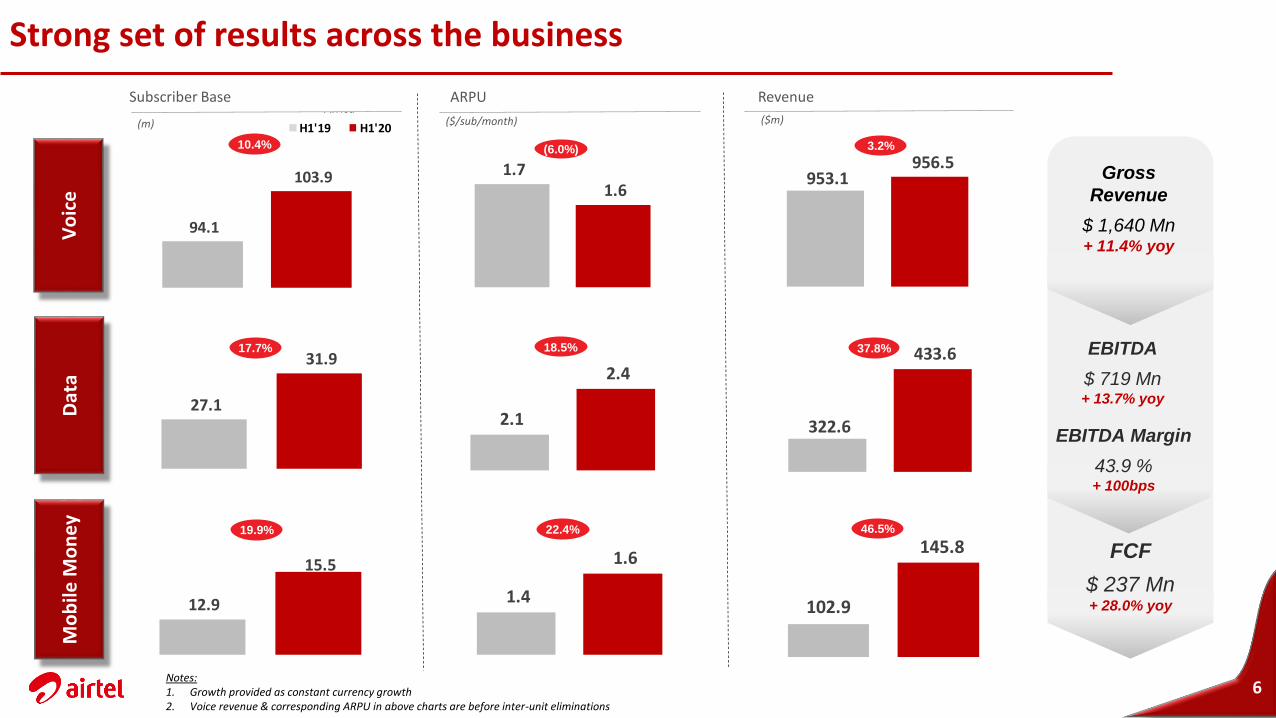
Strong set of results across the businessV
oic
eD
ata
Mo
bile
Mo
ne
yRevenue
3.2%
($m)
37.8%
46.5%
Subscriber Base
(m)
10.4%
19.9%
17.7%
ARPU
(6.0%)
($/sub/month)
22.4%
18.5%
Notes:1. Growth provided as constant currency growth 2. Voice revenue & corresponding ARPU in above charts are before inter-unit eliminations
94.1
103.9
27.1
31.9
12.9
15.5
13.8%
14.9%
Africa
H1'19 H1'20
1.7 1.6
2.1
2.4
1.4
1.6
953.1 956.5
322.6
433.6
102.9
145.8
Gross
Revenue
$ 1,640 Mn+ 11.4% yoy
EBITDA
$ 719 Mn + 13.7% yoy
FCF
$ 237 Mn + 28.0% yoy
EBITDA Margin
43.9 % + 100bps
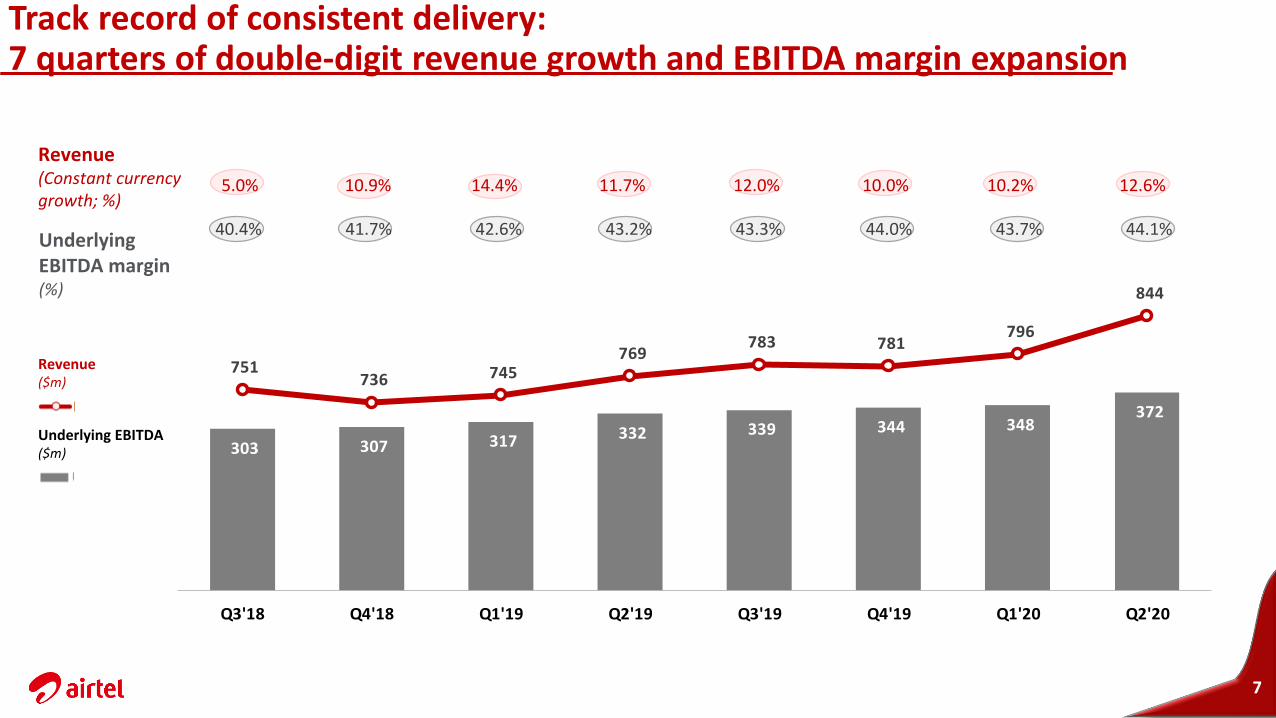
Track record of consistent delivery: 7 quarters of double-digit revenue growth and EBITDA margin expansion
Underlying EBITDA ($m)
Revenue ($m)
7
5.0%
40.4%
10.9%
41.7%
14.4%
42.6%
11.7%
43.2%
12.0%
43.3%
10.0%
44.0%
10.2%
43.7%
12.6%
44.1%Underlying EBITDA margin (%)
Revenue (Constant currency growth; %)
303 307 317 332 339 344 348 372
751 736 745
769 783 781
796
844
-
100
200
300
400
500
600
500
550
600
650
700
750
800
850
900
Q3'18 Q4'18 Q1'19 Q2'19 Q3'19 Q4'19 Q1'20 Q2'20
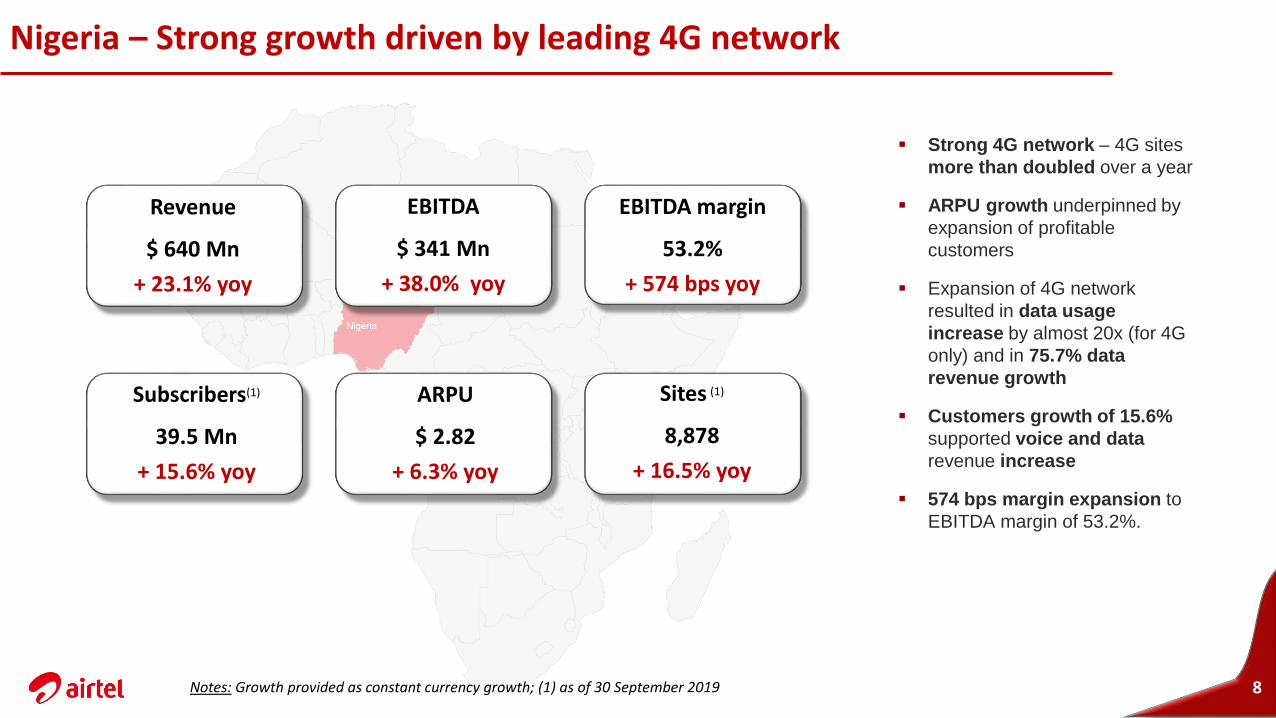
Nigeria – Strong growth driven by leading 4G network
8
▪ Strong 4G network – 4G sites
more than doubled over a year
▪ ARPU growth underpinned by
expansion of profitable
customers
▪ Expansion of 4G network
resulted in data usage
increase by almost 20x (for 4G
only) and in 75.7% data
revenue growth
▪ Customers growth of 15.6%
supported voice and data
revenue increase
▪ 574 bps margin expansion to
EBITDA margin of 53.2%.
Revenue
$ 640 Mn
+ 23.1% yoy
EBITDA
$ 341 Mn
+ 38.0% yoy
EBITDA margin
53.2%
+ 574 bps yoy
Subscribers(1)
39.5 Mn
+ 15.6% yoy
ARPU
$ 2.82
+ 6.3% yoy
Sites (1)
8,878
+ 16.5% yoy
Notes: Growth provided as constant currency growth; (1) as of 30 September 2019
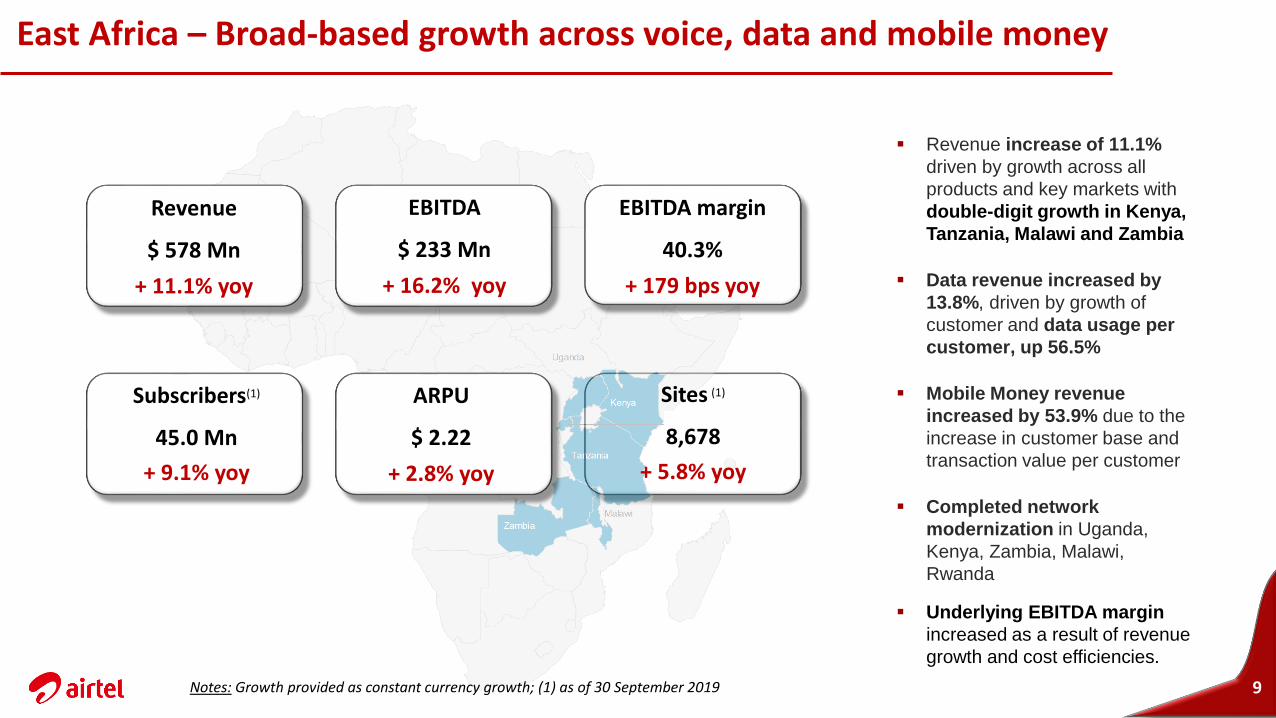
East Africa – Broad-based growth across voice, data and mobile money
9
▪ Revenue increase of 11.1%
driven by growth across all
products and key markets with
double-digit growth in Kenya,
Tanzania, Malawi and Zambia
▪ Data revenue increased by
13.8%, driven by growth of
customer and data usage per
customer, up 56.5%
▪ Mobile Money revenue
increased by 53.9% due to the
increase in customer base and
transaction value per customer
▪ Completed network
modernization in Uganda,
Kenya, Zambia, Malawi,
Rwanda
▪ Underlying EBITDA margin
increased as a result of revenue
growth and cost efficiencies.
Revenue
$ 578 Mn
+ 11.1% yoy
EBITDA
$ 233 Mn
+ 16.2% yoy
EBITDA margin
40.3%
+ 179 bps yoy
Subscribers(1)
45.0 Mn
+ 9.1% yoy
ARPU
$ 2.22
+ 2.8% yoy
Sites (1)
8,678
+ 5.8% yoy
Notes: Growth provided as constant currency growth; (1) as of 30 September 2019
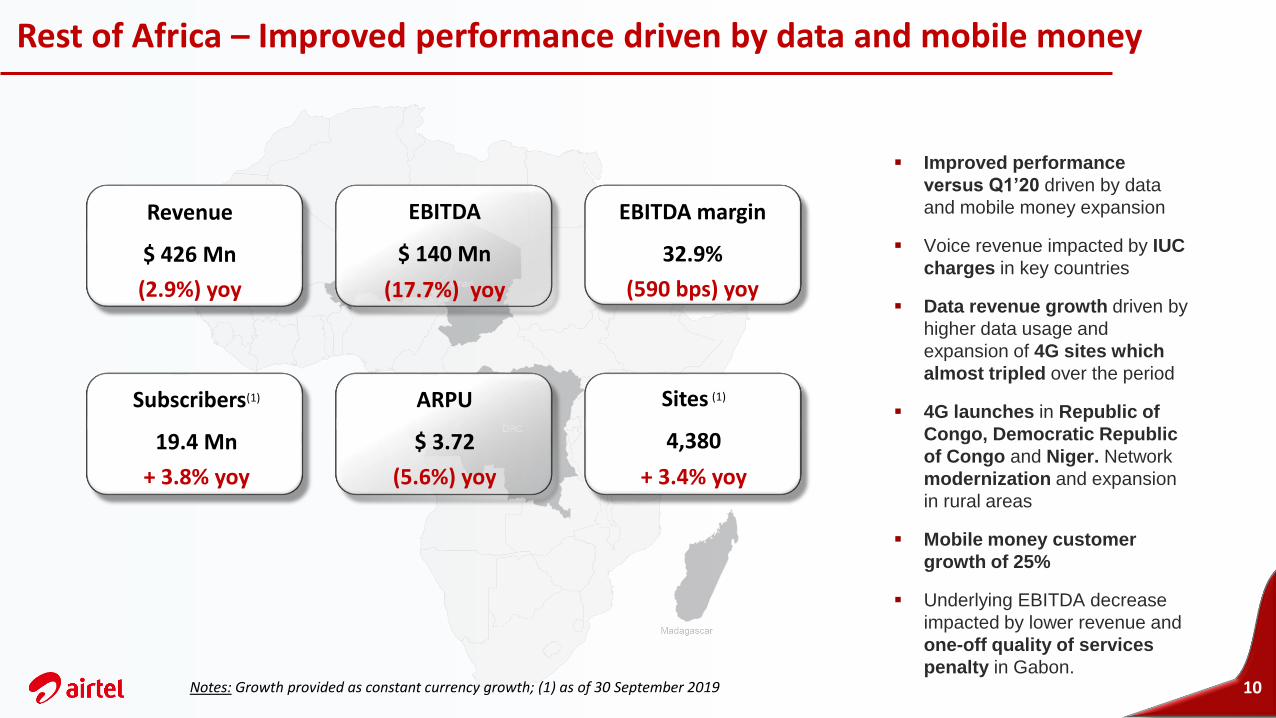
Rest of Africa – Improved performance driven by data and mobile money
10
▪ Improved performance
versus Q1’20 driven by data
and mobile money expansion
▪ Voice revenue impacted by IUC
charges in key countries
▪ Data revenue growth driven by
higher data usage and
expansion of 4G sites which
almost tripled over the period
▪ 4G launches in Republic of
Congo, Democratic Republic
of Congo and Niger. Network
modernization and expansion
in rural areas
▪ Mobile money customer
growth of 25%
▪ Underlying EBITDA decrease
impacted by lower revenue and
one-off quality of services
penalty in Gabon.
Revenue
$ 426 Mn
(2.9%) yoy
EBITDA
$ 140 Mn
(17.7%) yoy
EBITDA margin
32.9%
(590 bps) yoy
Subscribers(1)
19.4 Mn
+ 3.8% yoy
ARPU
$ 3.72
(5.6%) yoy
Sites (1)
4,380
+ 3.4% yoy
Notes: Growth provided as constant currency growth; (1) as of 30 September 2019

Airtel Africa plc
25th October 2019
Financial Performance
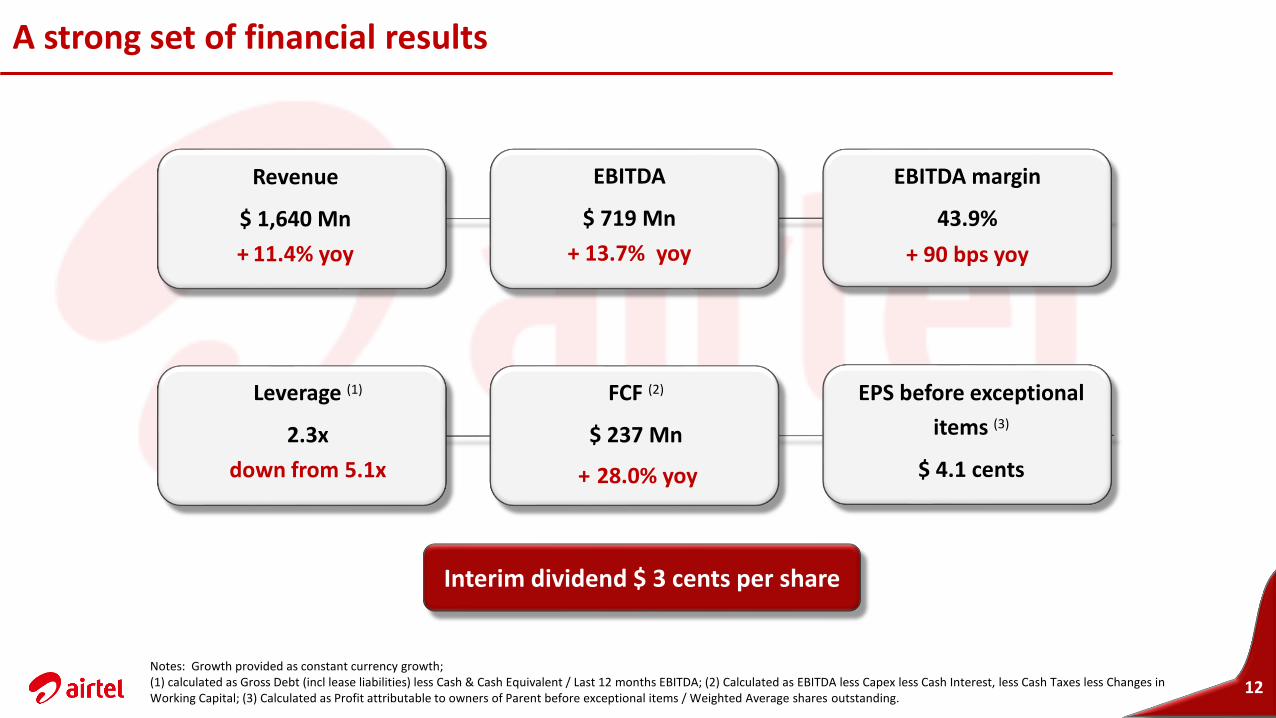
A strong set of financial results
12Notes: Growth provided as constant currency growth; (1) calculated as Gross Debt (incl lease liabilities) less Cash & Cash Equivalent / Last 12 months EBITDA; (2) Calculated as EBITDA less Capex less Cash Interest, less Cash Taxes less Changes in Working Capital; (3) Calculated as Profit attributable to owners of Parent before exceptional items / Weighted Average shares outstanding.
12
Revenue
$ 1,640 Mn
+ 11.4% yoy
EBITDA
$ 719 Mn
+ 13.7% yoy
EBITDA margin
43.9%
+ 90 bps yoy
Leverage (1)
2.3x
down from 5.1x
FCF (2)
$ 237 Mn
EPS before exceptional
items (3)
$ 4.1 cents+ 28.0% yoy
Interim dividend $ 3 cents per share
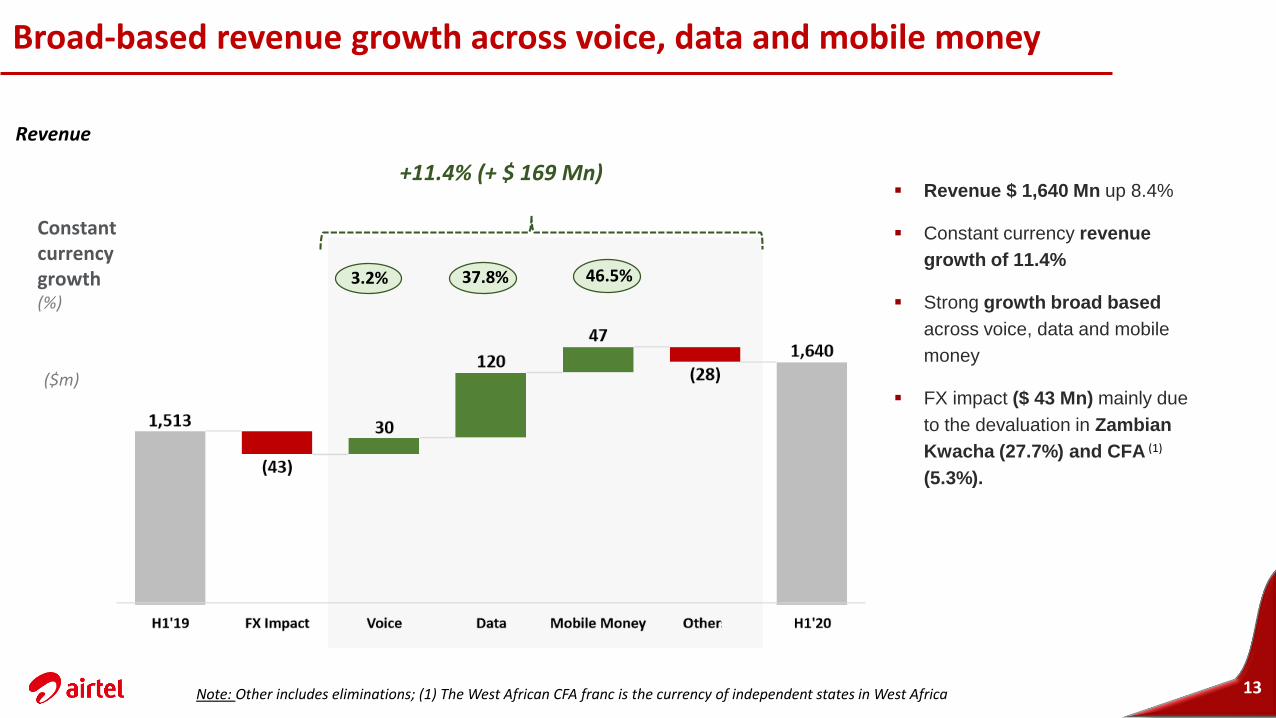
Broad-based revenue growth across voice, data and mobile money
13
▪ Revenue $ 1,640 Mn up 8.4%
▪ Constant currency revenue
growth of 11.4%
▪ Strong growth broad based
across voice, data and mobile
money
▪ FX impact ($ 43 Mn) mainly due
to the devaluation in Zambian
Kwacha (27.7%) and CFA (1)
(5.3%).
Constant currency growth (%)
3.2% 37.8% 46.5%
($m)
+11.4% (+ $ 169 Mn)
Revenue
Note: Other includes eliminations; (1) The West African CFA franc is the currency of independent states in West Africa
398
296
265
199
144
91 99
44 43 66
42
Nigeria East Africa Rest of Africa
Voice Data Mobile money Other
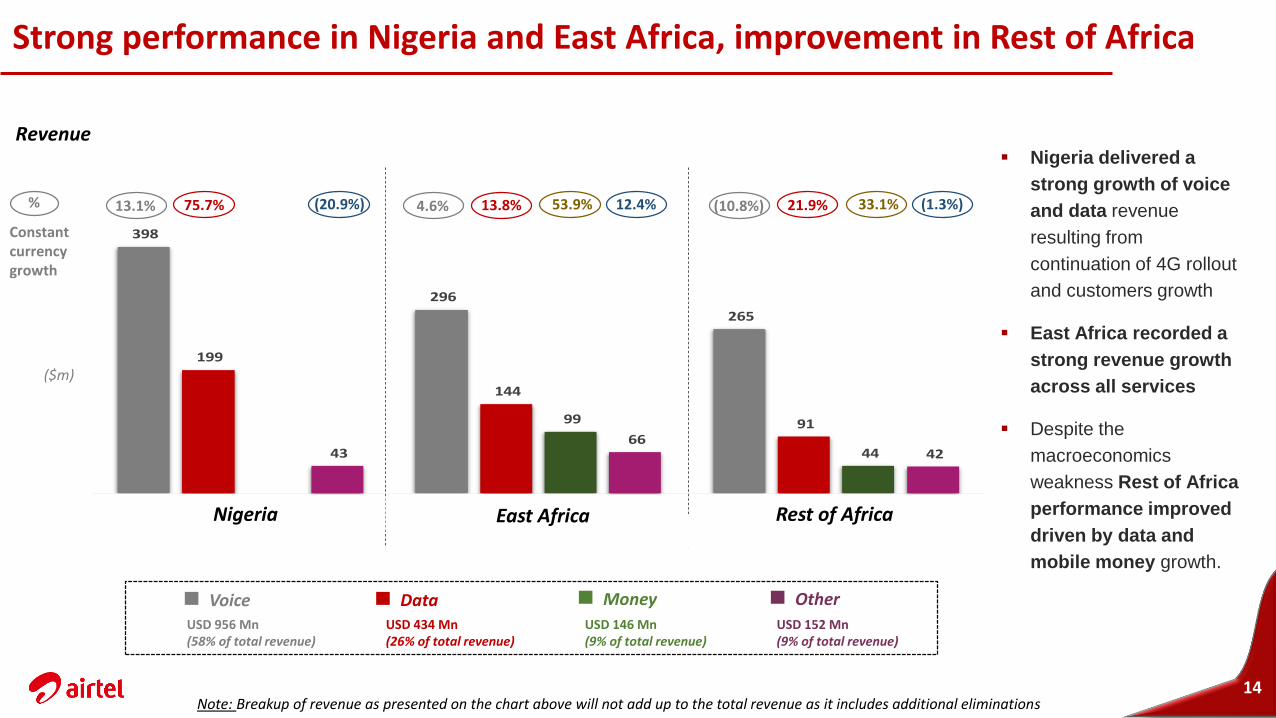
Strong performance in Nigeria and East Africa, improvement in Rest of Africa
14
▪ Nigeria delivered a
strong growth of voice
and data revenue
resulting from
continuation of 4G rollout
and customers growth
▪ East Africa recorded a
strong revenue growth
across all services
▪ Despite the
macroeconomics
weakness Rest of Africa
performance improved
driven by data and
mobile money growth.
Constant currency growth
($m)
%
USD 146 Mn (9% of total revenue)
USD 434 Mn (26% of total revenue)
USD 956 Mn (58% of total revenue)
(10.8%) 21.9% 33.1% (1.3%)
USD 152 Mn (9% of total revenue)
4.6% 13.8% 53.9% 12.4%13.1% 75.7% (20.9%)
Nigeria Rest of Africa
Voice Data Money Other
Revenue
Note: Breakup of revenue as presented on the chart above will not add up to the total revenue as it includes additional eliminations
East Africa
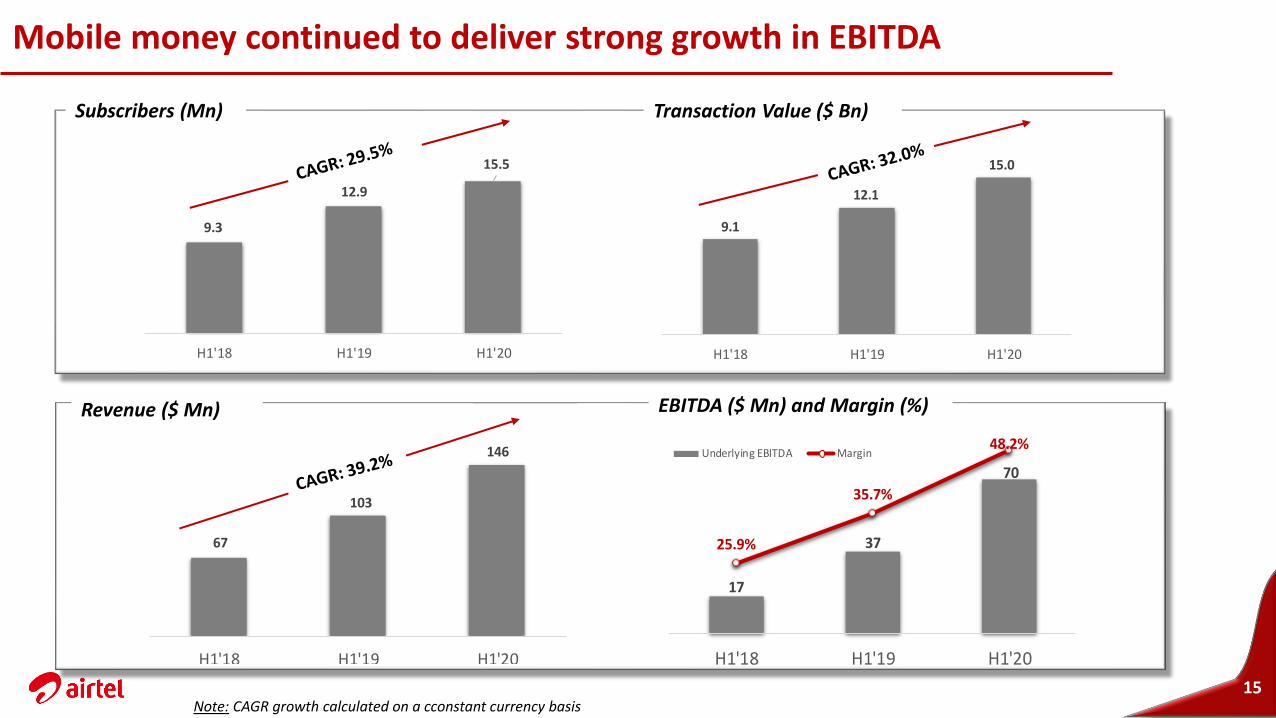
Mobile money continued to deliver strong growth in EBITDA
Note: CAGR growth calculated on a cconstant currency basis15
Subscribers (Mn) Transaction Value ($ Bn)
Revenue ($ Mn)
9.1
12.1
15.0
H1'18 H1'19 H1'20
67
103
146
H1'18 H1'19 H1'20
EBITDA ($ Mn) and Margin (%)
9.3
12.9
15.5
H1'18 H1'19 H1'20
17
37
70
25.9%
35.7%
48.2%
10.0%
15.0%
20.0%
25.0%
30.0%
35.0%
40.0%
45.0%
-5
5
15
25
35
45
55
65
75
85
H1'18 H1'19 H1'20
Underlying EBITDA Margin
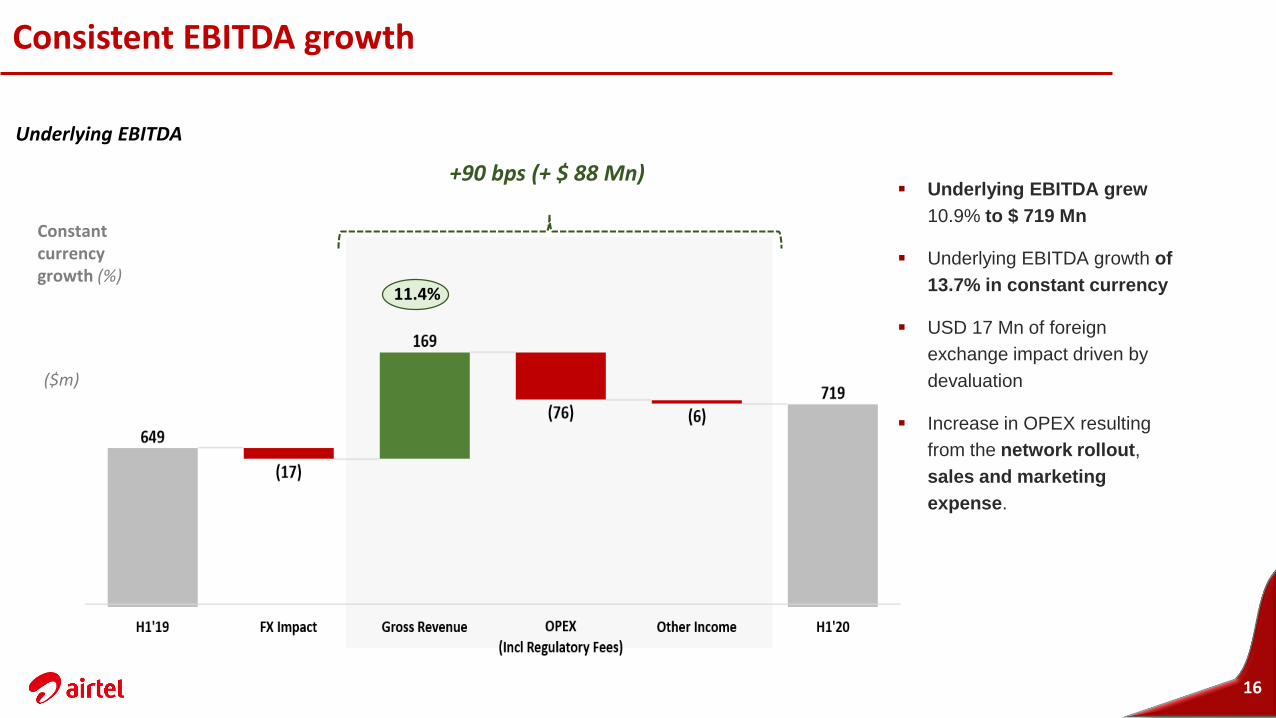
Consistent EBITDA growth
16
▪ Underlying EBITDA grew
10.9% to $ 719 Mn
▪ Underlying EBITDA growth of
13.7% in constant currency
▪ USD 17 Mn of foreign
exchange impact driven by
devaluation
▪ Increase in OPEX resulting
from the network rollout,
sales and marketing
expense.
11.4%
+90 bps (+ $ 88 Mn)
Constant currency growth (%)
($m)
Underlying EBITDA
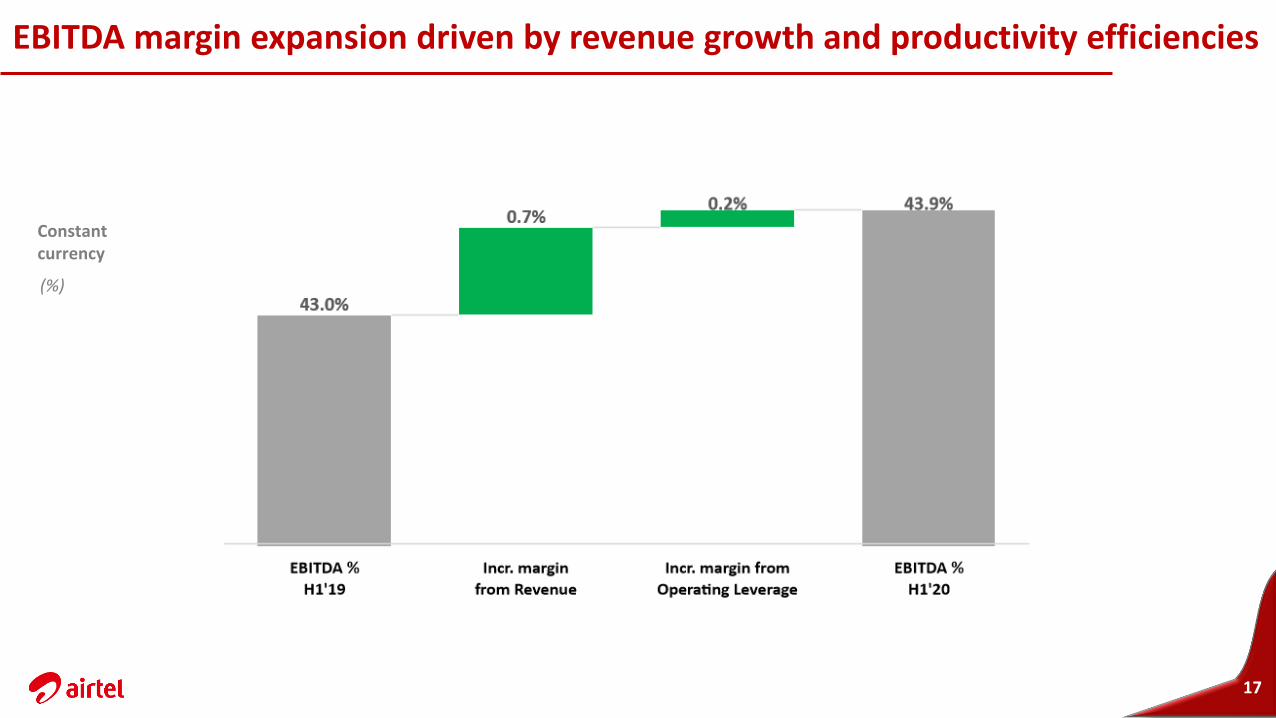
EBITDA margin expansion driven by revenue growth and productivity efficiencies
17
Constant currency
(%)
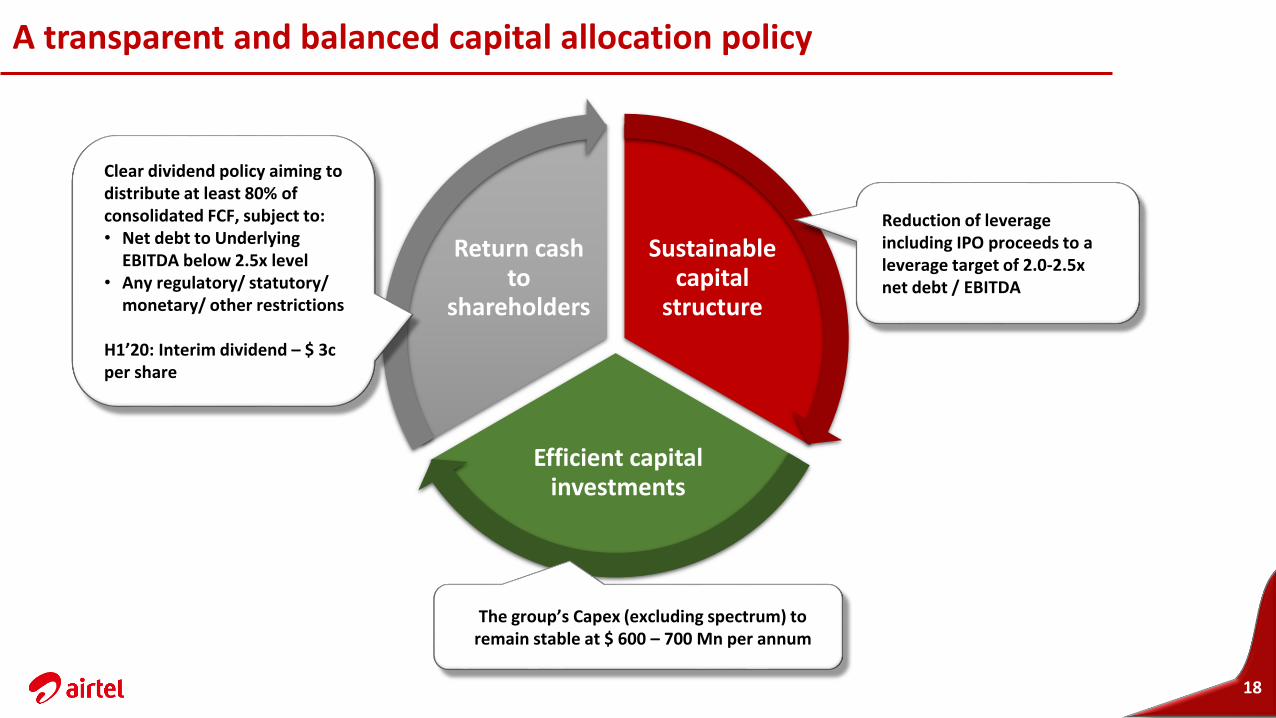
A transparent and balanced capital allocation policy
18
Sustainable capital
structure
Efficient capital investments
Return cash to
shareholders
Reduction of leverage including IPO proceeds to a leverage target of 2.0-2.5x net debt / EBITDA
The group’s Capex (excluding spectrum) to remain stable at $ 600 – 700 Mn per annum
Clear dividend policy aiming to distribute at least 80% of consolidated FCF, subject to:• Net debt to Underlying
EBITDA below 2.5x level• Any regulatory/ statutory/
monetary/ other restrictions
H1’20: Interim dividend – $ 3c per share
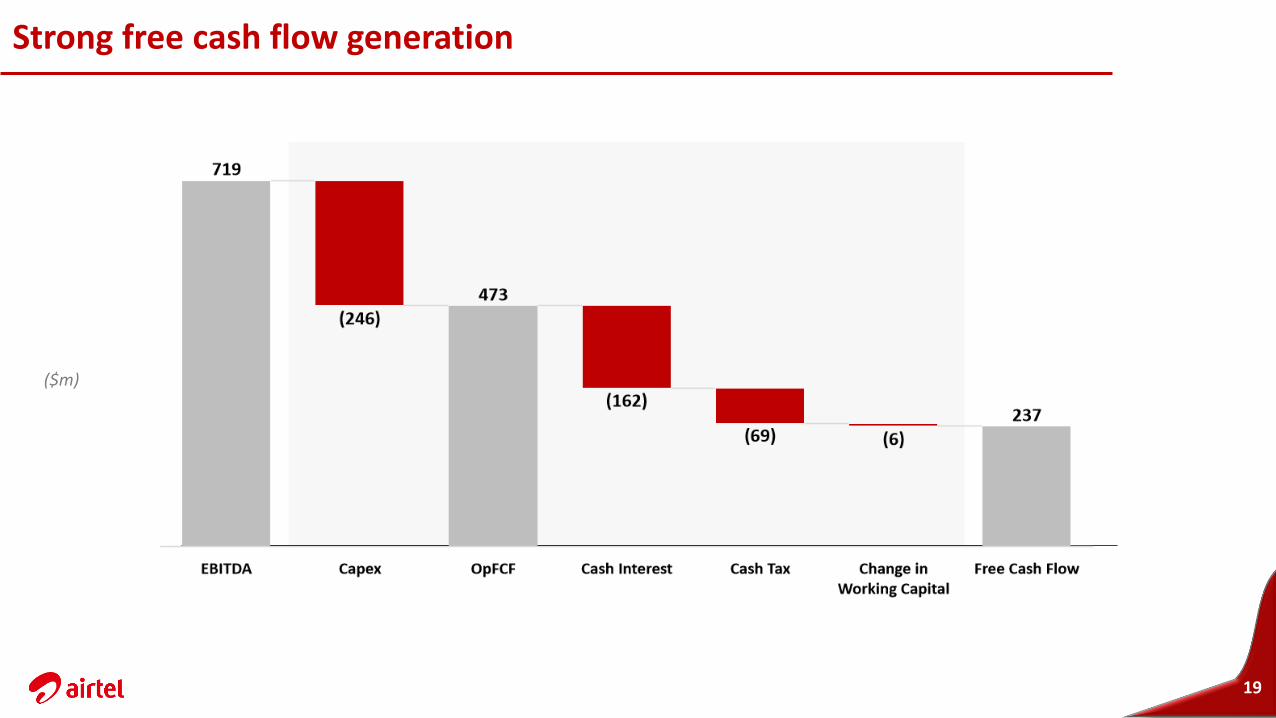
Strong free cash flow generation
19
($m)
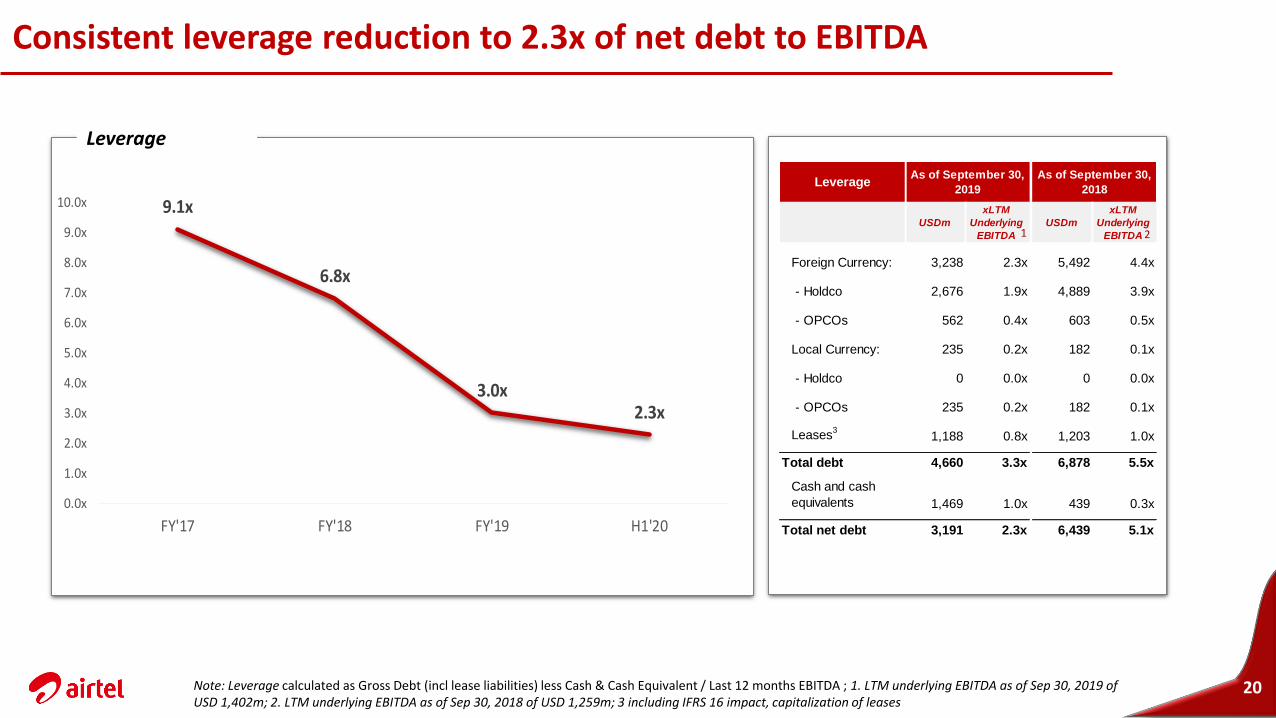
Consistent leverage reduction to 2.3x of net debt to EBITDA
20
9.1x
6.8x
3.0x2.3x
0.0x
1.0x
2.0x
3.0x
4.0x
5.0x
6.0x
7.0x
8.0x
9.0x
10.0x
FY'17 FY'18 FY'19 H1'20
Leverage
USDm
xLTM
Underlying
EBITDA
USDm
xLTM
Underlying
EBITDA
Foreign Currency: 3,238 2.3x 5,492 4.4x
- Holdco 2,676 1.9x 4,889 3.9x
- OPCOs 562 0.4x 603 0.5x
Local Currency: 235 0.2x 182 0.1x
- Holdco 0 0.0x 0 0.0x
- OPCOs 235 0.2x 182 0.1x
Leases3
1,188 0.8x 1,203 1.0x
Total debt 4,660 3.3x 6,878 5.5x
Cash and cash
equivalents 1,469 1.0x 439 0.3x
Total net debt 3,191 2.3x 6,439 5.1x
As of September 30,
2019
As of September 30,
2018
Leverage
Note: Leverage calculated as Gross Debt (incl lease liabilities) less Cash & Cash Equivalent / Last 12 months EBITDA ; 1. LTM underlying EBITDA as of Sep 30, 2019 of USD 1,402m; 2. LTM underlying EBITDA as of Sep 30, 2018 of USD 1,259m; 3 including IFRS 16 impact, capitalization of leases
1 2
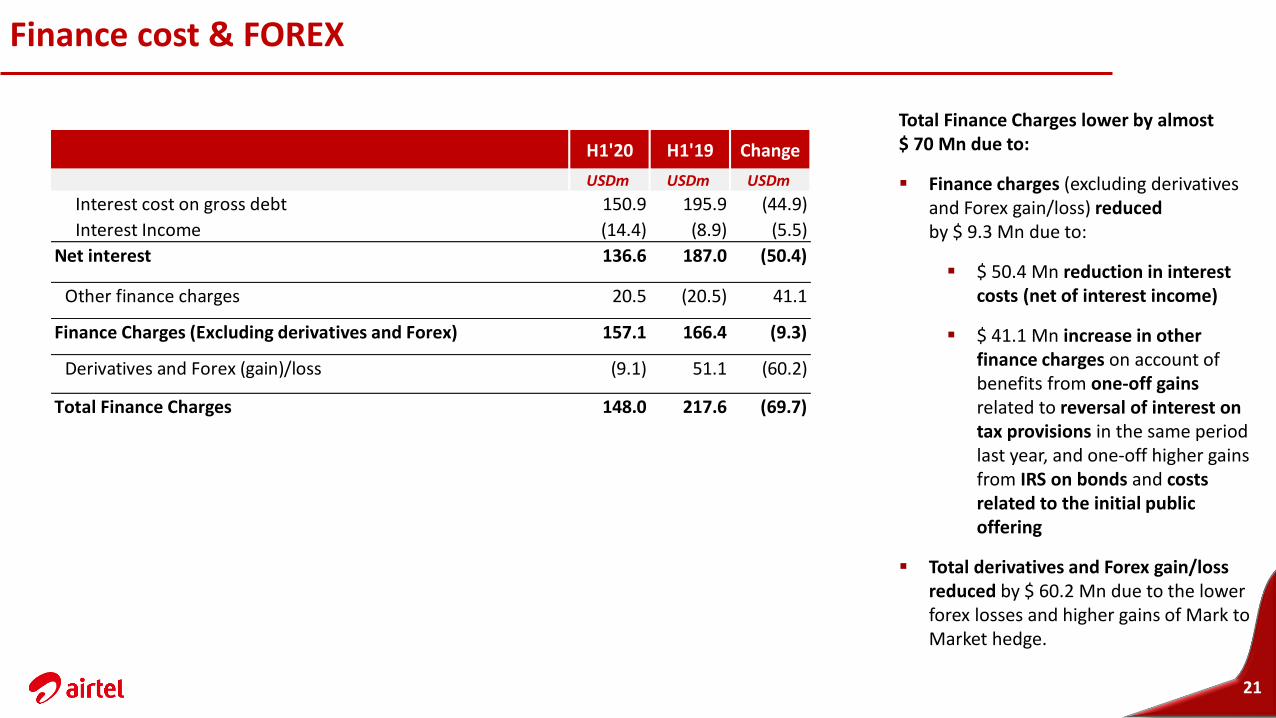
Finance cost & FOREX
21
Total Finance Charges lower by almost $ 70 Mn due to:
▪ Finance charges (excluding derivatives and Forex gain/loss) reduced by $ 9.3 Mn due to:
▪ $ 50.4 Mn reduction in interest costs (net of interest income)
▪ $ 41.1 Mn increase in other finance charges on account of benefits from one-off gains related to reversal of interest on tax provisions in the same period last year, and one-off higher gains from IRS on bonds and costs related to the initial public offering
▪ Total derivatives and Forex gain/loss reduced by $ 60.2 Mn due to the lower forex losses and higher gains of Mark to Market hedge.
H1'20 H1'19 Change
USDm USDm USDm USDm
Interest cost on gross debt 150.9 195.9 (44.9)
Interest Income (14.4) (8.9) (5.5)
Net interest 136.6 187.0 (50.4)
Other finance charges 20.5 (20.5) 41.1
Finance Charges (Excluding derivatives and Forex) 157.1 166.4 (9.3)
Derivatives and Forex (gain)/loss (9.1) 51.1 (60.2)
Total Finance Charges 148.0 217.6 (69.7)
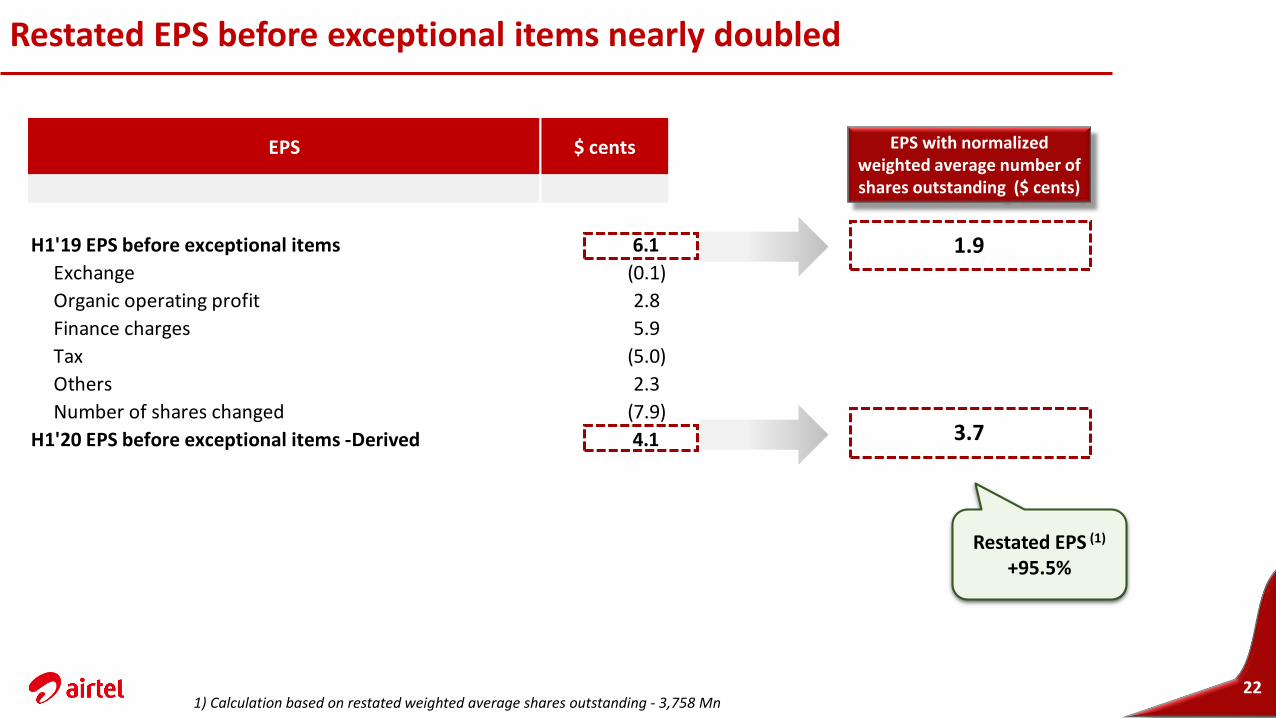
EPS $ cents
H1'19 EPS before exceptional items 6.1
Exchange (0.1)
Organic operating profit 2.8
Finance charges 5.9
Tax (5.0)
Others 2.3
Number of shares changed (7.9)
H1'20 EPS before exceptional items -Derived 4.1
Restated EPS before exceptional items nearly doubled
221) Calculation based on restated weighted average shares outstanding - 3,758 Mn
EPS with normalized weighted average number of shares outstanding ($ cents)
1.9
3.7
Restated EPS (1)
+95.5%
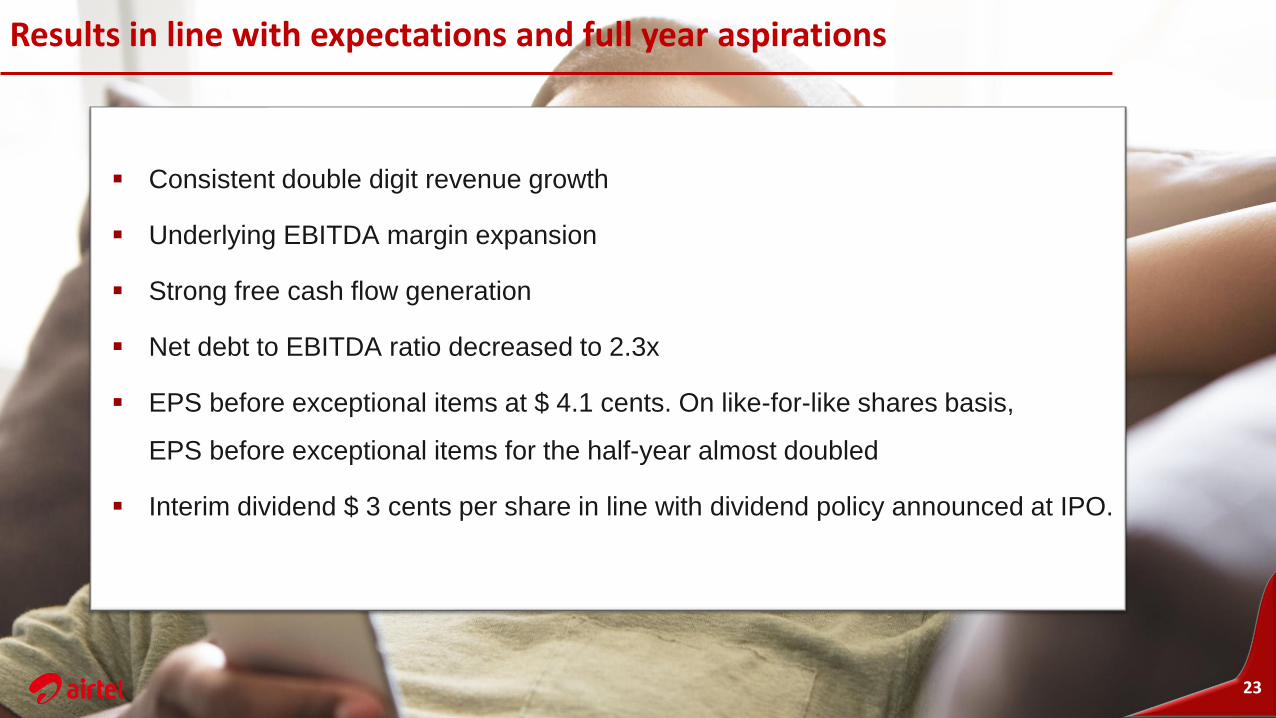
Results in line with expectations and full year aspirations
▪ Consistent double digit revenue growth
▪ Underlying EBITDA margin expansion
▪ Strong free cash flow generation
▪ Net debt to EBITDA ratio decreased to 2.3x
▪ EPS before exceptional items at $ 4.1 cents. On like-for-like shares basis,
EPS before exceptional items for the half-year almost doubled
▪ Interim dividend $ 3 cents per share in line with dividend policy announced at IPO.
23

24
Strategic Direction
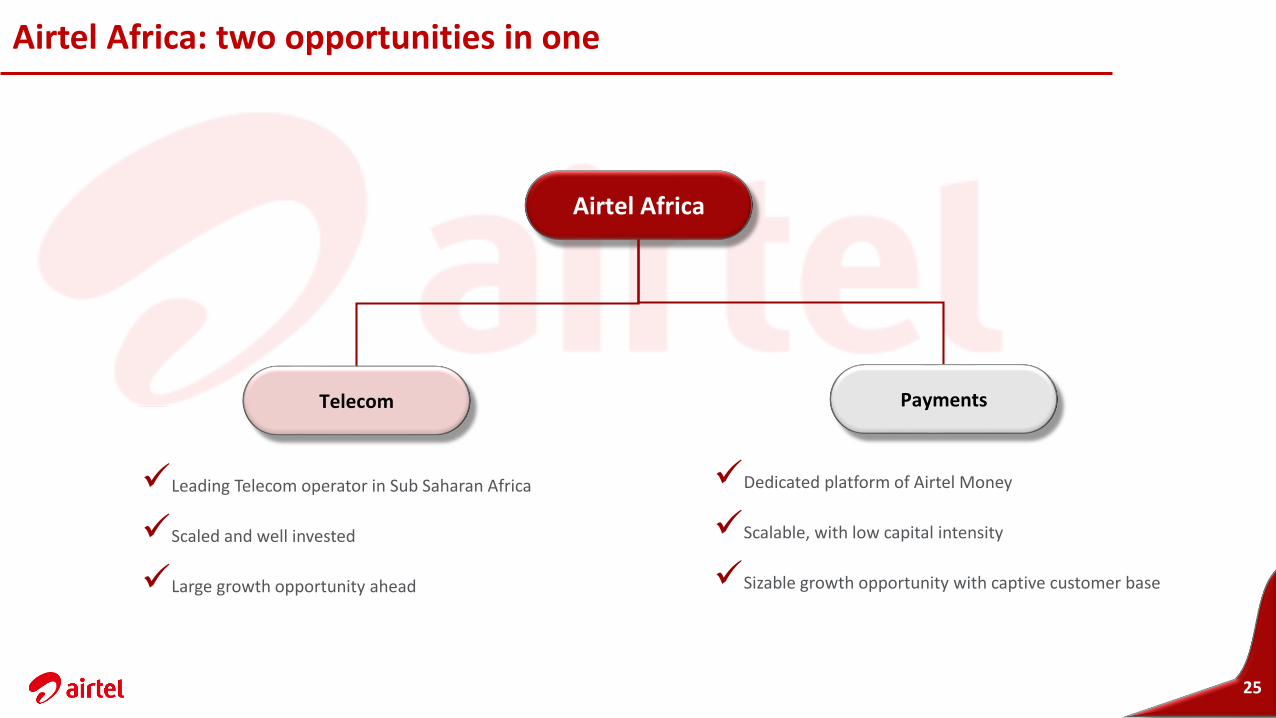
Airtel Africa: two opportunities in one
Airtel Africa
✓Leading Telecom operator in Sub Saharan Africa
✓Scaled and well invested
✓Large growth opportunity ahead
Telecom
✓Dedicated platform of Airtel Money
✓Scalable, with low capital intensity
✓Sizable growth opportunity with captive customer base
Payments
25
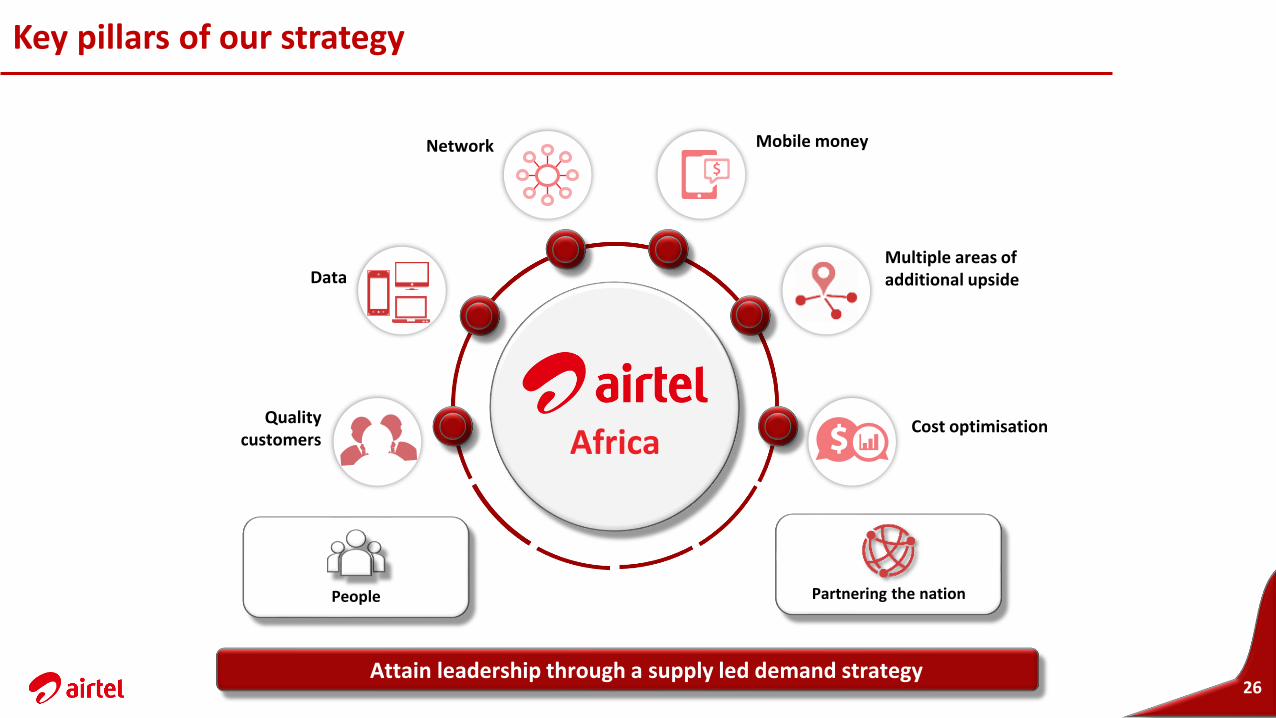
Key pillars of our strategy
Attain leadership through a supply led demand strategy
People
Cost optimisation
Multiple areas of additional upside
Mobile moneyNetwork
Data
AfricaQuality
customers
Partnering the nation
26
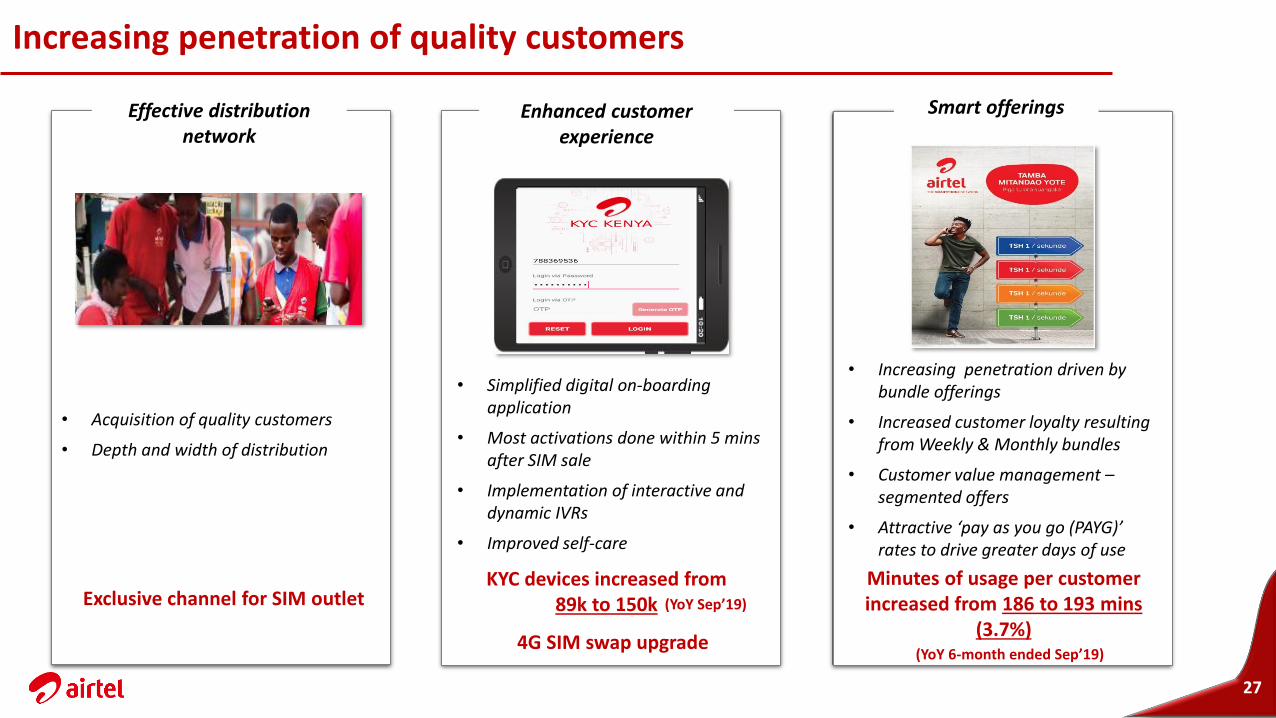
Increasing penetration of quality customers
27
Effective distribution network
Enhanced customer experience
Smart offerings
Exclusive channel for SIM outlet
4G SIM swap upgrade
• Simplified digital on-boarding application
• Most activations done within 5 mins after SIM sale
• Implementation of interactive and dynamic IVRs
• Improved self-care
• Increasing penetration driven by bundle offerings
• Increased customer loyalty resulting from Weekly & Monthly bundles
• Customer value management –segmented offers
• Attractive ‘pay as you go (PAYG)’ rates to drive greater days of use
Minutes of usage per customer increased from 186 to 193 mins
(3.7%)(YoY 6-month ended Sep’19)
• Acquisition of quality customers
• Depth and width of distribution
KYC devices increased from 89k to 150k (YoY Sep’19)
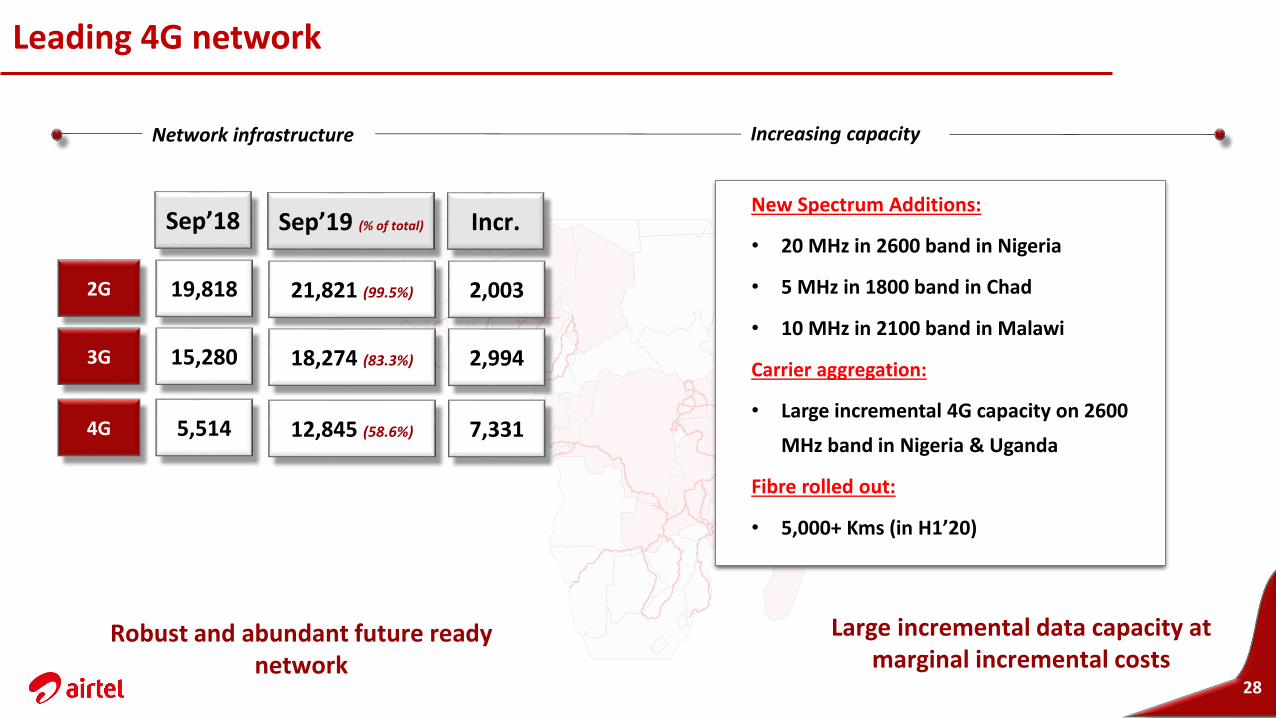
Leading 4G network
28
Network infrastructure Increasing capacity
Large incremental data capacity at marginal incremental costs
Robust and abundant future ready network
New Spectrum Additions:
• 20 MHz in 2600 band in Nigeria
• 5 MHz in 1800 band in Chad
• 10 MHz in 2100 band in Malawi
Carrier aggregation:
• Large incremental 4G capacity on 2600
MHz band in Nigeria & Uganda
Fibre rolled out:
• 5,000+ Kms (in H1’20)
2G
3G
Sep’18
19,818
15,280
4G 5,514
Sep’19 (% of total)
21,821 (99.5%)
18,274 (83.3%)
12,845 (58.6%)
Incr.
2,003
2,994
7,331
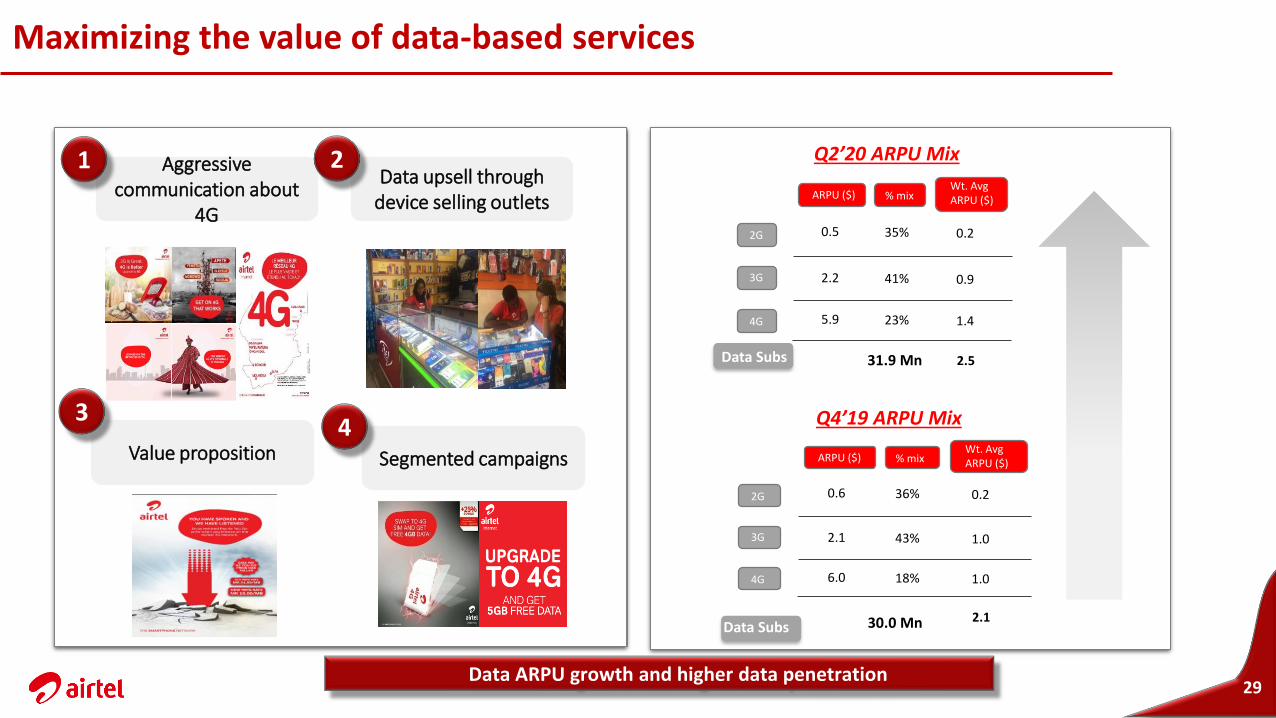
Maximizing the value of data-based services
29
Aggressive communication about
4G
1Data upsell through
device selling outlets
2
Value proposition
3
Segmented campaigns
4
Data ARPU growth and higher data penetration
2G
3G
4G
ARPU ($) % mixWt. Avg ARPU ($)
0.5
2.2
5.9
35%
41%
23%
0.2
0.9
1.4
2.5
Q2’20 ARPU Mix
2G
3G
4G
ARPU ($) % mixWt. Avg ARPU ($)
0.6
2.1
6.0
36%
43%
18%
0.2
1.0
1.0
2.1
Q4’19 ARPU Mix
Data Subs 30.0 Mn
31.9 MnData Subs
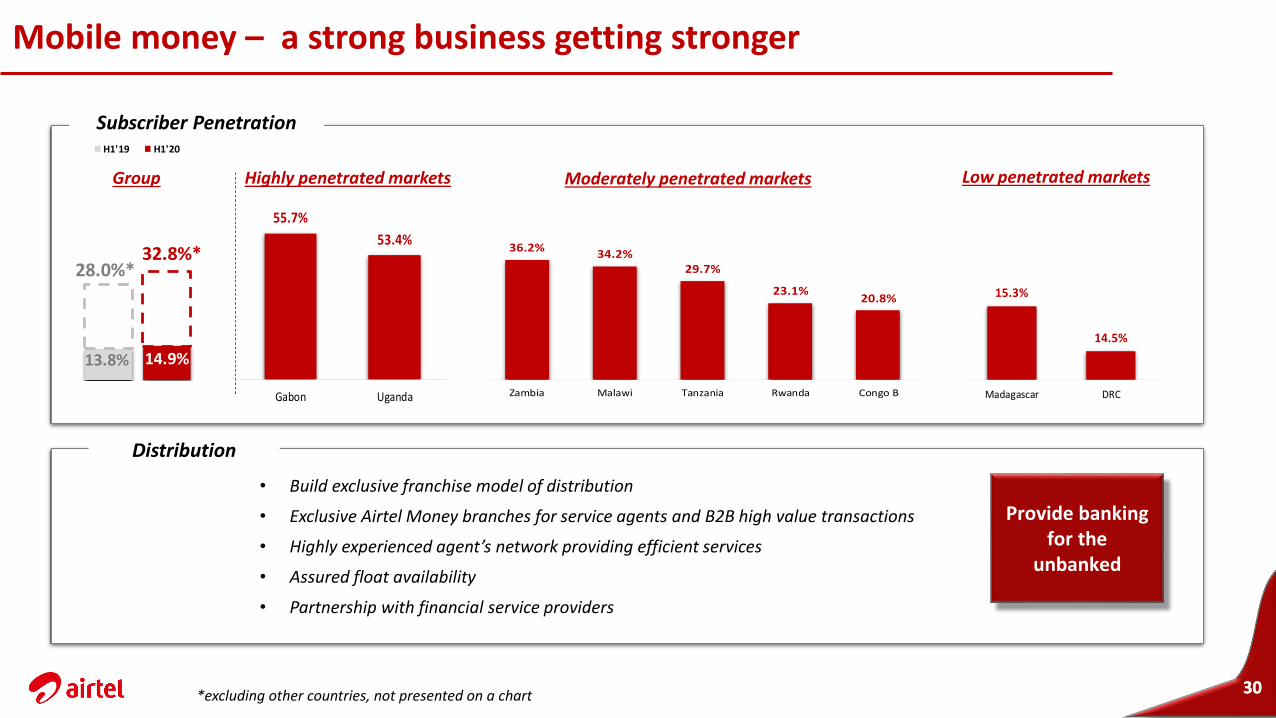
Mobile money – a strong business getting stronger
3030
Subscriber Penetration
Highly penetrated markets Moderately penetrated markets Low penetrated markets
13.8%
14.9%
Africa
H1'19 H1'20
Distribution
• Build exclusive franchise model of distribution
• Exclusive Airtel Money branches for service agents and B2B high value transactions
• Highly experienced agent’s network providing efficient services
• Assured float availability
• Partnership with financial service providers
Provide banking for the
unbanked
Group
*excluding other countries, not presented on a chart
13.8% 14.9%
28.0%*32.8%*
55.7%
53.4%
Gabon Uganda
36.2%34.2%
29.7%
23.1%20.8%
Zambia Malawi Tanzania Rwanda Congo B
15.3%
14.5%
Madagascar DRC
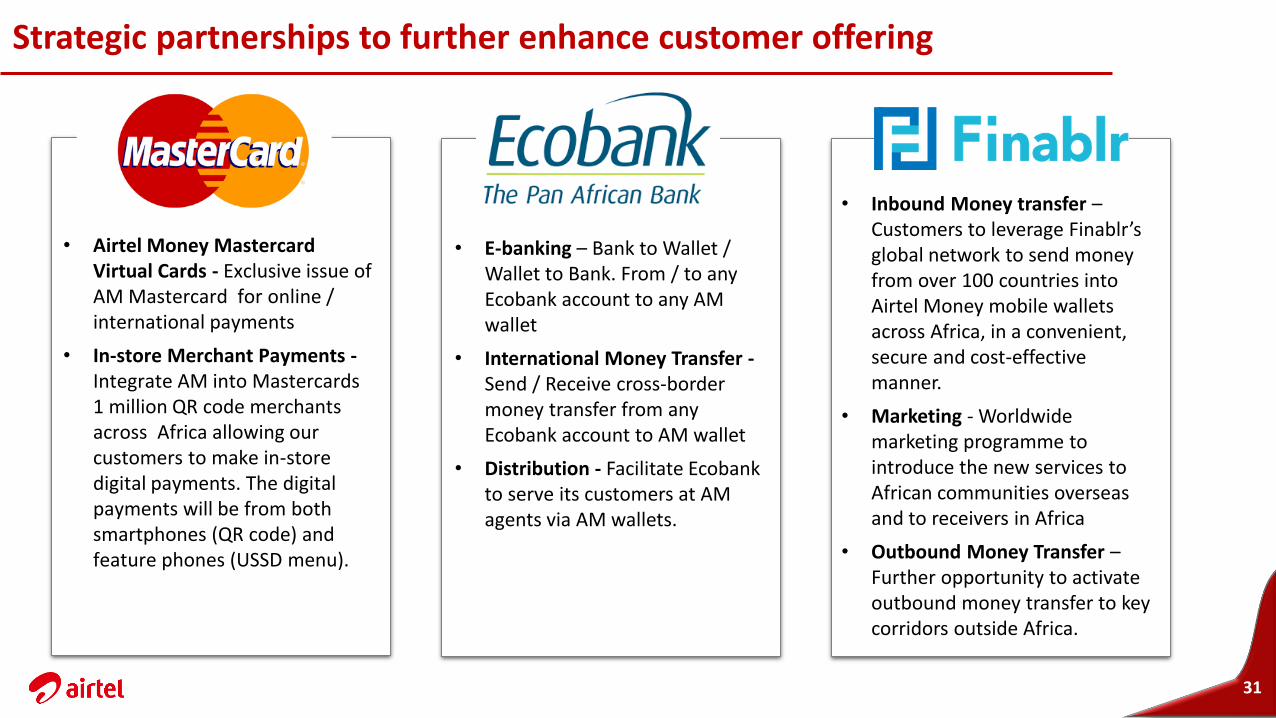
Strategic partnerships to further enhance customer offering
31
• Airtel Money Mastercard Virtual Cards - Exclusive issue of AM Mastercard for online / international payments
• In-store Merchant Payments -Integrate AM into Mastercards1 million QR code merchants across Africa allowing our customers to make in-store digital payments. The digital payments will be from both smartphones (QR code) and feature phones (USSD menu).
• E-banking – Bank to Wallet / Wallet to Bank. From / to any Ecobank account to any AM wallet
• International Money Transfer -Send / Receive cross-border money transfer from any Ecobank account to AM wallet
• Distribution - Facilitate Ecobank to serve its customers at AM agents via AM wallets.
• Inbound Money transfer –Customers to leverage Finablr’sglobal network to send money from over 100 countries into Airtel Money mobile wallets across Africa, in a convenient, secure and cost-effective manner.
• Marketing - Worldwide marketing programme to introduce the new services to African communities overseas and to receivers in Africa
• Outbound Money Transfer –Further opportunity to activate outbound money transfer to key corridors outside Africa.
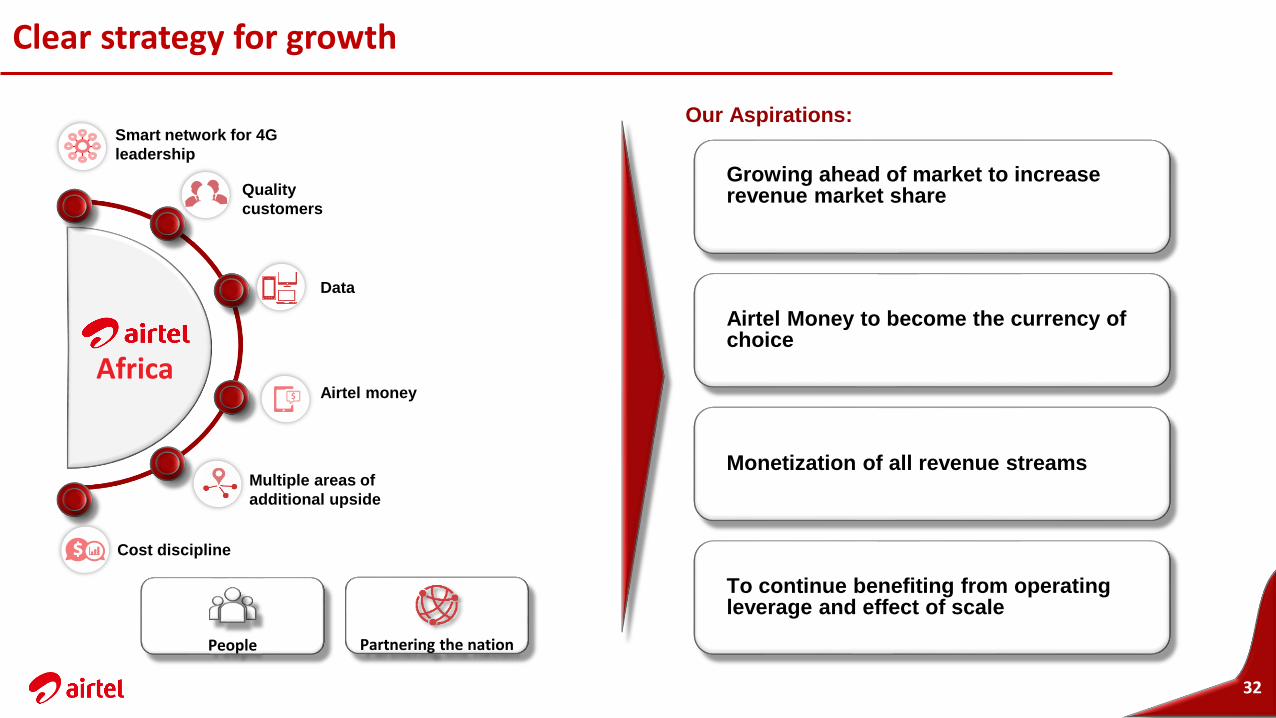
Clear strategy for growth
32
Our Aspirations:
Growing ahead of market to increase revenue market share
Airtel Money to become the currency of choice
Monetization of all revenue streams
To continue benefiting from operating leverage and effect of scale
Africa
Smart network for 4G
leadership
Quality
customers
Data
Airtel money
Multiple areas of
additional upside
Cost discipline
People Partnering the nation

33
Q&A

34

35
Appendix
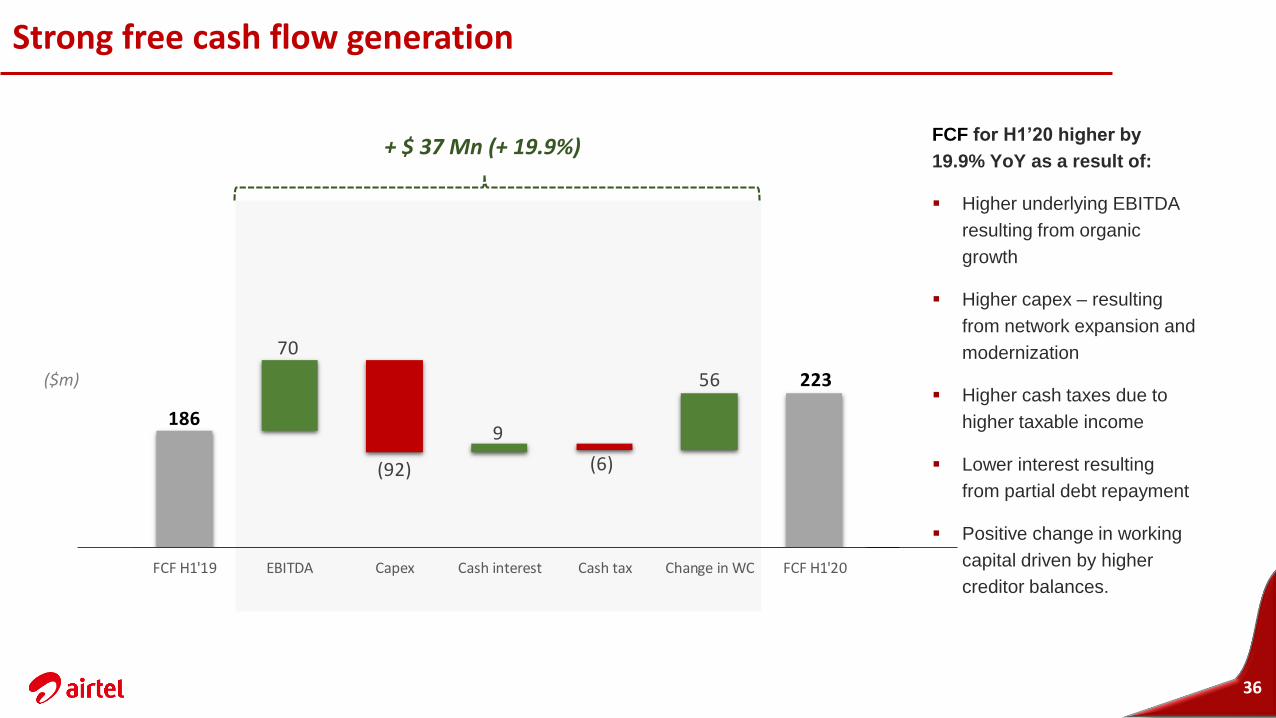
Strong free cash flow generation
36
FCF for H1’20 higher by
19.9% YoY as a result of:
▪ Higher underlying EBITDA
resulting from organic
growth
▪ Higher capex – resulting
from network expansion and
modernization
▪ Higher cash taxes due to
higher taxable income
▪ Lower interest resulting
from partial debt repayment
▪ Positive change in working
capital driven by higher
creditor balances.
186
223
70
(92)
9
(6)
56
FCF H1'19 EBITDA Capex Cash interest Cash tax Change in WC FCF H1'20
+ $ 37 Mn (+ 19.9%)
($m)