Embed Size (px)
DESCRIPTION
AIS Complete Report
Citation preview

INTRODUCTION IN MEASUREMENT AND EVALUATION
1.0 INTRODUCTION
A test paper was administered to Sekolah Menengah Kebangsaan Sultan Ismail in
Johor Bahru. The test was distributed to a form four class of 31 students on 26 th February
2014 at 9 am by the class’s English teacher. The students were given sixty minutes to
complete the test consisting of twenty items of multiple choice questions and ten items of
subjective questions. The test is a formative type test which was set to identify students’
development for the month of March.
The purpose of this coursework was to fulfil the requirements under the introduction
of measurement and evaluation component. This coursework requires item construction of
multiple choice questions and subjective questions, administration of test papers and test
and item analysis. The last step of test and item analysis was compiled into this assessment
report which enables the application of item analysis taught in the measurement and
evaluation component. In addition, the completed test papers by students were further
analysed for the discrimination between weak and good students for further remedial and
enrichment activity purposes.
2.0 PREPARATION FOR THE TEST
2.1 Item construction
Generally the test paper replicated the multiple choice questions for the English 1119
Sijil Pelajaran Malaysia (SPM) format which includes a mix of non-linear and linear text. The
non-linear questions were formed from a variety of texts for example pie chart, graphic
strips, notices. The resources for both linear and non-linear texts were taken from Malaysian
context. This is to allow students to familiarise with the context with reference to previous
knowledge. For example we used the notice of Malaysian Red Crescent Society reaching
out to help victims of the earthquake and tsunami in Japan or pictures of three different
weddings in Malaysia (Malay wedding, Chinese wedding and Indian wedding).
1

Question 5
A. pleased
B. apologetic
C. confused
D. unhappy
INTRODUCTION IN MEASUREMENT AND EVALUATION
The questions were based on six themes inclusive in the form four syllabuses with
close reference to the text book consisting of environment, people, social issues, science
and technology, values, health. For example in the theme: environment, this theme was
narrowed down into two different topics; saving every drop and preserving nature.
Reading skills suggested in the English language form four curriculum specifications
were also taken account such as process information by skimming and scanning for specific
information and ideas. Each question had different learning outcomes as can be shown in
Table 4.
During item construction, the teacher ensured that the items were constructed as
clear as possible. This means that each question stem must be positive without any
negatively phrased stems, eliminate new words in the stem and most of the subject matter
are in the stem. The teacher tried to avoid any fore coming ambiguities in the questions that
may confuse the test takers.
For best answer and distractors construction, the team tried to minimize tendency of
test takers using multiple choice question answering techniques also known as ‘test
wiseness’. To ensure this all alternatives were written similar with regards to length,
grammar and mode of expressions. This can be shown in the following example:
2
Question 11
The expression “just a click away” suggests…

INTRODUCTION IN MEASUREMENT AND EVALUATION
2.2 Difficulty of test items
The test items were constructed based on Bloom’s taxonomy of cognitive domain. The items
were structured from lowest to the highest level of cognitive process (Killen, 2005). Bloom’s
taxonomy was chosen because it was designed to display students thinking process which
incline in difficulty in each of its six domains. Having said that, it is logical to assume that first
domain, which is ‘Knowledge’ should only be used to construct items which are easy in
difficulty whereas items constructed according to the ‘Evaluation’ domain are difficult items.
However, test makers can also construct difficult questions for the ‘Knowledge’ domain and
easy question for the ‘Evaluation’ domain even though the latter requires students to have
the ability of higher order thinking skills. This is according to Downing and Haladyna (2006)
which says that in each of the domains, questions can still be divided into three level of
difficulty (easy, medium and difficult). This means that a question constructed, for example,
according to the Evaluation domain can be an easy item which means that even though it
involves higher order thinking, it is classified as an easy question in the context of that
domain whereas a difficult question in the same domain would mean that it requires students
to have the highest ability of higher order thinking in order to answer the question correctly.
The breakdown of the items in the test is shown in Table 2.
3

INTRODUCTION IN MEASUREMENT AND EVALUATION
Bloom’s taxonomy Item number
Knowledge 2, 3, 12
Comprehension 1, 4, 5, 11, 15, 16,
Application 6, 7, 17,
Analysis 8, 14, 18,
Synthesis 9, 19
Evaluation 10, 13, 20
Table 2: Breakdown of Test Items
2.5 Rubric
In order to create consistency in item formation for the test paper, the team decided
on a rubric (please refer to appendix A) that will guide the construction of items. Consistency
of item construction is important so that questions structure were valid. The rubric contained
format of question, theme / content, objectives and grading criteria. In addition, blooms level
of taxonomy’s behavioural terms were used as a guideline towards constructing question
items. The team has also decided on the marking scale where students will be divided into 5
bands (refer to Table 3) according to their marks.
Scale Marks
4

INTRODUCTION IN MEASUREMENT AND EVALUATION
30
Excellent
A 24-30
Good
B 21-23
Average
C 15-20
Pass
D 9-14
Fail
F 0-8
Table 3: Scoring Band
2.6 Test specification
The test specification (Refer appendix A and B) which includes a matrix consisting of two
axes is completed at the first stage before test construction. The test specification guides the
whole team for test construction because it is completed with levels of bloom’s taxonomy,
level of difficulty and topic and themes for each question. The test blueprint has extended
learning outcomes following the form 4 curriculum specification for each item shown in a
simplified version in Table 4:
Item Theme Topic Skills / Teaching objectives
5

INTRODUCTION IN MEASUREMENT AND EVALUATION
1 People Knowing me, knowing you 1.1 c. talking about self, family and friends,interests, part events, feelings, personalexperiences and understanding whenothers talk about themselves;
2. Social issues Facing teenage blues 2.2 B x. Understanding contextual clues such assynonyms, antonyms and wordequivalents.
3 Environment Saving every drop 1.2 iii. Expressing concern in simple
language
4 Values Loving our country 2.2 B vii. Identifying main ideas in a
simple text.
5 Values Loving our country 2.2 B xv. Identifying points of view in
simple texts.
6 Health Healthy living 2.2 B ix. Reading and interpreting non-linear textssuch as diagrams, tables, graphs.
7 Health Healthy living 2.2 B xiii. Identifying simple cause and
effect.
8 Science &
Technology
Gadgets 2.2 B ix. Reading and interpreting non-linear textssuch as diagrams, tables, graphs.
9 Social issues Reaching out 2.2 B iii. Scanning for details.
10 Social issues Reaching out 2.2 B xiv. Drawing conclusions that are obvious fromthe facts given.
11 Science &
Technology
Going Hi-Tech 3.1 ii. Finding out the meaning of unfamiliarwords by using contextual clues and thedictionary.
12. Science & Going Hi-Tech 3.1 xi. Talking about the message the
6

INTRODUCTION IN MEASUREMENT AND EVALUATION
Technology poet istrying to put across in his/her poem
13. Science &
Technology
Going Hi-Tech 3.1 xiii. Understanding some of the figurativelanguage of the text
14. Science &
Technology
Who invented it? 2.2 B vii. Identifying main ideas in a simple text.
15. Science &
Technology
Who invented it? 2.2 B xiv. Drawing conclusions that are obvious fromthe facts given.
16. Environment Preserving nature 2.2 B iii. Noting important details
17 Environment Preserving nature 2.2 B xiv. Drawing conclusions that are obvious fromthe facts given.
18. Environment Preserving nature 2.2 B x. Acquiring the meaning of words by understanding contextual clues such assynonyms, antonyms and wordequivalents.
19. Environment Preserving nature 2.2 B xiii. Identifying simple cause and effect.
20. Environment Preserving nature 2.2 B xiv. Drawing conclusions that are obvious fromthe facts given.
Table 4: Simplified Version of Test Blueprint
7

INTRODUCTION IN MEASUREMENT AND EVALUATION
2.7 Test Result
ANALYSIS STUDENTS ANSWERSLEVEL HIGH MODERATE LOW
STUDENT NUMBER
3 5 6 7 29 30 22 23 2 16 18 12 1 11 9 10 17 26 20 21 14 19 24 25 28 8 13 4 15 27 Total correct
itemITEM NO
ANSWER
1 B B B B B B B B B B B B B B B B B B B B B B B B B B B B B B B 30B B B B B B B B B B B B B B B B B B B B B B B B B B B B B B 30
2 B B B B B B A B B B B B B B B B B B A B B B B B B B B B B B B 28B B B B B B B B B B B B B B B B B B B B B B B B B A B B B B 29
3 A A A A A A A A A A A A A A A A A A A A A A A A A C B C C B B 24A A A A A - A A A A B A B A A A A A A A A A A C A A C C A A 24
4 B B B B C A B B B B B B D A D D B B A B B C D D C C C D D B A 14A A B C B B A B B B B A B A D B C A A B D D B D D B D D A C 13
5 C C C C C C C C C C C C C C C C B C C C C C C C C C C C C A C 27C C C C C C C C C C C C D C A B C C C C C C C C C C C C C C 26
6 A C B B B B C B C B C C C B A A B A C C B A B B A B A B A C B 9C C B B C C B B C C C D B B B C A C A B B C B A B D D A C C 12
7 B A A A A A B A A A A C A B A A A A A D A D A A B C A D C D B 19A A A A A A A C A A C D A A B A B A D A A D A A A A A C A D 21
8 C D D D D - D D D D B D D C D D D D B - D D B B B D B D B - D 19D D D C A B B D B B D B B A D D B D B D D B B B A B C B D B 11
9 B A A C B A B C A D D A B C A D D D D A D A A D B A A A A B D 3A A C B A B B A B B A C B D A D B A A D A A D C A A D A A D 3
10 C A A A A A D C A A A D A B A A B A A C A C D A D D C C A B D 16A C A A A D A D A A D A A D A C A C C A A B A D D C C A C A 16
11 A B B B B C B B C B C B A A B D B B B C A B C C C D C B C A A 14B B B B B B B C B C B A B B C B C B B A C B C C C B B C B B 19
12 B C B C C C D C D D C C D C C D D D C D C C C C C D C C C D A 18C C C C C C C C - C C D C C D C D C B C C C C C C C B C C C 25
13 B D C D D D D C D C D D D C D D C A D D - C A D D D D C D A A 18C C D D D D D D C D D D C D C D D D D C D A D D D D A D D D 22
8

INTRODUCTION IN MEASUREMENT AND EVALUATION
14 A D A A A D C D A C C A A A D A C C C D C A D D C D A D C C D 10D D A A D C D A - C B D C C D C D D B C C D C C C D D C D C 12
15 D C C A D C C D C D A B C C A C C A C D C B A B A C D A A D A 11C A D D A C A C A A A C D A A D C A C C B B D D D A B A A B 7
16 C A B D A A D B D D A B A A B C D B D C D A D D D D D C D B C 7B C D A D A D D D A D A D B B D D C D D A D D D B D C D C C 5
17 D A B D B A C C C B B B C C B B C D B B D C B B A A B B B D C 8A B C C C B C B C B B B C B C C B A B D A C B A D B D B A D 9
18 D B A A A A A A A A A A C A B A A A A A B A A B A C A A A A C 23C C C A A A C B C A A C C A D A A C A B C A C C C A A A C B 13
19 A D A B B A A C B A B A C A B D B B B A C A A B A A C B B A C 12A A A B A A A B A A B A A C C C A A A C C A C D A B B B A A 17
20 A D D B D B B B D D C B B C A B C A D B A D C A D A D B D D A 11B B B A B C B D B C B B B C B B C B B A A C A A B B A D B D 3
NO. CORREC
T ANSWER
1 16 13 13 13 13 13 13 13 12 12 12 12 11 11 10 10 10 10 10 10 9 9 9 9 8 8 8 8 7 6
2 13 10 14 12 14 13 12 10 11 13 10 12 9 8 7 12 11 13 9 10 13 11 9 7 8 10 7 8 12 10
9

INTRODUCTION IN MEASUREMENT AND EVALUATION
3.0 The measures of frequency
3.1 Mode
Mode is the most frequently occurring score. The table and bar graph below show
the students’ score and frequency of marks. Scores obtained ranged from 4 to 11 and the
total mark is 20 for multiple choice questions. As can be seen from Table 15, the highest
scores’ frequency in the test is 8. The subjective questions scores obtained ranged from 3 to
10 and the total mark is 10 where 7 is the highest score’s frequency in the subjective
section. As for the total score, the highest is 15 over 30 marks.
MULTIPLE CHOICE SCORE FREQUENCY4 15 16 47 28 89 7
10 411 4
Total 31Table 15: Students’ scores and the frequency of the scores for multiple choice questions
SUBJECTIVE SCORE FREQUENCY3 24 15 56 37 98 39 5
10 3Total 31
Table 16: Students’ scores and the frequency of the scores for subjective questions
10

INTRODUCTION IN MEASUREMENT AND EVALUATION
TOTAL SCORE FREQUENCY8 19 1
10 211 312 114 315 516 417 118 419 220 121 3
Total 31Table 17: Students’ scores and the frequency of the scores for total marks.
4.0 ITEM ANALYSIS DIFFICULTY INDEX, DISCRIMINATION INDEX, DISTRACTOR ANALYSIS
According to Murphy and Davidshofer (1991, as cited in Hamill & Usala, 2002), item
analysis refers to a structured group of statistics that can be computed for each item in a
test. This statistic is used to investigate the performance and the effectiveness of the test
items used in the test. According to Mitra et all (2009), item analysis will help to determine
the effectiveness and identify any areas for further improvement. There are three main
scopes in item analysis which are;
1) Difficulty Index (ID)
2) Discrimination Index (D)
3) Distractor Analysis (DA)
11

INTRODUCTION IN MEASUREMENT AND EVALUATION
4.1 Difficulty Index (ID)
Difficulty index refers to the proportion of the total number of correct responses to the
test item. It is calculated by the formula,
ID = Total number of students with correct answer
Total number of students who answered the item
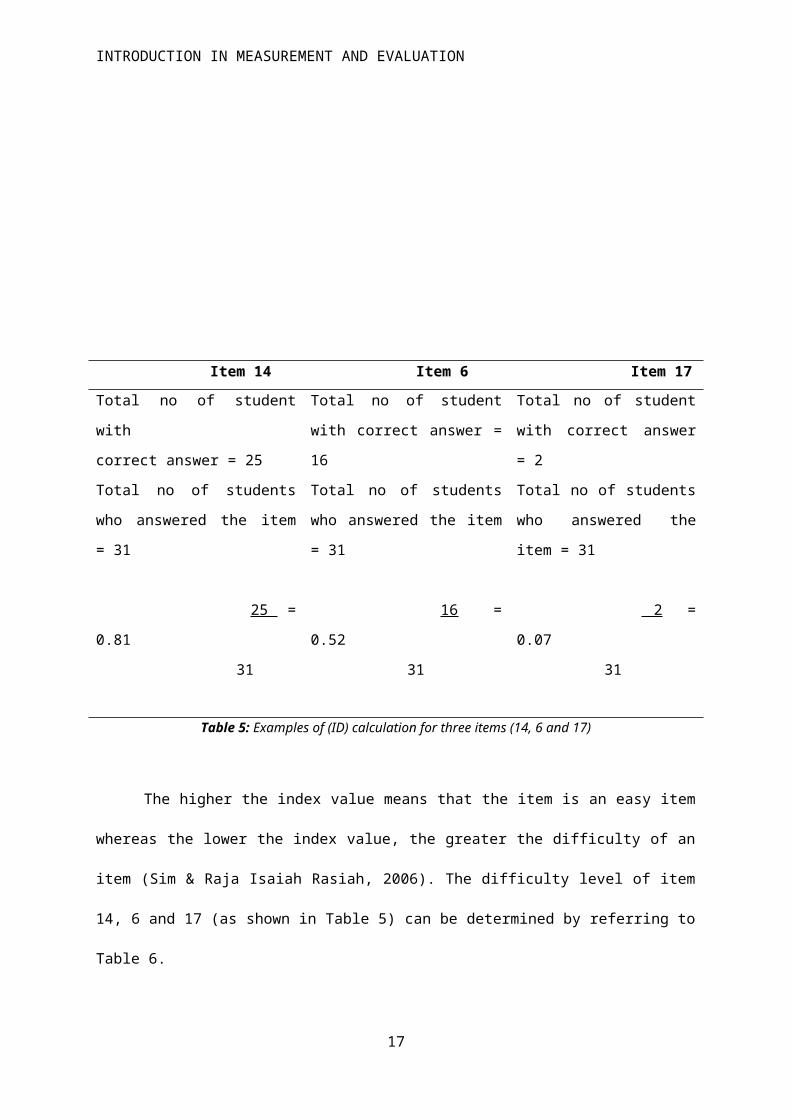
By using the formula, difficulty index for each item can be calculated. Three examples of the
calculation for item 14, item 6 and item 17 are shown in Table 5.
Item 14 Item 6 Item 17
Total no of student with
correct answer = 25
Total no of students who
answered the item = 31
25 = 0.81
31
Total no of student with
correct answer = 16
Total no of students who
answered the item = 31
16 = 0.52
31
Total no of student with
correct answer = 2
Total no of students who
answered the item = 31
2 = 0.07
31
Table 5: Examples of (ID) calculation for three items (14, 6 and 17)
The higher the index value means that the item is an easy item whereas the lower
the index value, the greater the difficulty of an item (Sim & Raja Isaiah Rasiah, 2006). The
12

INTRODUCTION IN MEASUREMENT AND EVALUATION
difficulty level of item 14, 6 and 17 (as shown in Table 5) can be determined by referring to
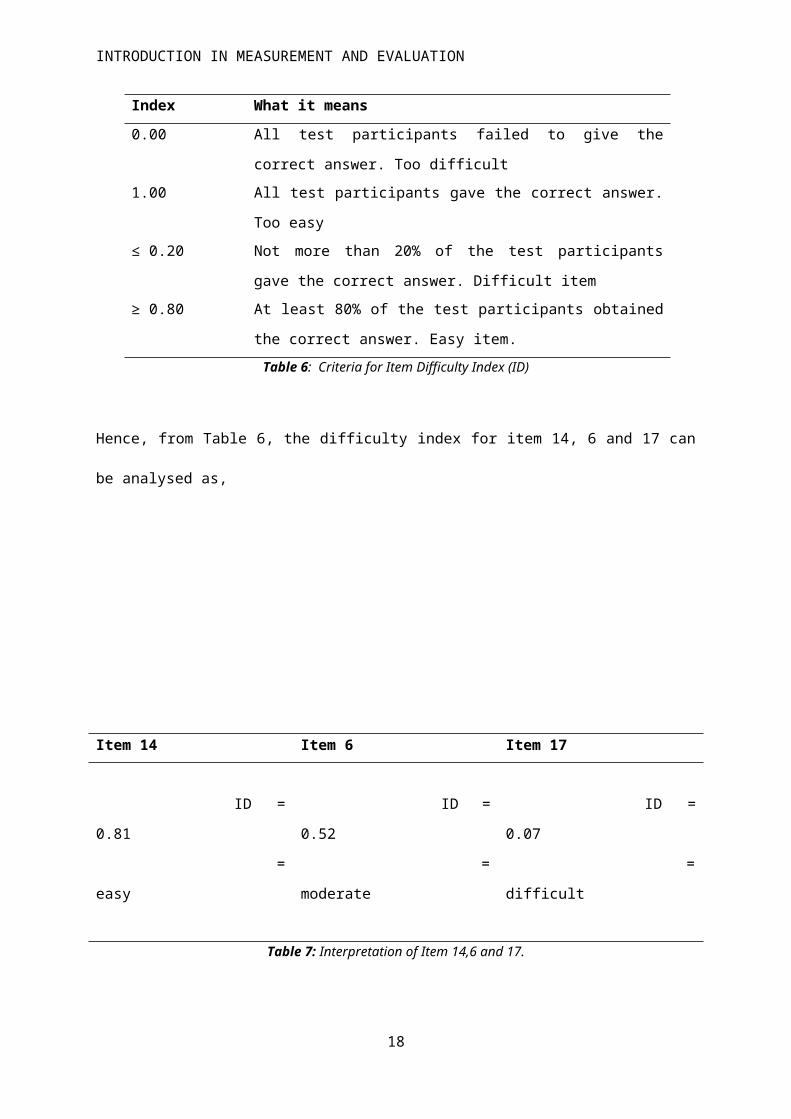
Table 6.
Index What it means
0.00 All test participants failed to give the correct answer. Too
difficult
1.00 All test participants gave the correct answer. Too easy
≤ 0.20 Not more than 20% of the test participants gave the correct
answer. Difficult item
≥ 0.80 At least 80% of the test participants obtained the correct
answer. Easy item.
Table 6: Criteria for Item Difficulty Index (ID)
Hence, from Table 6, the difficulty index for item 14, 6 and 17 can be analysed as,
Item 14 Item 6 Item 17
ID = 0.81
= easy
ID = 0.52
= moderate
ID = 0.07
= difficult
Table 7: Interpretation of Item 14,6 and 17.
From Table 7, the results indicate the difficulty index for different items. 25 students are able
to answer item 14 correctly with the ID level of 0.81. It indicates that there are at least 80%
students obtained correct answer, therefore item 14 is an easy item. In contrast, there are
only 2 students who answer item 17 correctly out of 31 students. The result shows 0.07
13

INTRODUCTION IN MEASUREMENT AND EVALUATION
which clearly indicates item 17 is a difficult item. In addition, item 6 shows an example of
moderate and acceptable items since the ID is 0.52, which falls in the range of 0.20 to 0.80.
Table 8 shows the summary for the overall result of difficulty index for 20 items that
have been distributed.
Question No. Difficulty index (ID) What it means
1 0.32 Moderate
2 0.61 Moderate
3 0.36 Moderate
4 0.19 Difficult
5 0.42 Moderate
6 0.52 Moderate
7 0.74 Moderate
8 0.71 Moderate
9 0.00 Too difficult
10 0.23 Moderate
11 0.48 Moderate
12 0.74 Moderate
13 0.39 Moderate
14 0.81 Easy
15 0.61 Moderate
16 0.39 Moderate
17 0.07 Difficult
18 0.26 Moderate
19 0.39 Moderate
20 0.10 Difficult
Table 8: Summary of difficulty index (ID) for 20 items
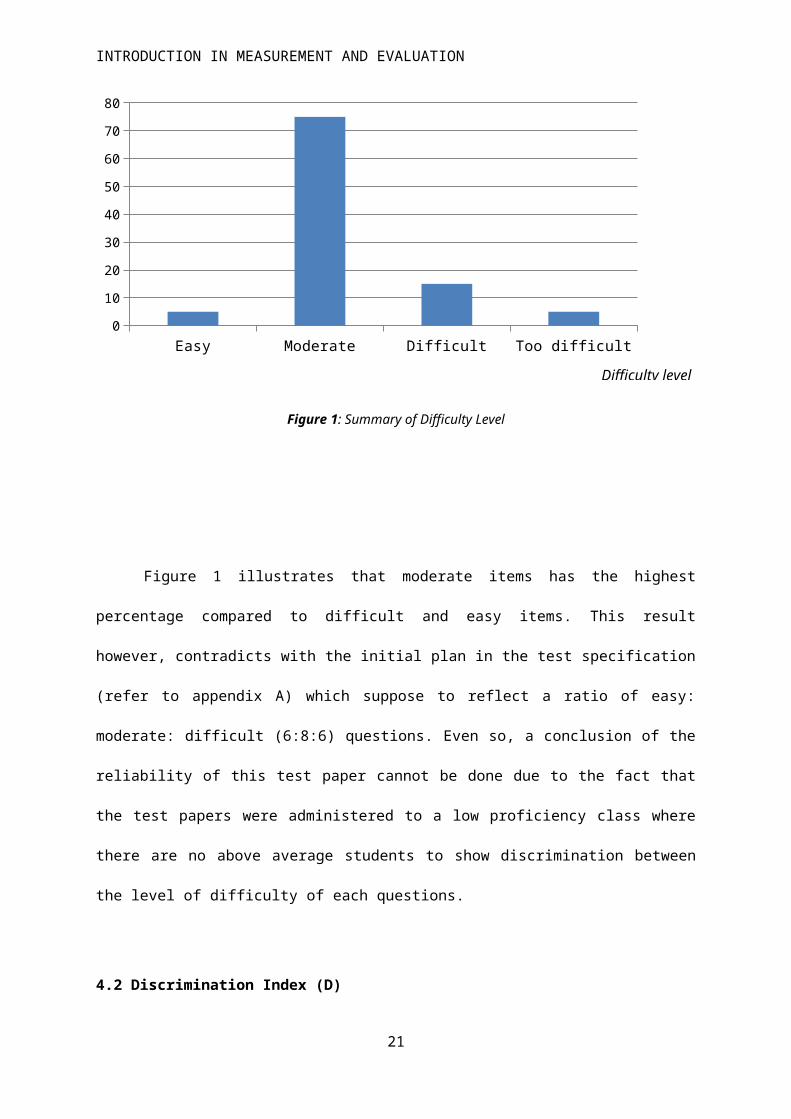
From the Table 8, it can be seen that there are 1 easy item, 15 moderate items, 3 difficult
items and 1 too difficult item in the test paper. It can be analysed that the items difficulty level
are not really well spread out because only 1 item is classified as an easy question
compared to the initial allocation level of difficulty (6:8:6) during the item construction. This is
14

INTRODUCTION IN MEASUREMENT AND EVALUATION
probably because the test question was administered to a class with low proficiency level.
Analysis of the table above also can be interpreted in Figure 1.
Easy Moderate Difficult Too difficult0
10
20
30
40
50
60
70
80
Figure 1: Summary of Difficulty Level
Figure 1 illustrates that moderate items has the highest percentage compared to
difficult and easy items. This result however, contradicts with the initial plan in the test
specification (refer to appendix A) which suppose to reflect a ratio of easy: moderate: difficult
(6:8:6) questions. Even so, a conclusion of the reliability of this test paper cannot be done
due to the fact that the test papers were administered to a low proficiency class where there
are no above average students to show discrimination between the level of difficulty of each
questions.
4.2 Discrimination Index (D)
15
Difficulty level
Percentage (%)

INTRODUCTION IN MEASUREMENT AND EVALUATION
Discrimination index, (D) portrays the extent to which a particular test item is able to
differentiate the higher scoring students from the lower scoring students. This means D
helps to determine whether an item is able to reflect individual differences in answering
items. In addition, D provides feedback to teachers in distinguishing between achieving and
struggling students for further remedial or enrichment activities. Discrimination index for this
item analysis uses the 33.3% percent scale for both top and bottom ranked students in the
group. The discrimination index was calculated in the following manner.
Discrimination Index, (D) = U₁ - B₂
Tt or Tb (33.3% of the total)
U₁ = No. of top students getting correct answer for the item
B₂ = No. of bottom students getting correct answer for the item
Tt = Total no. of students in top (33.3%)
Tb = Total no. of students in bottom (33.3%)
By using this formula, the item discrimination index for each item in the test can be
calculated. As for instance,
Item 3 Item 8
U₁ = 4
B₂ = 4
Tt = 10
Tb = 10
D = 4 – 4
10
= 0.0
U₁ = 10
B₂ = 3
Tt = 10
Tb = 10
D = 10 – 3
10
= 0.7
Table 9: Example of Item Discrimination Index
16
INTRODUCTION IN MEASUREMENT AND EVALUATION
Based on the results achieved above, Table 9 indicates two different indexes which differ
from each other. Therefore, the understanding of the index range is needed.
The standard index ranges from -1.00 to +1.00. The closer the index to +1.00, the
better the item can discriminate between top students and bottom ones. The value of -1.00
indicates that weaker students perform better than good students. The discrimination index
is analysed through the following criteria as shown in Table 10.
Index What it means
˂ 0.20 The item is poor in differentiating between good and weak
students. Must be rejected.
0.20 – 0.29 The item can marginally differentiate between good and
weak students.
0.30 – 0.39 The item can reasonably differentiate between good and
weak students.
≥ 0.40 The item is able to clearly differentiate between good and
weak students.
Table 10: Criteria for Item Discrimination Index (D)
From the table of criteria above, the discrimination index for item 3 and 8 can be determined.
Item 3
D = 0.0
= Poor item. Must be rejected
Item 8
D = 0.7
= Clear item. Able to differentiate
between good and weak students
17
INTRODUCTION IN MEASUREMENT AND EVALUATION
Table 11: Interpretation of Discrimination Index for Item 3 and 8
An overall summary of how the test items discriminate between the good and weak students
is shown in Table 12.
Question No. Discrimination index (D) What it means
1 0.0 Poor
2 0.2 Marginal
3 0.0 Poor
4 0.3 Reasonable
5 0.2 Marginal
6 0.5 Clear
7 0.6 Clear
8 0.7 Clear
9 0.0 Poor
18

INTRODUCTION IN MEASUREMENT AND EVALUATION
10 0.1 Poor
11 -0.1 Poor
12 -0.4 Poor
13 0.0 Poor
14 0.1 Poor
15 0.4 Clear
16 0.8 Clear
17 0.0 Poor
18 0.1 Poor
19 0.5 Clear
20 -0.1 Poor
Table 12: Summary of discrimination index (D) for 20 items
19

INTRODUCTION IN MEASUREMENT AND EVALUATION
Poor Marginal Reasonable Clear0
10
20
30
40
50
60
Figure 2: Summary of Discrimination Index (D)
Referring to Table 12 and Figure 2, we can conclude that more than half of the items did not
differentiate between good and weak students clearly. Hence it can be concluded that the
test items were unable to provide good feedbacks to the teachers regarding students’
performances. All of these items must be either rejected or modified in order to draw a clear
line between students’ achievement level for future improvement. However, the
discrimination index (D) obtained from the data collected did not reflect the expected
reliability of the test items as it was only administered to students with low English
proficiency.
4.3 Distractor Analysis
20
Item categories
Percentage (%)
INTRODUCTION IN MEASUREMENT AND EVALUATION
Distractor analysis functions to evaluate the effectiveness of distractors in each item.
To perform the distractor analysis, the team decided to analyse the distractors by looking at
the frequency of distractors that was selected by top 33.3% and bottom 33.3%. The key
indicator for this distractor analysis is classified as either Non-Functional (NF) or good (G).
Table 13 shows the summary of Distractor Analysis for each test items.
21

INTRODUCTION IN MEASUREMENT AND EVALUATION
Table 13: Summary of Distractor Analysis
22
Item Category of students
Response RemarksNF= Non-functional GD= Good Distractors
A B C D
1Ans: B
Top 6 4 0 0 A & C are GD,D is NFBottom 5 4 1 0
2Ans: A
Top 6 1 0 3 GD
Bottom 4 3 2 13Ans: D
Top 0 1 5 4 GD
Bottom 1 2 3 44Ans: D
Top 0 6 1 3 B & C are GD,A is NFBottom 0 9 1 0
5Ans: B
Top 2 4 3 1 GD
Bottom 2 2 4 26:Ans: A
Top 7 0 0 3 GD
Bottom 2 3 2 37Ans: B
Top 0 10 0 0 D is GD,A & C are NFBottom 0 4 0 6
8Ans: C
Top 0 0 10 0 GD
Bottom 2 1 3 49Ans: B
Top 0 0 9 1 GD
Bottom 5 0 4 110Ans: C
Top 6 0 3 1 GD
Bottom 4 3 3 011Ans: A
Top 5 5 0 0 B & C are GD,D is NFBottom 6 3 1 0
12Ans: B
Top 0 5 4 1 GD
Bottom 1 9 0 013Ans: B
Top 3 5 1 1 GD
Bottom 2 5 3 014Ans: A
Top 8 1 1 0 GD
Bottom 7 2 0 115Ans: D
Top 0 0 1 9 GD
Bottom 2 1 2 516Ans: C
Top 1 0 8 1 GD
Bottom 1 4 0 517Ans: D
Top 5 3 1 1 GD
Bottom 7 1 1 118Ans: B
Top 5 3 1 1 GD
Bottom 7 2 1 019Ans: A
Top 6 2 1 1 GD
Bottom 1 6 1 220Ans: C
Top 2 3 1 4 GD
Bottom 2 2 2 4

INTRODUCTION IN MEASUREMENT AND EVALUATION
Non-functional distractors are distractors that were not chosen at all by any students. These
distractors failed in its function to distract weak students. Therefore, these distractors are
usually modified, replaced or discarded to improve the reliability of the test.
4.4 Summary of Items Analysis
Table 14 below shows a combination of distractor analysis, difficulty and
discrimination index for all items. These three aspects of item analysis are taken account for
when classifying whether an item is good, defective or poor.
23

INTRODUCTION IN MEASUREMENT AND EVALUATION
Question
No.
Difficulty index
(ID)
Discriminatio
n index (D)
Distractor
analysis (DA)
Remarks
1 0.32 0.00 Distractor D is NF Defective item
2 0.61 0.20 GD Defective item
3 0.36 0.00 GD Defective item
4 0.19 0.30 Distractor A is NF Defective item
5 0.42 0.20 GD Defective item
6 0.52 0.50 GD Good item
7 0.74 0.60 Distractor A & C
are NF
Defective item
8 0.71 0.70 GD Good item
9 0.00 0.00 GD Poor item
10 0.23 0.10 GD Defective item
11 0.48 -0.10 Distractor D is NF Poor item
12 0.74 -0.40 GD Poor item
13 0.39 0.00 GD Defective item
14 0.81 0.10 GD Good item
15 0.61 0.40 GD Good item
16 0.39 0.80 GD Good item
17 0.07 0.00 GD Poor item
18 0.26 0.10 GD Defective item
24

INTRODUCTION IN MEASUREMENT AND EVALUATION
19 0.39 0.50 GD Good item
20 0.10 -0.10 GD Poor item
Table 14: Summary of Difficulty Index (ID), Discrimination Index (D) and Distractor Analysis (DA)
From Table 14, there are six items that have been classified as good items which are
item 6, 8,14,15,16 and 19. These items are a good item because they obtain a discrimination
index of (≥ 0.4) which means that these items can clearly discriminate between good and
weak students.
On the contrary, poor items can also be identified from the data analysis. The poor
items are item 9, 11, 12, 17 and 20. Mostly, all these items are poor in distinguishing the
upper and bottom group performance in the test. In fact, for item 11, 12 and 20, the
discrimination index showed negative values which indicate that weak student are able to
answer the items that are supposed to be difficult.
Another item classification is defective items. Item classified in this category possess
non-functioning distractors and have low discrimination index. Even though these items are
flawed in some ways, it can still be improved through minor modifications. For instance, item
7 obtained a moderate difficulty index (0.74) and a clear discrimination index (0.60) however
it is defective because of there are two non-functional distractors in the item (Distractor A &
C).
25

INTRODUCTION IN MEASUREMENT AND EVALUATION
7) En. Ali has been diagnosed with diabetes and high cholesterol problem.
As a medical student, select the best reason why En. Ali could get the
health problems?
A. He exercises only 10 minutes daily after working hours.B. He loves to eat meats, desserts and titbits. C. He watches television when he comes back from work.D. He eats 6 times daily and smokes moderately.
In order to modify the item, the team decided to change the distractors which are A
and C. This is because the distractors are non-functioning and after analysing the item, the
team have identified that these two distractors are not explicitly shown and connected to the
stimulus (food pyramid). As can be seen, all students chose to answer B or D maybe
because of the word ‘eat’ and this word relates to the stimulus food pyramid. Therefore, we
modified the distractors to become as follow:
7) En. Ali has been diagnosed with diabetes and high cholesterol problem.
As a medical student, select the best reason why En. Ali could get the
health problems?
A. He hates vegetables and eat fruits instead.B. He loves to eat meats, desserts and titbits. C. He loves to eat bread and milk for breakfast.D. He eats 6 times daily and smokes moderately.
These changes give students more choice of answers as compared to the non-
functioning distractors previously shown. Both distractors are constructed based on the
information provided in the stimulus (food pyramid) such as fruits, milk and bread. By having
these distractors, students need to pay more attention in reading and analysing the question,
the stimulus as well as the distractor in order to select the best answer. Consequently, this
26

INTRODUCTION IN MEASUREMENT AND EVALUATION
modification would turn the item into a food item where it can clearly discriminate between
good and weak students by having good distractors.
5.0 Overall Evaluation
Based on the students’ scores and item analysis, there is no clear evidence on
whether the test can be considered as either well-constructed or poorly-constructed. The
analysis of the difficulty index (ID) demonstrates that the majority of the items are moderate
items even though there is one particular item which is too difficult and could affect the test
reliability. In term of the discrimination index (D), most of the items are of poor items in
discriminating the good and the weak students while the distractor analysis shows that
although most of the items consist of good distractors, there are few items with non-
functional distracters, placing them as poorly constructed item. This test practically, unable
to serve the purpose of the testing which is to assess the students’ reading ability. From the
data, we realized that the test has less capability of discriminating good and weak students
as only a quarter of the items clearly discriminate good and the weak students (≥ 0.4). This
may be due largely to the characteristics of the test takers. Most of the students have very
low language proficiency and therefore, the results obtained from the analysis might be
inconsistent. Another contributing factor is the test administration as the team was not able
to administer the test closely. In addition, due to the fact that there is no teaching and
learning experience between the test makers and the students, this test should not be made
the solitary source in providing the analysis of assessment and test construction as a whole.
27

INTRODUCTION IN MEASUREMENT AND EVALUATION
References
Hamill, D.G. & Usala, P. D. (2002). Multiple-choice test item analysis : A new look at thebasics. Retrieved April 6, 2011 from http://www.ipacweb.org/conf/02/hamill.pdf
Killen, R. (2005). Programming and Assessment for Quality Teaching and Learning. Thomson Social Science Press: Melbourne
Mitra, N.K., Nagaraja, H.S., Poonudurai, G. & Judson, J.P. (2009). The levels of difficulty anddiscrimination indices in type a multiple choice questions of pre-clinical semester 1multidisciplinary summative tests. IeJSME 3(1):pp 2-7. Retrieved April 5, 2011 fromhttp://www.imu.edu.my./ejournal/approved/iMEC_2.original_p02-07.pdf
Sim, S.M. & Raja Isaiah Rasiah (2006). Relationship between item difficulty anddiscrimination indices in true/false type multiple choice questions of a para-clinicalmultidisciplinary paper. Vol. 35, No.2. retrieved April 5, 2011 fromhttp://www.annals.edu.sg/pdf/35VolNo2200603/V35N2p67.pdf
28