Embed Size (px)
Citation preview

AKÇANSA
2019 Q1 Results
Umut Zenar, CEO
Steffen Schebesta, CFO

This presentation (Presentation) has been prepared by Akçansa Çimento Sanayi ve Ticaret A.Ş. for the sole purpose
of providing information relating to Akçansa (Information).
This Presentation is based on public information and data provided by Akçansa management and basically
demonstrates forward looking statements based on numerous assumptions regarding our present and future
business strategies and the environment in which we will operate in the future.
Please be aware that the forward looking statements and/or assumptions of future events declared in the
Presentation and/or in the Information may not prove to be accurate.
No warranty or representation, express or implied, as to the accuracy, reliability, completeness, or timeliness of this
Information is made by Akçansa.
No profitability or any other warranty is claimed by the Information provided either on company or sectoral basis.
No liability/responsibility is accepted by Akçansa for any loss or damages of any kind, incurred by any person for any
information howsoever arising from any use of this Presentation or the Information.
The Information contained at this Presentation has been included for general informational purposes only and no
person should make any investment decisions in reliance upon the information contained herein.
Akçansa shall not be held responsible for any kinds of losses that may rise from investments and/or transactions
based on this Presentation or Information or from use of this Information and/or Presentation.
Disclaimer
2

Page
1. Market Overview 4
2. Financial Report 13
3. Outlook 19
Content
3

Key Highlights
▪ 2019 Q1
✓ Total cement volumes roughly in line with prior year. Domestic cement
volumes declined by 38%, offset by 263% increase in cement/clinker exports.
✓ Increased energy costs exerted pressure, particularly on domestic margins.
Good development in the export markets offset some of the decline in the
domestic market.
✓ EBITDA of 59.9 mTL (1Q18 70.7 mTL).
▪ 2019 Outlook
✓ Total cement volumes are expected to increase driven by roughly doubling
export volumes in 2019.
✓ Increased energy costs will exert pressure on margins. Increased alternative
fuels usage will offset some of the fuel cost increases.
✓ USD-long position expected to increasingly contribute to TL result increase.
✓ Strict fixed cost discipline and tight Capex control.
4

59%
16%
5%9%
-8%-11%
-2%
-32%
-6%
-28%
-35%
-44%
59%
33%
20%16%
10%6% 5%
-1% -2% -5%
-8% -11%
-60,0%
-40,0%
-20,0%
0,0%
20,0%
40,0%
60,0%
Jan-18 Feb-18 Mar-18 Apr-18 May-18 Jun-18 Jul-18 Aug-18 Sep-18 Oct-18 Nov-18 Dec-18
Turkey Monthly YoY Turkey YTD YoY
5
Turkey Domestic Demand Growth 2018
Source: TCMA
+ 6 %
-24 %
Turkish cement consumption was up by 6% in 1H2018,
however declined by -24% in 2H 2018

Source: TCMA
Domestic Sales Volume Change % (Jan’19 YTD)
January YTD -51% decrease
6
Harsh winter weather and high 2018 comparison base

Turkish Export Volume Trend – FY 2018
Source: TCMA and Akçansa estimations
Turkish clinker exports increased by 23% in 2018
7
8
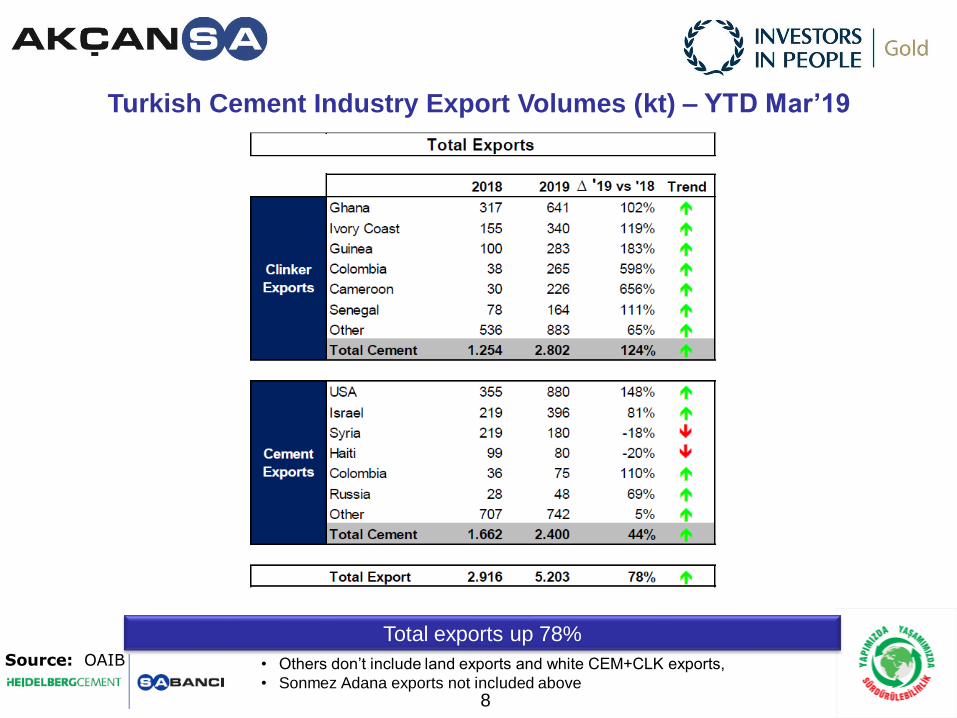
Turkish Cement Industry Export Volumes (kt) – YTD Mar’19
Total exports up 78%
• Others don’t include land exports and white CEM+CLK exports,
• Sonmez Adana exports not included above
Source: OAIB

2.4%
55.1%USA West Africa33.7%
Colombia
8.8%
Israel
1Q18
1Q19
Akçansa Export MarketsWest Africa, USA and Israel are the major export markets in 1Q19
Source: AKC management report
37.3%
Other
West Africa
62.6%USA
0.1%
LA Cement 0,4 mt
Clinker 0,4 mt
9
Q1 Exports up 263% from 0.3 to 0.8 mt

*) Domestic cement figures include Karçimsa and transfer to RMC
1.5
0.0
3.0
0.9
[M ton]
1.4
0.3
1Q18
0.8
1Q19
1.7 1.7
263%
-38%
-2%
Cement Shipments
Sales Volume Breakdown
0.0
0.5
1.0
1.5[M m3]
0.8
0.5
-41%
Domestic
Export
RMC Shipments
1Q18 1Q19
10

Energy Costs (1Q19 vs 1Q18)
▪ Higher electricity and fuel prices (in TL) lead to strong increase in
energy costs in Q1 2019
▪ Negative price effect of electricity and fuel: 55 mTL (~45% of it is
related to depreciation of TL against USD)
11
Increasing
Slightly increasing
Flat
Slightly decreasing
Decreasing
Coal (USD/t)
Coal (TL/t)
Petcoke (USD/t)
Petcoke (TL/t)
Diesel (TL/lt)
Electricity (TL/kwh)
Energy Price1Q19 vs
1Q18

Page
1. Market Overview 4
2. Financial Report 13
3. Outlook 19
Content
12

Income Statement
13
Company (M TL)1Q18 1Q19
% Ch.
YTD
Net Sales 387,6 407,3 5,1%
Cost of Sales (317,8) (373,0) 17,4%
Gross Margin 69,8 34,3 -50,8%
Marketing&Sales Expense (4,5) (6,2) 36,6%
General Management Expenses (16,2) (20,7) 28,0%
Other Operating Income/Charges 0,6 (0,3) 146,0%
Operating Income 49,7 7,2 -85,6%
Income/Losses from Investment Activities 13,6 41,1 201,3%
Non-Operating Financial Income 2,6 15,1 471,5%
Non-Operating Financial Charge (15,5) (46,7) 201,3%
Profit/Loss before Taxes 50,5 16,7 -66,9%
Taxes On Income (8,8) 2,4 -127,1%
Net Income/Loss 41,7 19,1 -54,2%
Minority Share 0,3 (0,6)
Parent Company Share 41,4 19,7
Gross Margin % 18,0% 8,4%
EBITDA Margin* % 18,1% 14,8%
Net Income Margin % 10,8% 4,7%
Source: CMB financials
(*) EBITDA = Operating Income + Gain/Loss from asset sales + Depreciation

Cash Flow
Source: CMB financials
14
Cash flow from operating activities
Operating income before the changes in working capital 73,8 37,1
Changes in working capital (11,0) (34,3)
Taxes paid (8,9) (3,0)
Other items (0,9) (3,9)
53,0 (4,0)
Cash flow from investing activities
Tangible and intangible fixed assets (31,8) (13,9)
Sale of financial investment 26,0 -
Proceeds from fixed asset disposals 0,1 34,4
Dividends Received 13,6 -
7,9 20,5
Cash flow from financing activities
Capital increase
Dividend payments (99,3) (118,5)
Net proceeds from bonds and loans 37,0 (0,9)
Interest paid (5,9) (44,9)
Interest received 0,4 8,9
Other items - -
(67,7) (155,3)
Net change in cash and cash equivalents - continuing operations (6,8) (138,7)
Change in cash & cash equivalents (6,8) (138,7)
Cash & cash equivalents at 1 January 52,7 275,4
Cash & cash equivalents at 31 March 46,0 136,7
Company (M TL) 1Q18 1Q19

CAPEX
15
115
134
113
98
14
0
20
40
60
0
20
40
60
80
100
120
140
M TL
2015
42.4
2.6
44.2
2016
30.9
2017
20.3
2018 2019 Q1
Total Capex (mTL) Total Capex in (mUSD)
FY 2019 Capex to stay clearly below 2018

406
455
423
333
384 383
304290
426
0
50
100
150
200
250
300
350
400
450
500
1.2
1.8
0.0
0.6
1.5
0.3
0.9
2.1
1Q17 2Q18
M TL
4Q17
1.1
1.5
2Q17
1.4
3Q17
1.11.2
1Q18
1.0
0.7
3Q18
0.8
4Q18 1Q19
1.2
Net Debt/EBITDA* (LTM)Net debt
Net Debt / EBITDA
16
Source: CMB financials
(*) EBITDA = Operating Income + Gain/Loss from asset sales + Depreciation
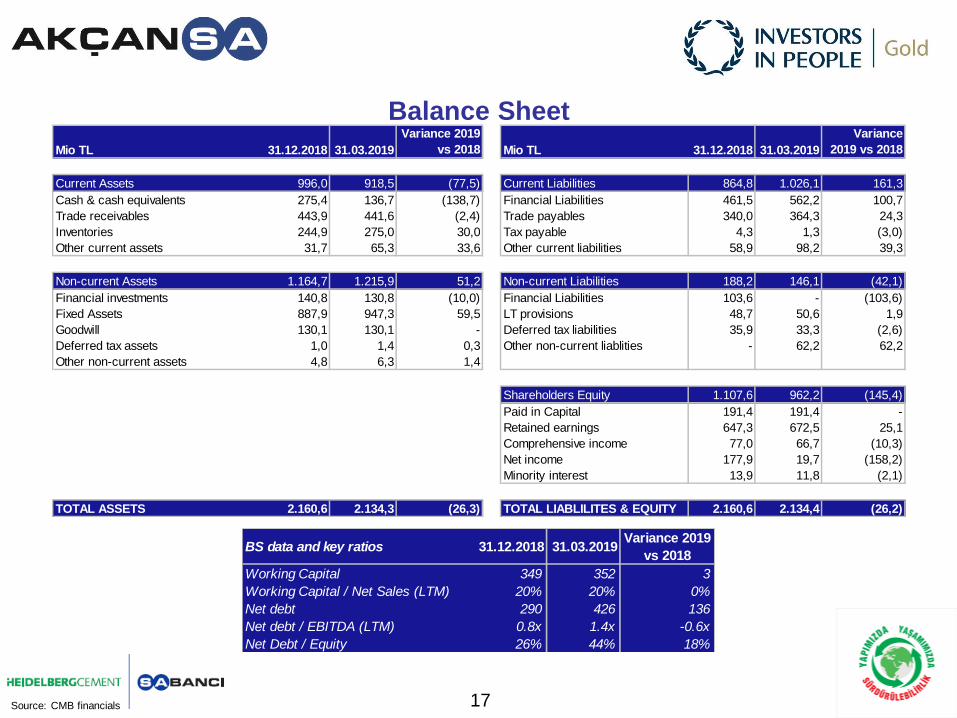
Balance Sheet
Source: CMB financials 17
Mio TL 31.12.2018 31.03.2019
Variance 2019
vs 2018 Mio TL 31.12.2018 31.03.2019
Variance
2019 vs 2018
Current Assets 996,0 918,5 (77,5) Current Liabilities 864,8 1.026,1 161,3
Cash & cash equivalents 275,4 136,7 (138,7) Financial Liabilities 461,5 562,2 100,7
Trade receivables 443,9 441,6 (2,4) Trade payables 340,0 364,3 24,3
Inventories 244,9 275,0 30,0 Tax payable 4,3 1,3 (3,0)
Other current assets 31,7 65,3 33,6 Other current liabilities 58,9 98,2 39,3
Non-current Assets 1.164,7 1.215,9 51,2 Non-current Liabilities 188,2 146,1 (42,1)
Financial investments 140,8 130,8 (10,0) Financial Liabilities 103,6 - (103,6)
Fixed Assets 887,9 947,3 59,5 LT provisions 48,7 50,6 1,9
Goodwill 130,1 130,1 - Deferred tax liabilities 35,9 33,3 (2,6)
Deferred tax assets 1,0 1,4 0,3 Other non-current liablities - 62,2 62,2
Other non-current assets 4,8 6,3 1,4
Shareholders Equity 1.107,6 962,2 (145,4)
Paid in Capital 191,4 191,4 -
Retained earnings 647,3 672,5 25,1
Comprehensive income 77,0 66,7 (10,3)
Net income 177,9 19,7 (158,2)
Minority interest 13,9 11,8 (2,1)
TOTAL ASSETS 2.160,6 2.134,3 (26,3) TOTAL LIABLILITES & EQUITY 2.160,6 2.134,4 (26,2)
BS data and key ratios 31.12.2018 31.03.2019Variance 2019
vs 2018
Working Capital 349 352 3
Working Capital / Net Sales (LTM) 20% 20% 0%
Net debt 290 426 136
Net debt / EBITDA (LTM) 0.8x 1.4x -0.6x
Net Debt / Equity 26% 44% 18%

s
Page
1. Market Overview 4
2. Financial Report 13
3. Outlook 19
Content
18

Global Cement Consumption
Source: CemNet 19
0
1
2
3
4
5
20092008
1.5
2018e2017
[bn ton]
20102007 20132011
2.4
2012 2014
1.4
4.1
2015 2016 2019e
3.02.22.8 2.8
1.4
3.33.6
1.3
3.84.0
1.6
4.1
1.8
2.5
4.1
2.1
4.1 4.2
2.3
4.1
1.5 1.4
2.42.2
1.6
1.6
1.9
1.6 1.6 1.8
2.3
1.7
2.3
1.9 2.0
-2%China
Global without China
2%

Overview of Major Projects in the Marmara
Major urban transformation areas in
Istanbul
Expected effect on Turkey
• Conversion of 6.500k housing units in 20 years
• 260.000k m3 RMC consumption
Çanakkale Bridge
(320k m3)
Izmit Bridge
Connections &
Highways (500k m3)
Ümraniye-
Göztepe-
Ataşehir Metro
Project (1.1m
m3)
Sancaktepe Sabiha
Gökçen Airport
Project
(600k m3)
North Marmara
Highway (2.500k m3)
Bostancı Metro
Project (800k m3)
Yarımca Port
Project
(150k m3)
Nida Residence
Projects (500k m3)
Kirazlı-Halkalı Metro
(450k m3)
3rd Airport –
Gayrettepe Metro
Line (1m m3)
Kadıköy urban
transformation
(1.500k m3)
Kanal İstanbul
Ataköy Marina
(500k m3)
Istanbul Tunnel
(8m m3)
Cendere Region
Rehabilitation Project
Galata Port
(250k m3)
Güneşli TOKI Project
(500k m3)
Tuzla Wholesale
Market Hall Project
(370k m3)
Darıca Gebze Metro
Project
(460kk m3)
Halkalı- 3rd Airport
Metro Project (900k
m3)
Projects 0-2 yearsProjects 3-5 yearsPostponed Projects
Source: New Economic Program; Turkish Government 20.09.2018
Tuzla İski Wastewater
Treatment (
Yenikapı İski
Wastewater
Treatment (175 m3)
Silivri Kiptaş
(100K m3)
Ataköy Marina
(500k m3)
Bayrampaşa urban
transformation project
(500 k m3)
Hadımköy Halk
Ekmek Plant
(150K m3)
Şehir hastaneleri
Kayaşehir (1m m3)
Halkalı Emlak Konut
(500K m3)
Mahmutbey Metro
Project (1m m3)
Taksim AKM
(200K m3)
Sütlüce Toki Project
(100K m3)
Istanbul Finance Center -
(350k m3)
20
Evyap Project – 100k
m3

Compared to 2018:
▪ Total cement volumes expected to increase, driven by
roughly doubling of export volumes
▪ Increase in alternative fuel usage from 13.1% (in 2018) to
above 20% will partially offset increased energy costs
▪ Increased energy costs and general cost inflation will exact
pressure on margins, particularly in the domestic market
▪ Strict cost discipline and tight Capex control
▪ USD-long position expected to increasingly contribute to TL
result increase.
▪ Elevated interest rates expected to increase financial
expenses
2019 Outlook
21
Increasing
Slightly increasing
Flat
Slightly decreasing
Decreasing
2019e
FY
Coal (TL/t)
Petcoke (USD/t)
Petcoke (TL/t)
Diesel (TL/lt)
Electricity (TL/kwh)
Energy Price

Follow Us
22

Steffen Schebesta, CFO
Phone +90 216 571 30 20
Fax +90 216 571 30 21
Dr.Barış Ergen, FPA & IR Manager
Phone +90 216 571 30 50 [email protected]
Fax +90 216 571 30 31 [email protected]
Banu Üçer, Corporate Communication Manager
Phone +90 216 571 30 13 [email protected]
Fax +90 216 571 30 11
Websites
www.akcansa.com.tr
www.betonsa.com.tr
www.sabanci.com.tr
www.heidelbergcement.com
Contacts
23
Appendix
24

EBITDA Margins
EBITDA Margin - Quarterly
0
5
10
15
20
25
30
35
25.0
18.1
Q1
%
Q2 Q4Q3
26.5
16.0
31.830.3
18.2
27.0
31.2 31.8
14.8
23.6 24.626.9
24.222.1
11.1
201920172015 20182016
EBITDA Margin - YTD
0
5
10
15
20
25
30
3529.6
16.0
12M
%
25.026.5
6M3M 9M
17.218.1
27.9
22.9
30.1 29.2
19.6
23.5
14.8
29.3 27.9
20.3 20.7
25

Dividend Paid Dividend Yield % Payout Ratio %
Dividend Paid, Dividend Yield and Payout Ratio
*) Adjusted for extraordinary gain from sale of Hobim shares (Income from Hobim sale amounted to 26,000,000 TL and special reserves 19,319,981 TL are excluded)
**) Akcansa closing share price as of 27 March 2019 is used for dividend yield calculation
Source: CMB single financials and AKC calculations
2015
226.3
2016 2017(*) 2018 2019
257.6237.2
128.0
152.8
2015
6.6
2014 20172016 2018
(**)
6.8
8.79.2
11.2
20182014 20172015
90.9
2016(*)
91.6 91.286.1
89.8
26

Annual Mortgage Interest Rate
as of Apr 19
Source: TCMA and TBB
15,0
27,8
21,0
17,0
10
12
14
16
18
20
22
24
26
28
%
2015Q
4
2016Q
2
2016Q
1
2017Q
2
2016Q
4
2016Q
3
2017Q
1
13,0
2017Q
3
2018Q
4
2017Q
4
2018Q
1
2018Q
2
22,8
2018Q
3
Jan 2
019
Feb 2
019
Mar 2
019
Apr 2
019
13,2
+2,0
27

General Basics About Cement and RMC Production Production
▪75-85% clinker is consumed to produce 1 ton of cement
▪250-300 kg of cement in 1 m3 RMC produced
▪1.5-2.0 ton of aggregate in 1 m3 RMC produced depending on the type of RMC produced
▪Distribution of cement production cost : 80-85% variable and 15-20% fixed costs
Fuel
▪A cement plant of 1 mio ton clinker capacity may consume 100 k ton petrocoke or 130 k ton coal, or a mix of both
▪7.500 kcal/ton in petrocoke vs. 6.000 kcal/ton in coal.
▪Fuel accounts for 35-40% of the variable cost of producing 1 ton of cement, 55-60% of producing 1 ton of clinker
▪1% increase in alternative fuel usage provides a 2.0-2.5 mTL cost advantage per year
Electricity
▪Electricity accounts for 15-20% of the variable cost of producing 1 ton of cement, 15-20% of producing 1 ton of clinker
▪0.01 TL increase in cost of 1 kwh electricity corresponds to 1.5-2.0 TL cost increase in 1 ton of cement.
▪Contribution of waste heat project
▪20-25% of Çanakkale Plant electricity consumption
▪Monthly contribution to P&L of Akcansa is around 2-2.5m TL based on current electricity prices
▪Contribution of one windmill
▪1-1.5% of Çanakkale Plant electricity consumption
▪2.0-2.5m TL yearly saving
▪Capacity is 2.4 MW/h
28

Sabancı Foundation
guided by love for humanity for 45 years, continues its activities for women,
youth and persons with disabilities in 3 areas:
29
SABANCI INTERNATIONALADANA THEATER FESTIVAL
SABANCI FOUNDATION SHORT FILM COMPETITION
NATIONAL YOUTH PHILHARMONIC
ORCHESTRA
190CHANGEMAKERS
20 MN+ GRANTS TO 148
PROJECTS
PHILANTHROPY SEMINARS
EDUCATION CULTURE-ARTS SOCIAL CHANGE
METROPOLIS ARCHEOLOGICAL
EXCAVATIONS
4
INTERNATIONAL AWARDS
SABANCI UNIVERSITY
INSTITUTIONS
SCHOLARSHIPS
AWARDS


![요약재무제표휴온스] IR BOOK_2020 2Q... · 2020. 9. 25. · 20년2분기연결기준매출1,036억원(YoY 17.6%), 영업이익132억원(YoY 57.3%), 순이익106억원(YoY](https://img.pdfslide.net/doc/110x75/60bfc29efa74e272a77e4410/eoeoe-oe-ir-book2020-2q-2020-9-25-20e2eeeeeoe1036yoy.jpg)


![Server Forum 2014 - JEDEC market driver Internet data center [+14% YoY in ‘14] Public cloud growth stacking capability [+18% YoY in ‘14] Industry demand High performance server](https://img.pdfslide.net/doc/110x75/5b37e7c27f8b9a40428ce756/server-forum-2014-jedec-market-driver-internet-data-center-14-yoy-in-14.jpg)