Embed Size (px)
Citation preview
resource "akamai_property" "example" { hostname = ["www.example.org","example.org"]
origin { hostname = "www.randomnoise.us" }
compress { extensions = ["css", "js"] content_types = ["text/html", "application/json"] }
cache { match { extensions = ["css", "js"] } max_age = "30d" prefreshing = true prefetch = true }}
$ akamai get akamai-open/cli-propertyAttempting to fetch command...... [OK]Installing...... [OK]Available Commands: update help list get propertySee "akamai help [command]" for details.
$ akamai get akamai-open/cli-propertyAttempting to fetch command...... [OK]Installing...... [OK]Available Commands: update help list get propertySee "akamai help [command]" for details.
$ akamai get akamai-open/cli-propertyAttempting to fetch command...... [OK]Installing...... [OK]Available Commands: update help list get propertySee "akamai help [command]" for details.
AkamaiWorkbook
Q U I C K 3 0 M I N T U T O R I A L S

Sign up for the Akamai Developer ProgramGet access to the latest developer tools, exclusive BETAs, upcoming events, and so much more.
bit.ly/akamaidev
A K A M A I W O R K B O O K | P A G E 1
Table of ContentsQ U I C K 3 0 M I N T U T O R I A L S
About the Akamai Workbook System setup 4 Step 1: Install Docker 4
Step 2: Run the container 4
01 Getting Started with Akamai Web Performance Step 1: Create an Akamai property 5 Step 2: Define a hostname 5 Tell me more! 6 Step 3: Configure the origin server 6 Tell me more! 7 Step 4: Define a CP Code 7 Step 5: Define SureRoute Test Object 7 Tell me more! 8 Step 6: Configure caching for static objects 8 Tell me more! 9 Step 7: Save and activate on the Staging network 9 Step 8: Check your site 10
Summary 10
02 High Performance Images with Image Manager Prerequisites 11 A note about user interface changes 11
Part 1: Create Image Manager policies 11 Step 1: Add NetStorage and Image Manager to your property 11 Step 2: Setting up the required Image Manager policies 13 Step 3: Create a new policy for background color 13 Step 4: View Image Manager in action 15 Step 5: Observe with Piez 15 Tell me more! 16
Part 2: Product Viewer 16 Step 1: Create a Media Collection and a 360 Spin Set 16 Step 2: Add single-image items 18 Step 3: View the Product Viewer sample page 18 Tell me more! 18

P A G E 2 | A K A M A I W O R K B O O K
03 Advanced Property Manager Prerequisites 19
Scenario 1: Website Redesign 19 Step 1: Add variables for path manipulation 19 Step 2: Add a Path Rewrite Rule 20 Step 3: Change the URL path 21 Step 4: Substitute the query string 22 Tell me more! 22 Step 5: Rewrite the forward path 22
Scenario 2: Handling erroneous content 23 Step 1: Create a new rule 23 Step 2: Limit the scope to certain pages only 23 Step 3: Add the Custom Behavior 24
Summary 24
04 Analyze Site Speed and Revenue with mPulse Step 1: Access the demo site 25 Step 2: Check your site’s pulse 26 Tell me more! 27 Step 3: Use What-if to forecast revenue, conversion, and degradation 27 Tell me more! 28 Step 4: Find performance optimizations 28 Step 5: Fix performance issues 30
Summary 31
05 Authentication and Provisioning using Luna Step 1: Add a new credential using Luna 32 Tell me more! 32 Step 2: Grant API access 33 Step 3: Set up the Docker container 35 Step 4: Verify your credentials 36 Step 5: Create more credentials 36
Tell me more! 36
Table of ContentsQ U I C K 3 0 M I N T U T O R I A L S
A K A M A I W O R K B O O K | P A G E 3
06 Diagnostic Tools Prerequisites 37 Step 1: Use the diagnostic-tools.py code 37 Tell me more! 38 Step 2: Access the APIs from the command line 39
Advanced: Additional Commands 40
07 Use the Purge API Prerequisites 41
Step 1: Use the ccu-v3.py code 41 Tell me more! 42
Step 2: Access the CCU V3 API from the command line 42
Step 3: Access the CCU V3 API using Akamai CLI 43
Advanced 43
08 Property Manager API Tutorial Prerequisites 44
Step 1: Choose a property name 44
Step 2: Create a new property 44 Tell me more! 45
Step 3: Retrieve property rules 45 Tell me more! 46
Step 4: Get a list of rule formats 46
Step 5: Use search 47
Step 6: Modify the origin 47
Step 7: Modify user variables 49
Step 8: View the property in Luna 50
Step 9: Delete the property 51
P A G E 4 | A K A M A I W O R K B O O K
INTRODUCTION
About the Akamai WorkbookThis workbook shows you how to create your first Akamai property (also known as a config), and then modify it using various features of the Akamai Intelligent Platform. The workbook starts with basic UI setup and progresses towards using code and the command line.
These tutorials are designed to be used at the Edge conference, with the pre-configured machines provided in the Hands-On Lab area. If you are using your own device, you’ll need to do some initial setup to replicate the environment used in the Hands-On Lab area. Note that Analyze Site Speed and Revenue with mPulse doesn’t require any previous setup.
System setupThe first tutorial in the Workbook uses a login that is provided to you in the Developer Zone Hands-On Labs area. If you’re doing this workbook at home, you’ll have to use your Akamai login. Some of the later tutorials use this same login, which is listed in the Prerequisites section.
In addition, the API tutorials in the second half of this workbook use a Docker container which has been configured with all the software needed to complete the tutorials. If you’re using your own laptop, you’ll need to download install Docker and run the container. This process will take a few minutes, and is explained below.
If you’re in the DevZone at Edge, double-click the Hands-On Labs icon on the desktop and move to the next tutorial.
Step 1: Install DockerInstall Docker on your personal device.
1. Go to https://www.docker.com.
2. Under Get Docker, choose your operating system and follow the instructions.
Step 2: Run the containerOnce Docker is running, download and run the container. The initial download may take a few minutes.
1. Open a terminal window, command prompt, or powershell window.
2. Type the following command:docker run -it akamaiopen/api-kickstart
That’s it! Note that each Docker instance is unique, so you’ll want to keep the same terminal window open between tutorials.
A K A M A I W O R K B O O K | P A G E 5
TUTORIAL 01
Getting Started with Akamai Web PerformanceLevel: Beginner Duration: 25-35 minutes
In this tutorial you’ll learn how to get superior performance from your website by putting it on the Akamai network. You’ll learn how to create a configuration and modify it with Property Manager, including how to add some basic caching.
Step 1: Create an Akamai propertyAn Akamai property is a website that’s been configured in a certain way. Sometimes we call a property a config, because it’s based a collection of configuration values.
1. Navigate to Luna at https://control.akamai.com/.
2. Log in with your username and password. If you’re doing a Hands-On Lab at Edge, use the username and password provided to you.
3. In Luna, click Configure > Property Manager > New Property.
4. Give your property a name something like edge2017-<YourID>.www.wp1.akamaiuweb.com, where <YourID> can be your first name and last initial, your initials, or some other unique identifier. Do not add spaces or non-letter characters. For example, if your name is Bob Marley, you might use edge2017-bobm.www.wp1.akamaiuweb.com.
5. Deselect the Launch assistant upon creation option.
6. Select Ion Premier if it’s not selected by default, and then click Create Property.
After you create a new property, a wizard opens to guide you through creating a hostname, IP version, and edge hostnames.
Step 2: Define a hostnameIn this step you enter your hostname and assign an Edge hostname. The hostname is your site’s address and the Edge hostname as the entry point onto the Akamai network.
1. On the first page of the wizard, in the Property Hostnames section, click Add.
2. Enter the same hostname as the name of your property: edge2017-[YourID].www.wp1.akamaiuweb.com. Click Next.
3. Select IPv4 Only and click Next.
4. Click the pencil tool to edit the Edge Hostname.
5. Select the following Edge Hostname from the list: lab-www.wp1.akamaiuweb.com.edgesuite.net
P A G E 6 | A K A M A I W O R K B O O K
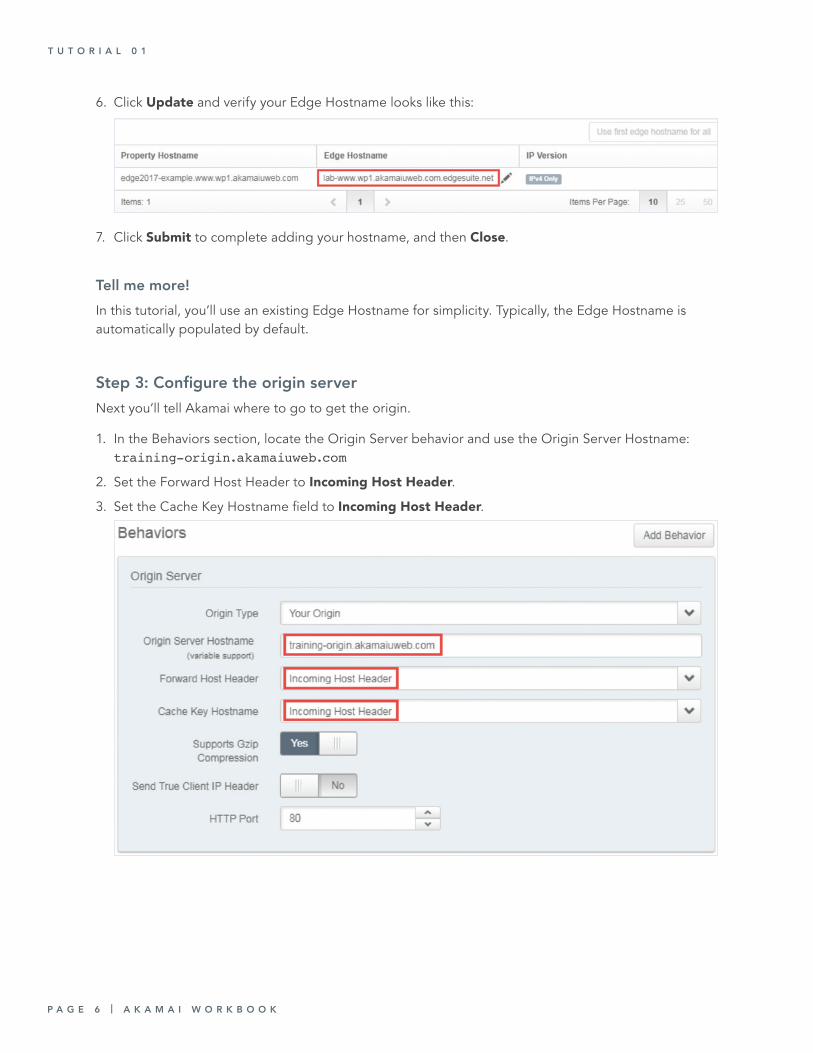
6. Click Update and verify your Edge Hostname looks like this:
7. Click Submit to complete adding your hostname, and then Close.
Tell me more!In this tutorial, you’ll use an existing Edge Hostname for simplicity. Typically, the Edge Hostname is automatically populated by default.
Step 3: Configure the origin server Next you’ll tell Akamai where to go to get the origin.
1. In the Behaviors section, locate the Origin Server behavior and use the Origin Server Hostname: training-origin.akamaiuweb.com
2. Set the Forward Host Header to Incoming Host Header.
3. Set the Cache Key Hostname field to Incoming Host Header.
T U T O R I A L 0 1
A K A M A I W O R K B O O K | P A G E 7
Tell me more!It’s important to set the Forward Host Header and Cache Key Hostname fields correctly for your Akamai property to work with your origin.The Forward Host Header needs to be the host header that the origin is expecting. In this case, it is expecting the same value as your site hostname. The Cache Key Hostname field specifies which hostname should form the hostname portion of the cache key for this site. In other words, it specifies content on the site fetched from this origin. In this case, the content is also the Incoming Host Header.
Step 4: Define a CP Code Content Provider Codes (CP codes) are used on the Akamai Network for reporting and billing purposes. They help keep track of the different segments of your traffic.
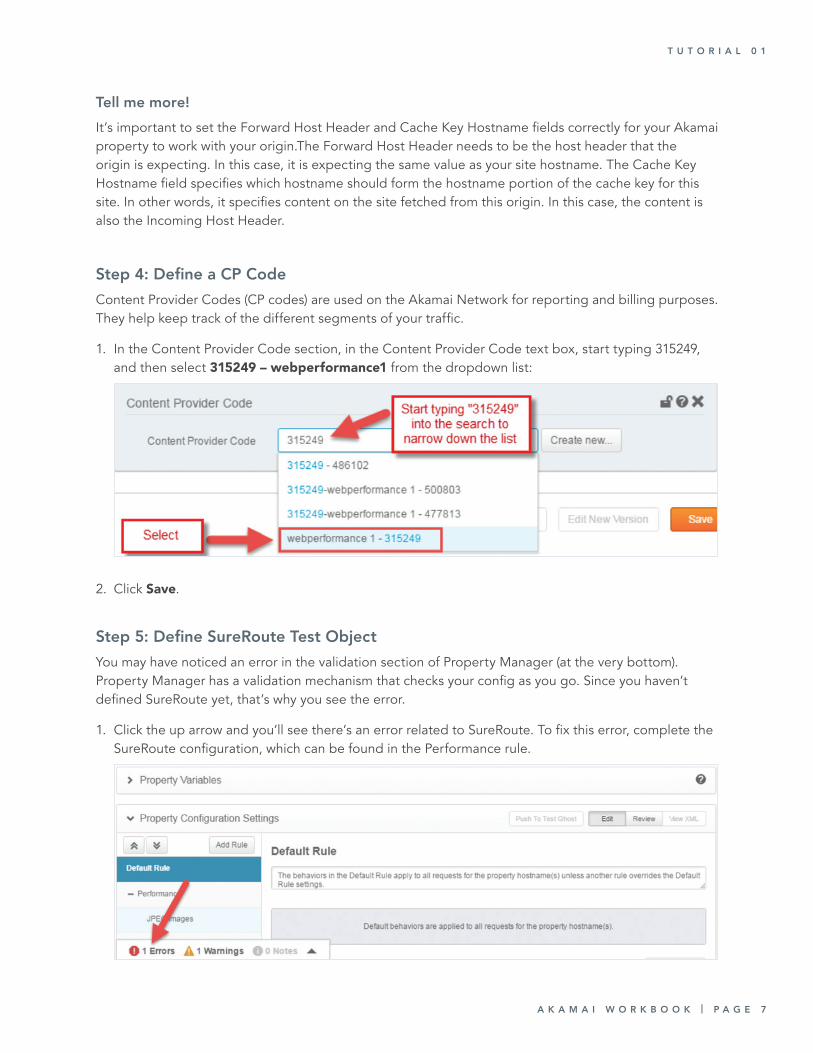
1. In the Content Provider Code section, in the Content Provider Code text box, start typing 315249, and then select 315249 – webperformance1 from the dropdown list:
2. Click Save.
Step 5: Define SureRoute Test ObjectYou may have noticed an error in the validation section of Property Manager (at the very bottom). Property Manager has a validation mechanism that checks your config as you go. Since you haven’t defined SureRoute yet, that’s why you see the error.
1. Click the up arrow and you’ll see there’s an error related to SureRoute. To fix this error, complete the SureRoute configuration, which can be found in the Performance rule.
T U T O R I A L 0 1
P A G E 8 | A K A M A I W O R K B O O K
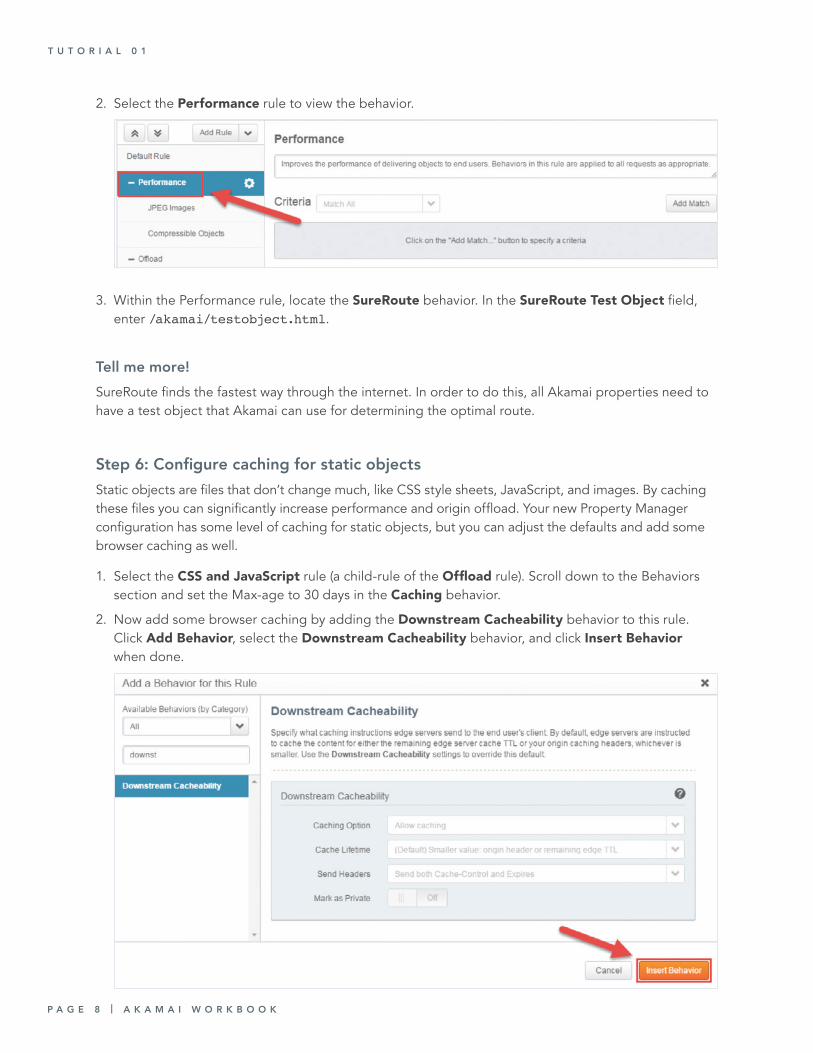
2. Select the Performance rule to view the behavior.
3. Within the Performance rule, locate the SureRoute behavior. In the SureRoute Test Object field, enter /akamai/testobject.html.
Tell me more!SureRoute finds the fastest way through the internet. In order to do this, all Akamai properties need to have a test object that Akamai can use for determining the optimal route.
Step 6: Configure caching for static objectsStatic objects are files that don’t change much, like CSS style sheets, JavaScript, and images. By caching these files you can significantly increase performance and origin offload. Your new Property Manager configuration has some level of caching for static objects, but you can adjust the defaults and add some browser caching as well.
1. Select the CSS and JavaScript rule (a child-rule of the Offload rule). Scroll down to the Behaviors section and set the Max-age to 30 days in the Caching behavior.
2. Now add some browser caching by adding the Downstream Cacheability behavior to this rule. Click Add Behavior, select the Downstream Cacheability behavior, and click Insert Behavior when done.
T U T O R I A L 0 1
A K A M A I W O R K B O O K | P A G E 9
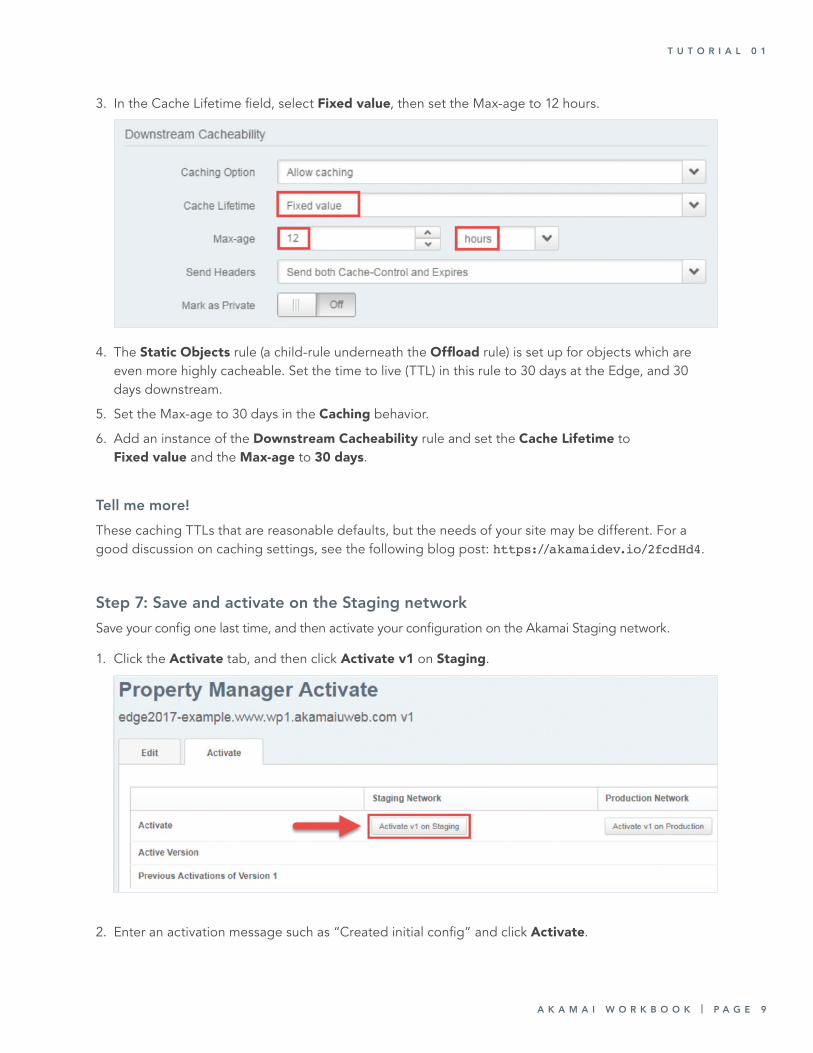
3. In the Cache Lifetime field, select Fixed value, then set the Max-age to 12 hours.
4. The Static Objects rule (a child-rule underneath the Offload rule) is set up for objects which are even more highly cacheable. Set the time to live (TTL) in this rule to 30 days at the Edge, and 30 days downstream.
5. Set the Max-age to 30 days in the Caching behavior.
6. Add an instance of the Downstream Cacheability rule and set the Cache Lifetime to Fixed value and the Max-age to 30 days.
Tell me more!These caching TTLs that are reasonable defaults, but the needs of your site may be different. For a good discussion on caching settings, see the following blog post: https://akamaidev.io/2fcdHd4.
Step 7: Save and activate on the Staging networkSave your config one last time, and then activate your configuration on the Akamai Staging network.
1. Click the Activate tab, and then click Activate v1 on Staging.
2. Enter an activation message such as “Created initial config” and click Activate.
T U T O R I A L 0 1
P A G E 1 0 | A K A M A I W O R K B O O K
Note: It currently takes about 10-20 minutes to activate the initial version of your property on the Staging Network. This screen will tell you when your config is activated. In the meantime, you can navigate elsewhere in Luna without affecting the status of the activation.
Step 8: Check your siteYou’ll know when your property has been activated via a notification email or by observing the status on the Activate page. You can see this in your browser using the URL: http://edge2017-example.www.wp1.akamaiuweb.com/
SummaryYou’ve now seen how to get a simple site up and running on Akamai with the standard feature set. From here, you can further adjust your property to add additional caching behavior as well as many other features.
T U T O R I A L 0 1
A K A M A I W O R K B O O K | P A G E 1 1
TUTORIAL 02
High Performance Images with Image ManagerLevel: Beginner Duration: 25-35 minutes
Image Manager automates image processing and offloads the creation of derivative images in various sizes and formats to the CDN. In this tutorial, you’ll add Image Manager to the Akamai property you configured in the tutorial. Then, you’ll:
• Automate applying background colors to images• Use variables to change the background color dynamically• Group multiple images of the same product together in a collection• Display a collection of images in a product viewer
PrerequisitesYou must first complete Getting Started with Akamai Web Performance. After doing that tutorial, you’ll have an Akamai property with the hostname edge2017-[YourID].www.wp1.akamaiuweb.com, which you’ll use in this tutorial.
A note about user interface changesThe most recent version of Image Manager Policy Manager has a number of UI changes that may be active for some customers and not for others. This workbook assumes you’re not using the new Image Manager UI.
If you’re using the new Image Manager Policy Manager UI, be sure the Configure Policy Settings is expanded. In this view, use the accordion panel on the left to add transformations, and to set the widths and quality of derivative images. From this point, you should be able to apply the instructions here to the new UI.
Part 1: Create Image Manager policiesIn this first part of the tutorial, you’ll create an Image Manager policy that automates a simple artistic transformation: applying a background color. By using a variable value, the color used in the background changes dynamically.
Step 1: Add NetStorage and Image Manager to your propertyFor this tutorial, we’ve created a set of test images (hammers) that reside in a distributed storage network (NetStorage). These steps point your configuration to this image store. In order to add this, you need to edit a new version of your property in Property Manager.
1. Log in to Luna, and navigate to your property in Property Manager. Tip: You can use the search box to find the hostname of your property.
2. On the Actions menu, select Edit New Property.
P A G E 1 2 | A K A M A I W O R K B O O K
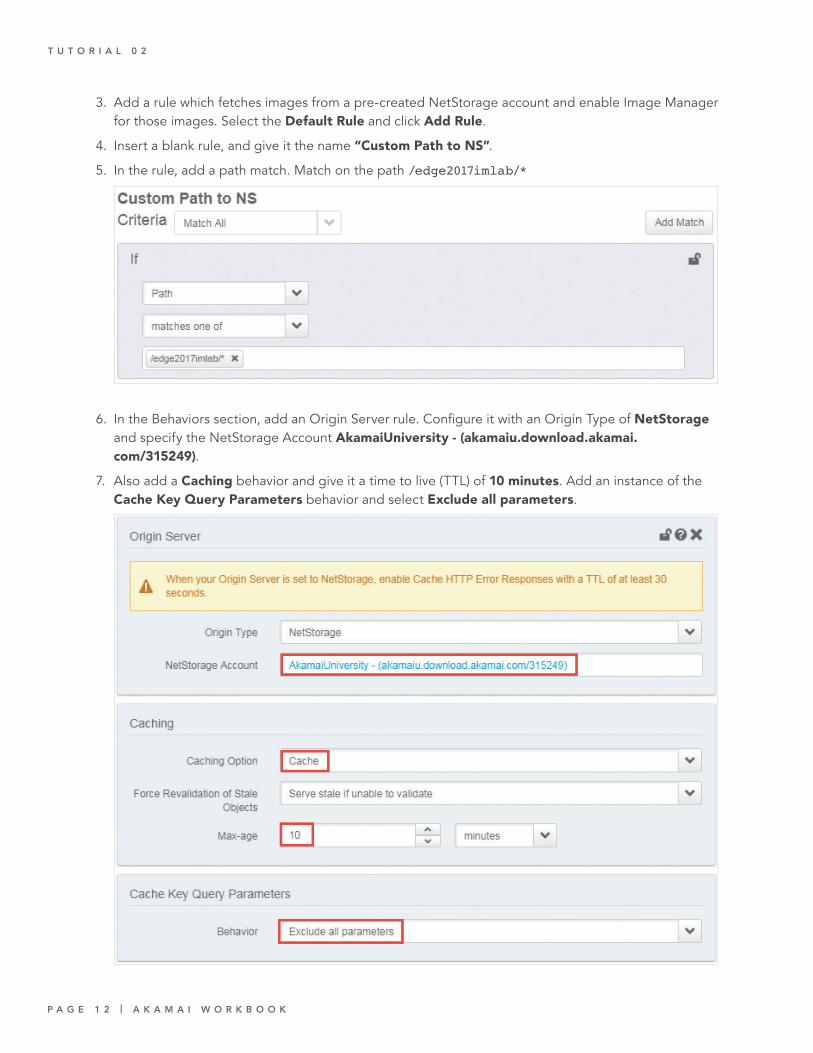
3. Add a rule which fetches images from a pre-created NetStorage account and enable Image Manager for those images. Select the Default Rule and click Add Rule.
4. Insert a blank rule, and give it the name “Custom Path to NS”.
5. In the rule, add a path match. Match on the path /edge2017imlab/*
6. In the Behaviors section, add an Origin Server rule. Configure it with an Origin Type of NetStorage and specify the NetStorage Account AkamaiUniversity - (akamaiu.download.akamai.com/315249).
7. Also add a Caching behavior and give it a time to live (TTL) of 10 minutes. Add an instance of the Cache Key Query Parameters behavior and select Exclude all parameters.
The Behaviors in your Custom Path to NS rule should look like this:
T U T O R I A L 0 2
A K A M A I W O R K B O O K | P A G E 1 3
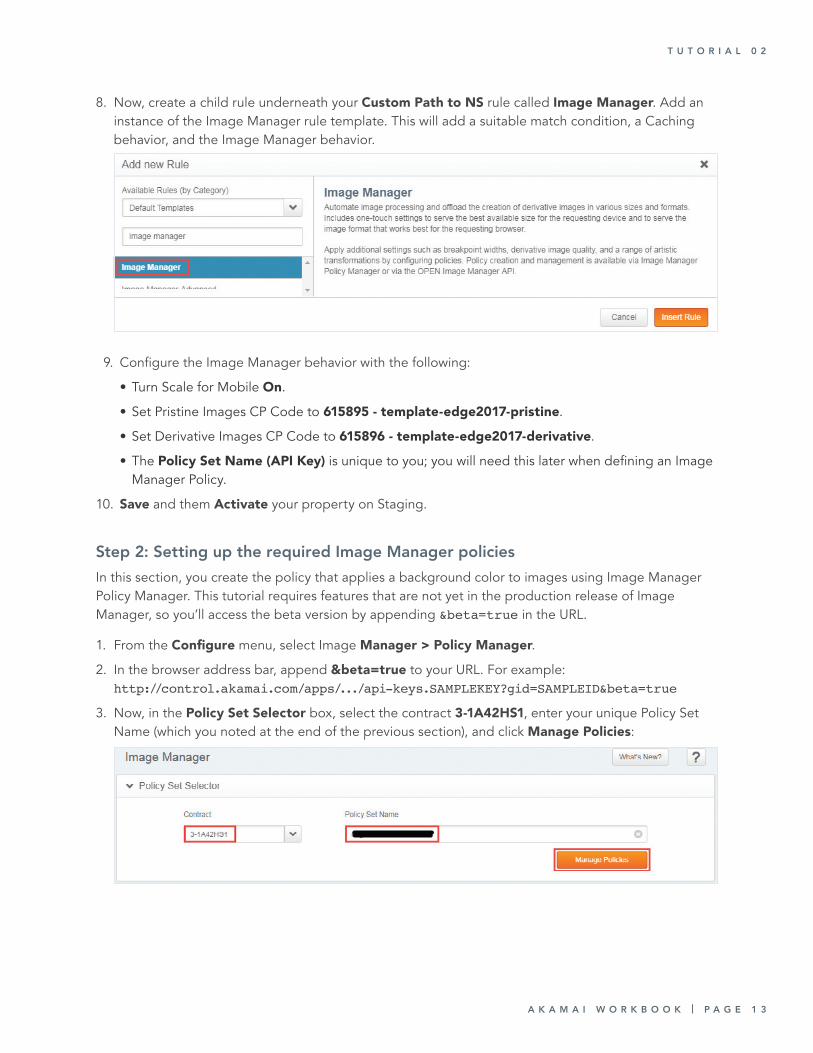
8. Now, create a child rule underneath your Custom Path to NS rule called Image Manager. Add an instance of the Image Manager rule template. This will add a suitable match condition, a Caching behavior, and the Image Manager behavior.
9. Configure the Image Manager behavior with the following:
• Turn Scale for Mobile On.
• Set Pristine Images CP Code to 615895 - template-edge2017-pristine.
• Set Derivative Images CP Code to 615896 - template-edge2017-derivative.
• The Policy Set Name (API Key) is unique to you; you will need this later when defining an Image Manager Policy.
10. Save and them Activate your property on Staging.
Step 2: Setting up the required Image Manager policiesIn this section, you create the policy that applies a background color to images using Image Manager Policy Manager. This tutorial requires features that are not yet in the production release of Image Manager, so you’ll access the beta version by appending &beta=true in the URL.
1. From the Configure menu, select Image Manager > Policy Manager.
2. In the browser address bar, append &beta=true to your URL. For example: http://control.akamai.com/apps/.../api-keys.SAMPLEKEY?gid=SAMPLEID&beta=true
3. Now, in the Policy Set Selector box, select the contract 3-1A42HS1, enter your unique Policy Set Name (which you noted at the end of the previous section), and click Manage Policies:
T U T O R I A L 0 2
P A G E 1 4 | A K A M A I W O R K B O O K
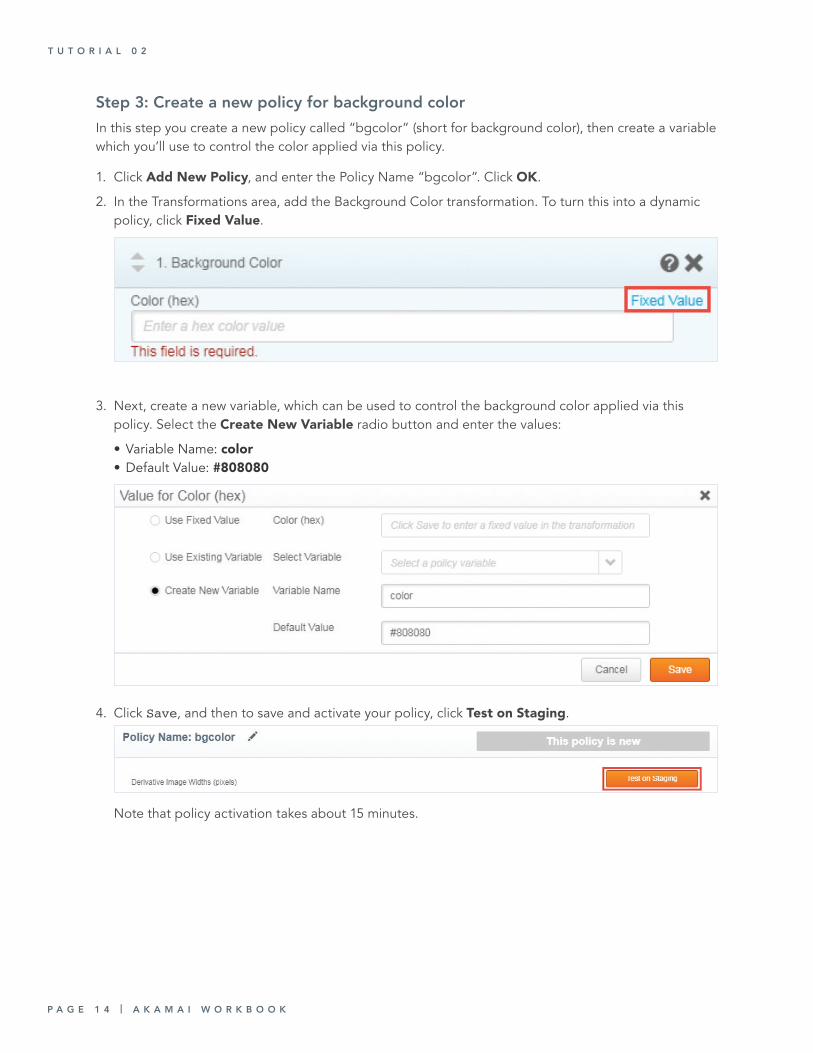
Step 3: Create a new policy for background colorIn this step you create a new policy called “bgcolor” (short for background color), then create a variable which you’ll use to control the color applied via this policy.
1. Click Add New Policy, and enter the Policy Name “bgcolor”. Click OK.
2. In the Transformations area, add the Background Color transformation. To turn this into a dynamic policy, click Fixed Value.
3. Next, create a new variable, which can be used to control the background color applied via this policy. Select the Create New Variable radio button and enter the values:
• Variable Name: color• Default Value: #808080
4. Click Save, and then to save and activate your policy, click Test on Staging.
Note that policy activation takes about 15 minutes.
T U T O R I A L 0 2
A K A M A I W O R K B O O K | P A G E 1 5
Step 4: View Image Manager in action To see Image Manager in action, take a look at a product page that shows multiple hammers in different colors.
1. In your browser, navigate to the hammer.php page: http://edge2017-[YourID].www.wp1.akamaiuweb.com/hammer.php
2. Notice the image URLs used by the <img> tags for the hammer images. See how they are leveraging:
• The policy with parameter impolicy=bgcolor
• The imwidth parameter (used to get a more optimal image size)
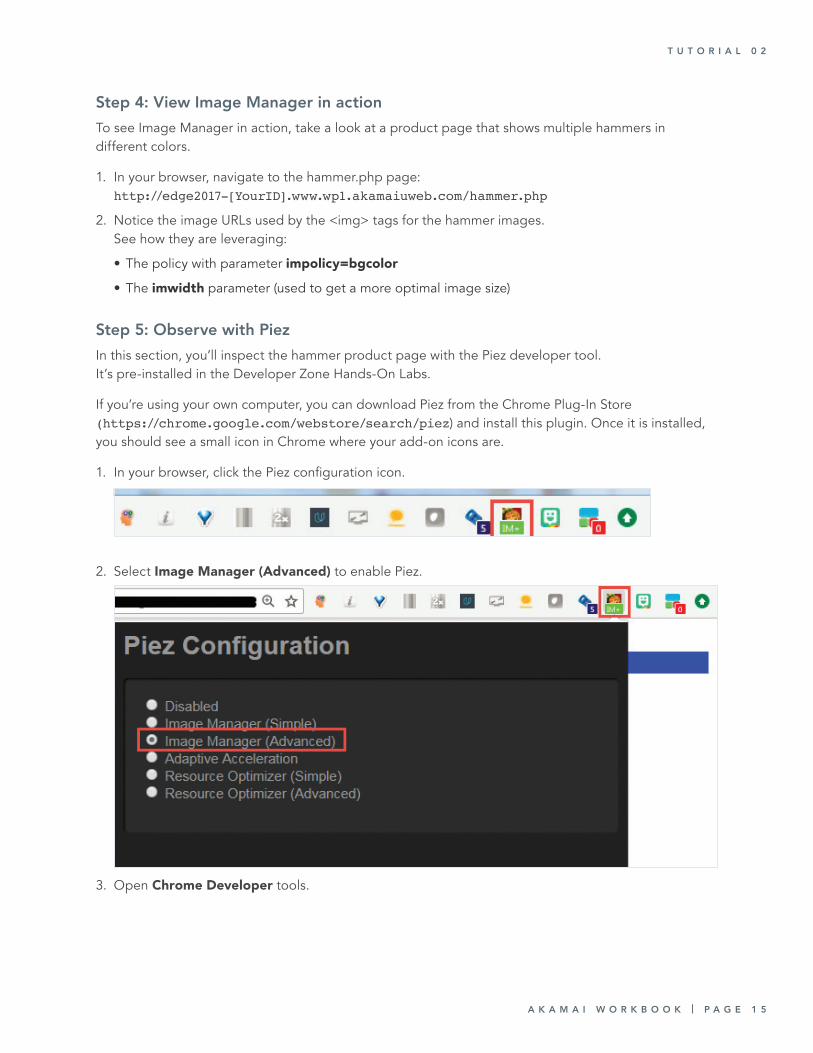
Step 5: Observe with PiezIn this section, you’ll inspect the hammer product page with the Piez developer tool. It’s pre-installed in the Developer Zone Hands-On Labs.
If you’re using your own computer, you can download Piez from the Chrome Plug-In Store (https://chrome.google.com/webstore/search/piez) and install this plugin. Once it is installed, you should see a small icon in Chrome where your add-on icons are.
1. In your browser, click the Piez configuration icon.
2. Select Image Manager (Advanced) to enable Piez.
3. Open Chrome Developer tools.
T U T O R I A L 0 2

P A G E 1 6 | A K A M A I W O R K B O O K
4. In the developer tools pane, select the Piez tab. If no data appears, reload the page.
Notice that the image widths are 640 px, which is the next size up from the requested width of 390 px given by the imwidth parameter. You can also see the byte reduction resulting from this and the compression, which is pretty significant at over 88%.
Tell me more!An additional sample page exists which allows you to easily choose any background color for the hammer pictures. Repeat the steps above using this additional sample page:
http://edge2017-[YourID].www.wp1.akamaiuweb.com/edge2017imlab/background-color.html
Part 2: Product ViewerThe second part of this tutorial uses the Imane Manager Product Viewer. The Product Viewer displays a group of related media items together in a carousel layout with thumbnails. You define sets of media items with Image Manager Media Collections. In this example, you’ll use a set of images of a pair of sandals.
In this tutorial, you use a common property: im-collection-lab. You’ll need to use the Policy Set Name (API Key) for this property: im-collections-lab-10493948.
Step 1: Create a Media Collection and a 360 Spin SetIf you’re doing this Hands-On Lab at Edge, you should create a unique Media Collection, using the same ID you used in the previous tutorial. Your Media Collection name will be “Sandal-[YourID]”.
1. In Luna, go to Configure > Image Manager > Media Collections (Beta)
T U T O R I A L 0 2

A K A M A I W O R K B O O K | P A G E 1 7
2. Select the contract 3-1A42HS1. In the Policy Set Name field, enter im-collections-lab-10493948.
3. Click the Add New Collection button to create a new collection tied to your Policy Set Name. Use the following:
• Collection ID: Sandal-[YourID]• Description: Sandal-[YourID]
4. Click Add Media Items to add items to your new collection.
5. Download in this file: http://im-collections-lab.edgesuite.net/edge2017imlab/ sandal-images.txt.
6. Select the Add a 360 Spin Set radio button. Paste in the URLs from the sandal-images.txt file.
7. Scroll down. Enter a tag of Spin, and click the Add button to add these images:
8. You should now see that, within your “Sandal-[YourID]” media collection, you have a single item which is your 360 Spin Set composite item:
T U T O R I A L 0 2
P A G E 1 8 | A K A M A I W O R K B O O K
Step 2: Add single-image itemsYou now add three additional images, but these will be single-image items, representing the front, side, and angle shots of the sandals. The URLs for easy copy/paste are located here: http://im-collections-lab.edgesuite.net/edge2017imlab/sandal-extras.txt
1. Click Add Media Items.
2. Leave the Add Images or Videos radio button selected.
3. Enter the first URL: http://im-collections-lab.edgesuite.net/edge2017imlab/images/sandal/360view/Img0206.jpg
4. Enter the Tag Angle and click Add Media Items.
5. Repeat steps 1-4 with the tag Front and the URL: http://im-collections-lab.edgesuite.net/edge2017imlab/images/sandal/360view/Img0214.jpg
6. Repeat steps 1-4 with the tag Side and the URL: http://im-collections-lab.edgesuite.net/edge2017imlab/images/sandal/360view/Img0229.jpg
7. Once you’re done adding all three images, click Save Changes to finish.
Step 3: View the Product Viewer sample pageNow that you’ve grouped images into a media collection and a 360 spin set, let’s see what the end result looks like. Your demo site already has a page with the necessary HTML and JavaScript code to put your image collection and 360 spin set into a carousel-style product viewer.
1. In your browser, go to the URL: http://im-collections-lab.edgesuite.net/edge2017imlab/pvdemo.html?imcollection=Sandal-[YourID]
If you’re having trouble with your site, you can look at the pre-created site here: https://akamaidev.io/2yf3LqY
2. To explore how this works, view the page’s HTML source.
Tell me more!You can find additional help by clicking the help button on any Property Manager, Policy Manager, or Media Collections page, or by navigating to the Image Manager user documentation page: https://control.akamai.com/portal/content/akaServiceSupport/documentation/ImageManager.jsp
T U T O R I A L 0 2
A K A M A I W O R K B O O K | P A G E 1 9
TUTORIAL 03
Advanced Property ManagerLevel: Intermediate Duration: 20-25 minutes
Akamai products offer a broad set of features to let you control how the edge servers process your traffic. Property Manager features are organized as nested rules, and most of the time the built-in features are all you need. In this tutorial, you’ll learn how to go beyond the more common settings and enhance your Property Manager configuration using variables, regular expressions, and custom behaviors.
PrerequisitesThis tutorial assumes you completed Getting Started with Akamai Web Performance and have a good understanding of complex web and CDN concepts.
The advanced Property Manager features can be used to implement almost any functionality. This tutorial walks you through two scenarios that illustrate the flexibility you have at your disposal.
Scenario 1: Website Redesign Your website has undergone a major redesign, which changed the path structure of your content. To preserve SEO rankings and avoid a lot of redirects, you’ll use Akamai to rewrite the incoming path from the old structure to the new one, before going forward to your origin server.
For all pages like /ct/lg/foo, rewrite the forward path to /lg_CT/foo.
For example: /us/en/foo ⇒ /en_US/foo
In addition, we also have some incoming requests with a query string loc that we now need to rewrite and replace with a fixed value loc=0.
For example: /us/en/foo?loc=5 ⇒ /en_US/foo?loc=0 /us/en/foo?x=a&loc=abc&pg=b ⇒ /en_US/foo?x=a&loc=0&pg=b
Step 1: Add variables for path manipulationUsing the property you created in Getting Started with Akamai Web Performance, modify it to add some variables that will do the path manipulation. You’ll create three variables: one for country, one for language, and another for the forward path.
1. In Luna, navigate to the property you created in Getting Started with Akamai Web Performance.
2. Expand Property Variables near the top of the config and click Add Variable.
P A G E 2 0 | A K A M A I W O R K B O O K
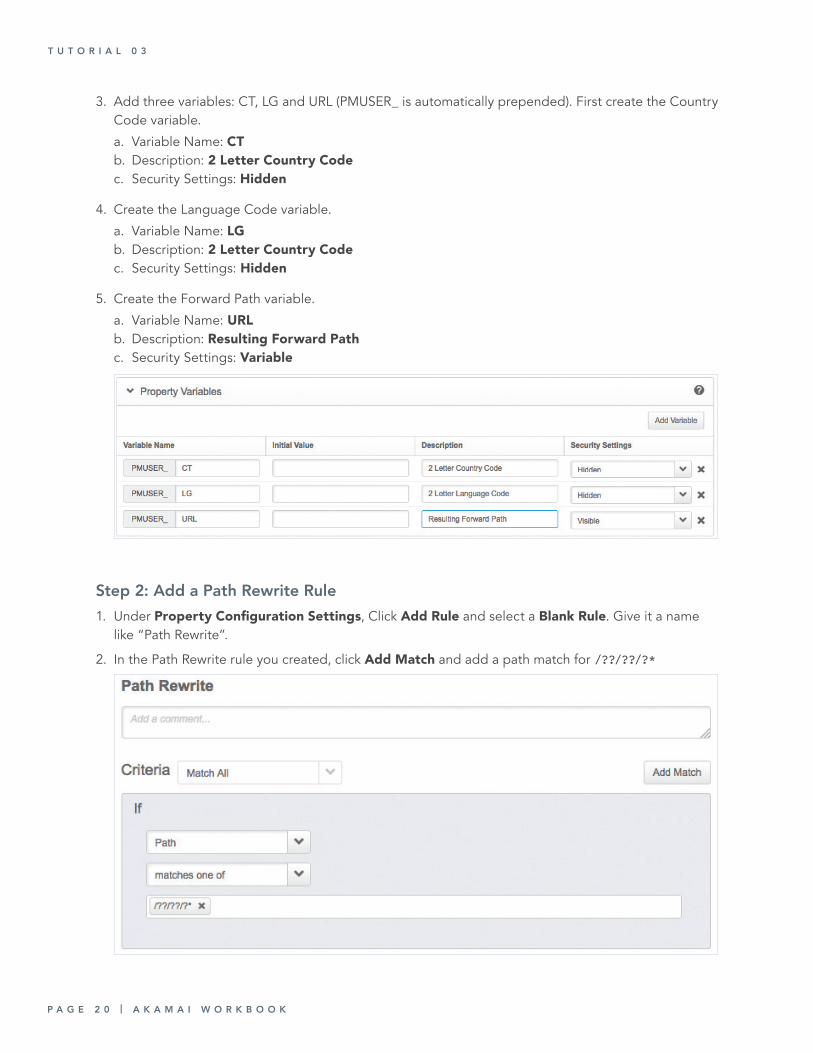
3. Add three variables: CT, LG and URL (PMUSER_ is automatically prepended). First create the Country Code variable.
a. Variable Name: CT b. Description: 2 Letter Country Codec. Security Settings: Hidden
4. Create the Language Code variable.
a. Variable Name: LG b. Description: 2 Letter Country Codec. Security Settings: Hidden
5. Create the Forward Path variable.
a. Variable Name: URL b. Description: Resulting Forward Pathc. Security Settings: Variable
Step 2: Add a Path Rewrite Rule1. Under Property Configuration Settings, Click Add Rule and select a Blank Rule. Give it a name
like “Path Rewrite”.
2. In the Path Rewrite rule you created, click Add Match and add a path match for /??/??/?*
T U T O R I A L 0 3
A K A M A I W O R K B O O K | P A G E 2 1
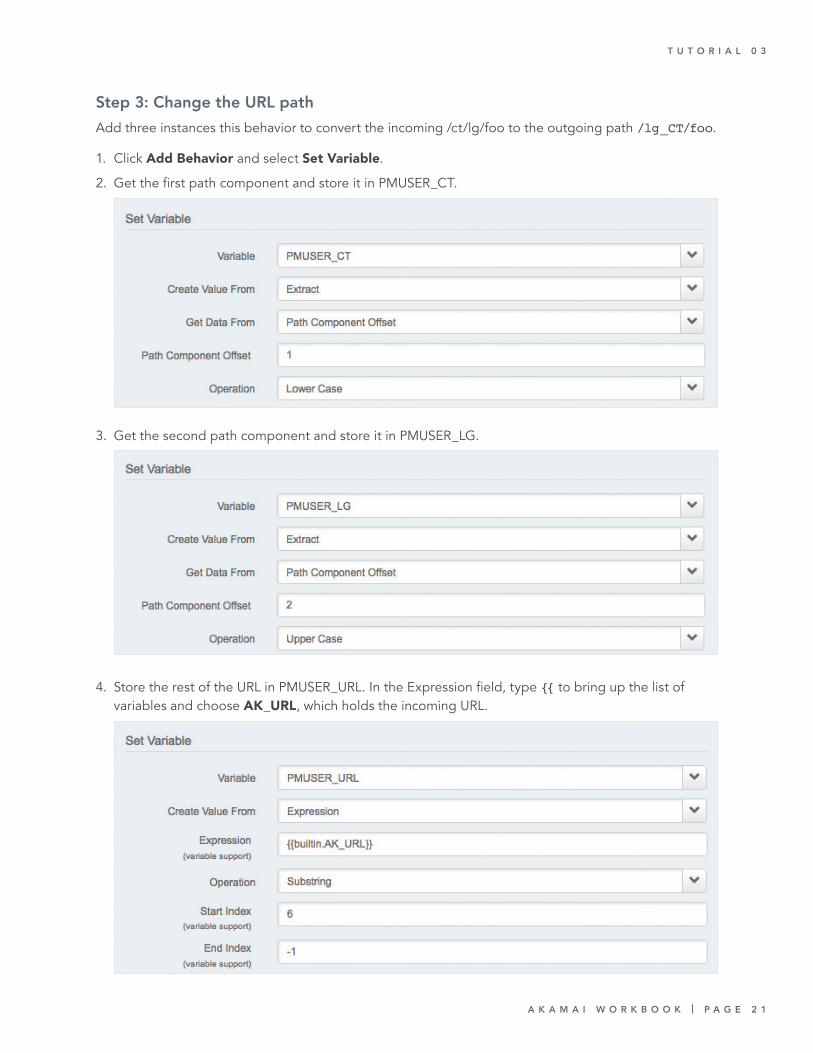
Step 3: Change the URL path Add three instances this behavior to convert the incoming /ct/lg/foo to the outgoing path /lg_CT/foo.
1. Click Add Behavior and select Set Variable.
2. Get the first path component and store it in PMUSER_CT.
3. Get the second path component and store it in PMUSER_LG.
4. Store the rest of the URL in PMUSER_URL. In the Expression field, type {{ to bring up the list of variables and choose AK_URL, which holds the incoming URL.
T U T O R I A L 0 3
P A G E 2 2 | A K A M A I W O R K B O O K
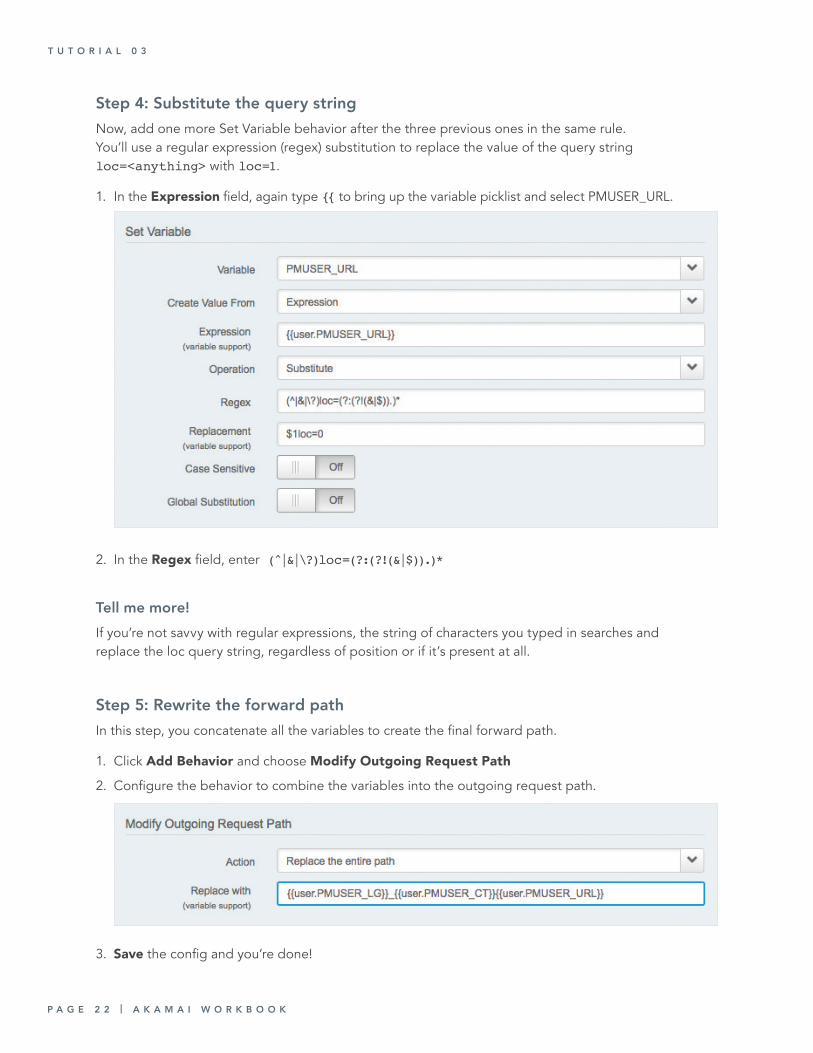
Step 4: Substitute the query string Now, add one more Set Variable behavior after the three previous ones in the same rule. You’ll use a regular expression (regex) substitution to replace the value of the query string loc=<anything> with loc=1.
1. In the Expression field, again type {{ to bring up the variable picklist and select PMUSER_URL.
2. In the Regex field, enter (̂ |&|\?)loc=(?:(?!(&|$)).)*
Tell me more!If you’re not savvy with regular expressions, the string of characters you typed in searches and replace the loc query string, regardless of position or if it’s present at all.
Step 5: Rewrite the forward pathIn this step, you concatenate all the variables to create the final forward path.
1. Click Add Behavior and choose Modify Outgoing Request Path
2. Configure the behavior to combine the variables into the outgoing request path.
3. Save the config and you’re done!
T U T O R I A L 0 3
A K A M A I W O R K B O O K | P A G E 2 3
Scenario 2: Handling erroneous contentOccasionally your origin application generates an erroneous response for certain pages, even though the response code is a 200 OK. This happens very rarely, but you need to avoid caching these responses, which could amplify the error to many users for as long as it’s cached.
Luckily, whenever the problem occurs, the resulting content is much smaller than normal, less than 500 bytes. Bypass the Akamai cache if the origin response content length is less than 500 bytes. This requires the use of advanced metadata, which has had the downside of not being self-serviceable. However, with the recently-launched Custom Behaviors, your Akamai account team can create reusable snippets of advanced metadata for you, so that you can reuse them across all your configs.
Note: For this tutorial, the Edge DevZone team has created a Custom Behavior called Bypass Cache for Response < 500 bytes in the shared DevZone account. If you are not at Edge using the shared account, you will need to ask your account team to enable custom behaviors on your account and add behaviors to work with.
You’ll be using the same config you’ve been editing from Scenario 1.
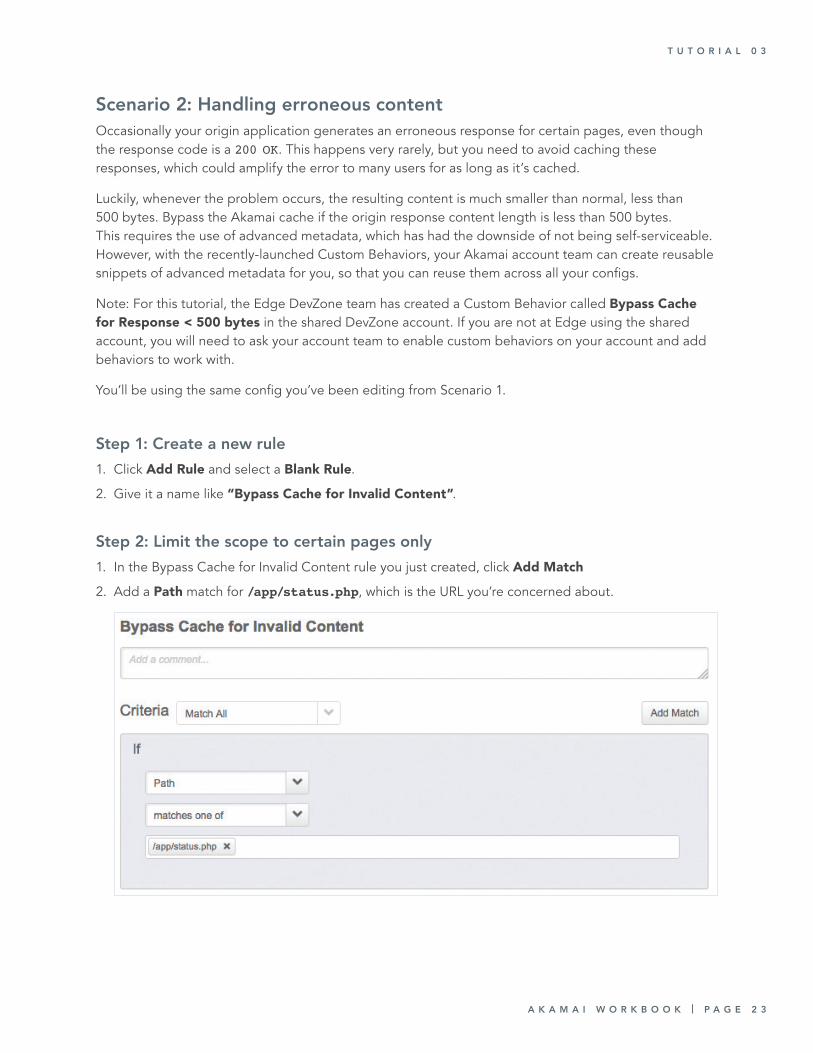
Step 1: Create a new rule1. Click Add Rule and select a Blank Rule.
2. Give it a name like “Bypass Cache for Invalid Content”.
Step 2: Limit the scope to certain pages only1. In the Bypass Cache for Invalid Content rule you just created, click Add Match
2. Add a Path match for /app/status.php, which is the URL you’re concerned about.
T U T O R I A L 0 3
P A G E 2 4 | A K A M A I W O R K B O O K
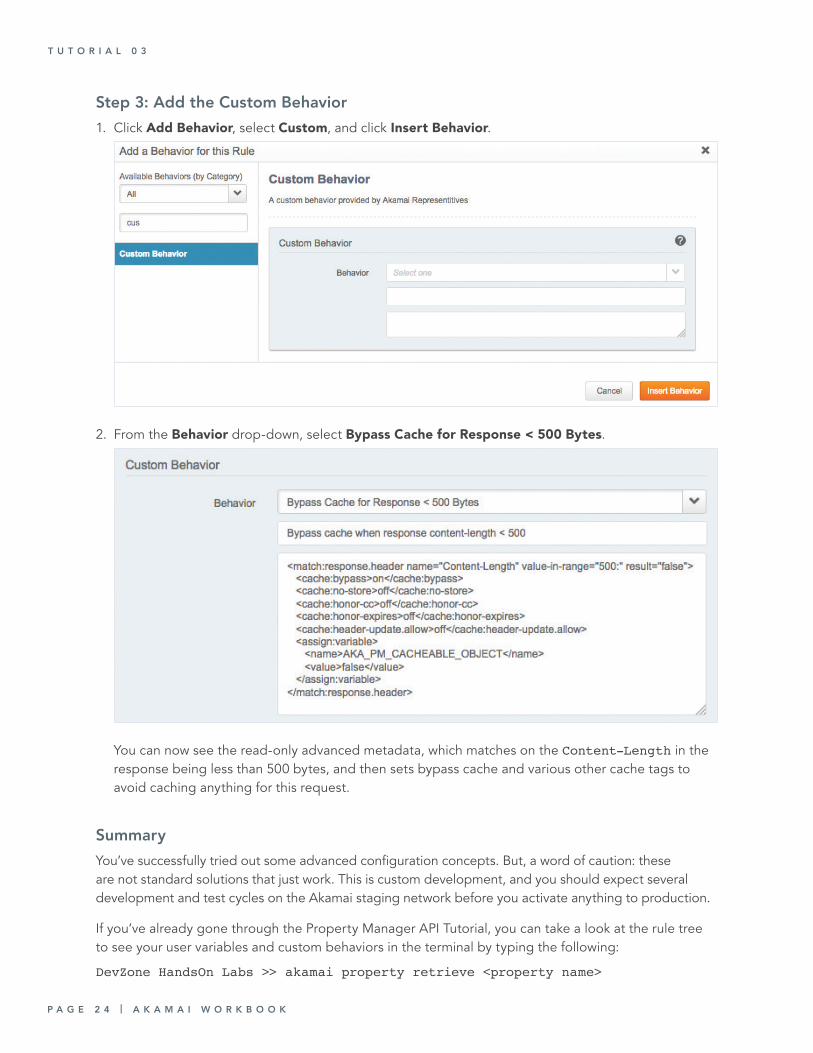
Step 3: Add the Custom Behavior1. Click Add Behavior, select Custom, and click Insert Behavior.
2. From the Behavior drop-down, select Bypass Cache for Response < 500 Bytes.
You can now see the read-only advanced metadata, which matches on the Content-Length in the response being less than 500 bytes, and then sets bypass cache and various other cache tags to avoid caching anything for this request.
SummaryYou’ve successfully tried out some advanced configuration concepts. But, a word of caution: these are not standard solutions that just work. This is custom development, and you should expect several development and test cycles on the Akamai staging network before you activate anything to production.
If you’ve already gone through the Property Manager API Tutorial, you can take a look at the rule tree to see your user variables and custom behaviors in the terminal by typing the following:
DevZone HandsOn Labs >> akamai property retrieve <property name>
T U T O R I A L 0 3
A K A M A I W O R K B O O K | P A G E 2 5
TUTORIAL 04
Analyze Site Speed and Revenue with mPulseLevel: Beginner Duration: 25-35 minutes
This module gets you started using mPulse, Akamai’s Real User Monitoring tool. You may already know how long your pages load using other tools, but mPulse looks at performance differently, because it also collects behavioral metrics like conversion rate, session length, and bounce rate. mPulse tells you not only how fast your site is, but how fast it should be.
mPulse works by installing a small piece of JavaScript on every page of your site. Whenever a visitor looks at a page on your site, mPulse collects over 200 facts about that experience, and sends them back to mPulse’s data warehouse. Most importantly, it does this by measuring what matters most: your real users in real time!
Step 1: Access the demo siteFirst, you need to log in to a running copy of mPulse with sample data.
1. Go to www.soasta.com/mpulse in your browser.
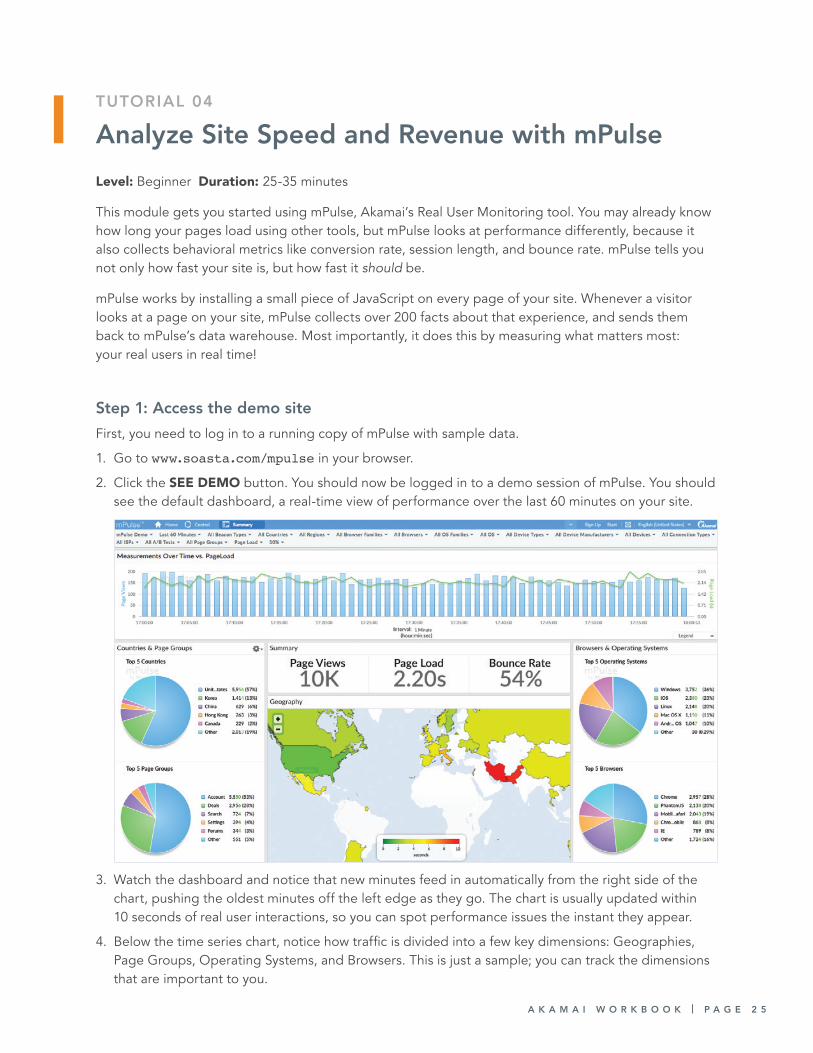
2. Click the SEE DEMO button. You should now be logged in to a demo session of mPulse. You should see the default dashboard, a real-time view of performance over the last 60 minutes on your site.
3. Watch the dashboard and notice that new minutes feed in automatically from the right side of the chart, pushing the oldest minutes off the left edge as they go. The chart is usually updated within 10 seconds of real user interactions, so you can spot performance issues the instant they appear.
4. Below the time series chart, notice how traffic is divided into a few key dimensions: Geographies, Page Groups, Operating Systems, and Browsers. This is just a sample; you can track the dimensions that are important to you.
P A G E 2 6 | A K A M A I W O R K B O O K
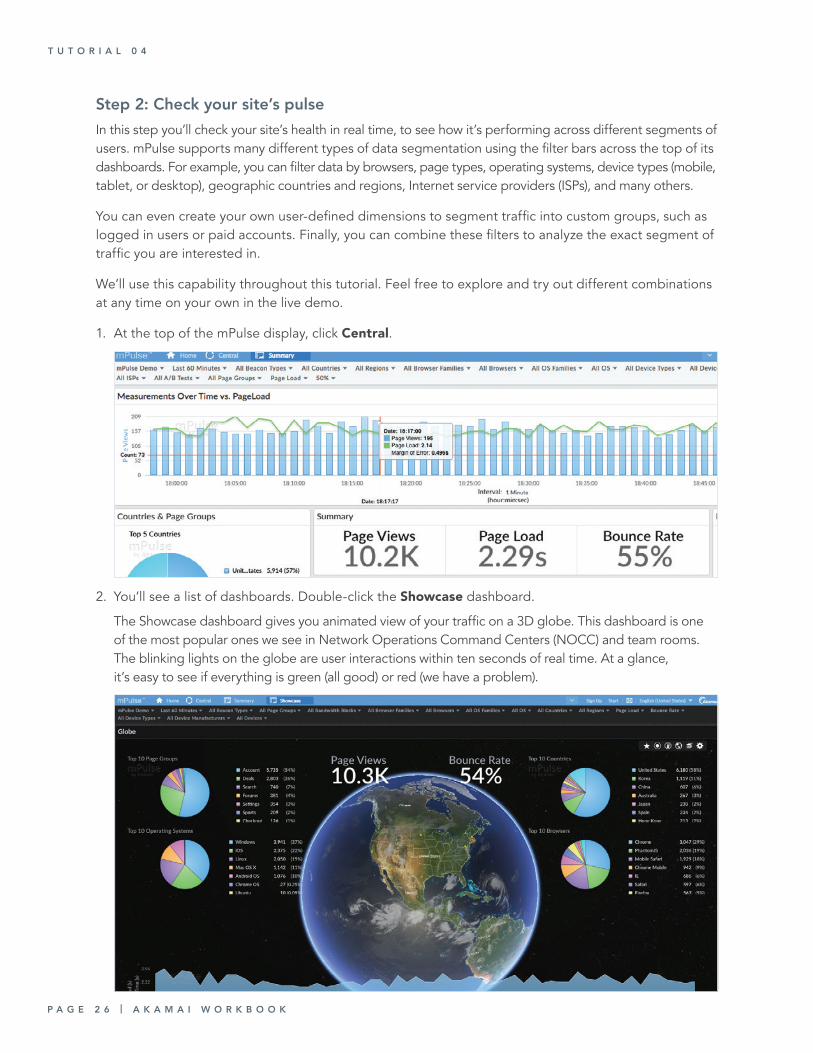
Step 2: Check your site’s pulseIn this step you’ll check your site’s health in real time, to see how it’s performing across different segments of users. mPulse supports many different types of data segmentation using the filter bars across the top of its dashboards. For example, you can filter data by browsers, page types, operating systems, device types (mobile, tablet, or desktop), geographic countries and regions, Internet service providers (ISPs), and many others.
You can even create your own user-defined dimensions to segment traffic into custom groups, such as logged in users or paid accounts. Finally, you can combine these filters to analyze the exact segment of traffic you are interested in.
We’ll use this capability throughout this tutorial. Feel free to explore and try out different combinations at any time on your own in the live demo.
1. At the top of the mPulse display, click Central.
2. You’ll see a list of dashboards. Double-click the Showcase dashboard.
The Showcase dashboard gives you animated view of your traffic on a 3D globe. This dashboard is one of the most popular ones we see in Network Operations Command Centers (NOCC) and team rooms. The blinking lights on the globe are user interactions within ten seconds of real time. At a glance, it’s easy to see if everything is green (all good) or red (we have a problem).
T U T O R I A L 0 4
A K A M A I W O R K B O O K | P A G E 2 7
Tell me more!mPulse has several default dashboards that support different monitoring use cases, all of which can be found in the Central tab. You can also create an unlimited number of your own custom dashboards. When you create a custom dashboard, it shows up in Central as well. Note that this feature has been disabled in the anonymous demo account you’re using for this tutorial.
Another key use case for mPulse is predicting the amount of additional revenue that would result from a given performance improvement, which is what our What-If dashboard does. It can also be used to see what would happen if you experienced a performance degradation.
Step 3: Use What-if to forecast revenue, conversion, and degradation mPulse not only shows you how fast you are, but how fast you need to be in order to meet your users’ expectations. Most site owners guess at this, or adopt a recommendation from analysts or research studies based on users of other web sites. By using mPulse, you can directly measure how your users are impacted by delays on your site, leading to a much more accurate estimate of what your target speed should be.
1. Return to the Central tab by clicking Central in the top bar.
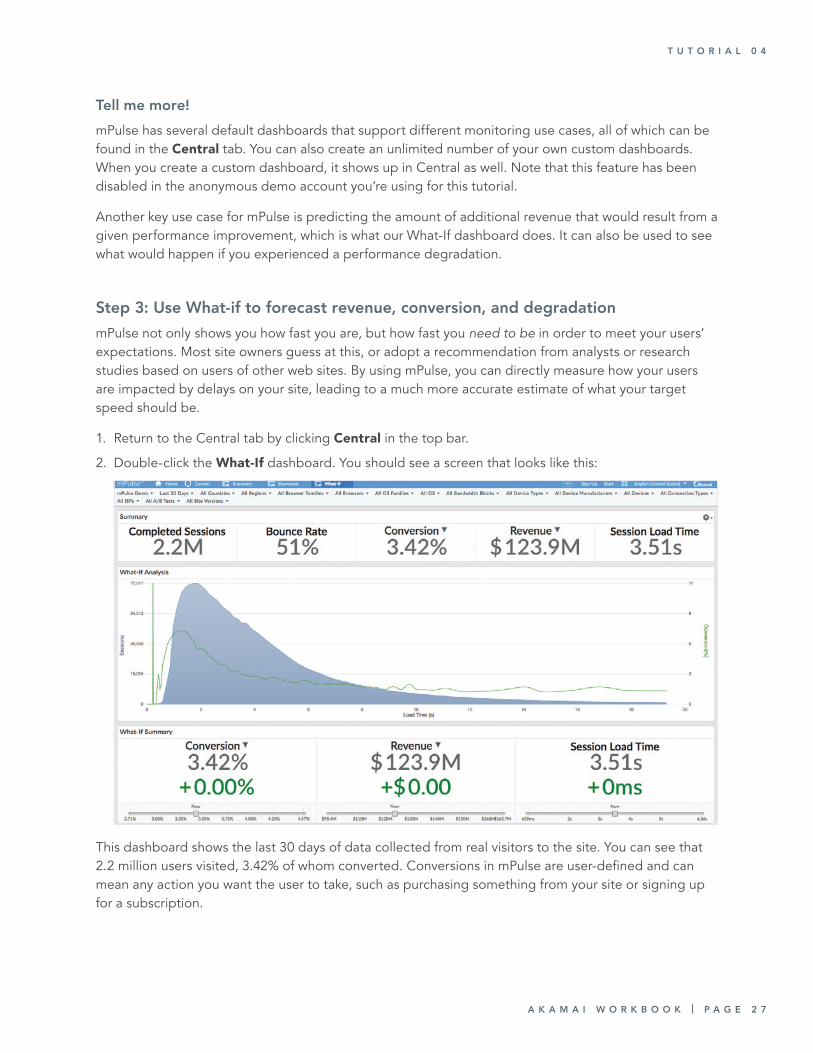
2. Double-click the What-If dashboard. You should see a screen that looks like this:
This dashboard shows the last 30 days of data collected from real visitors to the site. You can see that 2.2 million users visited, 3.42% of whom converted. Conversions in mPulse are user-defined and can mean any action you want the user to take, such as purchasing something from your site or signing up for a subscription.
T U T O R I A L 0 4
P A G E 2 8 | A K A M A I W O R K B O O K
Another user-definable field is Revenue. This could be the value of a subscription or the total value of the user’s shopping cart at the time of checkout. In the example above, we can see that the site’s conversions have generated $123.9M in revenue over the last 30 days. In terms of performance, we see that the median Session Load Time over the last 30 days has been 3.51 seconds.
So 3.51 seconds is how fast we currently are, but how fast do we need to be? Let’s use the model to choose a target speed and find out how much it would be worth to our business. To do this, we will use the sliders at the bottom of the What-If dashboard.
1. Grab the slider under Session Load Time and move it to the left until it is set to 3s. Notice that the histogram in the center of the dashboard displays a shaded overlay, and the values for Conversion and Revenue have changed.
2. Try moving the Conversion slider to a new value. Notice that the Revenue and Session Load Time sliders change correspondingly. This is because the sliders are all locked together based on the data in the model, so it is also possible to approach setting your performance goals by starting with either of the other two sliders.
3. You can also use this model to predict what might happen when your site experiences a negative impact on performance. Move the Session Load Time slider to 4 seconds and note the change. By playing with the settings, you can determine what level of severity to allocate to different amounts of degradation in response time.
Technical and behavioral data are often collected independently by disparate tools, and therefore siloed off from each other, making these insights unavailable. The What-If dashboard models the relationship between speed and revenue. This is only possible because mPulse collects both technical and behavioral metrics together and can correlate these two sets of data.
Tell me more!If your site isn’t conversion-drive, such as a media publisher that uses free content to attract an audience for ad revenue, you may be wondering how mPulse is useful to you. The model also works for use cases where you want to drive more engagement via deeper sessions and more page views. To see an example, click the triangle next to Conversion and change its value to Session Length. You’ll see that the model changes to show the relationship between speed and how many pages visitors click. You can now adjust any of the sliders to see how much more traffic you could generate by changing the speed of your site.
Step 4: Find performance optimizationsNow that you know how fast your site is, and how fast you want it to be, it’s time to identify how you can do to improve its speed. Open the DevOps dashboard and drill down on a few dimensions to find an area where performance optimizations would improve the user experience.
1. Return to the Central tab by clicking Central.
T U T O R I A L 0 4
A K A M A I W O R K B O O K | P A G E 2 9
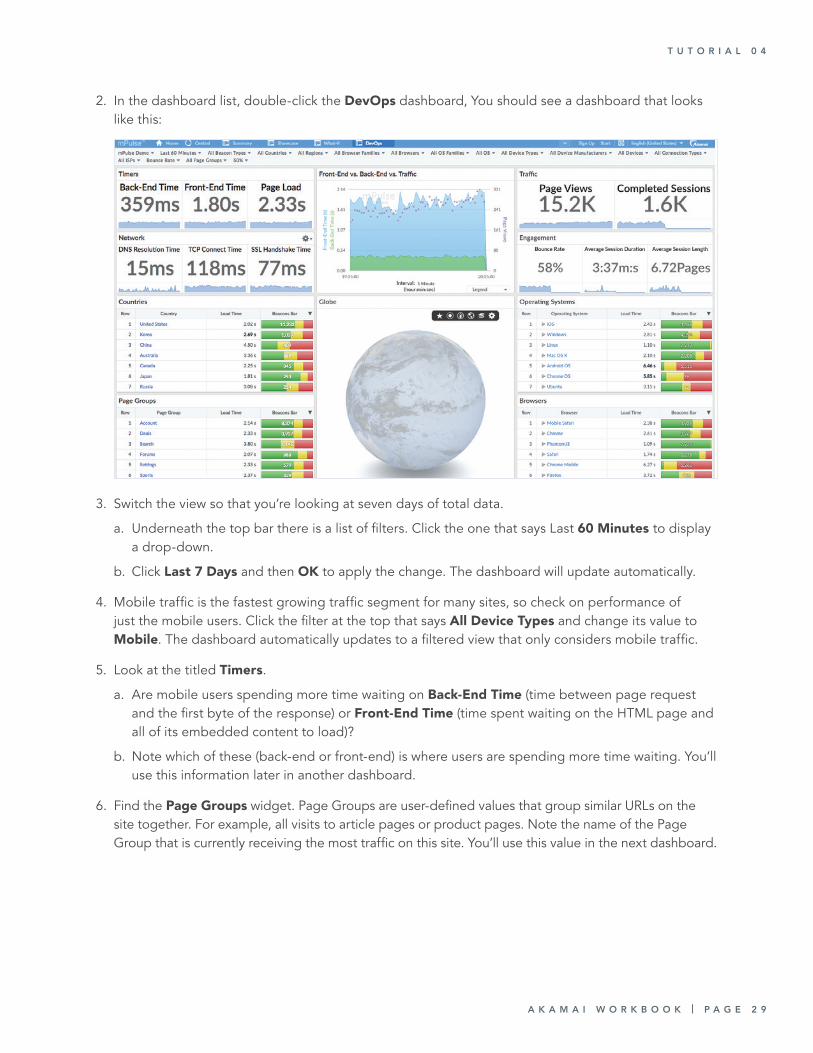
2. In the dashboard list, double-click the DevOps dashboard, You should see a dashboard that looks like this:
3. Switch the view so that you’re looking at seven days of total data.
a. Underneath the top bar there is a list of filters. Click the one that says Last 60 Minutes to display a drop-down.
b. Click Last 7 Days and then OK to apply the change. The dashboard will update automatically.
4. Mobile traffic is the fastest growing traffic segment for many sites, so check on performance of just the mobile users. Click the filter at the top that says All Device Types and change its value to Mobile. The dashboard automatically updates to a filtered view that only considers mobile traffic.
5. Look at the titled Timers.
a. Are mobile users spending more time waiting on Back-End Time (time between page request and the first byte of the response) or Front-End Time (time spent waiting on the HTML page and all of its embedded content to load)?
b. Note which of these (back-end or front-end) is where users are spending more time waiting. You’ll use this information later in another dashboard.
6. Find the Page Groups widget. Page Groups are user-defined values that group similar URLs on the site together. For example, all visits to article pages or product pages. Note the name of the Page Group that is currently receiving the most traffic on this site. You’ll use this value in the next dashboard.
T U T O R I A L 0 4
P A G E 3 0 | A K A M A I W O R K B O O K
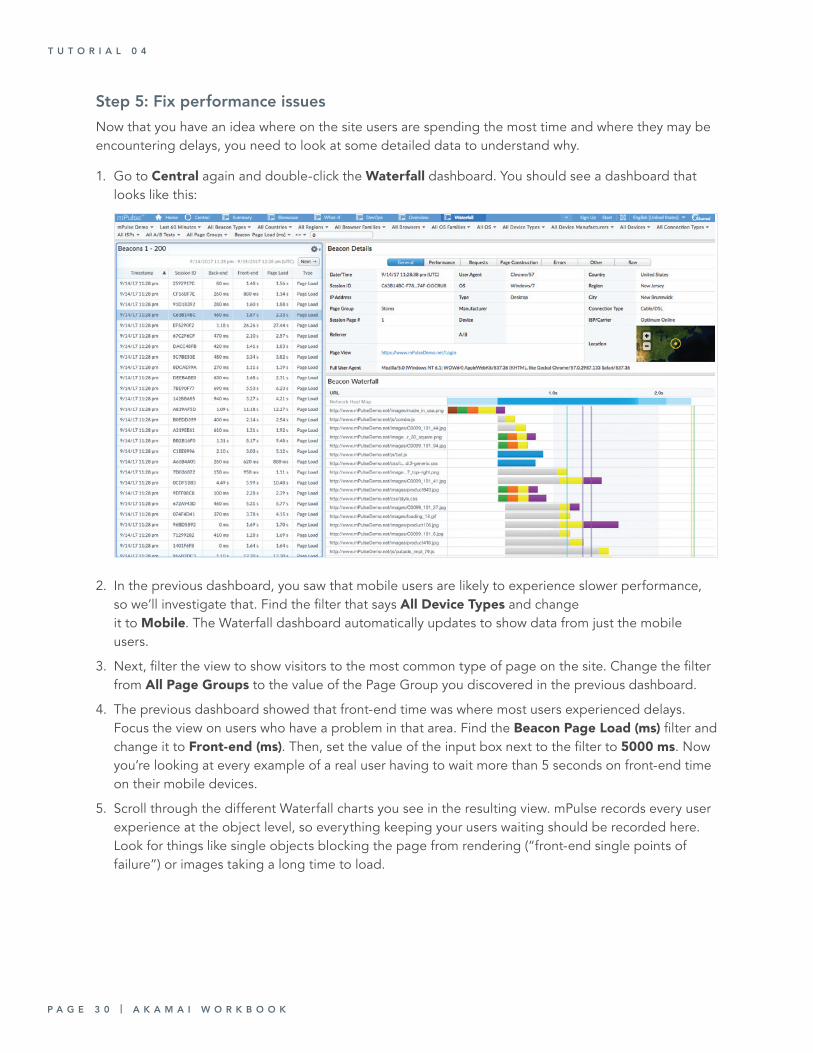
Step 5: Fix performance issuesNow that you have an idea where on the site users are spending the most time and where they may be encountering delays, you need to look at some detailed data to understand why.
1. Go to Central again and double-click the Waterfall dashboard. You should see a dashboard that looks like this:
2. In the previous dashboard, you saw that mobile users are likely to experience slower performance, so we’ll investigate that. Find the filter that says All Device Types and change it to Mobile. The Waterfall dashboard automatically updates to show data from just the mobile users.
3. Next, filter the view to show visitors to the most common type of page on the site. Change the filter from All Page Groups to the value of the Page Group you discovered in the previous dashboard.
4. The previous dashboard showed that front-end time was where most users experienced delays. Focus the view on users who have a problem in that area. Find the Beacon Page Load (ms) filter and change it to Front-end (ms). Then, set the value of the input box next to the filter to 5000 ms. Now you’re looking at every example of a real user having to wait more than 5 seconds on front-end time on their mobile devices.
5. Scroll through the different Waterfall charts you see in the resulting view. mPulse records every user experience at the object level, so everything keeping your users waiting should be recorded here. Look for things like single objects blocking the page from rendering (“front-end single points of failure”) or images taking a long time to load.
T U T O R I A L 0 4
A K A M A I W O R K B O O K | P A G E 3 1
SummaryThis quick tour only scratches the surface of what mPulse can do. To see how mPulse can help you find and fix performance problems interfering with your revenue, try out mPulse on your site to see how it works with your data.
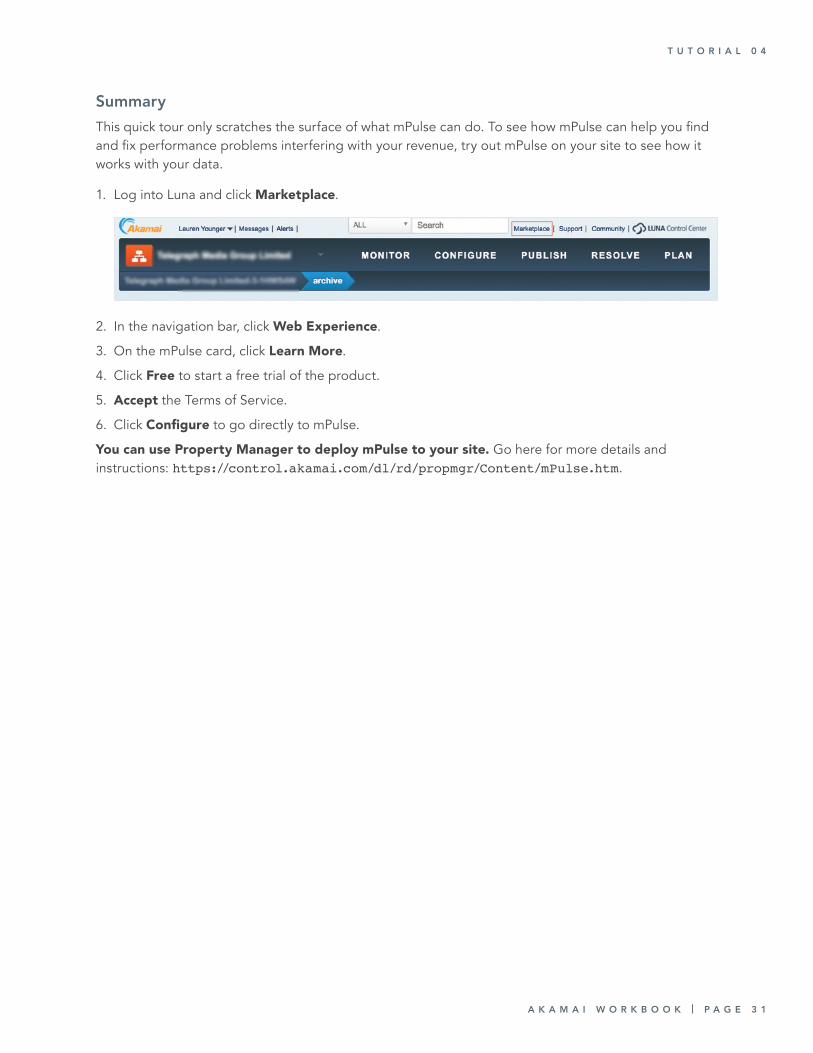
1. Log into Luna and click Marketplace.
2. In the navigation bar, click Web Experience.
3. On the mPulse card, click Learn More.
4. Click Free to start a free trial of the product.
5. Accept the Terms of Service.
6. Click Configure to go directly to mPulse.
You can use Property Manager to deploy mPulse to your site. Go here for more details and instructions: https://control.akamai.com/dl/rd/propmgr/Content/mPulse.htm.
T U T O R I A L 0 4

P A G E 3 2 | A K A M A I W O R K B O O K
TUTORIAL 05
Authentication and Provisioning using LunaLevel: Beginner Duration: 15-25 minutes
In this tutorial, you learn how to set up authentication and provisioning in Luna, and retrieve the authentication tokens needed to make OPEN API calls. The authentication tokens are required for other API-based tutorials that follow.
The high-level steps for provisioning credentials goes like this:
1. Add a new credential using Luna.2. Grant API access.3. Import the credentials into Docker. 4. Verify your credentials.
You’re going to do these three steps three times; once for each set of credentials you’ll need for the three API tutorials that follow.
Step 1: Add a new credential using LunaIn this step, you create a new API credential that you’ll use for the tutorials in this workbook. The API credential also determines the group access, and which specific APIs it can access.
1. In your browser, log in to Luna at https://control.akamai.com.
• In the DevZone at Edge: log in using the username and password for your workstation.
• On your own system: log in using your normal Luna login. This account must have API provisioning permissions. If it does not, ask your local Luna administrator to add this permission.
2. In the menu at the top, click the Configuration tab and choose Manage APIs.
3. On the Manage API Access screen, click New API Client for Me.
4. On the Create New API screen accept the default Group Access and click Next.
Tell me more!You’re right in the middle of a wizard, but it’s a good time to reflect on credentials and groups. For the purposes of these tutorials, it’s OK to use the default group access, which is the same as the user creating the credentials. But in reality, it’s pretty rare that everyone has the same access.
A K A M A I W O R K B O O K | P A G E 3 3
Step 2: Grant API access You’re now ready to set up credential grants, which is a fancy way of saying “which API can this credential access?” We’re assuming you want to do all the tutorials in this workbook, so the instructions here go through setting up each of them, one at a time.
The information you need for each credential set is as follows:
Tutorial Grant Config section
Diagnostic tools Diagnostic Tools default
Purge API CCU (all CPCodes) ccu
Property Manager API Property Manager papi
1. In the Client Name field, enter <tutorial>:<your name>. For example, Diagnostic Tools: Kirsten Hunter
2. Now set the grants for the API you want credentials for Diagnostic Tools. Scroll through the list of grants until you find Diagnostic Tools and set the permissions to READ/WRITE.
After you complete all of these instructions for Diagnostic Tools, you’ll do the same set of instructions again, for both Property Manager and Purge API. Don’t set these now, but for later reference, you’ll be using:
• Property Manager: set the permissions for Property Manager to READ/WRITE.
• Purge: Select the OPEN CCU / Fast Purge APIs radio button, select READ/WRITE as the access and choose All CPCodes.
T U T O R I A L 0 5
P A G E 3 4 | A K A M A I W O R K B O O K
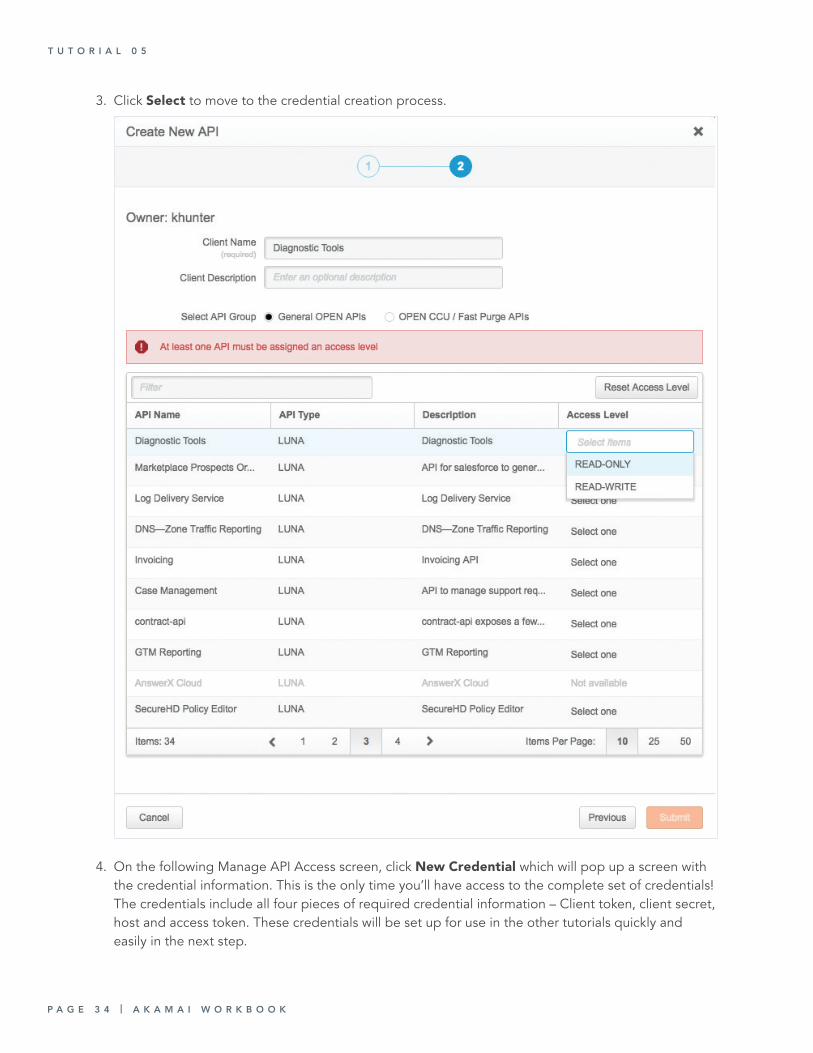
3. Click Select to move to the credential creation process.
4. On the following Manage API Access screen, click New Credential which will pop up a screen with the credential information. This is the only time you’ll have access to the complete set of credentials! The credentials include all four pieces of required credential information – Client token, client secret, host and access token. These credentials will be set up for use in the other tutorials quickly and easily in the next step.
T U T O R I A L 0 5
A K A M A I W O R K B O O K | P A G E 3 5
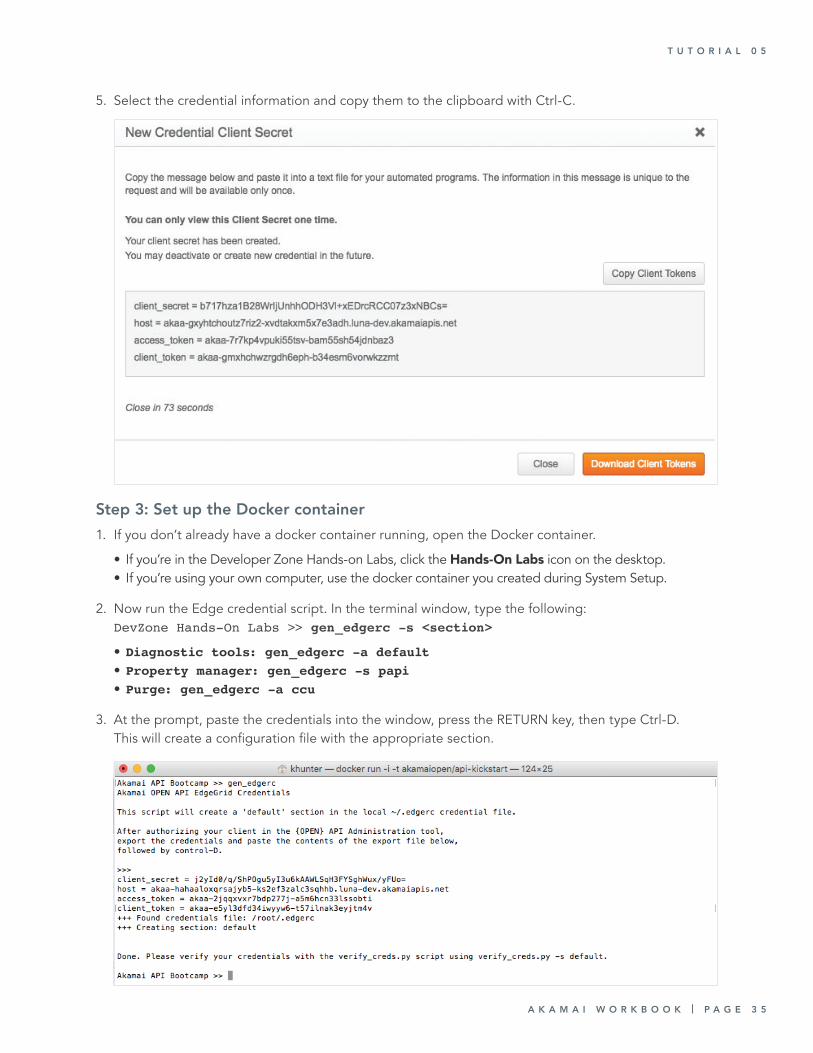
5. Select the credential information and copy them to the clipboard with Ctrl-C.
Step 3: Set up the Docker container1. If you don’t already have a docker container running, open the Docker container.
• If you’re in the Developer Zone Hands-on Labs, click the Hands-On Labs icon on the desktop. • If you’re using your own computer, use the docker container you created during System Setup.
2. Now run the Edge credential script. In the terminal window, type the following: DevZone Hands-On Labs >> gen_edgerc -s <section>
• Diagnostic tools: gen_edgerc -a default• Property manager: gen_edgerc -s papi• Purge: gen_edgerc -a ccu
3. At the prompt, paste the credentials into the window, press the RETURN key, then type Ctrl-D. This will create a configuration file with the appropriate section.
T U T O R I A L 0 5
P A G E 3 6 | A K A M A I W O R K B O O K
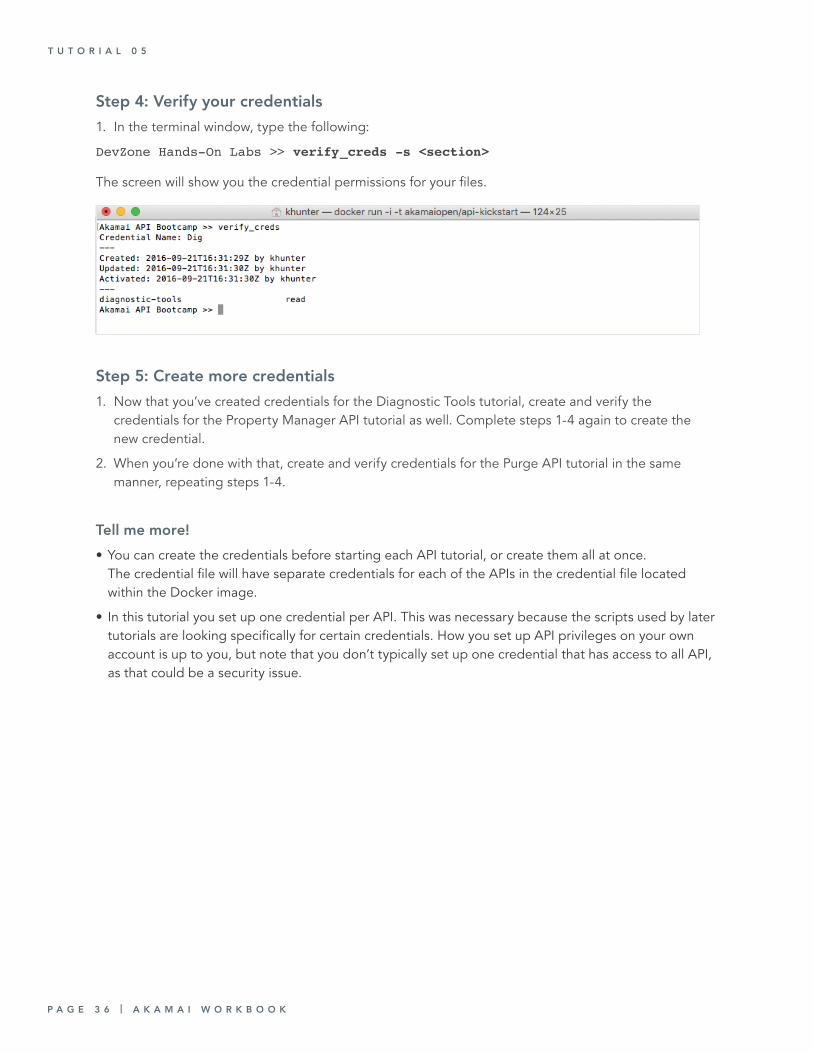
Step 4: Verify your credentials 1. In the terminal window, type the following:
DevZone Hands-On Labs >> verify_creds -s <section>
The screen will show you the credential permissions for your files.
Step 5: Create more credentials1. Now that you’ve created credentials for the Diagnostic Tools tutorial, create and verify the
credentials for the Property Manager API tutorial as well. Complete steps 1-4 again to create the new credential.
2. When you’re done with that, create and verify credentials for the Purge API tutorial in the same manner, repeating steps 1-4.
Tell me more! • You can create the credentials before starting each API tutorial, or create them all at once.
The credential file will have separate credentials for each of the APIs in the credential file located within the Docker image.
• In this tutorial you set up one credential per API. This was necessary because the scripts used by later tutorials are looking specifically for certain credentials. How you set up API privileges on your own account is up to you, but note that you don’t typically set up one credential that has access to all API, as that could be a security issue.
T U T O R I A L 0 5

A K A M A I W O R K B O O K | P A G E 3 7
TUTORIAL 06
Diagnostic ToolsLevel: Intermediate Duration: 25-35 minutes
In this tutorial, you’ll learn how to use the diagnostic tools API using both our sample code, and using a command line interface with HTTPie. Using both methods, you’ll retrieve a list of locations from the API and run a dig command from one of the locations. The dig command is a network utility used for inspecting traffic from DNS servers, but in this case we’re simply using it as an example of API interaction.
Prerequisites• You’ll use the Docker container you configured in Authentication and Provisioning.
Step 1: Use the diagnostic-tools.py codeThe first task will be to run the diagnostic-tools.py sample code. This code makes two calls: one call to the locations endpoint to choose a location, and then a dig command from that location.
1. You should already have a terminal window open. If not, open one. Then, run the following command:
python diagnostic-tools.py
P A G E 3 8 | A K A M A I W O R K B O O K
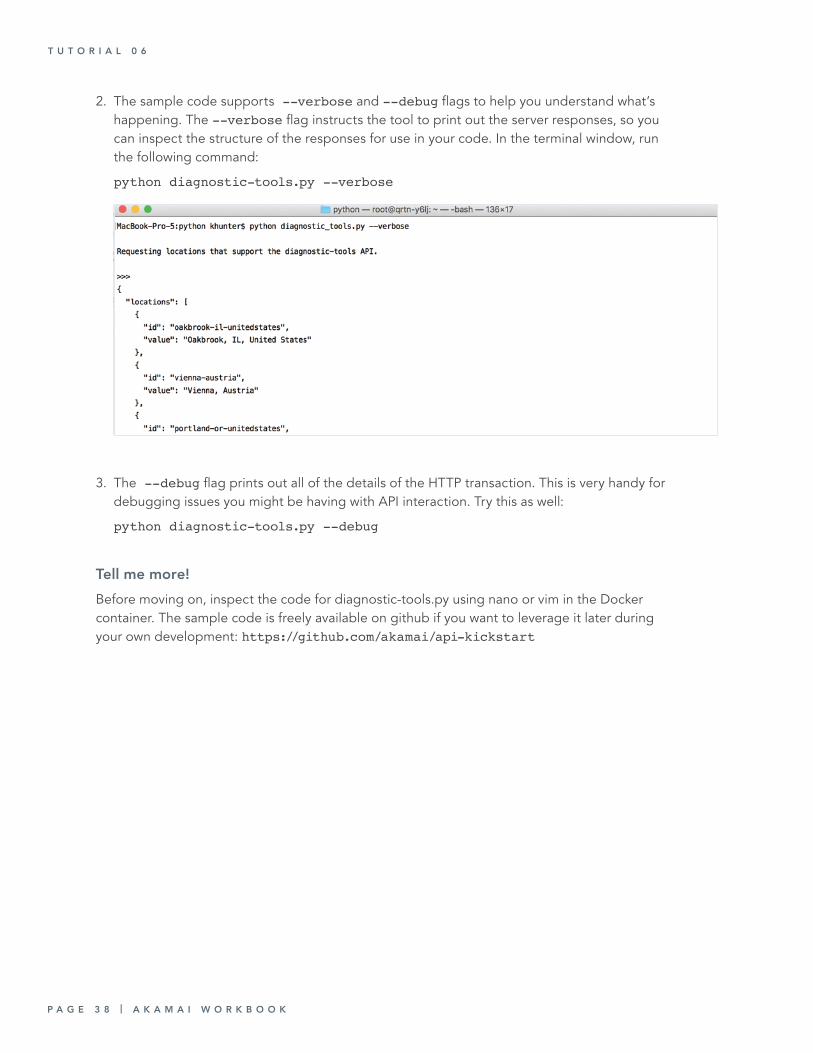
2. The sample code supports --verbose and --debug flags to help you understand what’s happening. The --verbose flag instructs the tool to print out the server responses, so you can inspect the structure of the responses for use in your code. In the terminal window, run the following command:
python diagnostic-tools.py --verbose
3. The --debug flag prints out all of the details of the HTTP transaction. This is very handy for debugging issues you might be having with API interaction. Try this as well:
python diagnostic-tools.py --debug
Tell me more!Before moving on, inspect the code for diagnostic-tools.py using nano or vim in the Docker container. The sample code is freely available on github if you want to leverage it later during your own development: https://github.com/akamai/api-kickstart
T U T O R I A L 0 6

A K A M A I W O R K B O O K | P A G E 3 9
Step 2: Access the APIs from the command lineNext, we’ll make calls directly to the API using HTTPie, a command line tool for accessing HTTP APIs. This tool has been installed and configured in the Docker environment.
1. In the terminal window, run the following command:
DevZone Hands-On Labs >> http -a default: :/diagnostic-tools/v2/ ghost-locations/available
This command pulls a list of the edge locations you can use for the upcoming dig call. Choose one of them (for instance, “vienna-austria”) for use in the next command.
2. In the terminal window, run the following command:
DevZone Hands-On Labs >> http -a default: :/diagnostic-tools/v2/ ghost-locations/vienna-austria/dig-info hostName==developer.akamai.com
This command runs the dig command, performing a lookup on the specified hostname from the edge location you specified. Try a few other locations from the first call, and observe how the output differs.
T U T O R I A L 0 6
P A G E 4 0 | A K A M A I W O R K B O O K
Advanced: Additional CommandsIf you’re interested in trying additional endpoints, select one of the endpoints from the reference tab and try it on the command line. In the following instructions, we’ll use Get a Translated URL, which gives high-level information about an Akamaized URL.
1. Double-click the Diagnostic Tools Documentation icon on the desktop.
2. Select Get a Translated URL. The basic format of the request is: http –a <section>: :<endpoint> <options>
• <section>: This is the authorization section for the credentials file. The default section from Authentication and Provisioning is default, so you’ll replace <section> with default.
• <endpoint>: This is the endpoint you wish to run from the list on the documentation page. So, for Get a Translated URL, the endpoint would be /diagnostic-tools/v2/translated-url
• <options>: Options are sent using the format variable==value.
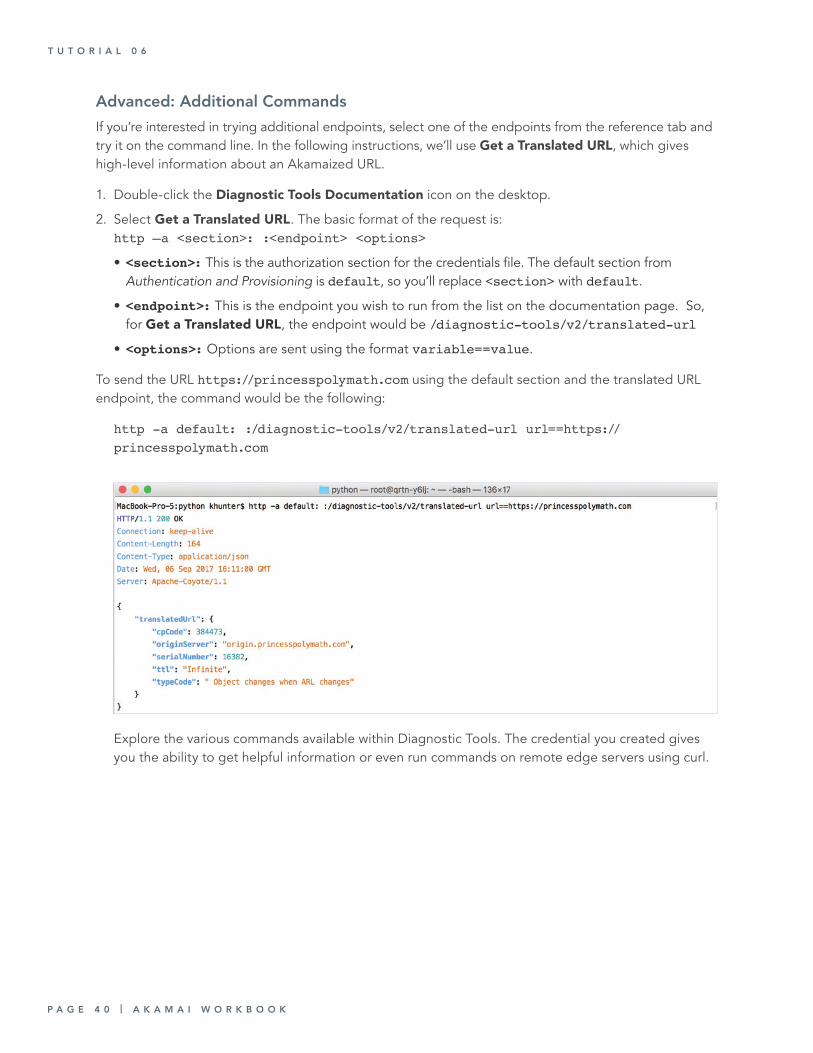
To send the URL https://princesspolymath.com using the default section and the translated URL endpoint, the command would be the following:
http -a default: :/diagnostic-tools/v2/translated-url url==https://princesspolymath.com
Explore the various commands available within Diagnostic Tools. The credential you created gives you the ability to get helpful information or even run commands on remote edge servers using curl.
T U T O R I A L 0 6

A K A M A I W O R K B O O K | P A G E 4 1
TUTORIAL 07
Use the Purge APILevel: Beginner Duration: 15-20 minutes
In this tutorial you’ll learn three different ways to purge a file using the Purge API:
• Using our sample code – a great way to jump-start your own development• From the command line using HTTPie – quick access to the API without writing code• Using the Akamai CLI tool – a wrapper for purge functionality to simplify the interaction
PrerequisitesAuthentication and Provisioning. You will work in the docker container you started up during the Authentication and Provisioning tutorial, using the ccu credential setting you created.
Note: If you are running this from your own account, you will need to select a file on your own property for each of the steps.
Step 1: Use the ccu-v3.py codeThe most common way to work with an API is through code developed to perform the interaction. First, we’ll run the ccu-v3.py sample code, which you can use as-is or as a starting point for your own purge utility. This code will make one call to the API to purge a file from the edge.
1. Open a terminal window and run the following command:
python ccu-v3.py --verbose
2. Verify that your response shows that the system has successfully received the purge request and completed the purge in less than five seconds. The response includes various tracking information, but the important pieces are the estimatedSeconds and httpStatus, which should be 201 (created).
P A G E 4 2 | A K A M A I W O R K B O O K
Tell me more!• The ccu-v3.py command uses the Purge endpoint of /ccu/v3/invalidate/url to invalidate the
specified resource or resources.
• The --verbose flag instructs the script to output details about the call and response body.
• The sample code for ccu-v3.py is freely available on github if you want to leverage it later during your own development: https://github.com/akamai/api-kickstart. Use command-line editing tools like nano or vim to inspect the code for ccu-v3.py in the Docker container.
Step 2: Access the CCU V3 API from the command lineNext, you make calls directly to the API using HTTPie, a command line tool for accessing HTTP APIs. This tool has been installed and configured in the Docker environment.
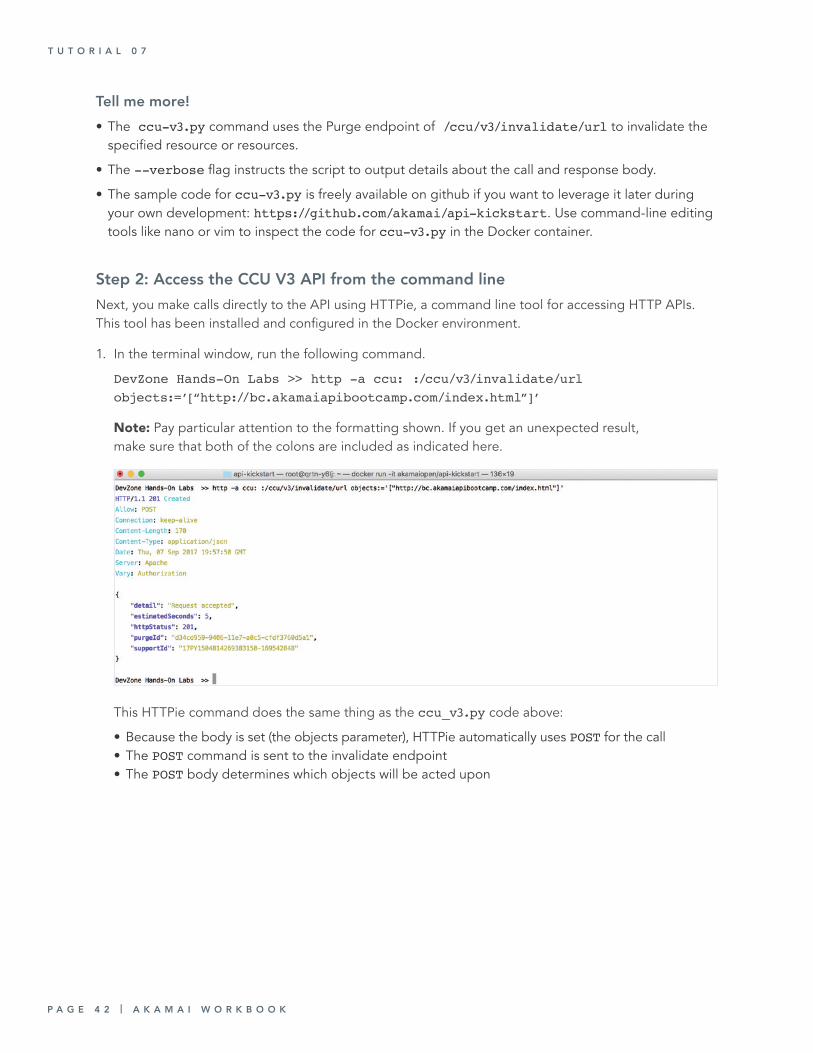
1. In the terminal window, run the following command.
DevZone Hands-On Labs >> http -a ccu: :/ccu/v3/invalidate/url objects:=’[“http://bc.akamaiapibootcamp.com/index.html”]’
Note: Pay particular attention to the formatting shown. If you get an unexpected result, make sure that both of the colons are included as indicated here.
This HTTPie command does the same thing as the ccu_v3.py code above:
• Because the body is set (the objects parameter), HTTPie automatically uses POST for the call• The POST command is sent to the invalidate endpoint• The POST body determines which objects will be acted upon
T U T O R I A L 0 7
A K A M A I W O R K B O O K | P A G E 4 3
Step 3: Access the CCU V3 API using Akamai CLIFinally, we purge an object using the new Akamai CLI utility. This utility provides easy access to different Akamai platform functions, including purge. The Akamai CLI is already installed in the Docker image, so you can use it with no setup.
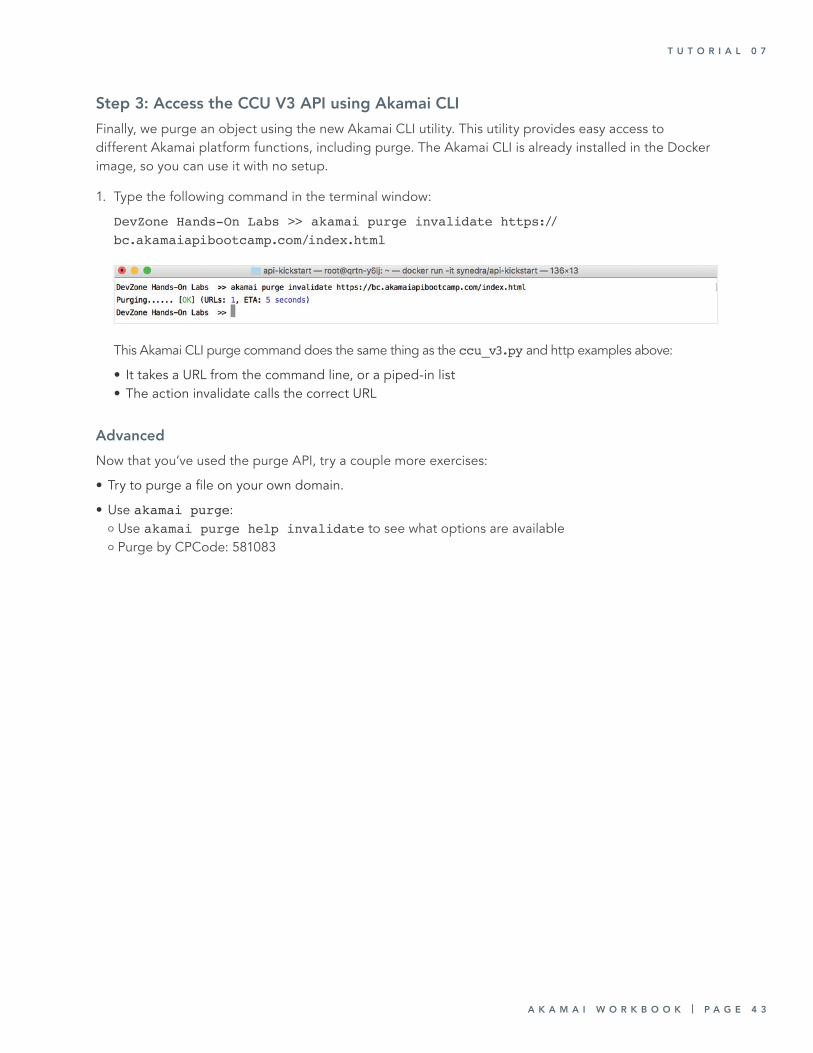
1. Type the following command in the terminal window:
DevZone Hands-On Labs >> akamai purge invalidate https://bc.akamaiapibootcamp.com/index.html
This Akamai CLI purge command does the same thing as the ccu_v3.py and http examples above:
• It takes a URL from the command line, or a piped-in list• The action invalidate calls the correct URL
AdvancedNow that you’ve used the purge API, try a couple more exercises:
• Try to purge a file on your own domain.
• Use akamai purge:o Use akamai purge help invalidate to see what options are availableo Purge by CPCode: 581083
T U T O R I A L 0 7
P A G E 4 4 | A K A M A I W O R K B O O K
TUTORIAL 08
Property Manager API TutorialLevel: Intermediate Duration: 25-35 minutes
In this tutorial you will work with the Property Manager API to create, configure and delete a web property from the Akamai Intelligent Platform.
Prerequisites• You’ll use the Docker container you configured in System Setup.
• All steps in this tutorial will use the papi credential setting you configured in Authentication and Provisioning.
Step 1: Choose a property nameBefore getting started, pick a property name that’s unique to you. The easiest name will be something like this: <firstinitiallastname>.example.com. So, Kirsten Hunter would become: khunter.example.com.
You’ll use this property name throughout the tutorial, so be sure to remember it. Anywhere you see <propertyname> in the tutorials, replace it with your unique name.
Step 2: Create a new propertyFor many of the tutorial steps you’ll use the new Akamai CLI. This tool makes it easy to do common tasks like property creation. In this step you’ll create a new property on the command line.
Note: If you are doing this tutorial on your own account, you’ll need to clone a property from within your account instead of jenkins.base.property.
Type the following command in the terminal window:
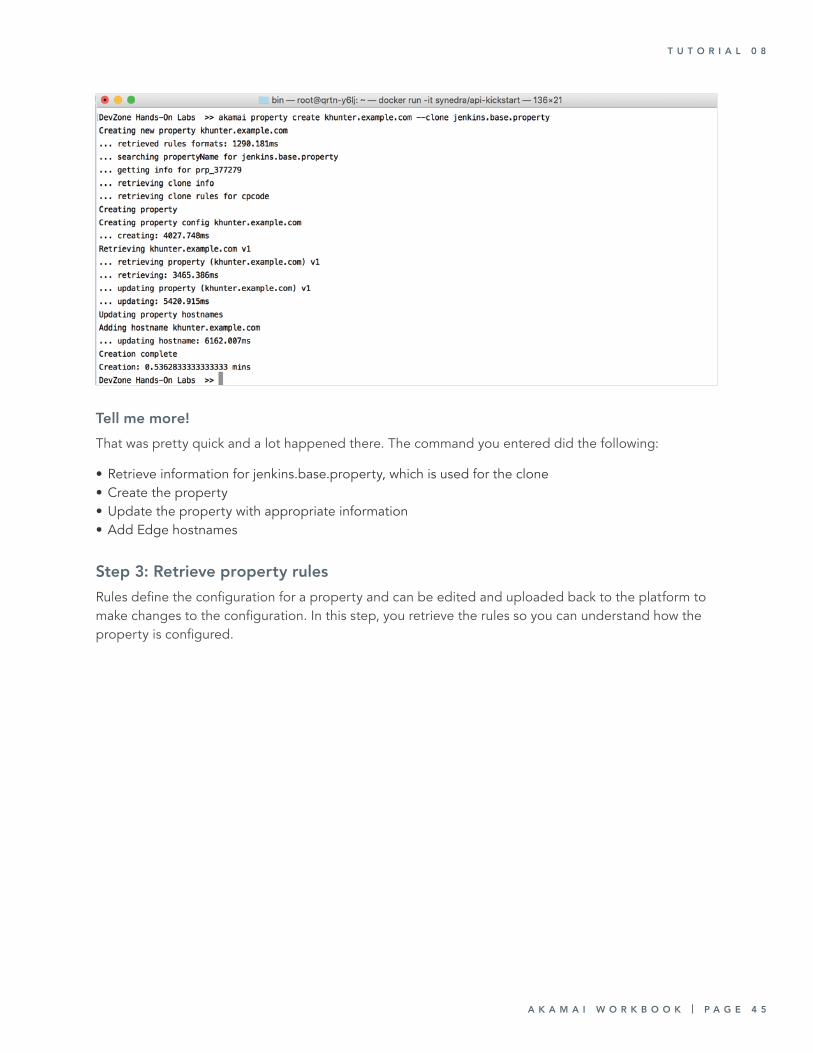
DevZone Hands-On Labs >> akamai property create <propertyname>.example.com --clone jenkins.base.property
A K A M A I W O R K B O O K | P A G E 4 5
Tell me more!That was pretty quick and a lot happened there. The command you entered did the following:
• Retrieve information for jenkins.base.property, which is used for the clone• Create the property• Update the property with appropriate information• Add Edge hostnames
Step 3: Retrieve property rulesRules define the configuration for a property and can be edited and uploaded back to the platform to make changes to the configuration. In this step, you retrieve the rules so you can understand how the property is configured.
T U T O R I A L 0 8
P A G E 4 6 | A K A M A I W O R K B O O K
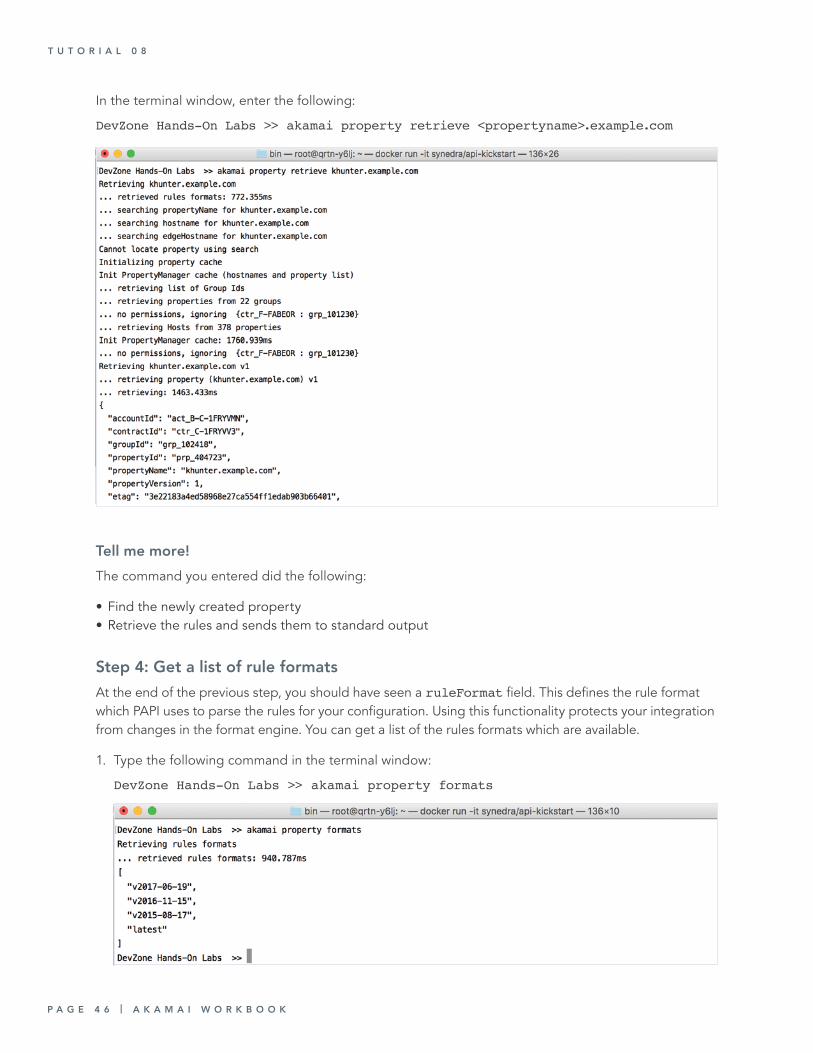
In the terminal window, enter the following:
DevZone Hands-On Labs >> akamai property retrieve <propertyname>.example.com
Tell me more!The command you entered did the following:
• Find the newly created property• Retrieve the rules and sends them to standard output
Step 4: Get a list of rule formatsAt the end of the previous step, you should have seen a ruleFormat field. This defines the rule format which PAPI uses to parse the rules for your configuration. Using this functionality protects your integration from changes in the format engine. You can get a list of the rules formats which are available.
1. Type the following command in the terminal window:
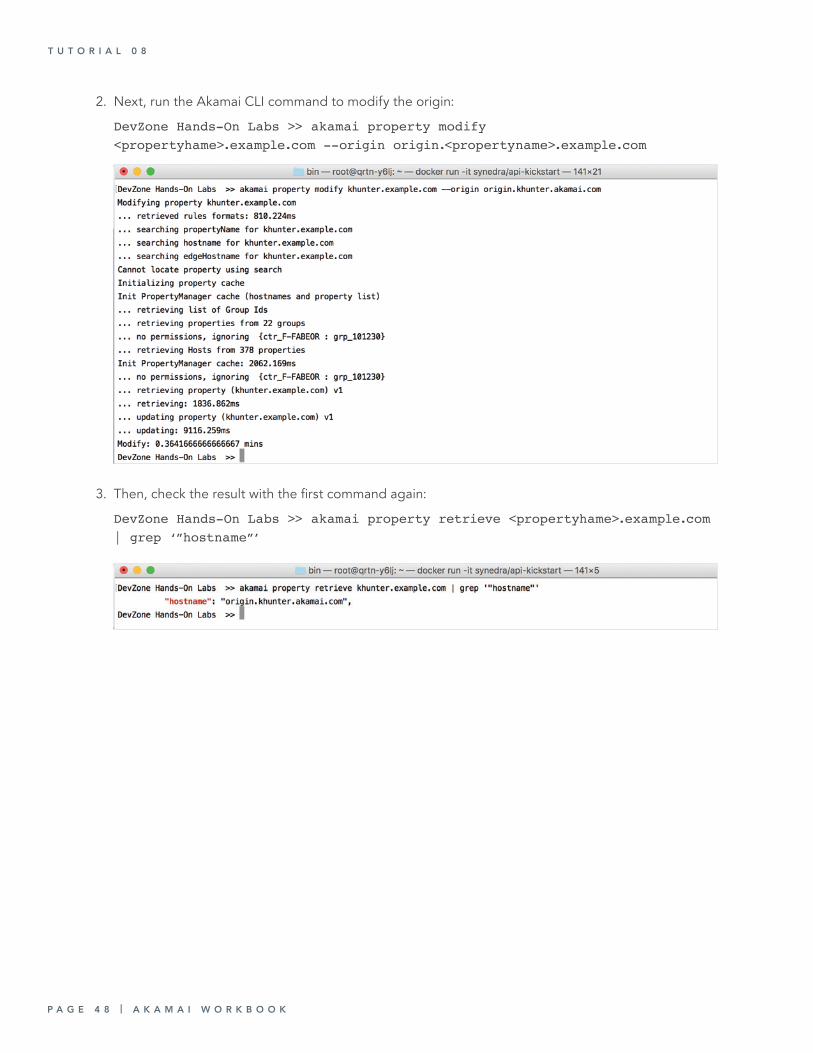
DevZone Hands-On Labs >> akamai property formats
T U T O R I A L 0 8

A K A M A I W O R K B O O K | P A G E 4 7
Step 5: Use searchThe Akamai CLI leverages the new Property Manager API search endpoint, but you can use it directly as well. You’ll use the HTTPie command line tool for this task. The HTTPie installation in the Docker image has been extended to handle authentication for the OPEN APIs, so it is a simple command line call.
Type the following command in the terminal window:
DevZone Hands-On Labs >> http -a papi: :/papi/v1/search/find-by-value propertyName=<propertyname>.example.com
Step 6: Modify the originThe Akamai CLI supports several different types of modifications to a property. In this tutorial, we’ll change the origin hostname for a property.
1. Retrieve the current origin hostname to see what it is:
DevZone Hands-On Labs >> akamai property retrieve <propertyhame>.example.com | grep ‘”hostname”’
T U T O R I A L 0 8
P A G E 4 8 | A K A M A I W O R K B O O K
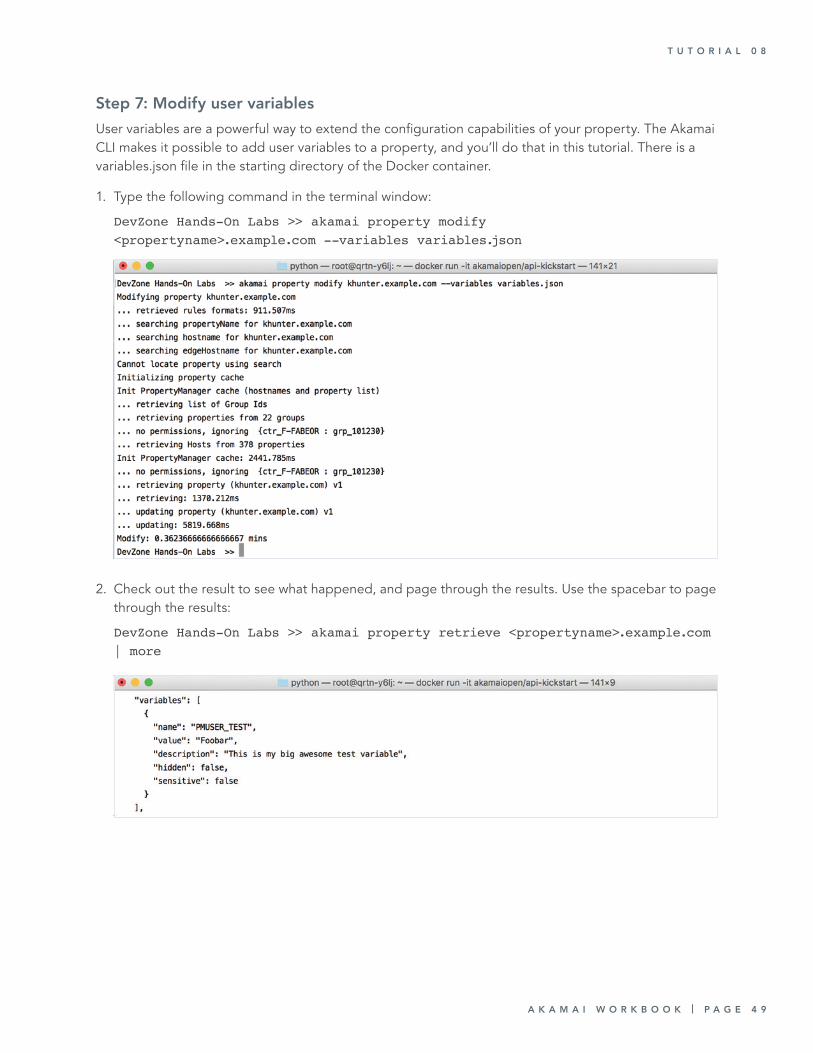
2. Next, run the Akamai CLI command to modify the origin:
DevZone Hands-On Labs >> akamai property modify <propertyhame>.example.com --origin origin.<propertyname>.example.com
3. Then, check the result with the first command again:
DevZone Hands-On Labs >> akamai property retrieve <propertyhame>.example.com | grep ‘”hostname”’
T U T O R I A L 0 8
A K A M A I W O R K B O O K | P A G E 4 9
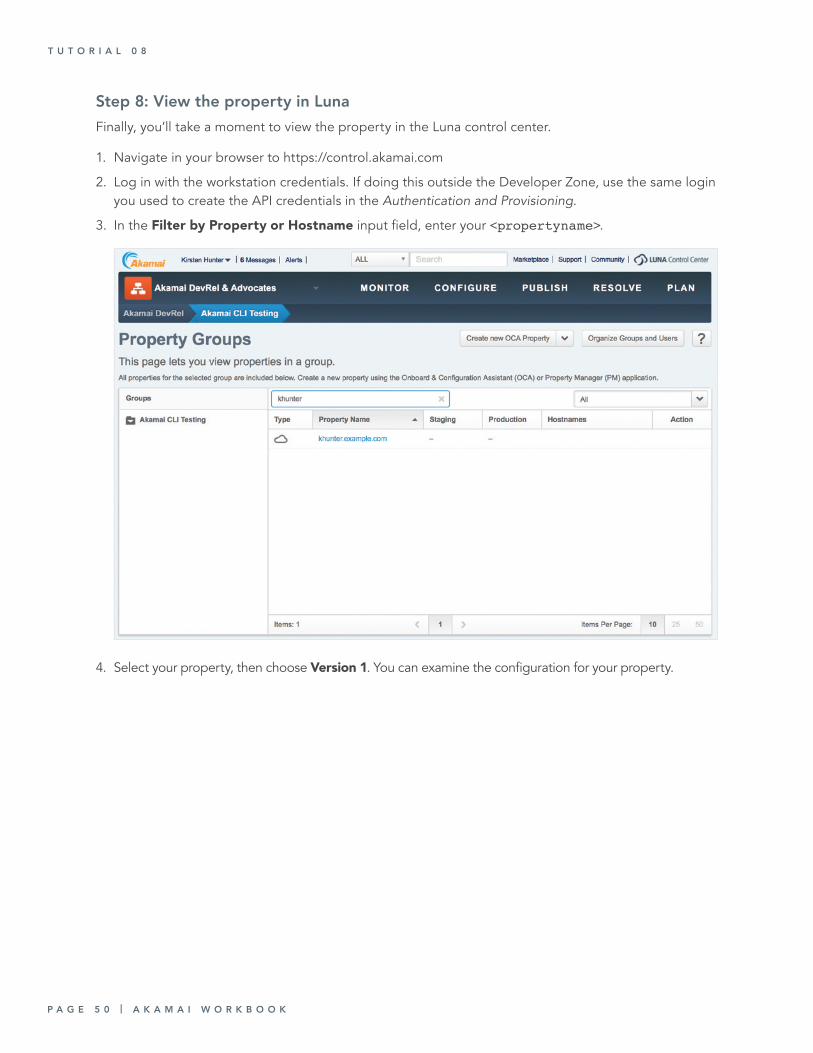
Step 7: Modify user variablesUser variables are a powerful way to extend the configuration capabilities of your property. The Akamai CLI makes it possible to add user variables to a property, and you’ll do that in this tutorial. There is a variables.json file in the starting directory of the Docker container.
1. Type the following command in the terminal window:
DevZone Hands-On Labs >> akamai property modify <propertyname>.example.com --variables variables.json
2. Check out the result to see what happened, and page through the results. Use the spacebar to page through the results:
DevZone Hands-On Labs >> akamai property retrieve <propertyname>.example.com | more
T U T O R I A L 0 8
P A G E 5 0 | A K A M A I W O R K B O O K
Step 8: View the property in LunaFinally, you’ll take a moment to view the property in the Luna control center.
1. Navigate in your browser to https://control.akamai.com
2. Log in with the workstation credentials. If doing this outside the Developer Zone, use the same login you used to create the API credentials in the Authentication and Provisioning.
3. In the Filter by Property or Hostname input field, enter your <propertyname>.
4. Select your property, then choose Version 1. You can examine the configuration for your property.
T U T O R I A L 0 8
A K A M A I W O R K B O O K | P A G E 5 1
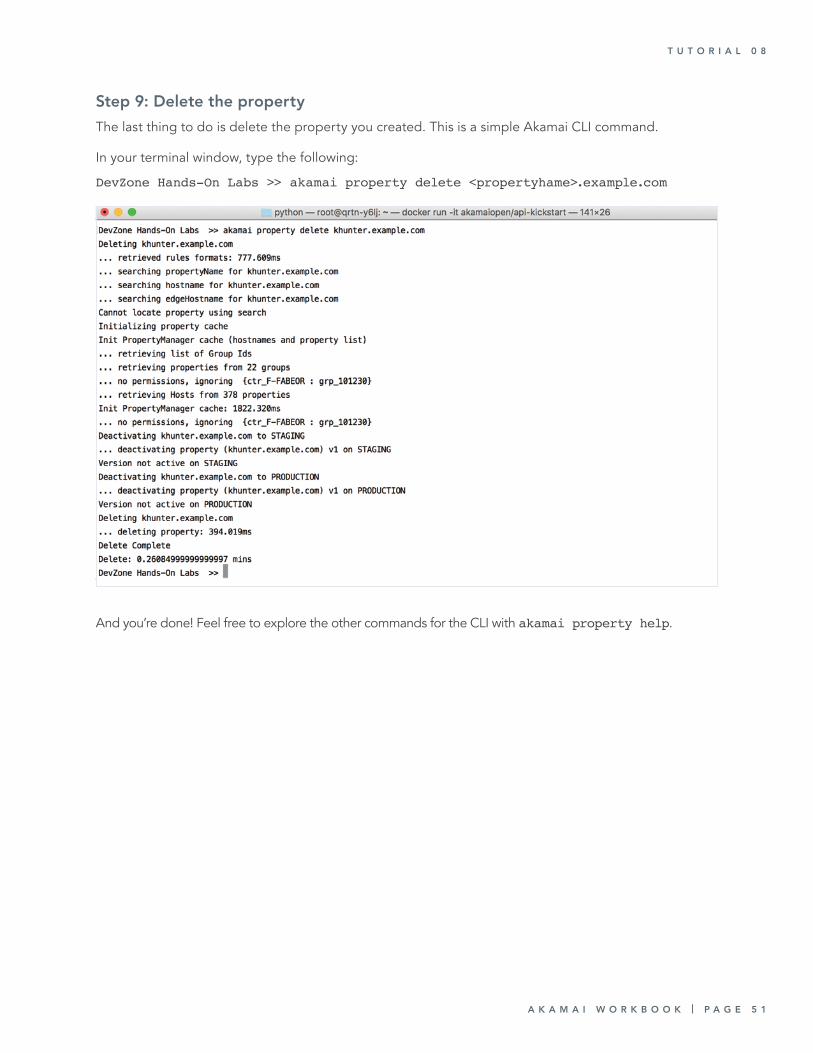
Step 9: Delete the propertyThe last thing to do is delete the property you created. This is a simple Akamai CLI command.
In your terminal window, type the following:
DevZone Hands-On Labs >> akamai property delete <propertyhame>.example.com
And you’re done! Feel free to explore the other commands for the CLI with akamai property help.
T U T O R I A L 0 8

NOTES:

NOTES:

P A G E B B | A K A M A I W O R K B O O K
developer.akamai.com