Embed Size (px)
Citation preview
Date: December 5 2013 Report No: R216.2013
Technica l Report
(Minera l Resource and Minera l Reserve Est imat ion)
UR A N I U M O N E I N C .
Akbastau Uranium Mine
Kazakhstan
By Maxim Seredkin
PhD, MAIG
and
R. Dennis Bergen P. Eng.
For: Approved: Uranium One Suite 1710, 333 Bay Street, Bay Adelaide Centre Toronto, Ontario, M5H 2R2 ________________________ Canada Daniel Wholley, Director
Uranium One Inc. Akbastau Uranium Mine
Report No: R216.2013 II
Author and Reviewer Signatures
Principal Author:
Maxim Seredkin PhD, MAIG
Signature:
Date: December 5 2013
Principal Author:
R. Dennis Bergen P.Eng.
Signature:
Date: December5 2013
Co-Author: Dmitry Pertel MSc, MAIG, GAA
Signature:
December 5 2013
Principal Reviewer:
Gerry Fahey MAuslMM, MAIG
Signature:
Date: December 5 2013
Principal Reviewer:
Steve Rose FAusIMM, MIMMM, CEng
Signature:
Date: December 5 2013
Reviewer: Aaron Meakin MAuslMM
Signature:
Date: December 5 2013
Reviewer: Serikjan Urbisinov MAIG
Signature:
Date: December 5 2013
Uranium One Inc. Akbastau Uranium Mine
Report No: R216.2013 III
Contents
Author and Reviewer Signatures ................................................................................................II Contents ....................................................................................................................................III 1 Summary .............................................................................................................................1
1.1 Executive Summary ................................................................................................................. 1 1.2 Conclusions ............................................................................................................................. 1 1.3 Recommendations .................................................................................................................. 2 1.4 Technical Summary ................................................................................................................. 3
1.4.1 Property Description and Location ..................................................................................... 3 1.4.2 Land Tenure ........................................................................................................................ 3 1.4.3 Existing Infrastructure ........................................................................................................ 4 1.4.4 History................................................................................................................................. 4 1.4.5 Geology and Mineralization ................................................................................................ 4 1.4.6 Exploration Status ............................................................................................................... 5 1.4.7 Mineral Resources .............................................................................................................. 5 1.4.8 Mineral Reserves ................................................................................................................ 8 1.4.9 Mining Method ................................................................................................................... 9 1.4.10 Mineral Processing ........................................................................................................... 9 1.4.11 Project Infrastructure ....................................................................................................... 9 1.4.12 Market Studies ................................................................................................................ 10 1.4.13 Environmental, Permitting and Social Considerations ................................................... 10 1.4.14 Capital Cost Estimate ...................................................................................................... 10 1.4.15 Operating Cost Estimates ............................................................................................... 11 1.4.16 Economic Analysis........................................................................................................... 12
2 Introduction ..................................................................................................................... 13 2.1 Issuer ..................................................................................................................................... 13 2.2 Terms of Reference ............................................................................................................... 13 2.3 Qualified Person Property Inspection ................................................................................... 13 2.4 Sources of Information ......................................................................................................... 13
3 Reliance on Other Experts ................................................................................................ 16 4 Property Description and Location .................................................................................. 17
4.1 Location of Property ............................................................................................................. 17 4.2 Obligations and Royalties ...................................................................................................... 18 4.3 Permits Required .................................................................................................................. 19 4.4 Environmental Liabilities ....................................................................................................... 19 4.5 Mineral Tenure ..................................................................................................................... 20
4.5.1 Budenovskoye No.1 .......................................................................................................... 20 4.5.2 Budenovskoye No. 3 and 4 ............................................................................................... 20
5 Accessibility, Climate, Local Resources, Infrastructure and Physiography ...................... 24 5.1 Accessibility ........................................................................................................................... 24 5.2 Climate and Physiography ..................................................................................................... 24 5.3 Local Resources and Infrastructure ....................................................................................... 25
6 History .............................................................................................................................. 26 6.1 Geological Study.................................................................................................................... 26 6.2 Ownership ............................................................................................................................. 28 6.3 Historical Mineral Resource and Mineral Reserve Estimates ............................................... 28
6.3.1 Cautionary Statement ....................................................................................................... 28 6.3.2 CSA Comments on CIS Resource Classification ................................................................. 29 6.3.3 Resources and Exploration Prognoses Estimates in Accordance with CIS Classification .. 30
Uranium One Inc. Akbastau Uranium Mine
Report No: R216.2013 IV
6.3.4 Mineral Resources and Mineral Reserves Estimates in Accordance with CIM Classification ................................................................................................................................... 31
6.4 Production from the Property ............................................................................................... 33 7 Geological Setting and Mineralization ............................................................................. 34
7.1 Regional Geology .................................................................................................................. 34 7.2 Local and Property Geology .................................................................................................. 38
7.2.1 Geological Structure ......................................................................................................... 38 7.2.2 Mineralized Bodies ........................................................................................................... 39 7.2.3 Mineralization ................................................................................................................... 40
8 Deposit Type..................................................................................................................... 45 9 Exploration ....................................................................................................................... 47 10 Drilling ........................................................................................................................... 48
10.1 Geological Exploratory Drilling .............................................................................................. 48 10.2 Drilling of Hydrogeological Holes .......................................................................................... 52 10.3 Downhole Geophysical Surveys ............................................................................................ 53
10.3.1 GR Logging ...................................................................................................................... 55 10.3.2 Downhole Survey ............................................................................................................ 56 10.3.3 Electrical (RL, SP) Logging ............................................................................................... 56 10.3.4 Drillhole Diameter Measurements (CL) .......................................................................... 57 10.3.5 Flowmeter Survey ........................................................................................................... 57 10.3.6 PFN Logging .................................................................................................................... 57
10.4 Drillhole Documentation ....................................................................................................... 57 10.5 Drillhole Sampling ................................................................................................................. 58
10.5.1 Sampling for Uranium and Radium ................................................................................. 59 10.5.2 Sampling for Associated Elements .................................................................................. 60 10.5.3 Sampling for Grain-Size Composition and Carbonate .................................................... 60 10.5.4 Sampling for Spectral Analysis ........................................................................................ 60 10.5.5 Collecting Solid Core Sticks to Determine Moisture Content and Specific Gravity ........ 61 10.5.6 Metallurgical Samples ..................................................................................................... 61 10.5.7 Samples for Mineralogical, Petrographic and Other Analyses ....................................... 61
10.6 Topo-Geodetic Survey ........................................................................................................... 62 10.7 Results of Drillhole Sampling ................................................................................................ 63
11 Sample Preparation, Analyses and Security ................................................................. 65 11.1 Sample Preparation............................................................................................................... 65 11.2 Analytical Work ..................................................................................................................... 67
11.2.1 Determination of Uranium and Radium ......................................................................... 68 11.2.2 Other Laboratory Analyses ............................................................................................. 71 11.2.3 Leaching Test Work ........................................................................................................ 72
11.3 Interpretation of Geophysical Data, Determination of Mineralized Intervals ...................... 72 11.3.1 Gamma-Ray Logging ....................................................................................................... 72 11.3.2 Resistivity Logging ........................................................................................................... 74 11.3.3 Control of Geophysical Surveys ...................................................................................... 74
11.4 Drillhole Registration Log-Books ........................................................................................... 77 11.5 CSA’s Opinion on Sample Preparation, Analytical and Interpretation Procedures ............... 78
12 Data Verification ........................................................................................................... 79 13 Mineral Processing and Metallurgical Testing .............................................................. 80
13.1 Laboratory Testwork – Karatau Mineralization .................................................................... 80 13.2 Wellfield Production – Budenovskoye No. 1......................................................................... 81 13.3 Field Production – Budenovskoye No. 3 ............................................................................... 83 13.4 Field Production – Budenovskoye No. 4 ............................................................................... 85
14 Mineral Resource Estimates ......................................................................................... 88 14.1 Introduction .......................................................................................................................... 88 14.2 Software Used ....................................................................................................................... 88 14.3 Geological Exploration Database .......................................................................................... 88 14.4 Definition of Mineralized Intervals ....................................................................................... 91
Uranium One Inc. Akbastau Uranium Mine
Report No: R216.2013 V
14.4.1 Corrections for Thorium and Potassium ......................................................................... 92 14.4.2 Radioactive Equilibrium Between Radium and Radon ................................................... 92 14.4.3 Natural Moisture Content of Mineralized Rocks and Specific Gravity ........................... 92
14.5 Geological Interpretation ...................................................................................................... 95 14.5.1 Modelling of Mineralized Horizons ................................................................................. 96 14.5.2 Interpretation of Mineralised Bodies ............................................................................. 97 14.5.3 Interpretation of Clay Horizons ...................................................................................... 98
14.6 Wireframe Modelling of the Mineralised Envelopes and Clay Horizons ............................ 103 14.7 Compositing ........................................................................................................................ 106 14.8 Classical Statistical Analysis ................................................................................................. 107 14.9 Geostatistical Analysis ......................................................................................................... 108 14.10 Specific Gravity .................................................................................................................... 110 14.11 Block Modelling ................................................................................................................... 110 14.12 Estimation of Grades and Uranium Productivity ................................................................ 112
14.12.1 Grade Interpolation .................................................................................................. 113 14.12.2 Generation of Gridded Model and Productivity Estimate ........................................ 113
14.13 Model Validation ................................................................................................................. 119 14.14 Resource Classification Discussion ...................................................................................... 120
14.14.1 Differentiation of Resources into Areas of the Deposit ............................................ 120 14.14.2 Classification of Resources by Categories ................................................................. 120
14.15 Mineral Resources without Depletion ................................................................................ 123 14.16 Account of Depletion in Recovery ....................................................................................... 125 14.17 Mineral Resource Estimate Statement ............................................................................... 128 14.18 Mineral Resources Compared to Previous Estimates ......................................................... 130
14.18.1 Comments for Budenovskoye No. 1 Deposit ............................................................ 130 14.18.2 Comments for Budenovskoye No. 3 ......................................................................... 130
15 Mineral Reserve Estimates ......................................................................................... 132 15.1 Summary ............................................................................................................................. 132 15.2 Cut-off Grade ...................................................................................................................... 133 15.3 Extraction ............................................................................................................................ 135 15.4 Dilution and Ore Loss .......................................................................................................... 135 15.5 Grade Estimation ................................................................................................................ 136 15.6 Classification of Mineral Reserves ...................................................................................... 136 15.7 Estimation of Mineral Reserves .......................................................................................... 136
15.7.1 Budenovskoye No. 1 ..................................................................................................... 136 15.7.2 Budenovskoye No. 3 ..................................................................................................... 138 15.7.3 Budenovskoye No. 4 ..................................................................................................... 139
15.8 Kazakh Mineral Reserve Estimation .................................................................................... 140 15.9 CSA Opinion ........................................................................................................................ 140
16 Mining Methods ......................................................................................................... 141 16.1 Mining Operations .............................................................................................................. 141 16.2 Wellfield Production Budenovskoye No. 1, No. 3 and No. 4............................................... 146 16.3 Well Operations .................................................................................................................. 146 16.4 Geomechanics & Hydrology ................................................................................................ 146
16.4.1 Local Hydrogeology ...................................................................................................... 147 16.5 Life of Mine Plan ................................................................................................................. 148 16.6 Mine Equipment ................................................................................................................. 149
17 Recovery Methods ...................................................................................................... 150 17.1 Process Description ............................................................................................................. 150 17.2 Process Plant Operations Budenovskoye No. 1 .................................................................. 152 17.3 Process Plant Operations Budenovskoye No. 3 .................................................................. 153 17.4 Process Plant Operations Budenovskoye No. 4 .................................................................. 154 17.5 Plant Operations ................................................................................................................. 155
18 Project Infrastructure ................................................................................................. 156 18.1 Staff Accommodation ......................................................................................................... 156
Uranium One Inc. Akbastau Uranium Mine
Report No: R216.2013 VI
18.2 Power .................................................................................................................................. 156 18.3 Transportation and Logistics ............................................................................................... 156
19 Market Studies and Contracts .................................................................................... 157 19.1 Markets ............................................................................................................................... 157
19.1.1 Uranium One Contracts ................................................................................................ 157 19.1.2 Uranium Price ............................................................................................................... 157
19.2 Contracts ............................................................................................................................. 158 20 Environmental Studies, Permitting and Social or Community Impact ....................... 159
20.1 Environment, Health and Safety ......................................................................................... 159 20.2 Project Permitting ............................................................................................................... 159 20.3 Social or Community Requirements ................................................................................... 159 20.4 Mine Closure Requirements ............................................................................................... 160
21 Capital and Operating Costs ....................................................................................... 161 21.1 Capital Cost Estimate .......................................................................................................... 161 21.2 Operating Costs ................................................................................................................... 161 21.3 Manpower ........................................................................................................................... 164
22 Economic Analysis ...................................................................................................... 165 23 Adjacent Properties .................................................................................................... 166 24 Other Relevant Data and Information ........................................................................ 167 25 Interpretation and Conclusions .................................................................................. 168 26 Recommendations ...................................................................................................... 173 27 References .................................................................................................................. 174 28 Date and Signatures.................................................................................................... 176
28.1 Certificate of Qualified Person ............................................................................................ 176 28.2 Certificate of Qualified Person ............................................................................................ 178
Appendix 1: Details of Database Structure .......................................................................... 180 Source Data ...................................................................................................................................... 180 Database Creation ............................................................................................................................ 182
Loading and Checking of Drillhole Collar Tables. .......................................................................... 182 Loading and Checking of Survey Tables ........................................................................................ 182 Loading and Checking of Assay Tables ......................................................................................... 183
The Database for Modelling of the Deposit ..................................................................................... 184 Appendix 2: Classical Statistics ............................................................................................. 193 Appendix 3: Semivariograms ................................................................................................ 195 Appendix 4: Comparison Exploration and Operation Data .................................................. 197 Appendix 5: Mineral Resources of Budenovskoye Uranium Field in Permeable Rocks ....... 198 Appendix 6: Mineralization of Budenovskoye Uranium Field in Non-Permeable Rocks (Non-Extractable Mineralization) ................................................................................................... 201 Appendix 7: Mineral Resources of Budenovskoye No. 1 in Permeable Rocks ..................... 205 Appendix 8: Mineralization of Budenovskoye No. 1 in Non-Permeable Rocks (Non-Extractable Mineralization) ................................................................................................... 208 Appendix 9: Mineral Resources of Budenovskoye No. 3 in Permeable Rocks ..................... 211 Appendix 10: Mineralization of Budenovskoye No. 3 in Non-Permeable Rocks (Non-Extractable Mineralization) ................................................................................................... 214 Appendix 11: Mineral Resources of Budenovskoye No. 4 in Permeable Rocks ................... 217 Appendix 12: Mineralization of Budenovskoye No. 4 in Non-Permeable Rocks (Non-Extractable Mineralization) ................................................................................................... 220 Appendix 13: Glossary of Technical Terms and Abbreviations ............................................ 223
Figures
Figure 4-1: Location Plan of Akbastau Uranium Mine ........................................................................... 21
Uranium One Inc. Akbastau Uranium Mine
Report No: R216.2013 VII
Figure 4-2: Location Plan of Akbastau Uranium Mine in the Southern Kazakhstan Uranium District ................................................................................................................................... 22
Figure 4-3: Property Plan of Akbastau Uranium Mine, showing the Budenovskoye No. 1, No. 3 and No. 4 License Areas ............................................................................................... 23
Figure 7-1: Chu-Sarysu Regional Geological Map .................................................................................. 35 Figure 7-2: Chu-Sarysu Region Generalised Stratigraphic Column ........................................................ 36 Figure 7-3: Schematic Long Section of the Principal Structure of Budenovskoye Mineralized
Body Roll Front ...................................................................................................................... 40 Figure 7-4: Geological Map of Budenovskoye No. 1 and No. 3 Mineralized Horizon showing
the Ribbon-like Shape of the Mineralized Bodies.................................................................. 42 Figure 7-5: Geological Map of Budenovskoye No. 4 Mineralized Horizon, showing the
Ribbon-like Shape of the Mineralized Bodies ........................................................................ 43 Figure 7-6: Inkuduk Horizon Mineralized Body Cross Section (Budenovskoye No. 1) with
Grade/Thickness Parameters ................................................................................................ 44 Figure 7-7: Inkuduk Horizon Mineralized Body Cross Section (Budenovskoye No. 4) with
Grade/Thickness Parameters ................................................................................................ 44 Figure 8-1: Principal Scheme of Roll-Front Uranium Deposit Formation .............................................. 46 Figure 10-1: Drill Collar Plan for the Budenovskoye No. 1 and No. 3 Deposits ..................................... 49 Figure 10-2: Drill Collar Plan for Budenovskoye No. 4 Deposit ............................................................. 50 Figure 10-3: Drilling of Geological Exploration Holes on Budenovskoye No. 3 Deposit ........................ 51 Figure 10-4: Logging and Assaying in Drill Holes on Budenovskoye No. 1 and No. 3 Deposits ............. 54 Figure 10-5: Logging and Assaying in Drill Holes on Budenovskoye No. 4 Deposit ............................... 55 Figure 10-6: Drilling Results for Budenovskoye No. 1 and No. 3 Deposits ............................................ 63 Figure 10-7: Drilling results for Budenovskoye No. 4 Deposit ............................................................... 64 Figure 11-1: Sample Treatment Flowsheet ........................................................................................... 66 Figure 13-1: Budenovskoye No. 1 Uranium Extraction .......................................................................... 81 Figure 13-2: Budenovskoye No. 1 Pregnant Solution Grades By Block ................................................. 82 Figure 13-3: Budenovskoye No. 1 Extraction versus Liquid:Solid Ratio................................................. 83 Figure 13-4: Budenovskoye No. 3 Uranium Extraction .......................................................................... 84 Figure 13-5: Budenovskoye No. 3 Pregnant Solution Grades ................................................................ 84 Figure 13-6: Budenovskoye No. 3 Extraction versus Liquid:Solid Ratio................................................. 85 Figure 13-7: Budenovskoye No. 4 Uranium Extraction .......................................................................... 86 Figure 13-8: Budenovskoye No. 4 Pregnant Solution Grades ................................................................ 87 Figure 13-9: Budenovskoye No. 4 Extraction Versus Liquid:Solid Ratio ................................................ 87 Figure 14-1: Existing and Missing Data for Modelling Budenovskoye No. 1 and No. 3
Deposits ................................................................................................................................. 89 Figure 14-2: Existing and Missing Data for Modelling, Budenovskoye No. 4 ........................................ 90 Figure 14-3: Determination of Radium Cut-Off Grades for Definition of Mineralized
Intervals in the Inkuduk Horizon ........................................................................................... 93 Figure 14-4: Dependence KRE (the Radioactive Equilibrium Factor) from Average Grade and
Thickness of Mineralized Intervals for Different Parts of Mineralized Bodies in the Inkuduk Horizon..................................................................................................................... 94
Figure 14-5: Interpretation of Mineralized Horizons: Inkuduk and Mynkuduk ..................................... 99 Figure 14-6: Interpretation of Mineralized Bodies on Base Initial Data .............................................. 100 Figure 14-7: Separation of Mineralized Bodies on Base Geochemistry Data ...................................... 101 Figure 14-8: Interpretation of Lithology .............................................................................................. 102 Figure 14-9: Wireframes of Mineralized Bodies .................................................................................. 104 Figure 14-10: Wireframes of Clay Horizons ......................................................................................... 105 Figure 14-11: Typical Cross Section of Mineralized Body with Roll Front Morphology ....................... 105 Figure 14-12: Comparison of Mineralized Intervals in Test Wells with Wireframes on Base
Exploration Data .................................................................................................................. 106 Figure 14-13: Search Ellipsoid for the Budenovskoye Uranium Field .................................................. 110 Figure 14-14: Principal Scheme of Estimation of Uranium Productivity in Block Model for
Budenovskoye Uranium Field .............................................................................................. 115
Uranium One Inc. Akbastau Uranium Mine
Report No: R216.2013 VIII
Figure 14-15: Uranium Productivity Distribution on Budenovskoye No. 1 and No. 3 Deposit (Inkuduk Horizon) ................................................................................................................ 116
Figure 14-16: Uranium Productivity Distribution on Budenovskoye No. 4 Deposit (Mynkuduk Horizon) ............................................................................................................ 117
Figure 14-17: KRE Distribution on Budenovskoye No. 1 and No. 3 Deposit (Inkuduk Horizon) .......... 118 Figure 14-18: KRE Distribution on Budenovskoye No. 4 Deposit (Mynkuduk Horizon) ...................... 119 Figure 14-19: Resource Classification for Budenovskoye No. 1 and No. 3 Deposit ............................. 122 Figure 14-20: Resource Classification for Budenovskoye No. 4 Deposit (Mynkuduk Horizon) ........... 123 Figure 14-21: Dependence of Average Productivity and Uranium Mineral Resources in
Sands on U Cut-off Productivity for the Budenovskoye No. 1 Deposit ............................... 124 Figure 14-22: Dependence of Average Productivity and Uranium Mineral Resources in
Sands on U Cut-off Productivity for the Budenovskoye No. 3 Deposit ............................... 124 Figure 14-23: Dependence of Average Productivity and Uranium Mineral Resources in
Sands on U Cut-off Productivity for the Budenovskoye No. 4 Deposit ............................... 125 Figure 14-24: Oblique View of 3D Production Blocks that have been Depleted for
Production ........................................................................................................................... 126 Figure 14-25: Production Blocks of Budenovskoye No. 1 and No. 3 Deposits ..................................... 127 Figure 14-26: Production (“Technological”) Blocks of Budenovskoye No. 4 Deposit .......................... 128 Figure 16-1: Budenovskoye No.1 Site Layout at the Akbastau Mine................................................... 142 Figure 16-2: Budenovskoye No.3 Site Layout at the Akbastau Mine................................................... 143 Figure 16-3: Budenovskoye No4 Site Layout at the Akbastau Mine.................................................... 143 Figure 16-4: Typical Well Configurations ............................................................................................. 144 Figure 16-5: Cross-section of a Typical Well Configuration ................................................................. 145 Figure 17-1: Karatau Process Flow Sheet ............................................................................................ 151 Figure 17-2: Budenovskoye No. 4 Satellite Plant Flowsheet ............................................................... 151 Figure 17-3: Monthly Solution Flow Rate ............................................................................................ 152 Figure 17-4: Monthly Solution Grades ................................................................................................. 152 Figure 17-5: Monthly Solution Flow Rate ............................................................................................ 153 Figure 17-6: Monthly Solution Grades ................................................................................................. 153 Figure 17-7: Monthly Solution Flow Rate ............................................................................................ 154 Figure 17-8: Monthly Solution Grades ................................................................................................. 154 Figure 19-1: UxC U3O8 Historical Uranium Prices ............................................................................... 158 Tables Table 1-1: Estimate of Mineral Resources for Akbastau Uranium Mine as of June 30, 2013.................. 7 Table 1-2: Estimate of Mineral Reserves for Akbastau Uranium Mine as at June 30, 2013 .................... 8 Table 1-3: LOM Capital Expenditure Estimate ....................................................................................... 10 Table 1-4: LOM Operating Cost Estimate .............................................................................................. 12 Table 2-1: List of Persons Providing Data and Consulting Support ........................................................ 14 Table 4-1: Budenovskoye No. 1, No. 3 and No. 4 Contract Area Coordinates....................................... 17 Table 6-1: Summary of Drilling Metres for each Phase of Exploration .................................................. 27 Table 6-2: Comparison of GKZ and CIM Classification of Mineral Resources ........................................ 29 Table 6-3: Budenovskoye No. 1, No. 3 and No. 4 Resources (C1, C2) and Exploration
Prognoses (P1) Estimated in Accordance with CIS Classification, kt U ................................... 30 Table 6-4: Budenovskoye No. 1, No. 3 and No. 4 Mineral Resources and Mineral Reserves
Estimated in Accordance with CIM Classification (Mineral Resources include Mineral Reserves) .................................................................................................................. 31
Table 6-5: Budenovskoye No. 1, No. 3 and No. 4 Uranium Production per Year, Tonnes U ................. 33 Table 10-1: Budenovskoye No. 1, No. 3 and No. 4 Core Recovery in Exploration Drillholes ................. 52 Table 10-2: Volume of Samples Taken for Various Analyses (by Exploration Stages) ........................... 59 Table 11-1: Results of Extra Methodological Control of Uranium Analyses .......................................... 70 Table 11-2: Internal Geological Control of Radium Analyses ................................................................ 70 Table 11-3: Results of Extra Methodological Control of Radium Analyses (Complex
Geophysical-Radiochemical Analysis) .................................................................................... 71
Uranium One Inc. Akbastau Uranium Mine
Report No: R216.2013 IX
Table 11-4: Results of External Geological Control of Uranium Analyses - Main Method - RSA, Control Method - Chemistry (VIMS) .............................................................................. 71
Table 11-5: Geoelectric Properties of Inkuduk Horizon Sediments at the Budenovskoye No. 1 and Budenovskoye No. 3 Deposits ..................................................................................... 74
Table 11-6: Basic and Control GRL Comparison Results ........................................................................ 75 Table 11-7: Results of Comparing GRL and Core Sampling for Uranium ............................................... 76 Table 11-8: Control RL Comparison for Basic and Control Logging ....................................................... 76 Table 11-9: Directional Survey Errors .................................................................................................... 77 Table 13-1: Laboratory Test Work – Karatau Mineralization Uranium One Inc. - Akbastau
Uranium Mine ........................................................................................................................ 80 Table 14-1: Summary Information for the Database used for Modelling ............................................. 91 Table 14-2: REF Values for Different Parts of Mineralized Bodies in the Inkuduk Horizon
(Budenovskoye Summary) depending on Radium Grade in Intersections ............................ 95 Table 14-3: Wireframe Models Summary ........................................................................................... 103 Table 14-4: Statistical Data on thicknesses of the Mineralized Intervals (whole of
Budenovskoye Uranium Field) ............................................................................................. 107 Table 14-5: Uranium Grade Distribution Statistical Parameters (all Budenovskoye Uranium
Field) .................................................................................................................................... 108 Table 14-6: Semivariogram Parameters for the Budenovskoye Uranium Field .................................. 109 Table 14-7: Budenovskoye Uranium Field Block Model Parameters ................................................... 112 Table 14-8: Grade Interpolation Parameters ....................................................................................... 114 Table 14-9: Comparison of Models based on Ordinary Kriging, IDW2, and IDW3 .............................. 120 Table 14-10: Statement of Mineral Resources for the Budenovskoye No. 1, No. 3 and No. 4
as of June 30, 2013 .............................................................................................................. 129 Table 14-11: Comparison of Resource Estimation on base CIS (GKZ) System and CIM System
for Budenovskoye No. 1, No. 3 and No. 4............................................................................ 131 Table 15-1: Estimate of Mineral Reserves for Akbastau Uranium Mine as at June 30, 2013 .............. 132 Table 15-2: Breakeven Cut-Off Grade Uranium One Inc. – Akbastau Uranium Mine ......................... 134 Table 15-3: Incremental Cut-Off Grade Uranium One Inc. – Akbastau Uranium Mine ....................... 135 Table 15-4: Budenovskoye No. 1 Technological Blocks ....................................................................... 137 Table 15-5: Calculation of Mineral Reserve Estimate Budenovskoye No. 1 ........................................ 138 Table 15-6: Budenovskoye No. 3 Technological Blocks ....................................................................... 139 Table 15-7: Budenovskoye No. 3 Calculation of Mineral Reserve Estimate ........................................ 139 Table 16-1: Akbastau Production Statistics ......................................................................................... 146 Table 16-2: Life of Mine Production Plan Uranium One Inc. – Akbastau Uranium Mine .................... 148 Table 21-1: LOM Capital Expenditure Estimate ................................................................................... 161 Table 21-2: June 2013 Operating Cost versus Budget ......................................................................... 162 Table 21-3: LOM Operating Cost Estimate .......................................................................................... 163 Table 21-4: Manpower Uranium One Inc. – Akbastau Uranium Mine ................................................ 164 Table 25-1: Estimate Mineral Resources for Budenovskoye No. 1, No. 3 and No. 4 as of
June 30, 2013 ....................................................................................................................... 170 Table 25-2: Estimate of Mineral Reserves for Akbastau Uranium Mine as at June 30, 2013 .............. 171
Appendices
Appendix 1: Details of Database Structure .......................................................................................... 180 Appendix 2: Classical Statistics ............................................................................................................ 193 Appendix 3: Semivariograms ............................................................................................................... 195 Appendix 4: Comparison Exploration and Operation Data ................................................................. 197 Appendix 5: Mineral Resources of Budenovskoye Uranium Field in Permeable Rocks ...................... 198 Appendix 6: Mineralization of Budenovskoye Uranium Field in Non-Permeable Rocks (Non-
Extractable Mineralization) ................................................................................................. 201 Appendix 7: Mineral Resources of Budenovskoye No. 1 in Permeable Rocks .................................... 205 Appendix 8: Mineralization of Budenovskoye No. 1 in Non-Permeable Rocks (Non-
Extractable Mineralization) ................................................................................................. 208
Uranium One Inc. Akbastau Uranium Mine
Report No: R216.2013 X
Appendix 9: Mineral Resources of Budenovskoye No. 3 in Permeable Rocks .................................... 211 Appendix 10: Mineralization of Budenovskoye No. 3 in Non-Permeable Rocks (Non-
Extractable Mineralization) ................................................................................................. 214 Appendix 11: Mineral Resources of Budenovskoye No. 4 in Permeable Rocks .................................. 217 Appendix 12: Mineralization of Budenovskoye No. 4 in Non-Permeable Rocks (Non-
Extractable Mineralization) ................................................................................................. 220 Appendix 13: Glossary of Technical Terms and Abbreviations ............................................................ 223
Uranium One Inc. Akbastau Uranium Mine
Report No: R216.2013 1
1 Summary
1.1 Executive Summary
CSA Global Pty Ltd (“CSA”) was retained by Uranium One Inc. (“Uranium One”) to update in
accordance with National Instrument 43-101 of the Canadian Securities Administration
(“NI43-101”), the Mineral Resource and Mineral Reserve estimate for the Akbastau Uranium
Mine (the “Mine”), and to prepare this report (the “Report”) to support Uranium One’s
public disclosure about the Mine. The Mine comprises the Budenovskoye No. 1, No. 3 and
No. 4 uranium deposits. The Budenovskoye No. 1, No. 3 and No. 4 deposits form part of the
larger Budenovskoye uranium deposit located in Southern Kazakhstan in the Chu-Sarysu
uranium-bearing region.
JSC Akbastau (“Akbastau”), which is owned indirectly by Uranium One (50%) and National
Atomic Company Kazatomprom (“Kazatomprom”) (50%), owns and operates the Mine and
holds the mineral tenure over the Mine pursuant to a Subsoil Use Contract issued by the
Ministry of Industry and New Technologies (“MINT”) of Kazakhstan.
Uranium One is a Canadian based uranium producing company and had a principal listing on
the Toronto Stock Exchange (TSX:UUU) and a secondary listing on the Johannesburg Stock
Exchange (JSE:UUU). Uranium One announced its delisting from both exchanges as part of
the going private transaction, on October 18, 2013. The company has producing operations
and advanced exploration projects in Kazakhstan, USA, Australia, and Tanzania.
The Mine is an in-situ recovery (“ISR”) uranium project, which includes wellfields, a pumping
system, offices, and a camp for employees.
Roscoe Postle Associates Inc. (“RPA”) prepared the previous Technical Report on the Mine:
“Technical Report on the Akbastau Uranium Mine, Kazakhstan” prepared for
Uranium One Inc. dated March 1, 2012, Amended May 2, 2012
1.2 Conclusions
Based on the site visit, review of the available data and the new resource estimate, CSA
concludes that:
The uranium mineralization is a sandstone-hosted, roll front deposit style.
The June 30, 2013 Mineral Resources are reported as:
o Measured Mineral Resources of 38.25 million tonnes grading 0.084 % U
(0.099 % U3O8), containing 32,044 t U (83.3 M lb U3O8)
o Indicated Mineral Resources of 14.59 million tonnes grading 0.104 % U
(0.123 % U3O8), containing 15,247 t U (39.6 M lb U3O8)
Uranium One Inc. Akbastau Uranium Mine
Report No: R216.2013 2
o Inferred Mineral Resources of 32.95 million tonnes grading 0.094 % U (0.110
% U3O8), containing 30,851 t U (80.2 M lb U3O8)
The Report shows a 77% increase in Mineral Resources (in terms of contained U) compared
to the March 2012 Mineral Resource estimate due to new exploration activities and new
geological modelling and geostatistical analysis. It has also upgraded significant parts of the
resource with an additional 33,694 tonnes U added to the combined Measured and
Indicated Mineral Resources categories, and 226 tonnes U added to the Inferred Mineral
Resource category.
Based on the site visit and review of the available data, CSA concludes that the June 30
Mineral Reserve estimate for Akbastau includes:
Proven Mineral Reserves of 54.6 million tonnes grading 0.039%U and containing
21,341 tonnes U (55.48 M lb U3O8); and
Probable Mineral Reserves of 21.6 million tonnes grading 0.048%U and containing
10,294 tonnes U (26.77 M lb U3O8).
The Akbastau deposits are being exploited using ISR techniques. The extraction used for
Mineral Reserves is 90%.
There has not been a project to date reconciliation between the production and the original
Mineral Reserve estimate for the producing areas.
The estimated operating cost for the Akbastau Mine is US$19.84 per pound U3O8 sold.
The Life of Mine Plan (“LOM”) plan generated by CSA for this Report includes the extraction
of the estimated Proven and Probable Mineral Reserves. The remaining mine life as of June
30, 2013, based on current Mineral Reserves, is approximately 22 years.
The maximum annual production is estimated to be 1,949 tonnes U.
There are 215 t U within the Budenovskoye No. 1 Mineral Reserves which are included but
will require an amendment to the Subsoil Use Contract as the production extends beyond
the current term of the contract.
The capital cost for the LOM is US$684 million including plant construction, well field
development and sustaining capital.
1.3 Recommendations
Based on the site visit and review of technical data, CSA recommends that Uranium One:
Complete a revised Mineral Resource estimate utilising the additional 20% of data
that was not available for this iteration of the Mineral Resource.
Complete additional exploration in Inferred and Indicated Mineral Resource areas to
increase the confidence level of these Mineral Resources. However, due to the large
Uranium One Inc. Akbastau Uranium Mine
Report No: R216.2013 3
Measured and Indicated Mineral Resource inventory, additional drilling in Inferred
Mineral Resource areas should be given lower priority.
Continue to improve the geological model using data as it becomes available from
ongoing delineation and development drilling.
Continue the operation of the mine.
Undertake a review of the LOM plan to develop the plan in more detail and to assess
the implications of the potential for the mine life to extend beyond the existing
permit conditions.
Pursue the implementation of reconciliation procedures that are maintained on a
regular basis and include block by block reconciliation of the production compared
to the Mineral Reserve estimate.
Direct more effort to the analysis of the physical and chemical data related to the
wellfields, process solutions, and plant operations to assist in the evaluation of the
operations and to possibly determine the cause of better or worse than planned
operating results.
1.4 Technical Summary
1.4.1 Property Description and Location
The Mine is located in the southwestern part of the Chu-Sarysu basin in the Suzak District of
the South Kazakhstan Oblast, approximately 400 km northwest of Shymkent, Kazakhstan,
and 200 km east of Kyzyl Orda, Kazakhstan.
1.4.2 Land Tenure
A Subsoil Use Contract dated November 20, 2007, granted Kazatomprom the right to explore
for and produce uranium on the Budenovskoye No. 1 part of the Mine. On November 30,
2007, a Subsoil Use Contract for the exploration and mining of uranium was granted to
Kazatomprom for the Budenovskoye No. 3 and No. 4 sites. On January 18, 2008, both
contracts were amended, with contractual rights and obligations being transferred to
Akbastau.
Each Subsoil Use Contract grants Akbastau the right to explore for and to exploit uranium
resources for the assigned area. The contract for No. 1 is valid for five years of exploration
and 25 years of production, while the No. 3 and 4 contracts have a 6-year exploration period
and a 25-year production period.
Each Subsoil Use Contract outlines the rights and obligations of the parties including work
programs and schedules for the production of uranium.
Uranium One Inc. Akbastau Uranium Mine
Report No: R216.2013 4
The Subsoil Use Contract for the No. 1 site covers an area of approximately 11 km2, while the
Subsoil Use Contract for the No. 3 and No. 4 sites covers an area of approximately 22.8 km2
centred at approximately Longitude 67o 41’ E and Latitude 44o 43’ N.
1.4.3 Existing Infrastructure
The Mine comprises:
An ISR operation producing uranium-bearing solutions from pilot production wells
pumping leach solutions from wellfields.
Infrastructure including office buildings, warehouse, camp, and materials storage
areas.
Pump station and sand ponds at the No. 3 site.
Satellite processing plant under construction on the No. 4 site.
On the adjacent Karatau mine a refining and calcining plant with design capacity of
5,000 tonnes U per annum to produce calcined yellowcake both for the Karatau and
Akbastau mine.
1.4.4 History
The Budenovskoye mineralization was discovered in 1979. In 1980, Team No. 27 of the
Volkov Geological and Mining Company (“Volkovgeologia”), a subsidiary of Kazatomprom,
carried out reconnaissance drilling and discovered uranium mineralization at Budenovskoye.
The exploration programs from 1984 to 1989 identified three uraniferous horizons, the
Inkuduk, Zhalpak, and Mynkuduk. In 2007, the Budenovskoye deposit was split into four
parts for development, with the present Mine being made up from the No. 1, No. 3, and No.
4 deposits or sites. The No. 2 deposit now forms the adjacent Karatau Uranium Mine, in
which Uranium One also has an indirect 50% interest.
In 1990, Volkovgeologia estimated mineral resources for the entire Budenovskoye Uranium
Field, including the Northern Subfield and Southern Subfield. The mineral resources were
subsequently re-estimated in 2004.
Following additional exploration, the operation commenced test production at the No. 1 site
in 2009.
Subsoil Use Contracts over the Mine were granted to Kazatomprom in 2007, and were
assigned to Akbastau in 2008. In 2010, Uranium One acquired its indirect 50% interest in
Akbastau.
1.4.5 Geology and Mineralization
The Mine is located in the Chu-Sarysu Basin, which represents a large Cretaceous age basin
up to 250 km wide and extends northward from the foothills of the Tien Shan Mountains for
over 1,000 km.
Uranium One Inc. Akbastau Uranium Mine
Report No: R216.2013 5
Uranium mineralization is present in the Mynkuduk, and Inkuduk horizons. These consist of
unconsolidated lacustrine-alluvial Late Cretaceous sediments. The Mynkuduk horizon occurs
at depths from 410 m to 800 m below the surface, and the Inkuduk horizon occurs from 330
m to 720 m below surface.
The Budenovskoye deposits in Kazakhstan are considered roll front deposits similar to the
roll front deposits in the Powder River Basin of Wyoming in the United States, but are of an
exceptional size. The fronts vary widely in size and shape and commonly have lateral
variations of several kilometres and thickness of several metres. There may be many
individual beds that contain roll fronts within a particular formation.
1.4.6 Exploration Status
Exploration is carried out by drilling. The exploration focus is on the upgrading of Inferred
Mineral Resources to the Indicated Mineral Resources category and Indicated to Measured
Resources category.
1.4.7 Mineral Resources
The update is based on the exploration work that was carried out on the deposit between
1979 and 2012 using core and non-core drilling techniques.
CSA completed Mineral Resource estimates based on data supplied by Uranium One, which
included relevant geological reports, the geological database, and recovery and depletion
data. A site visit was undertaken by Maxim Seredkin from April 20 to April 27 2012, which
included the analytical laboratory and information processing facilities.
The new estimates result from the application of three-dimensional (“3D”) modelling
techniques to the extensive database of drilling information for the property compiled by
the Government of Kazakhstan, which was previously not directly available to Uranium One,
but was made available to Uranium One for the first time in November 2012. Previously,
estimates for the Mine were prepared in accordance with the GKZ classifications (using a 2D
polygonal geological modelling and estimation process) and then converted to the
definitions and guidelines for the reporting of exploration information, Mineral Resources
and Mineral Reserves determined by the Canadian Institute of Mining, Metallurgy and
Petroleum Definition Standards on Mineral Resources and Mineral Reserves adopted by the
CIM Council (the “CIM Standards”).
The relationships between geophysical logging data and laboratory analyses were identified
in order to define resource estimation parameters based on gamma log and electrical
logging methods. Gamma logs were used to estimate the uranium content and electrical
techniques were used to define rock permeability. Hydrogeological drilling and
investigations have been used to determine the coefficient of permeability. Together these
have been used to estimate not only grade, but also the uranium productivity of the deposit
areas and mineralization amenability to ISR.
A serious challenge in estimating grades in these types of deposits is identifying radiological
responses and how these are influenced by the position of the mineralized interval relative
Uranium One Inc. Akbastau Uranium Mine
Report No: R216.2013 6
to the redox front zone (stratal oxidation in Russian terminology) and to what extent
disequilibrium is present within the deposit. This part of the investigation has resulted in:
Determination of radium cut-off grade being that of 0.01% U equivalent in different
geochemical zones.
Determination of a radioactive equilibrium factor (“REF”) for conversion of radium
m% (GT) into uranium.
The modelling of roll front type uranium deposits to be developed using ISR methods has its
own specific requirements, which have been fully accounted for in the course of performing
the assignment:
Modelling divided the bodies into mineralized horizons (Inkuduk and Mynkuduk)
based on the geometry of the mineralization (noses, wings, and roll residuals) and
whether the mineralization occurs within permeable sands or clays, (mineralization
in clay is non-extractable by ISR methods).
The initial downhole geophysical data was collected at 10 cm increments. These
intervals were too narrow for determination of radiological factors and to model
effectively. To negate this effect, intervals were composited over the full thickness of
the mineralization (with division into sands and clays).
For ISR deposits, the depletion of Mineral Resources was measured not by how
much rock is removed, as is the case with most traditionally mined resources, but
rather by lowering of uranium grade (and productivity). The depletion has been
factored into the Mineral Resource estimate.
All data reviewed has been the subject of appropriate Quality Assurance/Quality Control
(“QA/QC”) procedures, and the geological exploration activities and interpretation of
uranium-mineralized intervals have been performed by experienced and competent staff.
The final estimate for the Akbastau Uranium Mine Mineral Resources (i.e. Budenovskoye No.
1, No. 3 and No. 4 deposits), depleted for production, as of June 30, 2013 is given in Table
1-1.
Uranium One Inc. Akbastau Uranium Mine
Report No: R216.2013 7
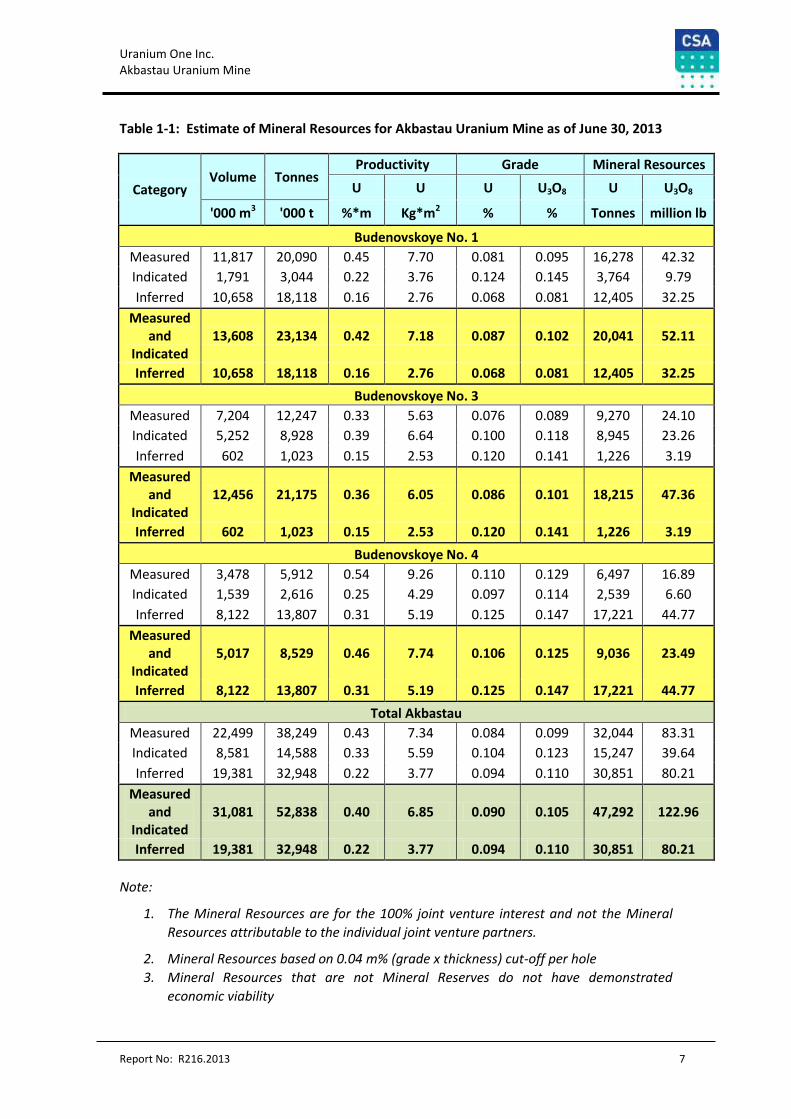
Table 1-1: Estimate of Mineral Resources for Akbastau Uranium Mine as of June 30, 2013
Category Volume Tonnes
Productivity Grade Mineral Resources
U U U U3O8 U U3O8
'000 m3 '000 t %*m Kg*m2 % % Tonnes million lb
Budenovskoye No. 1
Measured 11,817 20,090 0.45 7.70 0.081 0.095 16,278 42.32
Indicated 1,791 3,044 0.22 3.76 0.124 0.145 3,764 9.79
Inferred 10,658 18,118 0.16 2.76 0.068 0.081 12,405 32.25
Measured and
Indicated
13,608 23,134 0.42 7.18 0.087 0.102 20,041 52.11
Inferred 10,658 18,118 0.16 2.76 0.068 0.081 12,405 32.25
Budenovskoye No. 3
Measured 7,204 12,247 0.33 5.63 0.076 0.089 9,270 24.10
Indicated 5,252 8,928 0.39 6.64 0.100 0.118 8,945 23.26
Inferred 602 1,023 0.15 2.53 0.120 0.141 1,226 3.19
Measured and
Indicated
12,456 21,175 0.36 6.05 0.086 0.101 18,215 47.36
Inferred 602 1,023 0.15 2.53 0.120 0.141 1,226 3.19
Budenovskoye No. 4
Measured 3,478 5,912 0.54 9.26 0.110 0.129 6,497 16.89
Indicated 1,539 2,616 0.25 4.29 0.097 0.114 2,539 6.60
Inferred 8,122 13,807 0.31 5.19 0.125 0.147 17,221 44.77
Measured and
Indicated
5,017 8,529 0.46 7.74 0.106 0.125 9,036 23.49
Inferred 8,122 13,807 0.31 5.19 0.125 0.147 17,221 44.77
Total Akbastau
Measured 22,499 38,249 0.43 7.34 0.084 0.099 32,044 83.31
Indicated 8,581 14,588 0.33 5.59 0.104 0.123 15,247 39.64
Inferred 19,381 32,948 0.22 3.77 0.094 0.110 30,851 80.21
Measured and
Indicated
31,081 52,838 0.40 6.85 0.090 0.105 47,292 122.96
Inferred 19,381 32,948 0.22 3.77 0.094 0.110 30,851 80.21
Note:
1. The Mineral Resources are for the 100% joint venture interest and not the Mineral
Resources attributable to the individual joint venture partners.
2. Mineral Resources based on 0.04 m% (grade x thickness) cut-off per hole
3. Mineral Resources that are not Mineral Reserves do not have demonstrated
economic viability
Uranium One Inc. Akbastau Uranium Mine
Report No: R216.2013 8
4. Mineral Resources based on CIM definitions
5. Mineral Resources based on bulk density of 1.7 t/m3.
6. Depletion estimated using losses 10%
7. Measured Mineral Resources based on exploration drilling 50 m x 200 m (exclude
residual mineralized bodies)
8. Indicated Mineral Resources based on exploration drilling 50-100 m x 400 m (exclude
residual mineralized bodies) and 50 m x 200 m for residual mineralized bodies
9. Inferred Mineral Resources are based on exploration drilling 100-800 m x 400-1600
m
10. Mineral Resources include Mineral Reserves
11. Rows and columns may not add exactly due to rounding
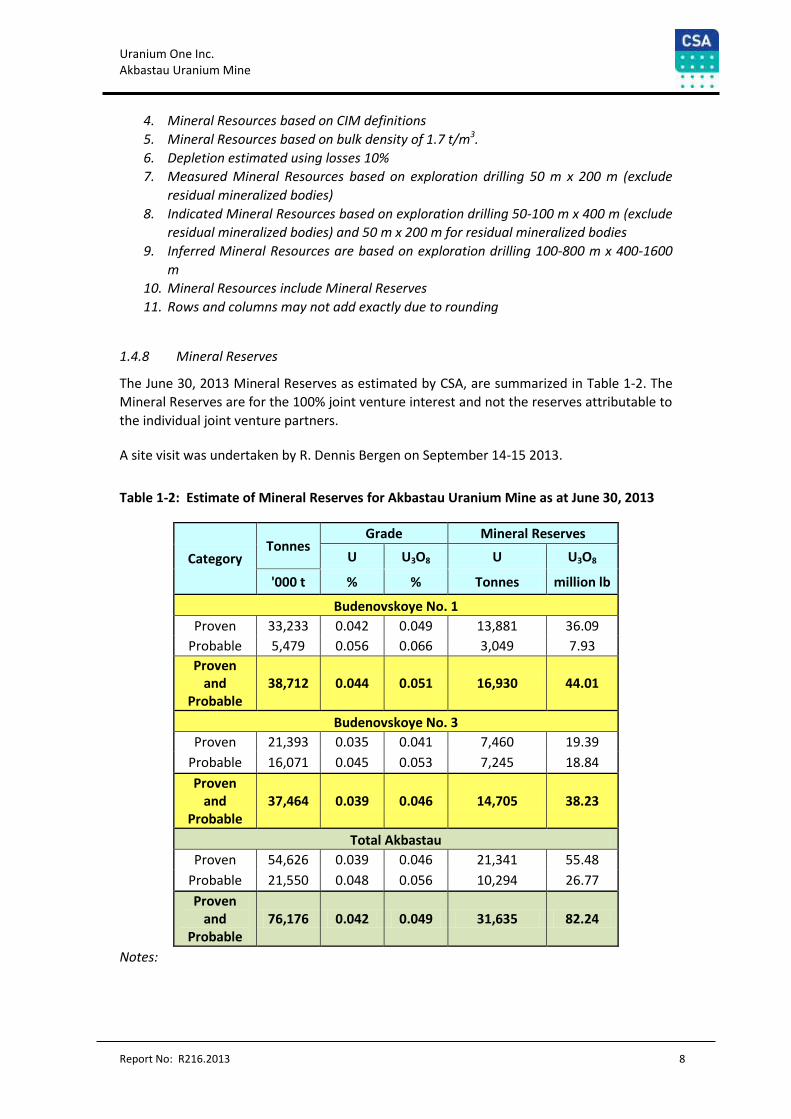
1.4.8 Mineral Reserves
The June 30, 2013 Mineral Reserves as estimated by CSA, are summarized in Table 1-2. The
Mineral Reserves are for the 100% joint venture interest and not the reserves attributable to
the individual joint venture partners.
A site visit was undertaken by R. Dennis Bergen on September 14-15 2013.
Table 1-2: Estimate of Mineral Reserves for Akbastau Uranium Mine as at June 30, 2013
Category Tonnes
Grade Mineral Reserves
U U3O8 U U3O8
'000 t % % Tonnes million lb
Budenovskoye No. 1
Proven 33,233 0.042 0.049 13,881 36.09
Probable 5,479 0.056 0.066 3,049 7.93
Proven and
Probable 38,712 0.044 0.051 16,930 44.01
Budenovskoye No. 3
Proven 21,393 0.035 0.041 7,460 19.39
Probable 16,071 0.045 0.053 7,245 18.84
Proven and
Probable 37,464 0.039 0.046 14,705 38.23
Total Akbastau
Proven 54,626 0.039 0.046 21,341 55.48
Probable 21,550 0.048 0.056 10,294 26.77
Proven and
Probable 76,176 0.042 0.049 31,635 82.24
Notes:
Uranium One Inc. Akbastau Uranium Mine
Report No: R216.2013 9
1. The Mineral Reserves are for the 100% joint venture interest and not the Mineral
Reserves attributable to the individual joint venture partners.
2. CIM definitions were followed for Mineral Reserves
3. Mineral Reserves are estimated at a cut-off grade of 0.01% U and 4 m thickness.
3. Mineral Reserves are estimated using an average long-term uranium price of US$65
per pound U3O8.
4. Bulk density is 1.7 t/m3.
5. Numbers may not add due to rounding.
6. Uranium quantities and grade are net of extraction.
Mineral Reserve estimates have been depleted for production to the date of the estimate.
Extraction of 90% of the Mineral Resource is forecast based upon the performance of the
Mine to date. Where production from the technological blocks exceeded the planned
extraction of 90%, RPA depleted the Mineral Resource and Mineral Reserve rock tonnages
and uranium tonnage from the total estimate and considered any additional production to
be “production in addition to the resource/reserve estimate”. A loss of 10% of the Mineral
Resources was estimated to account for thin isolated zones and potentially poor surface
access. Based upon the comparison of the Mineral Resource estimate to the technological
blocks, dilution was estimated to be 100%.
1.4.9 Mining Method
The mine is operating as an ISR operation and has achieved commercial production at both
Budenovskoye No. 1 and Budenovskoye No. 3. Budenovskoye No. 4 is in the test production
phase. No mineral reserves were estimated for the No. 4 area as it is still at the test mining
phase.
Uranium is leached from the ore by injecting a sulphuric acid solution which is then
recovered from production wells and treated on surface for the recovery of uranium.
1.4.10 Mineral Processing
Production solutions are all pumped to surface by submersible pump and then sent to the
Karatau plant for processing. The process includes adsorption of the uranium onto a resin
followed by denitrification and ion exchange to produce a rich eluate from which the
uranium is precipitated before being calcined to form yellowcake.
A satellite processing plant is under construction at No. 4 area and when operational this
plant will generate rich eluate to be treated in the adjacent Karatau plant.
Barren solution from the plant is adjusted for acid content and reinjected to leach uranium.
1.4.11 Project Infrastructure
The Akbastau mine is in operation and the necessary roads, power lines, camp facilities and
offices are in place for the operation.
Uranium One Inc. Akbastau Uranium Mine
Report No: R216.2013 10
1.4.12 Market Studies
Uranium One has contracts in place for the sales of uranium. The spot price of U3O8 on
October 7, 2013 was $35.00 per pound. The Mineral Reserve estimates are based upon a
price of $65.00 per pound U3O8.
1.4.13 Environmental, Permitting and Social Considerations
The environmental risk is currently perceived to be low. Akbastau indicates that it has the
necessary permits for its current operations.
In view of the depth of the zones being mined and the relative isolation of the aquifer, there
is no aquifer remediation planned as part of the closure. The surface disturbances will be
reclaimed and process facilities will be removed.
As of December 31, 2012, the Uranium One portion of the asset retirement obligations (on
an undiscounted basis) was estimated at $2.1 million for the successful decommissioning,
reclamation, and long term care of the surface and wellfield facilities. The total asset
retirement obligation was estimated to be $4.2 million.
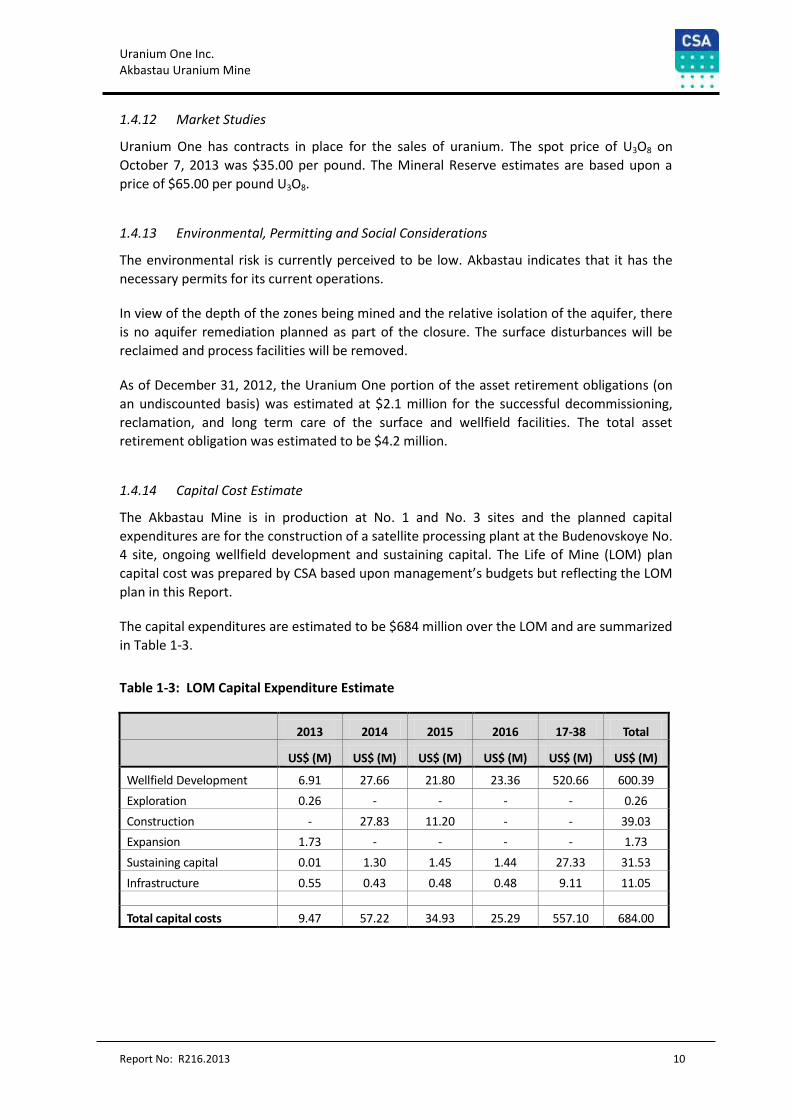
1.4.14 Capital Cost Estimate
The Akbastau Mine is in production at No. 1 and No. 3 sites and the planned capital
expenditures are for the construction of a satellite processing plant at the Budenovskoye No.
4 site, ongoing wellfield development and sustaining capital. The Life of Mine (LOM) plan
capital cost was prepared by CSA based upon management’s budgets but reflecting the LOM
plan in this Report.
The capital expenditures are estimated to be $684 million over the LOM and are summarized
in Table 1-3.
Table 1-3: LOM Capital Expenditure Estimate
2013 2014 2015 2016 17-38 Total
US$ (M) US$ (M) US$ (M) US$ (M) US$ (M) US$ (M)
Wellfield Development 6.91 27.66 21.80 23.36 520.66 600.39
Exploration 0.26 - - - - 0.26
Construction - 27.83 11.20 - - 39.03
Expansion 1.73 - - - - 1.73
Sustaining capital 0.01 1.30 1.45 1.44 27.33 31.53
Infrastructure 0.55 0.43 0.48 0.48 9.11 11.05
Total capital costs 9.47 57.22 34.93 25.29 557.10 684.00
Uranium One Inc. Akbastau Uranium Mine
Report No: R216.2013 11
1.4.15 Operating Cost Estimates
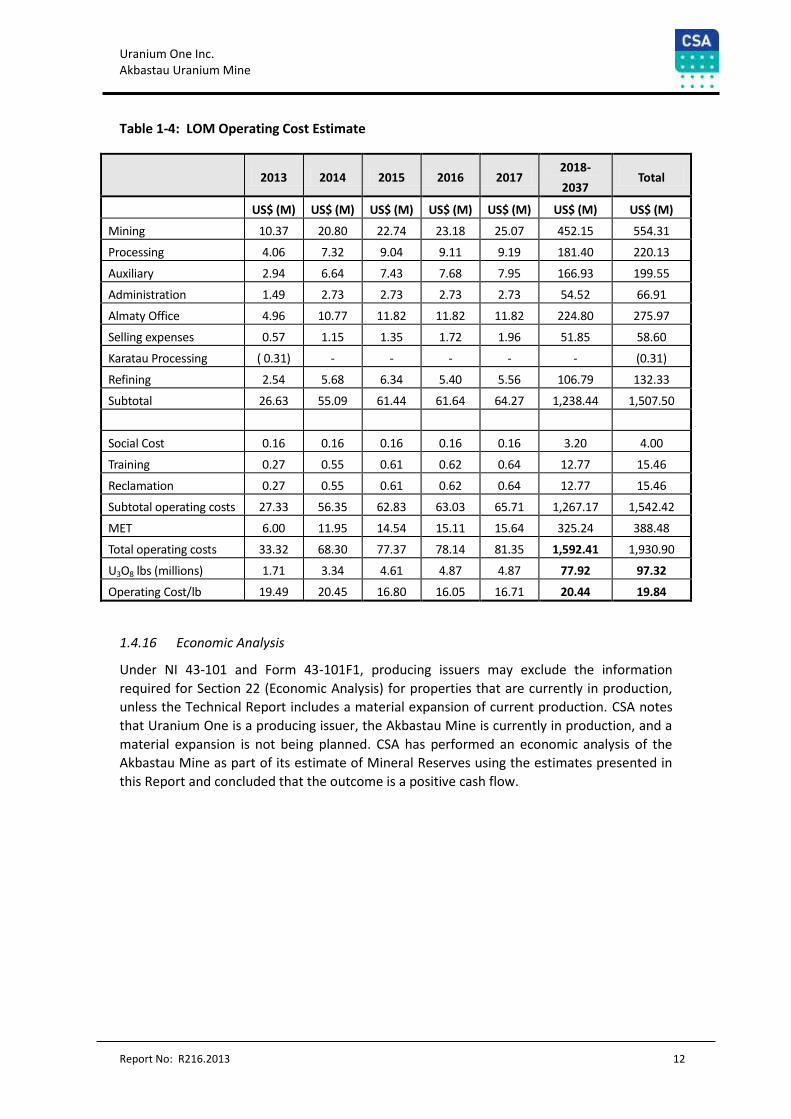
The LOM estimated operating costs are summarized in Table 1-4. The LOM operating costs
have been taken from management’s budgets but modified for the production forecast in
this Report.
Uranium One Inc. Akbastau Uranium Mine
Report No: R216.2013 12
Table 1-4: LOM Operating Cost Estimate
2013 2014 2015 2016 2017
2018-
2037 Total
US$ (M) US$ (M) US$ (M) US$ (M) US$ (M) US$ (M) US$ (M)
Mining 10.37 20.80 22.74 23.18 25.07 452.15 554.31
Processing 4.06 7.32 9.04 9.11 9.19 181.40 220.13
Auxiliary 2.94 6.64 7.43 7.68 7.95 166.93 199.55
Administration 1.49 2.73 2.73 2.73 2.73 54.52 66.91
Almaty Office 4.96 10.77 11.82 11.82 11.82 224.80 275.97
Selling expenses 0.57 1.15 1.35 1.72 1.96 51.85 58.60
Karatau Processing ( 0.31) - - - - - (0.31)
Refining 2.54 5.68 6.34 5.40 5.56 106.79 132.33
Subtotal 26.63 55.09 61.44 61.64 64.27 1,238.44 1,507.50
Social Cost 0.16 0.16 0.16 0.16 0.16 3.20 4.00
Training 0.27 0.55 0.61 0.62 0.64 12.77 15.46
Reclamation 0.27 0.55 0.61 0.62 0.64 12.77 15.46
Subtotal operating costs 27.33 56.35 62.83 63.03 65.71 1,267.17 1,542.42
MET 6.00 11.95 14.54 15.11 15.64 325.24 388.48
Total operating costs 33.32 68.30 77.37 78.14 81.35 1,592.41 1,930.90
U3O8 lbs (millions) 1.71 3.34 4.61 4.87 4.87 77.92 97.32
Operating Cost/lb 19.49 20.45 16.80 16.05 16.71 20.44 19.84
1.4.16 Economic Analysis
Under NI 43-101 and Form 43-101F1, producing issuers may exclude the information
required for Section 22 (Economic Analysis) for properties that are currently in production,
unless the Technical Report includes a material expansion of current production. CSA notes
that Uranium One is a producing issuer, the Akbastau Mine is currently in production, and a
material expansion is not being planned. CSA has performed an economic analysis of the
Akbastau Mine as part of its estimate of Mineral Reserves using the estimates presented in
this Report and concluded that the outcome is a positive cash flow.
Uranium One Inc. Akbastau Uranium Mine
Report No: R216.2013 13
2 Introduction
Uranium One Inc. (“Uranium One”) commissioned CSA Global Pty Ltd (“CSA”) to complete
geological modelling and an updated Mineral Resource and Mineral Reserve estimation for
the Akbastau Uranium Mine (the ”Mine”), which comprises and exploits the Budenovskoye
No. 1, No. 3 and No. 4 uranium deposits.
2.1 Issuer
Uranium One is a Canadian based uranium producing company and had a principal listing on
the Toronto Stock Exchange (TSX:UUU) and a secondary listing on the Johannesburg Stock
Exchange (JSE:UUU). Uranium One announced its delisting from both exchanges as part of
the going private transaction, on October 18, 2013. The company has producing operations
and advanced exploration projects in Kazakhstan, USA, Australia, and Tanzania. The Mine is
owned by JSC Akbastau (“Akbastau”), which is jointly owned by Uranium One (50%) and
National Atomic Company Kazatomprom (“Kazatomprom”) (50%).
2.2 Terms of Reference
The purpose of this Report is to provide an updated estimate of the Mineral Resources and
Mineral Reserves of the Mine, and to support the public disclosure of information relating to
the Mine by Uranium One.
CSA acted independently as Uranium One’s consultant, receiving a fixed fee for the services
provided. The fee had been determined previously during preliminary negotiations between
the parties. Neither CSA, nor any of its staff rendering the services in connection with this
Report had any material, financial or pecuniary interest in Uranium One and its subsidiaries,
or in the Mine.
2.3 Qualified Person Property Inspection
Site and other visits were carried April 20 to April 27 2012 by Dr Maxim Seredkin, PhD,
MAIG, Senior Resource Geologist, CSA. Further details are given in Section 12, Data
Verification. Mr. R. Dennis Bergen, P. Eng., an Associate Principal Mining Engineer engaged
by Roscoe Postle Associates Inc., visited the site on September 14-15, 2013. Mr Bergen
previously visited the site on October 13 and 14, 2011 and on June 5 and 6, 2010.
2.4 Sources of Information
The modelling and Mineral Resource estimate was carried out based on the documentation,
reports, technical data, and results of studies provided by Uranium One, in addition to data
collected on site during a site visit completed by CSA. In the course of modelling and Mineral
Resource and Mineral Reserve estimation, CSA relied on the provided information, regarding
it as accurate, valid, and applicable for Mineral Resource and Mineral Reserve estimation.
Uranium One Inc. Akbastau Uranium Mine
Report No: R216.2013 14
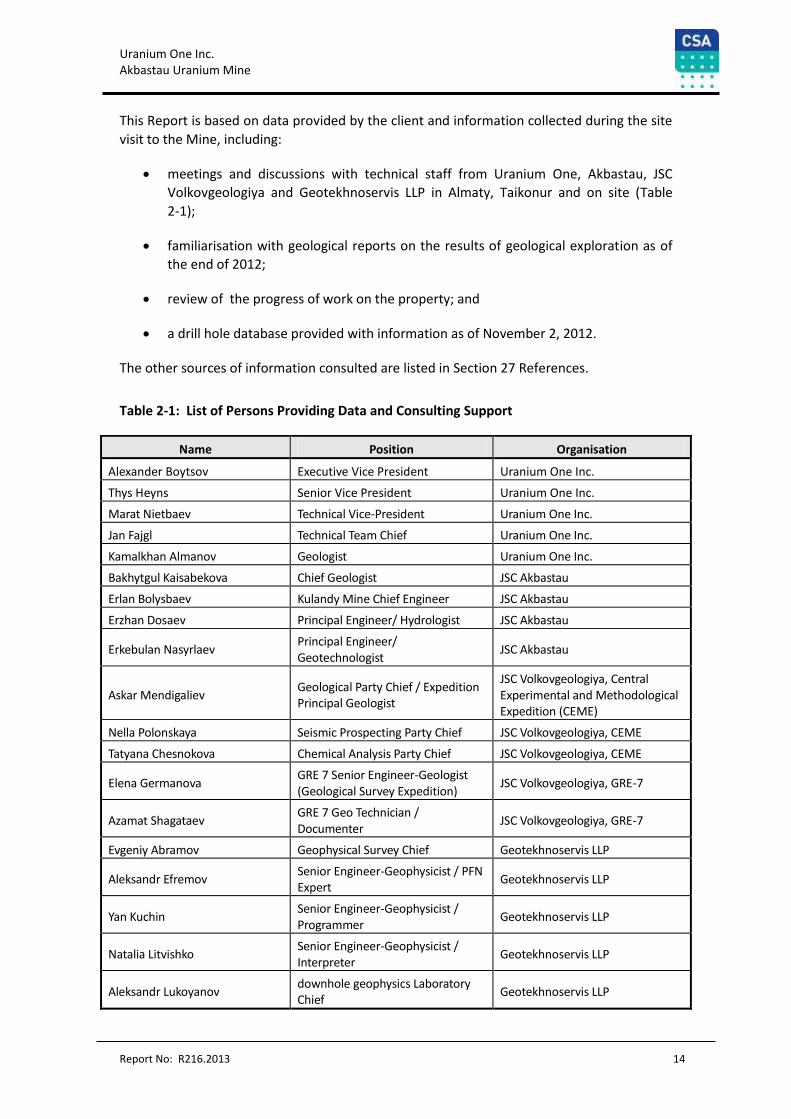
This Report is based on data provided by the client and information collected during the site
visit to the Mine, including:
meetings and discussions with technical staff from Uranium One, Akbastau, JSC
Volkovgeologiya and Geotekhnoservis LLP in Almaty, Taikonur and on site (Table
2-1);
familiarisation with geological reports on the results of geological exploration as of
the end of 2012;
review of the progress of work on the property; and
a drill hole database provided with information as of November 2, 2012.
The other sources of information consulted are listed in Section 27 References.
Table 2-1: List of Persons Providing Data and Consulting Support
Name Position Organisation
Alexander Boytsov Executive Vice President Uranium One Inc.
Thys Heyns Senior Vice President Uranium One Inc.
Marat Nietbaev Technical Vice-President Uranium One Inc.
Jan Fajgl Technical Team Chief Uranium One Inc.
Kamalkhan Almanov Geologist Uranium One Inc.
Bakhytgul Kaisabekova Chief Geologist JSC Akbastau
Erlan Bolysbaev Kulandy Mine Chief Engineer JSC Akbastau
Erzhan Dosaev Principal Engineer/ Hydrologist JSC Akbastau
Erkebulan Nasyrlaev Principal Engineer/ Geotechnologist
JSC Akbastau
Askar Mendigaliev Geological Party Chief / Expedition Principal Geologist
JSC Volkovgeologiya, Central Experimental and Methodological Expedition (CEME)
Nella Polonskaya Seismic Prospecting Party Chief JSC Volkovgeologiya, CEME
Tatyana Chesnokova Chemical Analysis Party Chief JSC Volkovgeologiya, CEME
Elena Germanova GRE 7 Senior Engineer-Geologist (Geological Survey Expedition)
JSC Volkovgeologiya, GRE-7
Azamat Shagataev GRE 7 Geo Technician / Documenter
JSC Volkovgeologiya, GRE-7
Evgeniy Abramov Geophysical Survey Chief Geotekhnoservis LLP
Aleksandr Efremov Senior Engineer-Geophysicist / PFN Expert
Geotekhnoservis LLP
Yan Kuchin Senior Engineer-Geophysicist / Programmer
Geotekhnoservis LLP
Natalia Litvishko Senior Engineer-Geophysicist / Interpreter
Geotekhnoservis LLP
Aleksandr Lukoyanov downhole geophysics Laboratory Chief
Geotekhnoservis LLP
Uranium One Inc. Akbastau Uranium Mine
Report No: R216.2013 15
Nurtas Makhanov Chief of Geophysical Division No4 Geotekhnoservis LLP
Bakhtiyar Makhanov Principal Geophysicist of Geophysical Division No4
Geotekhnoservis LLP
Uranium One Inc. Akbastau Uranium Mine
Report No: R216.2013 16
3 Reliance on Other Experts
This Report was prepared based on:
Geological reports, initial geological and other technical data supplied by Uranium
One;
Interviews with staff from Uranium One, Akbastau, JSC Volkovgeologiya and
Geotekhnoservis LLP; and
Observations made by CSA during visits to the Mine and assaying laboratories.
For the purpose of this Report, CSA has relied on ownership information provided by
Uranium One. CSA has not researched property title or mineral rights for the Mine and
expresses no opinion as to the ownership status of the property.
CSA has relied on Uranium One for guidance on applicable taxes, royalties, and other
government levies or interests, applicable to revenue or income from the Mine.
CSA performed an estimate of Mineral Resources and Mineral Reserves based on
mineralized intervals taking into account the influence of radiological factors calculated by
local experts (the experts are listed in Table 2-1; the radiological factors are discussed in
11.3.1 Gamma-Ray Logging). CSA carefully checked geological exploration and data
interpretation methodologies.
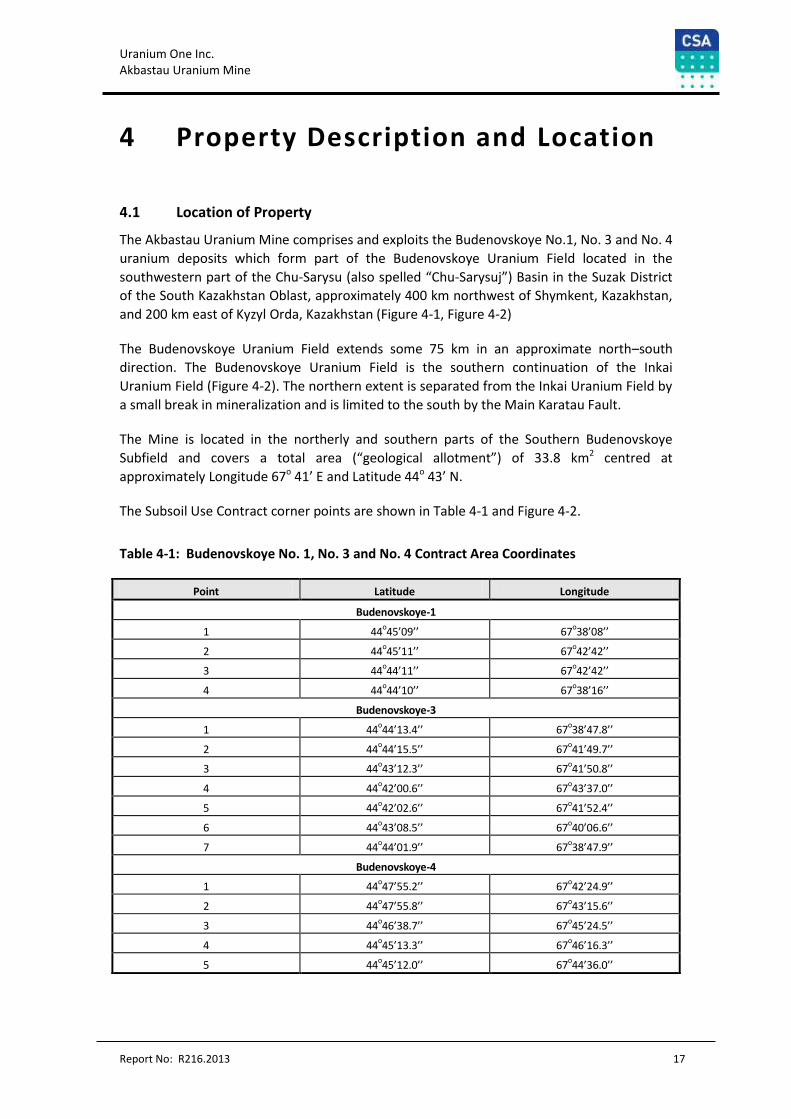
Uranium One Inc. Akbastau Uranium Mine
Report No: R216.2013 17
4 Property Description and Location
4.1 Location of Property
The Akbastau Uranium Mine comprises and exploits the Budenovskoye No.1, No. 3 and No. 4
uranium deposits which form part of the Budenovskoye Uranium Field located in the
southwestern part of the Chu-Sarysu (also spelled “Chu-Sarysuj”) Basin in the Suzak District
of the South Kazakhstan Oblast, approximately 400 km northwest of Shymkent, Kazakhstan,
and 200 km east of Kyzyl Orda, Kazakhstan (Figure 4-1, Figure 4-2)
The Budenovskoye Uranium Field extends some 75 km in an approximate north–south
direction. The Budenovskoye Uranium Field is the southern continuation of the Inkai
Uranium Field (Figure 4-2). The northern extent is separated from the Inkai Uranium Field by
a small break in mineralization and is limited to the south by the Main Karatau Fault.
The Mine is located in the northerly and southern parts of the Southern Budenovskoye
Subfield and covers a total area (“geological allotment”) of 33.8 km2 centred at
approximately Longitude 67o 41’ E and Latitude 44o 43’ N.
The Subsoil Use Contract corner points are shown in Table 4-1 and Figure 4-2.
Table 4-1: Budenovskoye No. 1, No. 3 and No. 4 Contract Area Coordinates
Point Latitude Longitude
Budenovskoye-1
1 44o45’09’’ 67
o38’08’’
2 44o45’11’’ 67
o42’42’’
3 44o44’11’’ 67
o42’42’’
4 44o44’10’’ 67
o38’16’’
Budenovskoye-3
1 44o44’13.4’’ 67
o38’47.8’’
2 44o44’15.5’’ 67
o41’49.7’’
3 44o43’12.3’’ 67
o41’50.8’’
4 44o42’00.6’’ 67
o43’37.0’’
5 44o42’02.6’’ 67
o41’52.4’’
6 44o43’08.5’’ 67
o40’06.6’’
7 44o44’01.9’’ 67
o38’47.9’’
Budenovskoye-4
1 44o47’55.2’’ 67
o42’24.9’’
2 44o47’55.8’’ 67
o43’15.6’’
3 44o46’38.7’’ 67
o45’24.5’’
4 44o45’13.3’’ 67
o46’16.3’’
5 44o45’12.0’’ 67
o44’36.0’’
Uranium One Inc. Akbastau Uranium Mine
Report No: R216.2013 18
4.2 Obligations and Royalties
In Kazakhstan, the grant of rights for the exploration and mining of minerals takes the form
of a Subsoil Use Contract. Such a contract results from negotiations between the
Government of the Republic of Kazakhstan and the deposit operator.
The contract defines the area to which the rights apply and defines a work program for the
exploration and mining development of the property, including the mine production plan.
The contract validity period can be extended by mutual agreement of the parties; other,
terms and conditions can be amended by written agreement between the parties. The
contract can be terminated at the Ministry of Industry and New Technologies’ (“MINT”) sole
discretion if the operator fails to fulfil any of the contract terms and conditions on more than
two occasions and does not remedy a failure within a period specified by MINT. Additionally,
the contract can be modified and/or terminated at MINT’s sole discretion if the actions of
the subsoil user might result in significant negative influence on the economic interests of
Kazakhstan and/or represents a potential threat to national security, or if the operator
braches the government’s pre-emptive rights to the minerals, or fails to obtain the consent
of the relevant authorities to any transfer of subsoil use rights or the ownership of the
entities holding such rights.
The contract stipulates that if any disagreements arise which cannot be resolved by
negotiation between the parties, they shall be submitted to the courts of the Republic of
Kazakhstan, and not to independent international bodies of arbitration.
The Government of Kazakhstan possesses certain statutory pre-emptive rights to: (i)
purchase and requisition uranium from subsoil users at prices not exceeding world market
prices; (ii) purchase subsoil use rights or equity interests in entities holding such rights if the
same are put up for sale; and (iii) terminate, in certain circumstances, the Subsoil Use
Contracts. In addition, on August 23, 2012, uranium subsoil use rights in Kazakhstan owned
by non-state entities were designated as “strategic assets”, which means that they cannot
be encumbered or alienated without the prior approval of the Government of Kazakhstan. If
an owner of strategic assets intends to sell them, the Government of Kazakhstan has a pre-
emptive right to purchase such assets at market value, determined in accordance with
Kazakh law.
A subsoil use contract gives the contractor a right to use the surface of the property while
exploring, mining and reclaiming the land. However, such right must be set forth in a surface
lease agreement with the applicable local administrative authority (Akimat). A surface lease
agreement must be entered for the same period of time as the relevant underlying subsoil
use contract including any extensions. Akbastau has a surface lease agreement with the local
Akimat.
Mineral producers in Kazakhstan are subject to, among other taxes such as corporate, excess
profits and dividend withholding taxes, to a mineral extraction tax ("MET") which is not
based on net income but rather calculated according to a formula related to the cost of
production. The MET statutory rate was originally set at 22% for 2011 and 2012, but was
then retroactively amended on January 1, 2013 to 17.5% for the years 2009 to 2012. The
retroactive amendment also modified the formula used to calculate the MET payable from
2009. The basis change and the decrease in the MET rate resulted in an immaterial increases
Uranium One Inc. Akbastau Uranium Mine
Report No: R216.2013 19
to the MET payable for the relevant years. The MET rate for 2013 and subsequent years is
18.5%. Amounts paid in respect of MET form part of the cash cost per pound sold.
Under the Contract, Akbastau is required to reimburse the Government of Kazakhstan for
historical costs in quarterly payments of $3,535 ($14,140 each year) through to the end of
2015. The payments due to date have been paid as required. The Contract also imposes on
Akbastau various social obligations for the benefit of its employees. These social obligations
include investing at least 1% of Akbastau’s operating expenses per annum in training
programs for its Kazakh employees and spending at least $150,000 per annum for regional
social programs.
4.3 Permits Required
Additional permits are also required to operate a mine in Kazakhstan, but the applicable
Subsoil Use Contract is the key permit. Other permits and licences required for the operation
of the Mine include:
Confirmation of the emergency plans by the Committee of MEMR for State Control
and Supervision of Emergency Situations on June 10, 2005;
Permission for the surface use (for the placement and construction of operational
facilities) and the removal of uranium from the site, awarded on March 1, 2007;
A licence for the use of dangerous substances (“precursors”), awarded on June 6,
2006;
A water licence, awarded by Shu-Thalaas Direction on May 29, 2006;
A land use permit (No. 297021091), awarded on May 29, 2006, by the Land
Resources Department of Suzaksky District of South Kazakhstan Oblast; and
A permit issued by the Committee of Nuclear Energy for the development,
production, closure, and rehabilitation of the operation, including ISR operation,
concentrate production, radioactive waste handling, use of radioactive sources for
process controls, use of X-ray fluorescence spectrography equipment, and assay
laboratory, awarded on August 2, 2007.
4.4 Environmental Liabilities
The Mine is subject to the environmental obligations imposed by the laws of the Republic of
Kazakhstan on mines generally, including the obligation to reclaim all surface disturbances
and remove all process facilities once the Mine has ceased operations at the end of the
Contract term. The Contract also requires Akbastau to contribute to a reclamation fund each
year. The amount contributed was US$8.0 million in 2012 (of which 50% was attributable to
Uranium One).
Uranium One Inc. Akbastau Uranium Mine
Report No: R216.2013 20
4.5 Mineral Tenure
Akbastau holds two Subsoil Use Contracts, one over the Budenovskoye No.1 deposit, and
one over the Budenovskoye No. 3 and Budenovskoye No. 4 deposits.
4.5.1 Budenovskoye No.1
On 20 November, 2007, Kazatomprom concluded a Subsoil Use Contract No. 2488 (the “Area
1 Contract”) with the Ministry of Energy and Mineral Resources (MEMR1, currently known as
Ministry of Industry and New Technologies (MINT)) of the Republic of Kazakhstan.
In accordance with the Area 1 Contract, Kazatomprom gained the uranium exploration and
mining rights over of the Budenovskoye No. 1 deposit. The Contract is valid for a period of
30 years, which includes 5 years of exploration and 25 years of mining uranium.
Pursuant to Addendum 1 (dated 18 January 2008), Kazatomprom transferred all its rights
and liabilities specified in the Area 1 Contract to Akbastau.
The area covered by the Area 1 Contract comprises 11.0 km2. Its corner points are given in
Table 4-1 and Figure 4-3.
4.5.2 Budenovskoye No. 3 and 4
On 20 November, 2007 NAC Kazatomprom concluded a Subsoil Use Contract No. 2487 (the
“Area 3 & 4 Contract”) with the then MEMR.
In accordance with the Area 3 & 4 Contract, Kazatomprom gained the uranium exploration
and mining rights over the Budenovskoye No.3 and Budenovskoye No.4 deposits. The
contract is valid for a period of 31 years, which includes 6 years of exploration and 25 years
of mining uranium.
Pursuant to Addendum 1 (dated 18 January 2008), Kazatomprom transferred all its rights
and liabilities specified in the Area 3 & 4 Contract to Akbastau.
The area covered by the Area 3 & 4 Contract comprises Licence area comprises 12.0 km2 for
the Budenovskoye No. 3 deposit, and 10.8 km2 for the Budenovskoye No. 4 deposit. The
corner points of the Area 3 & 4 Contract are given in Table 4-1 and Figure 4-3.
1 The MEMR was dissolved in March 2010 and its responsibilities with respect to all matters
relating to power generation, mining, and the nuclear industry were transferred to a new
body, the Ministry of Industry and New Technologies (MINT). All references to the MEMR in
this Report include the MINT for all matters from and after March 2010.
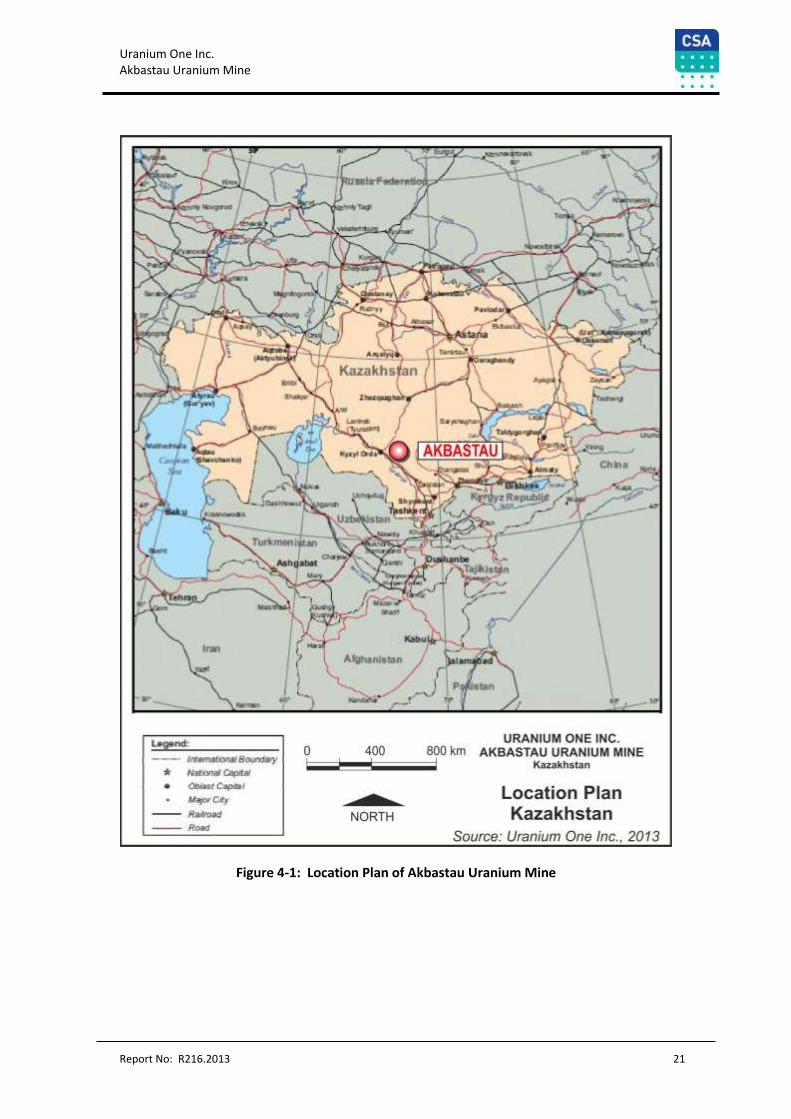
Uranium One Inc. Akbastau Uranium Mine
Report No: R216.2013 21
Figure 4-1: Location Plan of Akbastau Uranium Mine
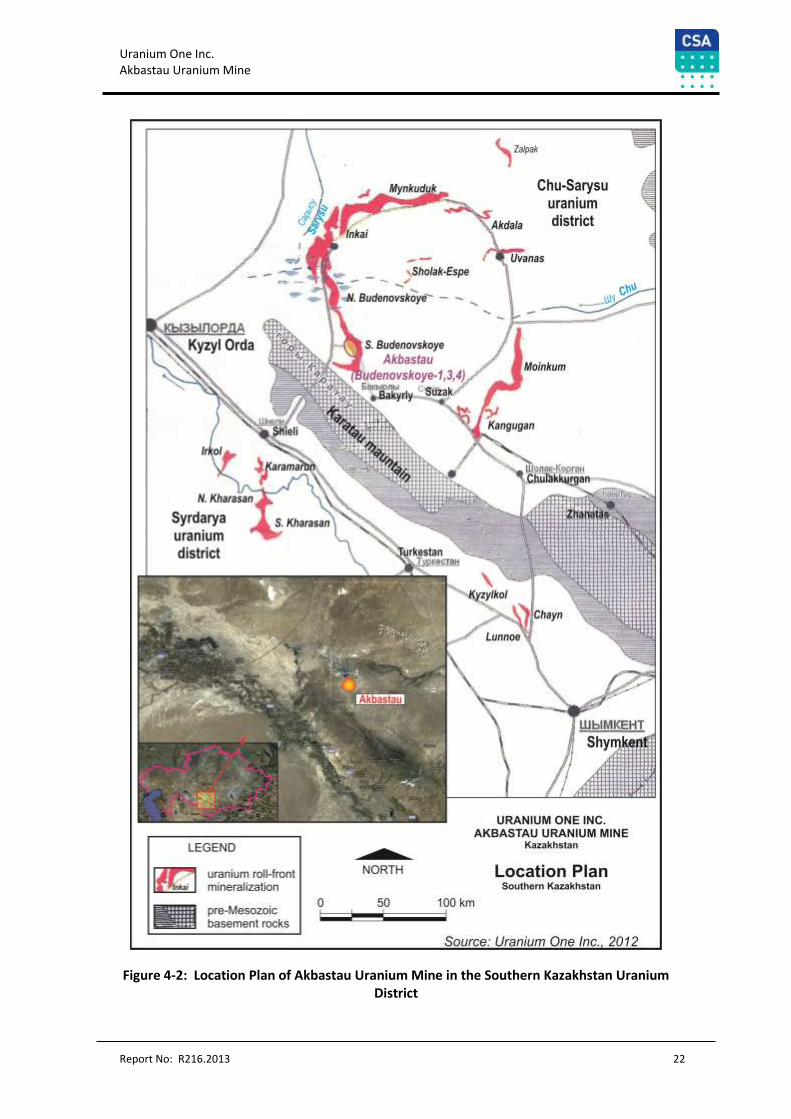
Uranium One Inc. Akbastau Uranium Mine
Report No: R216.2013 22
Figure 4-2: Location Plan of Akbastau Uranium Mine in the Southern Kazakhstan Uranium District
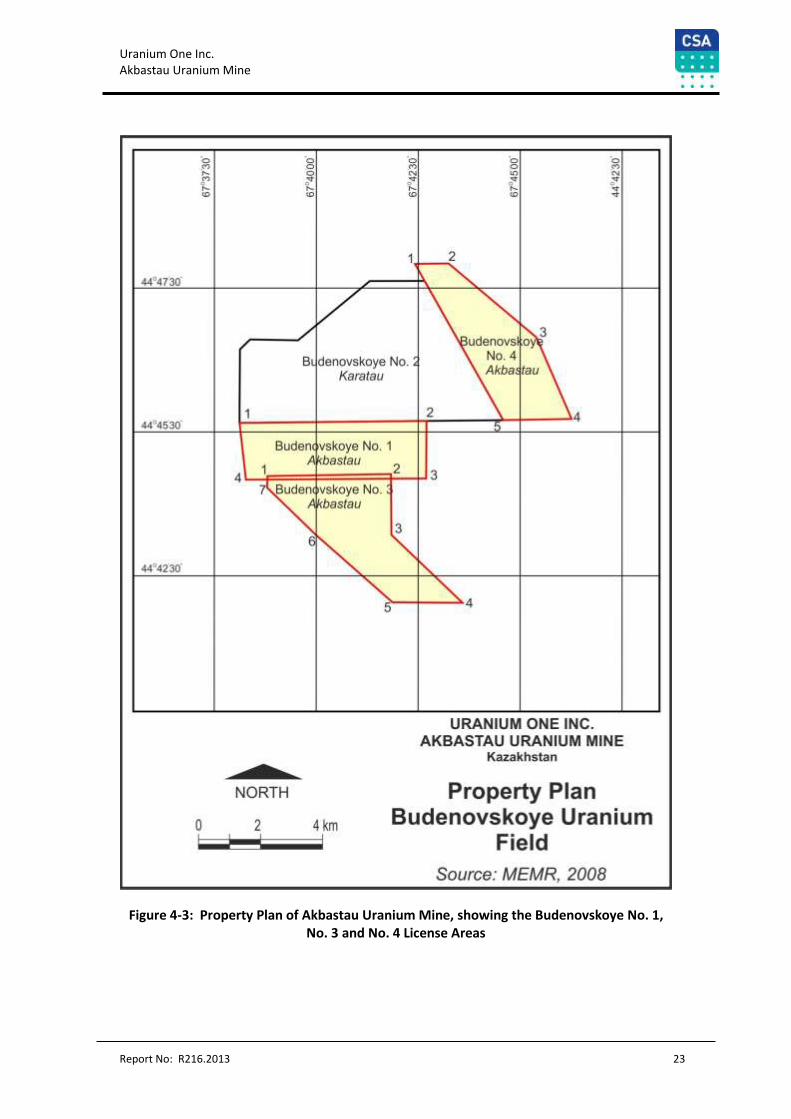
Uranium One Inc. Akbastau Uranium Mine
Report No: R216.2013 23
Figure 4-3: Property Plan of Akbastau Uranium Mine, showing the Budenovskoye No. 1, No. 3 and No. 4 License Areas
Uranium One Inc. Akbastau Uranium Mine
Report No: R216.2013 24
5 Accessibility, Climate, Local Resources, Infrastructure and Physiography
5.1 Accessibility
The Mine area is located approximately 10 km to the east of the Karatausky–Taikonur gravel
road, approximately 40 km north of Aksumbe. The nearest town approximately 50 km by
road to the north is Taikonur, the headquarters of the 7th Unit of Volkov Geological and
Mining Company (Volkovgeologia), a subsidiary of Kazatomprom. The closest airports with
scheduled local services are at Kyzyl Orda and Shymkent, at approximately 200 km west and
400 km southeast, respectively, from the Mine. The majority of supplies are transported to
site via road from the rail head at Suzak, 120 km away; however, the nearest rail line is at
Shieli approximately 90 km from the Mine.
Other deposits under development near the Mine include Inkai (40 km away), Mynkuduk
(120 km away), Akdala (140 km away), Zhalpak (180 km away), Uvanas (160 km away),
Kanzhugan and Moinkum (both 170 km away) (Figure 4-2). The Karatau Uranium Mine is
adjacent to the Mine.
5.2 Climate and Physiography
The Mine is located on a flat piedmont plain adjoining the Karatau Mountains. The plain is
characterised by takyrs, deflation basins, rare dome elevations and solonchaks or salt
marshes. Absolute elevations are 125-310 m.
The intermittent Shu River flows in the flood period only (May-June). The river then dries to
form disconnected ponds of salty water and is not therefore a reliable source of water.
The climate of the region is classified as continental and is characterised by considerable
annual and daily temperature variations. The winters are cold, with minimum temperatures
below –35оС (January). The summers are hot, with maximum temperatures above 43оС
(June-July).
The area has limited precipitation, with average annual precipitation of 130-140 mm. The
average air humidity is 56-59%.
Strong persistent winds are typical for the region and dust storms are frequent. Average
annual calm periods do not exceed 17%. The prevailing wind direction is northeastern and
eastern with an average speed of 3.8-4.6 m/sec.
The climatic conditions are such that the exploration, mining, and processing operations can
continue year round. The climate does not unduly affect production, although during
Uranium One Inc. Akbastau Uranium Mine
Report No: R216.2013 25
extreme cold, if the solutions are not continually pumped, there is the potential to freeze
solution in the pipes and a loss of production may occur until the solution can be thawed.
Vegetation consists of saxaul and solonchak-boyalych (Salsola arbuscula) plant complexes.
Flood plains of the Sarysu and Shu rivers are covered with meadow vegetation, including
bulrush and tamarisk.
The area has a diverse mix of fauna including saiga (antelope), goitred gazelle, wolves, foxes,
corsac foxes, wild pigs, and small-size mammals such as ground squirrels, jerboas,
sandlances, and five-toed jerboas. Poisonous scorpions, camel spiders, and widow spiders
can also be found here.
5.3 Local Resources and Infrastructure
There are no local resources as the Mine is located approximately 50 km from the nearest
medium sized town (Taikonur). Employees are transported from communities around the
Mine and from larger centres and work on a rotating shift basis at the Mine. Supplies are
obtained from larger centres and brought to the site by truck.
The area is reasonably serviced with infrastructure, which has been developed to support
uranium mining in the district. There are multiple roads (paved and unpaved) that connect
the main settlements in the area.
Road is the main means of freight transportation (Figure 4-2). The nearest railroad stations
are Kyzyl Orda (200 km from the Mine), Shieli (170 km from the Mine) and Suzak (120 km
away).
Electrical power for the Mine is provided by Power Line-110, which runs along the Pavlodar-
Shymkent gas pipeline, 140 km northeastward from the property.
Artesian basins provide water for both human consumption and industry. Drinking water is
drawn from the Paleocene aquifer complex with salinity levels of 0.7-1.0 g/l. Processing
water is drawn from the Cretaceous aquifer complex with salinity levels of 1-5.0 g/l.
Uranium One Inc. Akbastau Uranium Mine
Report No: R216.2013 26
6 History
6.1 Geological Study
Until the mid-1950s geological exploration in the southwestern part of Chu-Sarysu region,
which includes the Budenovskoye No. 2 deposit, was limited to minor drilling. Geological
mapping of the area was completed at a scale of 1:500 000. A number of major artesian
basins were identified at this time and preliminary data on hydrodynamic parameters was
collected.
From the mid-1950s until the late 1960s, the Chu-Sarysu region was systematically explored
for uranium. A state geological map was completed at a scale of 1:200 000 and the area was
evaluated for a number of commodities, including oil and gas. Surveying was accompanied
by drilling in the Mesozoic-Cenozoic basin and by hydrogeological studies, which made it
possible to map the aquifer complexes and artesian basins.
During the same period, and covering the entire region, the Volkov Expedition explored
specifically for uranium. The work was aimed at assessing uranium mineralization prospects
within Mesozoic-Cenozoic sediments and defining prospective areas for commercial uranium
deposits. The work was successful and located a number of prospective areas of uranium
mineralization in the Mesozoic–Cenozoic basin sediments.
By the end of 1970s, the controls on uranium mineralization within the Chu-Sarysu region
were reasonably understood. Systematic investigation of litho-facies and hydrochemical
characteristics of the rocks showed that uranium mineralization was linked to development
of regional zones of tabular oxidation in permeable Cretaceous-Paleogene deposits. It was
recognised that the uranium mineralization was related to the change in oxidation states
within the sediments.
The Budenovskoye Uranium Field was discovered in 1979 by the Volkov Expedition, as part
of the same exploration work that delineated multiple deposits including Uvanas, Zhalpak,
Kanzhugan, Mynkuduk, and Inkai, which formed a new large uranium-mineralized region in
the Chu-Sarysu depression.
From 1984 through to 1986, Expedition No 5 completed regional exploration drilling on a 6.4
- 1.6 km х 0.1 km grid on a 50 km2 area which included the Budenovskoye No. 2 deposit.
Drilling to 700 m depth encountered economic uranium mineralization in all productive
horizons of the Upper Cretaceous beds.
From 1987 through 1989, Expedition No 5 completed prospect evaluation work in the
southern part of the Budenovskoye Uranium Field, and identified areas of uranium
mineralization classified as Р1 and Р2 using the GKZ classification system (this is the system
developed by the Russian State Commission on Mineral Resources, and commonly used
countries of the former Soviet Union).
During the same period (1987-1989), Expedition No 7 was undertaking exploration drilling in
the northern part of the uranium field, near the southern boundary of the Inkai deposit.
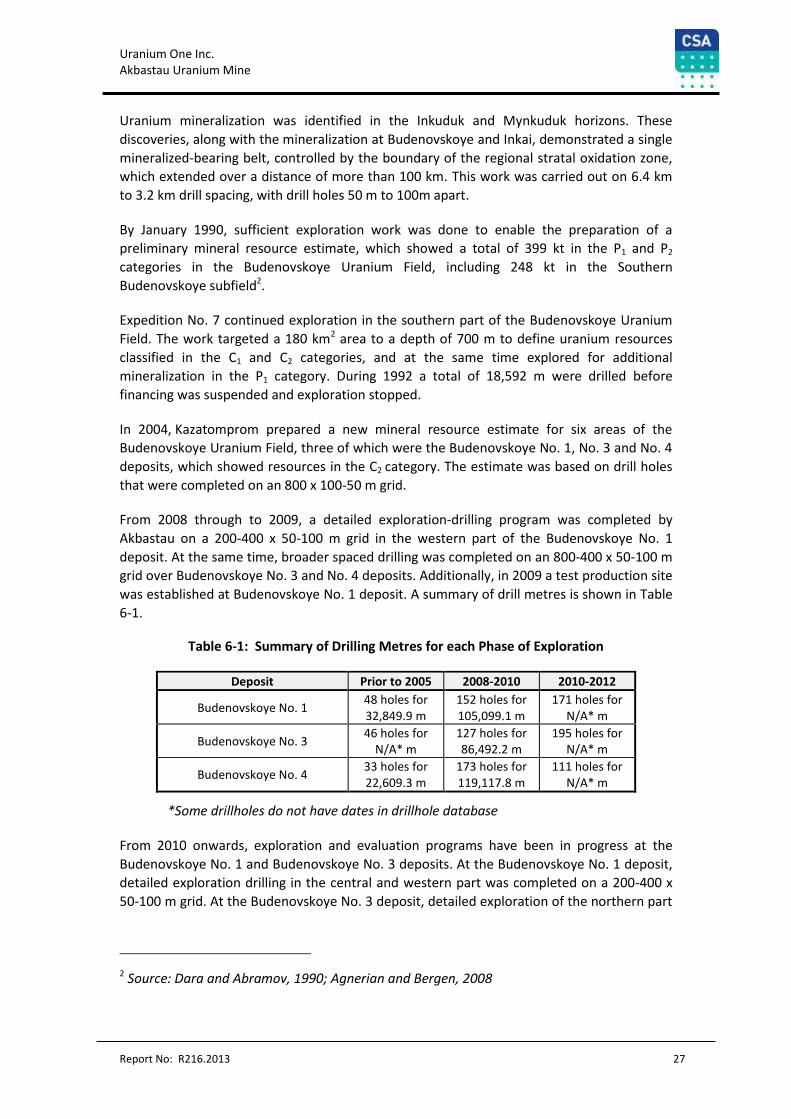
Uranium One Inc. Akbastau Uranium Mine
Report No: R216.2013 27
Uranium mineralization was identified in the Inkuduk and Mynkuduk horizons. These
discoveries, along with the mineralization at Budenovskoye and Inkai, demonstrated a single
mineralized-bearing belt, controlled by the boundary of the regional stratal oxidation zone,
which extended over a distance of more than 100 km. This work was carried out on 6.4 km
to 3.2 km drill spacing, with drill holes 50 m to 100m apart.
By January 1990, sufficient exploration work was done to enable the preparation of a
preliminary mineral resource estimate, which showed a total of 399 kt in the P1 and P2
categories in the Budenovskoye Uranium Field, including 248 kt in the Southern
Budenovskoye subfield2.
Expedition No. 7 continued exploration in the southern part of the Budenovskoye Uranium
Field. The work targeted a 180 km2 area to a depth of 700 m to define uranium resources
classified in the С1 and С2 categories, and at the same time explored for additional
mineralization in the P1 category. During 1992 a total of 18,592 m were drilled before
financing was suspended and exploration stopped.
In 2004, Kazatomprom prepared a new mineral resource estimate for six areas of the
Budenovskoye Uranium Field, three of which were the Budenovskoye No. 1, No. 3 and No. 4
deposits, which showed resources in the С2 category. The estimate was based on drill holes
that were completed on an 800 х 100-50 m grid.
From 2008 through to 2009, a detailed exploration-drilling program was completed by
Akbastau on a 200-400 х 50-100 m grid in the western part of the Budenovskoye No. 1
deposit. At the same time, broader spaced drilling was completed on an 800-400 x 50-100 m
grid over Budenovskoye No. 3 and No. 4 deposits. Additionally, in 2009 a test production site
was established at Budenovskoye No. 1 deposit. A summary of drill metres is shown in Table
6-1.
Table 6-1: Summary of Drilling Metres for each Phase of Exploration
Deposit Prior to 2005 2008-2010 2010-2012
Budenovskoye No. 1 48 holes for 32,849.9 m
152 holes for 105,099.1 m
171 holes for N/A* m
Budenovskoye No. 3 46 holes for
N/A* m
127 holes for 86,492.2 m
195 holes for N/A* m
Budenovskoye No. 4 33 holes for 22,609.3 m
173 holes for 119,117.8 m
111 holes for N/A* m
*Some drillholes do not have dates in drillhole database
From 2010 onwards, exploration and evaluation programs have been in progress at the
Budenovskoye No. 1 and Budenovskoye No. 3 deposits. At the Budenovskoye No. 1 deposit,
detailed exploration drilling in the central and western part was completed on a 200-400 х
50-100 m grid. At the Budenovskoye No. 3 deposit, detailed exploration of the northern part
2 Source: Dara and Abramov, 1990; Agnerian and Bergen, 2008
Uranium One Inc. Akbastau Uranium Mine
Report No: R216.2013 28
was completed on a 200-400 х 50-100 m grid and preliminary exploration was completed on
a 400-800 x 50-100 m grid targeting prospective geology.
The Budenovskoye No. 4 deposit was explored from 2010 onwards, but in lesser detail. First
pass drilling on a 400-800 х 50-100 m grid and more detailed drilling on a 200-400 х 50-100
m grid in the northern part was completed.
6.2 Ownership
Prior to 2007 – unallocated
2007 – Area 1 and Area 3 & 4 Subsoil Use Contracts granted to Kazatomprom.
2008 – Ownership of the project was transferred to Akbastau (50% Kazatomprom, 25%
Effective Energy N.V. and JSC Atomredmetzoloto (“ARMZ”) 25%) in accordance with
Addendum 1 Area 1 and Area 3 & 4 Subsoil Use Contracts.
2009 – ARMZ acquired Effective Energy, so that Akbastau is 50% owned by Kazatomprom
and 50% by ARMZ.
2010 – In exchange for its shares in Uranium One (which increased its interest in Uranium
One to 51%), ARMZ sold its share in the project, so that Akbastau, and therefore the Mine, is
50% owned by Kazatomprom and 50% by Uranium One, indirectly.
6.3 Historical Mineral Resource and Mineral Reserve Estimates
6.3.1 Cautionary Statement
Mineral resources at the Budenovskoye-1, 3 and 4 deposits were previously estimated by
Volkovgeologia in 1990, 2004, and 2010. In CSA’s opinion, these historical mineral resource
estimates are relevant in that they describe significant and possibly economic uranium
mineralization. However, they are not considered reliable as they pre-date NI 43-101, they
have no equivalent in the Canadian Institute of Mining, Metallurgy and Petroleum (“CIM”)
mineral resource and mineral reserve classification system, and the data could not be
verified. No qualified person has done sufficient work to classify the historical estimates as
current Mineral Resources or Mineral Reserves under the CIM classifications, and neither
CSA nor Uranium One is treating the historical estimates as current Mineral Resources or
Mineral Reserves.
The 2004 and 2010 mineral resource estimates were reviewed by Scott Wilson Roscoe Postle
Associated Inc. in the NI 43-101-compliant technical reports prepared by it for Uranium One
and dated October 1, 2008 and March 2, 2010, respectively, and reclassified as Indicated and
Inferred Mineral Resources as defined by CIM. Scott Wilson Roscoe Postle Associated Inc.
prepared additional Mineral Resource and Mineral Reserve estimates to take into account
further exploration work done since 2008, which estimates were reported in the NI 43-101-
compliant technical reports prepared by it for Uranium One and dated July 12, 2010 and
June 6, 2012. Although the 2008, 2010 and 2012 estimates have been classified as Mineral
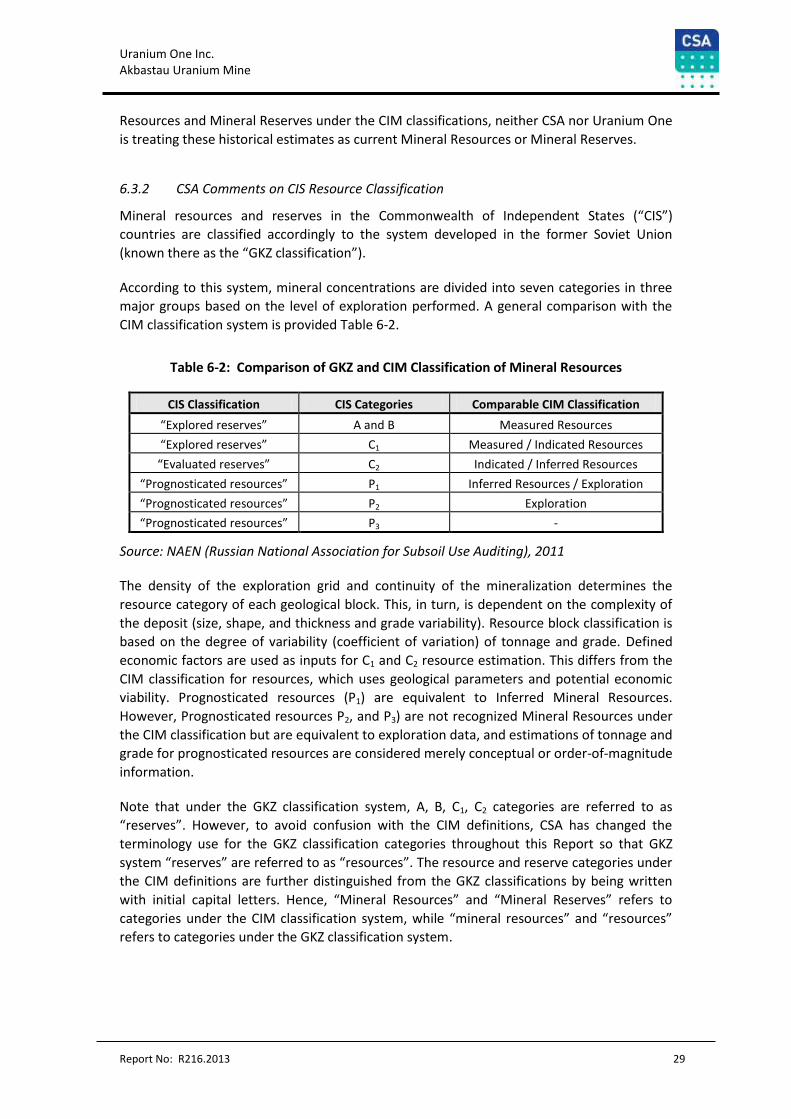
Uranium One Inc. Akbastau Uranium Mine
Report No: R216.2013 29
Resources and Mineral Reserves under the CIM classifications, neither CSA nor Uranium One
is treating these historical estimates as current Mineral Resources or Mineral Reserves.
6.3.2 CSA Comments on CIS Resource Classification
Mineral resources and reserves in the Commonwealth of Independent States (“CIS”)
countries are classified accordingly to the system developed in the former Soviet Union
(known there as the “GKZ classification”).
According to this system, mineral concentrations are divided into seven categories in three
major groups based on the level of exploration performed. A general comparison with the
CIM classification system is provided Table 6-2.
Table 6-2: Comparison of GKZ and CIM Classification of Mineral Resources
CIS Classification CIS Categories Comparable CIM Classification
“Explored reserves” A and B Measured Resources
“Explored reserves” C1 Measured / Indicated Resources
“Evaluated reserves” C2 Indicated / Inferred Resources
“Prognosticated resources” P1 Inferred Resources / Exploration
“Prognosticated resources” P2 Exploration
“Prognosticated resources” P3 -
Source: NAEN (Russian National Association for Subsoil Use Auditing), 2011
The density of the exploration grid and continuity of the mineralization determines the
resource category of each geological block. This, in turn, is dependent on the complexity of
the deposit (size, shape, and thickness and grade variability). Resource block classification is
based on the degree of variability (coefficient of variation) of tonnage and grade. Defined
economic factors are used as inputs for C1 and C2 resource estimation. This differs from the
CIM classification for resources, which uses geological parameters and potential economic
viability. Prognosticated resources (P1) are equivalent to Inferred Mineral Resources.
However, Prognosticated resources P2, and P3) are not recognized Mineral Resources under
the CIM classification but are equivalent to exploration data, and estimations of tonnage and
grade for prognosticated resources are considered merely conceptual or order-of-magnitude
information.
Note that under the GKZ classification system, A, B, C1, C2 categories are referred to as
“reserves”. However, to avoid confusion with the CIM definitions, CSA has changed the
terminology use for the GKZ classification categories throughout this Report so that GKZ
system “reserves” are referred to as “resources”. The resource and reserve categories under
the CIM definitions are further distinguished from the GKZ classifications by being written
with initial capital letters. Hence, “Mineral Resources” and “Mineral Reserves” refers to
categories under the CIM classification system, while “mineral resources” and “resources”
refers to categories under the GKZ classification system.
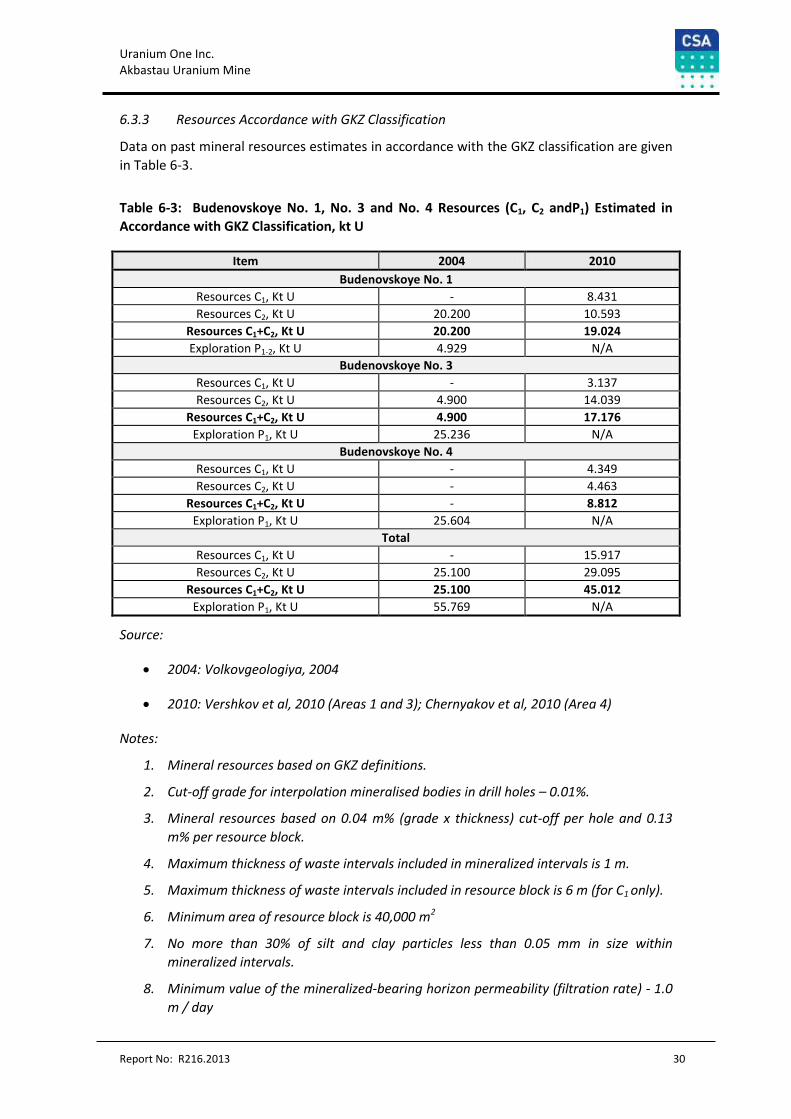
Uranium One Inc. Akbastau Uranium Mine
Report No: R216.2013 30
6.3.3 Resources Accordance with GKZ Classification
Data on past mineral resources estimates in accordance with the GKZ classification are given
in Table 6-3.
Table 6-3: Budenovskoye No. 1, No. 3 and No. 4 Resources (C1, C2 andP1) Estimated in
Accordance with GKZ Classification, kt U
Item 2004 2010
Budenovskoye No. 1
Resources C1, Kt U - 8.431
Resources C2, Kt U 20.200 10.593
Resources C1+C2, Kt U 20.200 19.024
Exploration P1-2, Kt U 4.929 N/A
Budenovskoye No. 3
Resources C1, Kt U - 3.137
Resources C2, Kt U 4.900 14.039
Resources C1+C2, Kt U 4.900 17.176
Exploration P1, Kt U 25.236 N/A
Budenovskoye No. 4
Resources C1, Kt U - 4.349
Resources C2, Kt U - 4.463
Resources C1+C2, Kt U - 8.812
Exploration P1, Kt U 25.604 N/A
Total
Resources C1, Kt U - 15.917
Resources C2, Kt U 25.100 29.095
Resources C1+C2, Kt U 25.100 45.012
Exploration P1, Kt U 55.769 N/A
Source:
2004: Volkovgeologiya, 2004
2010: Vershkov et al, 2010 (Areas 1 and 3); Chernyakov et al, 2010 (Area 4)
Notes:
1. Mineral resources based on GKZ definitions.
2. Cut-off grade for interpolation mineralised bodies in drill holes – 0.01%.
3. Mineral resources based on 0.04 m% (grade x thickness) cut-off per hole and 0.13
m% per resource block.
4. Maximum thickness of waste intervals included in mineralized intervals is 1 m.
5. Maximum thickness of waste intervals included in resource block is 6 m (for C1 only).
6. Minimum area of resource block is 40,000 m2
7. No more than 30% of silt and clay particles less than 0.05 mm in size within
mineralized intervals.
8. Minimum value of the mineralized-bearing horizon permeability (filtration rate) - 1.0
m / day
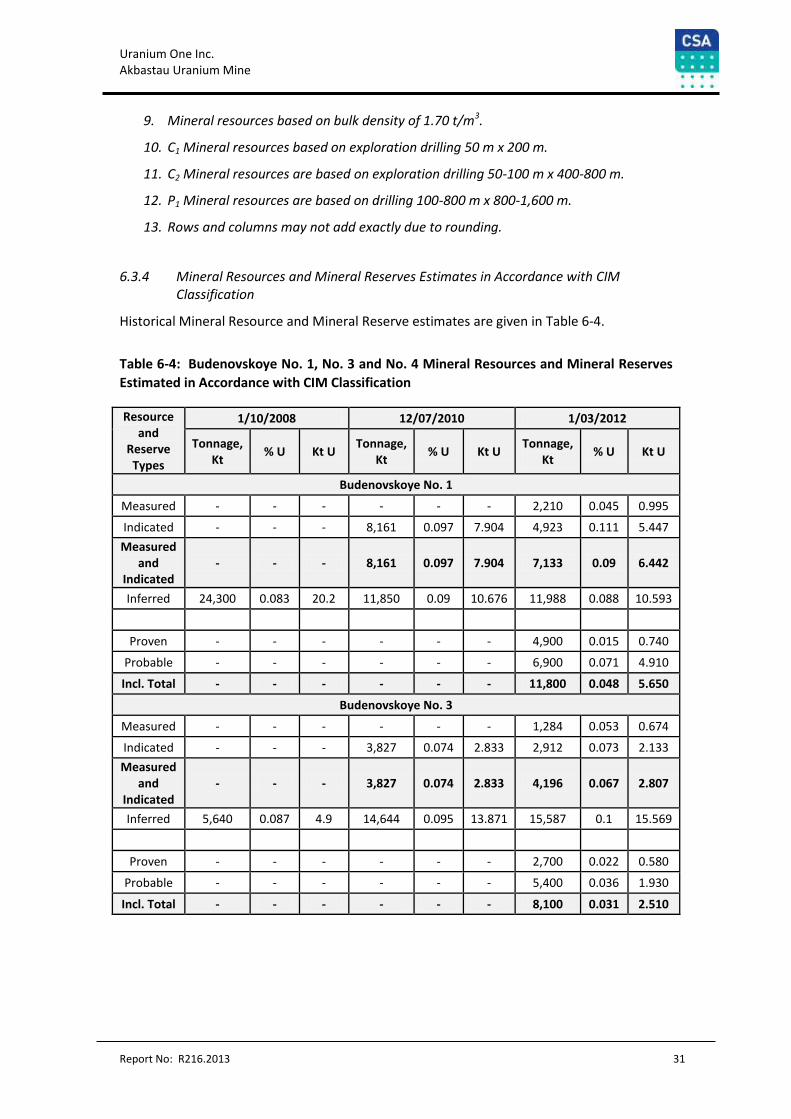
Uranium One Inc. Akbastau Uranium Mine
Report No: R216.2013 31
9. Mineral resources based on bulk density of 1.70 t/m3.
10. C1 Mineral resources based on exploration drilling 50 m x 200 m.
11. C2 Mineral resources are based on exploration drilling 50-100 m x 400-800 m.
12. P1 Mineral resources are based on drilling 100-800 m x 800-1,600 m.
13. Rows and columns may not add exactly due to rounding.
6.3.4 Mineral Resources and Mineral Reserves Estimates in Accordance with CIM Classification
Historical Mineral Resource and Mineral Reserve estimates are given in Table 6-4.
Table 6-4: Budenovskoye No. 1, No. 3 and No. 4 Mineral Resources and Mineral Reserves
Estimated in Accordance with CIM Classification
Resource and
Reserve Types
1/10/2008 12/07/2010 1/03/2012
Tonnage, Kt
% U Kt U Tonnage,
Kt % U Kt U
Tonnage, Kt
% U Kt U
Budenovskoye No. 1
Measured - - - - - - 2,210 0.045 0.995
Indicated - - - 8,161 0.097 7.904 4,923 0.111 5.447
Measured and
Indicated - - - 8,161 0.097 7.904 7,133 0.09 6.442
Inferred 24,300 0.083 20.2 11,850 0.09 10.676 11,988 0.088 10.593
Proven - - - - - - 4,900 0.015 0.740
Probable - - - - - - 6,900 0.071 4.910
Incl. Total - - - - - - 11,800 0.048 5.650
Budenovskoye No. 3
Measured - - - - - - 1,284 0.053 0.674
Indicated - - - 3,827 0.074 2.833 2,912 0.073 2.133
Measured and
Indicated - - - 3,827 0.074 2.833 4,196 0.067 2.807
Inferred 5,640 0.087 4.9 14,644 0.095 13.871 15,587 0.1 15.569
Proven - - - - - - 2,700 0.022 0.580
Probable - - - - - - 5,400 0.036 1.930
Incl. Total - - - - - - 8,100 0.031 2.510
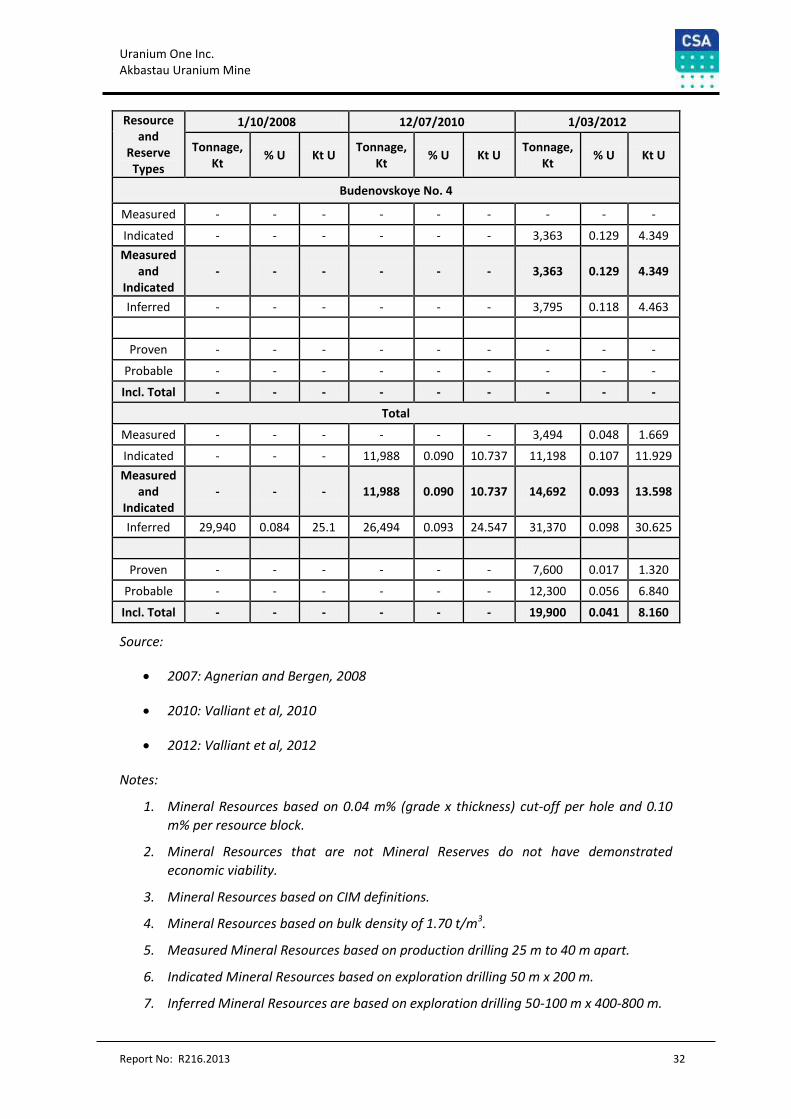
Uranium One Inc. Akbastau Uranium Mine
Report No: R216.2013 32
Resource and
Reserve Types
1/10/2008 12/07/2010 1/03/2012
Tonnage, Kt
% U Kt U Tonnage,
Kt % U Kt U
Tonnage, Kt
% U Kt U
Budenovskoye No. 4
Measured - - - - - - - - -
Indicated - - - - - - 3,363 0.129 4.349
Measured and
Indicated - - - - - - 3,363 0.129 4.349
Inferred - - - - - - 3,795 0.118 4.463
Proven - - - - - - - - -
Probable - - - - - - - - -
Incl. Total - - - - - - - - -
Total
Measured - - - - - - 3,494 0.048 1.669
Indicated - - - 11,988 0.090 10.737 11,198 0.107 11.929
Measured and
Indicated - - - 11,988 0.090 10.737 14,692 0.093 13.598
Inferred 29,940 0.084 25.1 26,494 0.093 24.547 31,370 0.098 30.625
Proven - - - - - - 7,600 0.017 1.320
Probable - - - - - - 12,300 0.056 6.840
Incl. Total - - - - - - 19,900 0.041 8.160
Source:
2007: Agnerian and Bergen, 2008
2010: Valliant et al, 2010
2012: Valliant et al, 2012
Notes:
1. Mineral Resources based on 0.04 m% (grade x thickness) cut-off per hole and 0.10
m% per resource block.
2. Mineral Resources that are not Mineral Reserves do not have demonstrated
economic viability.
3. Mineral Resources based on CIM definitions.
4. Mineral Resources based on bulk density of 1.70 t/m3.
5. Measured Mineral Resources based on production drilling 25 m to 40 m apart.
6. Indicated Mineral Resources based on exploration drilling 50 m x 200 m.
7. Inferred Mineral Resources are based on exploration drilling 50-100 m x 400-800 m.
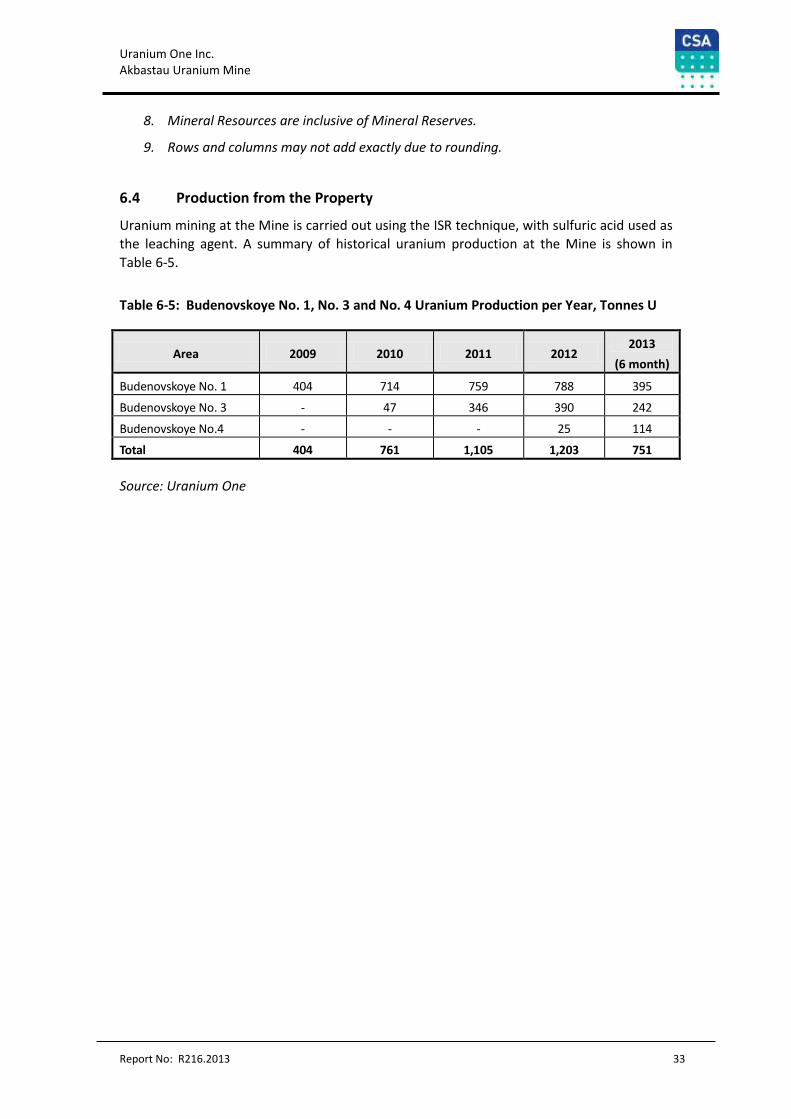
Uranium One Inc. Akbastau Uranium Mine
Report No: R216.2013 33
8. Mineral Resources are inclusive of Mineral Reserves.
9. Rows and columns may not add exactly due to rounding.
6.4 Production from the Property
Uranium mining at the Mine is carried out using the ISR technique, with sulfuric acid used as
the leaching agent. A summary of historical uranium production at the Mine is shown in
Table 6-5.
Table 6-5: Budenovskoye No. 1, No. 3 and No. 4 Uranium Production per Year, Tonnes U
Area 2009 2010 2011 2012 2013
(6 month)
Budenovskoye No. 1 404 714 759 788 395
Budenovskoye No. 3 - 47 346 390 242
Budenovskoye No.4 - - - 25 114
Total 404 761 1,105 1,203 751
Source: Uranium One
Uranium One Inc. Akbastau Uranium Mine
Report No: R216.2013 34
7 Geological Setting and Mineralization
7.1 Regional Geology
The Budenovskoye No. 1, No. 3 and No. 4 deposits are located in the Cretaceous Chu-Sarysu
basin, which extends over an area 250 km wide and 1,000 km long from the foothills of the
Tien Shan Mountains (Figure 7-1). The basin comprises a number of other large uranium
deposits, including Inkai, Mynkuduk, Akdala (Figure 7-1), Kanzhugan, and Moinkum.
The Budenovskoye Uranium Field can be split into three major geological levels. The vertical
section shows the following (Figure 7-2):
A basement of folded Proterozoic and early Paleozoic geosynclinal formations;
An intermediate structural level of lithified sediments formed during the mid-late
Paleozoic; and
A platform cover sequence of unconsolidated Mesozoic-Cenozoic sediments, which
are the host to commercial hydrogenous-type uranium mineralization.
Within the locality of the Budenovskoye Uranium Field, the basement occurs at a depth of
over 2 km.
The intermediate Paleozoic sedimentary deposits outcrop within the northwestern margin of
Big Karatau ridge. However, in the deposit areas they were intersected in drilling at depths
of 540 to 750 m. The depth to these beds tends to shallow towards the Main Karatau Fault.
The sediments are an Early Carboniferous marine terrigenous-carbonate sequence overlain
by continental sediments with a thickness of up to 1,500 m.
Mesozoic-Cenozoic sediments are divided into three units (Figure 7-2):
Jurassic – pre-platform unit;
Cretaceous-Paleogene – platform (mineralization host rocks); and
Neogene-Quarternary – platform-suborogenic.
Pre-platform sediments were encountered in individual drillholes at 580 m depth. These
sediments consist of typical terrigenous molasse of grey siltstones, sandstones with
abundant carbonised plant remains.
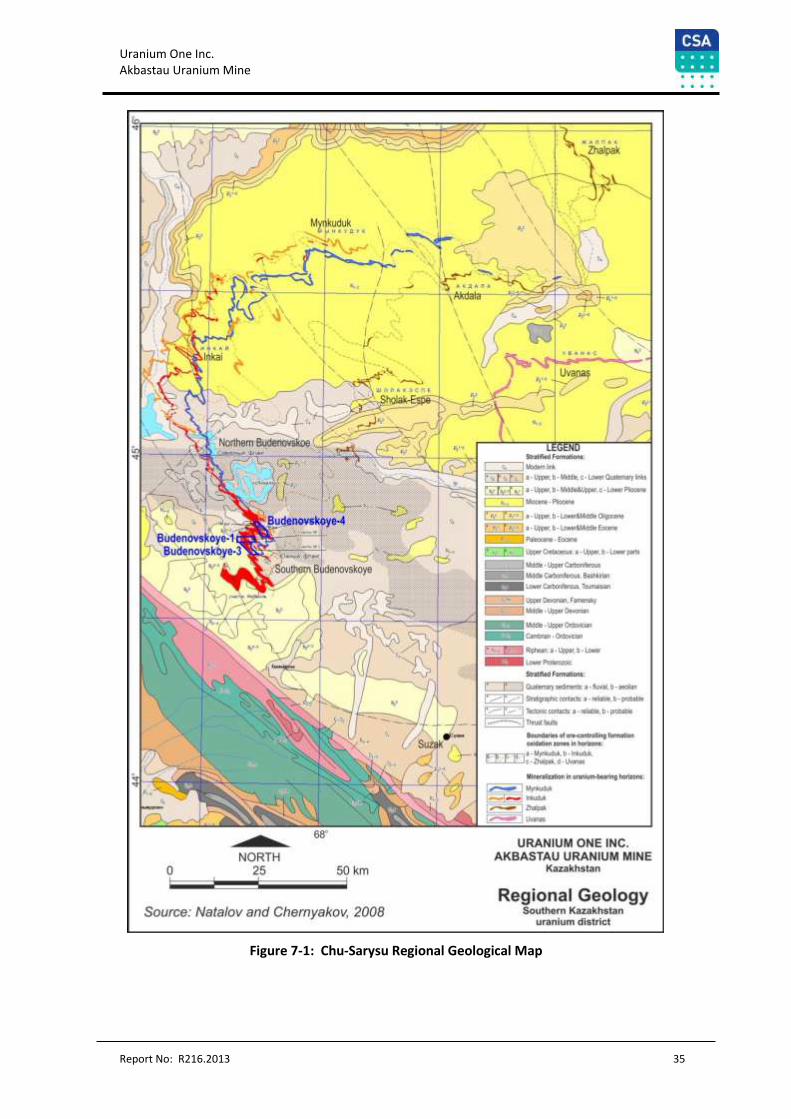
Uranium One Inc. Akbastau Uranium Mine
Report No: R216.2013 35
Figure 7-1: Chu-Sarysu Regional Geological Map
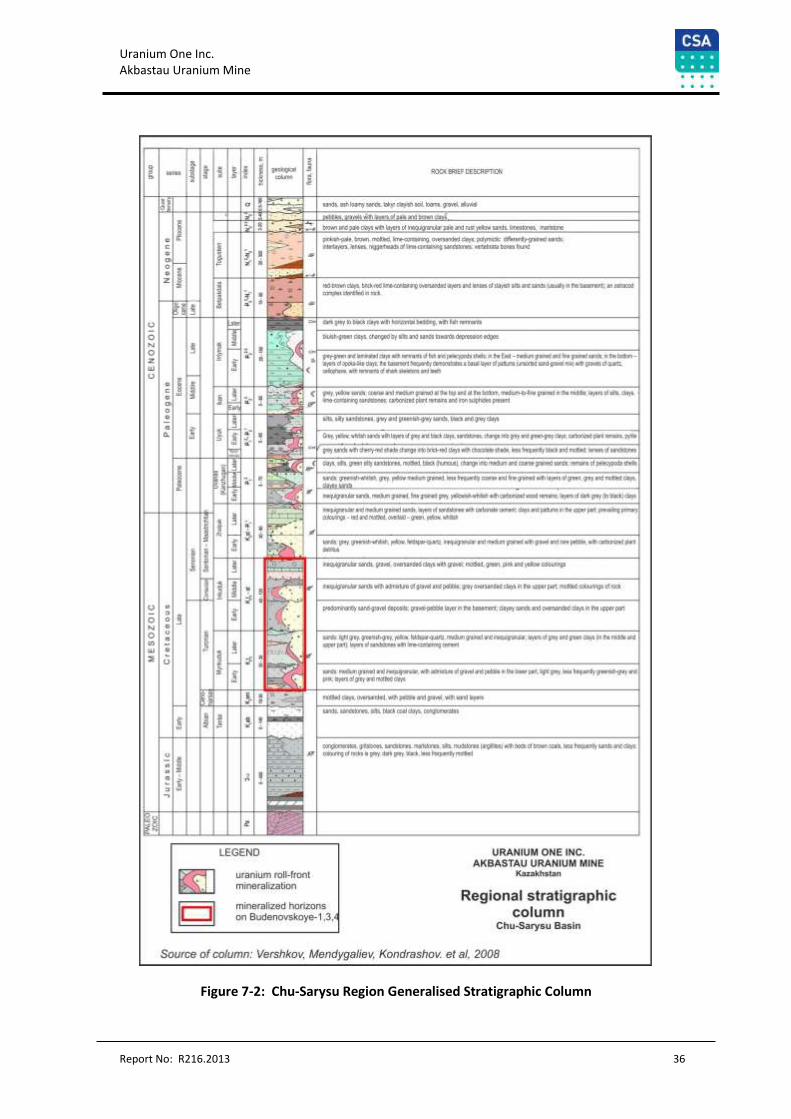
Uranium One Inc. Akbastau Uranium Mine
Report No: R216.2013 36
Figure 7-2: Chu-Sarysu Region Generalised Stratigraphic Column
Uranium One Inc. Akbastau Uranium Mine
Report No: R216.2013 37
The Cretaceous-Paleogene platform unit is comprised of continental terrigenous formations
of the late Cretaceous period and by continental and marine terrigenous formations of the
Paleocene and Eocene periods (Figure 7-2).
Late Cretaceous sediments are subdivided into three independent horizons (Figure 7-2), as
described below:
The Mynkuduk horizon (Early Turonian) is one of the main host rock units for
mineralization in the Budenovskoye Uranium Field, and occurs at depths of 410-790
m and is composed of fine-to-medium grained light grey sands with fine (up to 0.1
m) layers of grey to dark grey silts and clays. Ten to forty percent of the rock volume
is composed of coarse-grained lithologies composed of gravel and pebble beds. The
horizon thickness is 0-30 m. The sediments are oligomictic with membranous and
porous cement (montmorillonite and kaolinite). Carbonate, ferrous and
manganiferous-siderite cement is encountered less frequently. The rocks contain
carbonised organic matter in association with iron sulphides. The hanging wall of the
horizon is characterised by increased clay content as well as an increase in the
number and thickness of clay and silt layers.
The Inkuduk horizon (late Turonian - Cognac-Santonian) also hosts mineralization
and occurs at depths of 330-720 m. The stratigraphy is dominated by poorly-sorted
and coarse-grained sand with layers of fine-medium grained sand and gravel-pebble
units. Coarse-grained rocks comprise up to 30-95% of the total horizon volume.
There are rare thin (up to 0.5 m) layers of dark grey and mottled compacted silts and
clays. In the lower part of the horizon, the rocks are mainly grey, in the middle –
mottled, and in the upper - mottled-grey. There are layers (up to 0.5 m) of
sandstones with carbonaceous cement identified towards the base of the unit. In
their mineralogical properties Inkuduk, rocks do not differ greatly from the
underlying Mynkuduk. The lower boundary is reliably established by the presence of
coarse-grained deposits; however, the upper boundary can be hard to define.
The Zhalpak horizon (Campanian-Maastrichtian to early Paleocene) is composed of
mainly red coloured, less frequently grey-green, medium-grained sands with layers
of coarse sands with gravel and pebble. The lower boundary is sometimes difficult to
determine clearly due to the absence of a clear-cut basal marker bed. The hanging
wall is more distinct due to the onlap of Paleogene grey coloured coastal-marine
formations. Coarse detrital sediments comprise 10-40% of the total volume. The
horizon thickness is 80-120 m. The depth to the upper boundary is 260-670 m below
surface. There are two units clearly identified within the horizon. The lower unit is
composed of well-sorted oligomictic and polymictic medium grained sands with
relatively high grade of carbonized organic matter in association with iron sulphides.
The upper unit is mainly green and mottled sands, gravels, silts and clays that are
often with carbonate cement and contain high manganese. In their mineralogical
composition, the Zhalpak rocks are identical to the sediments of the underlying
horizons.
The Paleogene sediments are represented by continental (Paleocene) and marine (Eocene)
formations.
Uranium One Inc. Akbastau Uranium Mine
Report No: R216.2013 38
Four horizons (bottom-upwards) were distinguished in the Paleogene sequence (Figure 7-2):
Uvanas,
Uyuk,
Ikan and
Intymak.
None of these horizons are mineralized within the Budenovskoye No. 1, No. 3 and No. 4
deposits.
7.2 Local and Property Geology
7.2.1 Geological Structure
Overlying the basement rocks are the Cretaceous sediments that host the uranium
mineralization at the Mine. They are composed of lacustrine-alluvial fine-grained sands to
gravels, and 10% to 20% clays as narrow beds. Locally, the Cretaceous sedimentary horizons
of the Mynkuduk, Inkuduk and the Zhalpak show the following characteristics:
The lowest Mynkuduk horizon is located about 620 m to 730 m below surface and
consists of coarse-grained grey alluvial sediments at the base where the uranium
mineralization is hosted, grading upwards to fine-grained sands. The total thickness
of the Mynkuduk horizon is 40 m to 70 m.
The Inkuduk horizon is composed of basal coarse gravels grading upwards to fine-
grained to medium-grained sands, with interbedded clays. The horizon is 105 m to
130 m thick, and occurs at depths between 530 m and 670 m below surface.
Overlying the Inkuduk horizon, the Zhalpak horizon occurs at typical depths between
470 m and 615 m below surface. The Zhalpak horizon consists of medium-grained
grey to green sands grading upwards to red and brown clays, and is 20 m to 80 m
thick.
The above units meander in plan, in bands 27 km to 67 km long, 50 m to 1,500 m wide, and
0.2 m to 23 m thick. The mineralized bands average 0.5 – 3.5 m thick.
The overlying Palaeogene sediments consist of 140 m to 220 m of grey to green clays and
siltstones overlain by 200 m of Neogene sands and clays. There is up to 60 m of Quaternary
alluvial sands, clays, and loams.
In plan, the mineralized deposits are represented as weaving ribbons of various width and
length per unit area as controlled by the oxidation zone boundary (Figure 7-2). The width of
the deposits may vary from tens of metres to one kilometre, often dependent on the
thickness and frequency of internal confining layers, which complicate the boundary of the
zone of formation oxidation (ZFO) thinning in the stratigraphy. The extended upper limb of a
roll can become complicated by step-wise “sliding” of the geochemical boundary when the
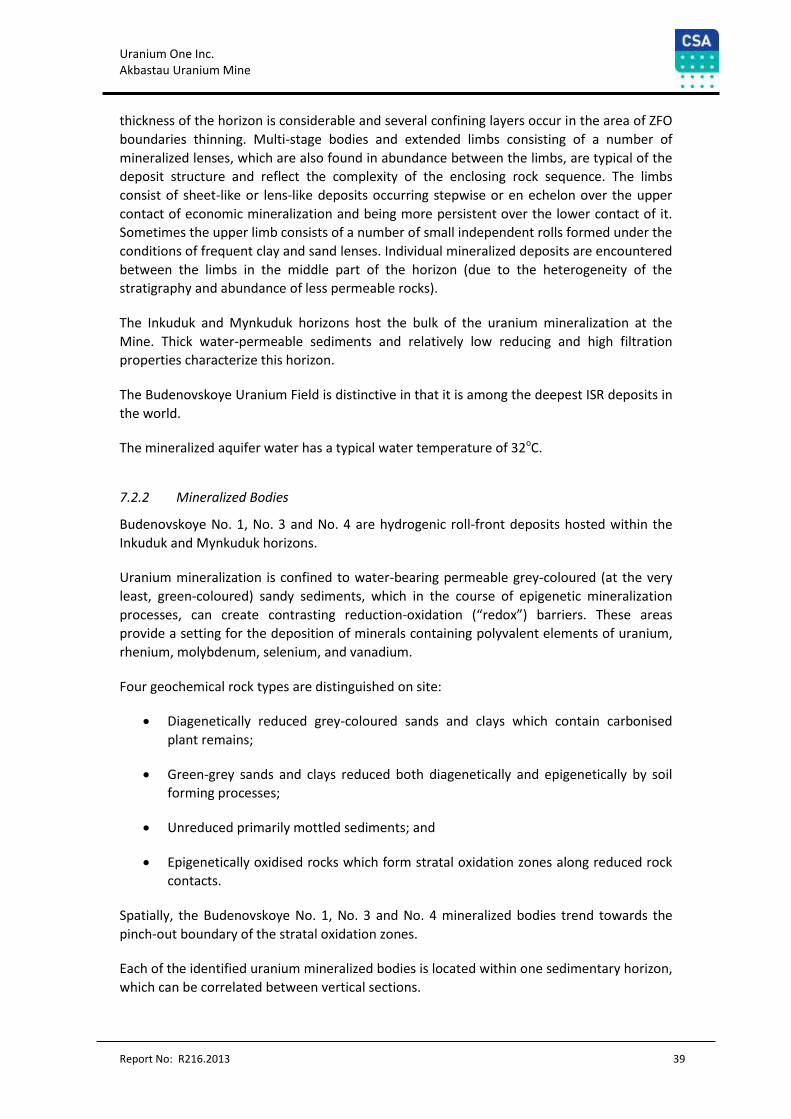
Uranium One Inc. Akbastau Uranium Mine
Report No: R216.2013 39
thickness of the horizon is considerable and several confining layers occur in the area of ZFO
boundaries thinning. Multi-stage bodies and extended limbs consisting of a number of
mineralized lenses, which are also found in abundance between the limbs, are typical of the
deposit structure and reflect the complexity of the enclosing rock sequence. The limbs
consist of sheet-like or lens-like deposits occurring stepwise or en echelon over the upper
contact of economic mineralization and being more persistent over the lower contact of it.
Sometimes the upper limb consists of a number of small independent rolls formed under the
conditions of frequent clay and sand lenses. Individual mineralized deposits are encountered
between the limbs in the middle part of the horizon (due to the heterogeneity of the
stratigraphy and abundance of less permeable rocks).
The Inkuduk and Mynkuduk horizons host the bulk of the uranium mineralization at the
Mine. Thick water-permeable sediments and relatively low reducing and high filtration
properties characterize this horizon.
The Budenovskoye Uranium Field is distinctive in that it is among the deepest ISR deposits in
the world.
The mineralized aquifer water has a typical water temperature of 32oC.
7.2.2 Mineralized Bodies
Budenovskoye No. 1, No. 3 and No. 4 are hydrogenic roll-front deposits hosted within the
Inkuduk and Mynkuduk horizons.
Uranium mineralization is confined to water-bearing permeable grey-coloured (at the very
least, green-coloured) sandy sediments, which in the course of epigenetic mineralization
processes, can create contrasting reduction-oxidation (“redox”) barriers. These areas
provide a setting for the deposition of minerals containing polyvalent elements of uranium,
rhenium, molybdenum, selenium, and vanadium.
Four geochemical rock types are distinguished on site:
Diagenetically reduced grey-coloured sands and clays which contain carbonised
plant remains;
Green-grey sands and clays reduced both diagenetically and epigenetically by soil
forming processes;
Unreduced primarily mottled sediments; and
Epigenetically oxidised rocks which form stratal oxidation zones along reduced rock
contacts.
Spatially, the Budenovskoye No. 1, No. 3 and No. 4 mineralized bodies trend towards the
pinch-out boundary of the stratal oxidation zones.
Each of the identified uranium mineralized bodies is located within one sedimentary horizon,
which can be correlated between vertical sections.
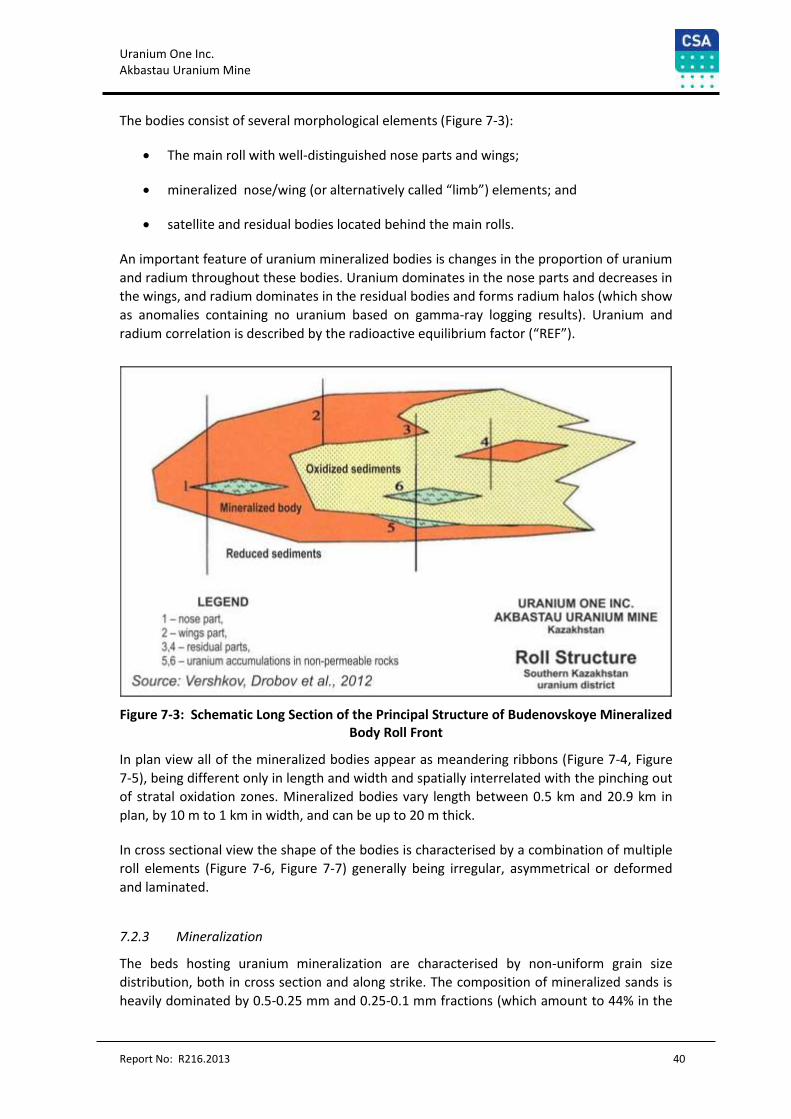
Uranium One Inc. Akbastau Uranium Mine
Report No: R216.2013 40
The bodies consist of several morphological elements (Figure 7-3):
The main roll with well-distinguished nose parts and wings;
mineralized nose/wing (or alternatively called “limb”) elements; and
satellite and residual bodies located behind the main rolls.
An important feature of uranium mineralized bodies is changes in the proportion of uranium
and radium throughout these bodies. Uranium dominates in the nose parts and decreases in
the wings, and radium dominates in the residual bodies and forms radium halos (which show
as anomalies containing no uranium based on gamma-ray logging results). Uranium and
radium correlation is described by the radioactive equilibrium factor (“REF”).
Figure 7-3: Schematic Long Section of the Principal Structure of Budenovskoye Mineralized Body Roll Front
In plan view all of the mineralized bodies appear as meandering ribbons (Figure 7-4, Figure
7-5), being different only in length and width and spatially interrelated with the pinching out
of stratal oxidation zones. Mineralized bodies vary length between 0.5 km and 20.9 km in
plan, by 10 m to 1 km in width, and can be up to 20 m thick.
In cross sectional view the shape of the bodies is characterised by a combination of multiple
roll elements (Figure 7-6, Figure 7-7) generally being irregular, asymmetrical or deformed
and laminated.
7.2.3 Mineralization
The beds hosting uranium mineralization are characterised by non-uniform grain size
distribution, both in cross section and along strike. The composition of mineralized sands is
heavily dominated by 0.5-0.25 mm and 0.25-0.1 mm fractions (which amount to 44% in the
Uranium One Inc. Akbastau Uranium Mine
Report No: R216.2013 41
lower Inkuduk sub-horizon and 62% in upper Inkuduk sub-horizon). The clay-silt fraction
(<0.05 mm) in Inkuduk varies from 10 to 25% (averaging 15%).
The composition of mineralized sands is dominated by insoluble minerals and those partially
soluble in acids (averaging 98.5%). The predominant minerals are quartz, feldspar, fragments
of silica rock and mica. Clay minerals (montmorillonite, kaolinite, and mica) are in stable
association with each other and form the cement of the mineralized sands.
Uranium minerals in the Inkuduk horizon comprise coffinite and uraninite that are found
both in the cement and on the sand grains. Their ratio in the lower Inkuduk sub-horizon is
approximately equal (1:1); whereas in upper Inkuduk and Mynkuduk horizons this ratio is
2.5:1.5 and 1:4 respectively (i.e. the pitchblende fraction increases with depth).
Uranium and selenium minerals exist side by side in mineralized rocks of the Inkuduk
horizon. Authigenic mineralization is represented by calcite (up to 0.26%), pyrite, marcasite,
limonite, goethite, and native selenium.
Uranium One Inc. Akbastau Uranium Mine
Report No: R216.2013 42
Figure 7-4: Geological Map of Budenovskoye No. 1 and No. 3 Mineralized Horizon showing the Ribbon-like Shape of the Mineralized Bodies
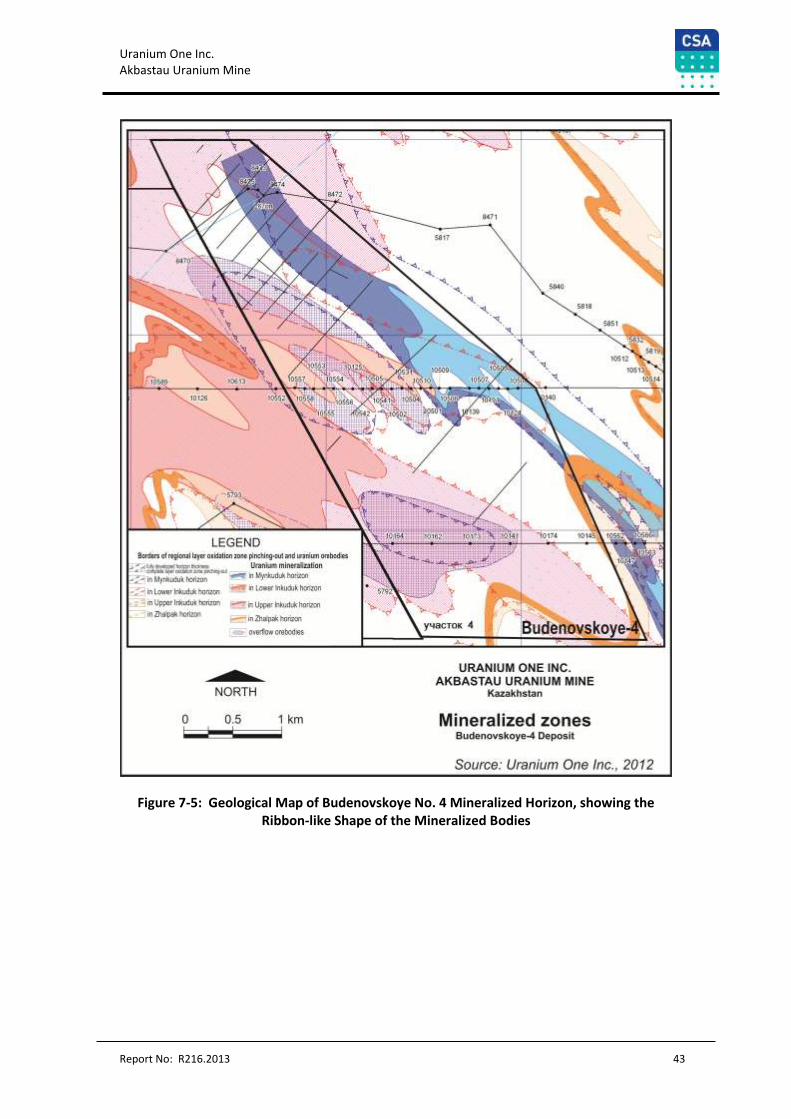
Uranium One Inc. Akbastau Uranium Mine
Report No: R216.2013 43
Figure 7-5: Geological Map of Budenovskoye No. 4 Mineralized Horizon, showing the Ribbon-like Shape of the Mineralized Bodies
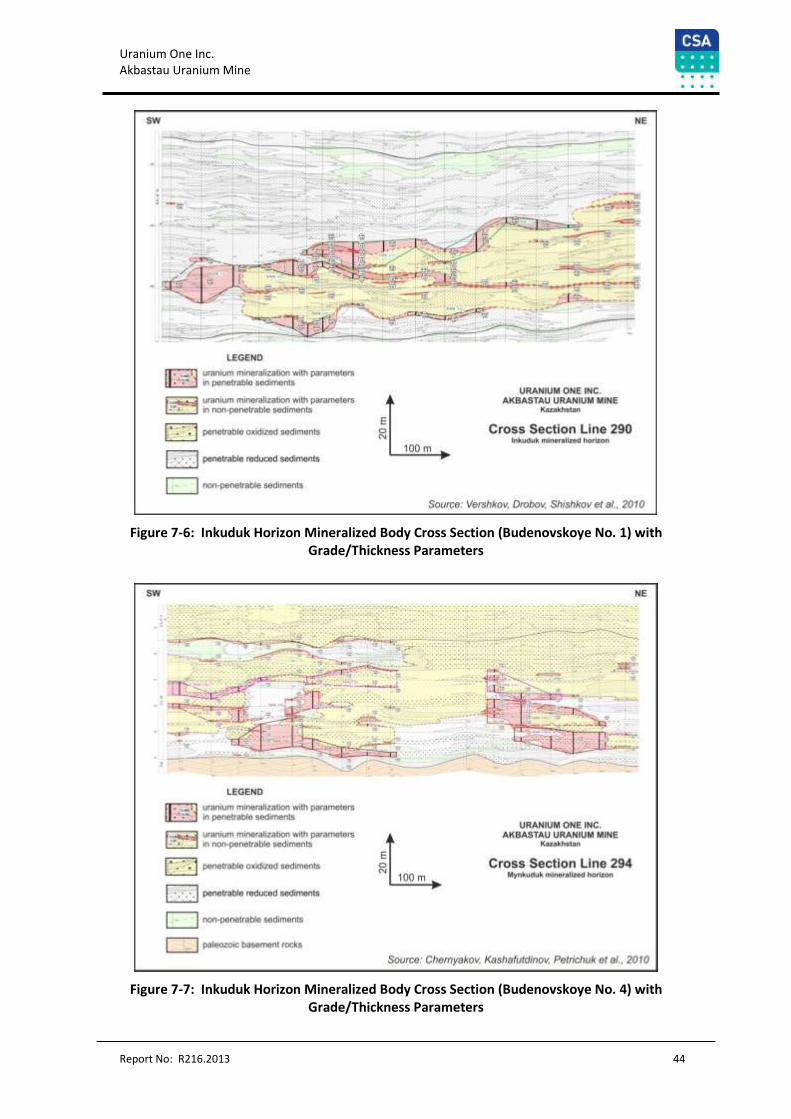
Uranium One Inc. Akbastau Uranium Mine
Report No: R216.2013 44
Figure 7-6: Inkuduk Horizon Mineralized Body Cross Section (Budenovskoye No. 1) with Grade/Thickness Parameters
Figure 7-7: Inkuduk Horizon Mineralized Body Cross Section (Budenovskoye No. 4) with Grade/Thickness Parameters
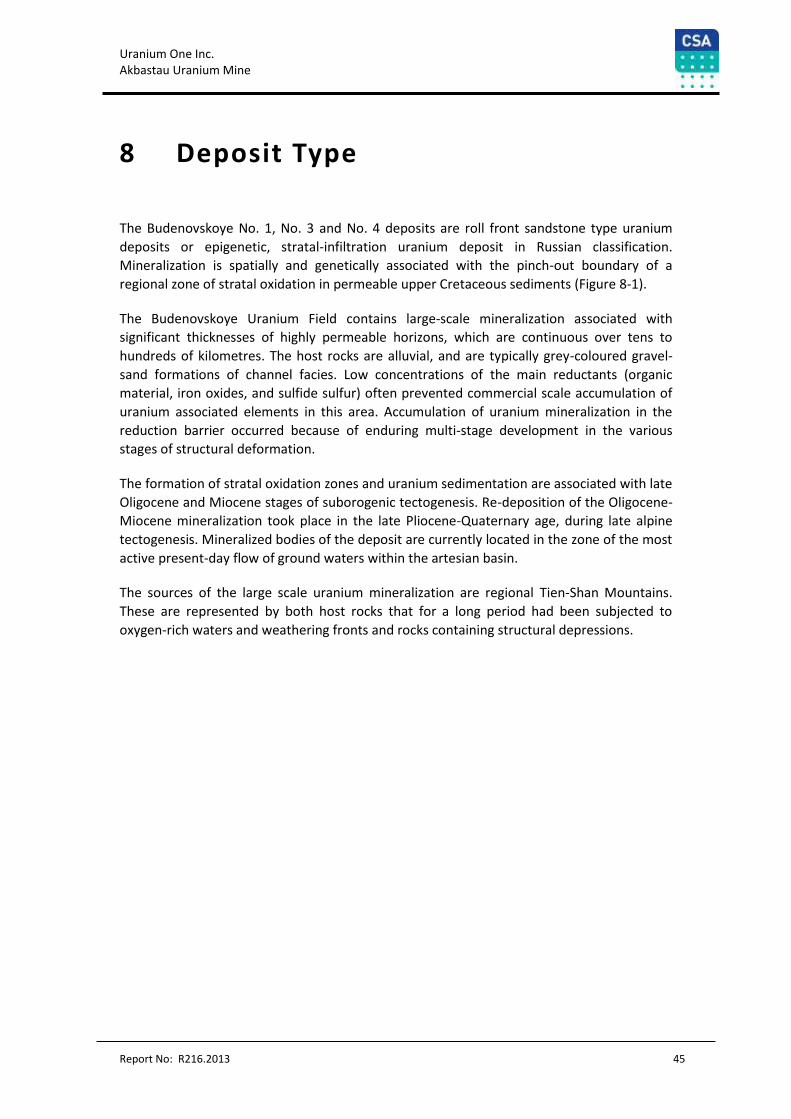
Uranium One Inc. Akbastau Uranium Mine
Report No: R216.2013 45
8 Deposit Type
The Budenovskoye No. 1, No. 3 and No. 4 deposits are roll front sandstone type uranium
deposits or epigenetic, stratal-infiltration uranium deposit in Russian classification.
Mineralization is spatially and genetically associated with the pinch-out boundary of a
regional zone of stratal oxidation in permeable upper Cretaceous sediments (Figure 8-1).
The Budenovskoye Uranium Field contains large-scale mineralization associated with
significant thicknesses of highly permeable horizons, which are continuous over tens to
hundreds of kilometres. The host rocks are alluvial, and are typically grey-coloured gravel-
sand formations of channel facies. Low concentrations of the main reductants (organic
material, iron oxides, and sulfide sulfur) often prevented commercial scale accumulation of
uranium associated elements in this area. Accumulation of uranium mineralization in the
reduction barrier occurred because of enduring multi-stage development in the various
stages of structural deformation.
The formation of stratal oxidation zones and uranium sedimentation are associated with late
Oligocene and Miocene stages of suborogenic tectogenesis. Re-deposition of the Oligocene-
Miocene mineralization took place in the late Pliocene-Quaternary age, during late alpine
tectogenesis. Mineralized bodies of the deposit are currently located in the zone of the most
active present-day flow of ground waters within the artesian basin.
The sources of the large scale uranium mineralization are regional Tien-Shan Mountains.
These are represented by both host rocks that for a long period had been subjected to
oxygen-rich waters and weathering fronts and rocks containing structural depressions.
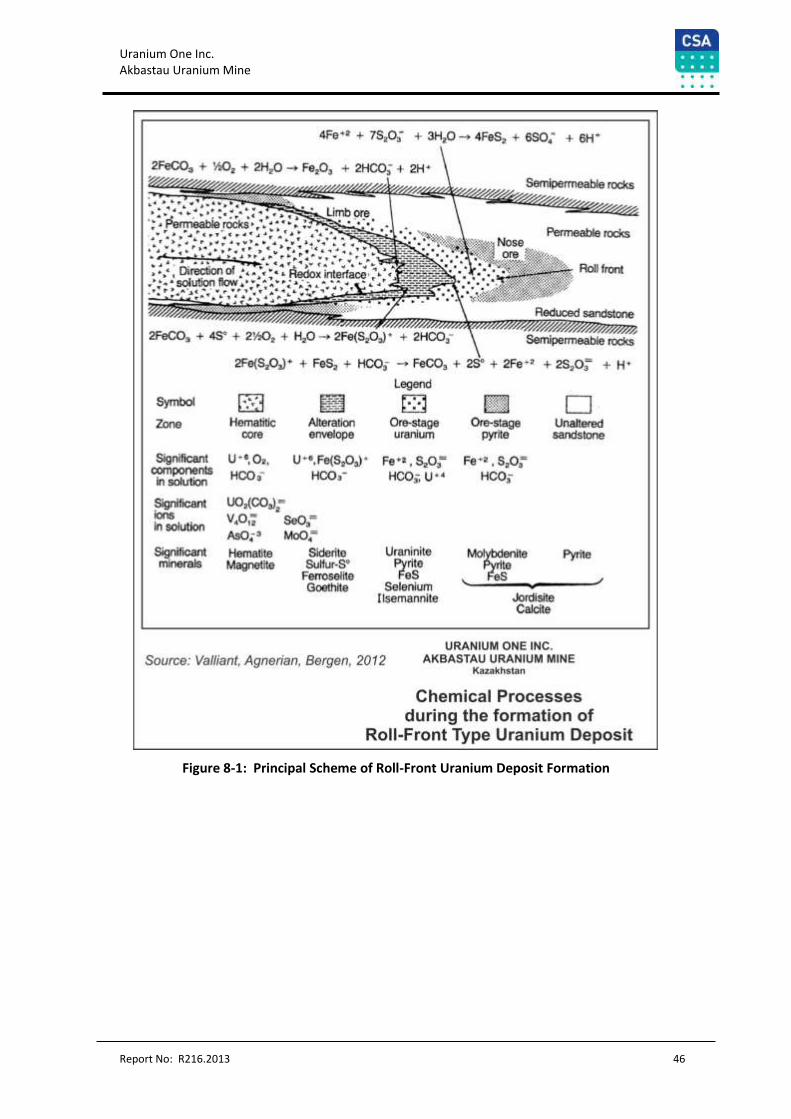
Uranium One Inc. Akbastau Uranium Mine
Report No: R216.2013 46
Figure 8-1: Principal Scheme of Roll-Front Uranium Deposit Formation
Uranium One Inc. Akbastau Uranium Mine
Report No: R216.2013 47
9 Exploration
The Mine is in production. The majority of exploration drilling was conducted during 2009-
2012. There are no current plans for further exploration.
Uranium One Inc. Akbastau Uranium Mine
Report No: R216.2013 48
10 Drilling
10.1 Geological Exploratory Drilling
The Budenovskoye No. 1, No. 3 and No. 4 deposits are typical roll-front sandstone type
uranium deposit with mineralization confined to permeable water-bearing horizons that are
marked by the development of oxidising zones that control mineralization.
The main features of such deposits and which define the appropriate exploration methods
are:
sub-horizontal and sub-conformable (to rock bedding) position of uranium
mineralized bodies within productive horizons;
large size and ribbon-like shape of mineralized bodies in plan view with considerable
continuous strike extent;
highly variable mineralization thicknesses and a roll-like shape of the mineralization
in cross section;
low uranium grade variability both along strike and down dip;
a complicated hydrogeological environment (confined waters);
mineralization is controlled by pinching out of the stratal oxidation zone at its
interface to reduced sediments; and
a single option recovery method - in situ recovery.
A 200 х 50m grid is most commonly used to define resources in category C1 and a 800-400 ×
50-100m grid is used to define resources in category C2, while a 400-800 m x 800-3,200 m
grid is used to define resources category P1 (Vershkov and Drobov, 2010).
Drill holes are typically up to 700m deep, with the lowest 40 m to 50 m hosting the potential
mineralization. The mineralized horizons are close to horizontal, so all drilling is vertical. No
core sampling has been undertaken in the upper margins of the drill holes. Coring typically
begins at approximately 560 m below surface.
There were several stages of exploration of this deposit (Figure 10-1, Figure 10-2, Table 6-1).
The stages prior to 2010 were before Uranium One’s involvement in the Mine:
Prior to 2005, work completed at Budenovskoye No. 1, No. 3 and No. 4 included
prospecting and prospect-evaluation (1979-1990). Preliminary exploration
commenced (but was not completed) in 1991. The prospects were mainly explored
on a 3200-800 х 2000-50m drilling grid (E-W sections). Drillhole depths varied from
42.5 to 729.1 m with an average of 684.6 m.
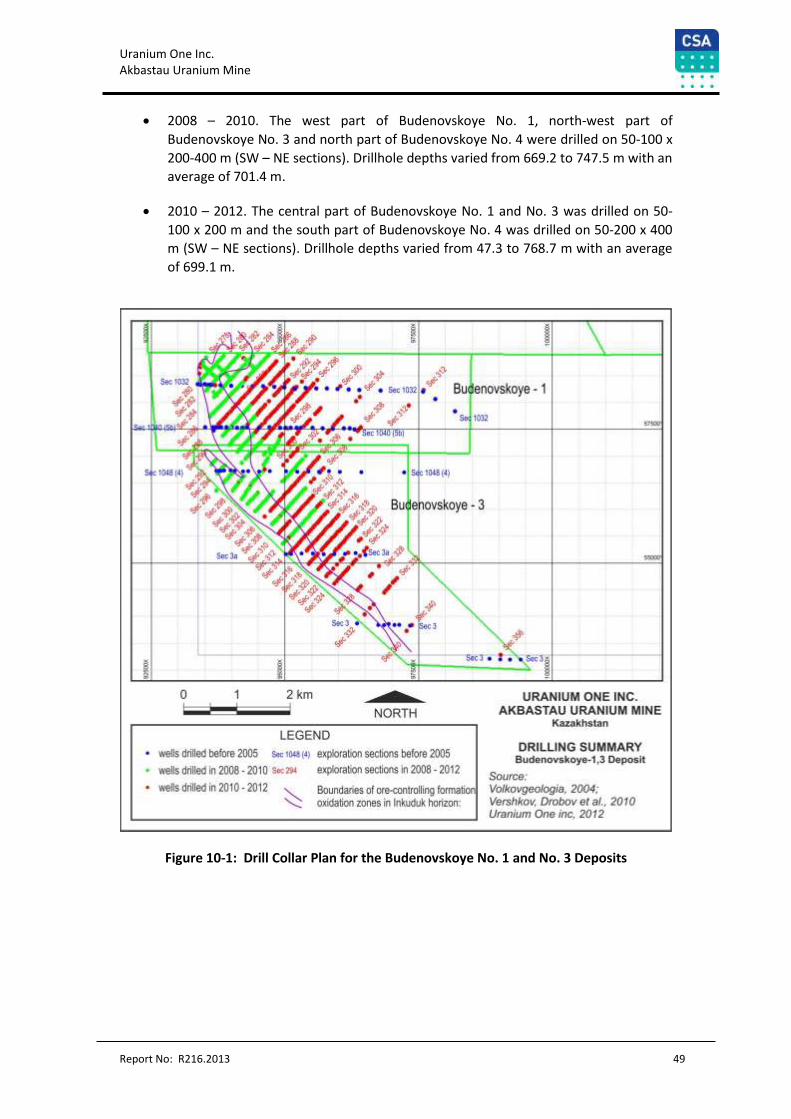
Uranium One Inc. Akbastau Uranium Mine
Report No: R216.2013 49
2008 – 2010. The west part of Budenovskoye No. 1, north-west part of
Budenovskoye No. 3 and north part of Budenovskoye No. 4 were drilled on 50-100 x
200-400 m (SW – NE sections). Drillhole depths varied from 669.2 to 747.5 m with an
average of 701.4 m.
2010 – 2012. The central part of Budenovskoye No. 1 and No. 3 was drilled on 50-
100 x 200 m and the south part of Budenovskoye No. 4 was drilled on 50-200 x 400
m (SW – NE sections). Drillhole depths varied from 47.3 to 768.7 m with an average
of 699.1 m.
Figure 10-1: Drill Collar Plan for the Budenovskoye No. 1 and No. 3 Deposits
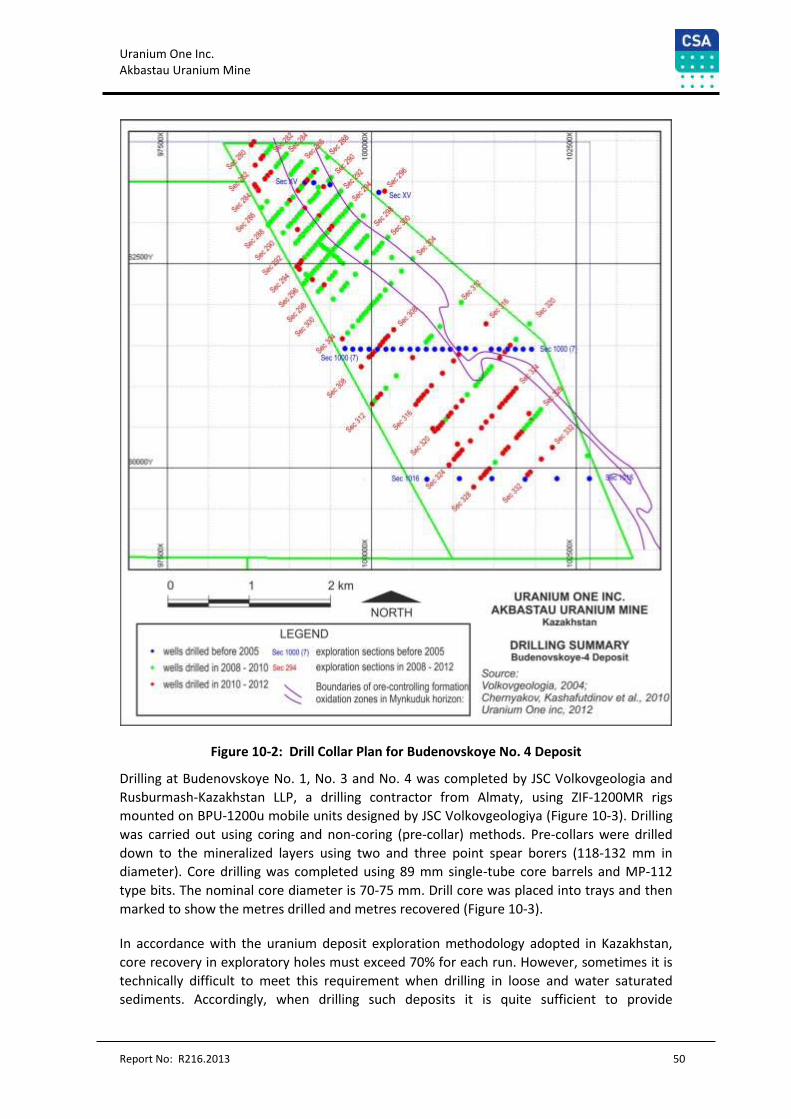
Uranium One Inc. Akbastau Uranium Mine
Report No: R216.2013 50
Figure 10-2: Drill Collar Plan for Budenovskoye No. 4 Deposit
Drilling at Budenovskoye No. 1, No. 3 and No. 4 was completed by JSC Volkovgeologia and
Rusburmash-Kazakhstan LLP, a drilling contractor from Almaty, using ZIF-1200МR rigs
mounted on BPU-1200u mobile units designed by JSC Volkovgeologiya (Figure 10-3). Drilling
was carried out using coring and non-coring (pre-collar) methods. Pre-collars were drilled
down to the mineralized layers using two and three point spear borers (118-132 mm in
diameter). Core drilling was completed using 89 mm single-tube core barrels and МP-112
type bits. The nominal core diameter is 70-75 mm. Drill core was placed into trays and then
marked to show the metres drilled and metres recovered (Figure 10-3).
In accordance with the uranium deposit exploration methodology adopted in Kazakhstan,
core recovery in exploratory holes must exceed 70% for each run. However, sometimes it is
technically difficult to meet this requirement when drilling in loose and water saturated
sediments. Accordingly, when drilling such deposits it is quite sufficient to provide
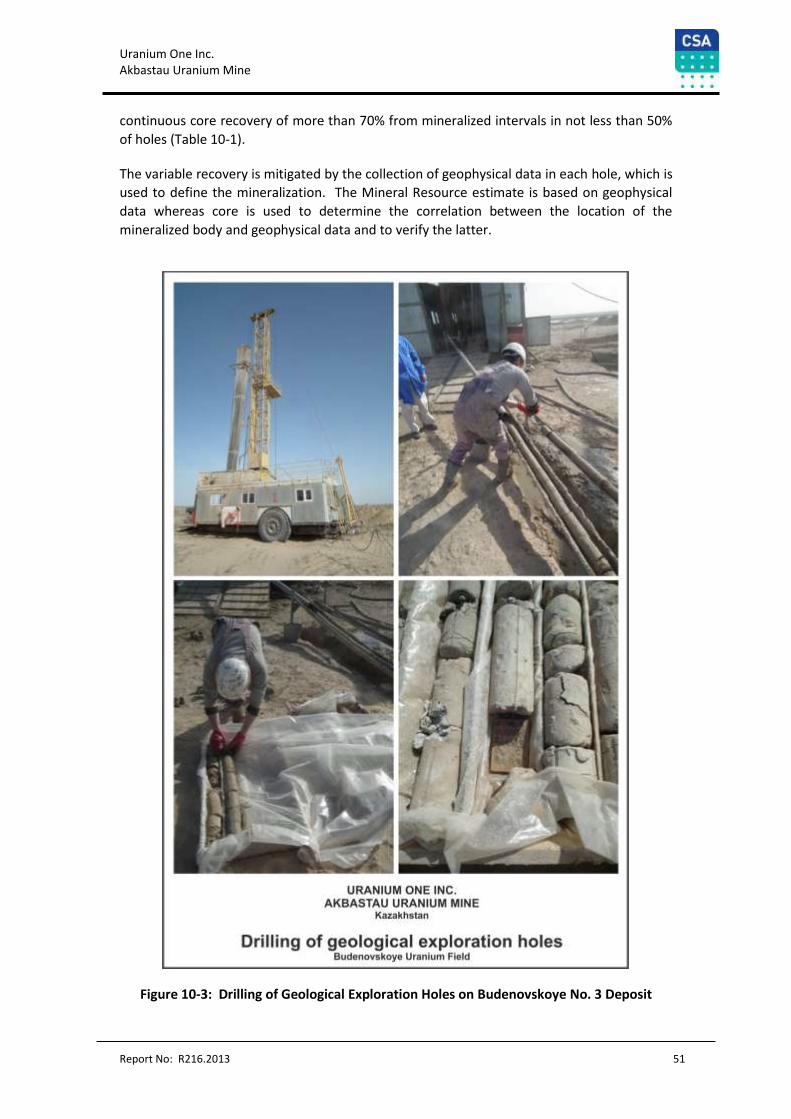
Uranium One Inc. Akbastau Uranium Mine
Report No: R216.2013 51
continuous core recovery of more than 70% from mineralized intervals in not less than 50%
of holes (Table 10-1).
The variable recovery is mitigated by the collection of geophysical data in each hole, which is
used to define the mineralization. The Mineral Resource estimate is based on geophysical
data whereas core is used to determine the correlation between the location of the
mineralized body and geophysical data and to verify the latter.
Figure 10-3: Drilling of Geological Exploration Holes on Budenovskoye No. 3 Deposit
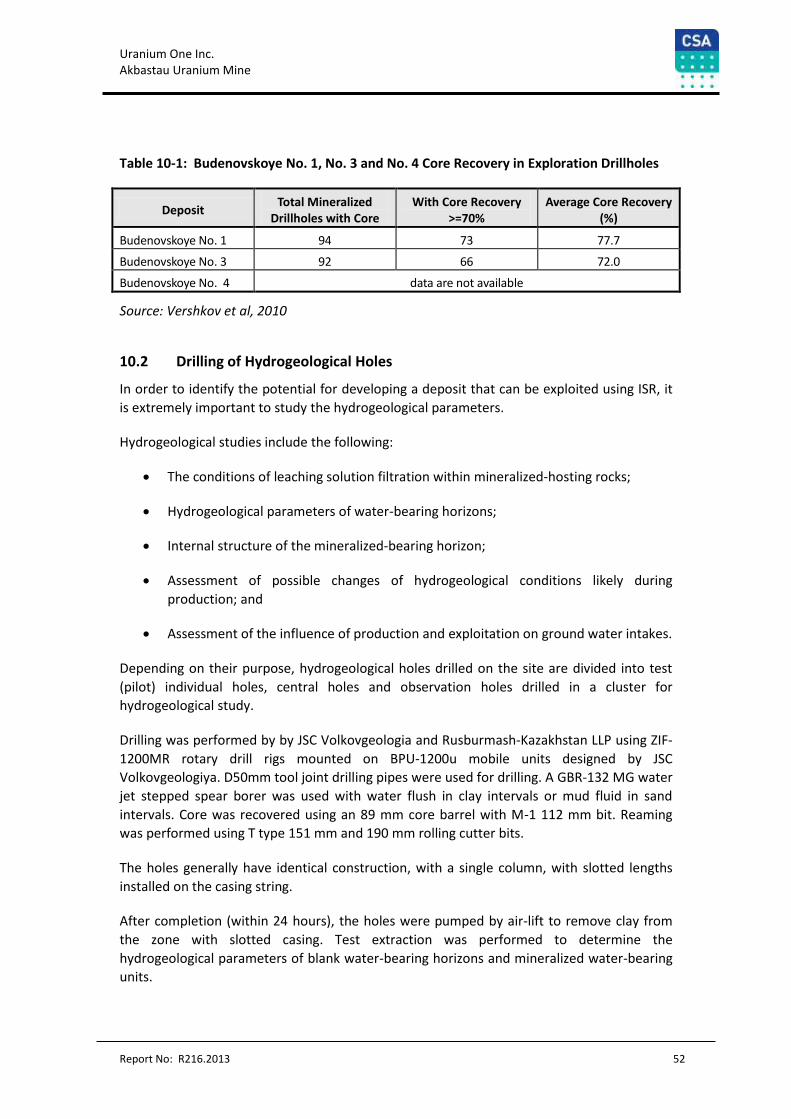
Uranium One Inc. Akbastau Uranium Mine
Report No: R216.2013 52
Table 10-1: Budenovskoye No. 1, No. 3 and No. 4 Core Recovery in Exploration Drillholes
Deposit Total Mineralized
Drillholes with Core With Core Recovery
>=70% Average Core Recovery
(%)
Budenovskoye No. 1 94 73 77.7
Budenovskoye No. 3 92 66 72.0
Budenovskoye No. 4 data are not available
Source: Vershkov et al, 2010
10.2 Drilling of Hydrogeological Holes
In order to identify the potential for developing a deposit that can be exploited using ISR, it
is extremely important to study the hydrogeological parameters.
Hydrogeological studies include the following:
The conditions of leaching solution filtration within mineralized-hosting rocks;
Hydrogeological parameters of water-bearing horizons;
Internal structure of the mineralized-bearing horizon;
Assessment of possible changes of hydrogeological conditions likely during
production; and
Assessment of the influence of production and exploitation on ground water intakes.
Depending on their purpose, hydrogeological holes drilled on the site are divided into test
(pilot) individual holes, central holes and observation holes drilled in a cluster for
hydrogeological study.
Drilling was performed by by JSC Volkovgeologia and Rusburmash-Kazakhstan LLP using ZIF-
1200МR rotary drill rigs mounted on BPU-1200u mobile units designed by JSC
Volkovgeologiya. D50mm tool joint drilling pipes were used for drilling. A GBR-132 MG water
jet stepped spear borer was used with water flush in clay intervals or mud fluid in sand
intervals. Core was recovered using an 89 mm core barrel with М-1 112 mm bit. Reaming
was performed using T type 151 mm and 190 mm rolling cutter bits.
The holes generally have identical construction, with a single column, with slotted lengths
installed on the casing string.
After completion (within 24 hours), the holes were pumped by air-lift to remove clay from
the zone with slotted casing. Test extraction was performed to determine the
hydrogeological parameters of blank water-bearing horizons and mineralized water-bearing
units.
Uranium One Inc. Akbastau Uranium Mine
Report No: R216.2013 53
Overall, the types of test operations performed during exploration were as follows:
Well completion;
Pilot exhausts from observation wells in non-mineralized water-bearing horizons;
Pilot air-lift pumping from observation wells;
Pilot extraction from clustered wells; and
Experimental single extraction wells.
The results from these tests show:
Hydrological characteristics of the Budenovskoye No.1,3,4 deposits have been
defined on basis of these hydrological tests;
The Zhalpak, Inkuduk and Mynkuduk horizons form a single aquifer with no
continuous impermeable layer separating them, thus representing a single water-
bearing complex 200 m to 245 m thick with filtration coefficients (permeability) of
2.9 m/day to 7.2 m/day; and
The piezometric surface is orientated south-southeast to north-northwest.
10.3 Downhole Geophysical Surveys
Downhole geophysical surveys formed the basis for evaluation activities.
Geophysical well logging (GIS) included the following logging methods:
gamma-ray logging (GRL),
electrical methods (resistivity logging (RL) and spontaneous polarisation (SP)
logging),
directional survey (DS),
induction logging (IL),
calliper logging (CL),
electric logging (EL),
flowmeter survey (flow measurement) (FM),
prompt fission neutron logging (PFN).
The logging methods GRL, RL, SP and DS are included in the so-called “standard set” and
have been completed in all of the holes drilled on site, whilst PFN is used as a control
method and for determination of radium halos (Figure 10-4, Figure 10-5).
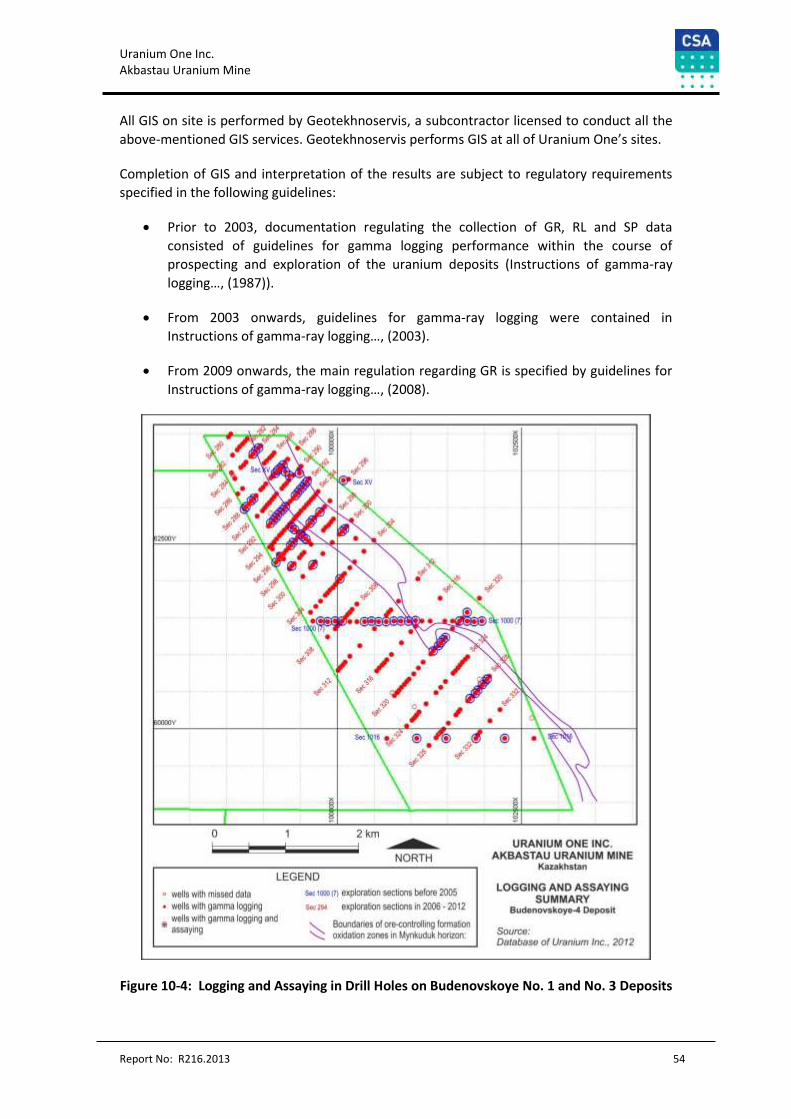
Uranium One Inc. Akbastau Uranium Mine
Report No: R216.2013 54
All GIS on site is performed by Geotekhnoservis, a subcontractor licensed to conduct all the
above-mentioned GIS services. Geotekhnoservis performs GIS at all of Uranium One’s sites.
Completion of GIS and interpretation of the results are subject to regulatory requirements
specified in the following guidelines:
Prior to 2003, documentation regulating the collection of GR, RL and SP data
consisted of guidelines for gamma logging performance within the course of
prospecting and exploration of the uranium deposits (Instructions of gamma-ray
logging…, (1987)).
From 2003 onwards, guidelines for gamma-ray logging were contained in
Instructions of gamma-ray logging…, (2003).
From 2009 onwards, the main regulation regarding GR is specified by guidelines for
Instructions of gamma-ray logging…, (2008).
Figure 10-4: Logging and Assaying in Drill Holes on Budenovskoye No. 1 and No. 3 Deposits
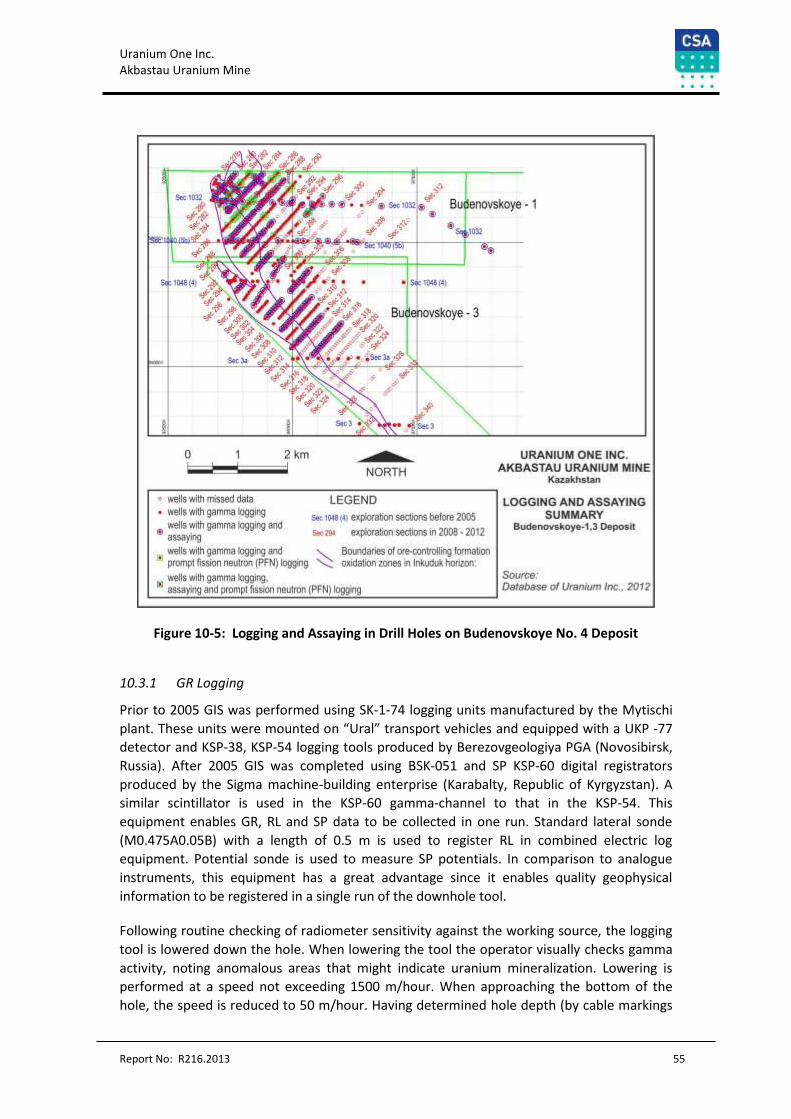
Uranium One Inc. Akbastau Uranium Mine
Report No: R216.2013 55
Figure 10-5: Logging and Assaying in Drill Holes on Budenovskoye No. 4 Deposit
10.3.1 GR Logging
Prior to 2005 GIS was performed using SK-1-74 logging units manufactured by the Mytischi
plant. These units were mounted on “Ural” transport vehicles and equipped with a UKP -77
detector and KSP-38, KSP-54 logging tools produced by Berezovgeologiya PGA (Novosibirsk,
Russia). After 2005 GIS was completed using BSK-051 and SP KSP-60 digital registrators
produced by the Sigma machine-building enterprise (Karabalty, Republic of Kyrgyzstan). A
similar scintillator is used in the KSP-60 gamma-channel to that in the KSP-54. This
equipment enables GR, RL and SP data to be collected in one run. Standard lateral sonde
(М0.475А0.05В) with a length of 0.5 m is used to register RL in combined electric log
equipment. Potential sonde is used to measure SP potentials. In comparison to analogue
instruments, this equipment has a great advantage since it enables quality geophysical
information to be registered in a single run of the downhole tool.
Following routine checking of radiometer sensitivity against the working source, the logging
tool is lowered down the hole. When lowering the tool the operator visually checks gamma
activity, noting anomalous areas that might indicate uranium mineralization. Lowering is
performed at a speed not exceeding 1500 m/hour. When approaching the bottom of the
hole, the speed is reduced to 50 m/hour. Having determined hole depth (by cable markings
Uranium One Inc. Akbastau Uranium Mine
Report No: R216.2013 56
and tape measure), the operator initiates lifting of the tool, during which all geophysical
parameters are recorded except for temperature. When recording GR, the speed of lifting is
essential for all kinds of logging sets. In accordance with the standing instruction, the speed
of a radiometer with a 30x70 mm crystal must not exceed 1000 m/hour. The actual speed of
lifting ranged from 800 to 900 m/hour. This means that gamma-anomalies with intensity of
50 mcR/h, thicknesses of 10 cm (accounting for natural water content of 20% relative) and
drilling mud correction of 0.9 were registered with a statistical error ranging from 7.5 to
8.0% relative (regulatory - 10% relative). Performing GR at this speed ensures quality initial
values. After removing the tool, the operator controls sensitivity from the working source.
GR logging results are recognised to be qualitative and applicable for processing if there are
no indications of discrepancies of more than 10% relative between measurements before
and after GRL, and the average between them does not differ from sensitivity reference
value by more than 7% relative. Otherwise, GR logging is conducted using a different, stable
radiometer.
10.3.2 Downhole Survey
KIT-1 and IEM-36 downhole survey (“DS”) tools were used to measure drill hole location.
These were tools with a magnetic compass for azimuth measurement. It should be noted
that all holes were planned as vertical. Fundamental errors (Vershkov et al, 2012) in the dip
angle are 30 minutes; errors in azimuth measurement are 10 degrees at dip angles from -88
to -85 degrees, and 5 degrees at dip angles from -85 to 80 deg. At dip angles less than -88
degrees, these tools, just as survey tools of any other mode of operation or modification,
measure azimuth with an error of more than 10 degrees.
The survey tool is lowered down the hole in locked condition (the sensor element is fixed) at
a speed not exceeding 1000 m/h. When approaching within 50m of the sampling interval,
the speed of lowering is reduced to 500 m/h. The tool is kept at the first sampling point for
at least 30 seconds. The tool is held for 10 seconds before taking measurements at the next
points. The standard interval of measurements is 20 m. When DS is performed after
extending a hole (that was previously subjected to this survey) the measurements cover 3 to
5 points (depending on hole dip angle). If discrepancies between the measurements are
more than double the fundamental error the entire interval is measured with a spacing of 5
m. Production wells are subject to additional requirements relating to acceptable deflection
of the well bottom in plan (not more than by 1m over 100m length of well). Therefore, in
order to increase DS accuracy, measurements of dip and azimuth in each point are
performed twice (for point devices). At least 20% of measurements are repeated (each 5th
point of basic measurements).
10.3.3 Electrical (RL, SP) Logging
These types of logging were performed simultaneously with GR Logging. RL and SP are
recorded using corresponding channels of a BSK-051 recorder. A specific requirement of
working with these logging types is to adjust their sensitivity in the reference horizon. This
horizon (Chigan clays) is present throughout the entire deposit area this method is evaluated
as being satisfactory. It should be noted that electric logging is always the first to be
performed out of the whole range of planned downhole surveys.
Uranium One Inc. Akbastau Uranium Mine
Report No: R216.2013 57
10.3.4 Drillhole Diameter Measurements (CL)
CL is performed using SPK and SKU units produced by UMZ. An added advantage of the latter
device is its controllability in the hole. If required, under the operator’s control, the lever
system of the calliper logging tool can be shut and open again to perform measurements
within the required interval.
10.3.5 Flowmeter Survey
Hydrological downhole flowmeter survey is performed using PETS-2 and TSR-34 flow meters
and 36mm and 70mm downhole tools (produced by Uralgeophyspribor plant, Yekaterinburg,
Russia). These devices measure the rotation speed of the impeller located in the downhole
tool within a surveyed interval. This rotation speed is proportional to the speed of ground
water axial flow in the hole. Measurements are made in point mode, with a spacing ranging
from 0.5 to 2 m (in accordance with the survey methodology).
10.3.6 PFN Logging
An “Impuls-101” instrument was used at Budenovskoye No. 1 to perform PFN logging (the
device was quite old but is functional and is backed by detailed procedures). At the
exploration stage, this device enabled quantitative estimates of U-238 concentrations in the
hole based on its U-235 isotope (designed by VIRG, St. Petersburg, manufactured by
Geologorazvedka plant, St. Petersburg). The device was used to identify U-235 prompt
fission neutrons, which are formed during irradiation of the downhole space with neutrons
produced by a pulse generator, included in the downhole logging tool set. Measurements
are completed in such a period in which generated neutrons pass the thermolization phase
(become thermal). These neutrons cause fission of U-235 nuclei. In one fission event, 2-3
prompt neutrons are formed which a helium proportional counter registers with cadmium
filter. The filter absorbs thermal neutrons, and so excludes their influence on measurement
results. The device had 2 channels of neutron registration, which enabled the influence of
moisture content on uranium concentration estimate results to be excluded. This instrument
is now no longer used due to it being obsolete.
Currently, the AINK-60 device is used for PFN, designed by VNIIA (Russian Research Institute
of Automatics, Moscow, Russia). This equipment has only one channel of neutron
registration. Therefore, in an environment with high variability of natural moisture content,
which is typical of hydrogenous deposits, this device can be used only for the qualitative
identification of uranium mineralized intervals within hole profiles. Nevertheless, this
equipment enables exclusion of the residual halos of radium, which are typical for rear areas
of hydrogenous deposits.
10.4 Drillhole Documentation
During core logging, special consideration was given to rock colour, composition and size of
detrital material, clay content, textural and structural features and authigenic mineralization.
During drillhole documentation, a field log is completed in which the geologist:
draws a geological column;
Uranium One Inc. Akbastau Uranium Mine
Report No: R216.2013 58
makes notes but no geological description is completed; and
registers core radiometric measurement results.
Radiometric measurements of core are made using “Prognoz” radiometers with fixed
measurements every 0.1 m. At minor radiation activity, measurements are taken without
the lead screen (which CSA note is not the correct procedure), at increased radiation activity,
a lead screen is used which offsets the influence of neighbouring intervals.
Agreement in the nature and thickness of mineralized intervals in the histogram of core
radioactivity measurement and GRL diagram demonstrates absence of selective grinding and
high representivity of the core. In the presence of intervals without core radiometric
measurements, core referencing is achieved by comparing measurement curves and GRL
curves.
Core field logs serve as operational workbooks only; they are not attached to drillhole files.
Documentation is completed at the GRE 7 Expedition base of Volkovgeologiya JSC where the
drillhole column is drawn, and is then entered into the database.
10.5 Drillhole Sampling
In the course of drilling at Budenovskoye No. 1, No. 3 and No. 4, samples were taken from
the drill core in order to:
determine uranium and radium grades;
study rock grain-size composition and carbonate content;
perform spectral analysis;
determine the grades of associate elements;
determine specific gravity and moisture content of uranium-bearing rocks;
determine rock acid-alkaline balance;
determine material composition of mineralization and host rocks; and
complete geotechnical testing for uranium leachability.
The sampling history is summarised in Table 10-2, the distribution of drill holes with assaying
on the Budenovskoye No. 1 and No. 3 is shown on Figure 10-4 and on the Budenovskoye No.
4 is shown on Figure 10-5.
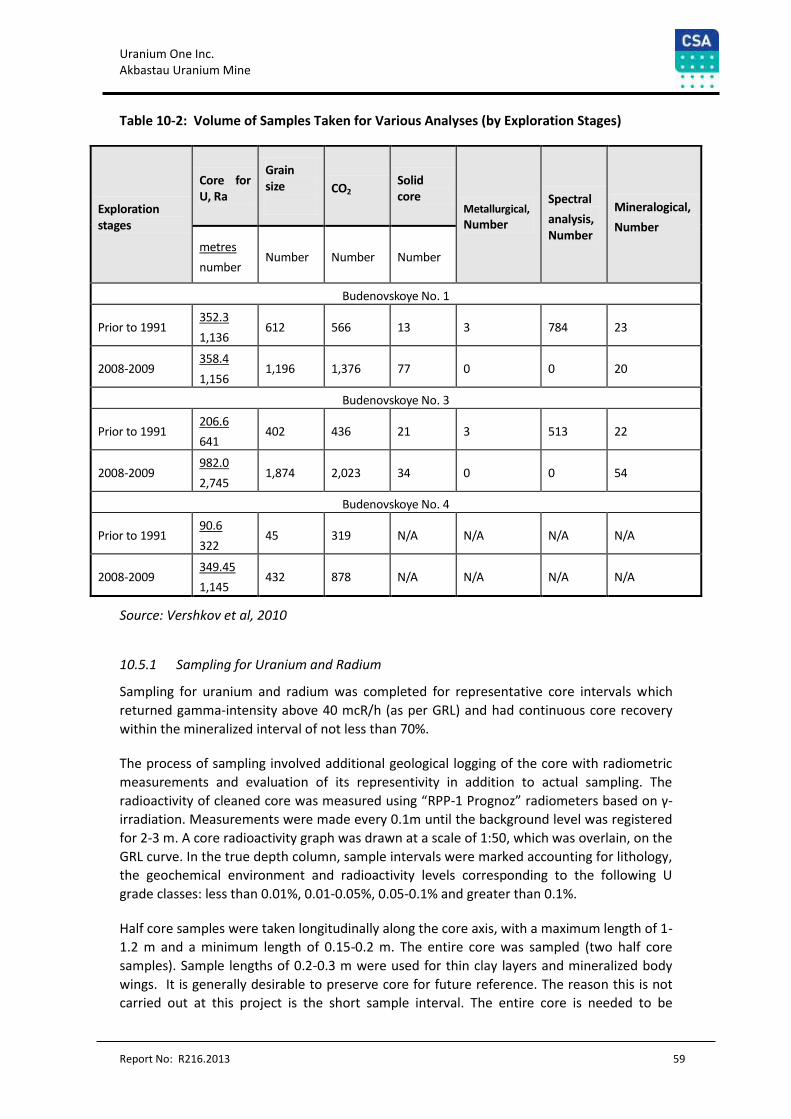
Uranium One Inc. Akbastau Uranium Mine
Report No: R216.2013 59
Table 10-2: Volume of Samples Taken for Various Analyses (by Exploration Stages)
Exploration stages
Core for U, Ra
Grain size
СО2 Solid core
Metallurgical,
Number
Spectral
analysis, Number
Mineralogical,
Number
metres
number Number Number Number
Budenovskoye No. 1
Prior to 1991 352.3
1,136 612 566 13 3 784 23
2008-2009 358.4
1,156 1,196 1,376 77 0 0 20
Budenovskoye No. 3
Prior to 1991 206.6
641 402 436 21 3 513 22
2008-2009 982.0
2,745 1,874 2,023 34 0 0 54
Budenovskoye No. 4
Prior to 1991 90.6
322 45 319 N/A N/A N/A N/A
2008-2009 349.45
1,145 432 878 N/A N/A N/A N/A
Source: Vershkov et al, 2010
10.5.1 Sampling for Uranium and Radium
Sampling for uranium and radium was completed for representative core intervals which
returned gamma-intensity above 40 mcR/h (as per GRL) and had continuous core recovery
within the mineralized interval of not less than 70%.
The process of sampling involved additional geological logging of the core with radiometric
measurements and evaluation of its representivity in addition to actual sampling. The
radioactivity of cleaned core was measured using “RPP-1 Prognoz” radiometers based on γ-
irradiation. Measurements were made every 0.1m until the background level was registered
for 2-3 m. A core radioactivity graph was drawn at a scale of 1:50, which was overlain, on the
GRL curve. In the true depth column, sample intervals were marked accounting for lithology,
the geochemical environment and radioactivity levels corresponding to the following U
grade classes: less than 0.01%, 0.01-0.05%, 0.05-0.1% and greater than 0.1%.
Half core samples were taken longitudinally along the core axis, with a maximum length of 1-
1.2 m and a minimum length of 0.15-0.2 m. The entire core was sampled (two half core
samples). Sample lengths of 0.2-0.3 m were used for thin clay layers and mineralized body
wings. It is generally desirable to preserve core for future reference. The reason this is not
carried out at this project is the short sample interval. The entire core is needed to be
Uranium One Inc. Akbastau Uranium Mine
Report No: R216.2013 60
sampled in order to give sufficient material for assaying. Sampling quality was controlled by
the collection of two adjacent samples (from each side of the core). Comparison was made
between their weight and uranium grades.
Based on the information collected, sampling for uranium and radium is considered by CSA
to be of a high quality and appropriate for control and evaluation of GRL quality.
10.5.2 Sampling for Associated Elements
Elements associated with uranium mineralization (rhenium, selenium, scandium, rare earth
totals, yttrium, etc.) were also assayed. Sampling for these elements was mainly carried out
in mineralized holes along geochemical (mineral-geochemical) profiles. Samples were
collected in oxidised and unaltered lithologies.
The rhenium distribution was examined by collecting 0.2-0.5 m samples from mineralized
core in which continuous core recovery exceeded 70%. The scandium and selenium
distribution was examined by taking individual samples from drillholes in mineralized,
barren, unaltered and oxidised lithologies. The distribution of rare earth elements and
yttrium were examined by combining samples taken from duplicates of individual
mineralized (uranium) samples located in different parts of the geological section.
10.5.3 Sampling for Grain-Size Composition and Carbonate
Sampling for grain-size composition and carbonate content was completed to study the
potential to extract the uranium by ISR methods.
Sampling was completed on a 400х100 m grid in mineralized holes with core recovery of
greater than 70%.
Samples were taken from mineralized intervals, barren layers (within the mineralization) and
host sediments located above and below the mineralization at distances of up to 15-20 m.
Core was longitudinally sampled by punctuated and continuous channel, accounting for
lithology and geochemical properties of the rocks. Length of samples varied (mainly 1-3 m).
Samples for carbonate determination were between 100-300 g in weight, and grain size
samples were not less than 500 g in weight.
10.5.4 Sampling for Spectral Analysis
Sampling for spectral analysis was initially completed at the prospect-evaluation stage on a
3200-1600 m х 200-100 m grid. At the later stage of preliminary exploration, sampling was
completed on an 800х100m grid. Samples for spectral analysis were taken from various
lithological and geochemical rock varieties. Sample length did not exceed 3-4m and weights
did not exceed 0.3 kg. The suite of elements that were analysed varied depending on the
period of exploration – initially only 10 elements were analysed, but this increased to 28 and
finally 41 elements. Samples were analysed for elements 10, 28 and 41.
Uranium One Inc. Akbastau Uranium Mine
Report No: R216.2013 61
10.5.5 Collecting Solid Core Sticks to Determine Moisture Content and Specific Gravity
Sampling of solid core is necessary to study rock grain size composition, determine
permeable and impermeable units and for correlation with geophysical surveys. Sticks were
collected uniformly across the deposit primarily on an 800х100-50m grid.
Stick samples were taken immediately after measuring core recovery, and were coated with
paraffin wax using a cutting ring method and then placed into boxes according to lithology.
10.5.6 Metallurgical Samples
Samples for uranium leachability were taken from mineralized material from a group of
mineralized drillholes, which characterise an area of the deposit or the deposit as a whole.
Metallurgical samples comprised individual samples taken by a continuous channelling
method, with a sample weight of 26-30 kg. All samples (2 - from Inkuduk horizon - t96 and
t99, and 1 - from Mynkuduk - t97) were sent to VNIIHT in November 1989, but when the first
report was written (1990), the results were obtained only for one sample (t96). The two
other samples remained untested (this is because of political changes due to the breakup of
the former Soviet Union affecting the responsible government exploration team).
10.5.7 Samples for Mineralogical, Petrographic and Other Analyses
Mineralized and host rock material composition samples were taken on a 1600х100-50 m
grid.
Samples were taken from drill core and analysed for the following:
mineralogical analysis of samples by examination of thin sections, polished sections
and microradiography,
X-ray phase analysis with determination of uranium minerals and analysis of clay
minerals,
electron-microscopic examination,
X-ray spectral analysis for uranium, radium and selenium,
spectral analysis,
neutron activation analysis for scandium and rare earth elements,
chemical analysis for rhenium, analysis for carbonate content, organic matter,
ferrum and sulfur forms, determination of uranium in water, and
silicate analysis.
Uranium One Inc. Akbastau Uranium Mine
Report No: R216.2013 62
10.6 Topo-Geodetic Survey
The following work was completed at the Mine:
first-order triangulation,
setting out of drillhole collar locations,
determination of actual drillhole collar coordinates, and
compilation of topography plans, geological maps and Mineral Resource estimation
plans.
A topography map at a scale of 1:50,000 with 10 m contour intervals is available for the
entire prospect area and a topography map at a scale of 1:25,000 with 5m contour intervals
is available for the mineralized field (updated in 1968-1969).
From 1983 through 1984, Enterprise No 6 completed infill of the geodetic network with a
horizontal control density of one point per 25 km2. First and second order triangulation was
completed by Expedition No. 5 with 6 points in 1986 and 5 points in 1988.
The coordinate system is local and has been adopted by Volkovgeologiya association. The
Baltic elevation system is used (1977).
First and second order triangulation was completed by insertions into corners established by
governmental triangulation points (classes 2 and 3). Corners were measured using a Т5-К
theodolite by measuring in four sets. The mean square error of measuring angles in the
triangle was ±4"0. Side lengths in the triangles varied from 1.3 km to 3 km and the maximum
closure error of a triangle was 18". An equation was devised using conditional
measurements. The centre of the first and second triangulation points represents a concrete
monolith with a metal pipe and the external point is a wooden peg 4-5 m high.
Drillhole collar positions were determined by resections as well as by extending theodolite
traverses with an accuracy of 1:1,000. Theodolite traverses were set between triangulation
points and separated point coordinates obtained from resections. Corners were measured
using a Т5-К theodolite. Lengths of the theodolite traverse lines were measured using a 50 m
steel tape measure with corrections for line slope.
Determination of drillhole collar elevations was by technical levelling from ground and
temporary bench marks.
Drillhole collar coordinates and marks located outside of the mineralized field were
determined by topographic maps at a scale of 1:50,000 with 10 m contour intervals.
The mean square error of drillhole collar positions within the mineralized field does not
exceed ±2 m in plan and ±0.5 m in elevation.
In 2005, stereo-topographic surveying at a scale of 1:10,000 with 1m contour intervals was
completed over the area of the geological permit. The work was completed by GIS LLP
(Licence Nо. 00190).
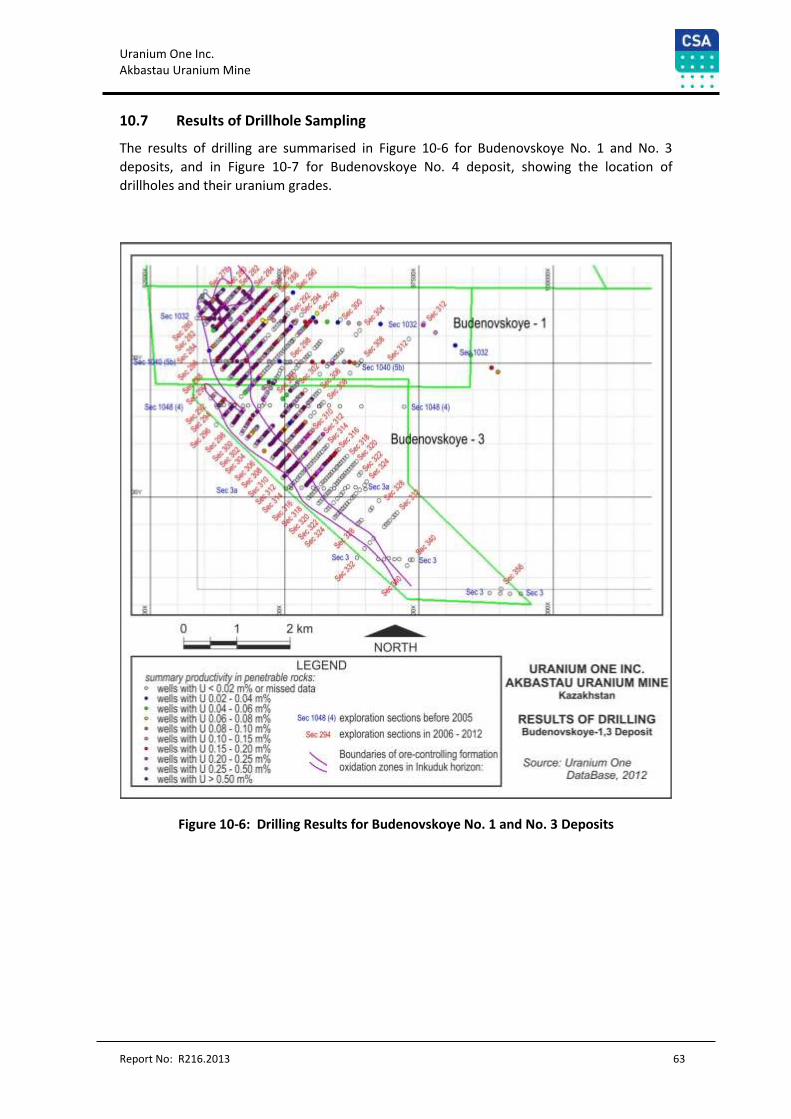
Uranium One Inc. Akbastau Uranium Mine
Report No: R216.2013 63
10.7 Results of Drillhole Sampling
The results of drilling are summarised in Figure 10-6 for Budenovskoye No. 1 and No. 3
deposits, and in Figure 10-7 for Budenovskoye No. 4 deposit, showing the location of
drillholes and their uranium grades.
Figure 10-6: Drilling Results for Budenovskoye No. 1 and No. 3 Deposits
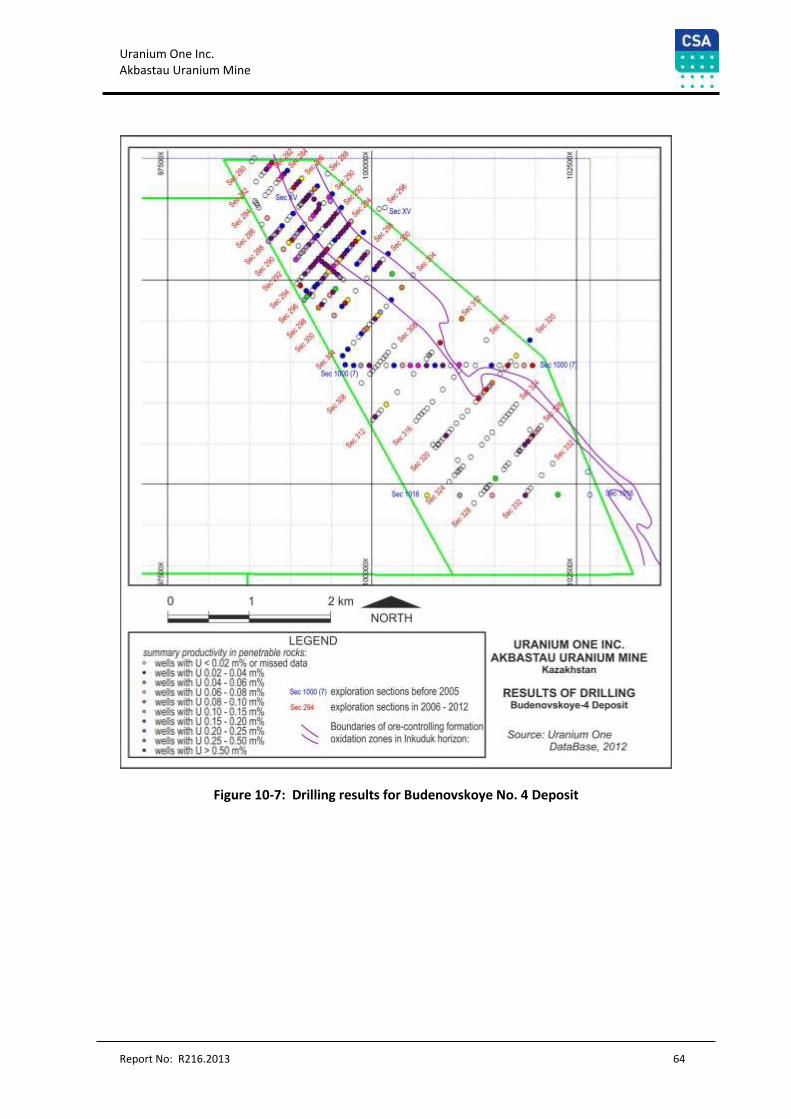
Uranium One Inc. Akbastau Uranium Mine
Report No: R216.2013 64
Figure 10-7: Drilling results for Budenovskoye No. 4 Deposit
Uranium One Inc. Akbastau Uranium Mine
Report No: R216.2013 65
11 Sample Preparation, Analyses and Security
11.1 Sample Preparation
Core is stored in a secure location on site, and then transported to the JSC Volkovgeologia
Laboratory in Taikonur in core trays. Here it is split by cutting the core longitudinally with a
blade (the core is relatively soft). Primary sample preparation (drying and grinding) is carried
out at either the JSC Volkovgeologiya Laboratory in Taikonur or the Central Experimental and
Methodological Expedition Laboratory (“CEME”) in Almaty. Pulped samples from JSC
Volkovgeologia are taken to CEME for further processing. The preparation methods are
similar at both laboratories.
Both Laboratories are subsidiaries of JSC Volkovgeologia which is subsidiary of
Kazatomprom.
Quality Control samples (standards and duplicates) were submitted (10% of the total
number of samples) in coded form. Blank samples were not submitted, but the absence of
blank samples is not considered critical for Mineral Resource estimation since the Mineral
Resource estimate is based on geophysical data.
Samples to be analysed for uranium, radium, rhenium and other elements were crushed to 1
mm with check sieving and subsequent quartering to reliable final weight (Q=0.200 kg) at 0.2
coefficient of irregularity and sample initial weight up to 7.0 kg.
Sample quartering in CEME was performed by rule of thumb, which is not advisable but in
the case of hydrogenous uranium deposits, this has no material influence on final analytical
quality.
The crushers were cleaned using a brush and the sample trays were washed.
A sample treatment flowsheet (Figure 11-1) was developed based on an average initial
weight of samples, maximum diameter of fragments and coefficient that reflects the degree
of uranium distribution non-uniformity in mineralized rocks (К) by the formula shown below.
This characterises the degree of commercial component distribution non-uniformity in
mineralized rocks.
Q=K*d2,
where: Q = sample initial weight (kg), d = diameter of small particles (mm) and К = coefficient
The coefficient of irregularity was determined mathematically, using a coefficient of
variation of commercial component grade calculated by the following formula:
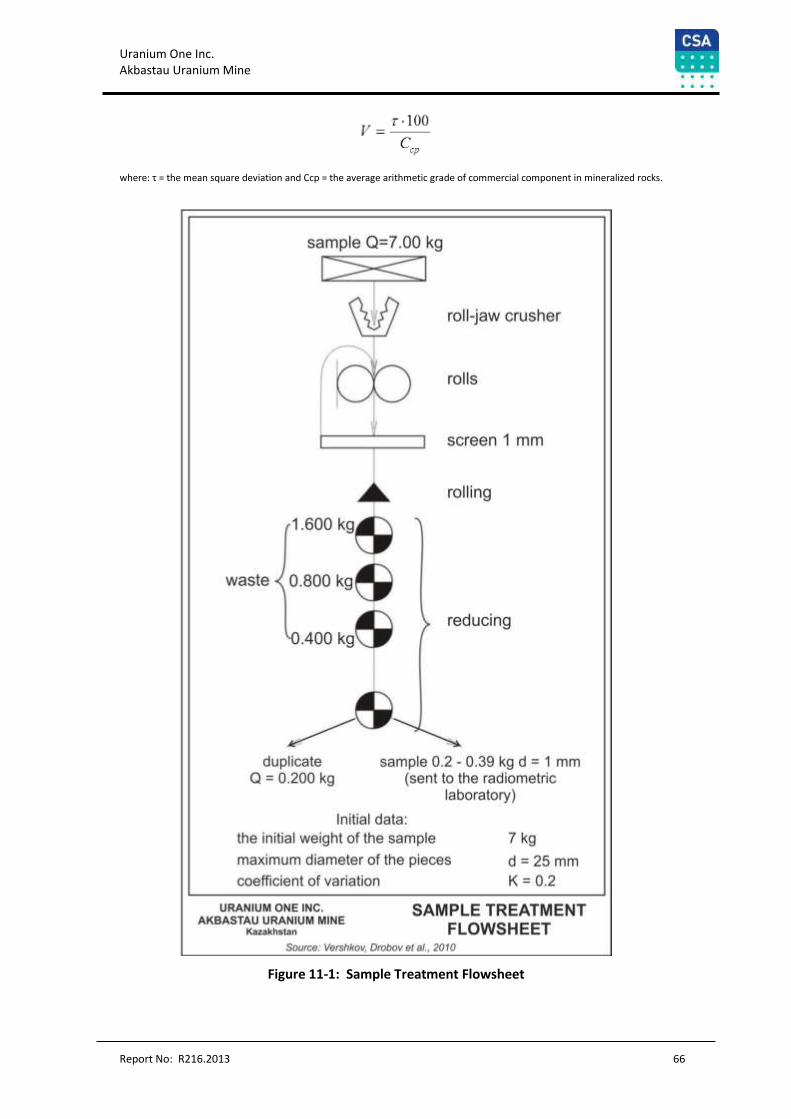
Uranium One Inc. Akbastau Uranium Mine
Report No: R216.2013 66
where: τ = the mean square deviation and Сср = the average arithmetic grade of commercial component in mineralized rocks.
Figure 11-1: Sample Treatment Flowsheet
Uranium One Inc. Akbastau Uranium Mine
Report No: R216.2013 67
Treatment quality control involved daily comparisons of sample weight before and after
crushing. The value of average relative loss for mineralized sands for one sample was from
0.7 to 1.8% (by exploration years), which indicates a small loss in sample treatment
procedure and high quality of work.
Sample duplicates were stored in CEME until approval of the report by GKZ, after which they
are transferred to the Mine for storage.
All activities performed with the samples are registered in special logs.
11.2 Analytical Work
The CEME Laboratory performed the following analyses of geological samples:
analysis for uranium, radium, thorium and potassium
analysis for rare earth elements
analysis for molybdenum, selenium and rhenium
spectral analyses for a wide range of elements
chemical and silicate analyses
analyses of physical properties (moisture content)
grain size analysis
metallurgical tests for uranium leaching
mineralogical analysis.
The CEME Laboratory is the former Central Laboratory of Volkovgeologiya PGA and has been
specialising in uranium-related analyses since 1950. The laboratory complies with the
current requirements (STRK ISO/MEK 17025-2007 Standard) and operates based on
corresponding accreditation certificate and required standard techniques.
The laboratory has 44 regular staff employed in the following subdivisions:
Chemical laboratory (chemical analyses of solid and liquid samples, complete and
reduced analysis of water, radiogeochemical analyses of uranium, radium, thorium,
lead-210 and polonium-210),
Physical laboratory (analyses of geological samples for uranium, radium, thorium
and potassium),
Metallurgical laboratory (metallurgical, mineralogical and X-ray analysis of
mineralized samples),
Test result quality control laboratory.
Uranium One Inc. Akbastau Uranium Mine
Report No: R216.2013 68
Laboratory analyses of the Mine’s samples are completed in order to:
Study the uranium distribution and distribution of other radioactive elements
(thorium and potassium)
Study of the uranium mineralization radiological characteristics
Validate the reliability of uranium mineralization parameters defined by downhole
GRL results (by direct determination of uranium in core samples)
Determine concentrations of associated elements (selenium, molybdenum, rhenium,
rare earths and scandium)
Determine rock grain size and its correlation with electric properties
Defining the possibility of introducing ISR methods based on results of laboratory
analyses.
11.2.1 Determination of Uranium and Radium
The determination of uranium and radium concentration is significant for not only
verification of GRL data but also for the identification of mineralized rocks radiological
properties, which have a quite high variability, while distribution of uranium and radium is in
disequilibrium (see below for details). Analyses are also carried out for thorium and
potassium, which also contribute to gamma-activity of mineralized rocks.
Uranium and thorium analyses are performed using a ARF-6 XRF (X-ray fluorescence or XRF)
analyser. Uranium and thorium are determined by measuring the intensity of characteristic
fluorescent radiation from the surface of a powdered sample ground to 200 mesh when
irradiated. The equipment is old but functional. Its principal advantage is a low threshold of
determination. In the case of uranium and thorium, it is approximately 2 * 10-4 %. This is the
reason why all analyses of uranium in mineralized samples that are used for determination
of radioactive equilibrium between uranium and radium are analysed using this equipment
(in order to compare them with GRL results).
The analysis of uranium and other heavy elements (L-line) and light elements (K-line) (26
elements) is performed using a RLP-21Т analyser. The equipment is quite up-to-date and
compact. However, this device cannot substitute for the ARF-6 analyser, as its registration
threshold for uranium is 1*10-3 %. Considering that estimation of radium cut off
concentrations requires determination of uranium with grades to the fourth decimal place it
becomes clear that this instrument can produce reliable analyses of core for grades >0.01%
only.
Analyses of radium are performed by CAP (Chemical Analysis Party) using two methods. In
terms of application, the first method is older and is referred to as “complex geophysical
method”. According to this method, a powdered sample milled to 1 mm and about 50 g in
weight is put into a special container. The container is sealed hermetically. Using a special
gamma-unit (UIR-1), which measures integral activity, the sample is subjected to gamma-
activity measurement.
Uranium One Inc. Akbastau Uranium Mine
Report No: R216.2013 69
The sample is then stored for 15 days and measured again. Samples with low radium grades
(0.01% equilibrium U and lower) are stored for up to 30 days. Observed growth of activity is
associated with radon accumulation. Knowing the accumulation time (from the moment of
sealing the container) radium concentration in the sample is calculated based on radon
accumulation tables. During calculation, there are allowances made for thorium (by XRF) and
potassium grades (flame photometry). Despite the age of the equipment, this method
features low threshold of radium determination – 5*10-4 % of equilibrium U.
The second method for radium analysis used in the laboratory is gamma-ray spectrometry.
In accordance with this method a sample of about 200 g is measured in a container using a
gamma-ray spectrometer. Radium concentration is determined by total intensity of lines
295, 352 keV (radium B) and 609 keV (radium C). To increase instrument sensitivity the
detector is placed in a thick lead screen, which reduces background of the spectrometer. The
spectrometer crystal has a cavity into which the container with the sample is placed. Gamma
spectrometric analysis threshold equals 5*10-4 % of equilibrium U.
Potassium is analysed using the flame photometry method. Analyses are performed using a
Jenway PFP-7 flame photometer.
In order to evaluate the accuracy of analyses the following control analyses were performed:
Internal control of X-ray spectral analysis for uranium and complex method for
radium with coding sample numbers. The relative mean square error value, which is
compared with the permissible mean square error, is calculated based on internal
control results.
Extra methodological control of analyses for uranium and radium. Chemical analysis
results were approved as an external control for X-ray spectral analyses for uranium,
whereas radiochemical analyses were accepted for the complex method. Extra
methodological control data identified the presence or absence of systematic error
in analyses for uranium and radium. An error value was calculated.
External control of chemical analyses for uranium and radiochemical analyses for
radium was performed in VIMS Laboratory and Nevskoe PGA Laboratory. External
control results were used to identify and calculate systematic discrepancy values in
chemical and radiochemical analyses performed in Volkovgeologiya CAL.
The laboratory retains a log of control coded samples.
The accuracy of uranium and radium analyses was systematically tested such that control
analyses were consistently submitted and representative of the entire deposit area. The
number of core samples and quality control analyses is shown in Table 11-1. Data on
geological control of uranium and radium analyses are given in Table 11-2. The results of
extra methodological control of uranium and radium analyses are given in Table 11-1 and
Table 11-3. External control results are presented in Table 11-4.
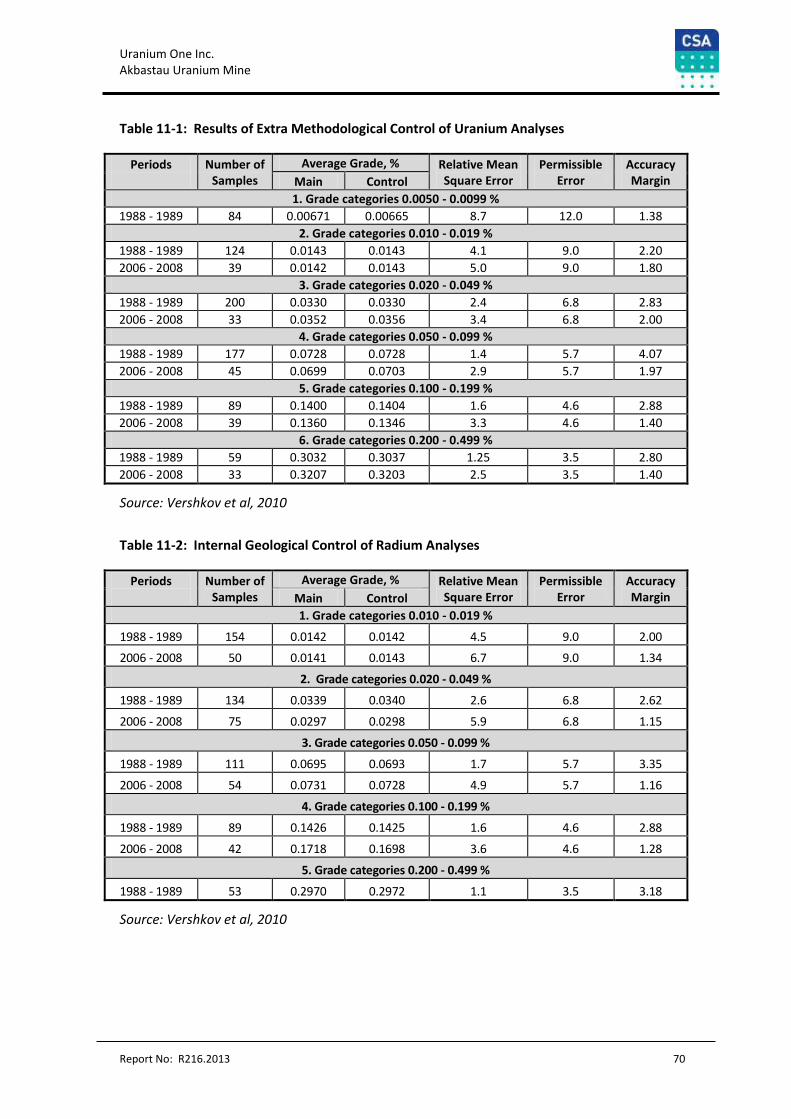
Uranium One Inc. Akbastau Uranium Mine
Report No: R216.2013 70
Table 11-1: Results of Extra Methodological Control of Uranium Analyses
Periods
Number of Samples
Average Grade, % Relative Mean Square Error
Permissible Error
Accuracy Margin Main Control
1. Grade categories 0.0050 - 0.0099 %
1988 - 1989 84 0.00671 0.00665 8.7 12.0 1.38
2. Grade categories 0.010 - 0.019 %
1988 - 1989 124 0.0143 0.0143 4.1 9.0 2.20
2006 - 2008 39 0.0142 0.0143 5.0 9.0 1.80
3. Grade categories 0.020 - 0.049 %
1988 - 1989 200 0.0330 0.0330 2.4 6.8 2.83
2006 - 2008 33 0.0352 0.0356 3.4 6.8 2.00
4. Grade categories 0.050 - 0.099 %
1988 - 1989 177 0.0728 0.0728 1.4 5.7 4.07
2006 - 2008 45 0.0699 0.0703 2.9 5.7 1.97
5. Grade categories 0.100 - 0.199 %
1988 - 1989 89 0.1400 0.1404 1.6 4.6 2.88
2006 - 2008 39 0.1360 0.1346 3.3 4.6 1.40
6. Grade categories 0.200 - 0.499 %
1988 - 1989 59 0.3032 0.3037 1.25 3.5 2.80
2006 - 2008 33 0.3207 0.3203 2.5 3.5 1.40
Source: Vershkov et al, 2010
Table 11-2: Internal Geological Control of Radium Analyses
Periods
Number of Samples
Average Grade, % Relative Mean Square Error
Permissible Error
Accuracy Margin Main Control
1. Grade categories 0.010 - 0.019 %
1988 - 1989 154 0.0142 0.0142 4.5 9.0 2.00
2006 - 2008 50 0.0141 0.0143 6.7 9.0 1.34
2. Grade categories 0.020 - 0.049 %
1988 - 1989 134 0.0339 0.0340 2.6 6.8 2.62
2006 - 2008 75 0.0297 0.0298 5.9 6.8 1.15
3. Grade categories 0.050 - 0.099 %
1988 - 1989 111 0.0695 0.0693 1.7 5.7 3.35
2006 - 2008 54 0.0731 0.0728 4.9 5.7 1.16
4. Grade categories 0.100 - 0.199 %
1988 - 1989 89 0.1426 0.1425 1.6 4.6 2.88
2006 - 2008 42 0.1718 0.1698 3.6 4.6 1.28
5. Grade categories 0.200 - 0.499 %
1988 - 1989 53 0.2970 0.2972 1.1 3.5 3.18
Source: Vershkov et al, 2010
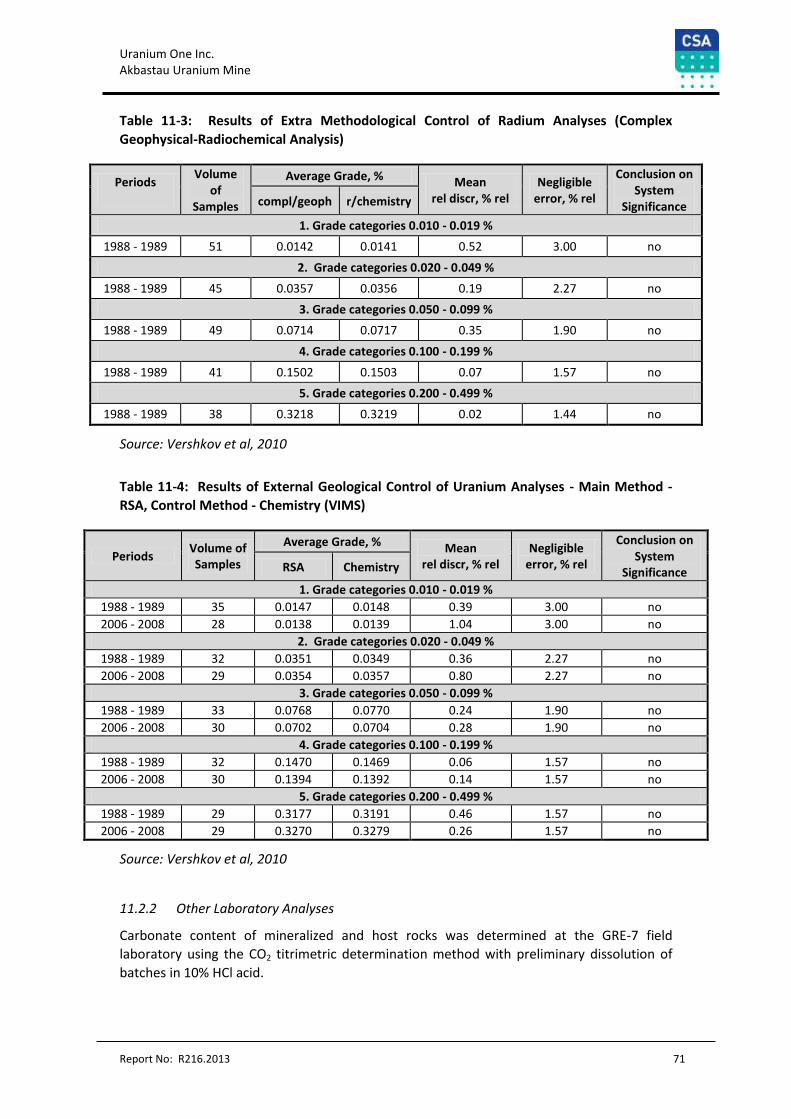
Uranium One Inc. Akbastau Uranium Mine
Report No: R216.2013 71
Table 11-3: Results of Extra Methodological Control of Radium Analyses (Complex
Geophysical-Radiochemical Analysis)
Periods
Volume of
Samples
Average Grade, % Mean rel discr, % rel
Negligible error, % rel
Conclusion on System
Significance compl/geoph r/chemistry
1. Grade categories 0.010 - 0.019 %
1988 - 1989 51 0.0142 0.0141 0.52 3.00 no
2. Grade categories 0.020 - 0.049 %
1988 - 1989 45 0.0357 0.0356 0.19 2.27 no
3. Grade categories 0.050 - 0.099 %
1988 - 1989 49 0.0714 0.0717 0.35 1.90 no
4. Grade categories 0.100 - 0.199 %
1988 - 1989 41 0.1502 0.1503 0.07 1.57 no
5. Grade categories 0.200 - 0.499 %
1988 - 1989 38 0.3218 0.3219 0.02 1.44 no
Source: Vershkov et al, 2010
Table 11-4: Results of External Geological Control of Uranium Analyses - Main Method -
RSA, Control Method - Chemistry (VIMS)
Periods Volume of Samples
Average Grade, % Mean rel discr, % rel
Negligible error, % rel
Conclusion on System
Significance RSA Chemistry
1. Grade categories 0.010 - 0.019 %
1988 - 1989 35 0.0147 0.0148 0.39 3.00 no
2006 - 2008 28 0.0138 0.0139 1.04 3.00 no
2. Grade categories 0.020 - 0.049 %
1988 - 1989 32 0.0351 0.0349 0.36 2.27 no
2006 - 2008 29 0.0354 0.0357 0.80 2.27 no
3. Grade categories 0.050 - 0.099 %
1988 - 1989 33 0.0768 0.0770 0.24 1.90 no
2006 - 2008 30 0.0702 0.0704 0.28 1.90 no
4. Grade categories 0.100 - 0.199 %
1988 - 1989 32 0.1470 0.1469 0.06 1.57 no
2006 - 2008 30 0.1394 0.1392 0.14 1.57 no
5. Grade categories 0.200 - 0.499 %
1988 - 1989 29 0.3177 0.3191 0.46 1.57 no
2006 - 2008 29 0.3270 0.3279 0.26 1.57 no
Source: Vershkov et al, 2010
11.2.2 Other Laboratory Analyses
Carbonate content of mineralized and host rocks was determined at the GRE-7 field
laboratory using the CO2 titrimetric determination method with preliminary dissolution of
batches in 10% HCl acid.
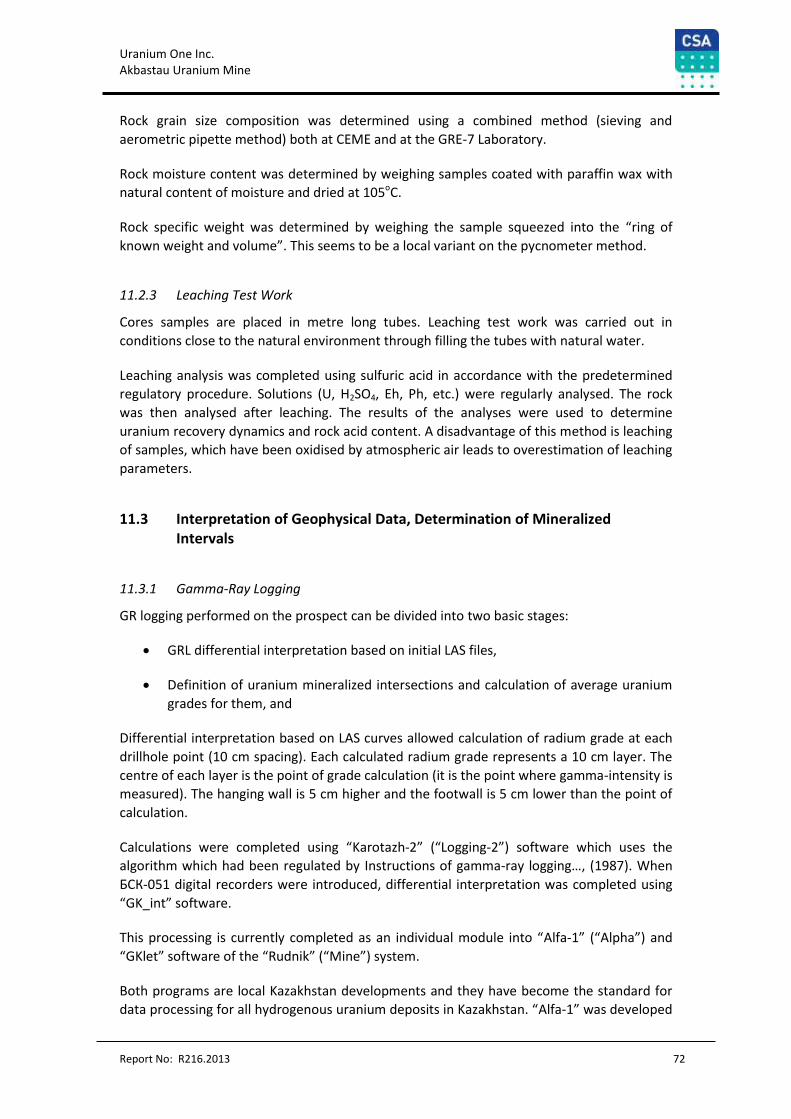
Uranium One Inc. Akbastau Uranium Mine
Report No: R216.2013 72
Rock grain size composition was determined using a combined method (sieving and
aerometric pipette method) both at CEME and at the GRE-7 Laboratory.
Rock moisture content was determined by weighing samples coated with paraffin wax with
natural content of moisture and dried at 105oC.
Rock specific weight was determined by weighing the sample squeezed into the “ring of
known weight and volume”. This seems to be a local variant on the pycnometer method.
11.2.3 Leaching Test Work
Cores samples are placed in metre long tubes. Leaching test work was carried out in
conditions close to the natural environment through filling the tubes with natural water.
Leaching analysis was completed using sulfuric acid in accordance with the predetermined
regulatory procedure. Solutions (U, H2SO4, Eh, Ph, etc.) were regularly analysed. The rock
was then analysed after leaching. The results of the analyses were used to determine
uranium recovery dynamics and rock acid content. A disadvantage of this method is leaching
of samples, which have been oxidised by atmospheric air leads to overestimation of leaching
parameters.
11.3 Interpretation of Geophysical Data, Determination of Mineralized Intervals
11.3.1 Gamma-Ray Logging
GR logging performed on the prospect can be divided into two basic stages:
GRL differential interpretation based on initial LAS files,
Definition of uranium mineralized intersections and calculation of average uranium
grades for them, and
Differential interpretation based on LAS curves allowed calculation of radium grade at each
drillhole point (10 cm spacing). Each calculated radium grade represents a 10 cm layer. The
centre of each layer is the point of grade calculation (it is the point where gamma-intensity is
measured). The hanging wall is 5 cm higher and the footwall is 5 cm lower than the point of
calculation.
Calculations were completed using “Karotazh-2” (“Logging-2”) software which uses the
algorithm which had been regulated by Instructions of gamma-ray logging…, (1987). When
БСК-051 digital recorders were introduced, differential interpretation was completed using
“GK_int” software.
This processing is currently completed as an individual module into “Alfa-1” (“Alpha”) and
“GKlet” software of the “Rudnik” (“Mine”) system.
Both programs are local Kazakhstan developments and they have become the standard for
data processing for all hydrogenous uranium deposits in Kazakhstan. “Alfa-1” was developed
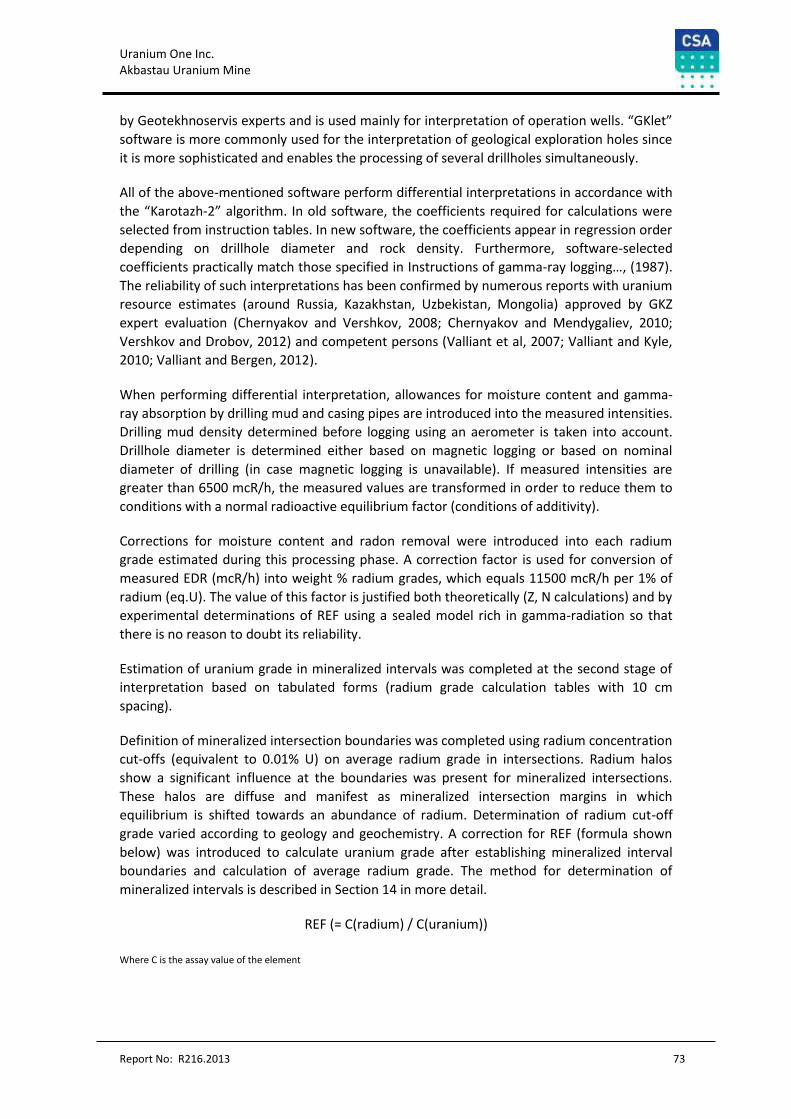
Uranium One Inc. Akbastau Uranium Mine
Report No: R216.2013 73
by Geotekhnoservis experts and is used mainly for interpretation of operation wells. “GKlet”
software is more commonly used for the interpretation of geological exploration holes since
it is more sophisticated and enables the processing of several drillholes simultaneously.
All of the above-mentioned software perform differential interpretations in accordance with
the “Karotazh-2” algorithm. In old software, the coefficients required for calculations were
selected from instruction tables. In new software, the coefficients appear in regression order
depending on drillhole diameter and rock density. Furthermore, software-selected
coefficients practically match those specified in Instructions of gamma-ray logging…, (1987).
The reliability of such interpretations has been confirmed by numerous reports with uranium
resource estimates (around Russia, Kazakhstan, Uzbekistan, Mongolia) approved by GKZ
expert evaluation (Chernyakov and Vershkov, 2008; Chernyakov and Mendygaliev, 2010;
Vershkov and Drobov, 2012) and competent persons (Valliant et al, 2007; Valliant and Kyle,
2010; Valliant and Bergen, 2012).
When performing differential interpretation, allowances for moisture content and gamma-
ray absorption by drilling mud and casing pipes are introduced into the measured intensities.
Drilling mud density determined before logging using an aerometer is taken into account.
Drillhole diameter is determined either based on magnetic logging or based on nominal
diameter of drilling (in case magnetic logging is unavailable). If measured intensities are
greater than 6500 mcR/h, the measured values are transformed in order to reduce them to
conditions with a normal radioactive equilibrium factor (conditions of additivity).
Corrections for moisture content and radon removal were introduced into each radium
grade estimated during this processing phase. A correction factor is used for conversion of
measured EDR (mcR/h) into weight % radium grades, which equals 11500 mcR/h per 1% of
radium (eq.U). The value of this factor is justified both theoretically (Z, N calculations) and by
experimental determinations of REF using a sealed model rich in gamma-radiation so that
there is no reason to doubt its reliability.
Estimation of uranium grade in mineralized intervals was completed at the second stage of
interpretation based on tabulated forms (radium grade calculation tables with 10 cm
spacing).
Definition of mineralized intersection boundaries was completed using radium concentration
cut-offs (equivalent to 0.01% U) on average radium grade in intersections. Radium halos
show a significant influence at the boundaries was present for mineralized intersections.
These halos are diffuse and manifest as mineralized intersection margins in which
equilibrium is shifted towards an abundance of radium. Determination of radium cut-off
grade varied according to geology and geochemistry. A correction for REF (formula shown
below) was introduced to calculate uranium grade after establishing mineralized interval
boundaries and calculation of average radium grade. The method for determination of
mineralized intervals is described in Section 14 in more detail.
REF (= С(radium) / С(uranium))
Where C is the assay value of the element
Uranium One Inc. Akbastau Uranium Mine
Report No: R216.2013 74
11.3.2 Resistivity Logging
Electric resistivity logging was the main method of differentiating sedimentary mineralized-
hosting rock by permeability. SP was less effective due to the use of drilling fluid with the
same electrical characteristics to that of ground water. This type of logging along with IL was
used for refinement of the geoelectric section boundaries. Table 11-5 summarises
resistivities for the main components of the sedimentary cross section.
Table 11-5: Geoelectric Properties of Inkuduk Horizon Sediments at the Budenovskoye No.
1 and Budenovskoye No. 3 Deposits
Rock Type Filtration
Characteristic Number of
Determinations Average
Resistivity Standard D(0.5) D(0.6)
Gravel-pebble sediments
Permeable 147 14.2 3.1 0.76 1.17
Poorly sorted sands
Permeable 74 12.2 2.3 0.51 0.80
M-grained sands Permeable 138 10.8 2.0 0.39 0.51
F-grained sands Permeable 32 9.7 2.0 0.23 0.31
Poorly sorted sands, clayey
Impermeable 33 8.3 1.7 0.19 0.24
Clays, silts Impermeable 18 5.8 1.5 0.09 0.10
Source: Vershkov et al, 2012
Table 11-5 shows that clays and silts are reliably isolated by electric resistivities. With
medium- and fine-grained sands (permeable) in the background, isolation of poorly-sorted
clayey sands, which also represent impermeable sediments, is questionable due to similar
geoelectric properties.
Predictions of permeability coefficients (PCs) based on RL data was performed using
dependence of D(0.6) on resistivity and PC from D(0.6) obtained in hydrogeological holes.
Naturally, for impermeable mineralized rocks in clays and silts the predictive results are
characterised by fair reliability. For clayey sands, the prediction is questionable.
11.3.3 Control of Geophysical Surveys
GRL quality was assessed by using the results of control GRLs performed in exploratory holes
either using different equipment or with the procedure performed by a more experienced
operator, as well as based on results of logging in the control-confirmatory hole. Control GRL
and results of comparing the main and control logging are given in Table 11-6.
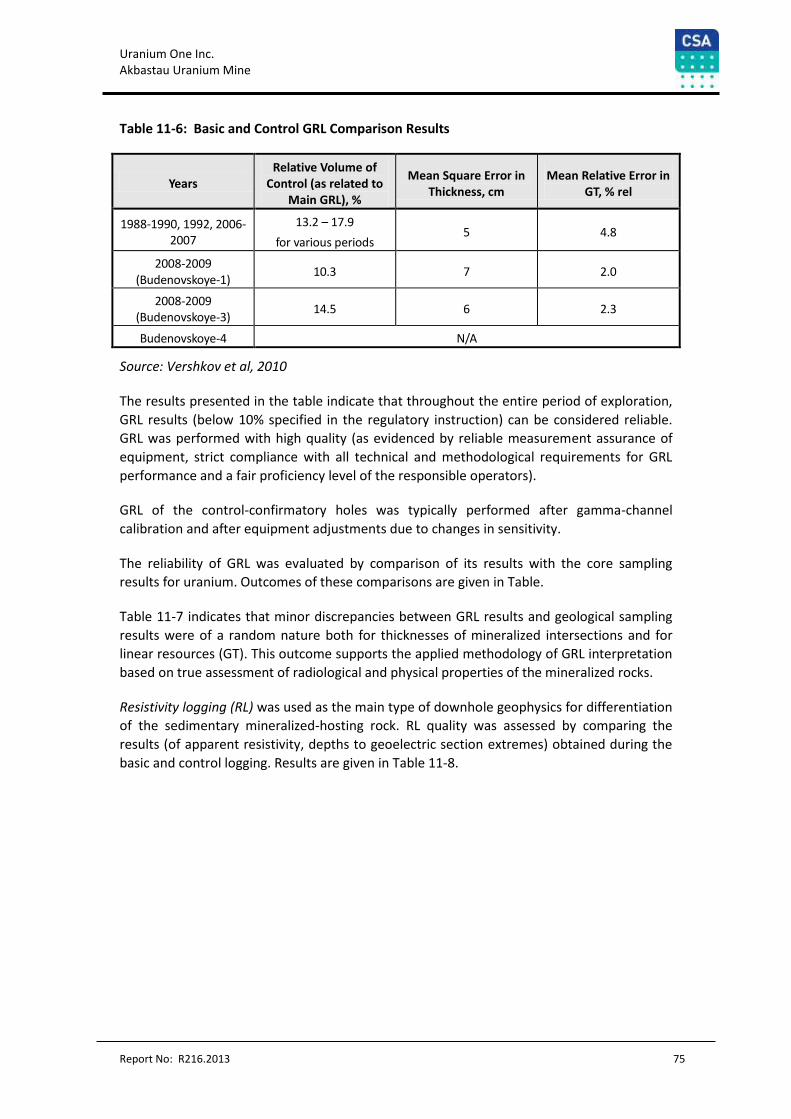
Uranium One Inc. Akbastau Uranium Mine
Report No: R216.2013 75
Table 11-6: Basic and Control GRL Comparison Results
Years Relative Volume of
Control (as related to Main GRL), %
Mean Square Error in Thickness, cm
Mean Relative Error in GT, % rel
1988-1990, 1992, 2006-2007
13.2 – 17.9
for various periods 5 4.8
2008-2009 (Budenovskoye-1)
10.3 7 2.0
2008-2009 (Budenovskoye-3)
14.5 6 2.3
Budenovskoye-4 N/A
Source: Vershkov et al, 2010
The results presented in the table indicate that throughout the entire period of exploration,
GRL results (below 10% specified in the regulatory instruction) can be considered reliable.
GRL was performed with high quality (as evidenced by reliable measurement assurance of
equipment, strict compliance with all technical and methodological requirements for GRL
performance and a fair proficiency level of the responsible operators).
GRL of the control-confirmatory holes was typically performed after gamma-channel
calibration and after equipment adjustments due to changes in sensitivity.
The reliability of GRL was evaluated by comparison of its results with the core sampling
results for uranium. Outcomes of these comparisons are given in Table.
Table 11-7 indicates that minor discrepancies between GRL results and geological sampling
results were of a random nature both for thicknesses of mineralized intersections and for
linear resources (GT). This outcome supports the applied methodology of GRL interpretation
based on true assessment of radiological and physical properties of the mineralized rocks.
Resistivity logging (RL) was used as the main type of downhole geophysics for differentiation
of the sedimentary mineralized-hosting rock. RL quality was assessed by comparing the
results (of apparent resistivity, depths to geoelectric section extremes) obtained during the
basic and control logging. Results are given in Table 11-8.
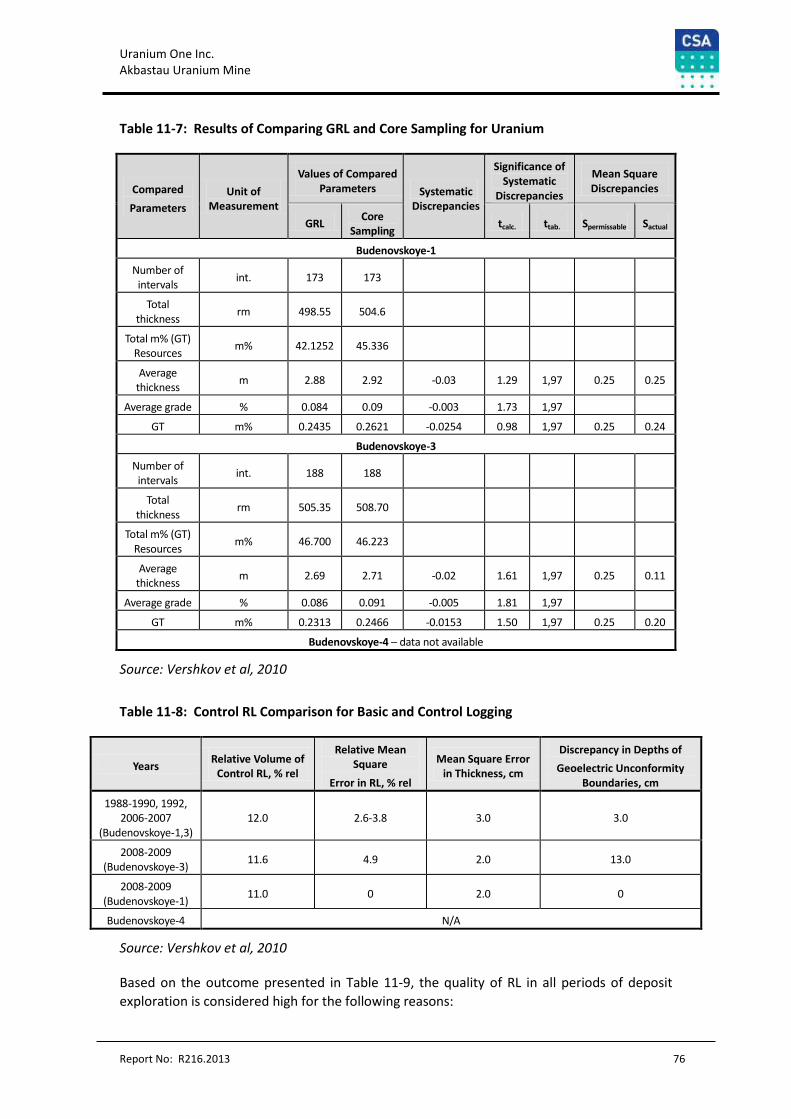
Uranium One Inc. Akbastau Uranium Mine
Report No: R216.2013 76
Table 11-7: Results of Comparing GRL and Core Sampling for Uranium
Compared
Parameters
Unit of Measurement
Values of Compared Parameters Systematic
Discrepancies
Significance of Systematic
Discrepancies
Mean Square Discrepancies
GRL Core
Sampling tcalc. ttab. Spermissable Sactual
Budenovskoye-1
Number of intervals
int. 173 173
Total thickness
rm 498.55 504.6
Total m% (GT) Resources
m% 42.1252 45.336
Average thickness
m 2.88 2.92 -0.03 1.29 1,97 0.25 0.25
Average grade % 0.084 0.09 -0.003 1.73 1,97
GT m% 0.2435 0.2621 -0.0254 0.98 1,97 0.25 0.24
Budenovskoye-3
Number of intervals
int. 188 188
Total thickness
rm 505.35 508.70
Total m% (GT) Resources
m% 46.700 46.223
Average thickness
m 2.69 2.71 -0.02 1.61 1,97 0.25 0.11
Average grade % 0.086 0.091 -0.005 1.81 1,97
GT m% 0.2313 0.2466 -0.0153 1.50 1,97 0.25 0.20
Budenovskoye-4 – data not available
Source: Vershkov et al, 2010
Table 11-8: Control RL Comparison for Basic and Control Logging
Years Relative Volume of
Control RL, % rel
Relative Mean Square
Error in RL, % rel
Mean Square Error in Thickness, cm
Discrepancy in Depths of
Geoelectric Unconformity Boundaries, cm
1988-1990, 1992, 2006-2007
(Budenovskoye-1,3) 12.0 2.6-3.8 3.0 3.0
2008-2009 (Budenovskoye-3)
11.6 4.9 2.0 13.0
2008-2009 (Budenovskoye-1)
11.0 0 2.0 0
Budenovskoye-4 N/A
Source: Vershkov et al, 2010
Based on the outcome presented in Table 11-9, the quality of RL in all periods of deposit
exploration is considered high for the following reasons:
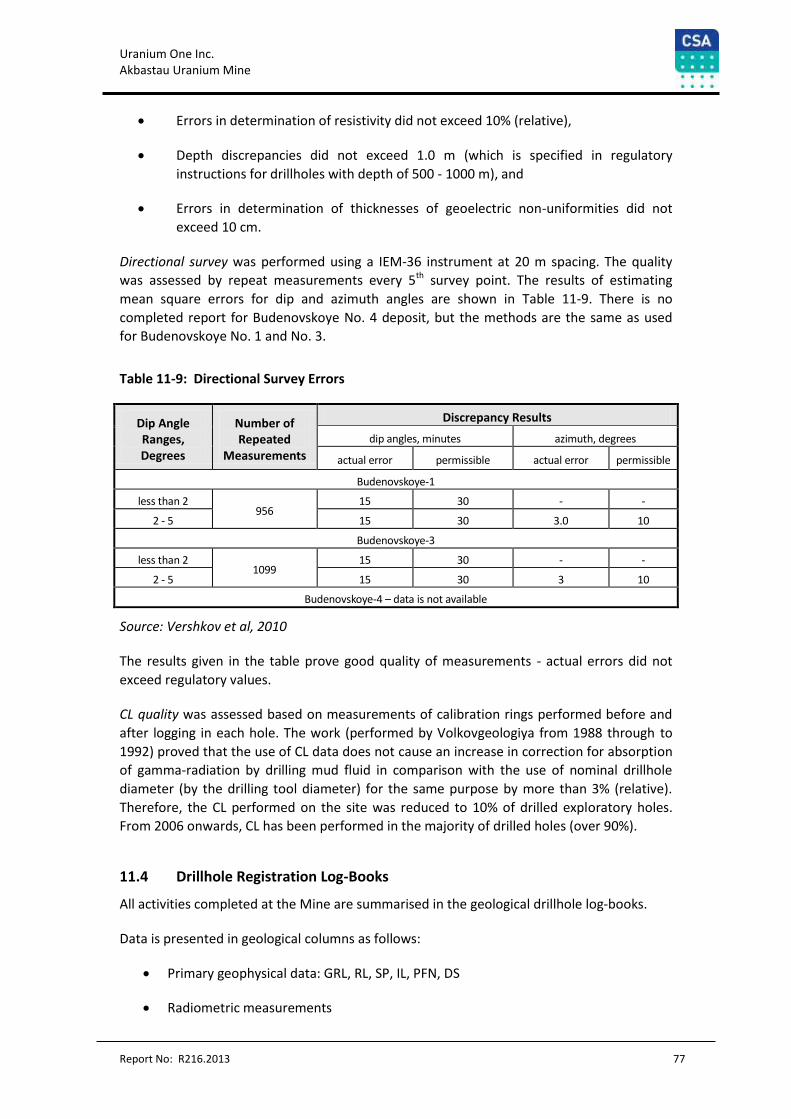
Uranium One Inc. Akbastau Uranium Mine
Report No: R216.2013 77
Errors in determination of resistivity did not exceed 10% (relative),
Depth discrepancies did not exceed 1.0 m (which is specified in regulatory
instructions for drillholes with depth of 500 - 1000 m), and
Errors in determination of thicknesses of geoelectric non-uniformities did not
exceed 10 cm.
Directional survey was performed using a IEM-36 instrument at 20 m spacing. The quality
was assessed by repeat measurements every 5th survey point. The results of estimating
mean square errors for dip and azimuth angles are shown in Table 11-9. There is no
completed report for Budenovskoye No. 4 deposit, but the methods are the same as used
for Budenovskoye No. 1 and No. 3.
Table 11-9: Directional Survey Errors
Dip Angle Ranges, Degrees
Number of Repeated
Measurements
Discrepancy Results
dip angles, minutes azimuth, degrees
actual error permissible actual error permissible
Budenovskoye-1
less than 2 956
15 30 - -
2 - 5 15 30 3.0 10
Budenovskoye-3
less than 2 1099
15 30 - -
2 - 5 15 30 3 10
Budenovskoye-4 – data is not available
Source: Vershkov et al, 2010
The results given in the table prove good quality of measurements - actual errors did not
exceed regulatory values.
CL quality was assessed based on measurements of calibration rings performed before and
after logging in each hole. The work (performed by Volkovgeologiya from 1988 through to
1992) proved that the use of CL data does not cause an increase in correction for absorption
of gamma-radiation by drilling mud fluid in comparison with the use of nominal drillhole
diameter (by the drilling tool diameter) for the same purpose by more than 3% (relative).
Therefore, the CL performed on the site was reduced to 10% of drilled exploratory holes.
From 2006 onwards, CL has been performed in the majority of drilled holes (over 90%).
11.4 Drillhole Registration Log-Books
All activities completed at the Mine are summarised in the geological drillhole log-books.
Data is presented in geological columns as follows:
Primary geophysical data: GRL, RL, SP, IL, PFN, DS
Radiometric measurements
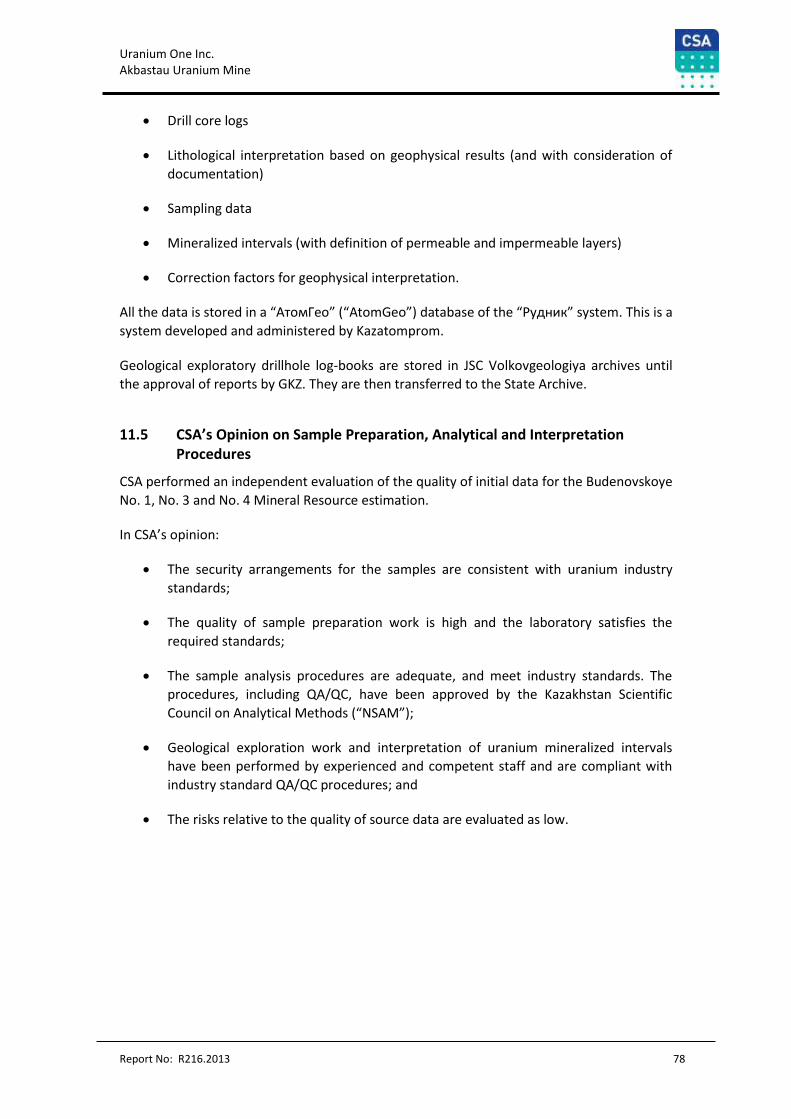
Uranium One Inc. Akbastau Uranium Mine
Report No: R216.2013 78
Drill core logs
Lithological interpretation based on geophysical results (and with consideration of
documentation)
Sampling data
Mineralized intervals (with definition of permeable and impermeable layers)
Correction factors for geophysical interpretation.
All the data is stored in a “АтомГео” (“AtomGeo”) database of the “Рудник” system. This is a
system developed and administered by Kazatomprom.
Geological exploratory drillhole log-books are stored in JSC Volkovgeologiya archives until
the approval of reports by GKZ. They are then transferred to the State Archive.
11.5 CSA’s Opinion on Sample Preparation, Analytical and Interpretation Procedures
CSA performed an independent evaluation of the quality of initial data for the Budenovskoye
No. 1, No. 3 and No. 4 Mineral Resource estimation.
In CSA’s opinion:
The security arrangements for the samples are consistent with uranium industry
standards;
The quality of sample preparation work is high and the laboratory satisfies the
required standards;
The sample analysis procedures are adequate, and meet industry standards. The
procedures, including QA/QC, have been approved by the Kazakhstan Scientific
Council on Analytical Methods (“NSAM”);
Geological exploration work and interpretation of uranium mineralized intervals
have been performed by experienced and competent staff and are compliant with
industry standard QA/QC procedures; and
The risks relative to the quality of source data are evaluated as low.
Uranium One Inc. Akbastau Uranium Mine
Report No: R216.2013 79
12 Data Verification
Maxim Seredkin visited the Mine from April 22 2012 through to April 23 2012 and reviewed
geological reports, drilling procedures and surveys in operation wells. Maxim Seredkin
examined the geological exploration drilling procedure, core recovery methods and
documentation and geophysical logging. Methodology and contractors are consistent across
all areas of the Budenovskoye deposit.
From April 20 2012 through to April 21 2012, Maxim Seredkin visited JSC Volkovgeologiya in
at Taikonur. This included the laboratory where the author was able to meet with JSC
Volkovgeologiya and Geotekhnoservis LLP personnel who are responsible for fieldwork at
the Mine.
From April 24 2012 through April 27 2012, Maxim Seredkin visited CEME and
Geotekhnoservis in Almaty, and had an opportunity to interview the personnel there.
CSA has reviewed the drill logs, cross-sections, plan maps, and electrical logs for the
Budenovskoye No. 2 geological database.
All work relating to geological exploration and leach testing was found to be of high quality.
The data is considered suitable for Mineral Resource and Mineral Reserve estimation.
Caution should be exercised when estimating Mineral Resources based on geophysical data
due to the complex radiology of the deposits. It is necessary to take account of the
interpreted composite mineralized intervals since all radiological patterns relate to them.
Mr R. Dennis Bergen visited the site on September 14 and 15 2013. Mr Bergen previously
visited the site on October 14 and 15, 2011 and on June 5 and 6, 2010 as part of an
assignment on the adjacent Akbastau mine. Mr Bergen verified the infrastructure,
processing plant and production plans.
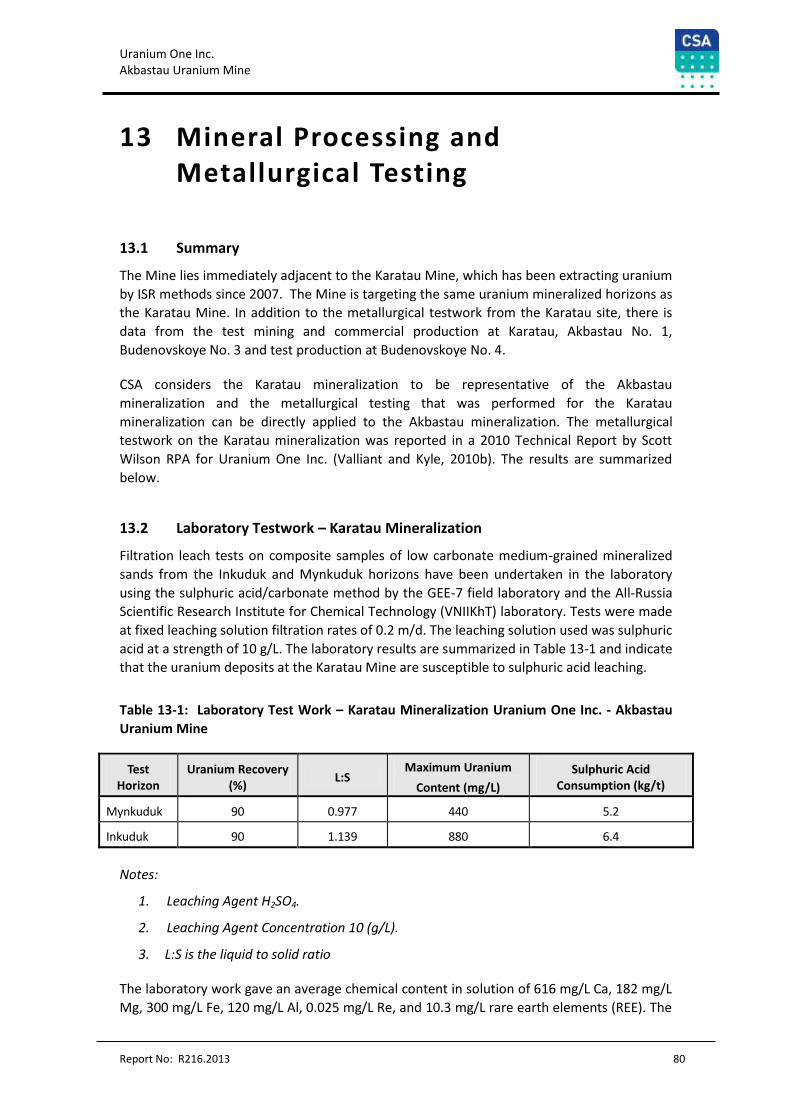
Uranium One Inc. Akbastau Uranium Mine
Report No: R216.2013 80
13 Mineral Processing and Metallurgical Testing
13.1 Summary
The Mine lies immediately adjacent to the Karatau Mine, which has been extracting uranium
by ISR methods since 2007. The Mine is targeting the same uranium mineralized horizons as
the Karatau Mine. In addition to the metallurgical testwork from the Karatau site, there is
data from the test mining and commercial production at Karatau, Akbastau No. 1,
Budenovskoye No. 3 and test production at Budenovskoye No. 4.
CSA considers the Karatau mineralization to be representative of the Akbastau
mineralization and the metallurgical testing that was performed for the Karatau
mineralization can be directly applied to the Akbastau mineralization. The metallurgical
testwork on the Karatau mineralization was reported in a 2010 Technical Report by Scott
Wilson RPA for Uranium One Inc. (Valliant and Kyle, 2010b). The results are summarized
below.
13.2 Laboratory Testwork – Karatau Mineralization
Filtration leach tests on composite samples of low carbonate medium-grained mineralized
sands from the Inkuduk and Mynkuduk horizons have been undertaken in the laboratory
using the sulphuric acid/carbonate method by the GEE-7 field laboratory and the All-Russia
Scientific Research Institute for Chemical Technology (VNIIKhT) laboratory. Tests were made
at fixed leaching solution filtration rates of 0.2 m/d. The leaching solution used was sulphuric
acid at a strength of 10 g/L. The laboratory results are summarized in Table 13-1 and indicate
that the uranium deposits at the Karatau Mine are susceptible to sulphuric acid leaching.
Table 13-1: Laboratory Test Work – Karatau Mineralization Uranium One Inc. - Akbastau
Uranium Mine
Test Horizon
Uranium Recovery (%)
L:S Maximum Uranium
Content (mg/L)
Sulphuric Acid Consumption (kg/t)
Mynkuduk 90 0.977 440 5.2
Inkuduk 90 1.139 880 6.4
Notes:
1. Leaching Agent H2SO4.
2. Leaching Agent Concentration 10 (g/L).
3. L:S is the liquid to solid ratio
The laboratory work gave an average chemical content in solution of 616 mg/L Ca, 182 mg/L
Mg, 300 mg/L Fe, 120 mg/L Al, 0.025 mg/L Re, and 10.3 mg/L rare earth elements (REE). The
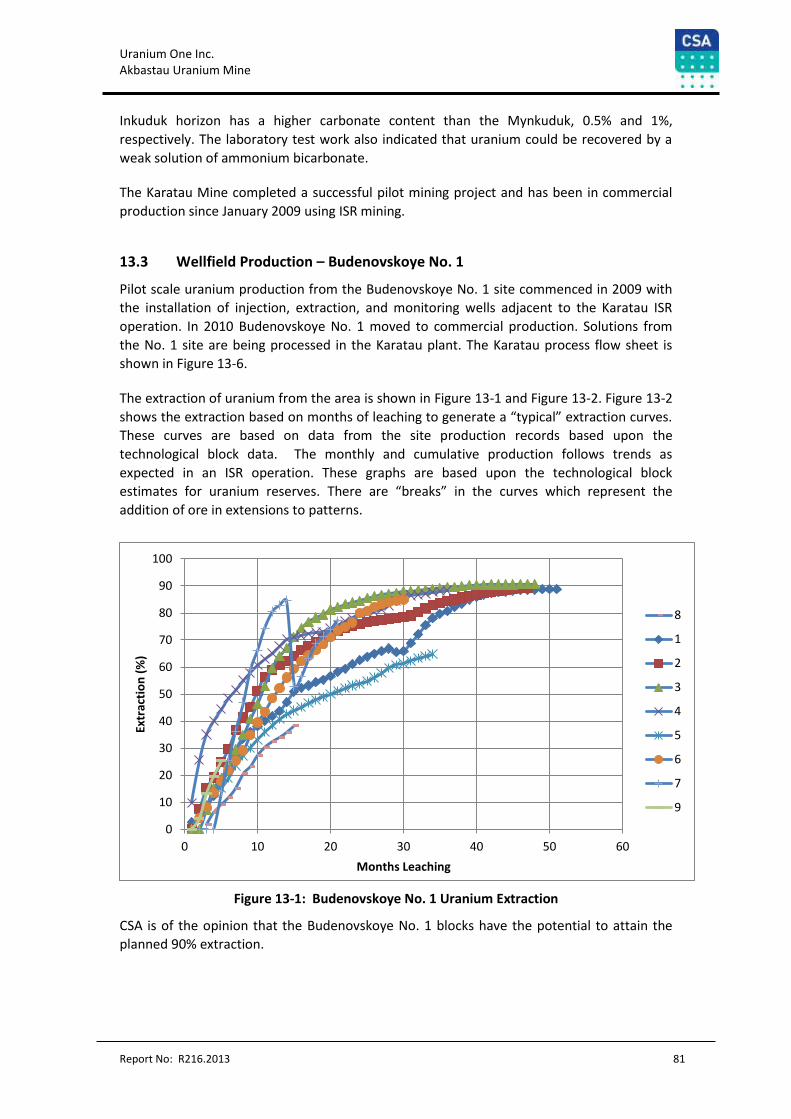
Uranium One Inc. Akbastau Uranium Mine
Report No: R216.2013 81
Inkuduk horizon has a higher carbonate content than the Mynkuduk, 0.5% and 1%,
respectively. The laboratory test work also indicated that uranium could be recovered by a
weak solution of ammonium bicarbonate.
The Karatau Mine completed a successful pilot mining project and has been in commercial
production since January 2009 using ISR mining.
13.3 Wellfield Production – Budenovskoye No. 1
Pilot scale uranium production from the Budenovskoye No. 1 site commenced in 2009 with
the installation of injection, extraction, and monitoring wells adjacent to the Karatau ISR
operation. In 2010 Budenovskoye No. 1 moved to commercial production. Solutions from
the No. 1 site are being processed in the Karatau plant. The Karatau process flow sheet is
shown in Figure 13-6.
The extraction of uranium from the area is shown in Figure 13-1 and Figure 13-2. Figure 13-2
shows the extraction based on months of leaching to generate a “typical” extraction curves.
These curves are based on data from the site production records based upon the
technological block data. The monthly and cumulative production follows trends as
expected in an ISR operation. These graphs are based upon the technological block
estimates for uranium reserves. There are “breaks” in the curves which represent the
addition of ore in extensions to patterns.
Figure 13-1: Budenovskoye No. 1 Uranium Extraction
CSA is of the opinion that the Budenovskoye No. 1 blocks have the potential to attain the
planned 90% extraction.
0
10
20
30
40
50
60
70
80
90
100
0 10 20 30 40 50 60
Extr
acti
on
(%
)
Months Leaching
8
1
2
3
4
5
6
7
9
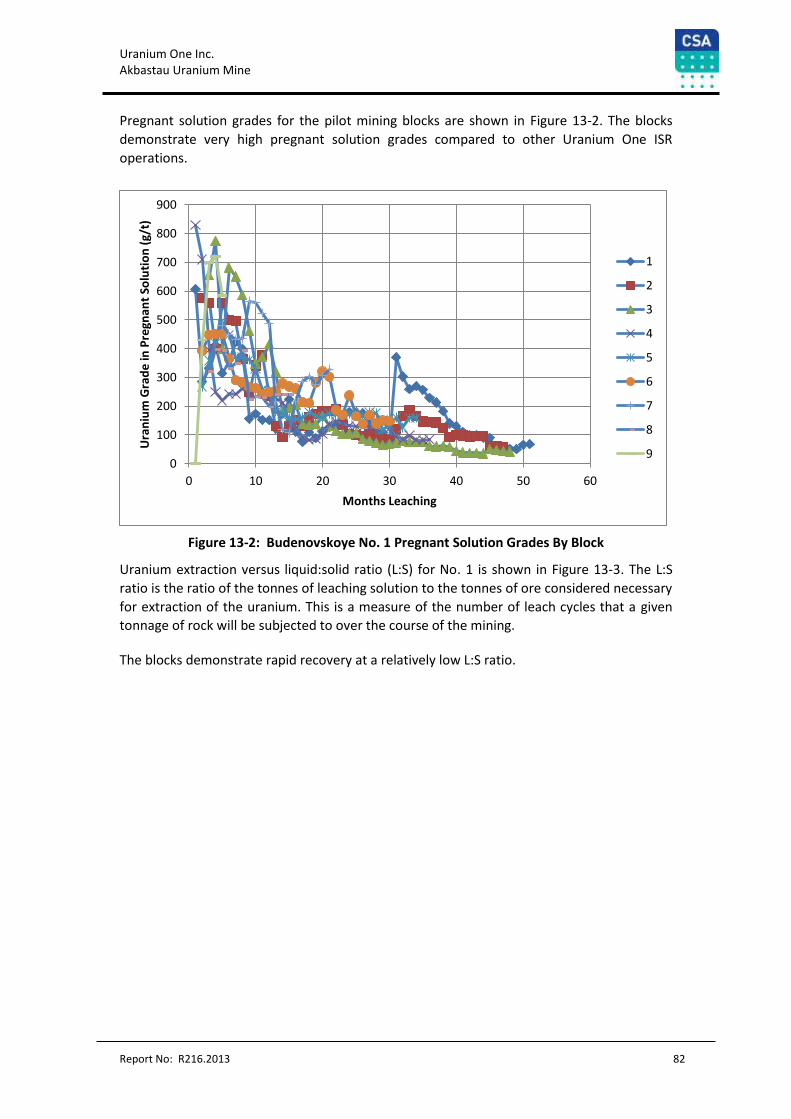
Uranium One Inc. Akbastau Uranium Mine
Report No: R216.2013 82
Pregnant solution grades for the pilot mining blocks are shown in Figure 13-2. The blocks
demonstrate very high pregnant solution grades compared to other Uranium One ISR
operations.
Figure 13-2: Budenovskoye No. 1 Pregnant Solution Grades By Block
Uranium extraction versus liquid:solid ratio (L:S) for No. 1 is shown in Figure 13-3. The L:S
ratio is the ratio of the tonnes of leaching solution to the tonnes of ore considered necessary
for extraction of the uranium. This is a measure of the number of leach cycles that a given
tonnage of rock will be subjected to over the course of the mining.
The blocks demonstrate rapid recovery at a relatively low L:S ratio.
0
100
200
300
400
500
600
700
800
900
0 10 20 30 40 50 60
Ura
niu
m G
rad
e in
Pre
gnan
t So
luti
on
(g/
t)
Months Leaching
1
2
3
4
5
6
7
8
9
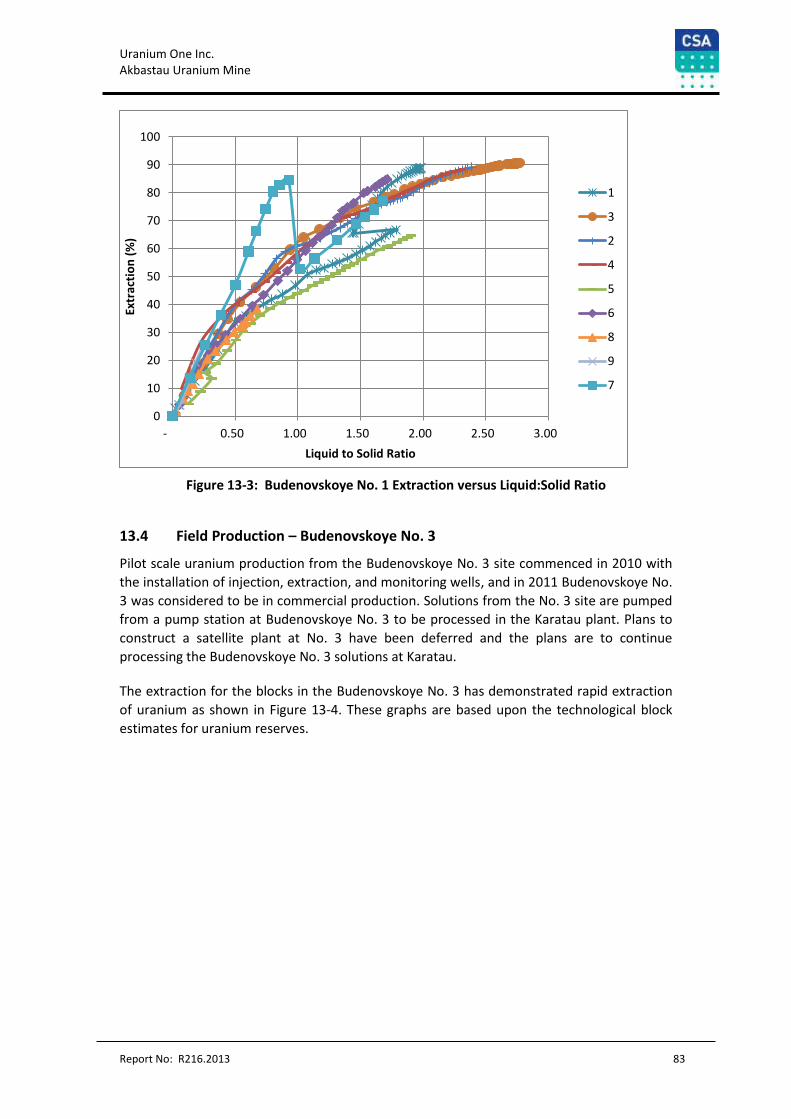
Uranium One Inc. Akbastau Uranium Mine
Report No: R216.2013 83
Figure 13-3: Budenovskoye No. 1 Extraction versus Liquid:Solid Ratio
13.4 Field Production – Budenovskoye No. 3
Pilot scale uranium production from the Budenovskoye No. 3 site commenced in 2010 with
the installation of injection, extraction, and monitoring wells, and in 2011 Budenovskoye No.
3 was considered to be in commercial production. Solutions from the No. 3 site are pumped
from a pump station at Budenovskoye No. 3 to be processed in the Karatau plant. Plans to
construct a satellite plant at No. 3 have been deferred and the plans are to continue
processing the Budenovskoye No. 3 solutions at Karatau.
The extraction for the blocks in the Budenovskoye No. 3 has demonstrated rapid extraction
of uranium as shown in Figure 13-4. These graphs are based upon the technological block
estimates for uranium reserves.
0
10
20
30
40
50
60
70
80
90
100
- 0.50 1.00 1.50 2.00 2.50 3.00
Extr
acti
on
(%
)
Liquid to Solid Ratio
1
3
2
4
5
6
8
9
7
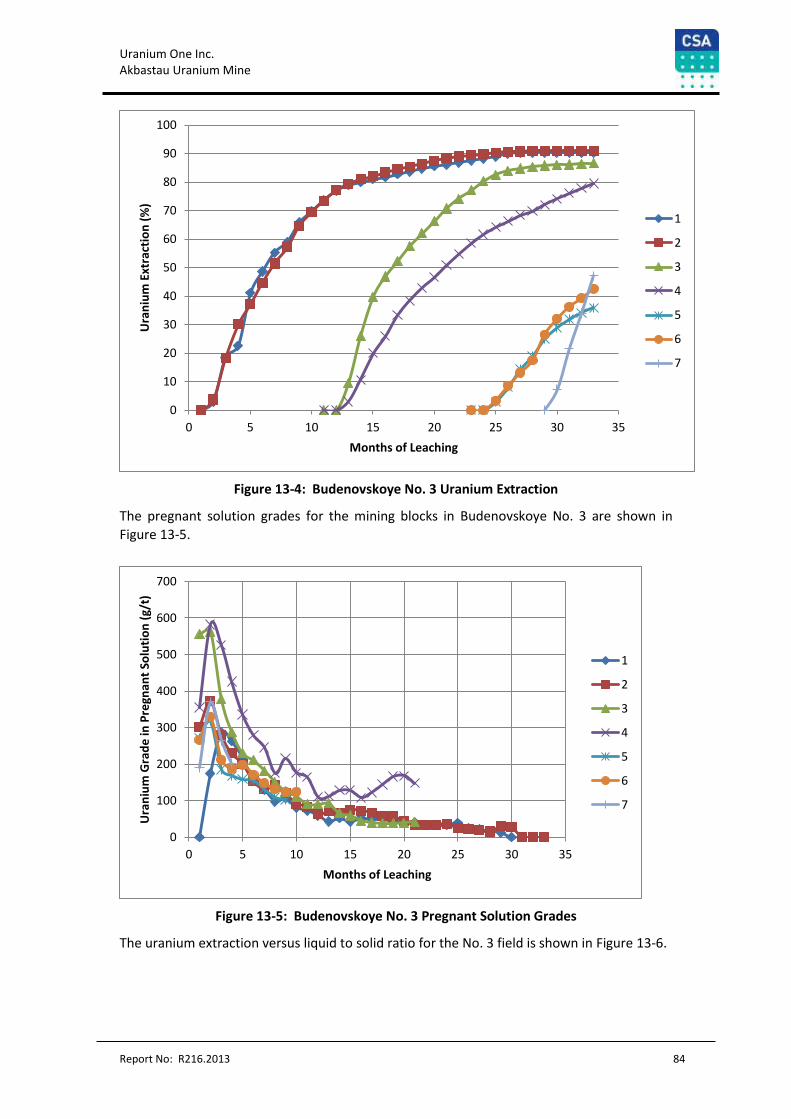
Uranium One Inc. Akbastau Uranium Mine
Report No: R216.2013 84
Figure 13-4: Budenovskoye No. 3 Uranium Extraction
The pregnant solution grades for the mining blocks in Budenovskoye No. 3 are shown in
Figure 13-5.
Figure 13-5: Budenovskoye No. 3 Pregnant Solution Grades
The uranium extraction versus liquid to solid ratio for the No. 3 field is shown in Figure 13-6.
0
10
20
30
40
50
60
70
80
90
100
0 5 10 15 20 25 30 35
Ura
niu
m E
xtra
ctio
n (
%)
Months of Leaching
1
2
3
4
5
6
7
0
100
200
300
400
500
600
700
0 5 10 15 20 25 30 35
Ura
niu
m G
rad
e in
Pre
gnan
t So
luti
on
(g/
t)
Months of Leaching
1
2
3
4
5
6
7
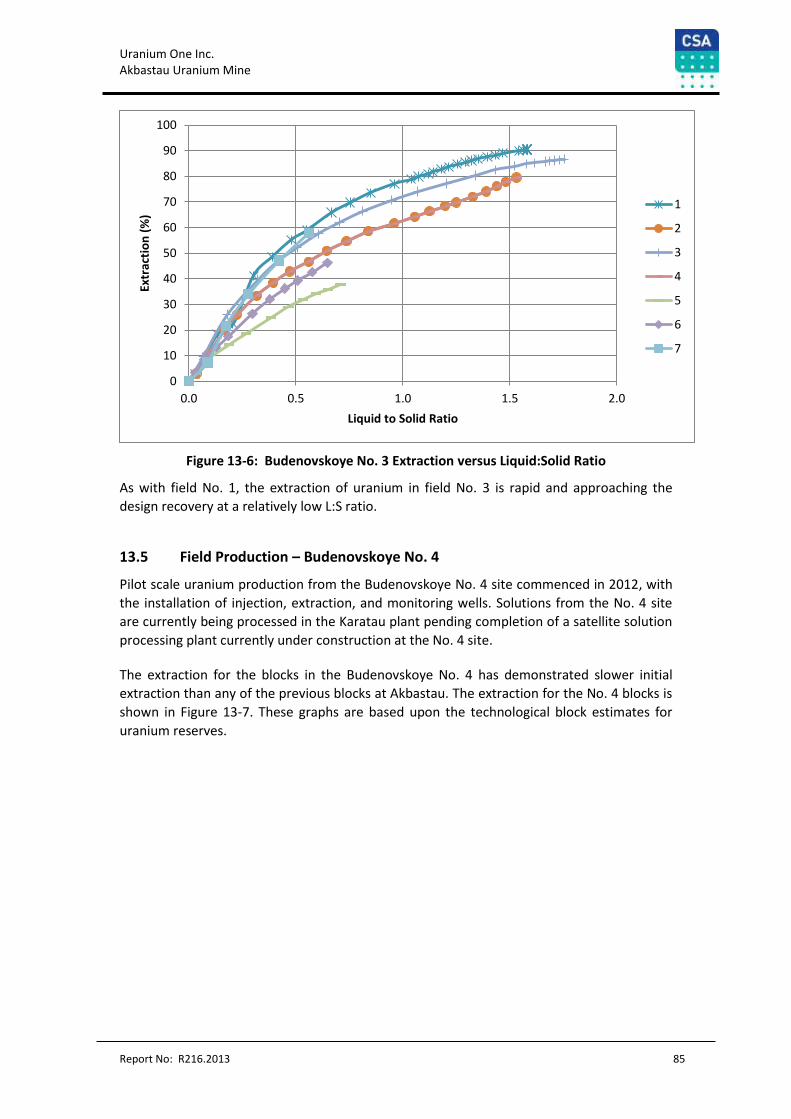
Uranium One Inc. Akbastau Uranium Mine
Report No: R216.2013 85
Figure 13-6: Budenovskoye No. 3 Extraction versus Liquid:Solid Ratio
As with field No. 1, the extraction of uranium in field No. 3 is rapid and approaching the
design recovery at a relatively low L:S ratio.
13.5 Field Production – Budenovskoye No. 4
Pilot scale uranium production from the Budenovskoye No. 4 site commenced in 2012, with
the installation of injection, extraction, and monitoring wells. Solutions from the No. 4 site
are currently being processed in the Karatau plant pending completion of a satellite solution
processing plant currently under construction at the No. 4 site.
The extraction for the blocks in the Budenovskoye No. 4 has demonstrated slower initial
extraction than any of the previous blocks at Akbastau. The extraction for the No. 4 blocks is
shown in Figure 13-7. These graphs are based upon the technological block estimates for
uranium reserves.
0
10
20
30
40
50
60
70
80
90
100
0.0 0.5 1.0 1.5 2.0
Extr
acti
on
(%
)
Liquid to Solid Ratio
1
2
3
4
5
6
7
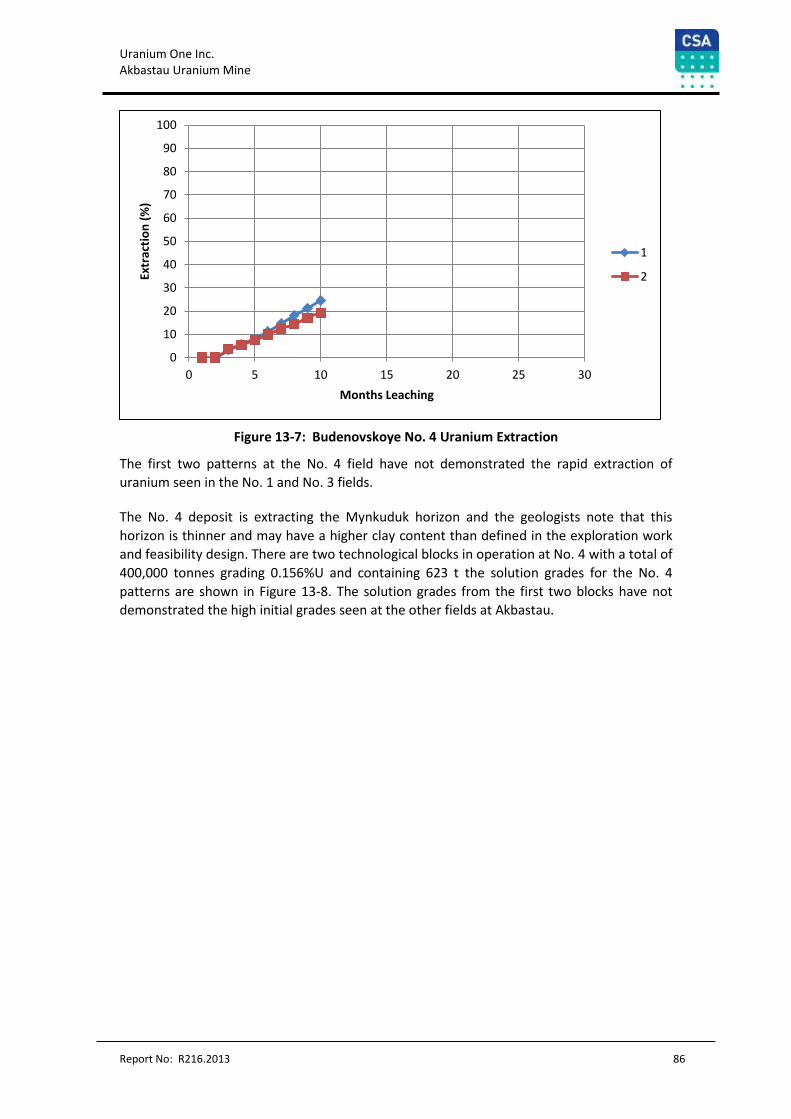
Uranium One Inc. Akbastau Uranium Mine
Report No: R216.2013 86
Figure 13-7: Budenovskoye No. 4 Uranium Extraction
The first two patterns at the No. 4 field have not demonstrated the rapid extraction of
uranium seen in the No. 1 and No. 3 fields.
The No. 4 deposit is extracting the Mynkuduk horizon and the geologists note that this
horizon is thinner and may have a higher clay content than defined in the exploration work
and feasibility design. There are two technological blocks in operation at No. 4 with a total of
400,000 tonnes grading 0.156%U and containing 623 t the solution grades for the No. 4
patterns are shown in Figure 13-8. The solution grades from the first two blocks have not
demonstrated the high initial grades seen at the other fields at Akbastau.
0
10
20
30
40
50
60
70
80
90
100
0 5 10 15 20 25 30
Extr
acti
on
(%
)
Months Leaching
1
2
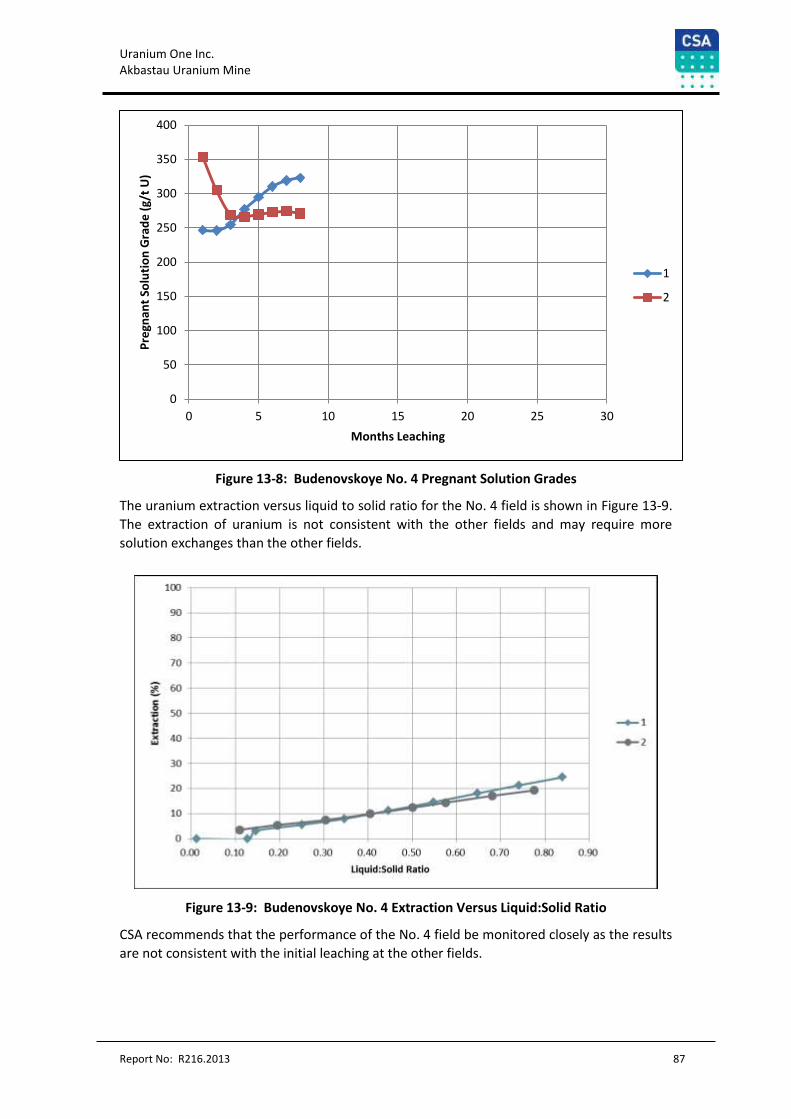
Uranium One Inc. Akbastau Uranium Mine
Report No: R216.2013 87
Figure 13-8: Budenovskoye No. 4 Pregnant Solution Grades
The uranium extraction versus liquid to solid ratio for the No. 4 field is shown in Figure 13-9.
The extraction of uranium is not consistent with the other fields and may require more
solution exchanges than the other fields.
Figure 13-9: Budenovskoye No. 4 Extraction Versus Liquid:Solid Ratio
CSA recommends that the performance of the No. 4 field be monitored closely as the results
are not consistent with the initial leaching at the other fields.
0
50
100
150
200
250
300
350
400
0 5 10 15 20 25 30
Pre
gnan
t So
luti
on
Gra
de
(g/
t U
)
Months Leaching
1
2
Uranium One Inc. Akbastau Uranium Mine
Report No: R216.2013 88
14 Mineral Resource Estimates
14.1 Introduction
CSA prepared an updated estimate of the Mineral Resources at the Mine using the
geological and drilling results data provided by Akbastau in its database for the Mine, and
the methods described in this section. The database provided included all drilling and results
available as at November 2012. The database covered not only Budenovskoye No. 1, No. 3,
and No. 4 deposits, but also the adjoining deposits of Budenovskoye No.2 deposit (Karatau
uranium mine).
Previous estimates have been based only manual (polygonal) estimation methods. For this
new estimate CSA have generated a 3D geological model and block model.
14.2 Software Used
Compilation and primary validation of the Budenovskoye Uranium Field database was
completed using DigiMine software. Geological modelling and resource estimation were
completed using Micromine 2011 (12.5.3).
This Report gives a description of the database compilation and modelling methods used for
the entire Budenovskoye Uranium Field, with a focus on the Mine.
14.3 Geological Exploration Database
Detailed information on the initial database, validation and conversion to Micromine is
provided in Appendix 1.
The statistical information contained in the database is summarised in Figure 14-1, Figure
14-2 and Table 14-1.
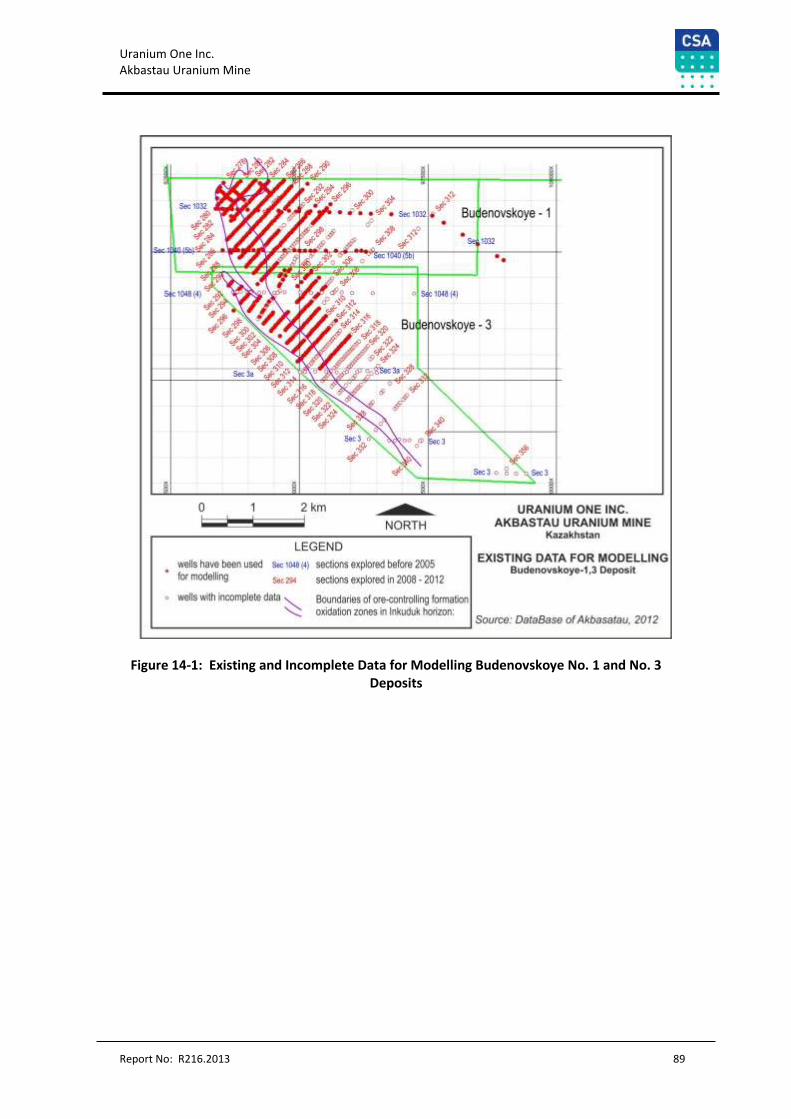
Uranium One Inc. Akbastau Uranium Mine
Report No: R216.2013 89
Figure 14-1: Existing and Incomplete Data for Modelling Budenovskoye No. 1 and No. 3 Deposits
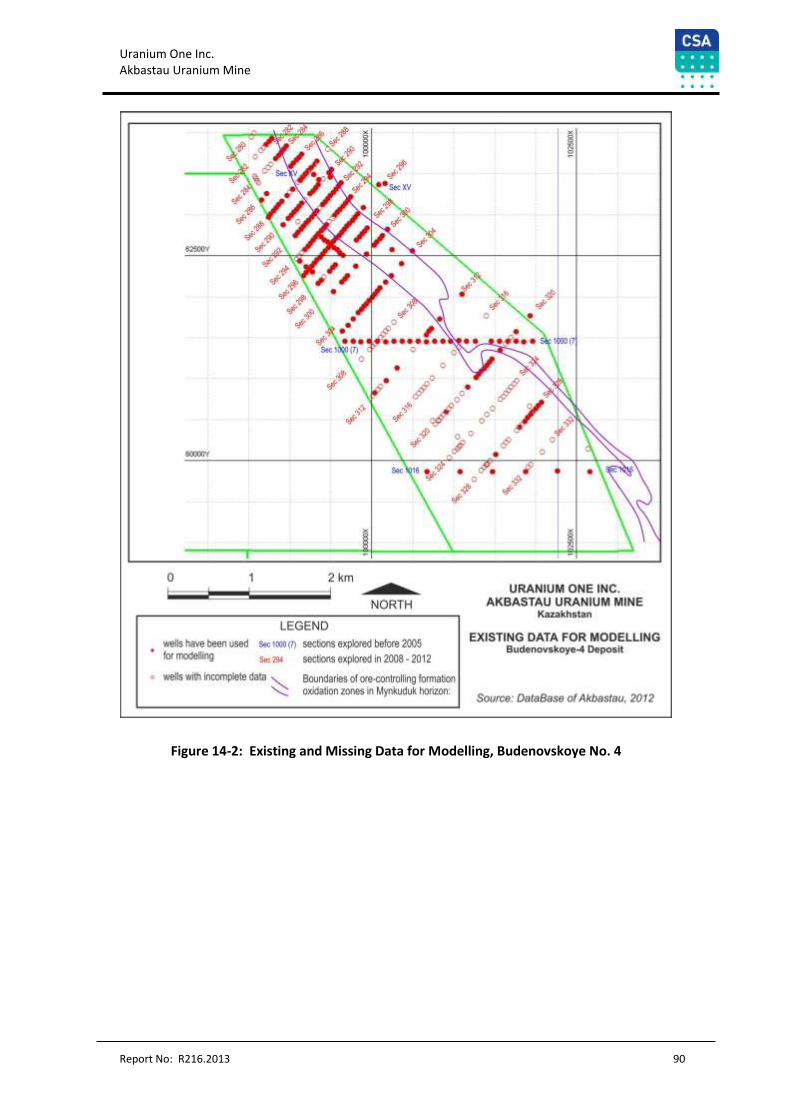
Uranium One Inc. Akbastau Uranium Mine
Report No: R216.2013 90
Figure 14-2: Existing and Missing Data for Modelling, Budenovskoye No. 4
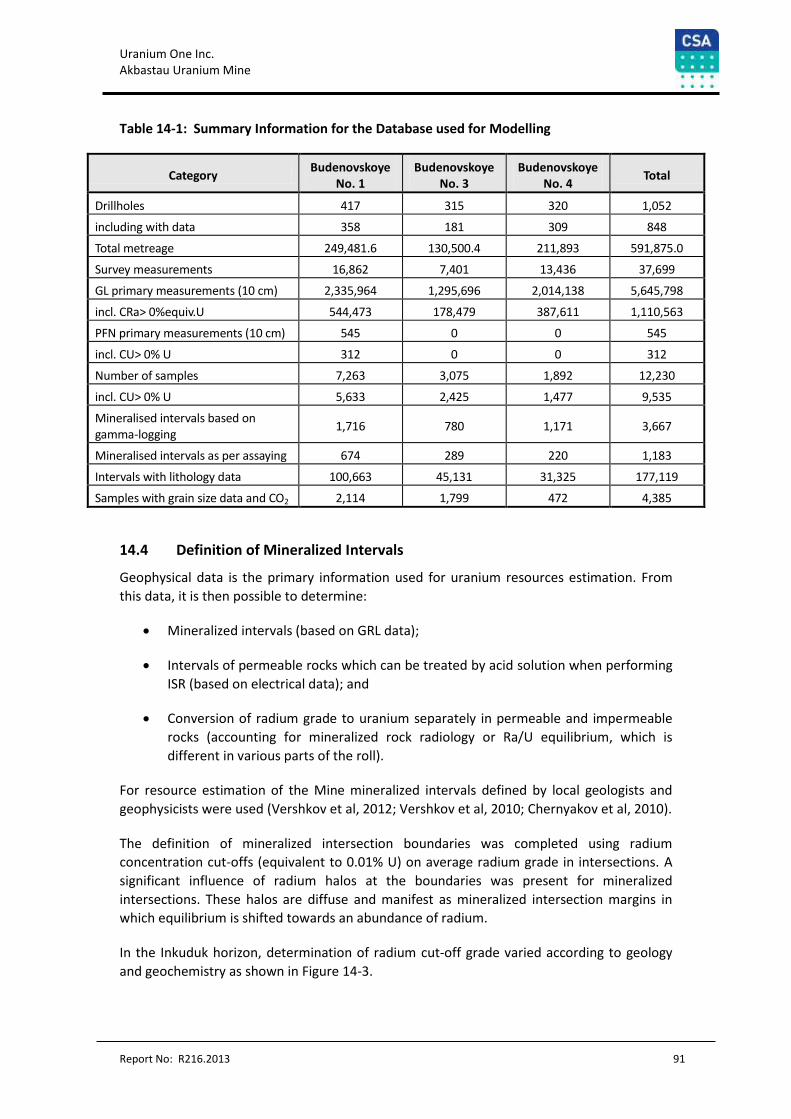
Uranium One Inc. Akbastau Uranium Mine
Report No: R216.2013 91
Table 14-1: Summary Information for the Database used for Modelling
Category Budenovskoye
No. 1 Budenovskoye
No. 3 Budenovskoye
No. 4 Total
Drillholes 417 315 320 1,052
including with data 358 181 309 848
Total metreage 249,481.6 130,500.4 211,893 591,875.0
Survey measurements 16,862 7,401 13,436 37,699
GL primary measurements (10 cm) 2,335,964 1,295,696 2,014,138 5,645,798
incl. CRa> 0%equiv.U 544,473 178,479 387,611 1,110,563
PFN primary measurements (10 cm) 545 0 0 545
incl. CU> 0% U 312 0 0 312
Number of samples 7,263 3,075 1,892 12,230
incl. CU> 0% U 5,633 2,425 1,477 9,535
Mineralised intervals based on gamma-logging
1,716 780 1,171 3,667
Mineralised intervals as per assaying 674 289 220 1,183
Intervals with lithology data 100,663 45,131 31,325 177,119
Samples with grain size data and CO2 2,114 1,799 472 4,385
14.4 Definition of Mineralized Intervals
Geophysical data is the primary information used for uranium resources estimation. From
this data, it is then possible to determine:
Mineralized intervals (based on GRL data);
Intervals of permeable rocks which can be treated by acid solution when performing
ISR (based on electrical data); and
Conversion of radium grade to uranium separately in permeable and impermeable
rocks (accounting for mineralized rock radiology or Ra/U equilibrium, which is
different in various parts of the roll).
For resource estimation of the Mine mineralized intervals defined by local geologists and
geophysicists were used (Vershkov et al, 2012; Vershkov et al, 2010; Chernyakov et al, 2010).
The definition of mineralized intersection boundaries was completed using radium
concentration cut-offs (equivalent to 0.01% U) on average radium grade in intersections. A
significant influence of radium halos at the boundaries was present for mineralized
intersections. These halos are diffuse and manifest as mineralized intersection margins in
which equilibrium is shifted towards an abundance of radium.
In the Inkuduk horizon, determination of radium cut-off grade varied according to geology
and geochemistry as shown in Figure 14-3.
Uranium One Inc. Akbastau Uranium Mine
Report No: R216.2013 92
Following similar analysis, the following dependences, common for various parts of the
deposit, were calculated for permeable mineralized rocks of the Mynkuduk horizon
(Vershkov et al, 2010; Chernyakov et al, 2010):
Mynkuduk С (radium, cut-off eq. 0.01% U) = 0.286 * С (radium) 0.23.
A correction for Radioactive Equilibrium Factor (REF = С(radium) / С(uranium)) was
introduced to calculate uranium grade after establishing mineralized interval boundaries and
calculation of average radium grade.
The REF was studied for various geological and geochemical environments in the Inkuduk
horizon as follows (Figure 14-4, Table 14-2):
in nose parts of mineralized bodies;
in wings parts of mineralized bodies;
in residual parts of mineralized bodies and radium residual halos; and
non-permeable rock (clays, silts).
The determination of REF for Mynkuduk horizons was not described specifically in reports,
but the formulae used are understood. REF was estimated within the database of initial
data.
14.4.1 Corrections for Thorium and Potassium
The average grade of thorium and potassium in mineralized rocks equals 0.00058% and
2.04% respectively (Vershkov et al, 2010). The natural variability of concentrations of these
GR interfering elements is not high and enables the use of average concentration values for
consideration of their total contribution. Taking into account the gamma-contribution total,
correction for thorium and potassium interference equals 0.00064 % of equivalent uranium.
Due to its small value, this correction was not introduced into GRL results.
14.4.2 Radioactive Equilibrium Between Radium and Radon
Correction for radon removal was evaluated based on a comparison between GRL results
and results of core sampling for radium. 165 mineralized intervals were compared
amounting to a total thickness of more than 427 rm. The weighted average (per thickness)
correction was 0.78. Practically the same correction value was obtained in the course of
comparing GRL and PFN results. For 39 mineralized intersections, the average correction was
0.76 (Vershkov, Drobov, Shishkov, 2010).
14.4.3 Natural Moisture Content of Mineralized Rocks and Specific Gravity
An average moisture content of 14.8% was used for GRL interpretation (Vershkov et al,
2010). Specific gravity of naturally wet mineralization amounted to 1.98. Average values of
moisture content and specific gravity were determined from 649 samples collected from
mineralized sediments. Quantitative interpretation of GRL was performed using Vk
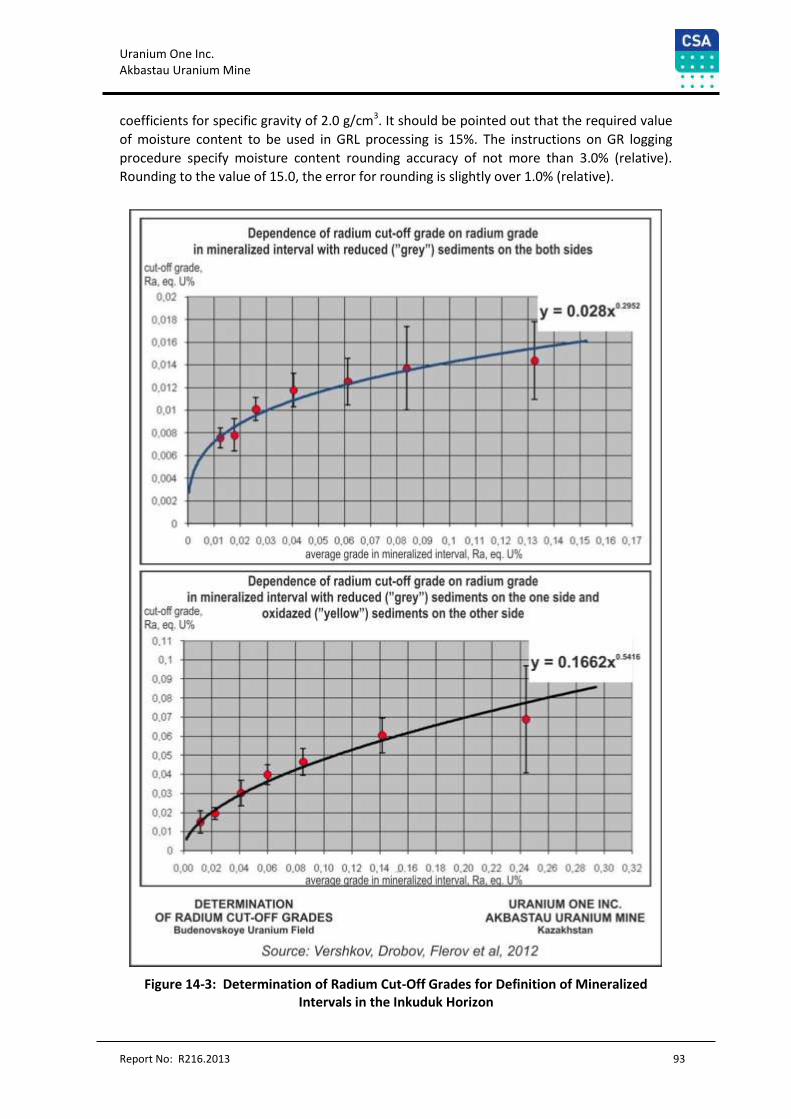
Uranium One Inc. Akbastau Uranium Mine
Report No: R216.2013 93
coefficients for specific gravity of 2.0 g/cm3. It should be pointed out that the required value
of moisture content to be used in GRL processing is 15%. The instructions on GR logging
procedure specify moisture content rounding accuracy of not more than 3.0% (relative).
Rounding to the value of 15.0, the error for rounding is slightly over 1.0% (relative).
Figure 14-3: Determination of Radium Cut-Off Grades for Definition of Mineralized Intervals in the Inkuduk Horizon
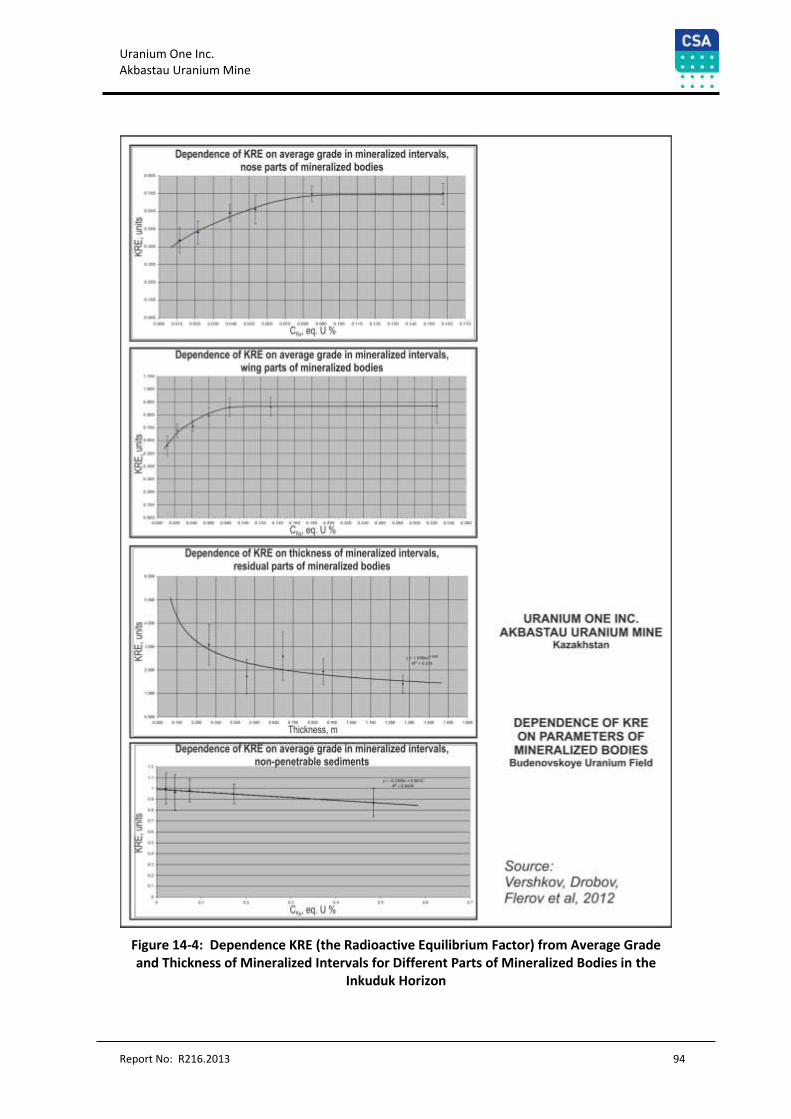
Uranium One Inc. Akbastau Uranium Mine
Report No: R216.2013 94
Figure 14-4: Dependence KRE (the Radioactive Equilibrium Factor) from Average Grade and Thickness of Mineralized Intervals for Different Parts of Mineralized Bodies in the
Inkuduk Horizon
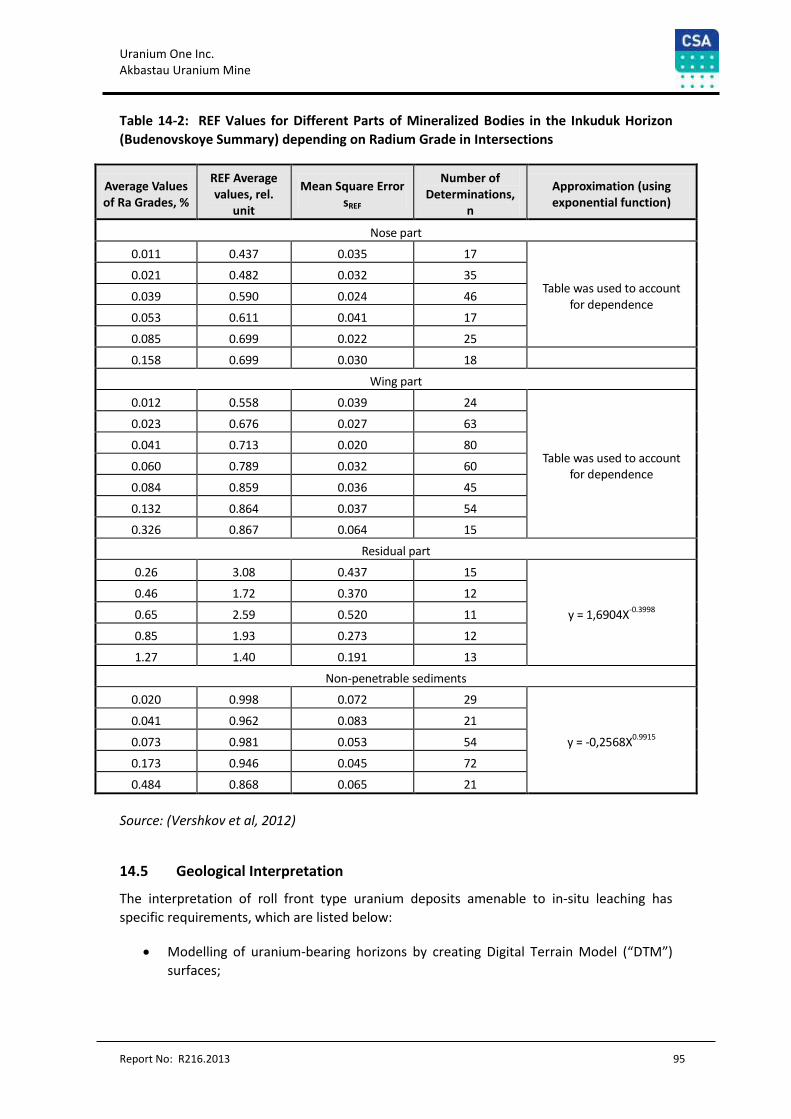
Uranium One Inc. Akbastau Uranium Mine
Report No: R216.2013 95
Table 14-2: REF Values for Different Parts of Mineralized Bodies in the Inkuduk Horizon
(Budenovskoye Summary) depending on Radium Grade in Intersections
Average Values of Ra Grades, %
REF Average values, rel.
unit
Mean Square Error sREF
Number of Determinations,
n
Approximation (using exponential function)
Nose part
0.011 0.437 0.035 17
Table was used to account for dependence
0.021 0.482 0.032 35
0.039 0.590 0.024 46
0.053 0.611 0.041 17
0.085 0.699 0.022 25
0.158 0.699 0.030 18
Wing part
0.012 0.558 0.039 24
Table was used to account for dependence
0.023 0.676 0.027 63
0.041 0.713 0.020 80
0.060 0.789 0.032 60
0.084 0.859 0.036 45
0.132 0.864 0.037 54
0.326 0.867 0.064 15
Residual part
0.26 3.08 0.437 15
y = 1,6904X-0.3998
0.46 1.72 0.370 12
0.65 2.59 0.520 11
0.85 1.93 0.273 12
1.27 1.40 0.191 13
Non-penetrable sediments
0.020 0.998 0.072 29
y = -0,2568X0.9915
0.041 0.962 0.083 21
0.073 0.981 0.053 54
0.173 0.946 0.045 72
0.484 0.868 0.065 21
Source: (Vershkov et al, 2012)
14.5 Geological Interpretation
The interpretation of roll front type uranium deposits amenable to in-situ leaching has
specific requirements, which are listed below:
Modelling of uranium-bearing horizons by creating Digital Terrain Model (“DTM”)
surfaces;
Uranium One Inc. Akbastau Uranium Mine
Report No: R216.2013 96
Using mineralized intervals defined by using gamma-logging taking into
consideration Ra cut-off grades which are dependent on the location of the
mineralized intervals in the oxidized or reduced sediments;
Division of interpreted mineralized bodies into nose, wing and residual parts
according to the geochemical composition of the host rocks; and
Interpretation of clay horizons in order to define mineralization that cannot be
extracted by ISR methods.
Interpretation of the mineralized bodies was completed on the Mine together with the
adjoining Budenovskoye-2 deposit:
31 geological exploration profiles for Budenovskoye No. 2 (Karatau),
34 geological exploration profiles for Budenovskoye No. 1 and No. 3, and
26 geological exploration profiles for Budenovskoye No. 4.
The dominant profile orientation is SW–NE (Figure 14-1, Figure 14-2). However, a number of
profiles have W-E and SE–NW orientations (Figure 14-1, Figure 14-2). Due to crossing
profiles, the geological features of the deposit could be modelled accurately.
Test drillholes were not used for geological interpretation; however, they were used to
validate mineralized envelopes (refer below).
14.5.1 Modelling of Mineralized Horizons
Modelling of mineralized horizons for the Budenovskoye deposits was carried out using the
data from Anomalous_intersection table in the database.
Strings and DTM surfaces (based on the strings) were created for the following surfaces
(Figure 14-5):
the surface topography based on the data of drillhole collar coordinates;
the boundary between the Zhalpak and the Inkuduk horizons (the upper boundary
of mineralization distribution);
the boundary between the Mynkuduk and the Inkuduk horizons; and
the boundary between the Mynkuduk horizon and Paleozoic basement (the lower
boundary of mineralization distribution).
In the process of further interpretation of the mineralized bodies, the boundary between the
horizons was slightly adjusted in several regions depending on the geological situation (this
applies especially to sudden differences in the position of horizon boundaries).
Uranium One Inc. Akbastau Uranium Mine
Report No: R216.2013 97
14.5.2 Interpretation of Mineralised Bodies
14.5.2.1 Initial Interpretation of Mineralized Bodies
Interpretation of mineralized bodies was carried out based on the mineralized intervals
estimated according to GL data with introduction of all the required corrections.
Mineralized intervals were displayed as red columns specifying U and Ra grades (Figure
14-6). A check on the mineralized intervals definition was performed during the
interpretation by comparing the primary data and sampling interpretation data (Figure
14-6).
The following methods were used for the interpretation of the mineralized envelopes:
Exploration profiles were displayed in Micromine Vizex with a clipping equal to half
of the distance between the profiles;
The interpretation was extended half way to adjacent exploration lines;
If mineralized envelopes were not extended to adjacent profiles they were restricted
by half the distance between exploration lines while retaining geological
parameters;
If mineralized envelopes were not extended to adjacent drillholes along the profile,
they were extended to the mid-way point between drillholes while retaining
geological parameters; and
Mineralized envelopes that did not intersect the boundary between mineralized
horizons were adjusted in accordance with the interpretation of mineralized bodies
(mineralized horizons are not correct described in historical drill holes).
14.5.2.2 Division of Mineralized Envelopes into Morphological Elements and Mineralized Deposits.
After the interpretation of the mineralized envelopes was completed, they were divided into
morphological elements – nose, wing, and residual parts (Figure 14-7) as well as into
mineralized horizons. This was completed using the data on the geochemical characteristics
of rock as follows:
The intervals where mostly reduced rocks are developed both in the mineralized
interval and above and below were attributed to the nose;
The intervals where reduced rocks are developed in the mineralized interval and
mainly on one of its sides (either above or below) were attributed to the limb; and
The intervals where there are mainly oxidised rocks developed above or below the
mineralized interval were attributed to the residual part; the mineralized interval
itself can be represented both by reduced and oxidised rocks.
An additional check was performed by comparing mineralized envelopes with the type of
mineralized intervals in the database (Figure 14-7).
Uranium One Inc. Akbastau Uranium Mine
Report No: R216.2013 98
14.5.3 Interpretation of Clay Horizons
The interpretation of clay horizons was carried out after interpretation of the mineralized
envelopes. The interpretation was performed using the information from three tables within
the database. Since clay intervals in these tables do not match completely, a priority system
was established as follows:
1. Of highest priority are the intervals of sands and clays in mineralized sediments
(Figure 14-8) – database table Assay_oreinterval_gamma.dat;
2. The general description of lithology for interpretation of clay and sandy intervals
outside of the mineralized intervals (Figure 14-8) – database table Lithology.dat;
and
3. Clay and sand intervals according to the data of RL interpretation alone were used
for interpretation outside of the mineralized intervals in the absence of any data in
general description (Figure 14-8) – database table Lithology_KS.dat.
When clay horizons in mineralized rocks were interpreted, the boundaries were delineated
strictly based on the clay intervals because the accuracy of their delineation directly
influences the resource estimate.
Interpretation of clay interbeds outside of the mineralized intervals was carried out with a
certain degree of generalisation (Figure 14-8) by including thin intervals of sands into clay
horizons and by excluding individual intervals of clays from interpretation (only those
interbeds which had been identified in 2 and more drillholes were correlated). The reason
for this is that clay horizons outside of the mineralized bodies do not form part of the
resource estimate.
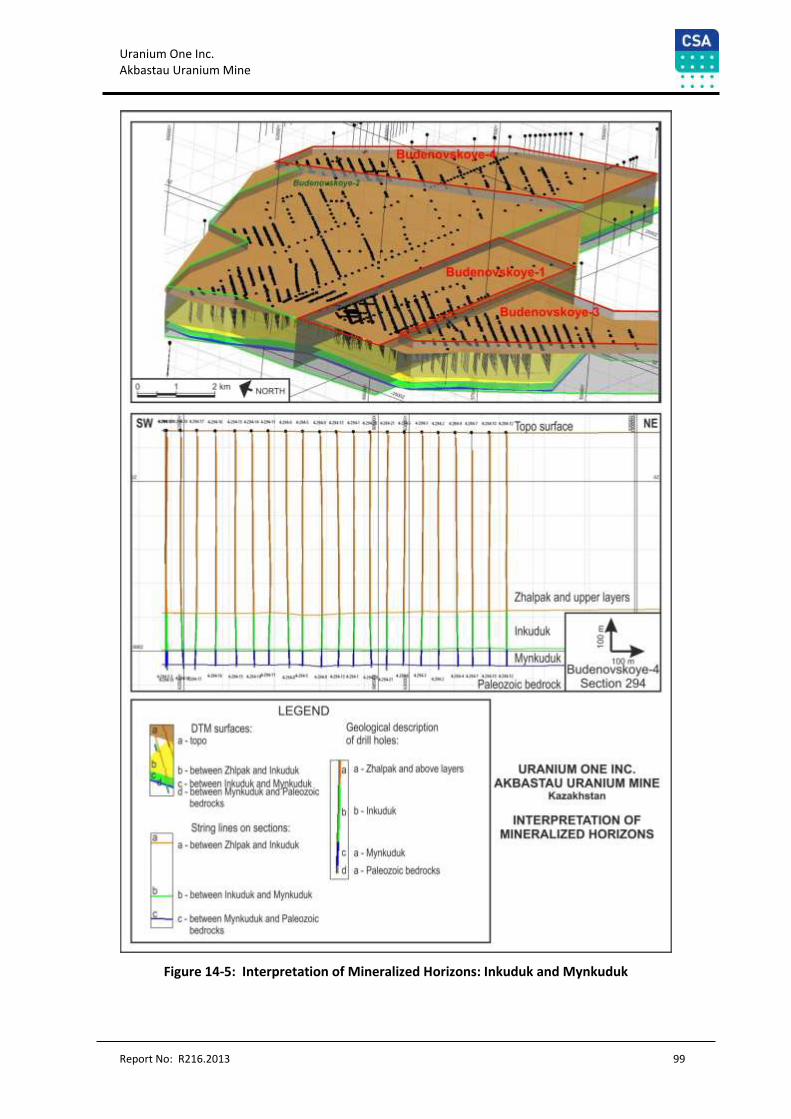
Uranium One Inc. Akbastau Uranium Mine
Report No: R216.2013 99
Figure 14-5: Interpretation of Mineralized Horizons: Inkuduk and Mynkuduk
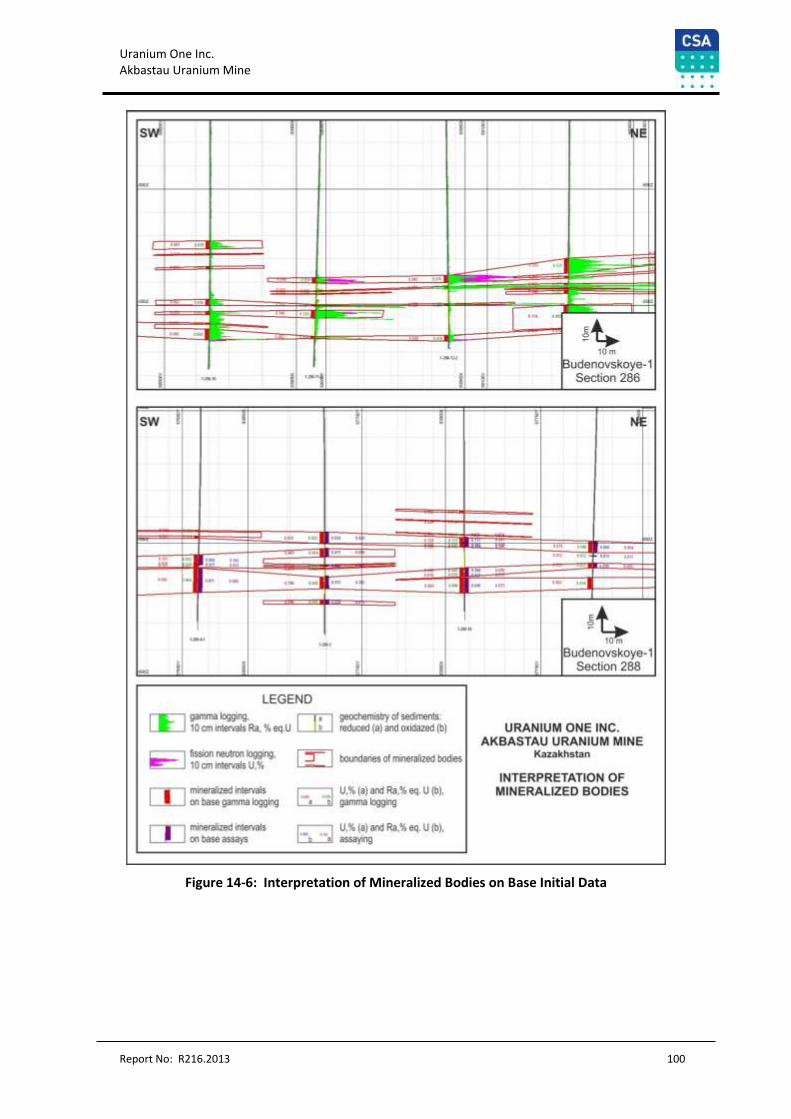
Uranium One Inc. Akbastau Uranium Mine
Report No: R216.2013 100
Figure 14-6: Interpretation of Mineralized Bodies on Base Initial Data
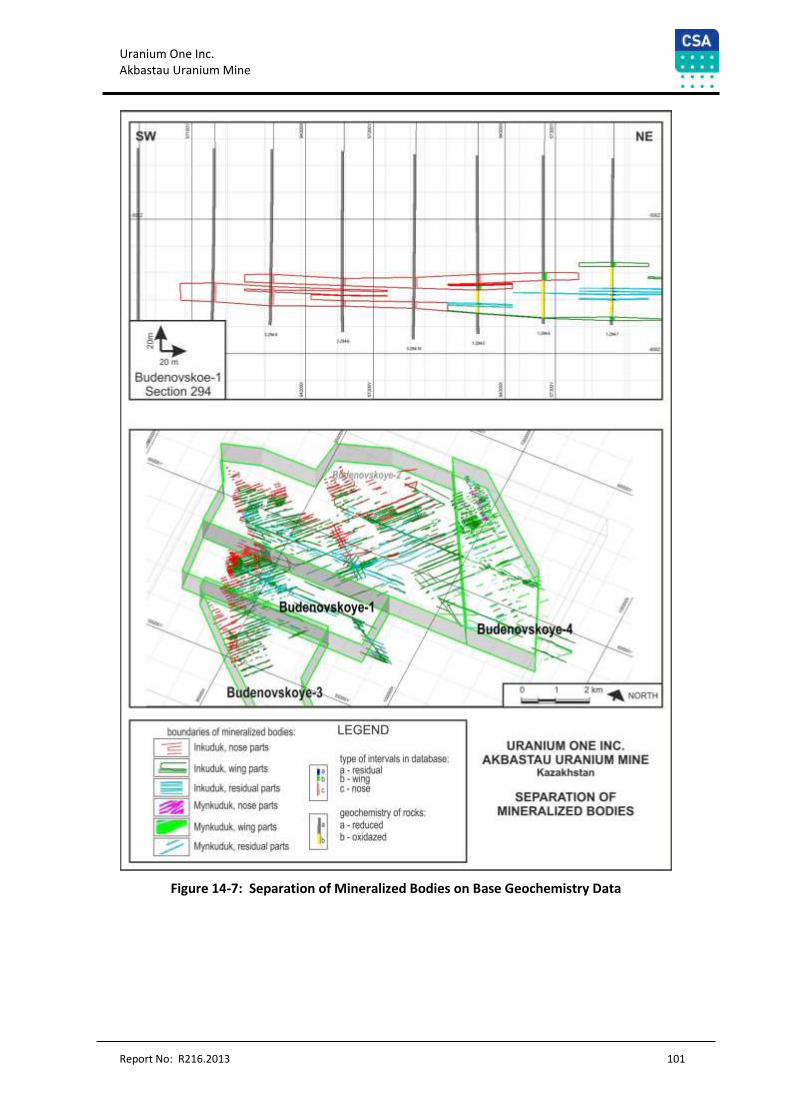
Uranium One Inc. Akbastau Uranium Mine
Report No: R216.2013 101
Figure 14-7: Separation of Mineralized Bodies on Base Geochemistry Data
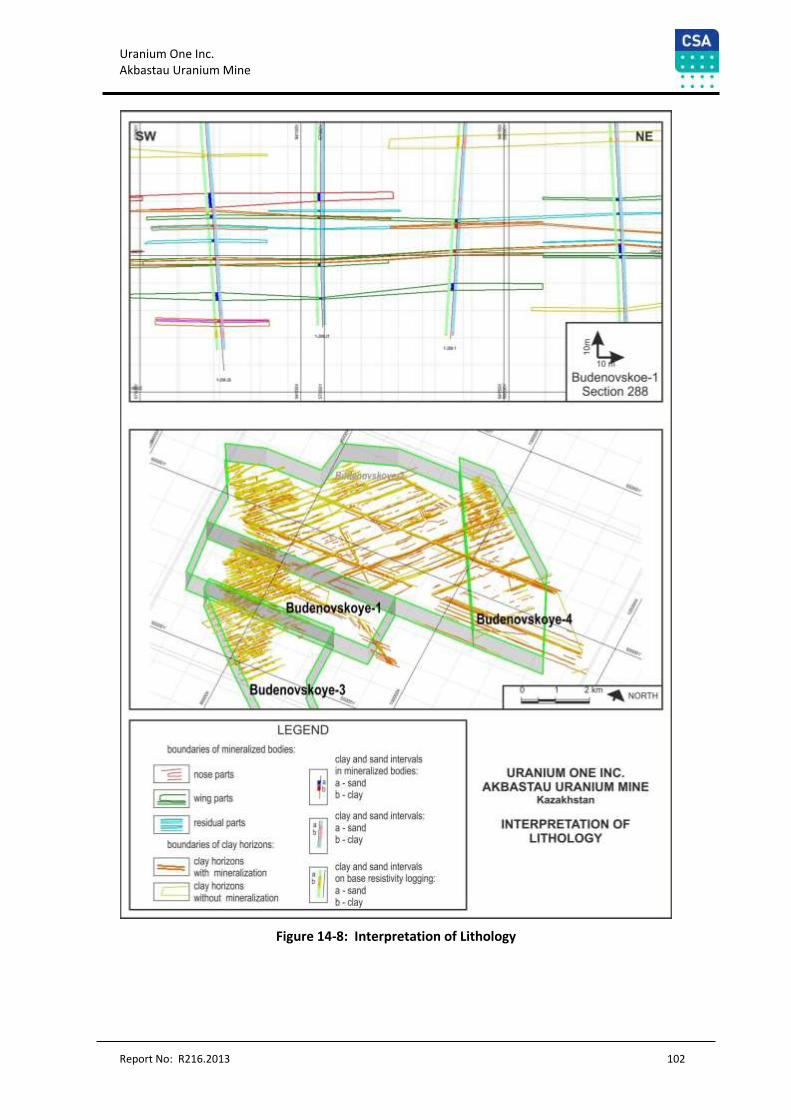
Uranium One Inc. Akbastau Uranium Mine
Report No: R216.2013 102
Figure 14-8: Interpretation of Lithology
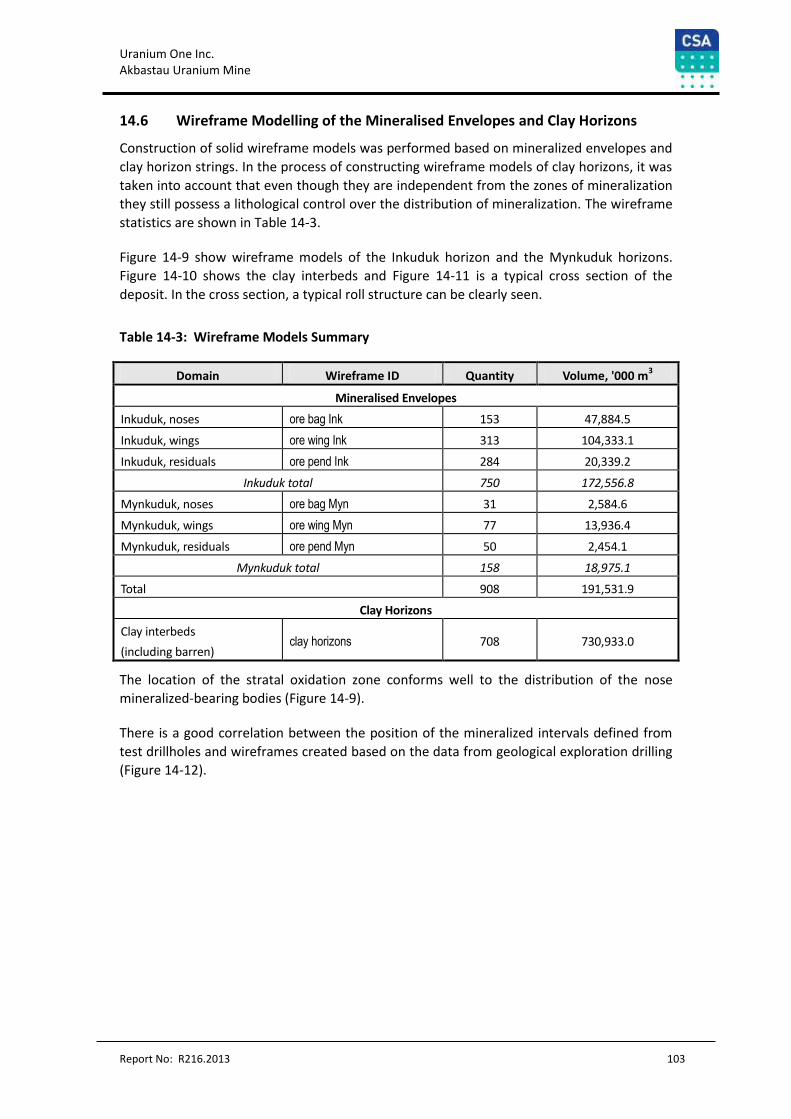
Uranium One Inc. Akbastau Uranium Mine
Report No: R216.2013 103
14.6 Wireframe Modelling of the Mineralised Envelopes and Clay Horizons
Construction of solid wireframe models was performed based on mineralized envelopes and
clay horizon strings. In the process of constructing wireframe models of clay horizons, it was
taken into account that even though they are independent from the zones of mineralization
they still possess a lithological control over the distribution of mineralization. The wireframe
statistics are shown in Table 14-3.
Figure 14-9 show wireframe models of the Inkuduk horizon and the Mynkuduk horizons.
Figure 14-10 shows the clay interbeds and Figure 14-11 is a typical cross section of the
deposit. In the cross section, a typical roll structure can be clearly seen.
Table 14-3: Wireframe Models Summary
Domain Wireframe ID Quantity Volume, '000 m3
Mineralised Envelopes
Inkuduk, noses ore bag Ink 153 47,884.5
Inkuduk, wings ore wing Ink 313 104,333.1
Inkuduk, residuals ore pend Ink 284 20,339.2
Inkuduk total 750 172,556.8
Mynkuduk, noses ore bag Myn 31 2,584.6
Mynkuduk, wings ore wing Myn 77 13,936.4
Mynkuduk, residuals ore pend Myn 50 2,454.1
Mynkuduk total 158 18,975.1
Total 908 191,531.9
Clay Horizons
Clay interbeds
(including barren) clay horizons 708 730,933.0
The location of the stratal oxidation zone conforms well to the distribution of the nose
mineralized-bearing bodies (Figure 14-9).
There is a good correlation between the position of the mineralized intervals defined from
test drillholes and wireframes created based on the data from geological exploration drilling
(Figure 14-12).
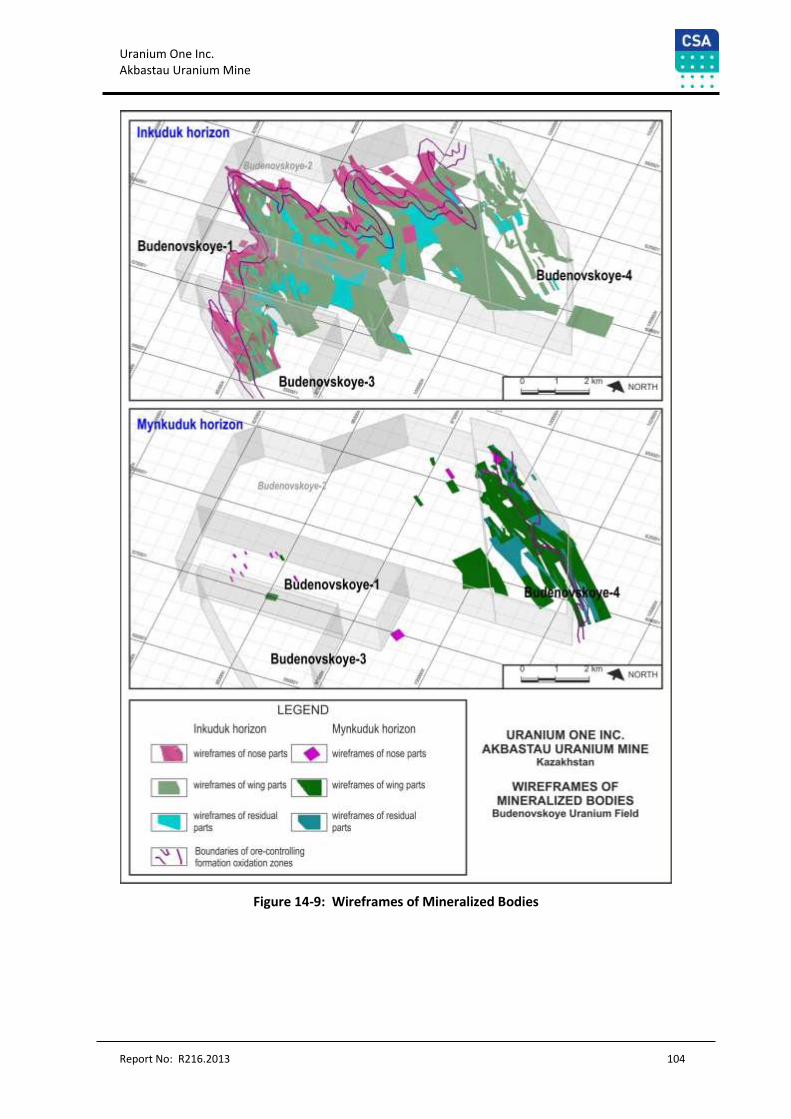
Uranium One Inc. Akbastau Uranium Mine
Report No: R216.2013 104
Figure 14-9: Wireframes of Mineralized Bodies
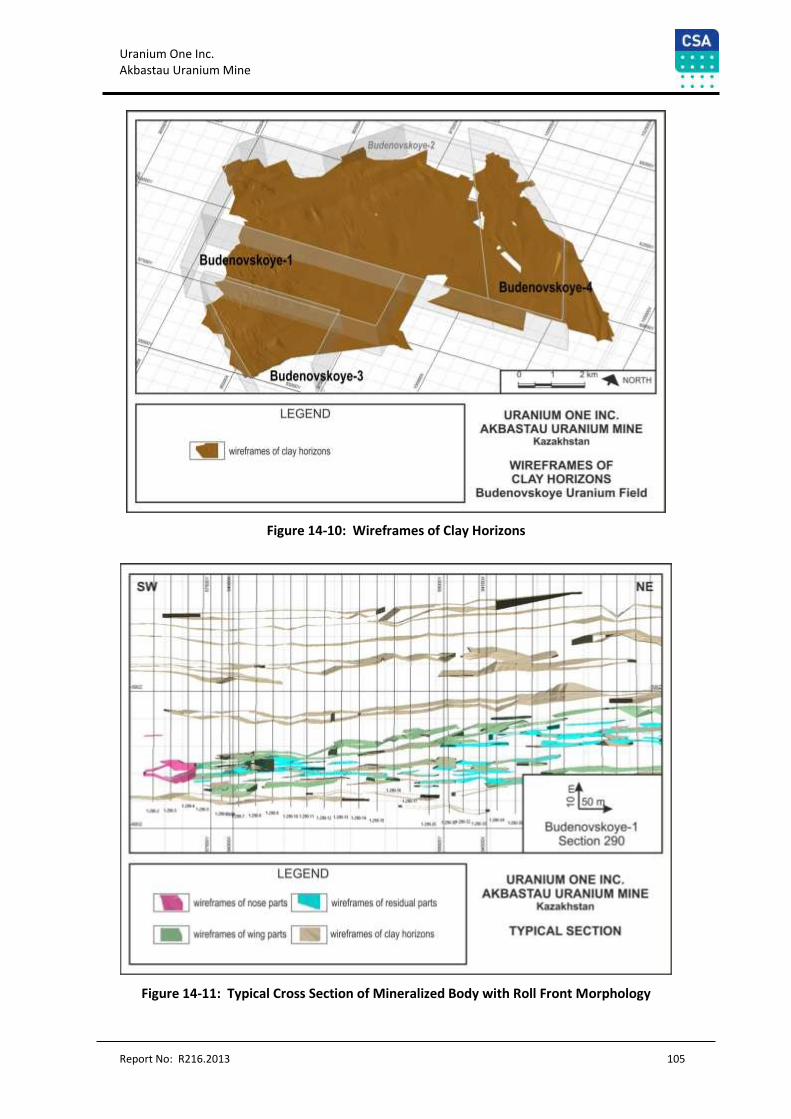
Uranium One Inc. Akbastau Uranium Mine
Report No: R216.2013 105
Figure 14-10: Wireframes of Clay Horizons
Figure 14-11: Typical Cross Section of Mineralized Body with Roll Front Morphology
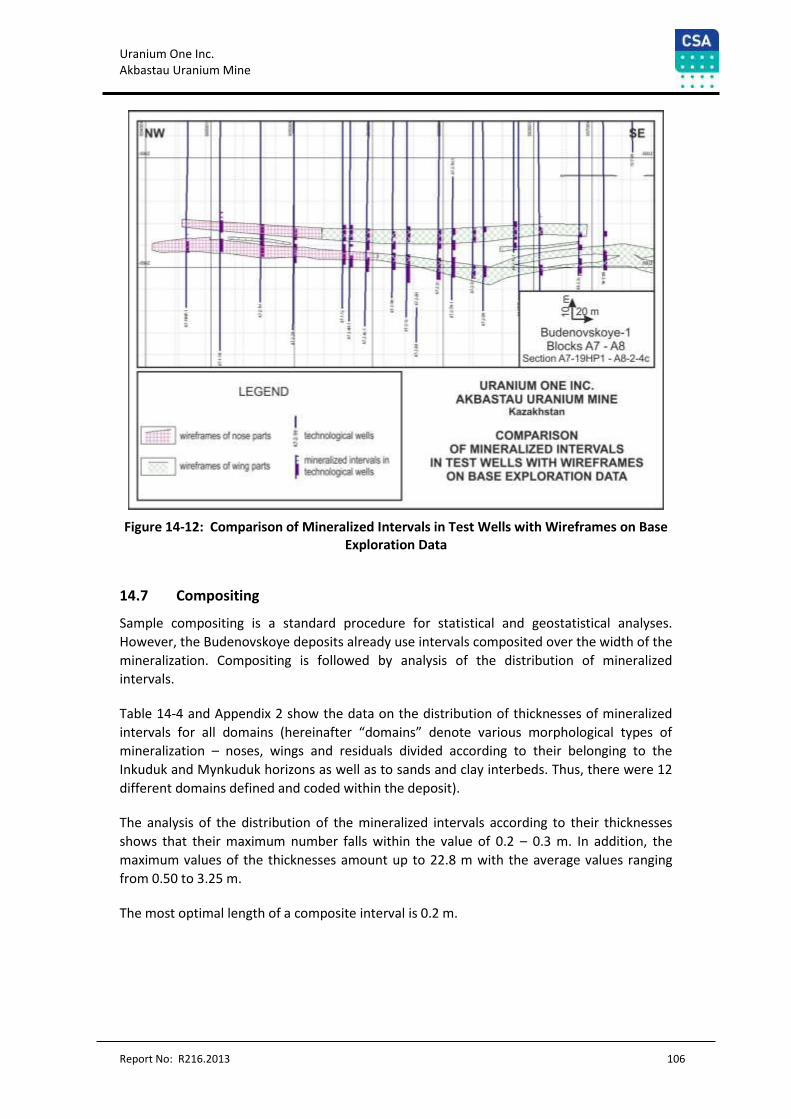
Uranium One Inc. Akbastau Uranium Mine
Report No: R216.2013 106
Figure 14-12: Comparison of Mineralized Intervals in Test Wells with Wireframes on Base Exploration Data
14.7 Compositing
Sample compositing is a standard procedure for statistical and geostatistical analyses.
However, the Budenovskoye deposits already use intervals composited over the width of the
mineralization. Compositing is followed by analysis of the distribution of mineralized
intervals.
Table 14-4 and Appendix 2 show the data on the distribution of thicknesses of mineralized
intervals for all domains (hereinafter “domains” denote various morphological types of
mineralization – noses, wings and residuals divided according to their belonging to the
Inkuduk and Mynkuduk horizons as well as to sands and clay interbeds. Thus, there were 12
different domains defined and coded within the deposit).
The analysis of the distribution of the mineralized intervals according to their thicknesses
shows that their maximum number falls within the value of 0.2 – 0.3 m. In addition, the
maximum values of the thicknesses amount up to 22.8 m with the average values ranging
from 0.50 to 3.25 m.
The most optimal length of a composite interval is 0.2 m.
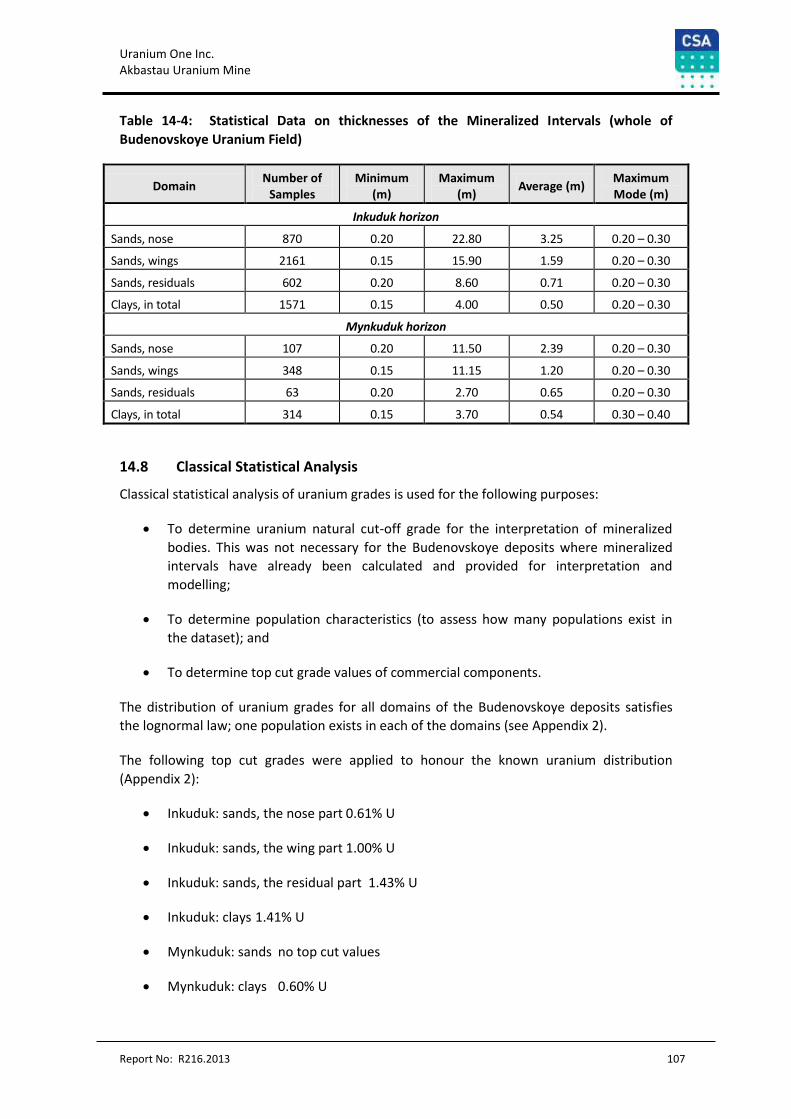
Uranium One Inc. Akbastau Uranium Mine
Report No: R216.2013 107
Table 14-4: Statistical Data on thicknesses of the Mineralized Intervals (whole of
Budenovskoye Uranium Field)
Domain Number of
Samples Minimum
(m) Maximum
(m) Average (m)
Maximum Mode (m)
Inkuduk horizon
Sands, nose 870 0.20 22.80 3.25 0.20 – 0.30
Sands, wings 2161 0.15 15.90 1.59 0.20 – 0.30
Sands, residuals 602 0.20 8.60 0.71 0.20 – 0.30
Clays, in total 1571 0.15 4.00 0.50 0.20 – 0.30
Mynkuduk horizon
Sands, nose 107 0.20 11.50 2.39 0.20 – 0.30
Sands, wings 348 0.15 11.15 1.20 0.20 – 0.30
Sands, residuals 63 0.20 2.70 0.65 0.20 – 0.30
Clays, in total 314 0.15 3.70 0.54 0.30 – 0.40
14.8 Classical Statistical Analysis
Classical statistical analysis of uranium grades is used for the following purposes:
To determine uranium natural cut-off grade for the interpretation of mineralized
bodies. This was not necessary for the Budenovskoye deposits where mineralized
intervals have already been calculated and provided for interpretation and
modelling;
To determine population characteristics (to assess how many populations exist in
the dataset); and
To determine top cut grade values of commercial components.
The distribution of uranium grades for all domains of the Budenovskoye deposits satisfies
the lognormal law; one population exists in each of the domains (see Appendix 2).
The following top cut grades were applied to honour the known uranium distribution
(Appendix 2):
Inkuduk: sands, the nose part 0.61% U
Inkuduk: sands, the wing part 1.00% U
Inkuduk: sands, the residual part 1.43% U
Inkuduk: clays 1.41% U
Mynkuduk: sands no top cut values
Mynkuduk: clays 0.60% U
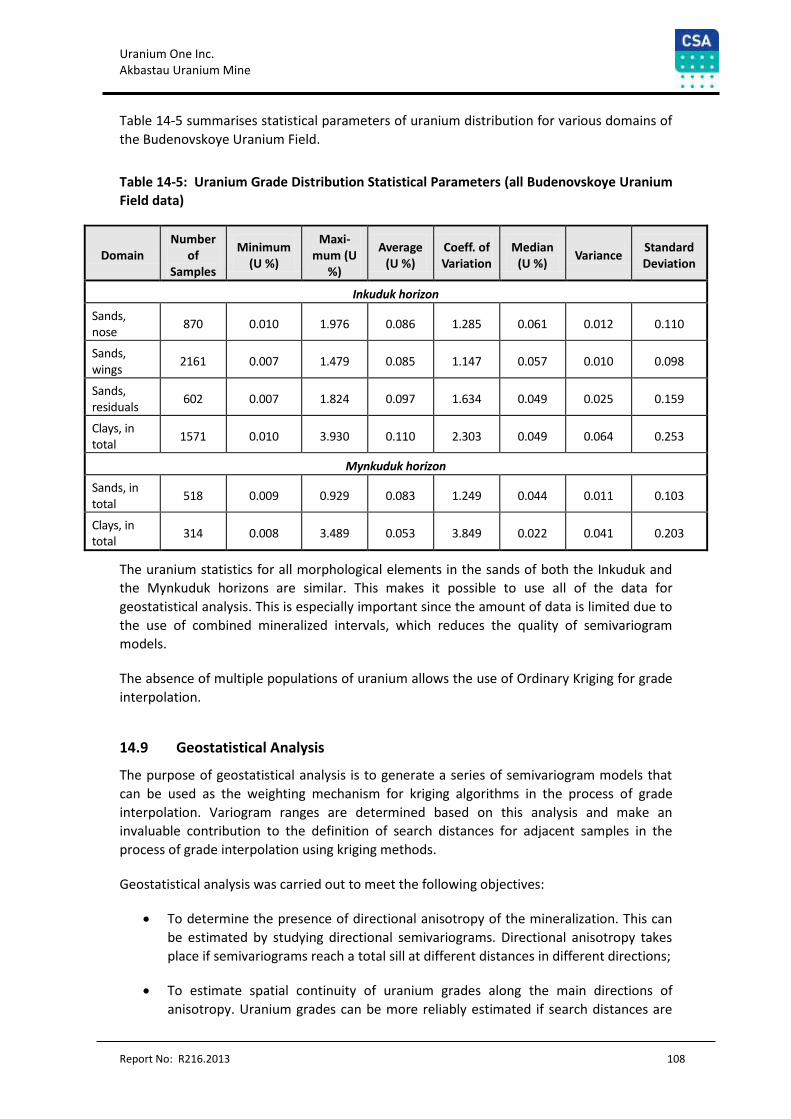
Uranium One Inc. Akbastau Uranium Mine
Report No: R216.2013 108
Table 14-5 summarises statistical parameters of uranium distribution for various domains of
the Budenovskoye Uranium Field.
Table 14-5: Uranium Grade Distribution Statistical Parameters (all Budenovskoye Uranium
Field data)
Domain Number
of Samples
Minimum (U %)
Maxi-mum (U
%)
Average (U %)
Coeff. of Variation
Median (U %)
Variance Standard Deviation
Inkuduk horizon
Sands, nose
870 0.010 1.976 0.086 1.285 0.061 0.012 0.110
Sands, wings
2161 0.007 1.479 0.085 1.147 0.057 0.010 0.098
Sands, residuals
602 0.007 1.824 0.097 1.634 0.049 0.025 0.159
Clays, in total
1571 0.010 3.930 0.110 2.303 0.049 0.064 0.253
Mynkuduk horizon
Sands, in total
518 0.009 0.929 0.083 1.249 0.044 0.011 0.103
Clays, in total
314 0.008 3.489 0.053 3.849 0.022 0.041 0.203
The uranium statistics for all morphological elements in the sands of both the Inkuduk and
the Mynkuduk horizons are similar. This makes it possible to use all of the data for
geostatistical analysis. This is especially important since the amount of data is limited due to
the use of combined mineralized intervals, which reduces the quality of semivariogram
models.
The absence of multiple populations of uranium allows the use of Ordinary Kriging for grade
interpolation.
14.9 Geostatistical Analysis
The purpose of geostatistical analysis is to generate a series of semivariogram models that
can be used as the weighting mechanism for kriging algorithms in the process of grade
interpolation. Variogram ranges are determined based on this analysis and make an
invaluable contribution to the definition of search distances for adjacent samples in the
process of grade interpolation using kriging methods.
Geostatistical analysis was carried out to meet the following objectives:
To determine the presence of directional anisotropy of the mineralization. This can
be estimated by studying directional semivariograms. Directional anisotropy takes
place if semivariograms reach a total sill at different distances in different directions;
To estimate spatial continuity of uranium grades along the main directions of
anisotropy. Uranium grades can be more reliably estimated if search distances are
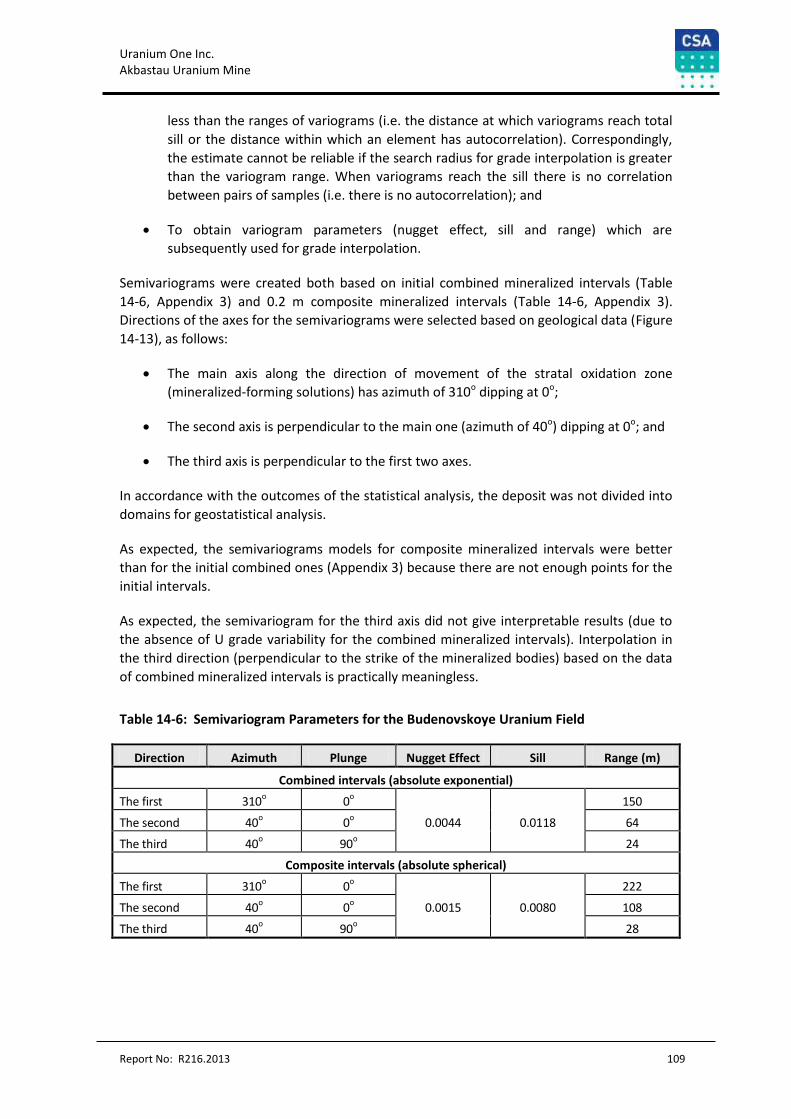
Uranium One Inc. Akbastau Uranium Mine
Report No: R216.2013 109
less than the ranges of variograms (i.e. the distance at which variograms reach total
sill or the distance within which an element has autocorrelation). Correspondingly,
the estimate cannot be reliable if the search radius for grade interpolation is greater
than the variogram range. When variograms reach the sill there is no correlation
between pairs of samples (i.e. there is no autocorrelation); and
To obtain variogram parameters (nugget effect, sill and range) which are
subsequently used for grade interpolation.
Semivariograms were created both based on initial combined mineralized intervals (Table
14-6, Appendix 3) and 0.2 m composite mineralized intervals (Table 14-6, Appendix 3).
Directions of the axes for the semivariograms were selected based on geological data (Figure
14-13), as follows:
The main axis along the direction of movement of the stratal oxidation zone
(mineralized-forming solutions) has azimuth of 310o dipping at 0o;
The second axis is perpendicular to the main one (azimuth of 40o) dipping at 0o; and
The third axis is perpendicular to the first two axes.
In accordance with the outcomes of the statistical analysis, the deposit was not divided into
domains for geostatistical analysis.
As expected, the semivariograms models for composite mineralized intervals were better
than for the initial combined ones (Appendix 3) because there are not enough points for the
initial intervals.
As expected, the semivariogram for the third axis did not give interpretable results (due to
the absence of U grade variability for the combined mineralized intervals). Interpolation in
the third direction (perpendicular to the strike of the mineralized bodies) based on the data
of combined mineralized intervals is practically meaningless.
Table 14-6: Semivariogram Parameters for the Budenovskoye Uranium Field
Direction Azimuth Plunge Nugget Effect Sill Range (m)
Combined intervals (absolute exponential)
The first 310o 0
o
0.0044 0.0118
150
The second 40o 0
o 64
The third 40o 90
o 24
Composite intervals (absolute spherical)
The first 310o 0
o
0.0015 0.0080
222
The second 40o 0
o 108
The third 40o 90
o 28
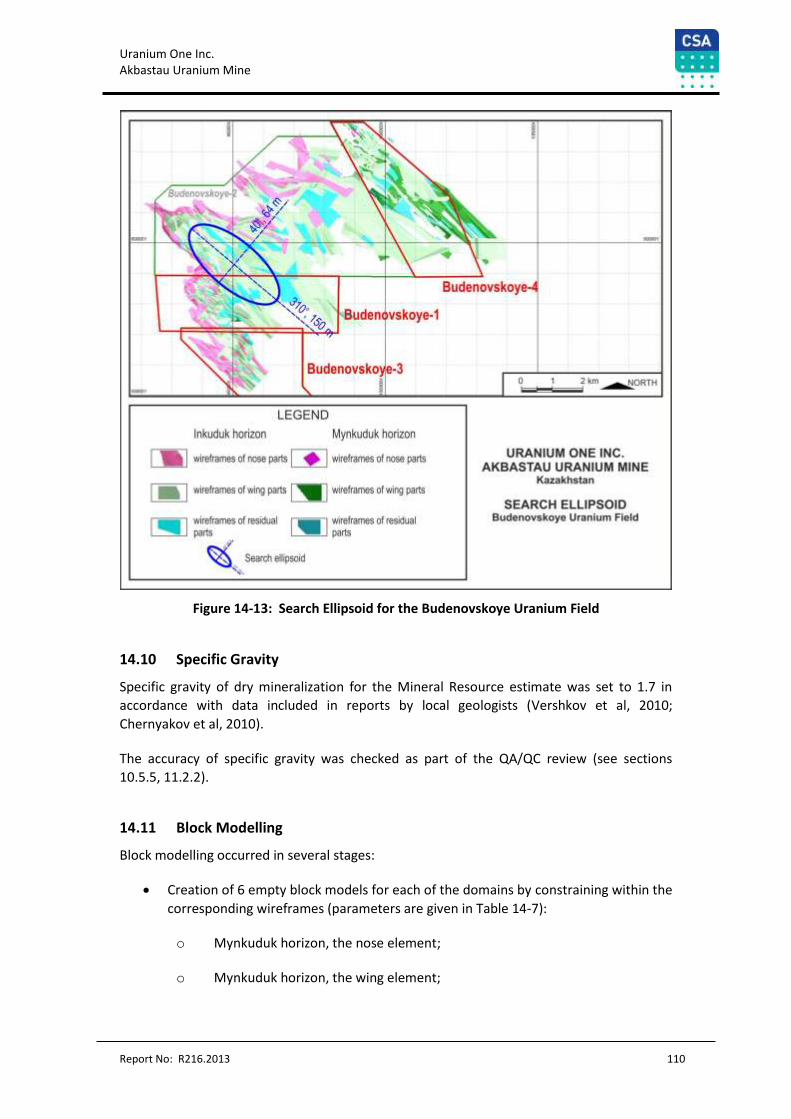
Uranium One Inc. Akbastau Uranium Mine
Report No: R216.2013 110
Figure 14-13: Search Ellipsoid for the Budenovskoye Uranium Field
14.10 Specific Gravity
Specific gravity of dry mineralization for the Mineral Resource estimate was set to 1.7 in
accordance with data included in reports by local geologists (Vershkov et al, 2010;
Chernyakov et al, 2010).
The accuracy of specific gravity was checked as part of the QA/QC review (see sections
10.5.5, 11.2.2).
14.11 Block Modelling
Block modelling occurred in several stages:
Creation of 6 empty block models for each of the domains by constraining within the
corresponding wireframes (parameters are given in Table 14-7):
o Mynkuduk horizon, the nose element;
o Mynkuduk horizon, the wing element;
Uranium One Inc. Akbastau Uranium Mine
Report No: R216.2013 111
o Mynkuduk horizon, the residual element;
o Inkuduk horizon, the nose element;
o Inkuduk horizon, the wing element; and
o Inkuduk horizon, the residual element
The dimensions of the parent blocks were set to 20х20х2 m with subcelling into 5 cells
(subcells) in the horizontal directions and 10 cells in the vertical direction. Subсelling is
applied at the boundaries of wireframe models and domains.
These dimensions were chosen for the following reasons:
o the maximum density of the geological exploration grid is 50x200 m;
o the dimension of production cells is generally not less than 30-40 m; and
o There is practically no vertical variability according to the provided source
data. However, the prevailing thickness of the mineralized bodies is 0.2-0.3
m.
Merging of the block models into one model, taking into account a priority sequence
(because the wireframes of different domains overlap near the contacts). This order
is shown below:
o Mynkuduk, residual element;
o Inkuduk, residual element;
o Mynkuduk, wing element;
o Inkuduk, wing element;
o Mynkuduk, nose element; and
o Inkuduk, nose element
The combined model was additionally divided into sands and clays. This created a
total of 12 domains.
In addition to the standard fields, the following fields were added to the model:
o Zone (1 – Mynkuduk horizon, 2 – Inkuduk horizon);
o Clay (0 – sands, 1 – clays);
o Oretype (1 – noses, 2 – wings, 3 – residuals);
o WFNAME_ORE – mineralized wireframe name; and
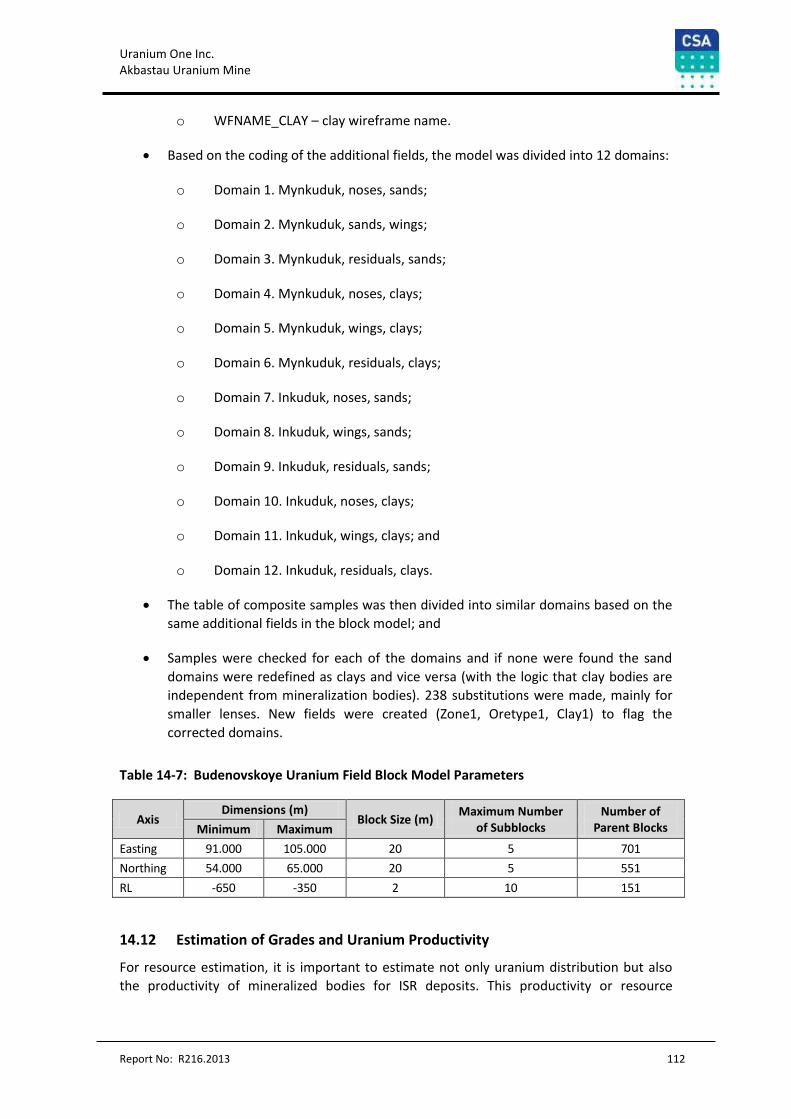
Uranium One Inc. Akbastau Uranium Mine
Report No: R216.2013 112
o WFNAME_CLAY – clay wireframe name.
Based on the coding of the additional fields, the model was divided into 12 domains:
o Domain 1. Mynkuduk, noses, sands;
o Domain 2. Mynkuduk, sands, wings;
o Domain 3. Mynkuduk, residuals, sands;
o Domain 4. Mynkuduk, noses, clays;
o Domain 5. Mynkuduk, wings, clays;
o Domain 6. Mynkuduk, residuals, clays;
o Domain 7. Inkuduk, noses, sands;
o Domain 8. Inkuduk, wings, sands;
o Domain 9. Inkuduk, residuals, sands;
o Domain 10. Inkuduk, noses, clays;
o Domain 11. Inkuduk, wings, clays; and
o Domain 12. Inkuduk, residuals, clays.
The table of composite samples was then divided into similar domains based on the
same additional fields in the block model; and
Samples were checked for each of the domains and if none were found the sand
domains were redefined as clays and vice versa (with the logic that clay bodies are
independent from mineralization bodies). 238 substitutions were made, mainly for
smaller lenses. New fields were created (Zone1, Oretype1, Clay1) to flag the
corrected domains.
Table 14-7: Budenovskoye Uranium Field Block Model Parameters
Axis Dimensions (m)
Block Size (m) Maximum Number
of Subblocks Number of
Parent Blocks Minimum Maximum
Easting 91.000 105.000 20 5 701
Northing 54.000 65.000 20 5 551
RL -650 -350 2 10 151
14.12 Estimation of Grades and Uranium Productivity
For resource estimation, it is important to estimate not only uranium distribution but also
the productivity of mineralized bodies for ISR deposits. This productivity or resource
Uranium One Inc. Akbastau Uranium Mine
Report No: R216.2013 113
estimate per square meter represents the product of the mineralized body thickness,
uranium grade, specific gravity and a factor of 10.
Often for hydrogenic deposits, the concept of “cut-off grade” is used not in terms of uranium
grade but in terms of productivity (calculated as kg/m2, where kg/m2 is the resources in a
vertical column with an end area of 1 m2 and a vertical height equal to the thickness of the
mineralized bodies). Moreover, for such deposits, the volume of mined rock does not have
significance as for other deposits; of more importance is the volume of rock exposed to
leaching. This volume is defined at the stage of estimation of Mineral Reserves.
Mineral Resources in clays are attributed to ISR non-extractable mineralization and hence
excluded from the final Mineral Resource estimate.
14.12.1 Grade Interpolation
Interpolation of grades into the Budenovskoye block model was carried out as follows:
A file (All_assays) was created which contained: U, Ra grades, REF from tables
assay_oreinterval_gamma and Ore_intervals_GKlet_U, and CO2 from tables sample,
grading, properties (on a priority basis). Top cuts were applied for uranium. The field
U_CUT field was created to contain this data.
The All_assays file was composited to 0.2 m. The composite file was divided into 12
domains (see Section 14.11).
U, U_CUT, REF, CO2 distribution was into the block model using ordinary kriging
methods by a series of iterations. Search and estimation parameters are summarised
in Table 14-8. The interpolation was carried out separately for each domain in order
to exclude the influence of samples from adjacent wireframes.
14.12.2 Generation of Gridded Model and Productivity Estimate
A gridded model was generated for each wireframe in order to estimate uranium
productivity based on block models. The vertical extent of the cells of the gridded model
depends on the thickness of mineralization. Uranium productivity is calculated by
multiplying the vertical size of the cells by the uranium grade (Figure 14-14).
After construction of gridded models, Mineral Resources in the original and in the gridded
model were compared and found to be identical.
Gridded models are two-dimensional. In order to estimate the productivity three-
dimensional space it is necessary to compare each cell of the gridded model with a column
of cells in the original (classical) block model. This was completed by indexing of the block
model cells by comparison with the cells of the gridded model. Using the indexes, the
productivity values from the gridded model were coded into the block model (Figure 14-14).
Figure 14-14 (right column) shows that an estimate of total productivity for the bifurcating
wireframes has been achieved. For individual wireframes, even the thin ones, the
productivity was estimated separately (Figure 14-14, central column). Sometimes this effect
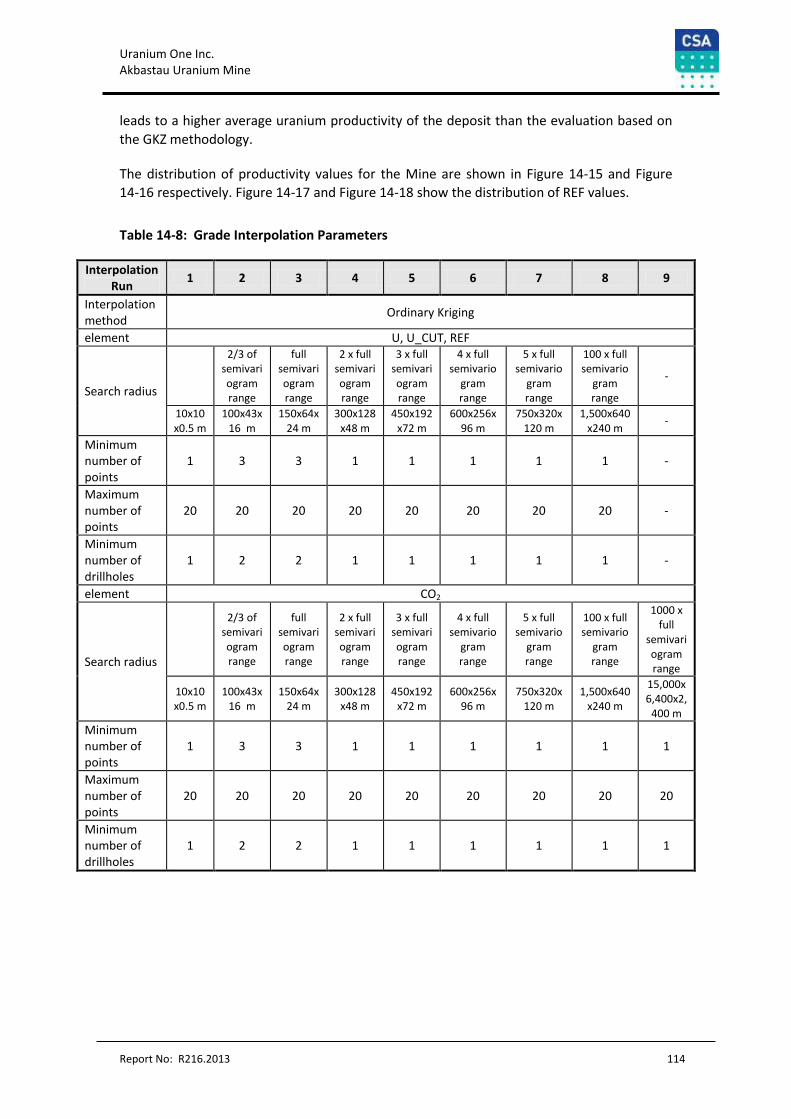
Uranium One Inc. Akbastau Uranium Mine
Report No: R216.2013 114
leads to a higher average uranium productivity of the deposit than the evaluation based on
the GKZ methodology.
The distribution of productivity values for the Mine are shown in Figure 14-15 and Figure
14-16 respectively. Figure 14-17 and Figure 14-18 show the distribution of REF values.
Table 14-8: Grade Interpolation Parameters
Interpolation Run
1 2 3 4 5 6 7 8 9
Interpolation method
Ordinary Kriging
element U, U_CUT, REF
Search radius
2/3 of semivariogram range
full semivariogram range
2 x full semivariogram range
3 x full semivariogram range
4 x full semivario
gram range
5 x full semivario
gram range
100 x full semivario
gram range
-
10х10х0.5 m
100x43x16 m
150x64x24 m
300x128x48 m
450x192x72 m
600x256x96 m
750x320x120 m
1,500x640x240 m
-
Minimum number of points
1 3 3 1 1 1 1 1 -
Maximum number of points
20 20 20 20 20 20 20 20 -
Minimum number of drillholes
1 2 2 1 1 1 1 1 -
element CO2
Search radius
2/3 of semivariogram range
full semivariogram range
2 x full semivariogram range
3 x full semivariogram range
4 x full semivario
gram range
5 x full semivario
gram range
100 x full semivario
gram range
1000 x full
semivariogram range
10х10х0.5 m
100x43x16 m
150x64x24 m
300x128x48 m
450x192x72 m
600x256x96 m
750x320x120 m
1,500x640x240 m
15,000x6,400x2,
400 m
Minimum number of points
1 3 3 1 1 1 1 1 1
Maximum number of points
20 20 20 20 20 20 20 20 20
Minimum number of drillholes
1 2 2 1 1 1 1 1 1
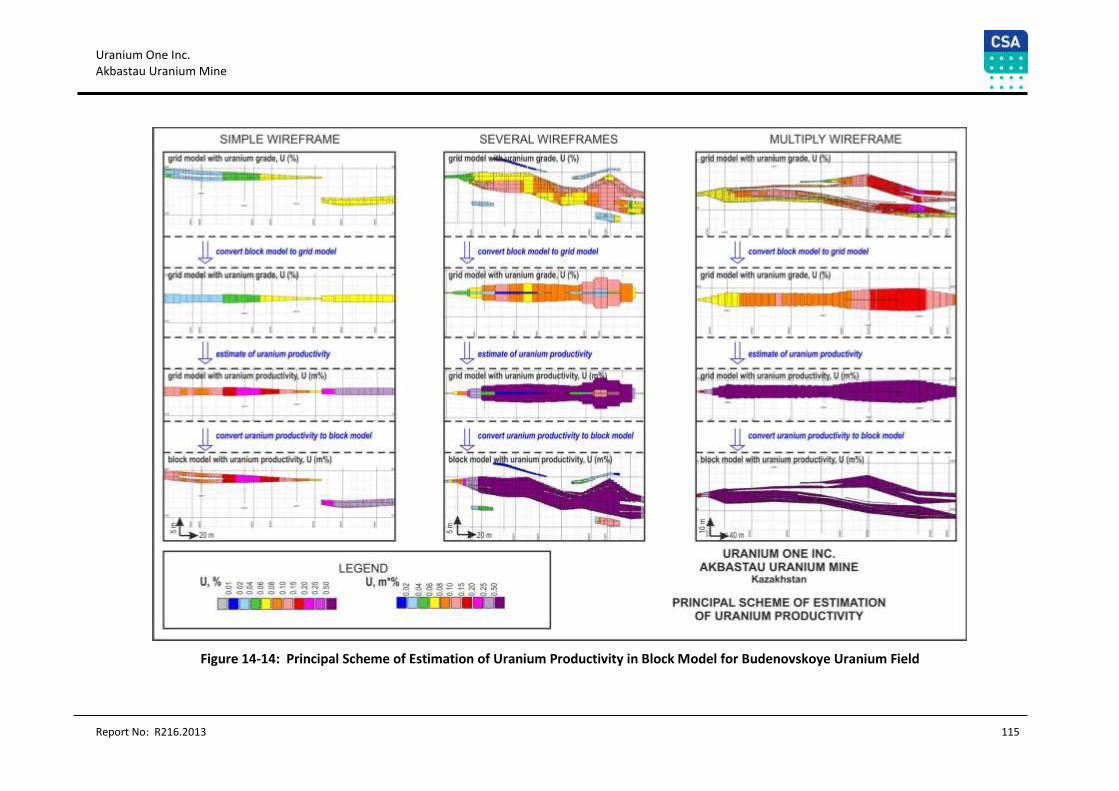
Uranium One Inc. Akbastau Uranium Mine
Report No: R216.2013 115
Figure 14-14: Principal Scheme of Estimation of Uranium Productivity in Block Model for Budenovskoye Uranium Field
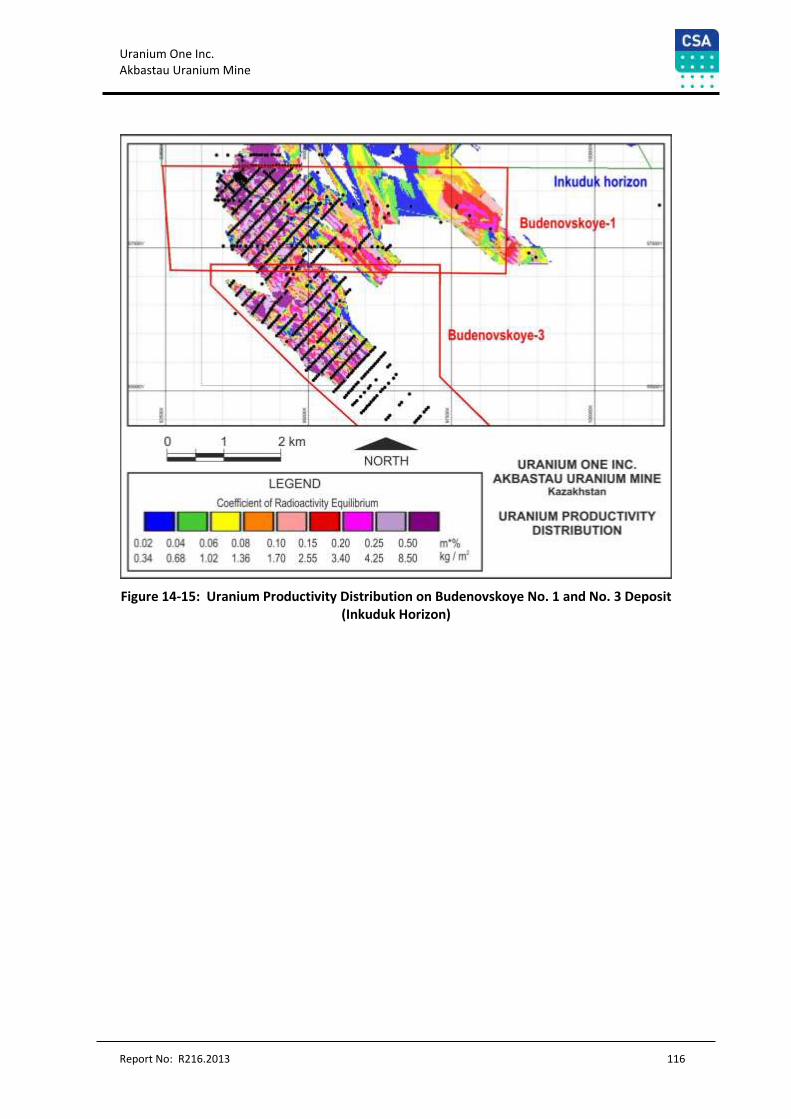
Uranium One Inc. Akbastau Uranium Mine
Report No: R216.2013 116
Figure 14-15: Uranium Productivity Distribution on Budenovskoye No. 1 and No. 3 Deposit (Inkuduk Horizon)
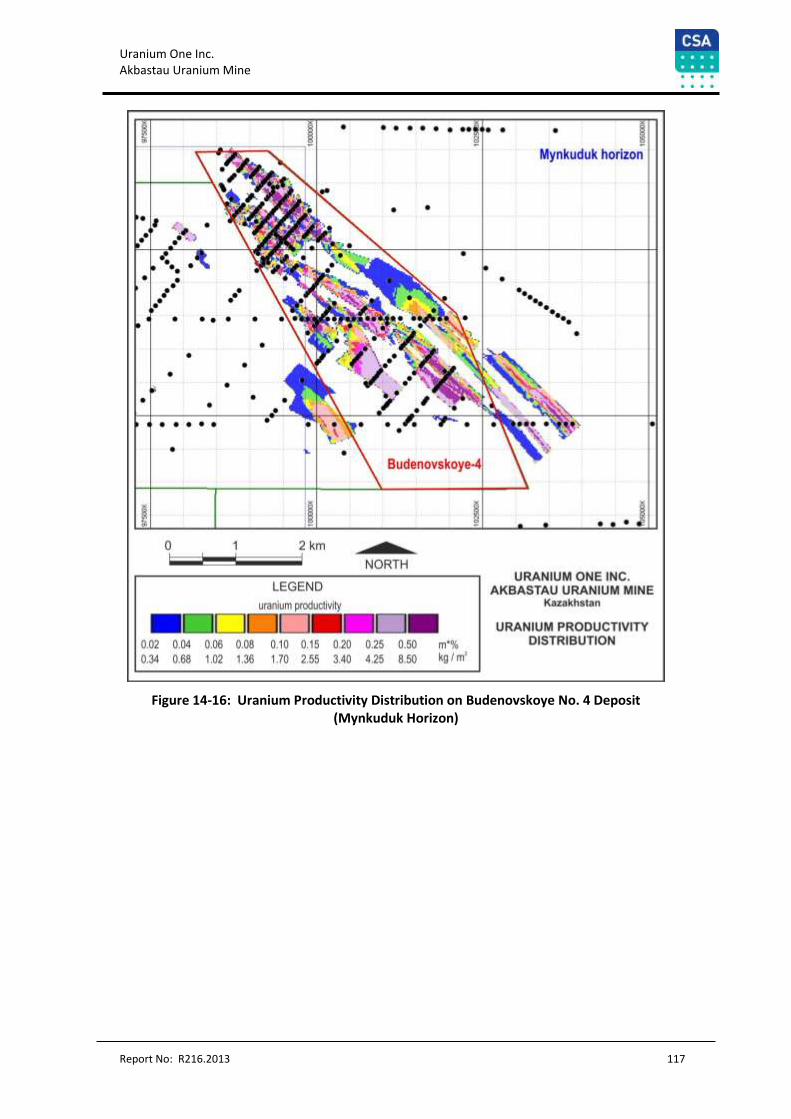
Uranium One Inc. Akbastau Uranium Mine
Report No: R216.2013 117
Figure 14-16: Uranium Productivity Distribution on Budenovskoye No. 4 Deposit (Mynkuduk Horizon)
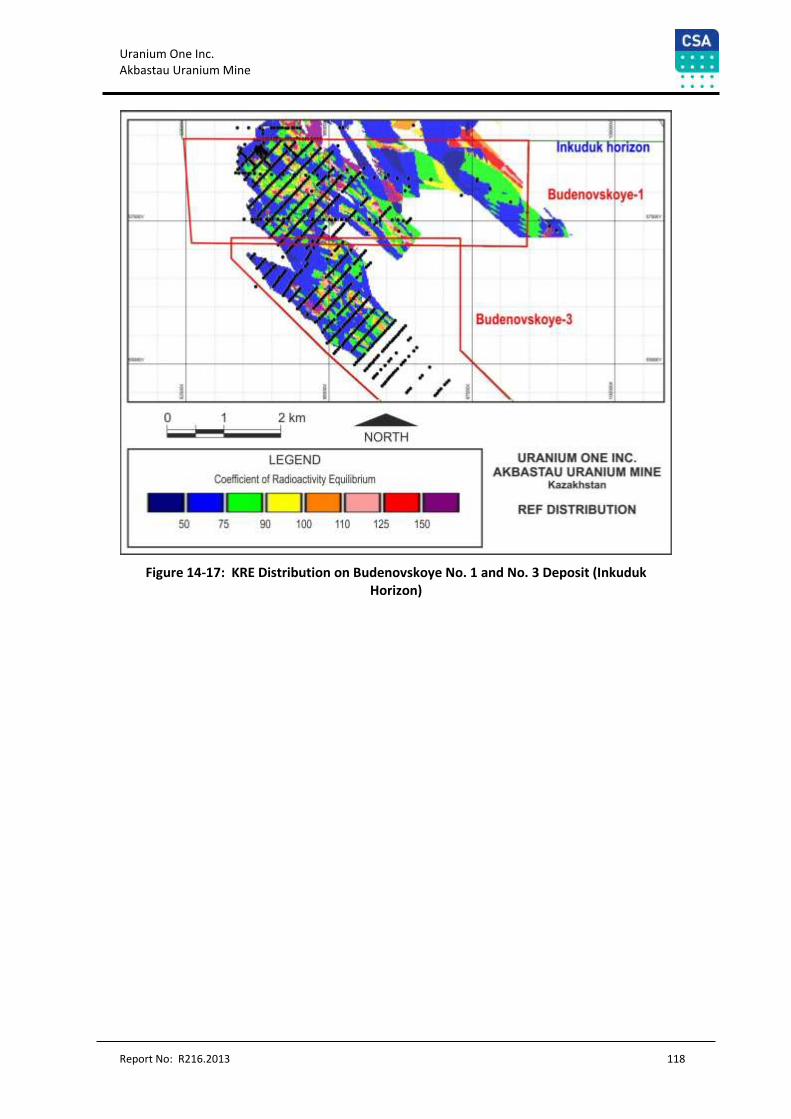
Uranium One Inc. Akbastau Uranium Mine
Report No: R216.2013 118
Figure 14-17: KRE Distribution on Budenovskoye No. 1 and No. 3 Deposit (Inkuduk Horizon)
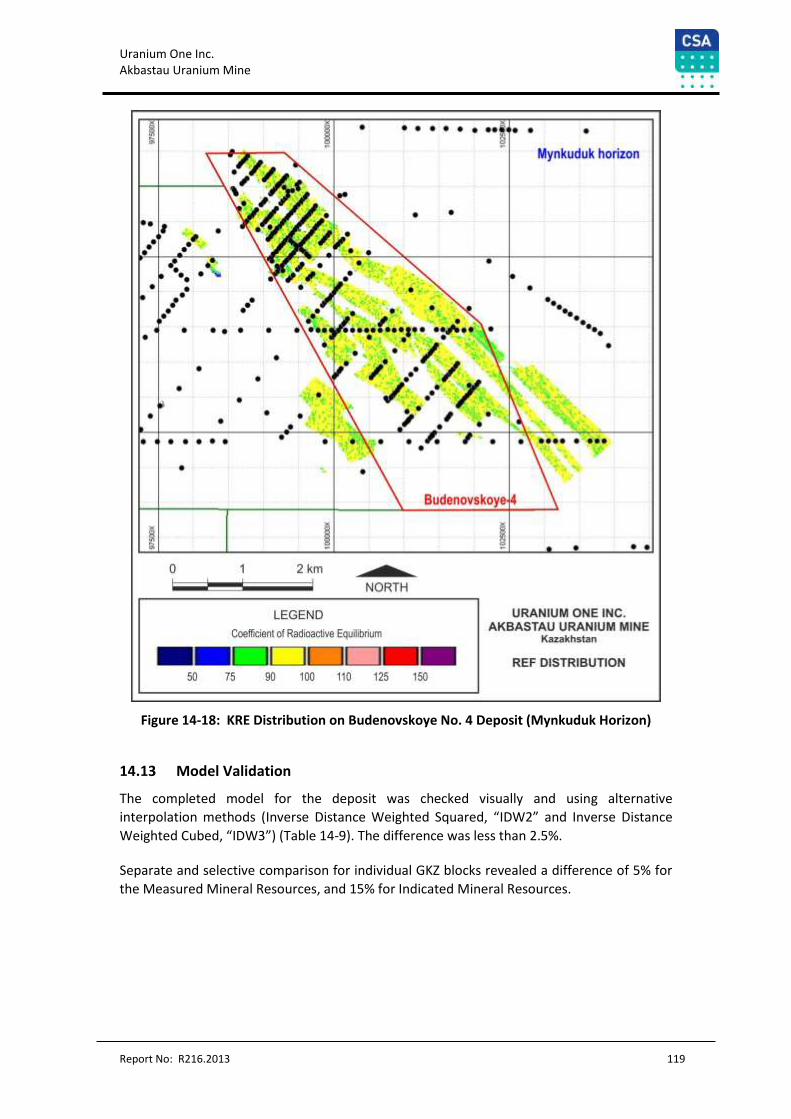
Uranium One Inc. Akbastau Uranium Mine
Report No: R216.2013 119
Figure 14-18: KRE Distribution on Budenovskoye No. 4 Deposit (Mynkuduk Horizon)
14.13 Model Validation
The completed model for the deposit was checked visually and using alternative
interpolation methods (Inverse Distance Weighted Squared, “IDW2” and Inverse Distance
Weighted Cubed, “IDW3”) (Table 14-9). The difference was less than 2.5%.
Separate and selective comparison for individual GKZ blocks revealed a difference of 5% for
the Measured Mineral Resources, and 15% for Indicated Mineral Resources.
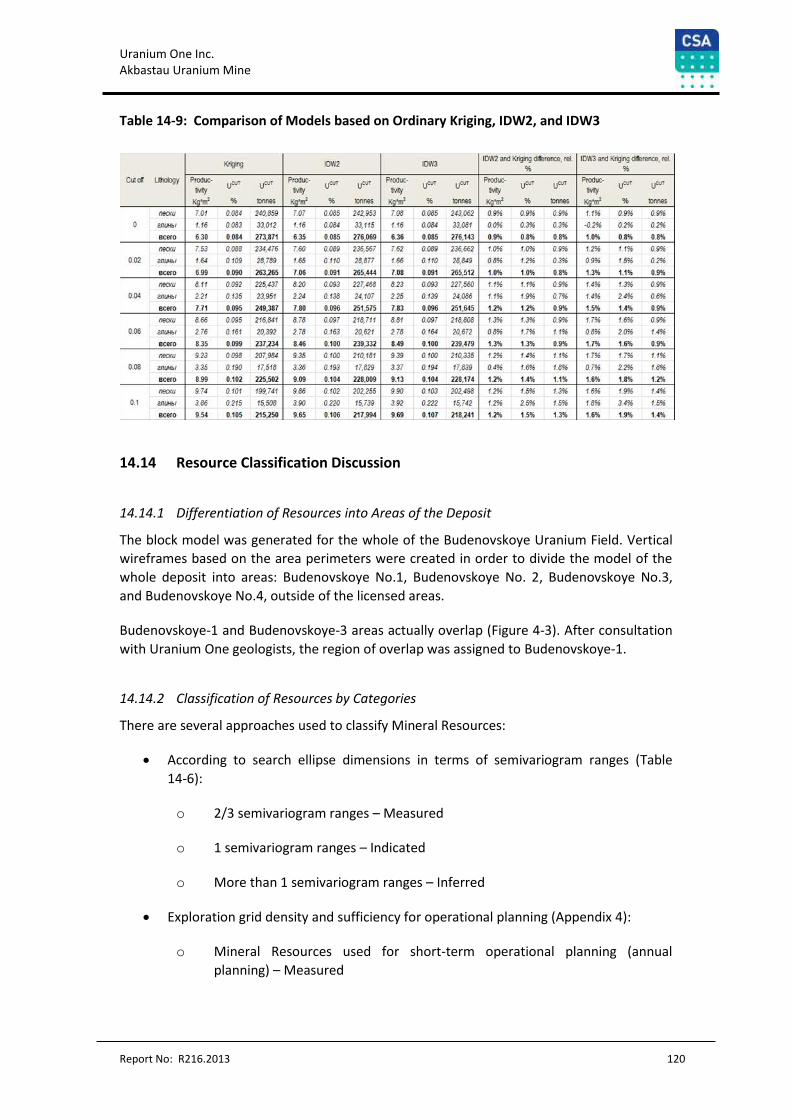
Uranium One Inc. Akbastau Uranium Mine
Report No: R216.2013 120
Table 14-9: Comparison of Models based on Ordinary Kriging, IDW2, and IDW3
14.14 Resource Classification Discussion
14.14.1 Differentiation of Resources into Areas of the Deposit
The block model was generated for the whole of the Budenovskoye Uranium Field. Vertical
wireframes based on the area perimeters were created in order to divide the model of the
whole deposit into areas: Budenovskoye No.1, Budenovskoye No. 2, Budenovskoye No.3,
and Budenovskoye No.4, outside of the licensed areas.
Budenovskoye-1 and Budenovskoye-3 areas actually overlap (Figure 4-3). After consultation
with Uranium One geologists, the region of overlap was assigned to Budenovskoye-1.
14.14.2 Classification of Resources by Categories
There are several approaches used to classify Mineral Resources:
According to search ellipse dimensions in terms of semivariogram ranges (Table
14-6):
o 2/3 semivariogram ranges – Measured
o 1 semivariogram ranges – Indicated
o More than 1 semivariogram ranges – Inferred
Exploration grid density and sufficiency for operational planning (Appendix 4):
o Mineral Resources used for short-term operational planning (annual
planning) – Measured
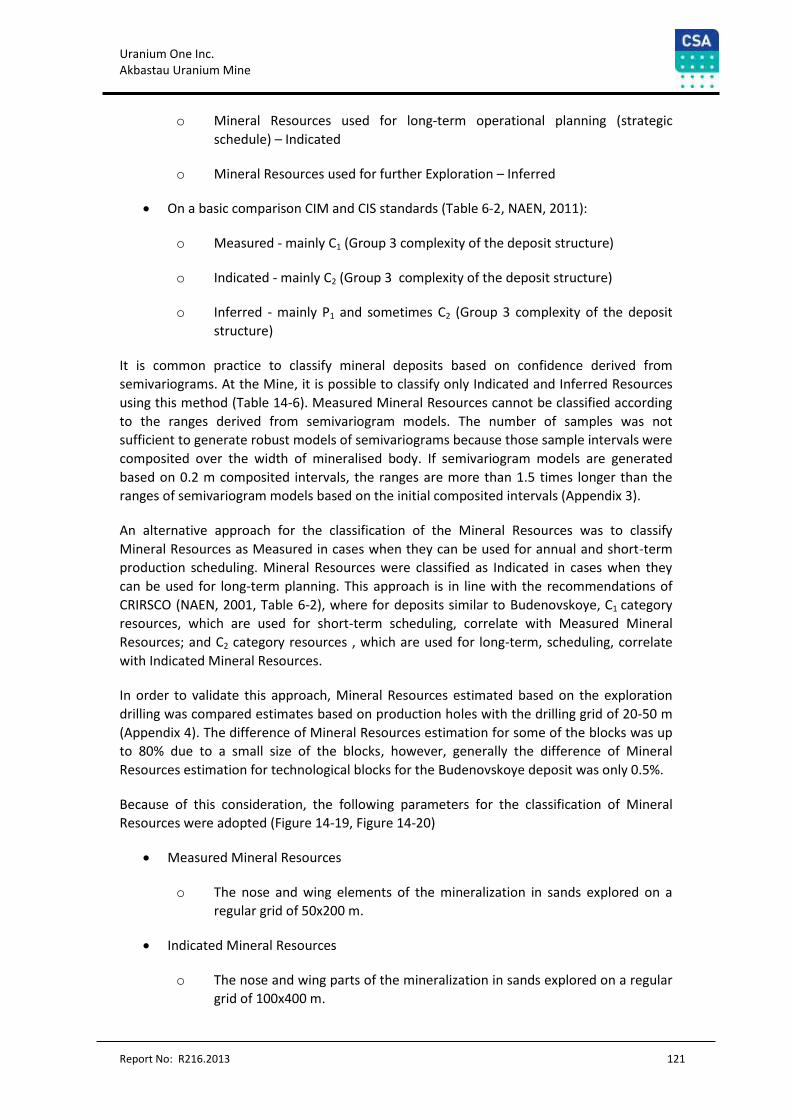
Uranium One Inc. Akbastau Uranium Mine
Report No: R216.2013 121
o Mineral Resources used for long-term operational planning (strategic
schedule) – Indicated
o Mineral Resources used for further Exploration – Inferred
On a basic comparison CIM and CIS standards (Table 6-2, NAEN, 2011):
o Measured - mainly C1 (Group 3 complexity of the deposit structure)
o Indicated - mainly C2 (Group 3 complexity of the deposit structure)
o Inferred - mainly P1 and sometimes C2 (Group 3 complexity of the deposit
structure)
It is common practice to classify mineral deposits based on confidence derived from
semivariograms. At the Mine, it is possible to classify only Indicated and Inferred Resources
using this method (Table 14-6). Measured Mineral Resources cannot be classified according
to the ranges derived from semivariogram models. The number of samples was not
sufficient to generate robust models of semivariograms because those sample intervals were
composited over the width of mineralised body. If semivariogram models are generated
based on 0.2 m composited intervals, the ranges are more than 1.5 times longer than the
ranges of semivariogram models based on the initial composited intervals (Appendix 3).
An alternative approach for the classification of the Mineral Resources was to classify
Mineral Resources as Measured in cases when they can be used for annual and short-term
production scheduling. Mineral Resources were classified as Indicated in cases when they
can be used for long-term planning. This approach is in line with the recommendations of
CRIRSCO (NAEN, 2001, Table 6-2), where for deposits similar to Budenovskoye, C1 category
resources, which are used for short-term scheduling, correlate with Measured Mineral
Resources; and C2 category resources , which are used for long-term, scheduling, correlate
with Indicated Mineral Resources.
In order to validate this approach, Mineral Resources estimated based on the exploration
drilling was compared estimates based on production holes with the drilling grid of 20-50 m
(Appendix 4). The difference of Mineral Resources estimation for some of the blocks was up
to 80% due to a small size of the blocks, however, generally the difference of Mineral
Resources estimation for technological blocks for the Budenovskoye deposit was only 0.5%.
Because of this consideration, the following parameters for the classification of Mineral
Resources were adopted (Figure 14-19, Figure 14-20)
Measured Mineral Resources
o The nose and wing elements of the mineralization in sands explored on a
regular grid of 50x200 m.
Indicated Mineral Resources
o The nose and wing parts of the mineralization in sands explored on a regular
grid of 100x400 m.
Uranium One Inc. Akbastau Uranium Mine
Report No: R216.2013 122
o The residual parts of the mineralization in sands explored on a regular grid of
50x200 m.
Inferred Mineral Resources
o All the other parts of the mineralization inside wireframes.
Mineralization in clays has been excluded from Mineral Resource estimation.
Figure 14-19: Resource Classification for Budenovskoye No. 1 and No. 3 Deposit
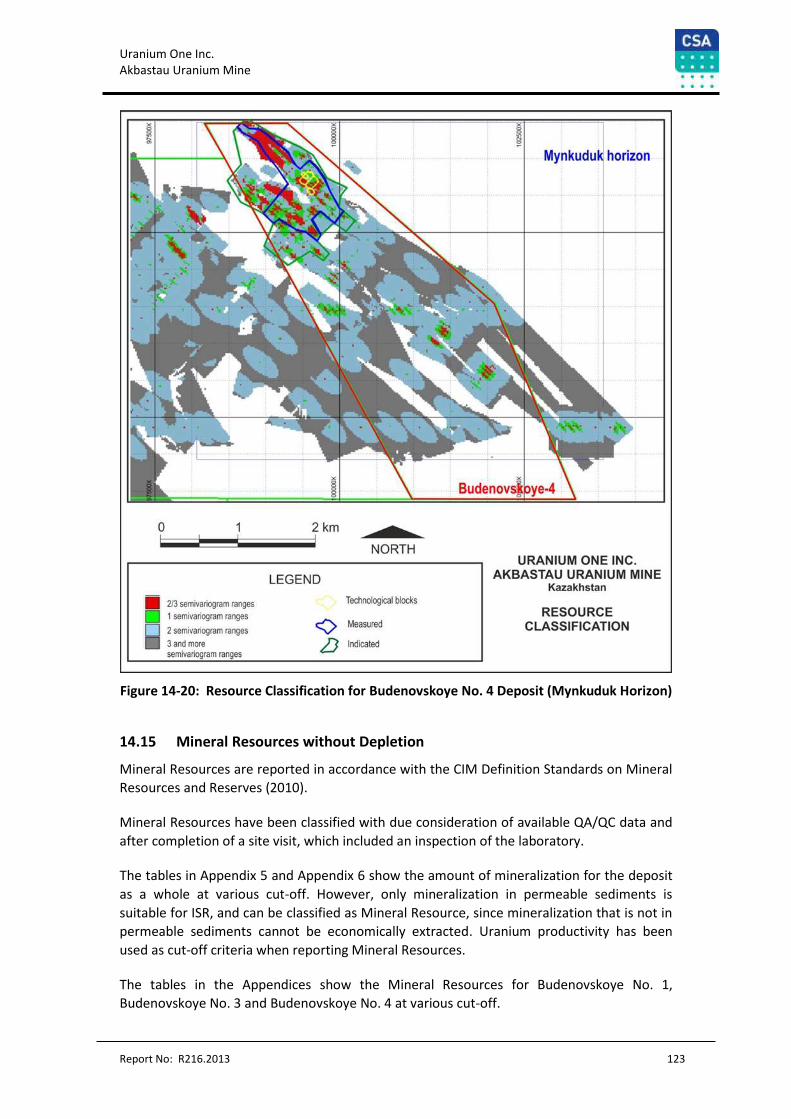
Uranium One Inc. Akbastau Uranium Mine
Report No: R216.2013 123
Figure 14-20: Resource Classification for Budenovskoye No. 4 Deposit (Mynkuduk Horizon)
14.15 Mineral Resources without Depletion
Mineral Resources are reported in accordance with the CIM Definition Standards on Mineral
Resources and Reserves (2010).
Mineral Resources have been classified with due consideration of available QA/QC data and
after completion of a site visit, which included an inspection of the laboratory.
The tables in Appendix 5 and Appendix 6 show the amount of mineralization for the deposit
as a whole at various cut-off. However, only mineralization in permeable sediments is
suitable for ISR, and can be classified as Mineral Resource, since mineralization that is not in
permeable sediments cannot be economically extracted. Uranium productivity has been
used as cut-off criteria when reporting Mineral Resources.
The tables in the Appendices show the Mineral Resources for Budenovskoye No. 1,
Budenovskoye No. 3 and Budenovskoye No. 4 at various cut-off.
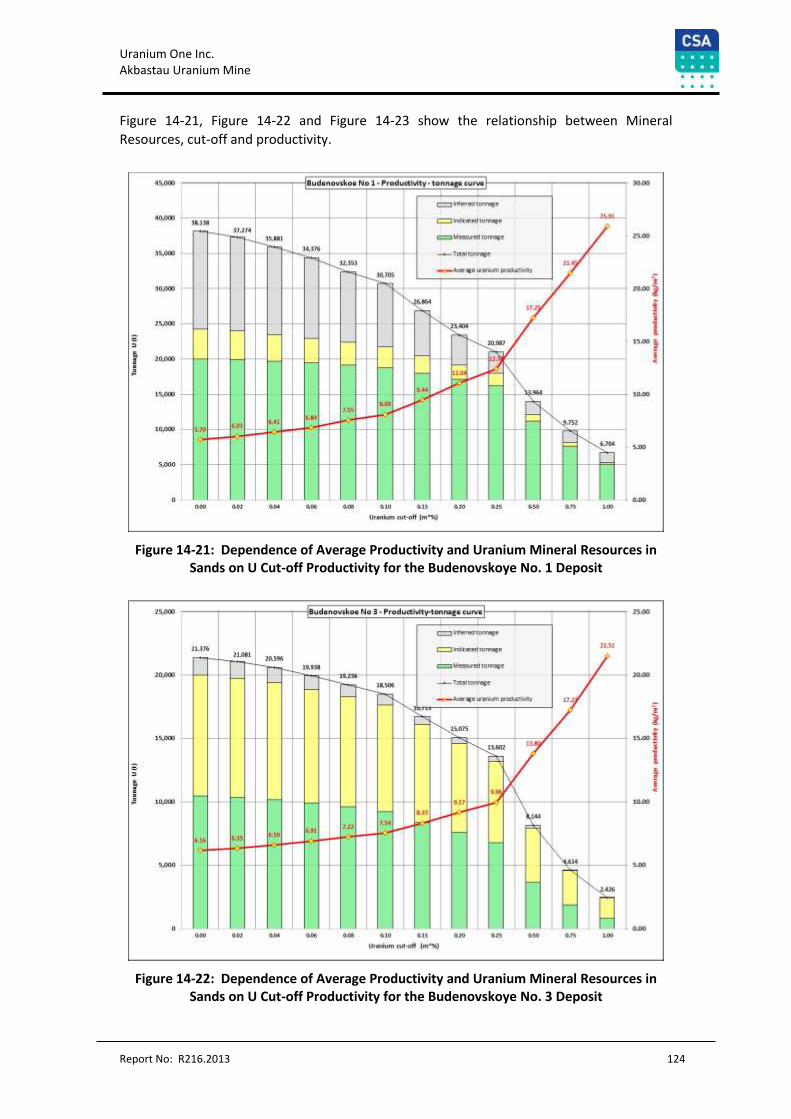
Uranium One Inc. Akbastau Uranium Mine
Report No: R216.2013 124
Figure 14-21, Figure 14-22 and Figure 14-23 show the relationship between Mineral
Resources, cut-off and productivity.
Figure 14-21: Dependence of Average Productivity and Uranium Mineral Resources in Sands on U Cut-off Productivity for the Budenovskoye No. 1 Deposit
Figure 14-22: Dependence of Average Productivity and Uranium Mineral Resources in Sands on U Cut-off Productivity for the Budenovskoye No. 3 Deposit
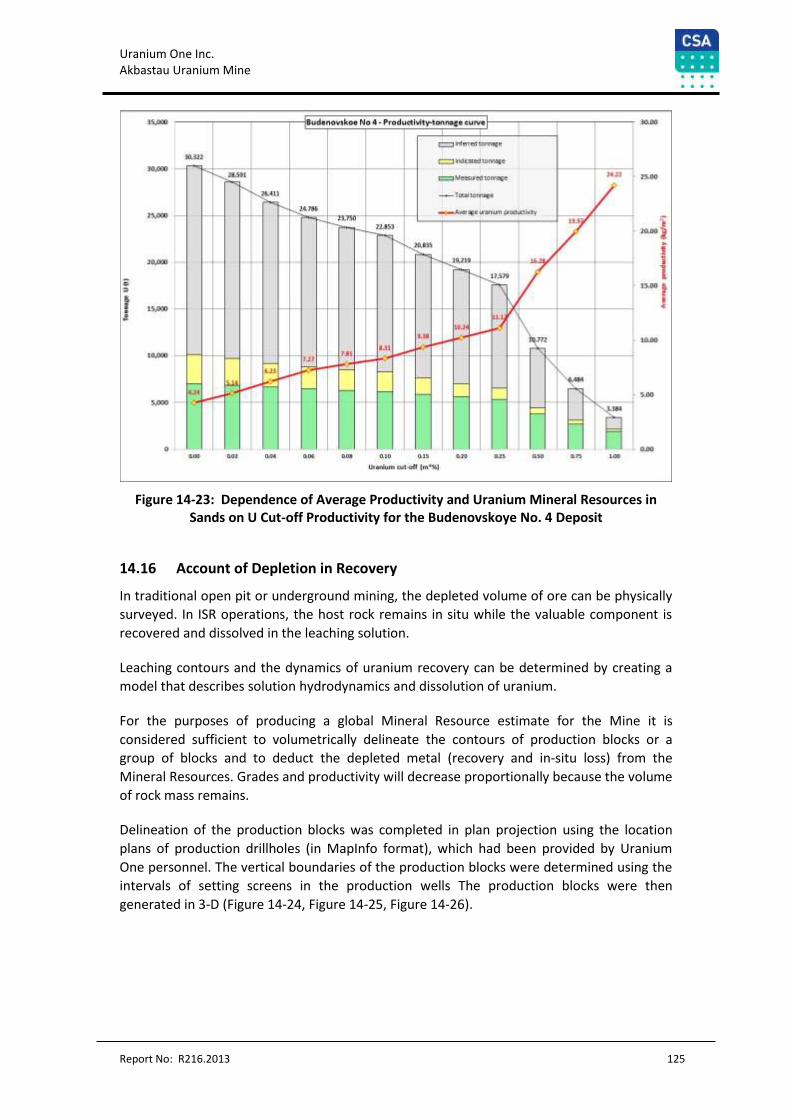
Uranium One Inc. Akbastau Uranium Mine
Report No: R216.2013 125
Figure 14-23: Dependence of Average Productivity and Uranium Mineral Resources in Sands on U Cut-off Productivity for the Budenovskoye No. 4 Deposit
14.16 Account of Depletion in Recovery
In traditional open pit or underground mining, the depleted volume of ore can be physically
surveyed. In ISR operations, the host rock remains in situ while the valuable component is
recovered and dissolved in the leaching solution.
Leaching contours and the dynamics of uranium recovery can be determined by creating a
model that describes solution hydrodynamics and dissolution of uranium.
For the purposes of producing a global Mineral Resource estimate for the Mine it is
considered sufficient to volumetrically delineate the contours of production blocks or a
group of blocks and to deduct the depleted metal (recovery and in-situ loss) from the
Mineral Resources. Grades and productivity will decrease proportionally because the volume
of rock mass remains.
Delineation of the production blocks was completed in plan projection using the location
plans of production drillholes (in MapInfo format), which had been provided by Uranium
One personnel. The vertical boundaries of the production blocks were determined using the
intervals of setting screens in the production wells The production blocks were then
generated in 3-D (Figure 14-24, Figure 14-25, Figure 14-26).
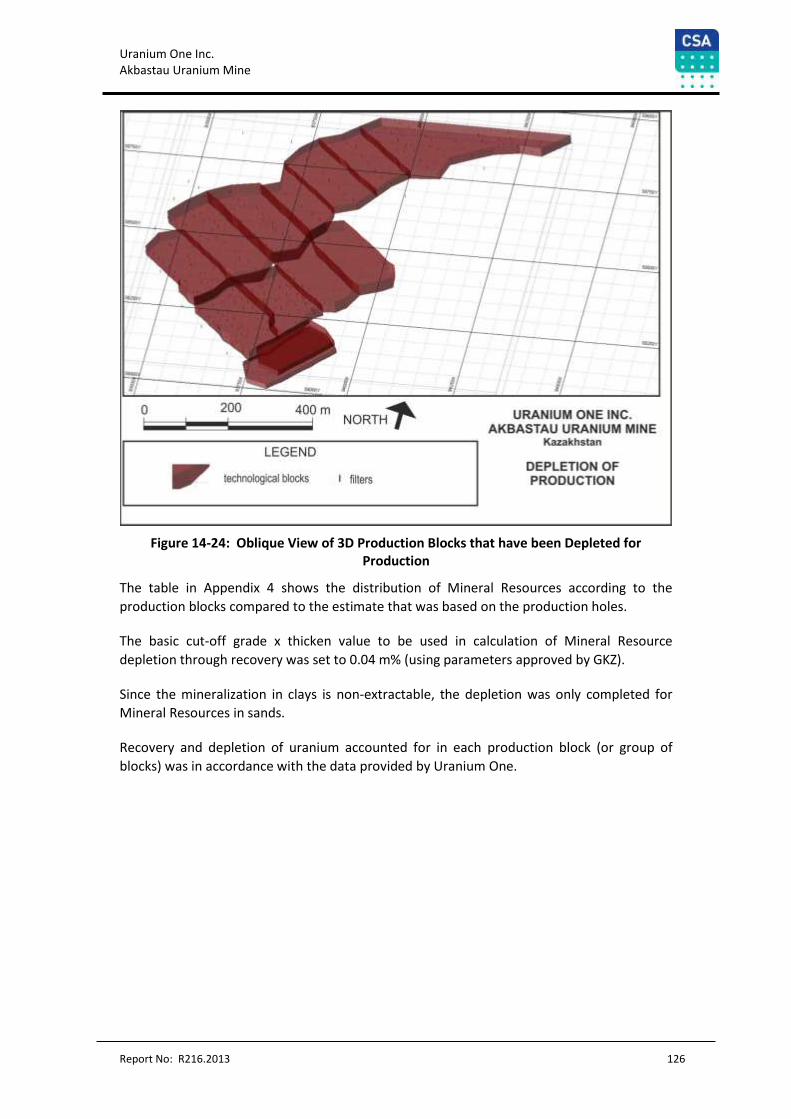
Uranium One Inc. Akbastau Uranium Mine
Report No: R216.2013 126
Figure 14-24: Oblique View of 3D Production Blocks that have been Depleted for Production
The table in Appendix 4 shows the distribution of Mineral Resources according to the
production blocks compared to the estimate that was based on the production holes.
The basic cut-off grade x thicken value to be used in calculation of Mineral Resource
depletion through recovery was set to 0.04 m% (using parameters approved by GKZ).
Since the mineralization in clays is non-extractable, the depletion was only completed for
Mineral Resources in sands.
Recovery and depletion of uranium accounted for in each production block (or group of
blocks) was in accordance with the data provided by Uranium One.
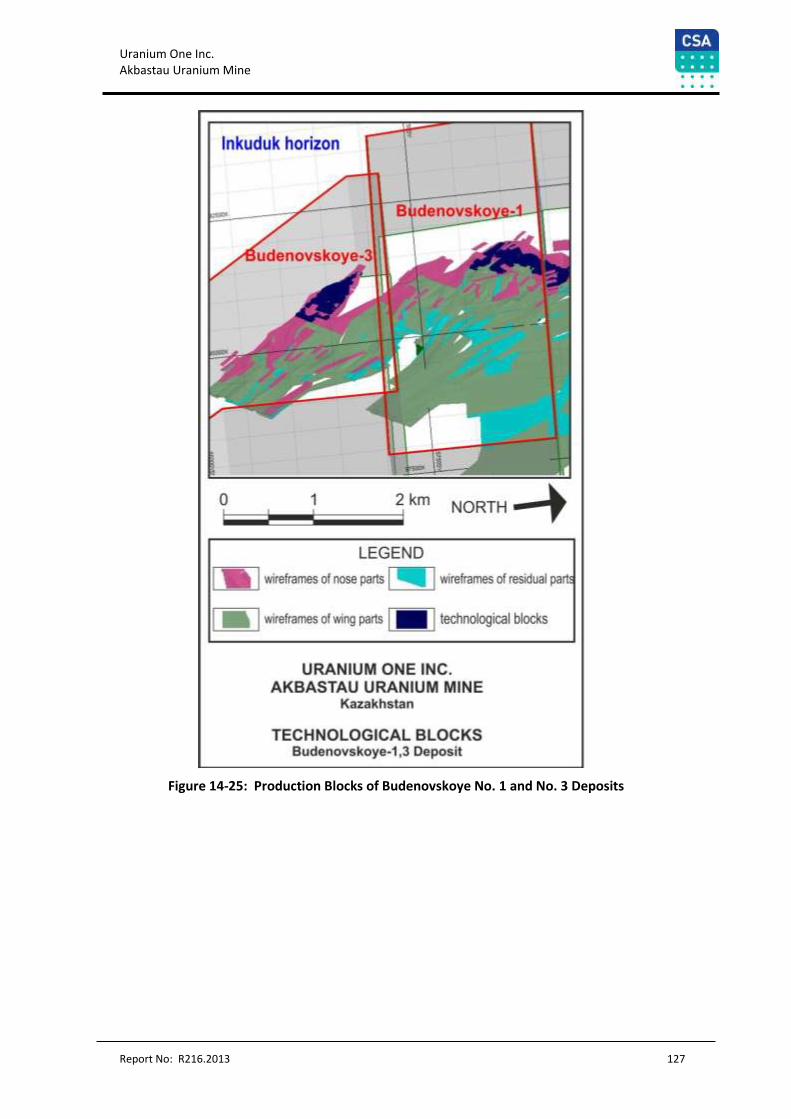
Uranium One Inc. Akbastau Uranium Mine
Report No: R216.2013 127
Figure 14-25: Production Blocks of Budenovskoye No. 1 and No. 3 Deposits
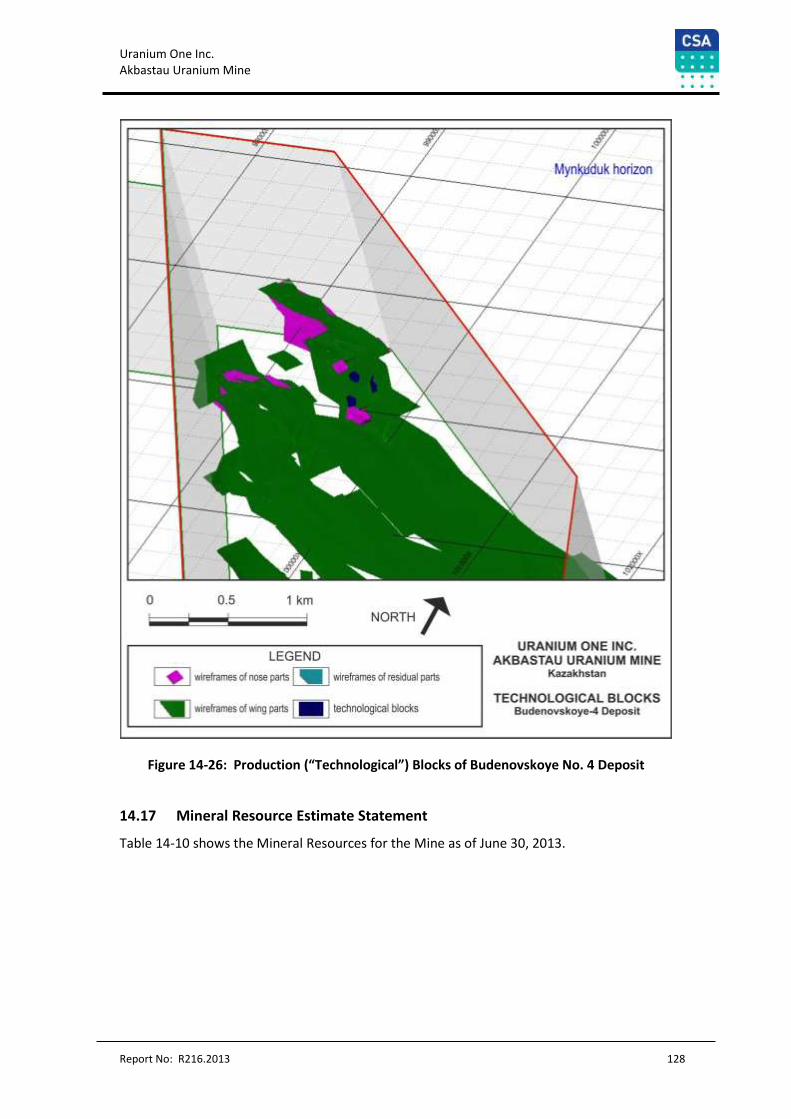
Uranium One Inc. Akbastau Uranium Mine
Report No: R216.2013 128
Figure 14-26: Production (“Technological”) Blocks of Budenovskoye No. 4 Deposit
14.17 Mineral Resource Estimate Statement
Table 14-10 shows the Mineral Resources for the Mine as of June 30, 2013.
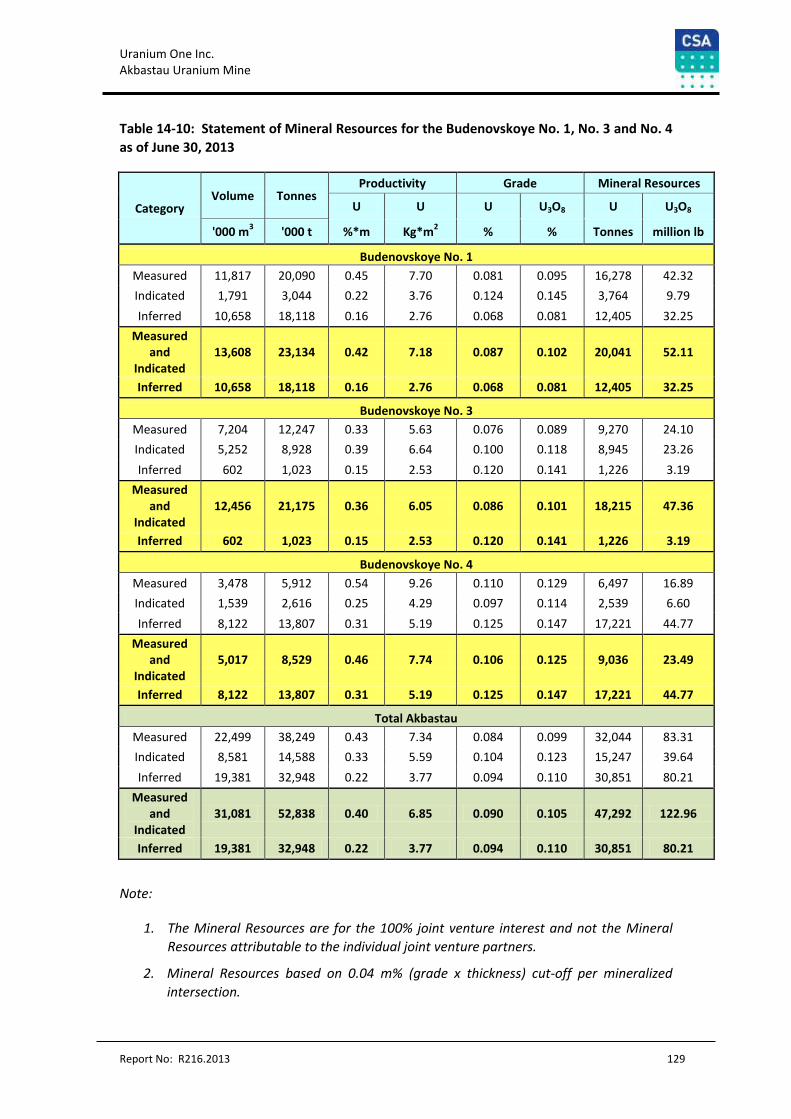
Uranium One Inc. Akbastau Uranium Mine
Report No: R216.2013 129
Table 14-10: Statement of Mineral Resources for the Budenovskoye No. 1, No. 3 and No. 4
as of June 30, 2013
Category Volume Tonnes
Productivity Grade Mineral Resources
U U U U3O8 U U3O8
'000 m3 '000 t %*m Kg*m
2 % % Tonnes million lb
Budenovskoye No. 1
Measured 11,817 20,090 0.45 7.70 0.081 0.095 16,278 42.32
Indicated 1,791 3,044 0.22 3.76 0.124 0.145 3,764 9.79
Inferred 10,658 18,118 0.16 2.76 0.068 0.081 12,405 32.25
Measured and
Indicated 13,608 23,134 0.42 7.18 0.087 0.102 20,041 52.11
Inferred 10,658 18,118 0.16 2.76 0.068 0.081 12,405 32.25
Budenovskoye No. 3
Measured 7,204 12,247 0.33 5.63 0.076 0.089 9,270 24.10
Indicated 5,252 8,928 0.39 6.64 0.100 0.118 8,945 23.26
Inferred 602 1,023 0.15 2.53 0.120 0.141 1,226 3.19
Measured and
Indicated 12,456 21,175 0.36 6.05 0.086 0.101 18,215 47.36
Inferred 602 1,023 0.15 2.53 0.120 0.141 1,226 3.19
Budenovskoye No. 4
Measured 3,478 5,912 0.54 9.26 0.110 0.129 6,497 16.89
Indicated 1,539 2,616 0.25 4.29 0.097 0.114 2,539 6.60
Inferred 8,122 13,807 0.31 5.19 0.125 0.147 17,221 44.77
Measured and
Indicated 5,017 8,529 0.46 7.74 0.106 0.125 9,036 23.49
Inferred 8,122 13,807 0.31 5.19 0.125 0.147 17,221 44.77
Total Akbastau
Measured 22,499 38,249 0.43 7.34 0.084 0.099 32,044 83.31
Indicated 8,581 14,588 0.33 5.59 0.104 0.123 15,247 39.64
Inferred 19,381 32,948 0.22 3.77 0.094 0.110 30,851 80.21
Measured and
Indicated 31,081 52,838 0.40 6.85 0.090 0.105 47,292 122.96
Inferred 19,381 32,948 0.22 3.77 0.094 0.110 30,851 80.21
Note:
1. The Mineral Resources are for the 100% joint venture interest and not the Mineral
Resources attributable to the individual joint venture partners.
2. Mineral Resources based on 0.04 m% (grade x thickness) cut-off per mineralized
intersection.
Uranium One Inc. Akbastau Uranium Mine
Report No: R216.2013 130
3. Mineral Resources that are not Mineral Reserves do not have demonstrated
economic viability.
4. Mineral Resources based on CIM definitions.
5. Mineral Resources based on bulk density of 1.70 t/m3
6. Depletion estimated using losses 10%.
7. Measured Mineral Resources based on exploration drilling density of 50 m x 200 m
(excluding residual mineralized bodies).
8. Indicated Mineral Resources based on exploration drilling density of 50-100 m x 400
m (excluding residual mineralized bodies) and 50 m x 200 m for residual mineralized
bodies.
9. Inferred Mineral Resources are based on exploration drilling density of 100-800 m x
400-1,600 m.
10. Mineral Resources include Mineral Reserves.
11. Rows and columns may not add exactly due to rounding.
14.18 Mineral Resources Compared to Previous Estimates
Mineral Resources for the Mine that have been previously estimated and reported by
Uranium One followed GKZ standards and then converted to CIM classification.
Therefore, for the purposes of comparison, it is sufficient to use the most recent Mineral
Resource and exploration estimates completed in accordance with GKZ (Table 14-11). The
comparison was only completed for Mineral Resources hosted in sands, as those are the
only parts of the mineralization suitable for ISR.
14.18.1 Comments for Budenovskoye No. 1 Deposit
The comparison between the Mineral Resource estimate as per the CIM and resource
estimate as per GKZ for Budenovskoye No. 1 Deposit is within 4%, (Table 14-11).
The increase in Measured and Indicated Mineral Resources (when compared to C1+C2
resources) is explained by new assay and drilling data that became available after the last
approval of mineral resources in GKZ.
14.18.2 Comments for Budenovskoye No. 3
The comparison between the Measured and Indicated Mineral Resources estimates as per
CIM and the C1+C2 mineral resource estimates as per GKZ is excellent (Table 14-11).
Redistribution of the Mineral Resources to Measured is explained by new data available
after the last approval in GKZ.
However, Inferred Mineral Resource estimates as per CIM are considerably lower than the P1
estimates as per GKZ (Table 14-11). This is due to an incomplete drillhole database, which
prevented full construction of the geological model (and estimation of Mineral Resources for
the southern flank of the deposit).
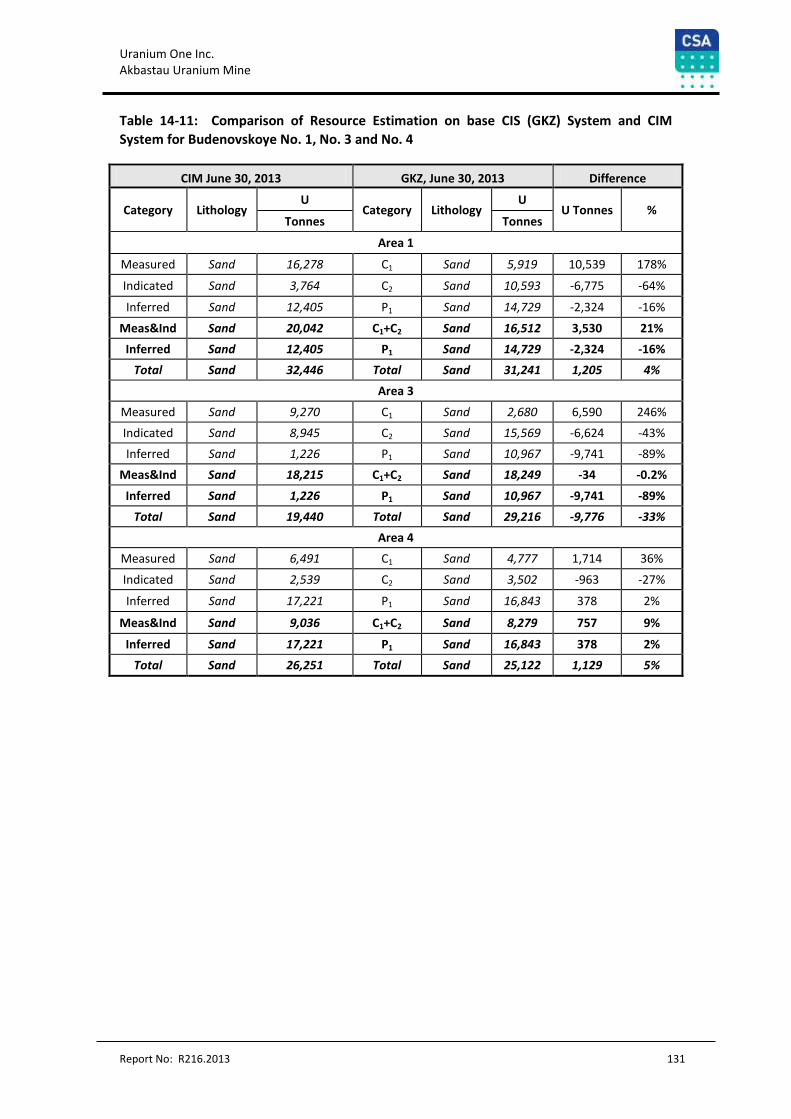
Uranium One Inc. Akbastau Uranium Mine
Report No: R216.2013 131
Table 14-11: Comparison of Resource Estimation on base CIS (GKZ) System and CIM
System for Budenovskoye No. 1, No. 3 and No. 4
CIM June 30, 2013 GKZ, June 30, 2013 Difference
Category Lithology U
Category Lithology U
U Tonnes % Tonnes Tonnes
Area 1
Measured Sand 16,278 C1 Sand 5,919 10,539 178%
Indicated Sand 3,764 C2 Sand 10,593 -6,775 -64%
Inferred Sand 12,405 P1 Sand 14,729 -2,324 -16%
Meas&Ind Sand 20,042 C1+C2 Sand 16,512 3,530 21%
Inferred Sand 12,405 P1 Sand 14,729 -2,324 -16%
Total Sand 32,446 Total Sand 31,241 1,205 4%
Area 3
Measured Sand 9,270 C1 Sand 2,680 6,590 246%
Indicated Sand 8,945 C2 Sand 15,569 -6,624 -43%
Inferred Sand 1,226 P1 Sand 10,967 -9,741 -89%
Meas&Ind Sand 18,215 C1+C2 Sand 18,249 -34 -0.2%
Inferred Sand 1,226 P1 Sand 10,967 -9,741 -89%
Total Sand 19,440 Total Sand 29,216 -9,776 -33%
Area 4
Measured Sand 6,491 C1 Sand 4,777 1,714 36%
Indicated Sand 2,539 C2 Sand 3,502 -963 -27%
Inferred Sand 17,221 P1 Sand 16,843 378 2%
Meas&Ind Sand 9,036 C1+C2 Sand 8,279 757 9%
Inferred Sand 17,221 P1 Sand 16,843 378 2%
Total Sand 26,251 Total Sand 25,122 1,129 5%
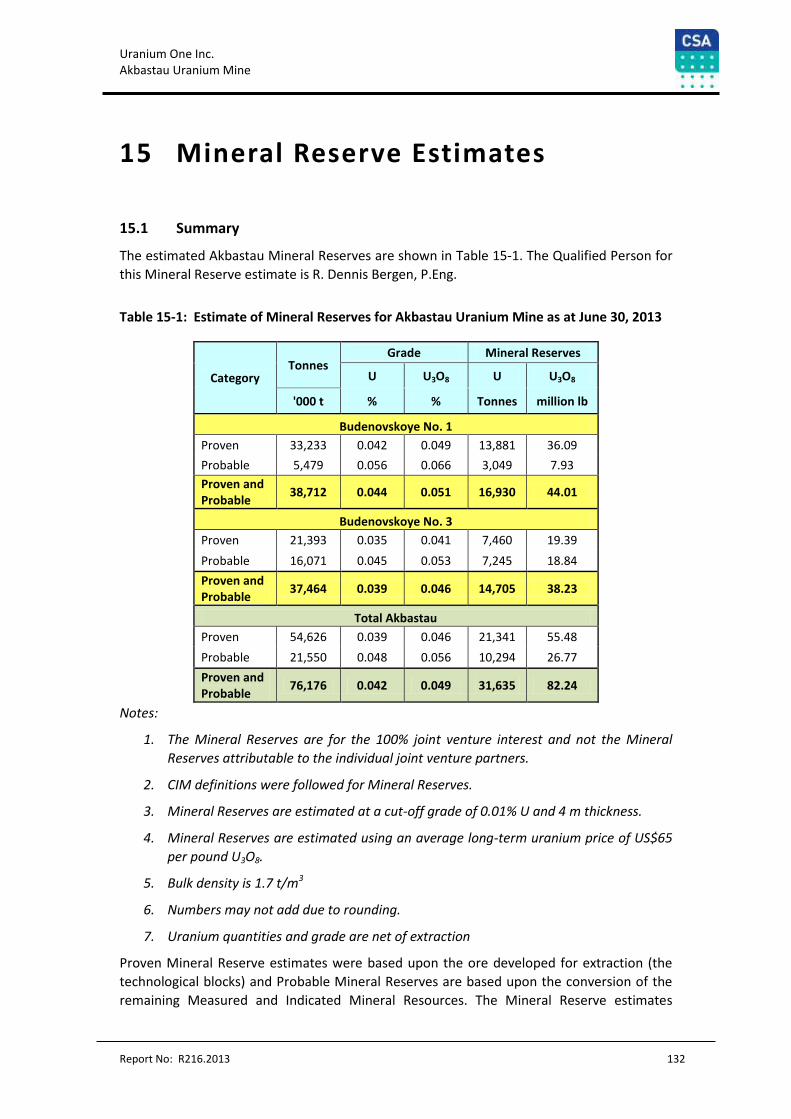
Uranium One Inc. Akbastau Uranium Mine
Report No: R216.2013 132
15 Mineral Reserve Estimates
15.1 Summary
The estimated Akbastau Mineral Reserves are shown in Table 15-1. The Qualified Person for
this Mineral Reserve estimate is R. Dennis Bergen, P.Eng.
Table 15-1: Estimate of Mineral Reserves for Akbastau Uranium Mine as at June 30, 2013
Category Tonnes
Grade Mineral Reserves
U U3O8 U U3O8
'000 t % % Tonnes million lb
Budenovskoye No. 1
Proven 33,233 0.042 0.049 13,881 36.09
Probable 5,479 0.056 0.066 3,049 7.93
Proven and Probable
38,712 0.044 0.051 16,930 44.01
Budenovskoye No. 3
Proven 21,393 0.035 0.041 7,460 19.39
Probable 16,071 0.045 0.053 7,245 18.84
Proven and Probable
37,464 0.039 0.046 14,705 38.23
Total Akbastau
Proven 54,626 0.039 0.046 21,341 55.48
Probable 21,550 0.048 0.056 10,294 26.77
Proven and Probable
76,176 0.042 0.049 31,635 82.24
Notes:
1. The Mineral Reserves are for the 100% joint venture interest and not the Mineral
Reserves attributable to the individual joint venture partners.
2. CIM definitions were followed for Mineral Reserves.
3. Mineral Reserves are estimated at a cut-off grade of 0.01% U and 4 m thickness.
4. Mineral Reserves are estimated using an average long-term uranium price of US$65
per pound U3O8.
5. Bulk density is 1.7 t/m3
6. Numbers may not add due to rounding.
7. Uranium quantities and grade are net of extraction
Proven Mineral Reserve estimates were based upon the ore developed for extraction (the
technological blocks) and Probable Mineral Reserves are based upon the conversion of the
remaining Measured and Indicated Mineral Resources. The Mineral Reserve estimates
Uranium One Inc. Akbastau Uranium Mine
Report No: R216.2013 133
include dilution and an estimate of the uranium extraction. The estimates are based upon
production to June 2013. The Mineral Reserves are for the 100% joint venture interest and
not the Mineral Reserves attributable to the individual joint venture partners.
15.2 Cut-off Grade
CSA has generated a breakeven cut-off grade estimate for the Akbastau Mineral Reserves
based upon the operating costs projected in the budget for 2013 to 2015. The approach was
to determine the processing costs per cubic metre of process flow and the average
liquid:solid (L:S) ratio. The L:S ratio is the ratio of the tonnes of leaching solution to the
tonnes of ore considered necessary for extraction of the uranium. This is a measure of the
number of leach cycles that a given tonnage of rock will be subjected to over the course of
the mining.
The L:S ratio for the planned extraction was estimated to be three. In fields No. 1 and No. 3
the work to date appears to support this assumption. CSA recommends that the
performance of field No. 4 be monitored to assess the L:S ratio required to attain the
required extraction of uranium. CSA is of the opinion that the L:S ratio to obtain 90%
extraction may in some areas exceed three. CSA has used an L:S ratio of three as the basis
for the cut-off grade calculation as shown in Table 15-2.
Metal prices used for reserves are based on consensus, long term forecasts from banks,
financial institutions, and other sources.
CSA is of the opinion that a breakeven cut-off grade of 0.01% U is appropriate for the
Akbastau deposit in light of expected operating cost reductions as solution flow rate is
increased and that with a four metre minimum thickness, the minimum GT is 0.04 m% U.
The full cost breakeven cut-off grade for the solution is estimated to be 32 mg/L to 37 mg/L
U.
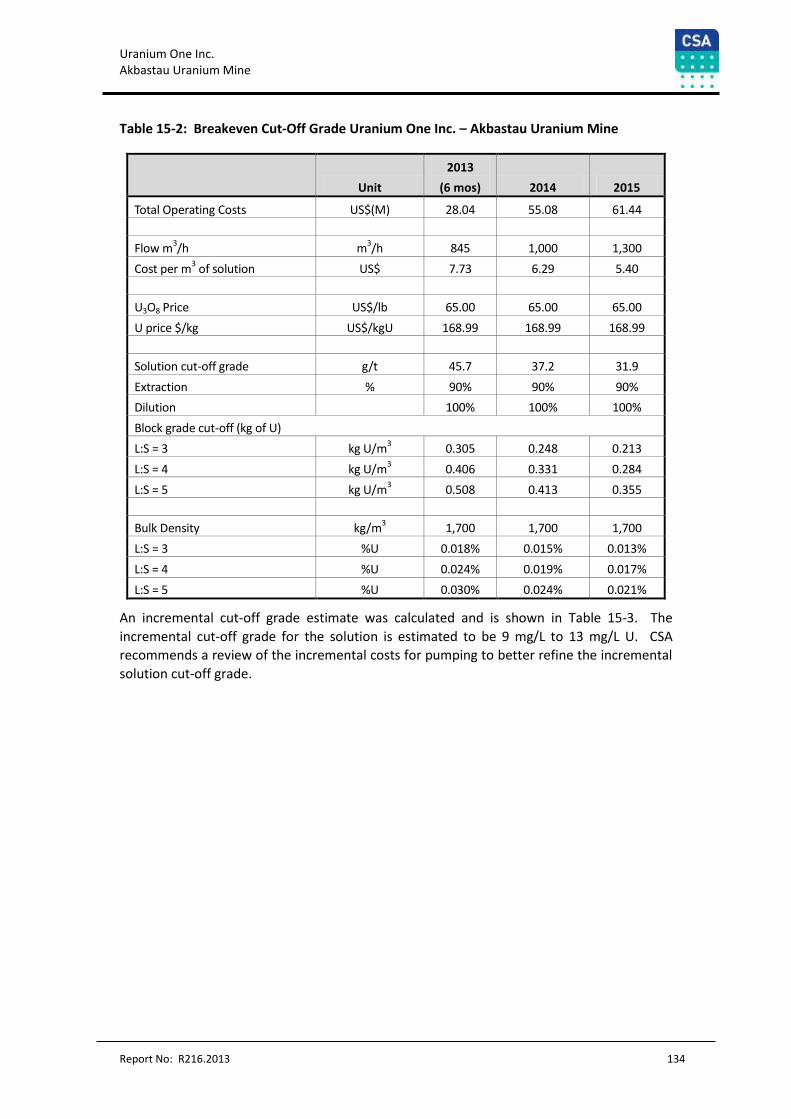
Uranium One Inc. Akbastau Uranium Mine
Report No: R216.2013 134
Table 15-2: Breakeven Cut-Off Grade Uranium One Inc. – Akbastau Uranium Mine
Unit
2013
(6 mos) 2014 2015
Total Operating Costs US$(M) 28.04 55.08 61.44
Flow m3/h m
3/h 845 1,000 1,300
Cost per m3 of solution US$ 7.73 6.29 5.40
U3O8 Price US$/lb 65.00 65.00 65.00
U price $/kg US$/kgU 168.99 168.99 168.99
Solution cut-off grade g/t 45.7 37.2 31.9
Extraction % 90% 90% 90%
Dilution
100% 100% 100%
Block grade cut-off (kg of U)
L:S = 3 kg U/m3 0.305 0.248 0.213
L:S = 4 kg U/m3 0.406 0.331 0.284
L:S = 5 kg U/m3 0.508 0.413 0.355
Bulk Density kg/m3 1,700 1,700 1,700
L:S = 3 %U 0.018% 0.015% 0.013%
L:S = 4 %U 0.024% 0.019% 0.017%
L:S = 5 %U 0.030% 0.024% 0.021%
An incremental cut-off grade estimate was calculated and is shown in Table 15-3. The
incremental cut-off grade for the solution is estimated to be 9 mg/L to 13 mg/L U. CSA
recommends a review of the incremental costs for pumping to better refine the incremental
solution cut-off grade.
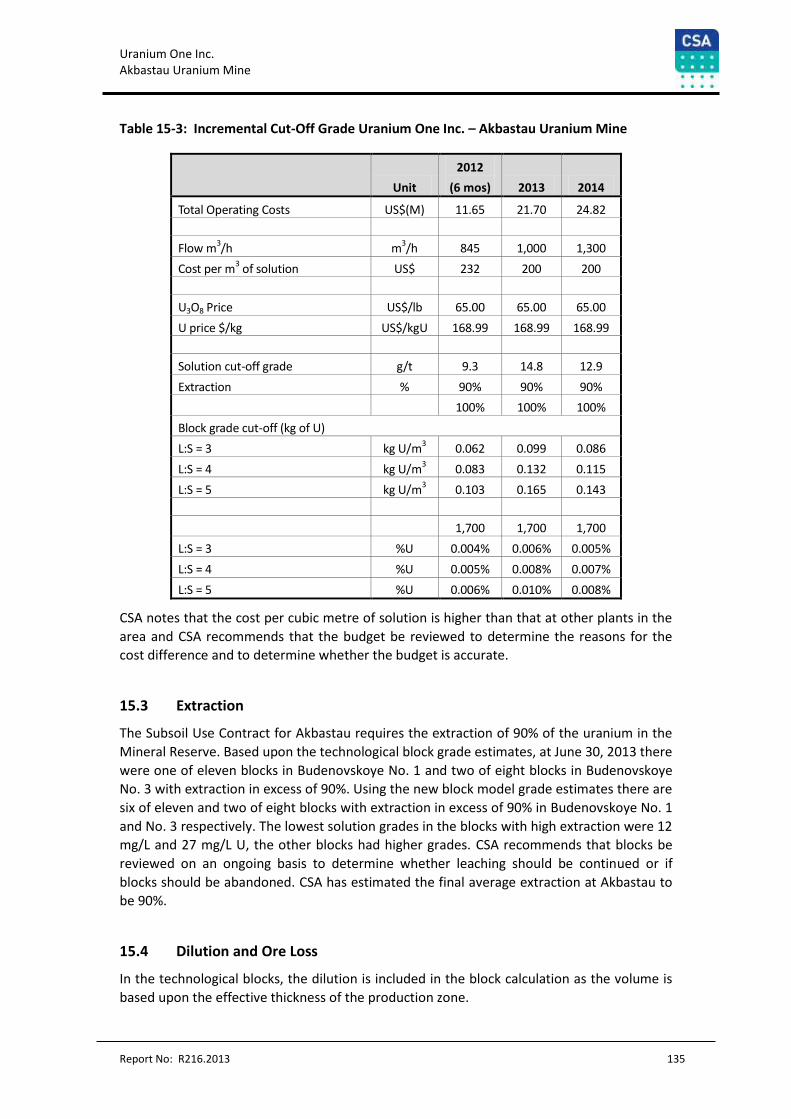
Uranium One Inc. Akbastau Uranium Mine
Report No: R216.2013 135
Table 15-3: Incremental Cut-Off Grade Uranium One Inc. – Akbastau Uranium Mine
Unit
2012
(6 mos) 2013 2014
Total Operating Costs US$(M) 11.65 21.70 24.82
Flow m3/h m
3/h 845 1,000 1,300
Cost per m3 of solution US$ 232 200 200
U3O8 Price US$/lb 65.00 65.00 65.00
U price $/kg US$/kgU 168.99 168.99 168.99
Solution cut-off grade g/t 9.3 14.8 12.9
Extraction % 90% 90% 90%
100% 100% 100%
Block grade cut-off (kg of U)
L:S = 3 kg U/m3 0.062 0.099 0.086
L:S = 4 kg U/m3 0.083 0.132 0.115
L:S = 5 kg U/m3 0.103 0.165 0.143
1,700 1,700 1,700
L:S = 3 %U 0.004% 0.006% 0.005%
L:S = 4 %U 0.005% 0.008% 0.007%
L:S = 5 %U 0.006% 0.010% 0.008%
CSA notes that the cost per cubic metre of solution is higher than that at other plants in the
area and CSA recommends that the budget be reviewed to determine the reasons for the
cost difference and to determine whether the budget is accurate.
15.3 Extraction
The Subsoil Use Contract for Akbastau requires the extraction of 90% of the uranium in the
Mineral Reserve. Based upon the technological block grade estimates, at June 30, 2013 there
were one of eleven blocks in Budenovskoye No. 1 and two of eight blocks in Budenovskoye
No. 3 with extraction in excess of 90%. Using the new block model grade estimates there are
six of eleven and two of eight blocks with extraction in excess of 90% in Budenovskoye No. 1
and No. 3 respectively. The lowest solution grades in the blocks with high extraction were 12
mg/L and 27 mg/L U, the other blocks had higher grades. CSA recommends that blocks be
reviewed on an ongoing basis to determine whether leaching should be continued or if
blocks should be abandoned. CSA has estimated the final average extraction at Akbastau to
be 90%.
15.4 Dilution and Ore Loss
In the technological blocks, the dilution is included in the block calculation as the volume is
based upon the effective thickness of the production zone.
Uranium One Inc. Akbastau Uranium Mine
Report No: R216.2013 136
For the conversion of Indicated Mineral Resources, dilution is added to the Mineral Resource
estimate. Considering the technological block grades as compared on average to the
resource grades, RPA previously assigned a dilution factor of 100% to the Budenovskoye No.
1 and Budenovskoye No. 3 site in the conversion of Indicated Mineral Resources to Probable
Mineral Reserves. The current technological block rock tonnage for Budenovskoye No. 1 is
1.76 times larger than the resource model rock tonnage, this equates to 76% dilution. For
Budenovskoye No. 3 the technological block rock tonnage is 1.95 times larger than the
resource model rock tonnage, this equates to 95% dilution. For this estimate CSA assigned a
dilution of 100% as a conservative value. CSA is of the opinion that this factor should be
monitored and revised based on experience in the future. In the ISR fields, the dilution
represents a cost in that additional material must be acidified and will contribute to acid
consumption and time to attain the desired L:S ratio for the extraction of the uranium. The
dilution is applied to the Mineral Resource tonnage at zero grade.
For the technological blocks, which are based on close spaced drilling, there is no loss
assigned to the ore tonnage. For Mineral Resources beyond the technological blocks CSA has
assumed a 10% loss of tonnage and contained uranium to account for unforeseen
difficulties, poor surface access and thin or impermeable zones that were not identified in
the resource drilling.
CSA recommends a detailed reconciliation between the Mineral Resource estimates and
Mineral Reserve estimates calculated from the technological (wellfield) drilling to assess the
conversion factors and to develop more accurate conversion factors. CSA is also of the
opinion that close control and oversight in the placement of screens is warranted to ensure
that screens are properly located and to reduce the amount of barren rock (dilution) which
must be leached.
15.5 Grade Estimation
The Mineral Reserve grades are taken from the Mineral Resource grades which are
estimated as described in Section 14 of this Report, but with the addition of the mine
dilution and as modified for extraction estimates.
15.6 Classification of Mineral Reserves
CSA considers that the Mineral Reserves under leach to be Proven Mineral Reserves. In
addition, the Measured Mineral Resources beyond the technological blocks have been
converted to Proven Mineral Reserves and the Indicated Mineral Resources have been
converted to Probable Mineral Reserves.
15.7 Estimation of Mineral Reserves
15.7.1 Budenovskoye No. 1
Mineral Reserves have been estimated as at June 30, 2013.
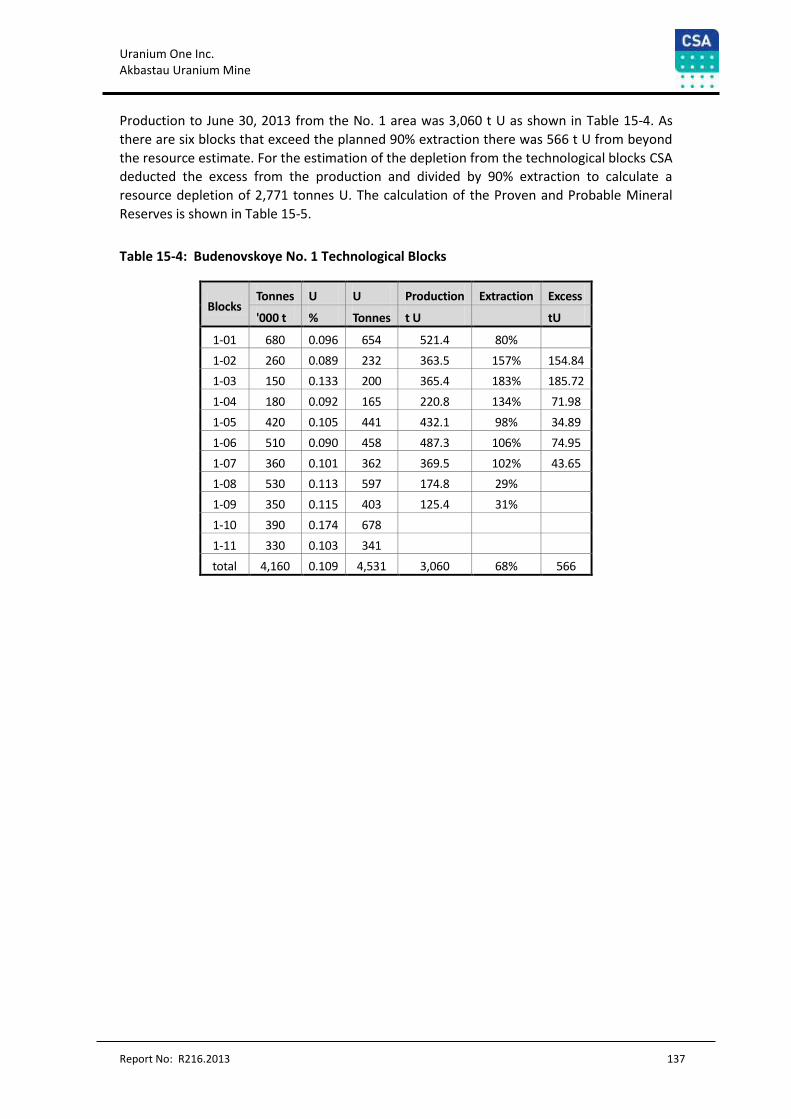
Uranium One Inc. Akbastau Uranium Mine
Report No: R216.2013 137
Production to June 30, 2013 from the No. 1 area was 3,060 t U as shown in Table 15-4. As
there are six blocks that exceed the planned 90% extraction there was 566 t U from beyond
the resource estimate. For the estimation of the depletion from the technological blocks CSA
deducted the excess from the production and divided by 90% extraction to calculate a
resource depletion of 2,771 tonnes U. The calculation of the Proven and Probable Mineral
Reserves is shown in Table 15-5.
Table 15-4: Budenovskoye No. 1 Technological Blocks
Blocks Tonnes U U Production Extraction Excess
'000 t % Tonnes t U
tU
1-01 680 0.096 654 521.4 80%
1-02 260 0.089 232 363.5 157% 154.84
1-03 150 0.133 200 365.4 183% 185.72
1-04 180 0.092 165 220.8 134% 71.98
1-05 420 0.105 441 432.1 98% 34.89
1-06 510 0.090 458 487.3 106% 74.95
1-07 360 0.101 362 369.5 102% 43.65
1-08 530 0.113 597 174.8 29%
1-09 350 0.115 403 125.4 31%
1-10 390 0.174 678
1-11 330 0.103 341
total 4,160 0.109 4,531 3,060 68% 566
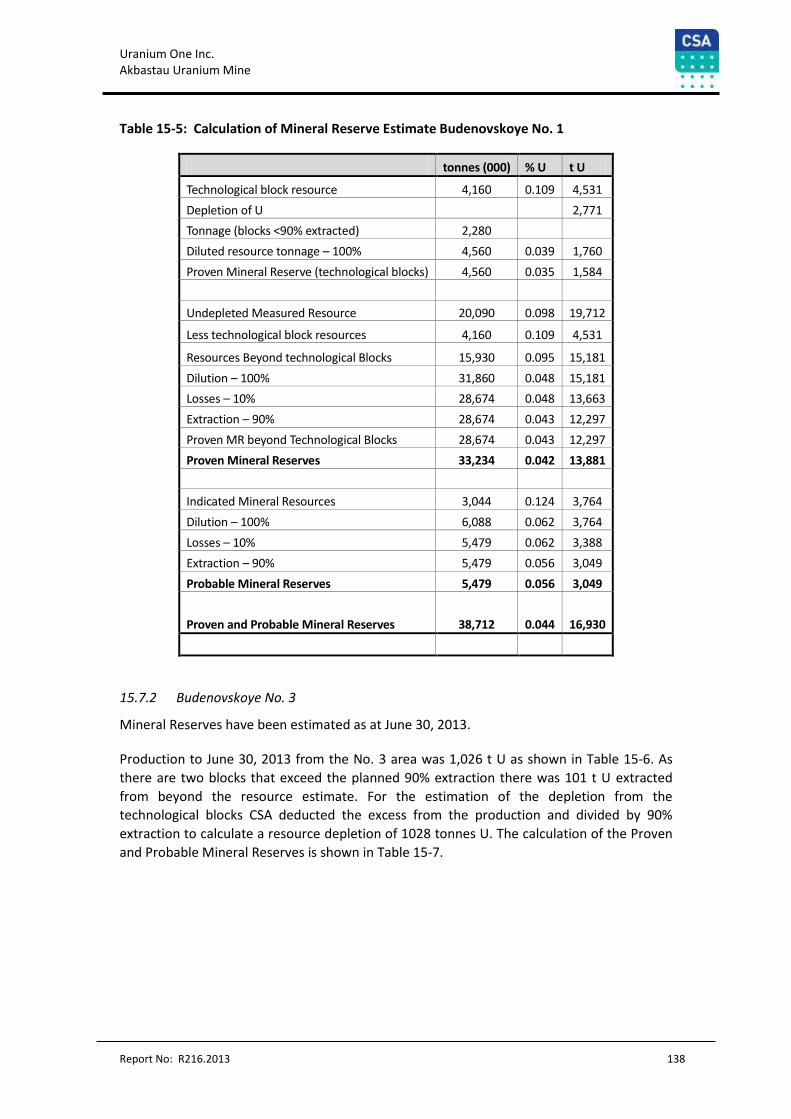
Uranium One Inc. Akbastau Uranium Mine
Report No: R216.2013 138
Table 15-5: Calculation of Mineral Reserve Estimate Budenovskoye No. 1
tonnes (000) % U t U
Technological block resource 4,160 0.109 4,531
Depletion of U
2,771
Tonnage (blocks <90% extracted) 2,280
Diluted resource tonnage – 100% 4,560 0.039 1,760
Proven Mineral Reserve (technological blocks) 4,560 0.035 1,584
Undepleted Measured Resource 20,090 0.098 19,712
Less technological block resources 4,160 0.109 4,531
Resources Beyond technological Blocks 15,930 0.095 15,181
Dilution – 100% 31,860 0.048 15,181
Losses – 10% 28,674 0.048 13,663
Extraction – 90% 28,674 0.043 12,297
Proven MR beyond Technological Blocks 28,674 0.043 12,297
Proven Mineral Reserves 33,234 0.042 13,881
Indicated Mineral Resources 3,044 0.124 3,764
Dilution – 100% 6,088 0.062 3,764
Losses – 10% 5,479 0.062 3,388
Extraction – 90% 5,479 0.056 3,049
Probable Mineral Reserves 5,479 0.056 3,049
Proven and Probable Mineral Reserves
38,712 0.044 16,930
15.7.2 Budenovskoye No. 3
Mineral Reserves have been estimated as at June 30, 2013.
Production to June 30, 2013 from the No. 3 area was 1,026 t U as shown in Table 15-6. As
there are two blocks that exceed the planned 90% extraction there was 101 t U extracted
from beyond the resource estimate. For the estimation of the depletion from the
technological blocks CSA deducted the excess from the production and divided by 90%
extraction to calculate a resource depletion of 1028 tonnes U. The calculation of the Proven
and Probable Mineral Reserves is shown in Table 15-7.
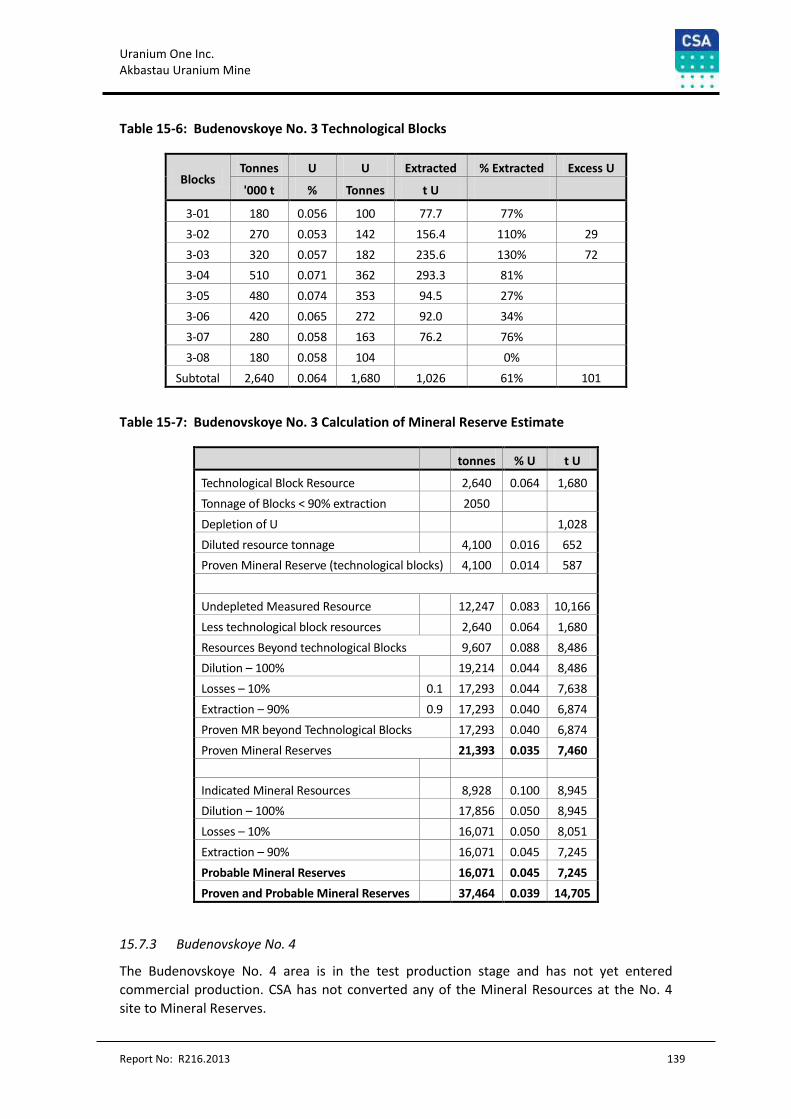
Uranium One Inc. Akbastau Uranium Mine
Report No: R216.2013 139
Table 15-6: Budenovskoye No. 3 Technological Blocks
Blocks Tonnes U U Extracted % Extracted Excess U
'000 t % Tonnes t U
3-01 180 0.056 100 77.7 77%
3-02 270 0.053 142 156.4 110% 29
3-03 320 0.057 182 235.6 130% 72
3-04 510 0.071 362 293.3 81%
3-05 480 0.074 353 94.5 27%
3-06 420 0.065 272 92.0 34%
3-07 280 0.058 163 76.2 76%
3-08 180 0.058 104
0%
Subtotal 2,640 0.064 1,680 1,026 61% 101
Table 15-7: Budenovskoye No. 3 Calculation of Mineral Reserve Estimate
tonnes % U t U
Technological Block Resource
2,640 0.064 1,680
Tonnage of Blocks < 90% extraction
2050
Depletion of U
1,028
Diluted resource tonnage
4,100 0.016 652
Proven Mineral Reserve (technological blocks) 4,100 0.014 587
Undepleted Measured Resource
12,247 0.083 10,166
Less technological block resources
2,640 0.064 1,680
Resources Beyond technological Blocks 9,607 0.088 8,486
Dilution – 100%
19,214 0.044 8,486
Losses – 10% 0.1 17,293 0.044 7,638
Extraction – 90% 0.9 17,293 0.040 6,874
Proven MR beyond Technological Blocks 17,293 0.040 6,874
Proven Mineral Reserves 21,393 0.035 7,460
Indicated Mineral Resources
8,928 0.100 8,945
Dilution – 100%
17,856 0.050 8,945
Losses – 10% 16,071 0.050 8,051
Extraction – 90% 16,071 0.045 7,245
Probable Mineral Reserves 16,071 0.045 7,245
Proven and Probable Mineral Reserves
37,464 0.039 14,705
15.7.3 Budenovskoye No. 4
The Budenovskoye No. 4 area is in the test production stage and has not yet entered
commercial production. CSA has not converted any of the Mineral Resources at the No. 4
site to Mineral Reserves.
Uranium One Inc. Akbastau Uranium Mine
Report No: R216.2013 140
15.8 Kazakh Mineral Reserve Estimation
Mineral reserves in Kazakhstan are approved by the State Committee on Mineral Reserves
and are completed by consultants for the licence holders. The consultants typically handle all
of the sampling, drilling, testing, and estimation and the final result is then shared with the
licence holder and subsequently submitted to the State Committee for approval. The
process is lengthy, the consultants do not release data to the licence holder on an ongoing
basis, and the licence holder is not “involved” in the estimation procedure. The procedures
for the evaluation of mineral resources and mineral reserves are dictated by the State
guidelines and the consultants follow these guidelines.
CSA considers the process to be unwieldy and inconsistent with the North American public
company requirements for continuous disclosure of material information. In some regards,
the methods may, through a focus on resource extraction, be inconsistent with the Mineral
Resource and Mineral Reserve estimation standards of CIM in which the proof of economic
viability is paramount to resource extraction. Furthermore, the lack of involvement of site
personnel may mean that ongoing experience at a site is not available or being used in the
estimation of the Mineral Reserves. CSA notes that Uranium One and Kazatomprom
provided all of the exploration and technological estimation data for this estimate permitting
the opportunity to complete the Mineral Resource and Mineral Reserve estimates
independently of the joint venture for reporting as a Canadian issuer.
15.9 CSA Opinion
CSA is of the opinion that the Mineral Reserve estimate as stated is consistent with the CIM
guidelines for the estimation of Mineral Reserves.
CSA considers the estimates to be attainable but notes that there is some risk if the
extraction target of 90% is not met.
Uranium One Inc. Akbastau Uranium Mine
Report No: R216.2013 141
16 Mining Methods
The Akbastau Mine is an ISR uranium mining operation. From the commencement of pilot
production at the No. 1 site on January 30, 2009, to June 30, 2013, the operation has
extracted a total of 3,060 tonnes of uranium from Budenovskoye No. 1, 1,025 t U from the
No. 3 site and 139 t U from the No. 4 site.
The Akbastau Mineral Reserves are located in permeable sandstones some 700 m below
surface. In light of the depth of the deposit, the sand host rock, and the low grades, CSA
concur that ISR mining is the appropriate method for the deposit. The general layout of the
Mine is shown in Figure 16-1, Figure 16-2 and Figure 16-3.
16.1 Mining Operations
Operations at the Mine include the wellfield operations and associated facilities. Processing
is done at the adjacent Karatau process plant (Figure 16-1). The property comprises three
deposits (No. 1, No. 3, and No. 4), with deposits No. 1 and No. 3 in commercial production
and No.4 in the test production phase.
The uranium ISR operation uses a sulphuric acid leach. Sulphuric acid leaching solution is
pumped into the mineralized zone through a network of injection wells (boreholes) and the
resulting uranium bearing solution is extracted by production wells. The wells are typically
200 mm in diameter in the upper portions reducing to 100 mm lower in the hole. At the
Mine, the wells are approximately 700 m deep and are generally placed in a hexagonal
pattern with a 40 m radius or in line patterns with wells 25 m to 40 m apart on lines that are
25 m to 50 m apart. Typical wellfield leach patterns are shown in Figure 16-4 and typical well
configurations are shown in Figure 16-5.
The choice of pattern depends upon the shape of the block as defined in the technological
block development. CSA observes that the preference appears to be shifting from hexagonal
patterns to line patterns.
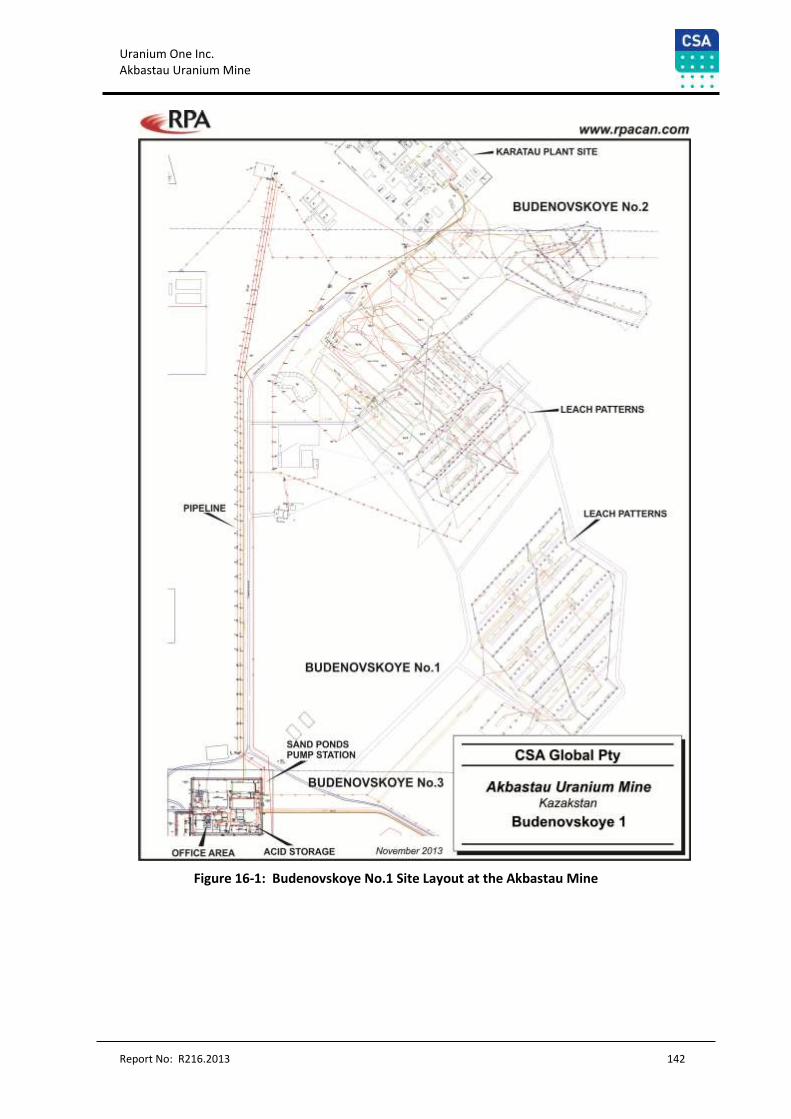
Uranium One Inc. Akbastau Uranium Mine
Report No: R216.2013 142
Figure 16-1: Budenovskoye No.1 Site Layout at the Akbastau Mine
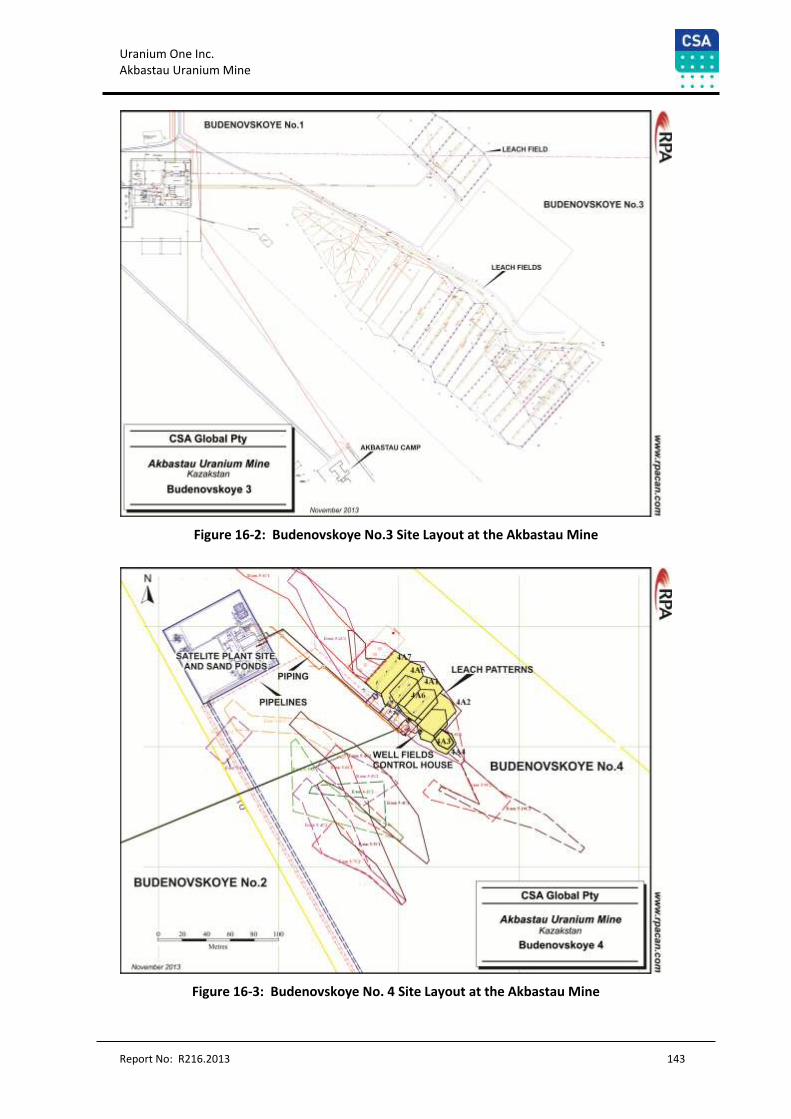
Uranium One Inc. Akbastau Uranium Mine
Report No: R216.2013 143
Figure 16-2: Budenovskoye No.3 Site Layout at the Akbastau Mine
Figure 16-3: Budenovskoye No. 4 Site Layout at the Akbastau Mine
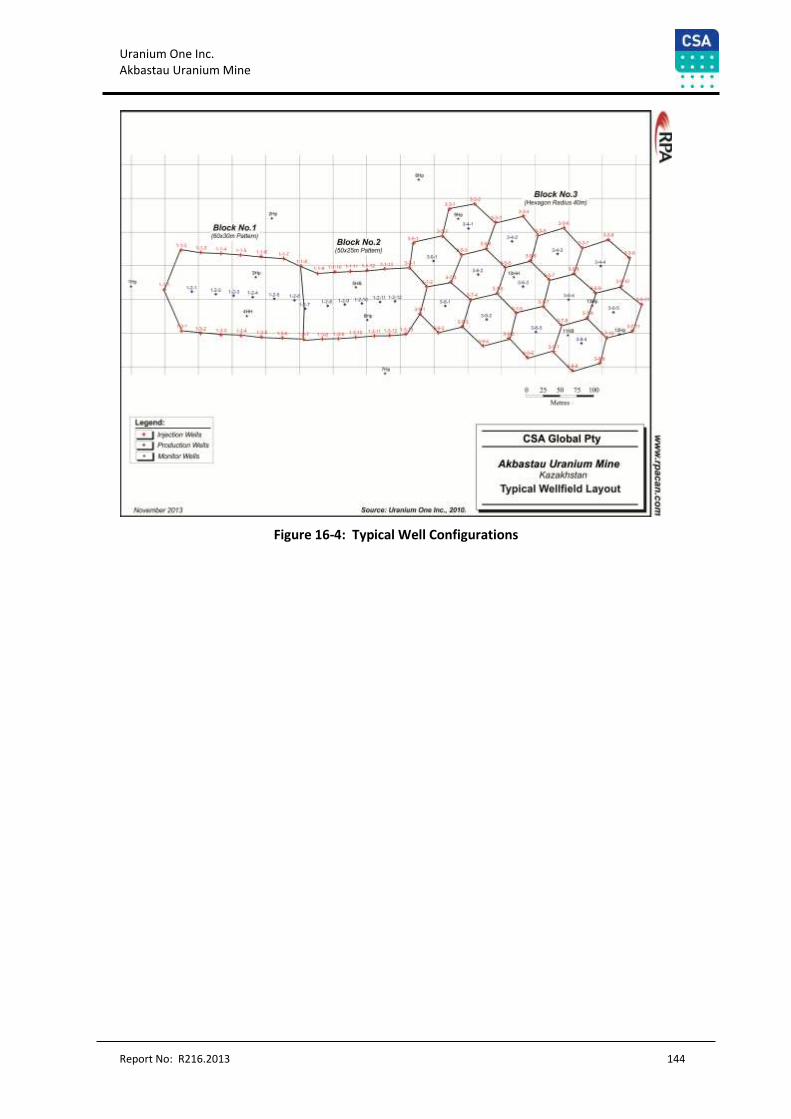
Uranium One Inc. Akbastau Uranium Mine
Report No: R216.2013 144
Figure 16-4: Typical Well Configurations
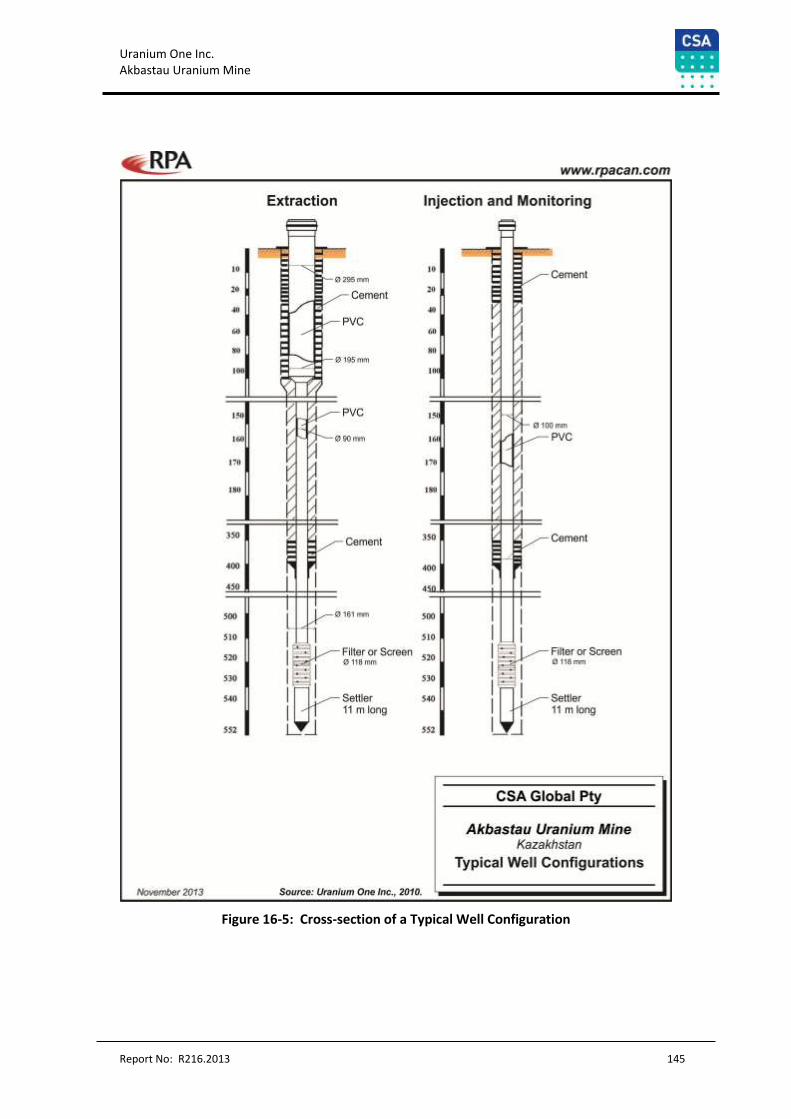
Uranium One Inc. Akbastau Uranium Mine
Report No: R216.2013 145
Figure 16-5: Cross-section of a Typical Well Configuration
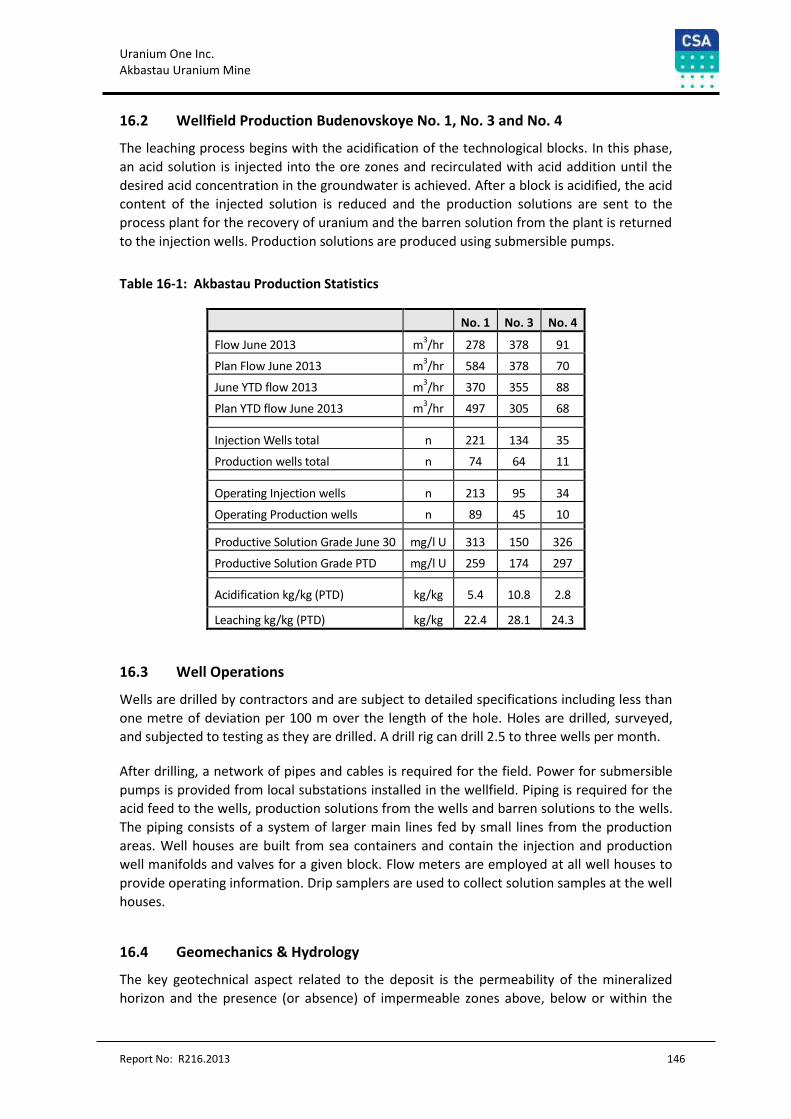
Uranium One Inc. Akbastau Uranium Mine
Report No: R216.2013 146
16.2 Wellfield Production Budenovskoye No. 1, No. 3 and No. 4
The leaching process begins with the acidification of the technological blocks. In this phase,
an acid solution is injected into the ore zones and recirculated with acid addition until the
desired acid concentration in the groundwater is achieved. After a block is acidified, the acid
content of the injected solution is reduced and the production solutions are sent to the
process plant for the recovery of uranium and the barren solution from the plant is returned
to the injection wells. Production solutions are produced using submersible pumps.
Table 16-1: Akbastau Production Statistics
No. 1 No. 3 No. 4
Flow June 2013 m3/hr 278 378 91
Plan Flow June 2013 m3/hr 584 378 70
June YTD flow 2013 m3/hr 370 355 88
Plan YTD flow June 2013 m3/hr 497 305 68
Injection Wells total n 221 134 35
Production wells total n 74 64 11
Operating Injection wells n 213 95 34
Operating Production wells n 89 45 10
Productive Solution Grade June 30 mg/l U 313 150 326
Productive Solution Grade PTD mg/l U 259 174 297
Acidification kg/kg (PTD) kg/kg 5.4 10.8 2.8
Leaching kg/kg (PTD) kg/kg 22.4 28.1 24.3
16.3 Well Operations
Wells are drilled by contractors and are subject to detailed specifications including less than
one metre of deviation per 100 m over the length of the hole. Holes are drilled, surveyed,
and subjected to testing as they are drilled. A drill rig can drill 2.5 to three wells per month.
After drilling, a network of pipes and cables is required for the field. Power for submersible
pumps is provided from local substations installed in the wellfield. Piping is required for the
acid feed to the wells, production solutions from the wells and barren solutions to the wells.
The piping consists of a system of larger main lines fed by small lines from the production
areas. Well houses are built from sea containers and contain the injection and production
well manifolds and valves for a given block. Flow meters are employed at all well houses to
provide operating information. Drip samplers are used to collect solution samples at the well
houses.
16.4 Geomechanics & Hydrology
The key geotechnical aspect related to the deposit is the permeability of the mineralized
horizon and the presence (or absence) of impermeable zones above, below or within the
Uranium One Inc. Akbastau Uranium Mine
Report No: R216.2013 147
mineralized zones. The permeability is determined in the course of drilling and the ability of
the mineralized zone to permit the transmission of water is demonstrated by the ongoing
operation.
16.4.1 Local Hydrogeology
The north-south trending mineralized zone of the Mine is associated with the circulation of
oxygen-rich regional groundwater (flowing into the region from the southeast). The
northwest flanks of the deposit are associated with the activity of local groundwater poor in
oxygen. The groundwater in the north-south zone contains a broad spectrum of metals, with
elevated concentrations of Mo, Zn, Re, etc.
Groundwater in the area, in grey-coloured unaltered epigenetic formations, is characterized
by the presence of reducing geochemical barriers, responsible for accumulation of rare and
trace elements passing through the roll fronts.
There are carbonated waters identified within the Jabakol area of the deposit. They were
formed as a result of carbon dioxide migration from the pre-Mesozoic horizons via faults
into the host formations.
Saline waters and fluorine-containing carbonated waters present in the north-south zone of
the mineralization may have unfavourable environmental impact, as Se and F concentrations
exceed the allowable limits by two to 2.5 times (Lara and Abramov, 1990).
The Jalpak, Inkuduk, and Mynkuduk horizons form a single aquifer with no constant
impermeable layer separating them, thus representing a single water-bearing complex 200
m to 245 m thick with filtration coefficients (permeability) of 2.9 m/d to 7.2 m/d. The
piezometric surface is orientated south-southeast to north-northwest (Valliant et al., 2007).
The aquifer is recharged in the Karatau Crest Mountains. The subsurface water in the south
has 0.5 g/L to 1.5 g/L dissolved solids, increasing to 1.8 g/L at Budenovskoye and 3.5 g/L to
3.6 g/L in the north (at the Inkai deposit).
The groundwater features an absence of dissolved oxygen, low negative values for
reduction/oxidation potential, the presence of hydrogen sulphide, and near-neutral
(trending to alkaline) conditions. Dissolved mineral concentrations in the aquifers are
typically:
2.5 x 10⁻⁴ g/L uranium
8.2 x 10⁻¹⁰ g/L radium
x 10-5 g/L molybdenum
1.4 x 10⁻⁴ g/L zinc
1.8 – 2.0 x10⁻⁷ g/L rhenium.
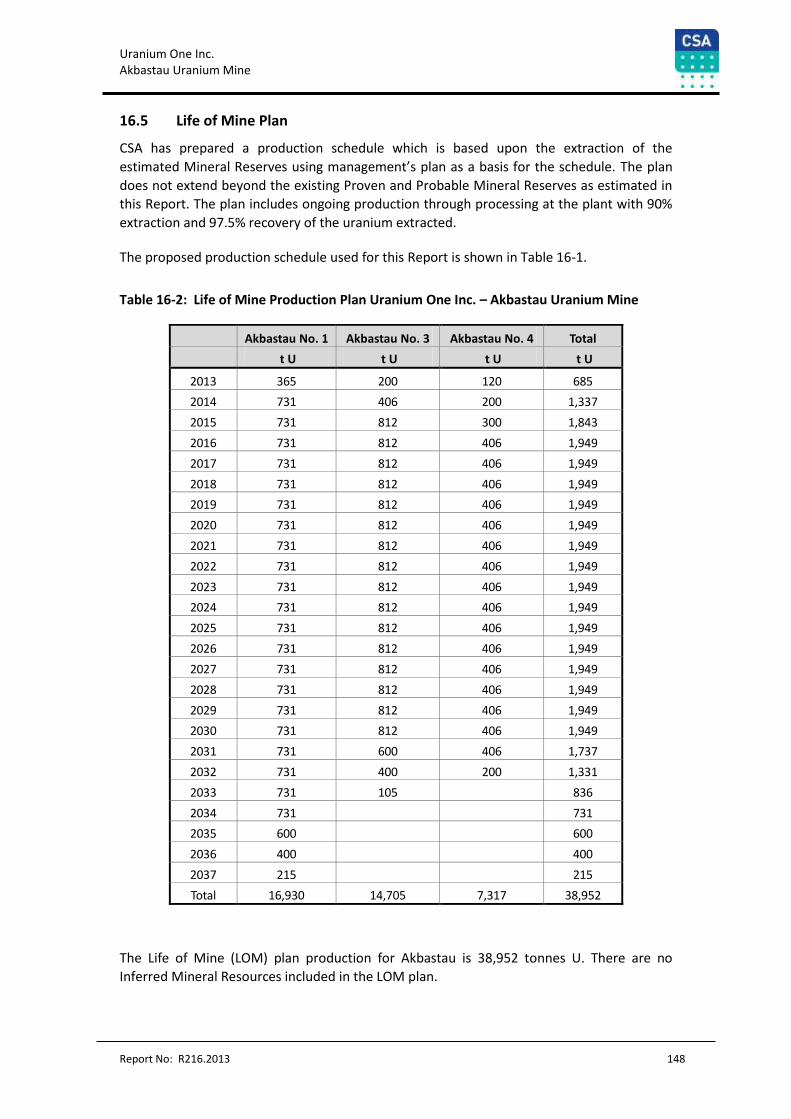
Uranium One Inc. Akbastau Uranium Mine
Report No: R216.2013 148
16.5 Life of Mine Plan
CSA has prepared a production schedule which is based upon the extraction of the
estimated Mineral Reserves using management’s plan as a basis for the schedule. The plan
does not extend beyond the existing Proven and Probable Mineral Reserves as estimated in
this Report. The plan includes ongoing production through processing at the plant with 90%
extraction and 97.5% recovery of the uranium extracted.
The proposed production schedule used for this Report is shown in Table 16-1.
Table 16-2: Life of Mine Production Plan Uranium One Inc. – Akbastau Uranium Mine
Akbastau No. 1 Akbastau No. 3 Akbastau No. 4 Total
t U t U t U t U
2013 365 200 120 685
2014 731 406 200 1,337
2015 731 812 300 1,843
2016 731 812 406 1,949
2017 731 812 406 1,949
2018 731 812 406 1,949
2019 731 812 406 1,949
2020 731 812 406 1,949
2021 731 812 406 1,949
2022 731 812 406 1,949
2023 731 812 406 1,949
2024 731 812 406 1,949
2025 731 812 406 1,949
2026 731 812 406 1,949
2027 731 812 406 1,949
2028 731 812 406 1,949
2029 731 812 406 1,949
2030 731 812 406 1,949
2031 731 600 406 1,737
2032 731 400 200 1,331
2033 731 105 836
2034 731 731
2035 600 600
2036 400 400
2037 215 215
Total 16,930 14,705 7,317 38,952
The Life of Mine (LOM) plan production for Akbastau is 38,952 tonnes U. There are no
Inferred Mineral Resources included in the LOM plan.
Uranium One Inc. Akbastau Uranium Mine
Report No: R216.2013 149
There are Inferred Mineral Resources at the site and which may be converted to Measured
and Indicated Mineral Resources and then to Mineral Reserves to extend the life of the
project. Management’s plan for the operation includes the conversion of these resources.
However, there can be no assurance that any such Inferred Mineral Resources will be
converted to Measured or Indicated Mineral Resources.
There are 215 t U within the Budenovskoye No. 1 Mineral Reserves which are included but
will require an amendment to the Subsoil Use Contract as the production extends beyond
the current term of the contract.
16.6 Mine Equipment
There is little major equipment associated with the operation. All of the well drilling and
installation is done by contractors. The operation has the rework equipment (air
compressors and piping mounted on trailers), light vehicles, and small forklifts for handling
concentrate bins, supplies, and reagents.
In the wellfields, there are pump and flow control units generally built from sea containers
and there are pumps in each production well and the associated electrical power
distribution and motor controls.
Uranium One Inc. Akbastau Uranium Mine
Report No: R216.2013 150
17 Recovery Methods
Processing of solutions from the Mine takes place at the Karatau processing plant. The
process plant at Karatau is in place and operating and has been operating for several years.
The plant has been expanded over time to increase the throughput capacity and to extend
the processing through the addition of the calcining and packaging circuits.
The process plant is a standard design used by Kazatomprom in Kazakhstan. Productive
solutions are pumped from the wells to a settling/storage pond from which the solution is
pumped to the process plant for ion exchange treatment, denitrification, precipitation, and
filtering of yellowcake.
17.1 Process Description
Uranium rich solutions (pregnant solutions) are pumped from the wellfields and delivered
via a series of pipelines into the pregnant solution pond. This lined pond allows
accumulation and drawdown of the solutions and provides a buffer between wellfield
operations and process plant operations. Pregnant solution is recovered from the pregnant
solution pond via pumps located adjacent to the processing plant facilities.
Within the processing facility, the pregnant solutions are passed through a series of 50 m3
ion exchange columns loaded with a uranium-selective resin. Within these column reactors,
the uranium is adsorbed from the solutions onto the resin. Resin loading of 20 kg U/m3 is
targeted in this process. The solution exiting the column reactors has been stripped of its
uranium content and is returned to the barren solution side of the process plant for pH
adjustment and eventual re-injection into the wellfield.
The uranium bearing resin is transferred from the column reactors to 100 m3 desorption
columns where uranium is stripped from the resin, with ammonium nitrate solution
returning the uranium back into solution. The stripped resin is recycled back to the column
reactors for reloading. The strip solution contains approximately 55 g U/L to 70 g U/L and is
transferred to a precipitation vessel where hydrogen peroxide is used to precipitate the
uranium out of solution.
The precipitate is dewatered and calcined before being packaged in drums for shipment to
off-site converters and refineries for upgrading to international market quality yellowcake.
The Karatau process plant flow sheet is shown in Figure 17-1.
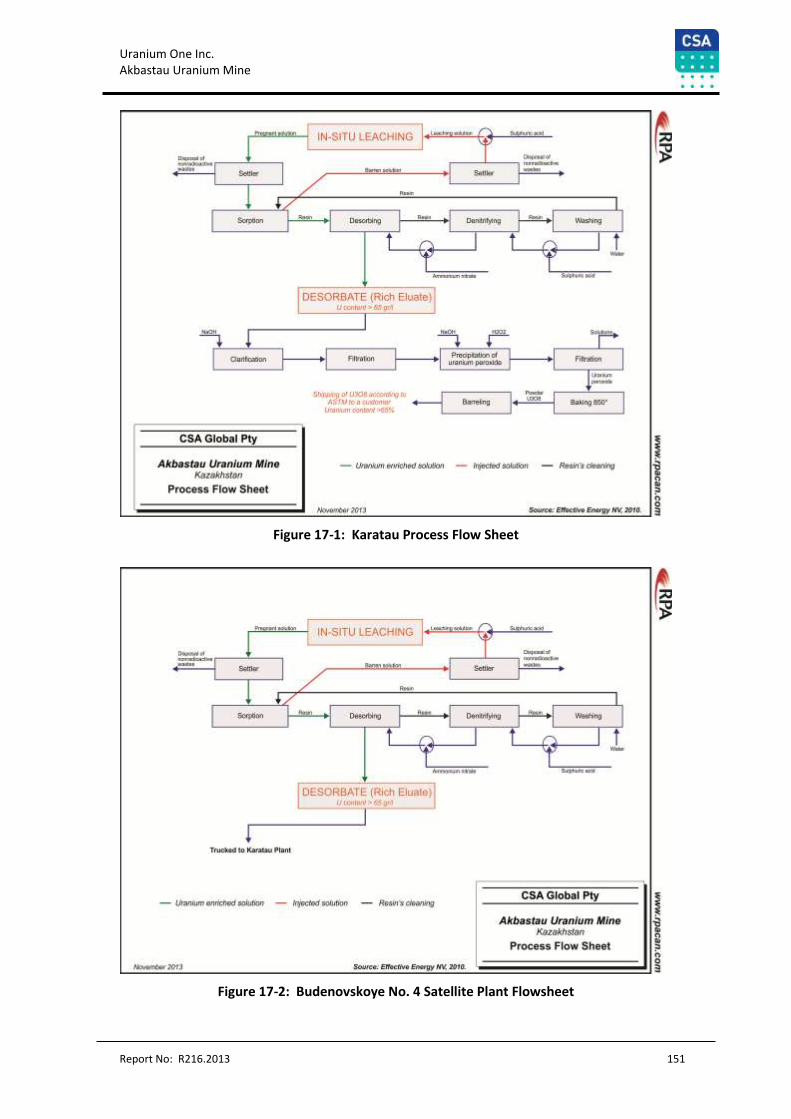
Uranium One Inc. Akbastau Uranium Mine
Report No: R216.2013 151
Figure 17-1: Karatau Process Flow Sheet
Figure 17-2: Budenovskoye No. 4 Satellite Plant Flowsheet
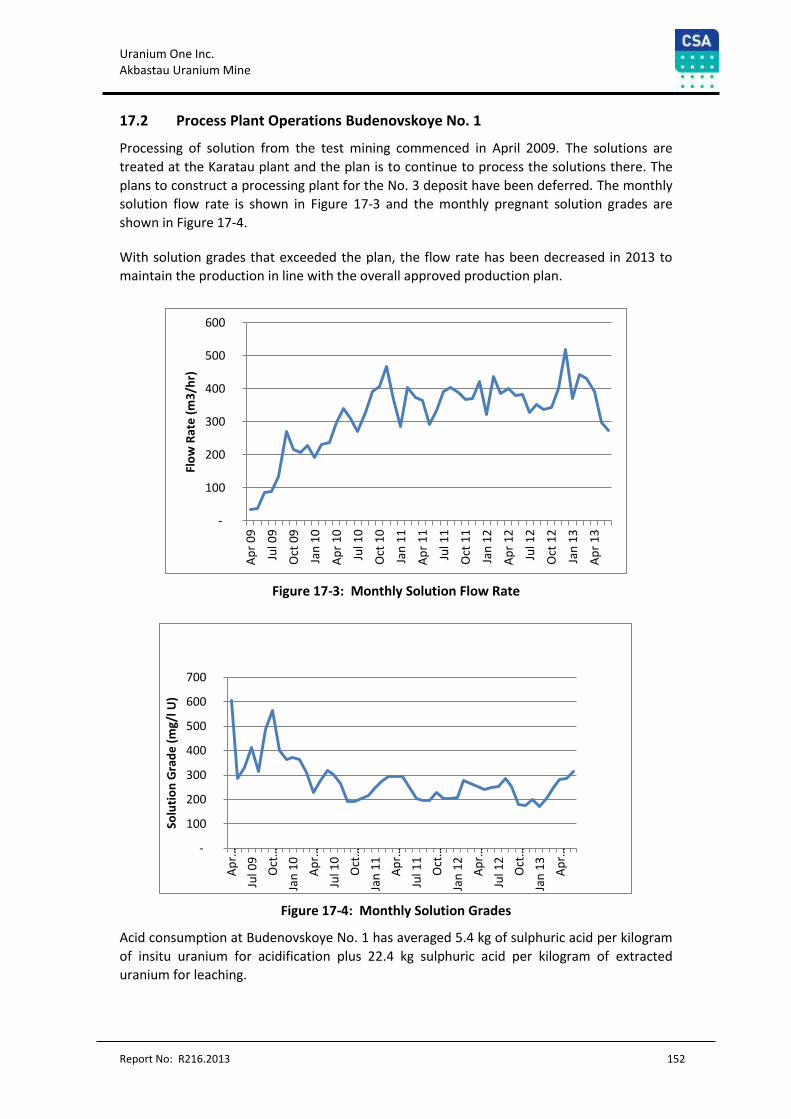
Uranium One Inc. Akbastau Uranium Mine
Report No: R216.2013 152
17.2 Process Plant Operations Budenovskoye No. 1
Processing of solution from the test mining commenced in April 2009. The solutions are
treated at the Karatau plant and the plan is to continue to process the solutions there. The
plans to construct a processing plant for the No. 3 deposit have been deferred. The monthly
solution flow rate is shown in Figure 17-3 and the monthly pregnant solution grades are
shown in Figure 17-4.
With solution grades that exceeded the plan, the flow rate has been decreased in 2013 to
maintain the production in line with the overall approved production plan.
Figure 17-3: Monthly Solution Flow Rate
Figure 17-4: Monthly Solution Grades
Acid consumption at Budenovskoye No. 1 has averaged 5.4 kg of sulphuric acid per kilogram
of insitu uranium for acidification plus 22.4 kg sulphuric acid per kilogram of extracted
uranium for leaching.
-
100
200
300
400
500
600
Ap
r 0
9
Jul 0
9
Oct
09
Jan
10
Ap
r 1
0
Jul 1
0
Oct
10
Jan
11
Ap
r 1
1
Jul 1
1
Oct
11
Jan
12
Ap
r 1
2
Jul 1
2
Oct
12
Jan
13
Ap
r 1
3
Flo
w R
ate
(m
3/h
r)
-
100
200
300
400
500
600
700
Ap
r…
Jul 0
9
Oct
…
Jan
10
Ap
r…
Jul 1
0
Oct
…
Jan
11
Ap
r…
Jul 1
1
Oct
…
Jan
12
Ap
r…
Jul 1
2
Oct
…
Jan
13
Ap
r…
Solu
tio
n G
rad
e (
mg/
l U)
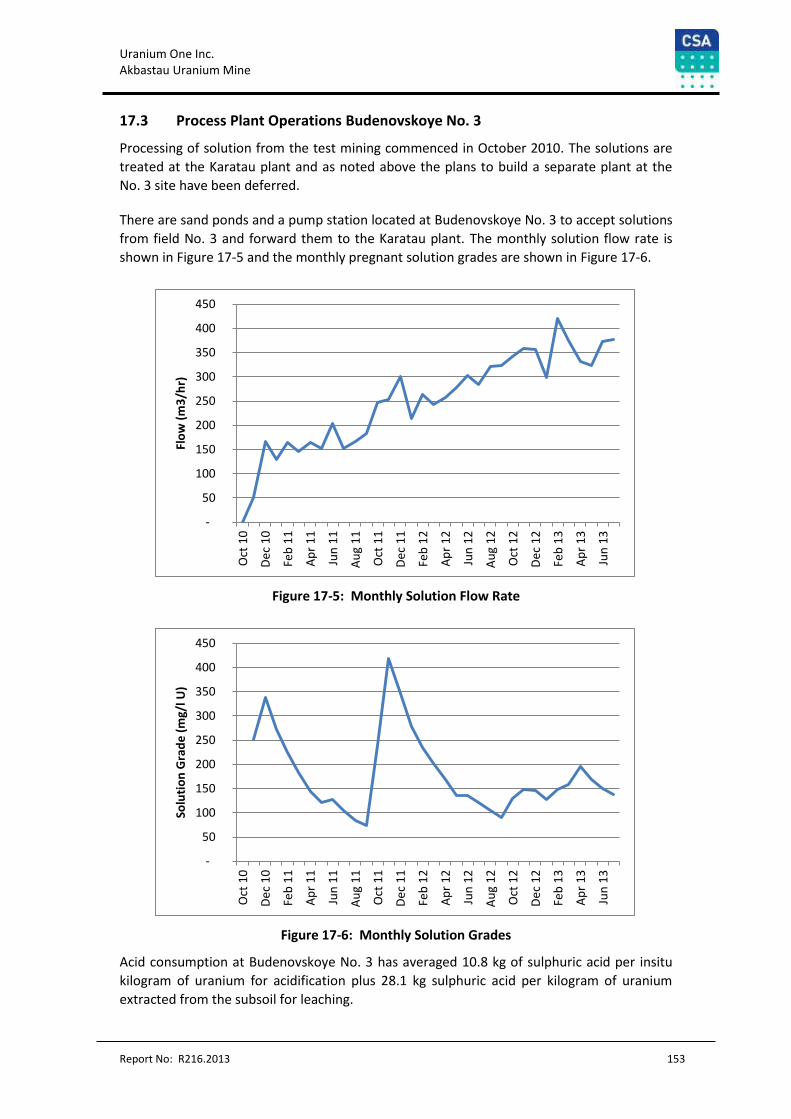
Uranium One Inc. Akbastau Uranium Mine
Report No: R216.2013 153
17.3 Process Plant Operations Budenovskoye No. 3
Processing of solution from the test mining commenced in October 2010. The solutions are
treated at the Karatau plant and as noted above the plans to build a separate plant at the
No. 3 site have been deferred.
There are sand ponds and a pump station located at Budenovskoye No. 3 to accept solutions
from field No. 3 and forward them to the Karatau plant. The monthly solution flow rate is
shown in Figure 17-5 and the monthly pregnant solution grades are shown in Figure 17-6.
Figure 17-5: Monthly Solution Flow Rate
Figure 17-6: Monthly Solution Grades
Acid consumption at Budenovskoye No. 3 has averaged 10.8 kg of sulphuric acid per insitu
kilogram of uranium for acidification plus 28.1 kg sulphuric acid per kilogram of uranium
extracted from the subsoil for leaching.
-
50
100
150
200
250
300
350
400
450
Oct
10
De
c 1
0
Feb
11
Ap
r 1
1
Jun
11
Au
g 1
1
Oct
11
De
c 1
1
Feb
12
Ap
r 1
2
Jun
12
Au
g 1
2
Oct
12
De
c 1
2
Feb
13
Ap
r 1
3
Jun
13
Flo
w (
m3
/hr)
-
50
100
150
200
250
300
350
400
450
Oct
10
De
c 1
0
Feb
11
Ap
r 1
1
Jun
11
Au
g 1
1
Oct
11
De
c 1
1
Feb
12
Ap
r 1
2
Jun
12
Au
g 1
2
Oct
12
De
c 1
2
Feb
13
Ap
r 1
3
Jun
13
Solu
tio
n G
rad
e (
mg/
l U)
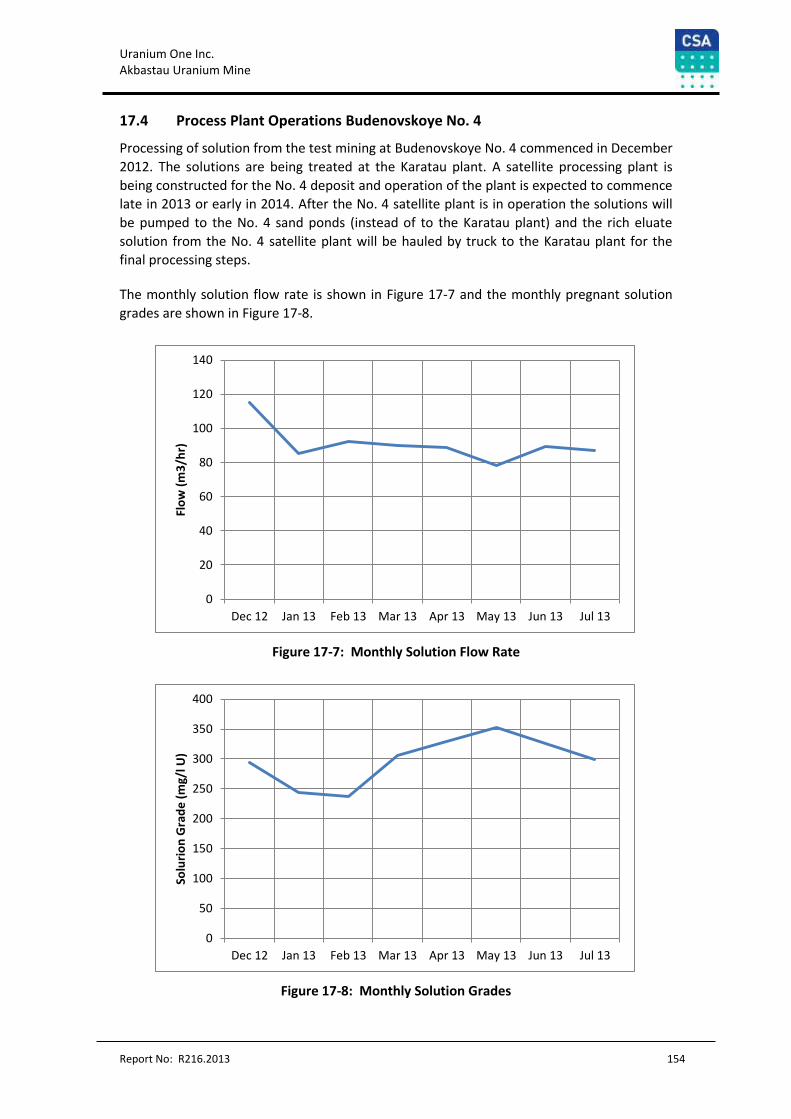
Uranium One Inc. Akbastau Uranium Mine
Report No: R216.2013 154
17.4 Process Plant Operations Budenovskoye No. 4
Processing of solution from the test mining at Budenovskoye No. 4 commenced in December
2012. The solutions are being treated at the Karatau plant. A satellite processing plant is
being constructed for the No. 4 deposit and operation of the plant is expected to commence
late in 2013 or early in 2014. After the No. 4 satellite plant is in operation the solutions will
be pumped to the No. 4 sand ponds (instead of to the Karatau plant) and the rich eluate
solution from the No. 4 satellite plant will be hauled by truck to the Karatau plant for the
final processing steps.
The monthly solution flow rate is shown in Figure 17-7 and the monthly pregnant solution
grades are shown in Figure 17-8.
Figure 17-7: Monthly Solution Flow Rate
Figure 17-8: Monthly Solution Grades
0
20
40
60
80
100
120
140
Dec 12 Jan 13 Feb 13 Mar 13 Apr 13 May 13 Jun 13 Jul 13
Flo
w (
m3
/hr)
0
50
100
150
200
250
300
350
400
Dec 12 Jan 13 Feb 13 Mar 13 Apr 13 May 13 Jun 13 Jul 13
Solu
rio
n G
rad
e (
mg/
l U)
Uranium One Inc. Akbastau Uranium Mine
Report No: R216.2013 155
Acid consumption at Budenovskoye No. 3 has averaged 2.8 kg of sulphuric acid per kilogram
of insitu uranium for acidification plus 24.3 kg sulphuric acid per kilogram of uranium
extracted from the subsoil for leaching.
17.5 Plant Operations
CSA notes that there are a comprehensive set of data reports related to the wellfield
operations, process solution chemistry, and process plant operation which are collected and
reported on a monthly basis. CSA is of the opinion that additional analysis of such data may
indicate the potential causes for better or worse than expected performance and it may
provide better tracking of the wellfield performance.
CSA recommends additional analysis of the physical and chemical data related to the
wellfields, process solutions, and plant operations be done on an ongoing basis to assist in
the evaluation of the operations and to possibly determine the cause of better or worse
than planned operating results.
Uranium One Inc. Akbastau Uranium Mine
Report No: R216.2013 156
18 Project Infrastructure
The Mine has a number of support facilities including:
Connection to the national power grid;
Backup diesel generators for the camp, solution pumping to Budenovskoye No. 3,
solution pumping for Budenovskoye No. 1 and for the satellite plant at No. 4;
Solution pipelines for the recovery of pregnant solution and the delivery of barren
solution;
Acid storage tanks and acid distribution systems;
Supplies storage area;
Offices at Budenovskoye No. 3 and No. 4;
Fenced plant area with security at the gate;
Staff accommodation and dining facilities;
Settling ponds and pump station for Budenovskoye No. 3; and
Pipe connections to the Karatau plant for Budenovskoye No. 1, No. 3 and No. 4.
18.1 Staff Accommodation
A new camp building has been built near the No. 3 field. The facility includes
accommodation, interior recreation areas and dining facilities. The camp is somewhat
remote from the remaining facilities at the site.
18.2 Power
Electrical power is supplied from the national power grid and emergency back-up is only able
to provide power for critical plant operations in the event of a failure of the grid power
supply. The power supply does suffer from numerous short term outages.
18.3 Transportation and Logistics
The site is accessed by a combination of gravel roads and highways. Upgrading of the access
road to Shieli is underway and the new road is paved for a considerable portion of the
distance and some corners and grades have been eliminated. The plant yards are paved as is
the main access road in the immediate vicinity of the Mine. The nearest rail line is at Suzak,
approximately 120 km from the Mine.
Uranium One Inc. Akbastau Uranium Mine
Report No: R216.2013 157
19 Market Studies and Contracts
19.1 Markets
19.1.1 Uranium One Contracts
Generally, Uranium One sells its uranium production to major nuclear utilities in North
America, Europe, and Asia under long term supply agreements and, in limited circumstances,
to third parties such as trading companies, in small quantities. Uranium One has entered into
market-related sales contracts with price mechanisms that reference the market price in
effect at or near the time of delivery. In addition, Uranium One has negotiated floor price
protection in many of its sales contracts.
Customers take delivery of U3O8 at conversion facilities and Uranium One ships the U3O8
produced at its mines to converters in time for scheduled deliveries to customers.
Depending on the location of the conversion facility, shipping times from Kazakhstan can be
up to four months and the lead time between production of U3O8 and sales has a significant
impact on the inventory levels at any given time. Uranium One has entered into a uranium
logistics agreement with JSC Atomredmetzoloto, the Russian state-owned uranium mining
company, which allows both parties to enter into location swaps and spot sales in order to
facilitate deliveries of uranium to customers, and to better manage shipping logistics.
19.1.2 Uranium Price
CSA notes that the market for uranium has fluctuated during the past four years. Figure
19-1, copied from the Ux Consulting Company LLC (“UxC”) website, shows the trend in
uranium pricing over the past two years.
The spot quote listed by UxC on October 7, 2013 was US$35.00/lb U3O8. For economic
analysis, CSA has used a spot price of US$55.00/lb in 2013 and 2014 and US$65.00/lb U3O8
thereafter.
Metal prices used for Mineral Resources and Mineral Reserves are based on consensus, long
term forecasts from banks, financial institutions, and other sources.
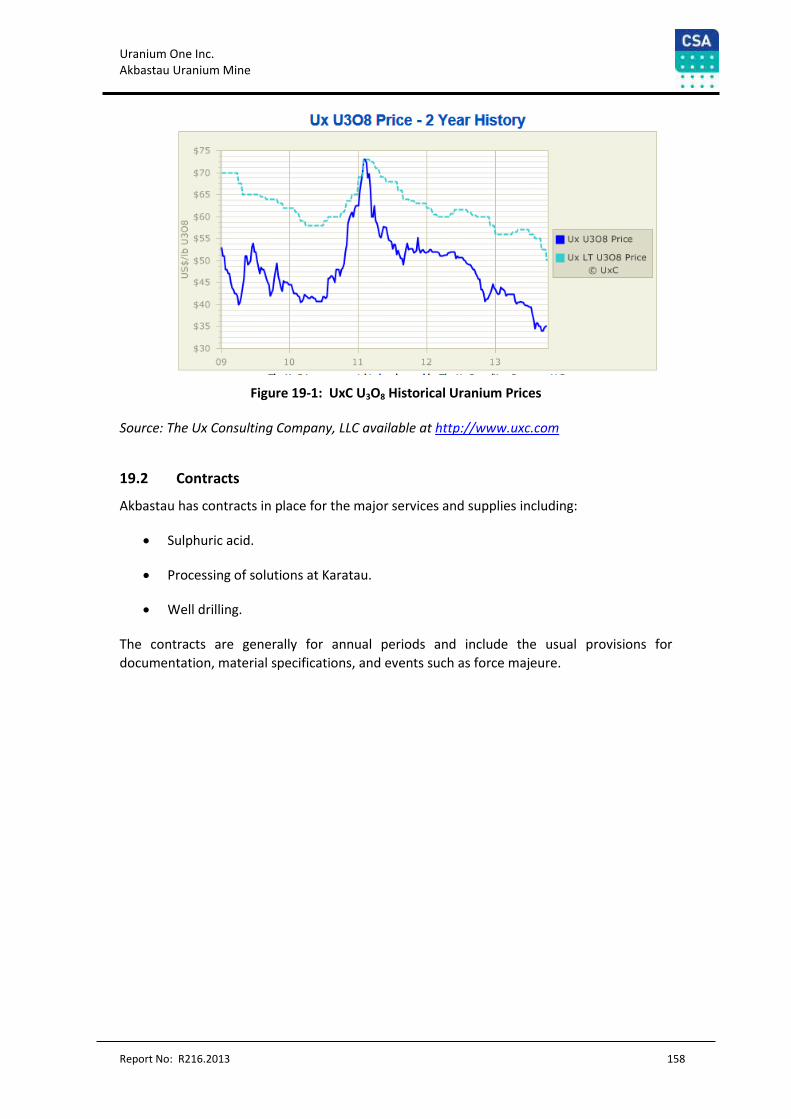
Uranium One Inc. Akbastau Uranium Mine
Report No: R216.2013 158
Figure 19-1: UxC U3O8 Historical Uranium Prices
Source: The Ux Consulting Company, LLC available at http://www.uxc.com
19.2 Contracts
Akbastau has contracts in place for the major services and supplies including:
Sulphuric acid.
Processing of solutions at Karatau.
Well drilling.
The contracts are generally for annual periods and include the usual provisions for
documentation, material specifications, and events such as force majeure.
Uranium One Inc. Akbastau Uranium Mine
Report No: R216.2013 159
20 Environmental Studies, Permitting and Social or Community Impact
20.1 Environment, Health and Safety
The site was well kept, clean, and with good housekeeping practices in the operating areas.
Staff appeared to be knowledgeable in their job areas, and designs appeared to be adequate
for the nature of the work at the facility. Conventional health and safety programs exist with
respect to acid management (a key health safety and environmental program element) as
well as other conventional health and safety elements.
Contractor working areas were less tidy and tripping hazards were common in construction
areas. PPE (eye protection, hard hats, and steel-toed boots) was not in use in the
contractor’s working areas.
No material issues of concern became evident and no fatal flaws from an environmental
perspective were identified.
Current Kazakhstan regulations regarding development are being followed. For this
operation, the environmental issues relative to start-up can be expected to be minimized. In
view of the depth of the zones being mined and the relative isolation of the aquifer, there is
no aquifer remediation planned as part of the closure. The surface disturbances will be
reclaimed and process facilities will be removed.
Small quantities of sand may accumulate in the process ponds. This material may contain
radioactive materials and is planned to be disposed of in an approved waste disposal area
off site. In 2012 issues with the degradation of IX resin led to an increase in the amount of
waste entering the sand ponds and requiring appropriate disposal.
The environmental risk is currently perceived by CSA to be low.
20.2 Project Permitting
The Mine is operating at the with the No. 1 and No. 3 areas in commercial production and
only No. 4 remaining in the test production stage.
The approved production at the No. 1 site is 731 t U per year while the approved production
plan for No. 3 is 812 t U per year at steady state. After it moves to commercial production
the No. 4 unit will have an approved annual production rate of 406 t U.
Akbastau indicates that it has the necessary permits for its current operations.
20.3 Social or Community Requirements
The Mine is not located near any communities and there are no residents in the immediate
mine area. The nearest community is Aksumbe which is 40 km south of the Mine.
Uranium One Inc. Akbastau Uranium Mine
Report No: R216.2013 160
20.4 Mine Closure Requirements
In view of the depth of the zones being mined and the relative isolation of the aquifer, there
is no aquifer remediation planned as part of the closure. The surface disturbances will be
reclaimed and process facilities will be removed.
As part of the Subsoil Use Contract, Akbastau is required to contribute to a reclamation fund.
As of December 31, 2012, the Uranium One portion of the asset retirement obligations (on
an undiscounted basis) has been estimated at $2.1 million for the successful
decommissioning, reclamation, and long term care of the surface and wellfield facilities. The
total asset retirement obligation is estimated to be $4.2 million.
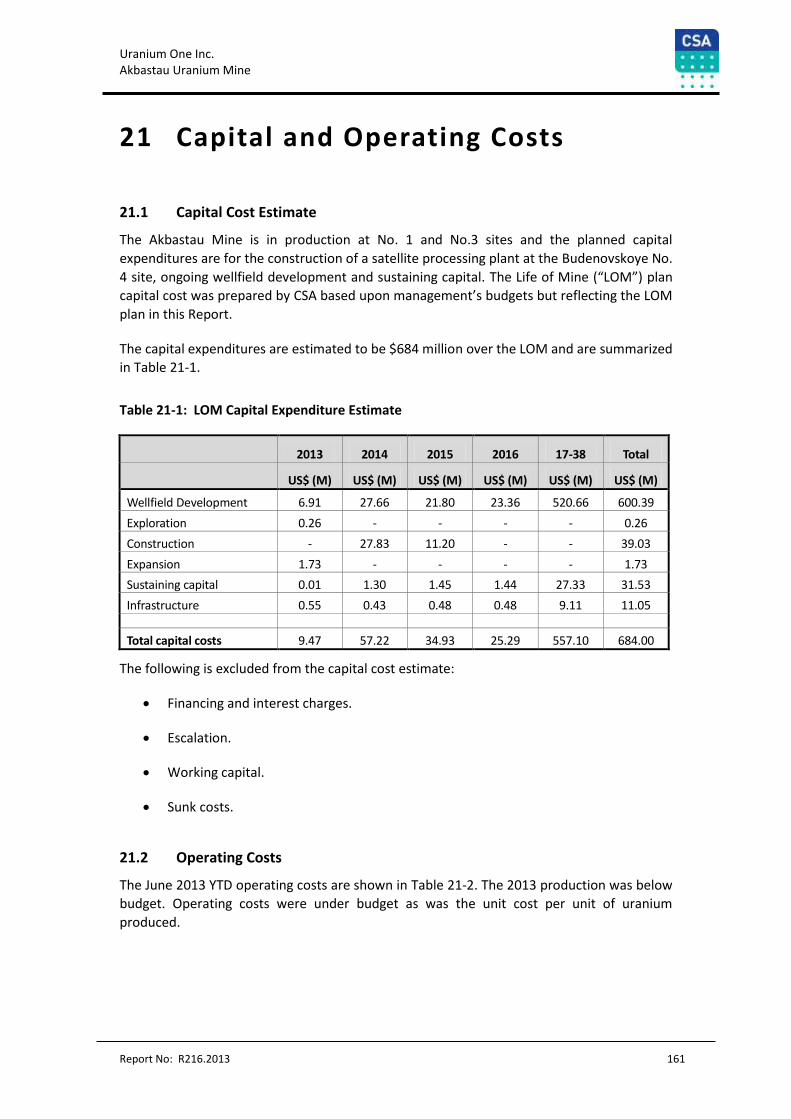
Uranium One Inc. Akbastau Uranium Mine
Report No: R216.2013 161
21 Capital and Operating Costs
21.1 Capital Cost Estimate
The Akbastau Mine is in production at No. 1 and No.3 sites and the planned capital
expenditures are for the construction of a satellite processing plant at the Budenovskoye No.
4 site, ongoing wellfield development and sustaining capital. The Life of Mine (“LOM”) plan
capital cost was prepared by CSA based upon management’s budgets but reflecting the LOM
plan in this Report.
The capital expenditures are estimated to be $684 million over the LOM and are summarized
in Table 21-1.
Table 21-1: LOM Capital Expenditure Estimate
2013 2014 2015 2016 17-38 Total
US$ (M) US$ (M) US$ (M) US$ (M) US$ (M) US$ (M)
Wellfield Development 6.91 27.66 21.80 23.36 520.66 600.39
Exploration 0.26 - - - - 0.26
Construction - 27.83 11.20 - - 39.03
Expansion 1.73 - - - - 1.73
Sustaining capital 0.01 1.30 1.45 1.44 27.33 31.53
Infrastructure 0.55 0.43 0.48 0.48 9.11 11.05
Total capital costs 9.47 57.22 34.93 25.29 557.10 684.00
The following is excluded from the capital cost estimate:
Financing and interest charges.
Escalation.
Working capital.
Sunk costs.
21.2 Operating Costs
The June 2013 YTD operating costs are shown in Table 21-2. The 2013 production was below
budget. Operating costs were under budget as was the unit cost per unit of uranium
produced.
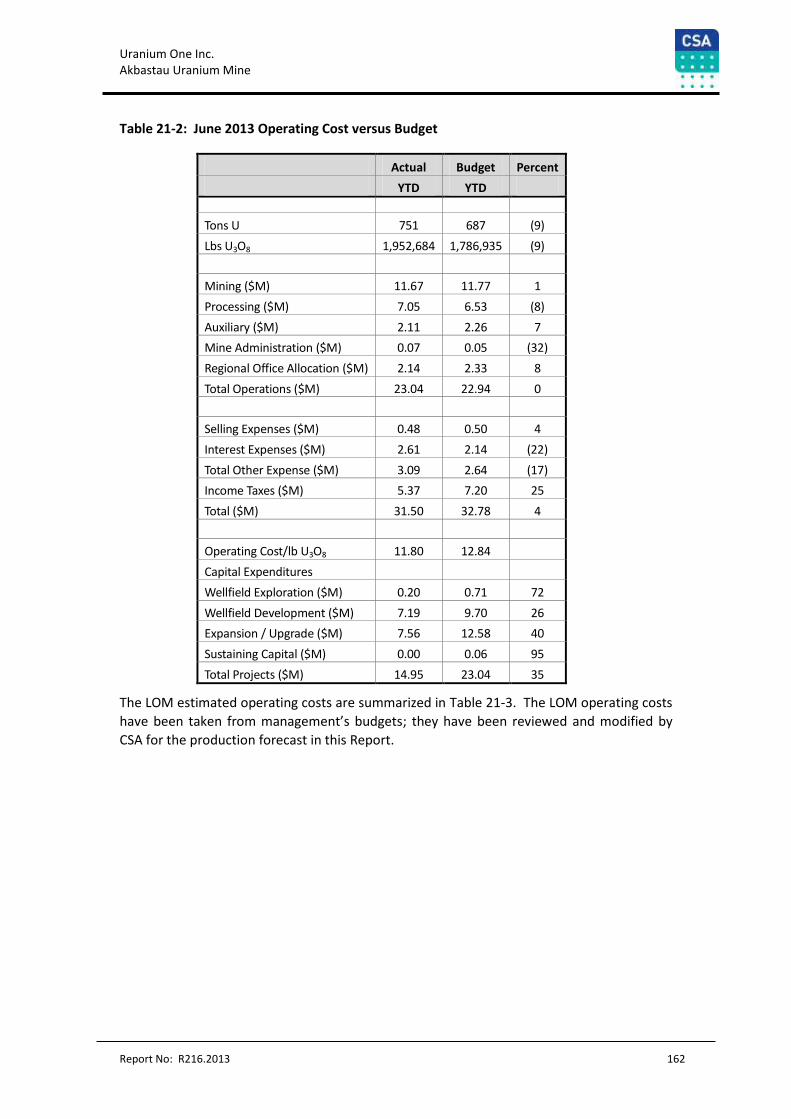
Uranium One Inc. Akbastau Uranium Mine
Report No: R216.2013 162
Table 21-2: June 2013 Operating Cost versus Budget
Actual Budget Percent
YTD YTD
Tons U 751 687 (9)
Lbs U3O8 1,952,684 1,786,935 (9)
Mining ($M) 11.67 11.77 1
Processing ($M) 7.05 6.53 (8)
Auxiliary ($M) 2.11 2.26 7
Mine Administration ($M) 0.07 0.05 (32)
Regional Office Allocation ($M) 2.14 2.33 8
Total Operations ($M) 23.04 22.94 0
Selling Expenses ($M) 0.48 0.50 4
Interest Expenses ($M) 2.61 2.14 (22)
Total Other Expense ($M) 3.09 2.64 (17)
Income Taxes ($M) 5.37 7.20 25
Total ($M) 31.50 32.78 4
Operating Cost/lb U3O8 11.80 12.84
Capital Expenditures
Wellfield Exploration ($M) 0.20 0.71 72
Wellfield Development ($M) 7.19 9.70 26
Expansion / Upgrade ($M) 7.56 12.58 40
Sustaining Capital ($M) 0.00 0.06 95
Total Projects ($M) 14.95 23.04 35
The LOM estimated operating costs are summarized in Table 21-3. The LOM operating costs
have been taken from management’s budgets; they have been reviewed and modified by
CSA for the production forecast in this Report.
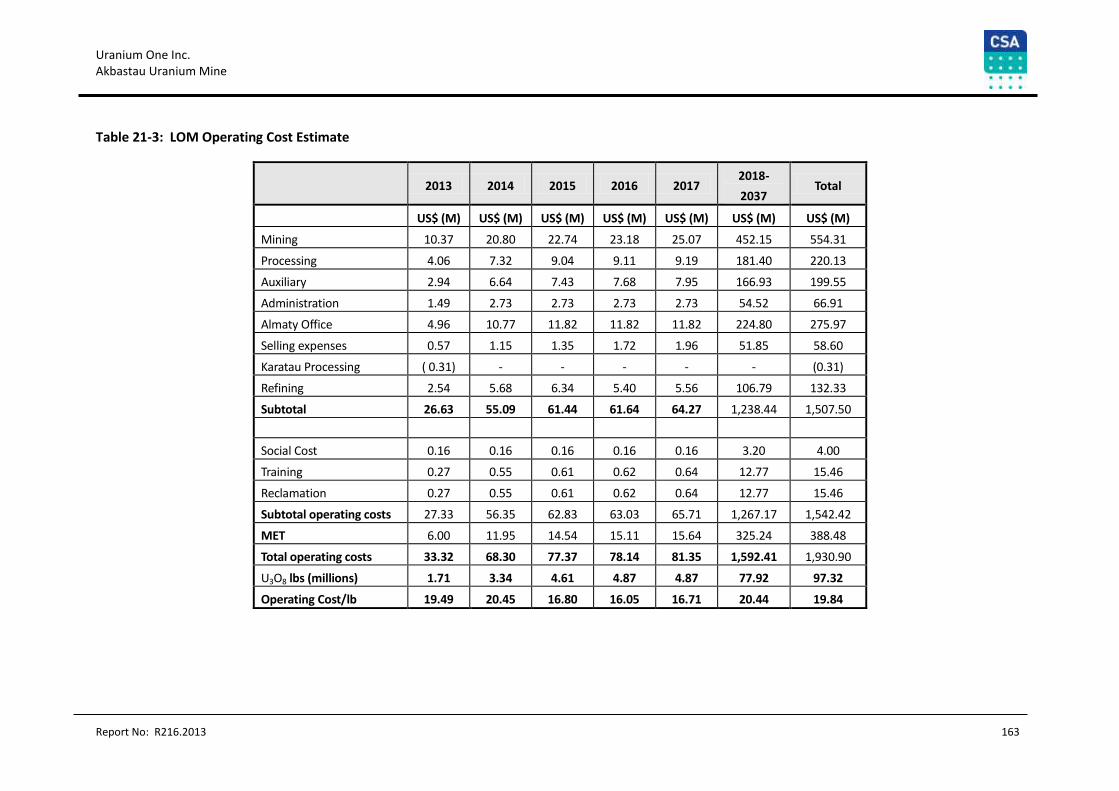
Uranium One Inc. Akbastau Uranium Mine
Report No: R216.2013 163
Table 21-3: LOM Operating Cost Estimate
2013 2014 2015 2016 2017
2018-
2037 Total
US$ (M) US$ (M) US$ (M) US$ (M) US$ (M) US$ (M) US$ (M)
Mining 10.37 20.80 22.74 23.18 25.07 452.15 554.31
Processing 4.06 7.32 9.04 9.11 9.19 181.40 220.13
Auxiliary 2.94 6.64 7.43 7.68 7.95 166.93 199.55
Administration 1.49 2.73 2.73 2.73 2.73 54.52 66.91
Almaty Office 4.96 10.77 11.82 11.82 11.82 224.80 275.97
Selling expenses 0.57 1.15 1.35 1.72 1.96 51.85 58.60
Karatau Processing ( 0.31) - - - - - (0.31)
Refining 2.54 5.68 6.34 5.40 5.56 106.79 132.33
Subtotal 26.63 55.09 61.44 61.64 64.27 1,238.44 1,507.50
Social Cost 0.16 0.16 0.16 0.16 0.16 3.20 4.00
Training 0.27 0.55 0.61 0.62 0.64 12.77 15.46
Reclamation 0.27 0.55 0.61 0.62 0.64 12.77 15.46
Subtotal operating costs 27.33 56.35 62.83 63.03 65.71 1,267.17 1,542.42
MET 6.00 11.95 14.54 15.11 15.64 325.24 388.48
Total operating costs 33.32 68.30 77.37 78.14 81.35 1,592.41 1,930.90
U3O8 lbs (millions) 1.71 3.34 4.61 4.87 4.87 77.92 97.32
Operating Cost/lb 19.49 20.45 16.80 16.05 16.71 20.44 19.84
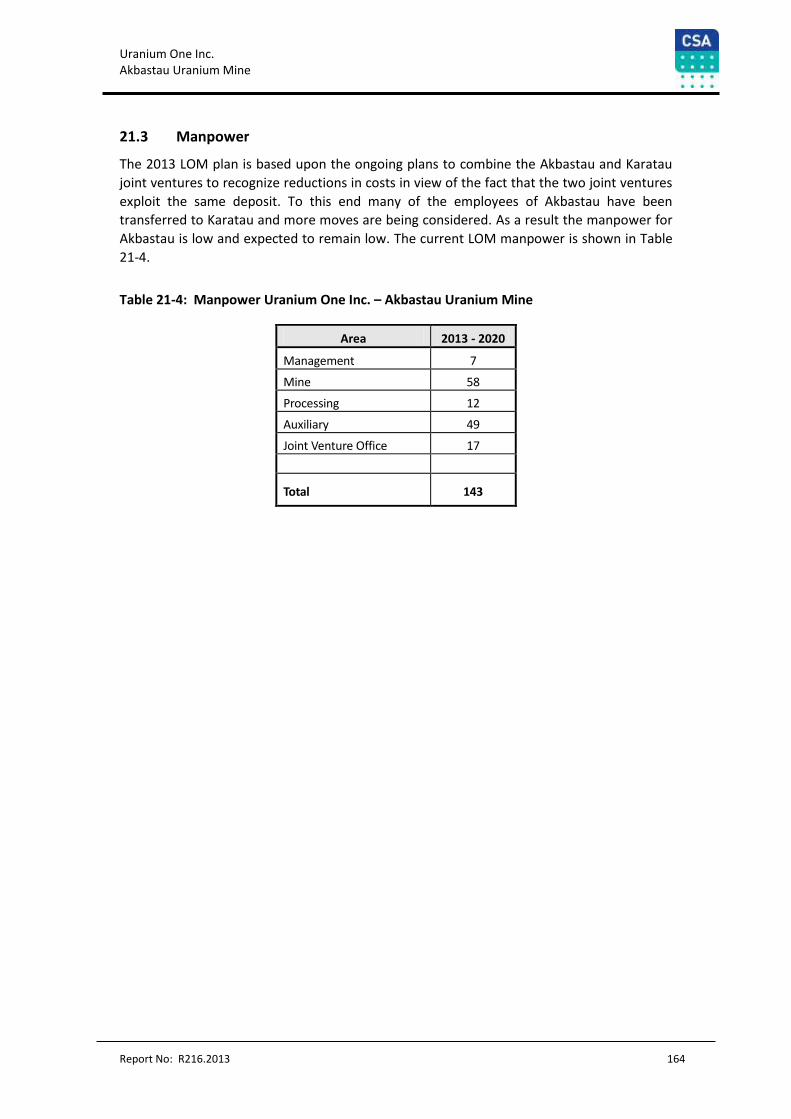
Uranium One Inc. Akbastau Uranium Mine
Report No: R216.2013 164
21.3 Manpower
The 2013 LOM plan is based upon the ongoing plans to combine the Akbastau and Karatau
joint ventures to recognize reductions in costs in view of the fact that the two joint ventures
exploit the same deposit. To this end many of the employees of Akbastau have been
transferred to Karatau and more moves are being considered. As a result the manpower for
Akbastau is low and expected to remain low. The current LOM manpower is shown in Table
21-4.
Table 21-4: Manpower Uranium One Inc. – Akbastau Uranium Mine
Area 2013 - 2020
Management 7
Mine 58
Processing 12
Auxiliary 49
Joint Venture Office 17
Total 143
Uranium One Inc. Akbastau Uranium Mine
Report No: R216.2013 165
22 Economic Analysis
Under NI 43-101 and Form 43-101F1, producing issuers may exclude the information
required for Section 22 (Economic Analysis) for properties that are currently in production,
unless the Technical Report includes a material expansion of current production. CSA notes
that Uranium One is a producing issuer, the Akbastau Mine is currently in production, and a
material expansion is not being planned. CSA has performed an economic analysis of the
Akbastau Mine as part of its estimate of Mineral Reserves using the estimates presented in
this Report and concluded that the outcome is a positive cash flow.
Uranium One Inc. Akbastau Uranium Mine
Report No: R216.2013 166
23 Adjacent Properties
The Mine is immediately adjacent to the southern and eastern boundaries of the Karatau
Mine. The uranium leach solutions extracted from the Budenovskoye No. 1, No. 3 and No. 4
sites are treated at the Karatau plant under a processing agreement with Karatau. The two
mines are exploiting the same geological deposit. The boundary between the two mines is a
legally defined line across the deposit set by the Government of Kazakhstan in the past.
The Karatau Mine has been the subject of Technical Reports prepared for Uranium One and
is available on SEDAR.
Uranium One Inc. Akbastau Uranium Mine
Report No: R216.2013 167
24 Other Relevant Data and Information
No additional information or explanation is necessary to make this Technical Report
understandable and not misleading.
Uranium One Inc. Akbastau Uranium Mine
Report No: R216.2013 168
25 Interpretation and Conclusions
CSA has completed a Mineral Resource and Mineral Reserve estimates for the Budenovskoye
No. 1, No. 3, and No. 4 deposits of the Akbastau Uranium Mine.
Geological exploration and mineralization interpretation have been performed by
experienced and competent personnel. Significant QA/QC data has been collected and CSA
considers that the data that has been used to compile this Mineral Resource estimate is of a
high quality.
The new estimates result from the application of three-dimensional (“3D”) modelling
techniques to the extensive database of drilling information for the property compiled by
the Government of Kazakhstan, which was previously not directly available to Uranium One,
but was made available to Uranium One for the first time in November 2012. Previously,
estimates for the Mine were prepared in accordance with the GKZ classifications (using a 2D
polygonal geological modelling and estimation process) and then converted to the
definitions and guidelines for the reporting of exploration information, Mineral Resources
and Mineral Reserves determined by the Canadian Institute of Mining, Metallurgy and
Petroleum Definition Standards on Mineral Resources and Mineral Reserves adopted by the
CIM Council (the “CIM Standards”).
Mineral Resources for Budenovskoye No. 1, No. 3 and No. 4 deposit, current to June 30,
2013, are shown in Table 25-1.
The completed modelling and Mineral Resource estimate has led to an increase in Measured
and Indicated Mineral Resources of 33,694 t U and an increase in Inferred Mineral Resources
of 226 t U (compared to the previous estimate in March 2012). Modelling allowed for a more
reliable interpretation of the available data, which resulted in an increase to the total
Mineral Resources by 77%.
It should be noted that 20% of the drillhole data could not be used (because the data was
not completed for these holes) in this iteration of the Mineral Resource estimate. This data
should be incorporated in the next version of the Mineral Resource estimate.
The new geological model can be used not only for classification of the Mineral Resources
but also for planning of production. On-going interpretation of the data acquired from
production drilling will allow for more accurate planning for setting screens and modes of
operation.
CSA’s recommendation is to continue improving the geological model, with due
consideration of the production drilling data.
The geological model demonstrates the significant exploration potential of the
Budenovskoye No. 1, No. 3, and No. 4 deposits. Assuming the current production rate of
2,000 tpa U, the Measured and Indicated Mineral Resources support a mine life of 25-30

Uranium One Inc. Akbastau Uranium Mine
Report No: R216.2013 169
years. For this reason, CSA considers that increasing the confidence of Inferred Mineral
Resources need not be given high priority.
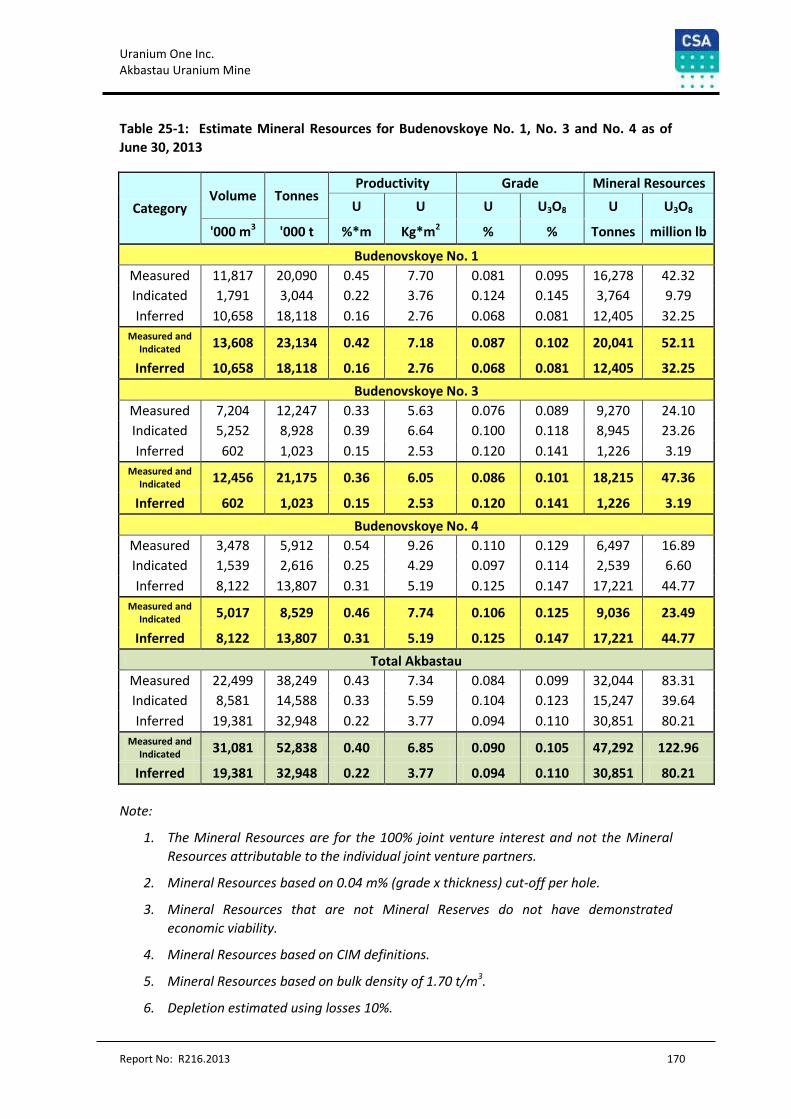
Uranium One Inc. Akbastau Uranium Mine
Report No: R216.2013 170
Table 25-1: Estimate Mineral Resources for Budenovskoye No. 1, No. 3 and No. 4 as of
June 30, 2013
Category Volume Tonnes
Productivity Grade Mineral Resources
U U U U3O8 U U3O8
'000 m3 '000 t %*m Kg*m2 % % Tonnes million lb
Budenovskoye No. 1
Measured 11,817 20,090 0.45 7.70 0.081 0.095 16,278 42.32
Indicated 1,791 3,044 0.22 3.76 0.124 0.145 3,764 9.79
Inferred 10,658 18,118 0.16 2.76 0.068 0.081 12,405 32.25
Measured and Indicated 13,608 23,134 0.42 7.18 0.087 0.102 20,041 52.11
Inferred 10,658 18,118 0.16 2.76 0.068 0.081 12,405 32.25
Budenovskoye No. 3
Measured 7,204 12,247 0.33 5.63 0.076 0.089 9,270 24.10
Indicated 5,252 8,928 0.39 6.64 0.100 0.118 8,945 23.26
Inferred 602 1,023 0.15 2.53 0.120 0.141 1,226 3.19
Measured and Indicated 12,456 21,175 0.36 6.05 0.086 0.101 18,215 47.36
Inferred 602 1,023 0.15 2.53 0.120 0.141 1,226 3.19
Budenovskoye No. 4
Measured 3,478 5,912 0.54 9.26 0.110 0.129 6,497 16.89
Indicated 1,539 2,616 0.25 4.29 0.097 0.114 2,539 6.60
Inferred 8,122 13,807 0.31 5.19 0.125 0.147 17,221 44.77
Measured and Indicated 5,017 8,529 0.46 7.74 0.106 0.125 9,036 23.49
Inferred 8,122 13,807 0.31 5.19 0.125 0.147 17,221 44.77
Total Akbastau
Measured 22,499 38,249 0.43 7.34 0.084 0.099 32,044 83.31
Indicated 8,581 14,588 0.33 5.59 0.104 0.123 15,247 39.64
Inferred 19,381 32,948 0.22 3.77 0.094 0.110 30,851 80.21
Measured and Indicated 31,081 52,838 0.40 6.85 0.090 0.105 47,292 122.96
Inferred 19,381 32,948 0.22 3.77 0.094 0.110 30,851 80.21
Note:
1. The Mineral Resources are for the 100% joint venture interest and not the Mineral
Resources attributable to the individual joint venture partners.
2. Mineral Resources based on 0.04 m% (grade x thickness) cut-off per hole.
3. Mineral Resources that are not Mineral Reserves do not have demonstrated
economic viability.
4. Mineral Resources based on CIM definitions.
5. Mineral Resources based on bulk density of 1.70 t/m3.
6. Depletion estimated using losses 10%.
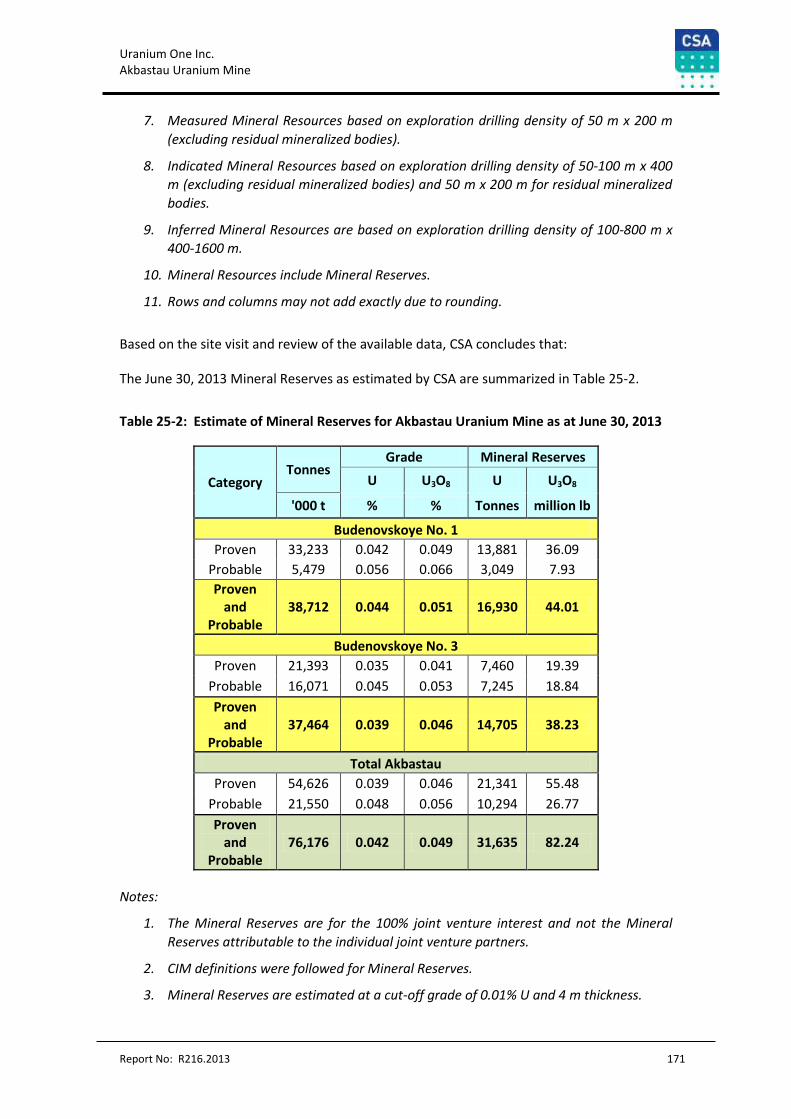
Uranium One Inc. Akbastau Uranium Mine
Report No: R216.2013 171
7. Measured Mineral Resources based on exploration drilling density of 50 m x 200 m
(excluding residual mineralized bodies).
8. Indicated Mineral Resources based on exploration drilling density of 50-100 m x 400
m (excluding residual mineralized bodies) and 50 m x 200 m for residual mineralized
bodies.
9. Inferred Mineral Resources are based on exploration drilling density of 100-800 m x
400-1600 m.
10. Mineral Resources include Mineral Reserves.
11. Rows and columns may not add exactly due to rounding.
Based on the site visit and review of the available data, CSA concludes that:
The June 30, 2013 Mineral Reserves as estimated by CSA are summarized in Table 25-2.
Table 25-2: Estimate of Mineral Reserves for Akbastau Uranium Mine as at June 30, 2013
Category Tonnes
Grade Mineral Reserves
U U3O8 U U3O8
'000 t % % Tonnes million lb
Budenovskoye No. 1
Proven 33,233 0.042 0.049 13,881 36.09
Probable 5,479 0.056 0.066 3,049 7.93
Proven and
Probable 38,712 0.044 0.051 16,930 44.01
Budenovskoye No. 3
Proven 21,393 0.035 0.041 7,460 19.39
Probable 16,071 0.045 0.053 7,245 18.84
Proven and
Probable 37,464 0.039 0.046 14,705 38.23
Total Akbastau
Proven 54,626 0.039 0.046 21,341 55.48
Probable 21,550 0.048 0.056 10,294 26.77
Proven and
Probable 76,176 0.042 0.049 31,635 82.24
Notes:
1. The Mineral Reserves are for the 100% joint venture interest and not the Mineral
Reserves attributable to the individual joint venture partners.
2. CIM definitions were followed for Mineral Reserves.
3. Mineral Reserves are estimated at a cut-off grade of 0.01% U and 4 m thickness.
Uranium One Inc. Akbastau Uranium Mine
Report No: R216.2013 172
4. Mineral Reserves are estimated using an average long-term uranium price of US$65
per pound U3O8.
5. Bulk density is 1.7 t/m3.
6. Numbers may not add due to rounding.
7. Uranium quantities and grade are net of extraction.
There has not been a project to date reconciliation between the production and the original
Mineral Reserve estimate for the producing areas.
The estimated operating cost for the Akbastau Mine is US$19.84 per pound U3O8 sold.
The LOM plan includes the extraction of the estimated Proven and Probable Mineral
Reserves. The remaining mine life as of June 30, 2013, based on current Mineral Reserves, is
approximately 25 years.
There are 215 t U within the Budenovskoye No. 1 Mineral Reserves which are included but
will require an amendment to the Subsoil Use Contract as the production extends beyond
the current term of the contract.
The maximum annual production is estimated to be 1,949 tonnes U.
The capital cost for the LOM is US$684 million including plant construction, wellfield
development and sustaining capital.
Uranium One Inc. Akbastau Uranium Mine
Report No: R216.2013 173
26 Recommendations
Key recommendations from this Report are listed below:
To complete a revised Mineral Resource estimate utilising the additional 20% of data
that was not available for this iteration of the Mineral Resource.
To complete additional exploration in the Inferred and Indicated Mineral Resource
blocks to increase the confidence level of these Mineral Resources. As previously
mentioned, due to the large Measured and Indicated Mineral Resource inventory,
additional drilling in the Inferred Mineral Resource areas may be given lower
priority.
To improve the geological model with due consideration of the new exploration and
production drilling data.
Continue the operation of the mine.
Undertake a review of the LOM plan to develop the plan in more detail and to assess
the implications of the potential for the mine life to extend beyond the existing
permit conditions.
Pursue the implementation of reconciliation procedures that are maintained on a
regular basis and include block by block reconciliation of the production compared
to the Mineral Reserve estimate.
Direct more effort to the analysis of the physical and chemical data related to the
wellfields, process solutions, and plant operations to assist in the evaluation of the
operations and to possibly determine the cause of better or worse than planned
operating results.
Uranium One Inc. Akbastau Uranium Mine
Report No: R216.2013 174
27 References
Agnerian H, Bergen R.D. Technical NI 43-101 Report on the Budenovskoye No. 1, 3, 4
Uranium projects, Kazakhstan, prepared for Effective Energy NV by Scott Wilson
Roscoe Postle Associated, October 2008
Australasian Code for Reporting of Exploration Results, Mineral Resources, and Ore
Reserves. Prepared by: The Joint Ore Reserves Committee of The Australasian
Institute of Mining and Metallurgy, Australian Institute of Geoscientists and Minerals
Council of Australia (JORC), 2004.
Charts of technological blocks for the Budenovskoye Area 1, 3 and 4
Chernyakov V.M., Kashafutdinov I.V., Petrichuk N.V. et al., 2010 (Volkovgeologia, 2010).
Preliminary estimation of reserves to deposits No. 4 of the uranium deposit
Budenovskoye (in Russian). Almaty, 2010.
CIM (2010): CIM Definition Standards for Mineral Resources and Mineral Reserves 2010.
Dara M.Y., Abramov E.K., 1990. Report on exploration and resource definition at the
Budenovskoye deposit in 1988-1990 and a Resource estimate as January, 1990.
Geological Objectives 5-18 and 7-18 (in Russian). Almaty, 1990.
Instructions of gamma-ray logging for exploration and operation of uranium deposits (In
Russian). Moscow, 1987
Instructions of gamma-ray logging for preparation to the operation of tabular-infiltration
uranium d deposits (In Russian). Almaty, 2003
Instructions of gamma-ray logging for tabular-infiltration uranium deposits (In Russian).
Almaty, 2008.
MEMR (2007): Contract for Joint Uranium Exploration and Production on Site 1,
Budenovskoye Field, 2007
MEMR (2007): Contract for Joint Uranium Exploration and Production on Sites 3 and 4
Budenovskoye Field, 2007
NAEN, 2011. Russian Code for the public reporting of exploration results, mineral resources
and mineral reserves (Code NAEN). Moscow, 2011
Natalov A.G., Chernyakov V.M., Kashafutdinov I.F. et al. (Volkovgeologia, 2008) The project
of a detailed exploration with a complex of related research and test operation at area
1 of uranium deposit Budenovskoye (in Russian). Almaty, 2008.
National instrument 43-101 standards of disclosure for mineral projects, form 43-101F1
technical report, and companion policy 43-101CP
Uranium One Inc. Akbastau Uranium Mine
Report No: R216.2013 175
Source database in GKlet format
Valliant, W. V., Kyle, J. I., and Oliver, H., 2007, Technical Report on the Budenovskoye No. 2
Uranium Project, Kazakhstan: Scott Wilson RPA Report Prepared for Effective Energy
NV, December 20, 2007.
Valliant, W. V., and Kyle, J. I., 2010b, Technical Report on the Karatau Uranium Mine,
Kazakhstan, prepared for Uranium One Inc. by Scott Wilson Roscoe Postle Associates
Inc., January 25, 2010.
Valliant W.W., Agnerian H, Bergen R.D. Technical NI 43-101 Report on the Akbastau Uranium
project, Kazakhstan, prepared for Uranium One Inc. by Scott Wilson Roscoe Postle
Associated, July, 2010
Valliant W.W., Agnerian H, Bergen R.D. Technical NI 43-101 Report on the Akbastau Uranium
mine, Kazakhstan, prepared for Uranium One Inc. by Roscoe Postle Associated Inc.,
March, 2012
Valliant, W.V. and Bergen, R.D., 2012, Technical Report on the Akbastau Uranium Mine,
Kazakhstan, prepared for Uranium One Inc. by Roscoe Postle Associates Inc., May 2,
2012.
Vershkov A.F., Drobov S.R., Flerov I.A. et al., 2012 (Volkovgeologia, 2012). Report on the
results of detailed exploration area No. 2 of the uranium deposit Budenovskoye with
estimated reserves a resource of uranium as of 01.01.2012 (in Russian). Almaty, 2012.
Vershkov A.F., Drobov S.R., Shishkov I.A. et al., 2010 (Volkovgeologia, 2010). Prefeasibility
study of permanent conditions for area No. 3 of the uranium deposit Budenovskoye
(in Russian). Almaty, 2010
Vershkov A.F., Drobov S.R., Shishkov I.A. et al., 2010 (Volkovgeologia, 2010). Report on the
results of detailed exploration area No. 1 of the uranium deposit Budenovskoye with
estimated reserves of uranium as of 01.01.2010 (in Russian). Almaty, 2010.
Vershkov A.F., Mendygaliev A.S., Kondrashov V.P. et al, 2008 (Volkovgeologia, 2008). Report
on the results of detailed exploration area No. 4 of the uranium deposit Inkai with
estimated reserves of uranium as of 01.07.2008 (in Russian). Almaty, 2008.
Vershkov A.F., Natalov A.G., Shishkov I.A. et al., 2010 (Volkovgeologia, 2010). Prefeasibility
study of permanent conditions for area No. 1 of the uranium deposit Budenovskoye
(in Russian). Almaty, 2010
Volkovgeologiya, 2004. Report with calculation of reserves of uranium at deposit 1 in
Southern part of Budenovskoye deposit as of 01.10.2004. Almaty, 2004
Volkovgeologiya, 2004. Report with calculation of reserves of uranium at deposit 3 in
Southern part of Budenovskoye deposit as of 01.10.2004. Almaty, 2004
Volkovgeologiya, 2004. Report with calculation of reserves of uranium at deposit 4 in
Southern part of Budenovskoye deposit as of 01.10.2004. Almaty, 2004
Uranium One Inc. Akbastau Uranium Mine
Report No: R216.2013 176
28 Date and Signatures
The following people are responsible for supervising and/or preparing this Report:
28.1 Certificate of Qualified Person
I, Maxim Seredkin, Ph.D, MAIG, as an author of this report entitled “Technical Report
(Mineral Resource and Mineral Reserve Estimation), Uranium One Inc., Akbastau Uranium
Mine, Kazakhstan” (the “Report”), dated December 5, 2013 and prepared for Uranium One
Inc., do hereby certify that:
1. I am a Senior Resource Geologist with CSA Global Pty Ltd (“CSA”) at its head office at
Level 2, 3 Ord Street, West Perth, WA 6005, Australia.
2. I am a professional geologist having graduated with a BSc (Geology), 1997, from the
Moscow State University, Russia and a PhD from the Moscow State University,
Russia, majoring in petrology and volcanology in 2001.
3. I am a Member of the Australian Institute of Geoscientists. I have worked as a
geologist for a total of sixteen years since my graduation from university.
4. I have read the definition of "qualified person" set out in National Instrument 43-101
("NI 43-101") and certify that by reason of my education, affiliation with a
professional association (as defined in NI 43-101) and past relevant work experience,
I fulfill the requirements to be a "qualified person" for the purposes of NI 43-101.
5. I visited the property that is the subject of the Report from April 20 to 27, 2012.
6. I am responsible for Sections 2 to 12 and 14 of the Report, and share responsibility
for Sections 1, 25, 26 of the Report.
7. I am independent of Uranium One applying the test set out in Section 1.5 of NI 43-
101.
8. I have had prior involvement with the property that is the subject of the Report from
2008 to January 2012 during my work as chief geologist of ARMZ Holding.
9. I have read NI 43-101, and the Report has been prepared in compliance with NI 43-
101 and Form 43-101F1.
10. As of the date of this Report, to the best of my knowledge, information, and belief,
this Report contains all scientific and technical information that is required to be
disclosed to make the Report not misleading.
Dated this 5th day of December, 2013.
.
Uranium One Inc. Akbastau Uranium Mine
Report No: R216.2013 177
Dr. Maxim Seredkin
Senior Resource Geologist
CSA Global Pty Ltd.
Uranium One Inc. Akbastau Uranium Mine
Report No: R216.2013 178
28.2 Certificate of Qualified Person
I, Raymond Dennis Bergen, P. Eng., as an author of this report entitled “Technical Report
(Mineral Resource and Mineral Reserve Estimation) Akbastau Uranium Mine, Kazakhstan”,
dated December 5, 2013 and prepared for Uranium One Inc., do hereby certify that:
1. I am an Associate Principal Mining Engineer engaged by Roscoe Postle Associates
Inc. of Suite 501, 55 University Ave., Toronto, ON, M5J 2H7.
2. I am a graduate of the University of British Columbia, Vancouver, B.C., Canada, in
1979 with a Bachelor of Applied Science degree in Mineral Engineering. I am a
graduate of the British Columbia Institute Technology in Burnaby, B.C. Canada, in
1972 with a Diploma in Mining Technology.
3. I am registered as a Professional Engineer in the Province of British Columbia (Reg.
#16064) and as a Licensee with the Association of Professional Engineers, Geologists
and Geophysicists of the Northwest Territories (Licence L1660). I have worked as an
engineer for a more than 30 years since my graduation. My relevant experience for
the purpose of the Technical Report is:
Practice as a mining engineer, production superintendent, mine manager, Vice
President of Operations and a consultant in the design, operation and review of
mining operations.
Review and report, as an employee and as a consultant, on numerous mining
operations and projects around the world for due diligence and operational
review related to project acquisition and technical report preparation, including
NI 43-101 technical report preparation.
Mining engineer in underground gold and base metal mines.
Consulting engineer working on project acquisition and project design.
Mine Manager at three different mines with open pit and underground
operations
Review of uranium ISR projects in the U.S.A., Australia and Kazakhstan.
4. I have read the definition of "qualified person" set out in National Instrument 43-101
("NI 43-101") and certify that by reason of my education, affiliation with a
professional association (as defined in NI 43-101) and past relevant work experience,
I fulfill the requirements to be a "qualified person" for the purposes of NI 43-101.
5. I visited the Akbastau Mine on September 14-15, 2013.
6. I am responsible for Sections 13, 15-22 and share responsibility for Sections 1, 25,
26, and 27 of the Technical Report.
7. I am independent of the Issuer applying the test set out in Section 1.5 of NI 43-101.
Uranium One Inc. Akbastau Uranium Mine
Report No: R216.2013 179
8. I have previously visited the Akbastau Mine and co-authored three Technical Reports
on the Akbastau Mine (formerly Budenovskoye No. 1, 3, and 4) dated October 1,
2008 for the Effective Energy N.V. and July 12, 2010 and March 1, 2012 (amended
May 2, 2012) for Uranium One.
9. I have read NI 43-101, and the Technical Report has been prepared in compliance
with NI 43-101 and Form 43-101F1.
10. To the best of my knowledge, information, and belief, the Technical Report contains
all scientific and technical information that is required to be disclosed to make the
technical report not misleading.
Dated this 5th day of December, 2013
Raymond Dennis Bergen, P. Eng.
Associate Principal Mining Engineer
Roscoe Postle Associates Inc.
Uranium One Inc. Akbastau Uranium Mine
Report No: R216.2013 180
Appendix 1: Details of Database Structure
Source Data
The source data for the database were supplied in GKlet format – Excel based tables
developed to manage databases in the AtomGeo system:
83 files were supplied for Akbastau - 1,
36 files were supplied for Akbastau - 3,
72 files were supplied for Akbastau - 4.
The tables contain the following information (which is often duplicated):
“AI” sheet (anomalous intersections) includes fields: Drillhole, Anomalous
Intersection, Horizon, Profile, Anomalous Intersection first point depth, Anomalous
Intersection last point depth, Logging date, Drillhole diameter, Drilling fluid density,
Detector length, Tool diameter, Casing thickness, RL (resistivity logging) level above
reference point (ohm.m), EL sonde type, EL sensitivity parameter, Correction for
absorption, Correction for radon release, RL level shift, Reference point level shift,
Correlation of level to reference point, Lithological boundary displacement, SP
inclination, SP reliability, SP flip, MaxPs, MinPs, RL average level in drillhole, RL
level above reference point, Reference point start depth and Reference point end
depth.
“Diagram” sheet includes fields: Drillhole, Point depth, Count rate (mcR/h),
Apparent Resistivity (ohm.m), Spontaneous Potential (mV), Radium concentration
(%), Calliper logging (drillhole diameter, mm), PFN, uranium grade (%), Induction
logging and Ratio of initial logging to final measurements.
“Lithology” sheet includes fields: Drillhole, Depth from (m), Depth to (m), Rock
permeability type, Rock lithology/filtration code, Comment, Filtration coefficient
(m/day), Normalised electrical resistivity of lithological variety (ohm.m), Apparent
electric resistivity in the top of the formation (ohm.m), Apparent electric resistivity
in the bottom of the formation (ohm.m), Index of interval inclusion into a sample
for comparison, SP average value of U and SP maximum value of U (shale line).
“RL Lithology” sheet includes fields: Drillhole, Depth from (m), Depth to (m), Rock
permeability type, Rock lithology/filtration code, Comment, Filtration coefficient
(m/day), Normalised electrical resistivity of lithological variety (ohm.m), Apparent
electric resistivity in the top of the formation (ohm.m), Apparent electric resistivity
in the bottom of the formation (ohm.m), Index of inclusion of an interval into a
sample for comparison, SP average value of U, SP maximum value of U (shale line)
and Horizon code.
Uranium One Inc. Akbastau Uranium Mine
Report No: R216.2013 181
“Samples” sheet includes fields: Deposit, Sample, Profile, Drillhole, Depth FROM
(m), Depth TO (m), U concentration (%), Ra concentration (%), Rock permeability
type, Count rate (mcR/h), Lithological type (code), Clay content (%), CO2 carbonate
content, Se concentration, Rhenium, Vanadium, Yttrium, Scandium and
Lanthanides.
“MI_Pas” (mineralized intervals passport) sheet that has the following structure:
Deposit (zone), Anomalous intersection, Profile, Drillhole, Interval start depth (m),
Interval finish depth (m), Interval thickness (m), Ra GT (m%), U GT (m%), Rock
permeability, Filtration coefficient (m/day), Index of interval inclusion into
comparison, Extreme member of sample as per REF, REF correction, Morphological
element, Rock colour at the top of the interval, Rock colour at the bottom of the
interval, X, Y, Z, Ra cut-off concentration (the top), Ra cut-off concentration (the
bottom) and Drillhole average diameter in mineralized interval as per Calliper log
(mm).
“MIpfn” (mineralized intervals of PFN) sheet that has the following structure:
Drillhole, Depth From, Depth To, Thickness , U GT, Ra GT, Ra cut-off value (the
top), Ra cut-off value (the bottom), Lithotype, Clay content coefficient and
Indicator for comparison.
“MI Smpl sheet” (mineralized intervals of sampling) includes fields: Deposit (zone),
Profile, Drillhole, Depth from (m), Depth to (m), Interval thickness (m), U
concentration (%), Ra concentration (%), REF (radioactive equilibrium factor, %),
Core recovery (%), Filtration coefficient (m/day), Thickness of interval of release
(m), Ra concentration as per sampling (%), Ra concentration as per logging (%),
Correction of error of sampling for sands (release), Rock permeability type,
Flushability parameter according to Terekhov, Deposit morphological element,
Geochemical zone (colour), Geochemical type (the top), Geochemical type (the
bottom), Ra cut-off concentration (the top), Ra cut-off concentration (the bottom),
Ra threshold concentration (the top) and Ra threshold concentration (the bottom).
“Grain Size” sheet includes fields: Deposit (zone), Drillhole, Depth From, Depth To,
>10, 10-5, 5-2, 2-1, 1-0.5, 0.5-0.25, 0.25-0.1, 0.1-0.05, 0.05-0.01, 0.01 - 0.005,
0.005-0.002, <0.002, Carbonate content, Comment, Total and CO2 sample ID.
“Properties” sheet includes fields: Block, Drillhole, Depth From, Depth To, Fractions
(mm), Carbonate content, Filtration coefficient, Comment, Total, Permeability,
Rock code, Colour, Characteristic, Class of mode, Mode, D50, SiltClay, Clay, <0.01
mm, PC, Electric Resistivity, D10, D20, D60 and D100.
“Collar Coordinates” sheet includes fields: Deposit (zone), Profile, Drillhole, Index
of angle measurement type, Drillhole depth (m), X (m), Y (m), Z (m), Profile
direction angle (degrees), Magnetic inclination (degrees), Meridian convergence
(degrees), Plane error (m), Altitude error (m), Length of drillhole projection from
collar to bottom (m) and Direction of drillhole projection from collar to bottom
(degrees).
Uranium One Inc. Akbastau Uranium Mine
Report No: R216.2013 182
“Directional Survey” sheet includes fields: Drillhole, Depth (m), Dip (deg), Azimuth
(deg), Coordinate X (m), Coordinate Y (m), Coordinate Z (m), Coordinate increment
between points along X-axis (m), Coordinate increment between points along Y-
axis (m), Coordinate increment between points along Z-axis (m) and Horizontal
equivalent (m).
There are sheets added with comparison of data of different types for each hole.
Database Creation
DigiMine software was used for initial database creation and validation of the source data.
The data was then converted from DigiMine to Micromine and an additional check was
performed.
Loading and Checking of Drillhole Collar Tables.
The data on drillhole collars was loaded from collar coordinate tables whereby the following
observations / corrections were made:
For many drillholes there are planned but not actual coordinates specified in the
source data in the collar coordinates tables. In this regard, for the coordinates of
the most of the drillholes of Areas 1 and 3, there was a table provided with actual
coordinates which were used to form the database instead of the data from GKlet
tables.
Drillhole coordinates were provided in 2 different relative coordinate systems, one
of which was used for Area 2 and at a later stage of studying Areas 1, 3 and 4. The
other system was used at earlier stages of studying Areas 1, 3 and 4. The
conversion factor from the second to the first system for coordinate X (Easting)
was + 78,000, for coordinate Y (Northing) was – 122,000.
Drillhole 1-10-283-5 had incorrect coordinates and is located far beyond the
boundaries of the deposit.
The location of drillhole collars was checked by transferring the drillholes from the
database onto the physical and geological maps from the reports with resource
estimate, which showed a good reproducibility of results.
To perform further conversion into Micromine a DepthMM field was created which
differed from the source data by 0.1 m. This is based on the fact that the start of
the last interval of the source measurements coincides with drillhole bottom. In
order to make conversion of data to Micromine possible the depth of a drillhole
must not be less than the end of the last interval.
Loading and Checking of Survey Tables
Drillhole survey data was loaded from survey tables whereby the following adjustments to
the data were made:
Uranium One Inc. Akbastau Uranium Mine
Report No: R216.2013 183
Survey data missing at 0 interval – calculation was completed in DigiMine
Drillhole azimuths greater than 360o, adjustments were made by deducting 360o
from such value
Survey measurement points that exceeded the drillhole depth were excluded
Only magnetic azimuth was provided in the source data with no corrections for
magnetic inclination, hence the true azimuth could not be calculated. However,
given the vertical position of the drillholes this error is not considered critical.
A check of drillhole locations was performed by loading the coordinates of survey
measurement points from GKlet source files into Micromine and calculating drillhole traces.
The maximum difference of coordinates horizontally is 3.2 m (average of 0.03 m).
Loading and Checking of Assay Tables
The assay tables included the following data:
Tables of GL and PFN initial measurements and sampling
Tables of interpretation of mineralized intervals as per gamma-logging and
sampling
Table of anomalous intersections (mineralized horizons)
Tables of grain size classification.
In the process of entering the sampling tables into the database, the data was corrected in
the following cases:
Assay intervals exceeding drillhole depth – corrections were made to the drillhole
depth, in which case in all the holes, without exception, there was a depth field
created for Micromine which exceeded the depth specified in the catalogue by 0.1
m (due to the fact that the end of the hole usually matched the value of the
beginning of the last interval in the initial log tables)
Search and correction of overlapping intervals
o Overlapping intervals were mainly found in the initial GL tables due to a great number of digits after the decimal point. These values were rounded to the second digit after the decimal point, thus overlapping of intervals were removed.
o Intervals of sub-economic intersections (with the prefix “sub”), which are often a sub-population of economic cumulative intervals, were calculated separately in the tables of interpreted mineralized intervals. In case of interval overlapping the sub-economic intervals were removed.
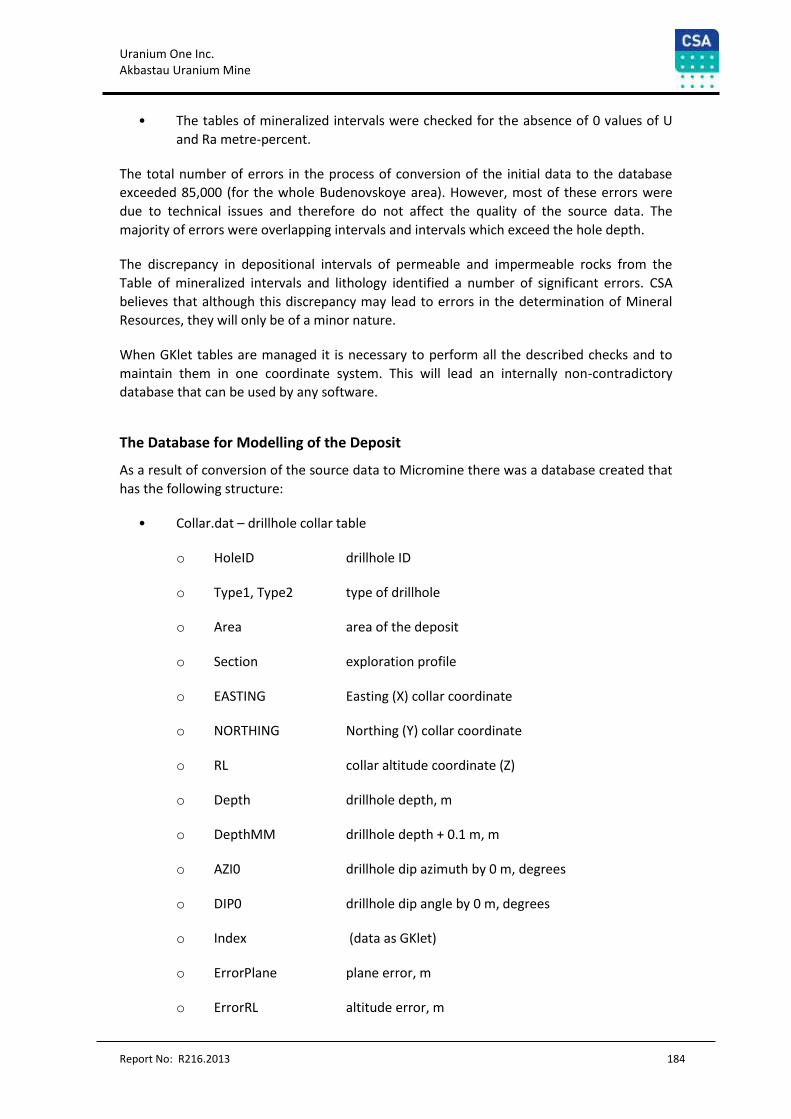
Uranium One Inc. Akbastau Uranium Mine
Report No: R216.2013 184
• The tables of mineralized intervals were checked for the absence of 0 values of U
and Ra metre-percent.
The total number of errors in the process of conversion of the initial data to the database
exceeded 85,000 (for the whole Budenovskoye area). However, most of these errors were
due to technical issues and therefore do not affect the quality of the source data. The
majority of errors were overlapping intervals and intervals which exceed the hole depth.
The discrepancy in depositional intervals of permeable and impermeable rocks from the
Table of mineralized intervals and lithology identified a number of significant errors. CSA
believes that although this discrepancy may lead to errors in the determination of Mineral
Resources, they will only be of a minor nature.
When GKlet tables are managed it is necessary to perform all the described checks and to
maintain them in one coordinate system. This will lead an internally non-contradictory
database that can be used by any software.
The Database for Modelling of the Deposit
As a result of conversion of the source data to Micromine there was a database created that
has the following structure:
• Collar.dat – drillhole collar table
o HoleID drillhole ID
o Type1, Type2 type of drillhole
o Area area of the deposit
o Section exploration profile
o EASTING Easting (X) collar coordinate
o NORTHING Northing (Y) collar coordinate
o RL collar altitude coordinate (Z)
o Depth drillhole depth, m
o DepthMM drillhole depth + 0.1 m, m
o AZI0 drillhole dip azimuth by 0 m, degrees
o DIP0 drillhole dip angle by 0 m, degrees
o Index (data as GKlet)
o ErrorPlane plane error, m
o ErrorRL altitude error, m
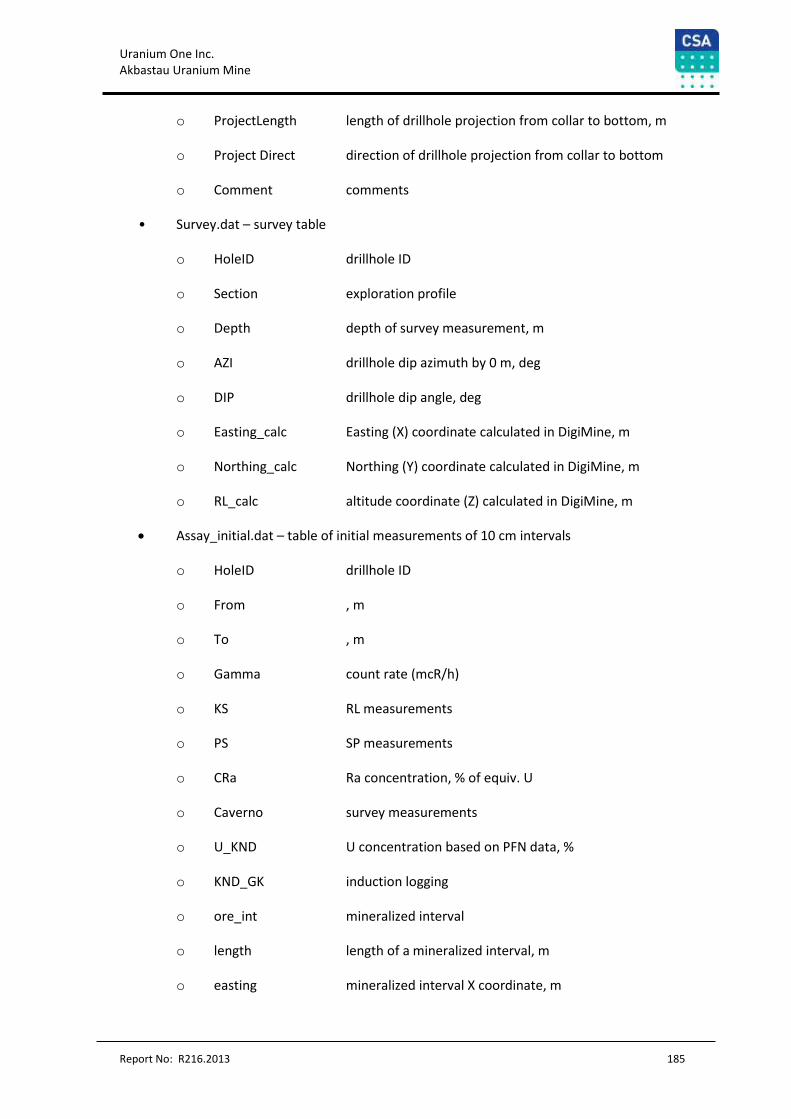
Uranium One Inc. Akbastau Uranium Mine
Report No: R216.2013 185
o ProjectLength length of drillhole projection from collar to bottom, m
o Project Direct direction of drillhole projection from collar to bottom
o Comment comments
• Survey.dat – survey table
o HoleID drillhole ID
o Section exploration profile
o Depth depth of survey measurement, m
o AZI drillhole dip azimuth by 0 m, deg
o DIP drillhole dip angle, deg
o Easting_calc Easting (X) coordinate calculated in DigiMine, m
o Northing_calc Northing (Y) coordinate calculated in DigiMine, m
o RL_calc altitude coordinate (Z) calculated in DigiMine, m
Assay_initial.dat – table of initial measurements of 10 cm intervals
o HoleID drillhole ID
o From , m
o To , m
o Gamma count rate (mcR/h)
o KS RL measurements
o PS SP measurements
o CRa Ra concentration, % of equiv. U
o Caverno survey measurements
o U_KND U concentration based on PFN data, %
o KND_GK induction logging
o ore_int mineralized interval
o length length of a mineralized interval, m
o easting mineralized interval X coordinate, m
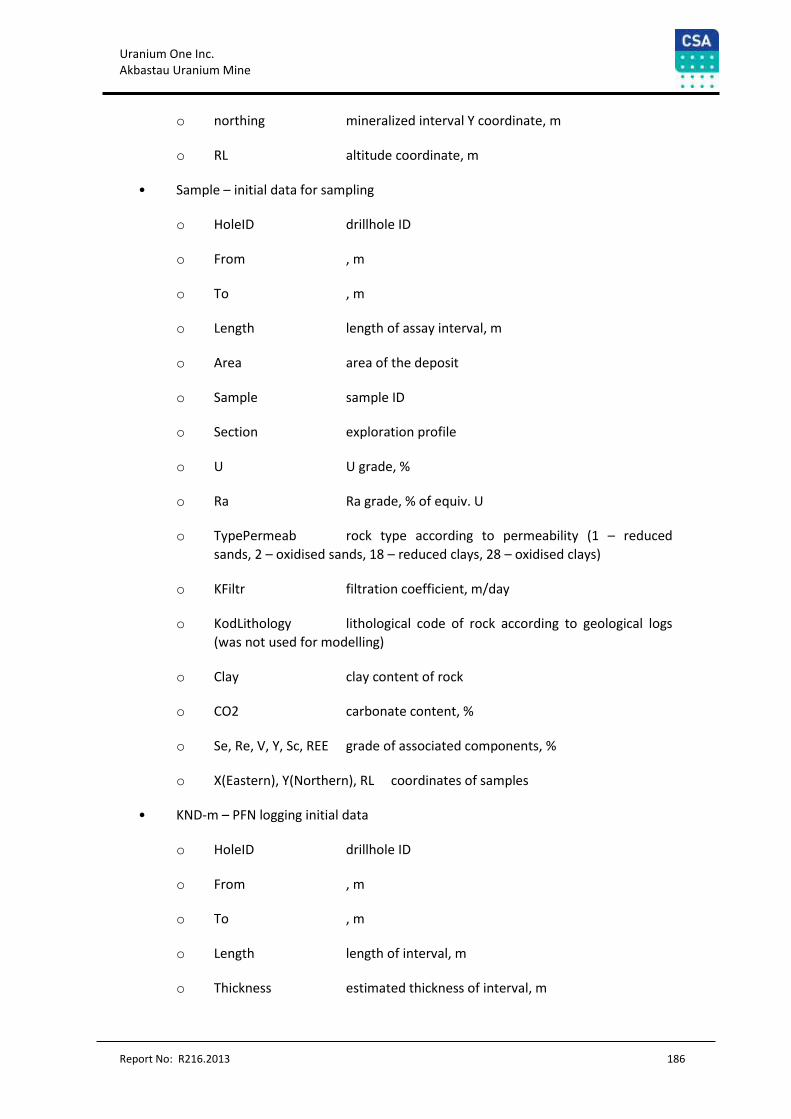
Uranium One Inc. Akbastau Uranium Mine
Report No: R216.2013 186
o northing mineralized interval Y coordinate, m
o RL altitude coordinate, m
• Sample – initial data for sampling
o HoleID drillhole ID
o From , m
o To , m
o Length length of assay interval, m
o Area area of the deposit
o Sample sample ID
o Section exploration profile
o U U grade, %
o Ra Ra grade, % of equiv. U
o TypePermeab rock type according to permeability (1 – reduced
sands, 2 – oxidised sands, 18 – reduced clays, 28 – oxidised clays)
o KFiltr filtration coefficient, m/day
o KodLithology lithological code of rock according to geological logs
(was not used for modelling)
o Clay clay content of rock
o CO2 carbonate content, %
o Se, Re, V, Y, Sc, REE grade of associated components, %
o X(Eastern), Y(Northern), RL coordinates of samples
• KND-m – PFN logging initial data
o HoleID drillhole ID
o From , m
o To , m
o Length length of interval, m
o Thickness estimated thickness of interval, m
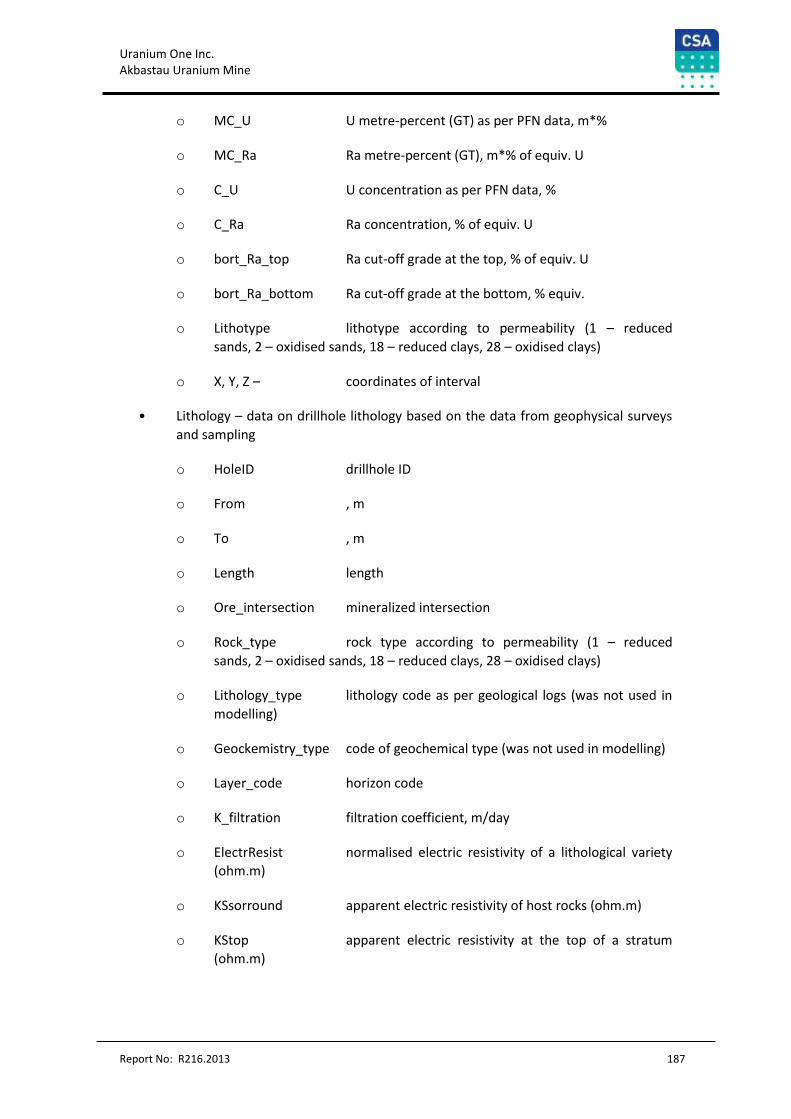
Uranium One Inc. Akbastau Uranium Mine
Report No: R216.2013 187
o MC_U U metre-percent (GT) as per PFN data, m*%
o MC_Ra Ra metre-percent (GT), m*% of equiv. U
o C_U U concentration as per PFN data, %
o C_Ra Ra concentration, % of equiv. U
o bort_Ra_top Ra cut-off grade at the top, % of equiv. U
o bort_Ra_bottom Ra cut-off grade at the bottom, % equiv.
o Lithotype lithotype according to permeability (1 – reduced
sands, 2 – oxidised sands, 18 – reduced clays, 28 – oxidised clays)
o X, Y, Z – coordinates of interval
• Lithology – data on drillhole lithology based on the data from geophysical surveys
and sampling
o HoleID drillhole ID
o From , m
o To , m
o Length length
o Ore_intersection mineralized intersection
o Rock_type rock type according to permeability (1 – reduced
sands, 2 – oxidised sands, 18 – reduced clays, 28 – oxidised clays)
o Lithology_type lithology code as per geological logs (was not used in
modelling)
o Geockemistry_type code of geochemical type (was not used in modelling)
o Layer_code horizon code
o K_filtration filtration coefficient, m/day
o ElectrResist normalised electric resistivity of a lithological variety
(ohm.m)
o KSsorround apparent electric resistivity of host rocks (ohm.m)
o KStop apparent electric resistivity at the top of a stratum
(ohm.m)
Uranium One Inc. Akbastau Uranium Mine
Report No: R216.2013 188
o KSbottom apparent electric resistivity at the bottom of a stratum
(ohm.m)
o Index interval index (as per GKlet data)
o PS_mean Average value of spontaneous potential of U
o PS_max Maximum value of spontaneous potential of U (shale
line)
o X(eastern), Y(northern), RL interval coordinates
• Lithology_KS – data on drillhole lithology based on the data from geophysical
surveys
o HoleID drillhole ID
o From , m
o To , m
o Length length
o ore_intersection mineralized intersection
o Type_perneability rock type according to permeability (1 – reduced
sands, 2 – oxidised sands, 18 – reduced clays, 28 – oxidised clays)
o Type_lithology code of rock lithology (was not used in modelling)
o K_filtration filtration coefficient, m/day
o electrResist normalised electric resistivity of a lithological variety
(ohm.m)
o KS_rock apparent electric resistivity of host rocks (ohm.m)
o KS_top apparent electric resistivity at the top of a stratum
(ohm.m)
o KS_bottom apparent electric resistivity at the bottom of a stratum
(ohm.m)
o PS_mean Average value of spontaneous potential of U
o PS_max Maximum value of spontaneous potential of U (shale
line)
o X, Y, Z coordinates of interval
Uranium One Inc. Akbastau Uranium Mine
Report No: R216.2013 189
• Assay_oreinterval_gamma – mineralized intervals calculated based on gamma-
logging
o HoleID drillhole ID
o From , m
o To , m
o Length length of interval
o Area area of the deposit
o AnomInters anomalous horizon ID
o Section exploration profile
o Thickness thickness of interval, m
o MC_Ra Ra metre-percent (GT), m*% of equiv. U
o MC_U U metre-percent (GT), m*%
o Ra Ra grade, % of equiv. U
o U U grade, %
o Permeability rock type according to permeability (1 – reduced
sands, 2 – oxidised sands, 18 – reduced clays, 28 – oxidised clays)
o KFiltration filtration coefficient, m/day
o KRE Radioactive equilibrium factor,
o condition_contouring condition of contouring
o Ra_div_U ratio of Ra to U
o Morphology mineralized body morphological element
o morphology_number code of morphological element (1 – nose, 2 – wing, 3 –
residual)
o colour_interval colour of interval
o colour_top colour of interval top
o colour_bottom colour of interval bottom
• Assay_oreinterval_gamma – mineralized intervals calculated based on assaying
o HoleID drillhole ID
Uranium One Inc. Akbastau Uranium Mine
Report No: R216.2013 190
o From , m
o To , m
o Length thickness of interval, m
o Area area of the deposit
o Section exploration profile
o Thickness estimated thickness of interval
o U U grade, %
o Ra Ra grade, % of equiv. U
o MC_U U metre-percent (GT), m*%
o MC_Ra Ra metre-percent (GT), m*% of equiv. U
o KRE Radioactive equilibrium factor, %
o core_recov core recovery
o KFiltr filtration coefficient
o ThicknessRnInt thickness of interval of radon release
o Correct_Rn correction for Rn release
o Ra_Sample Ra grade as per sampling, % of equiv. U
o MCRaSample Ra metre-percent (GT) as per sampling, m*% of equiv.
U
o RaGamma Ra grade as per gamma-logging, % of equiv. U
o MCRaGamma Ra metre-percent (GT) as per gamma-logging, % of
equiv. U
o permeabilityType rock type according to permeability (1 – reduced
sands, 2 – oxidised sands, 18 – reduced clays, 28 – oxidised clays)
o Flushability flushability according to Terekhov
o Morphology mineralized body morphological element
o Colour_Int interval colour (Gr – grey, Y – yellow)
o Colour_Top colour of the top
o Colour_Bottom colour of the bottom
Uranium One Inc. Akbastau Uranium Mine
Report No: R216.2013 191
o Ra_bort_Top Ra cut-off grade at the top, % of equiv. U
o Ra_bort_Bottom Ra cut-off grade at the bottom, % of equiv. U
o U_bort_Top U cut-off grade at the top, %
o U_bort_Bottom U cut-off grade at the bottom, %
o condition_contouring – condition of contouring
o X(Eastern), Y(Northern), Z(RL) – interval coordinates
• Anomalous_intersection – anomalous intersections or mineralized horizons
o HoleID drillhole ID
o From , m
o To , m
o Length mineralized horizon length
o Anomalous horizon No (1- Zhalpak and above, 2 – Induk, 3 –
Mynkuduk, 4 – Paleozoic basement)
o Layer horizon name (Zhalpak, Inkuduk, Mynkuduk, pz –
Paleozoic basement)
o Section exploration profile
• Grading – data on rock grain size
o HoleID drillhole ID
o From , m
o To , m
o Length thickness
o Area area of the deposit
o _10, 5_10, 2_5, 1_2, 1_0.5, 0.5_0.25, 0.25_0.1, 0.1_0.05, 0.05_0.01,
0.01_0.005, 0.005_0.002, _0.002н distribution of grain size
classes in rock, %
o CO2 carbonate content, %
o assayCO2 number of sample for carbonate content, %
o X, Y, Z coordinates of interval
Uranium One Inc. Akbastau Uranium Mine
Report No: R216.2013 192
• Properties – data on rock grain size, an alternative table similar to Grading
• Ore_intervals_GKlet_U – data for mineralized intervals for which only primary data
and data of initial calculation of mineralized intervals were provided
o HoleID drillhole ID
o From , m
o To , m
o Thickness thickness of interval, %
o U,% U grade, %
o U, m% U metre-percent (GT), m*%
o KRR radioactive equilibrium factor (REF), %
o Type rock type according to permeability (1 – reduced
sands, 2 – oxidised sands, 18 – reduced clays, 28 – oxidised clays)
o Morphology mineralized body morphological element
o morphology 2 code of morphological element (1 – nose, 2 – wing, 3 –
residual)
o EASTING, NORTHING, RL interval coordinates
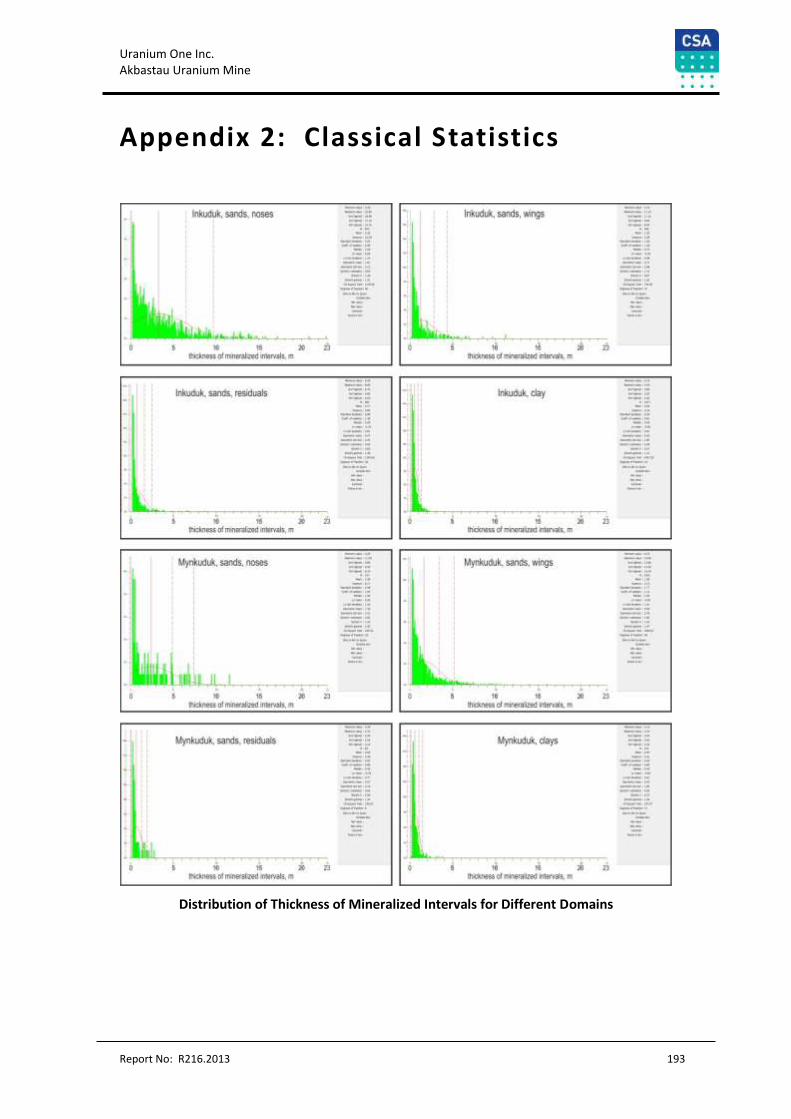
Uranium One Inc. Akbastau Uranium Mine
Report No: R216.2013 193
Appendix 2: Classical Statistics
Distribution of Thickness of Mineralized Intervals for Different Domains
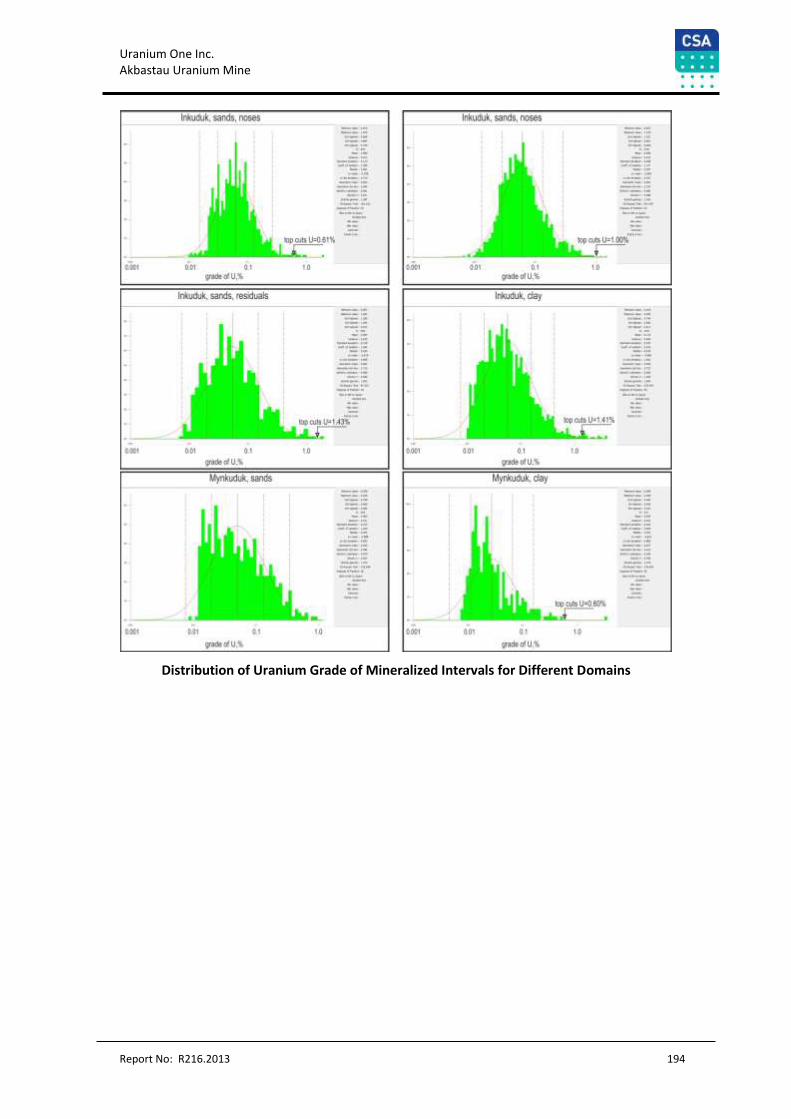
Uranium One Inc. Akbastau Uranium Mine
Report No: R216.2013 194
Distribution of Uranium Grade of Mineralized Intervals for Different Domains
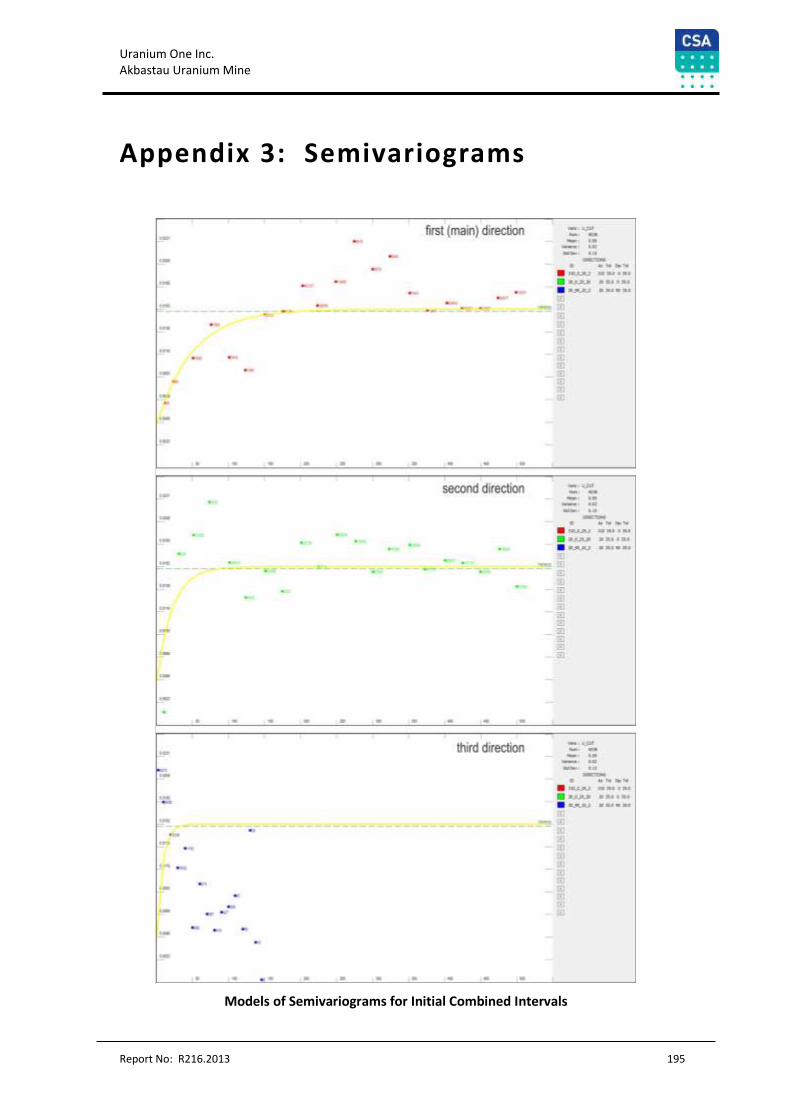
Uranium One Inc. Akbastau Uranium Mine
Report No: R216.2013 195
Appendix 3: Semivariograms
Models of Semivariograms for Initial Combined Intervals
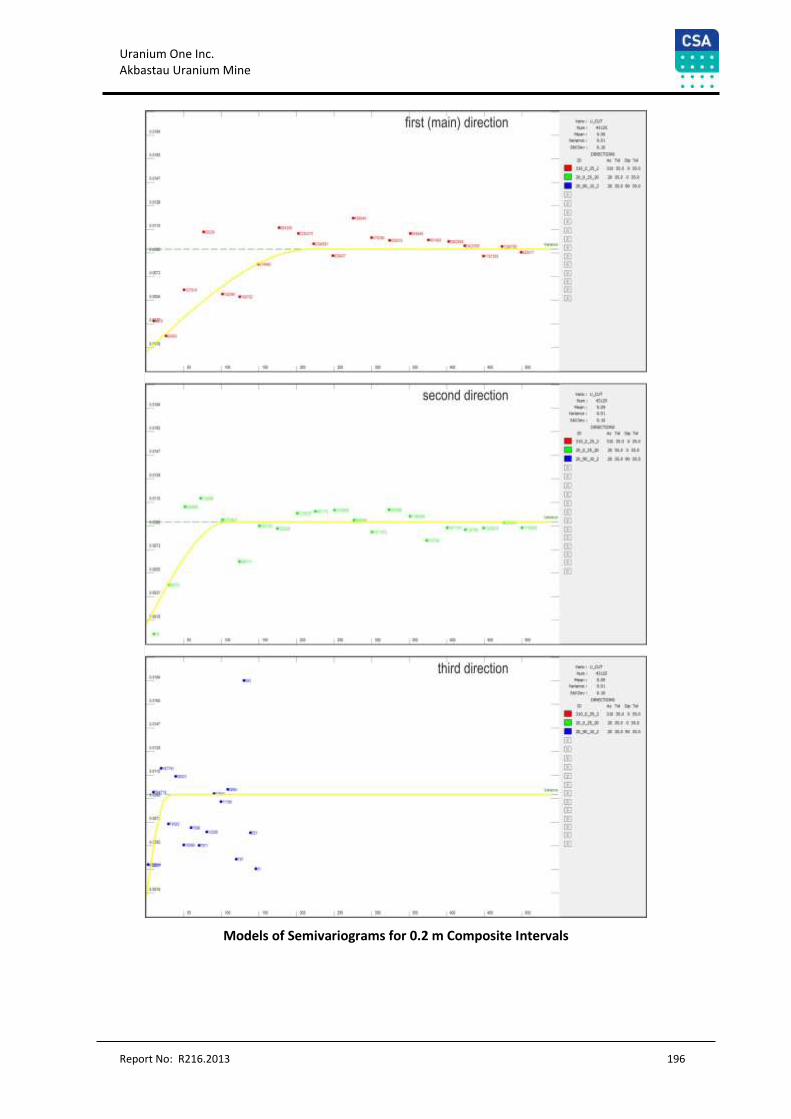
Uranium One Inc. Akbastau Uranium Mine
Report No: R216.2013 196
Models of Semivariograms for 0.2 m Composite Intervals
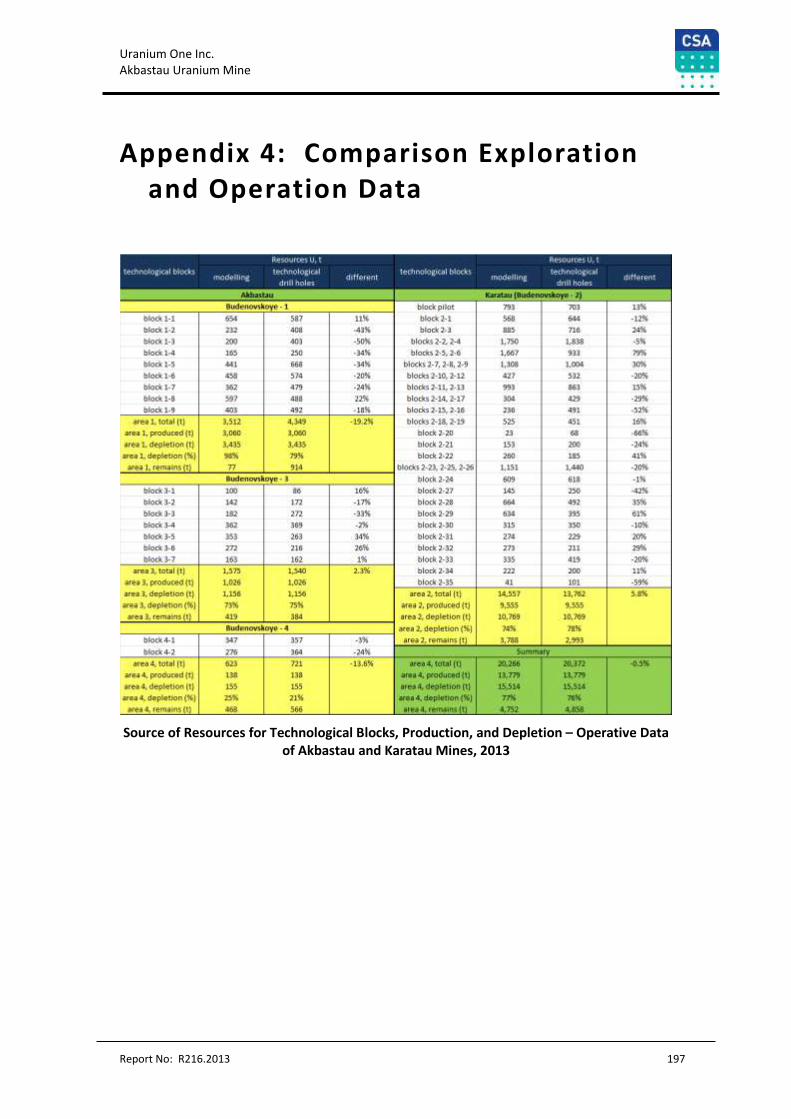
Uranium One Inc. Akbastau Uranium Mine
Report No: R216.2013 197
Appendix 4: Comparison Exploration and Operation Data
Source of Resources for Technological Blocks, Production, and Depletion – Operative Data of Akbastau and Karatau Mines, 2013
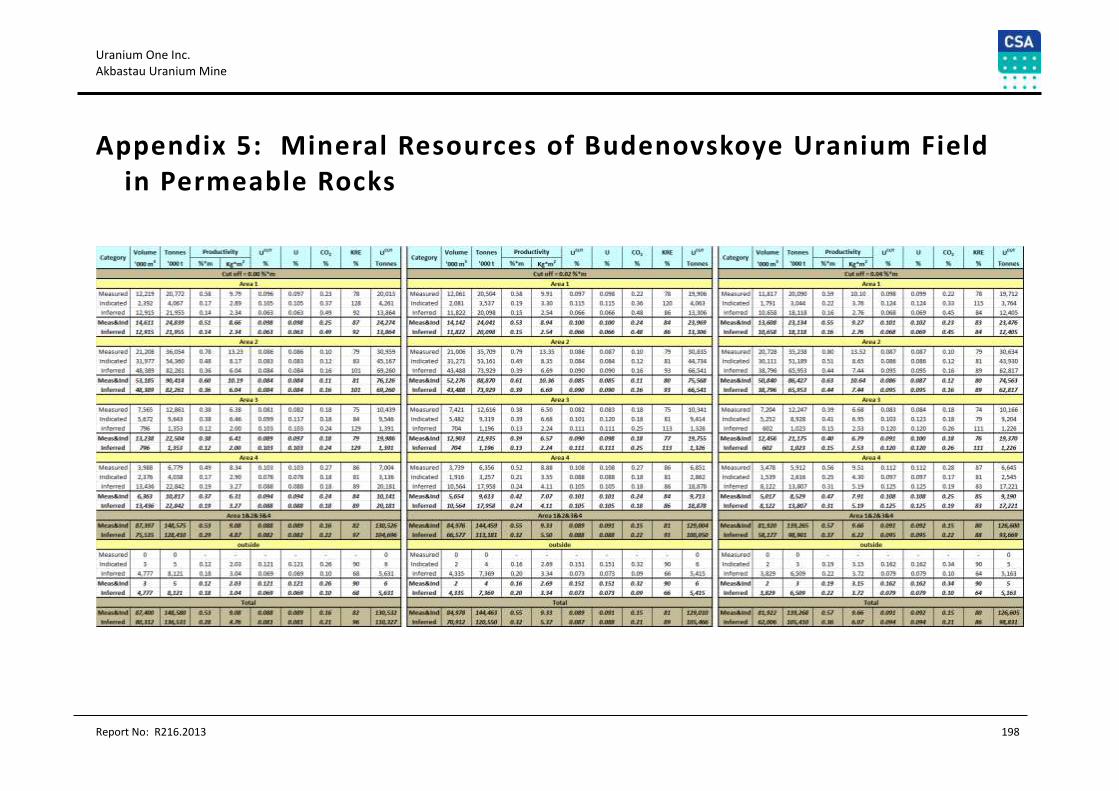
Uranium One Inc. Akbastau Uranium Mine
Report No: R216.2013 198
Appendix 5: Mineral Resources of Budenovskoye Uranium Field in Permeable Rocks
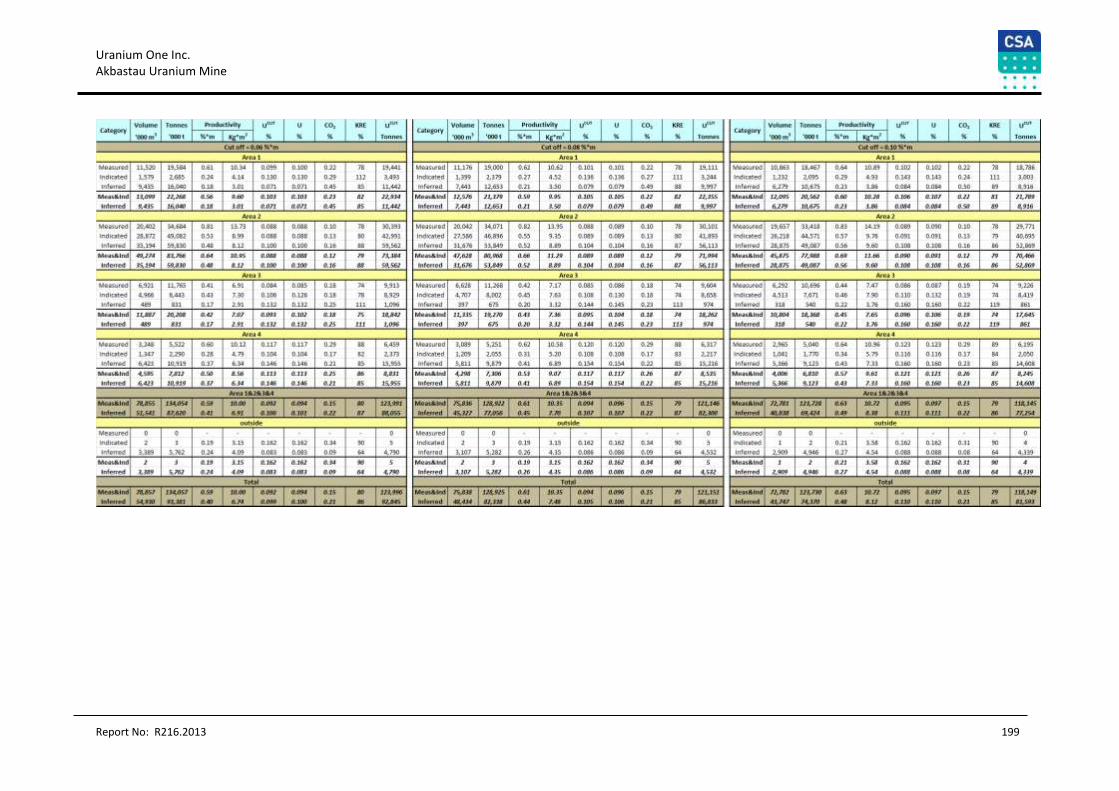
Uranium One Inc. Akbastau Uranium Mine
Report No: R216.2013 199
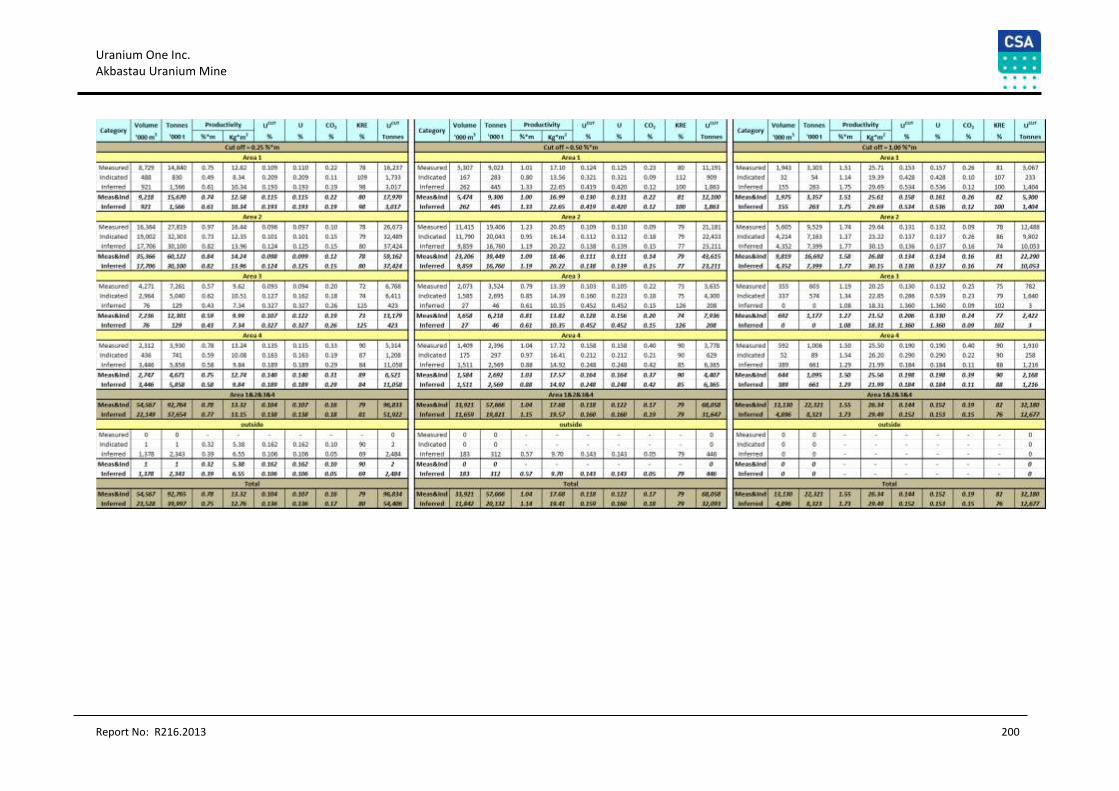
Uranium One Inc. Akbastau Uranium Mine
Report No: R216.2013 200
Uranium One Inc. Akbastau Uranium Mine
Report No: R216.2013 201
Appendix 6: Mineralization of Budenovskoye Uranium Field in Non-Permeable Rocks (Non-Extractable Mineralization)
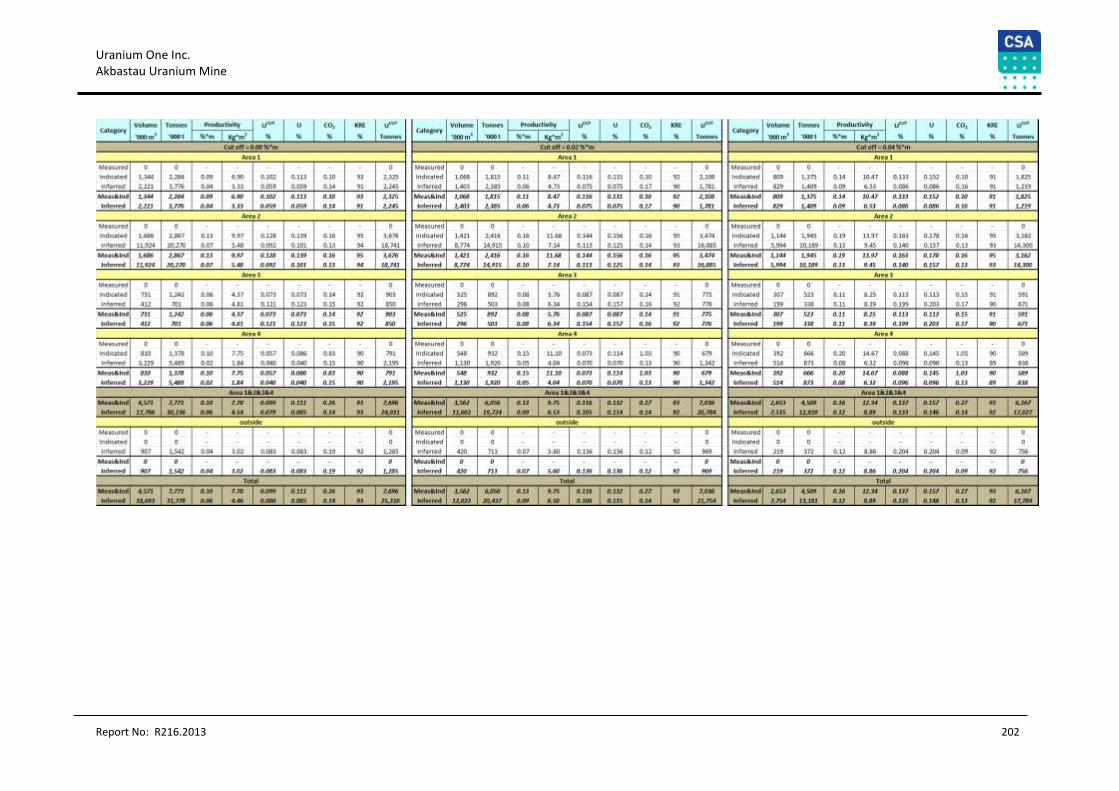
Uranium One Inc. Akbastau Uranium Mine
Report No: R216.2013 202
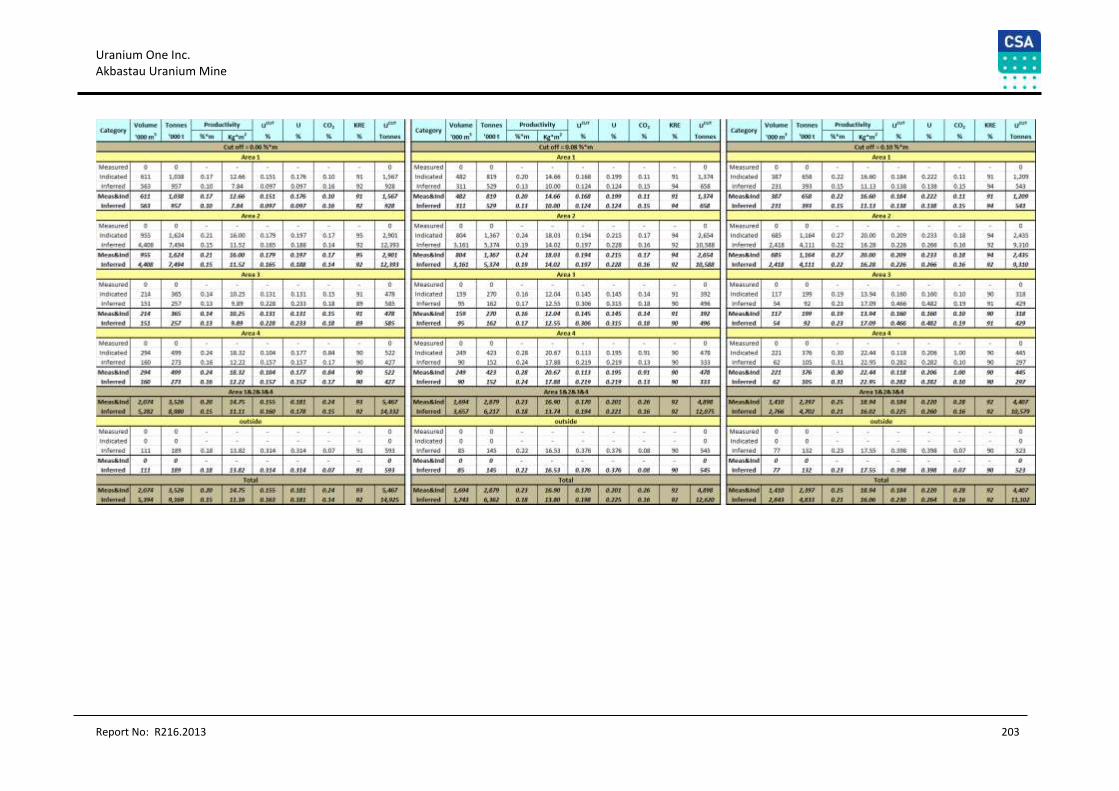
Uranium One Inc. Akbastau Uranium Mine
Report No: R216.2013 203
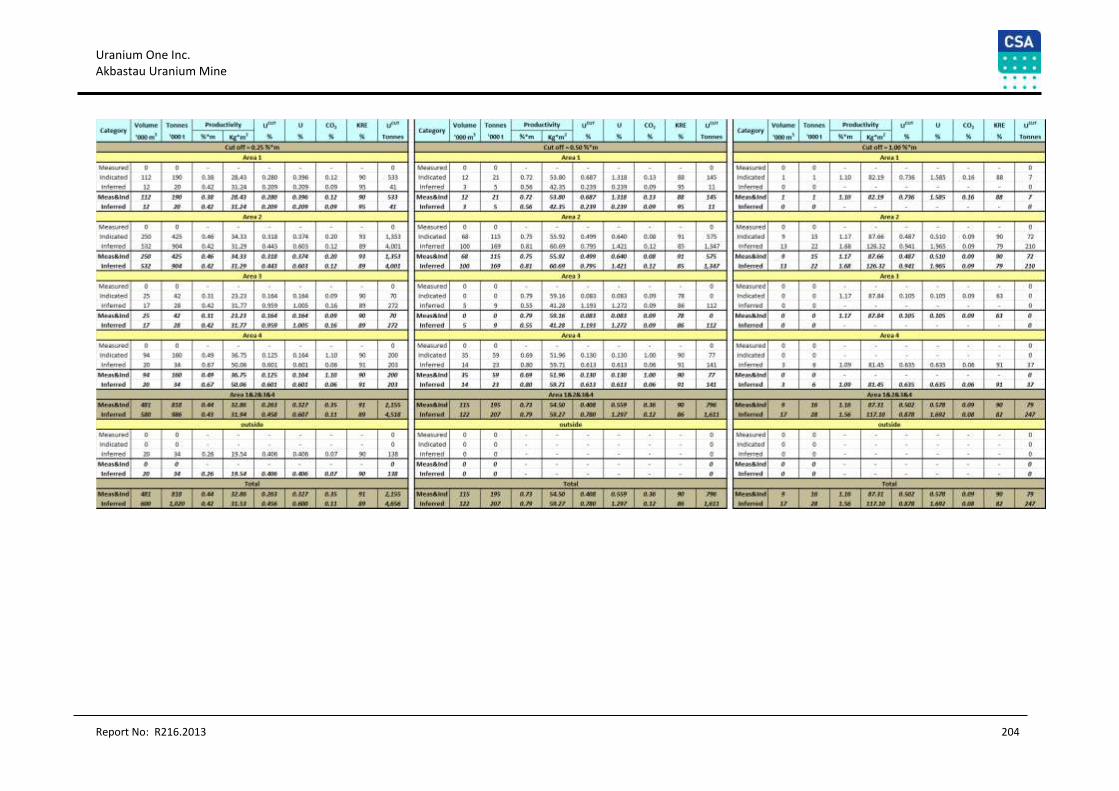
Uranium One Inc. Akbastau Uranium Mine
Report No: R216.2013 204
Uranium One Inc. Akbastau Uranium Mine
Report No: R216.2013 205
Appendix 7: Mineral Resources of Budenovskoye No. 1 in Permeable Rocks
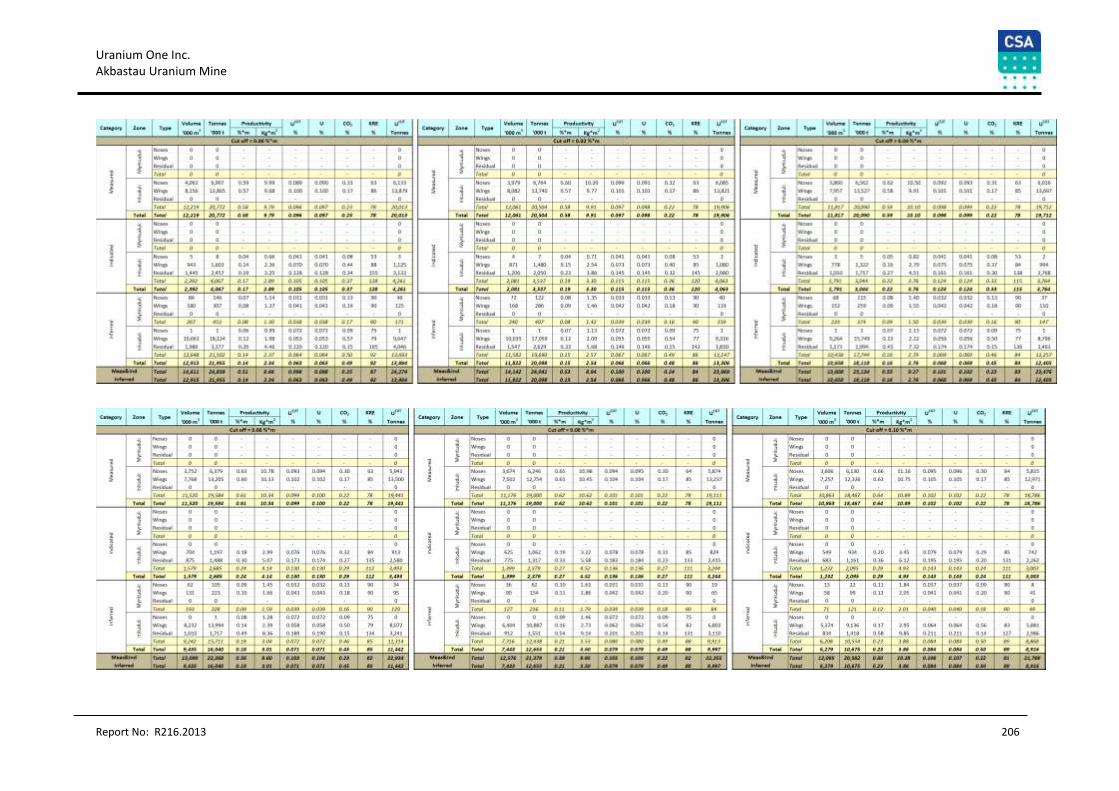
Uranium One Inc. Akbastau Uranium Mine
Report No: R216.2013 206
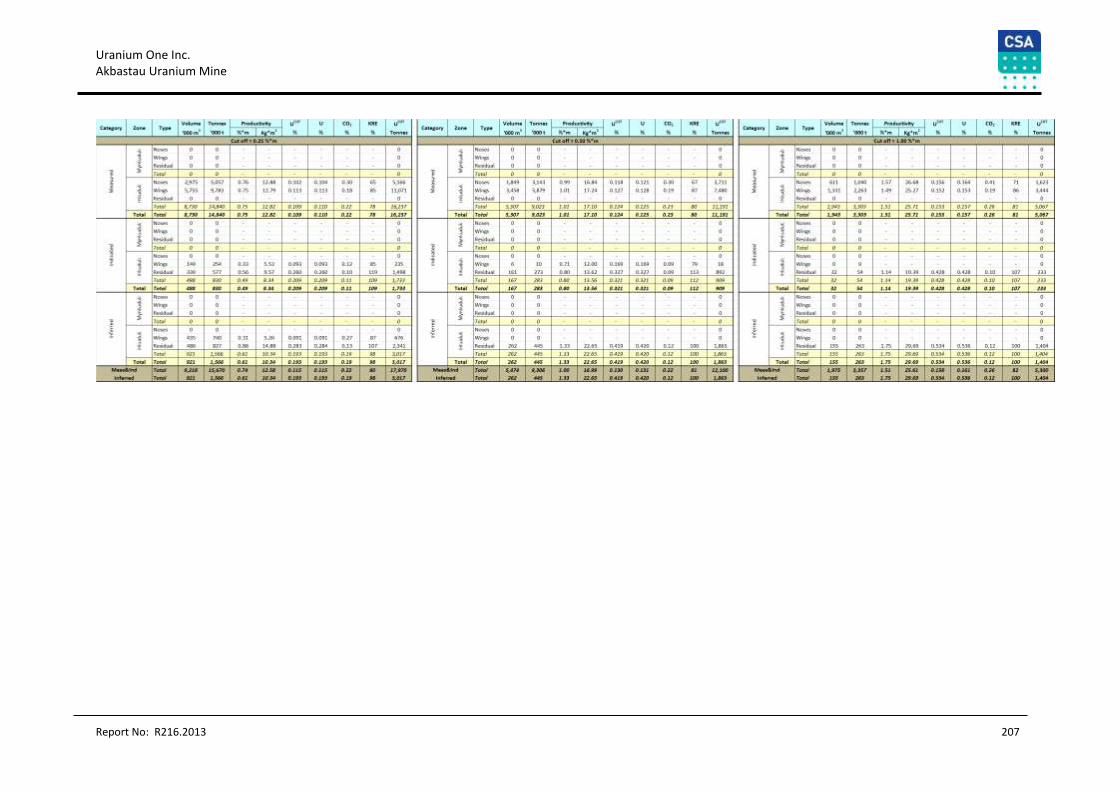
Uranium One Inc. Akbastau Uranium Mine
Report No: R216.2013 207

Uranium One Inc. Akbastau Uranium Mine
Report No: R216.2013 208
Appendix 8: Mineralization of Budenovskoye No. 1 in Non-Permeable Rocks (Non-Extractable Mineralization)
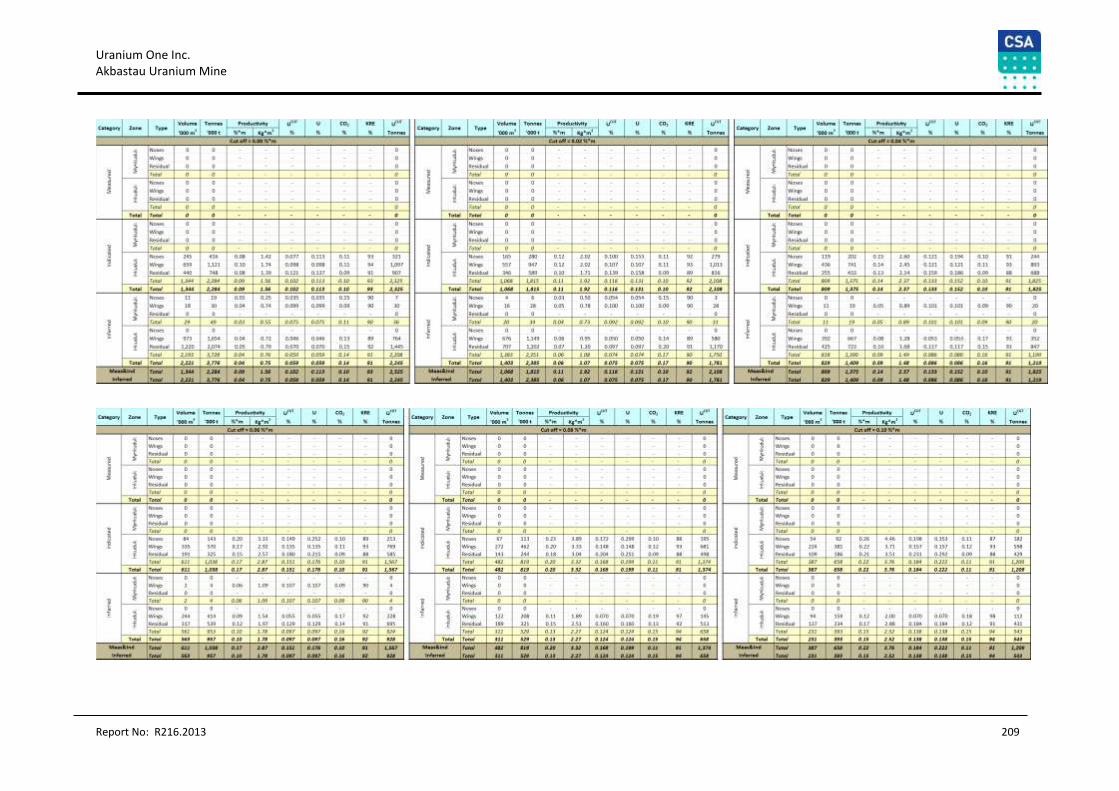
Uranium One Inc. Akbastau Uranium Mine
Report No: R216.2013 209
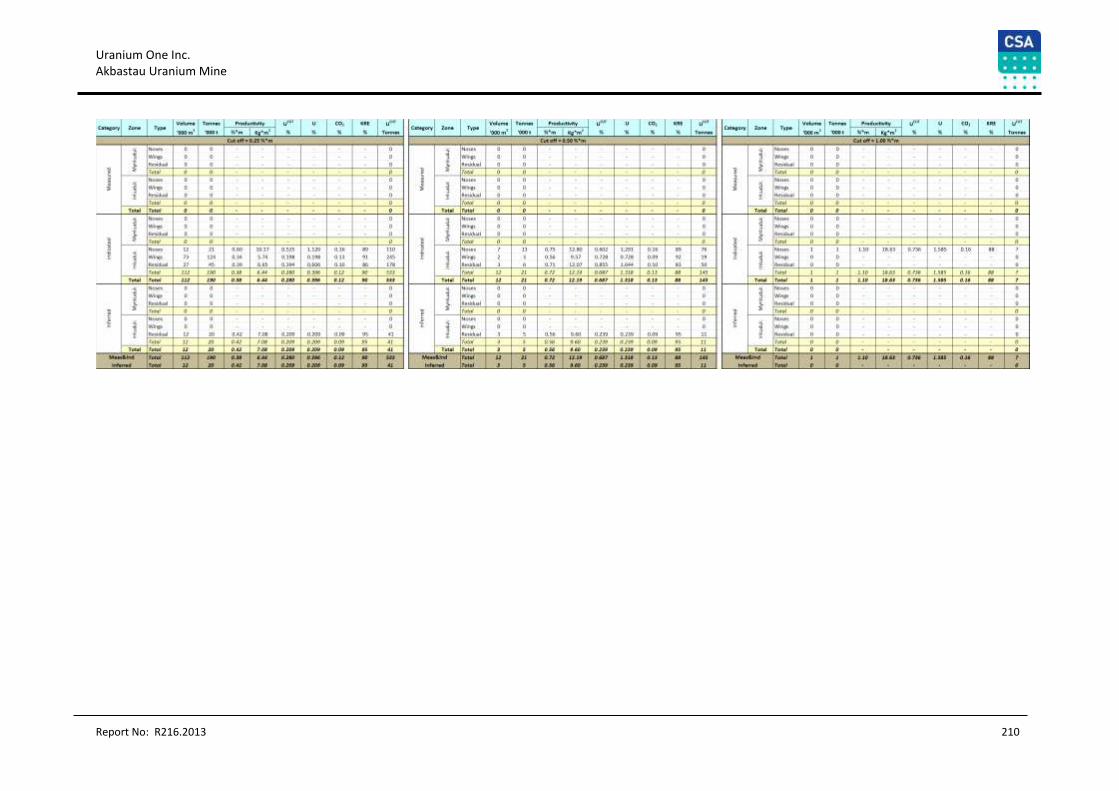
Uranium One Inc. Akbastau Uranium Mine
Report No: R216.2013 210

Uranium One Inc. Akbastau Uranium Mine
Report No: R216.2013 211
Appendix 9: Mineral Resources of Budenovskoye No. 3 in Permeable Rocks
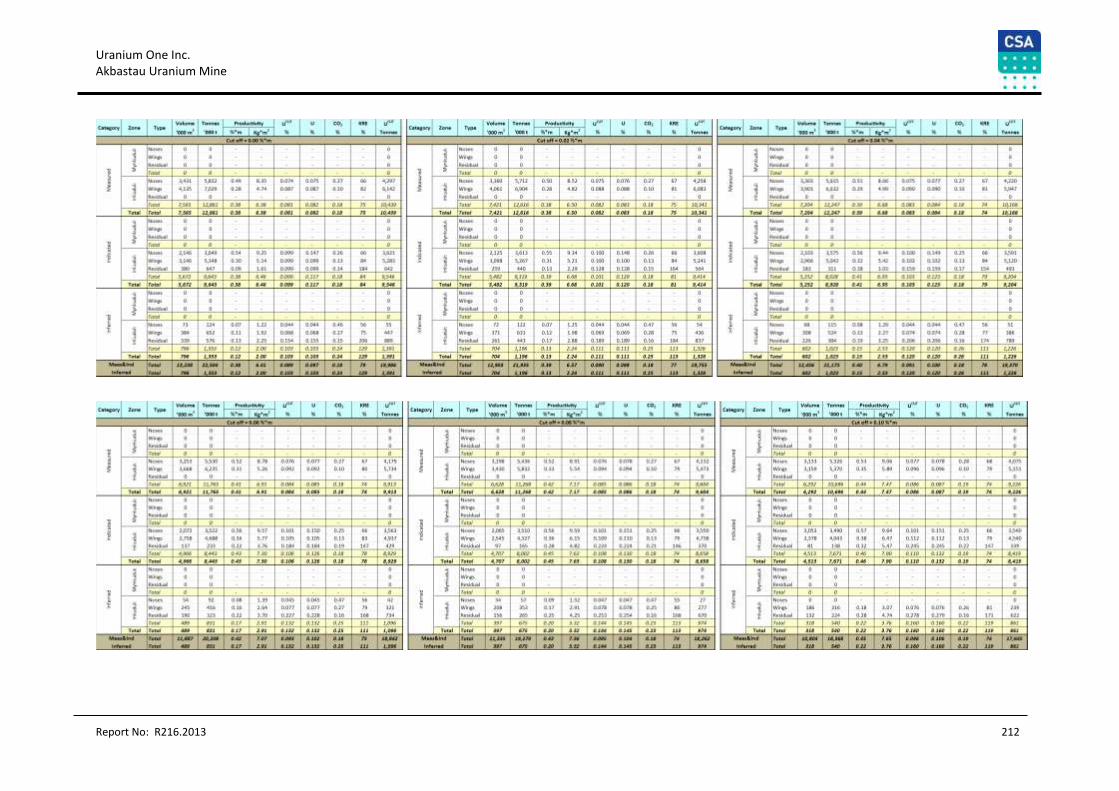
Uranium One Inc. Akbastau Uranium Mine
Report No: R216.2013 212
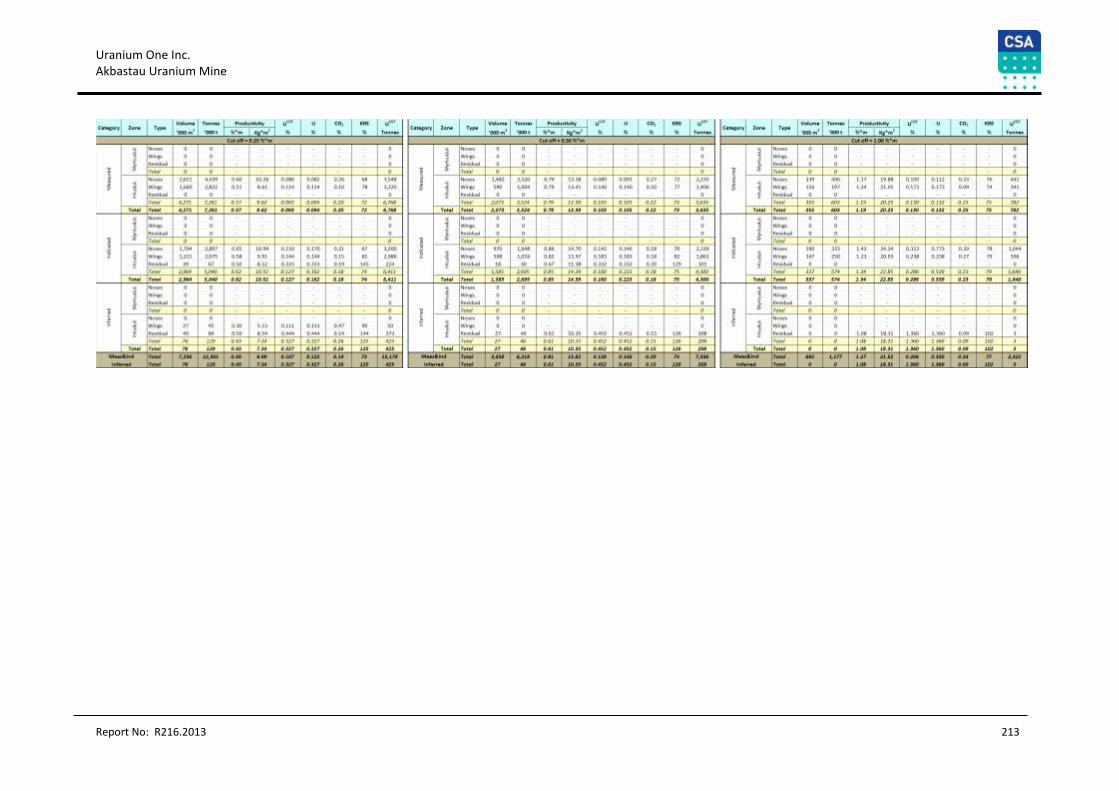
Uranium One Inc. Akbastau Uranium Mine
Report No: R216.2013 213
Uranium One Inc. Akbastau Uranium Mine
Report No: R216.2013 214
Appendix 10: Mineralization of Budenovskoye No. 3 in Non-Permeable Rocks (Non-Extractable Mineralization)
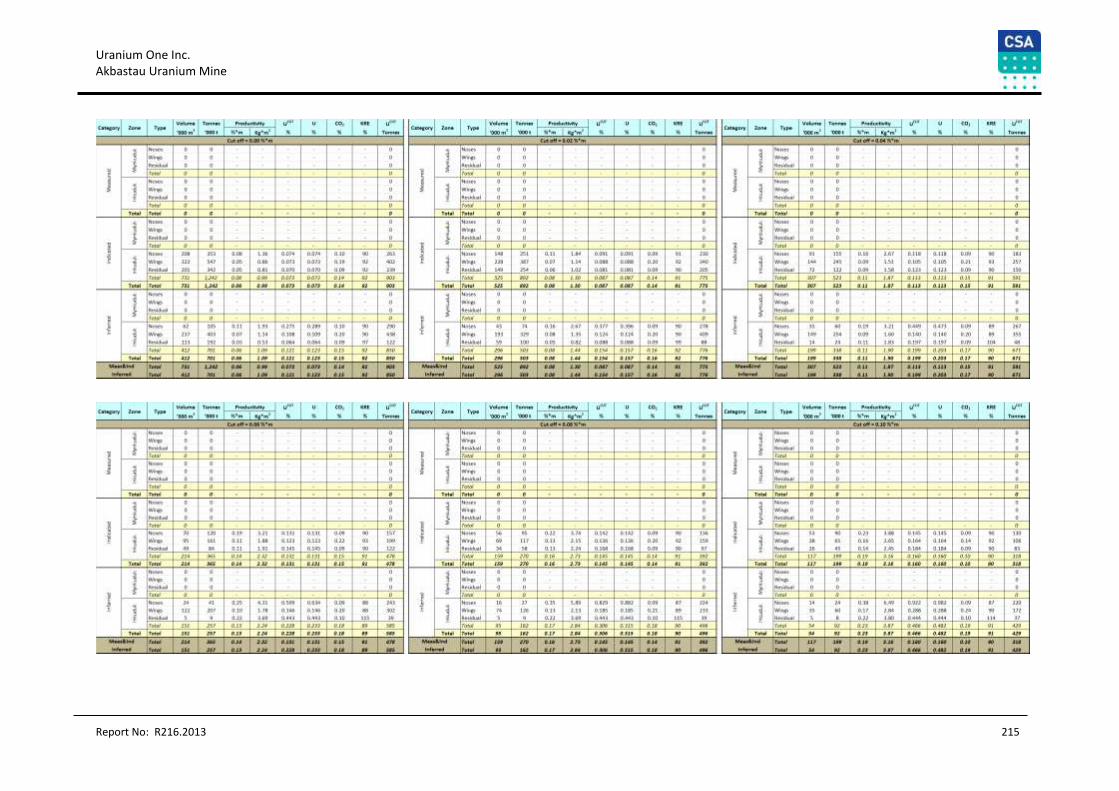
Uranium One Inc. Akbastau Uranium Mine
Report No: R216.2013 215
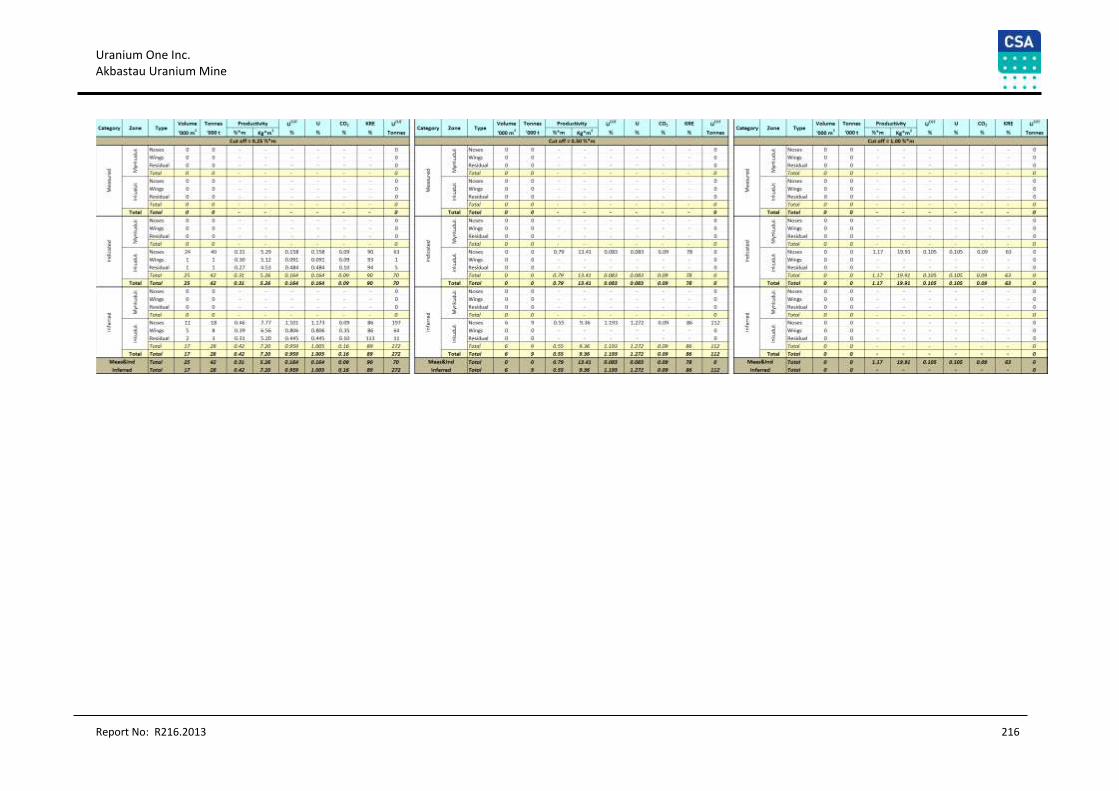
Uranium One Inc. Akbastau Uranium Mine
Report No: R216.2013 216

Uranium One Inc. Akbastau Uranium Mine
Report No: R216.2013 217
Appendix 11: Mineral Resources of Budenovskoye No. 4 in Permeable Rocks
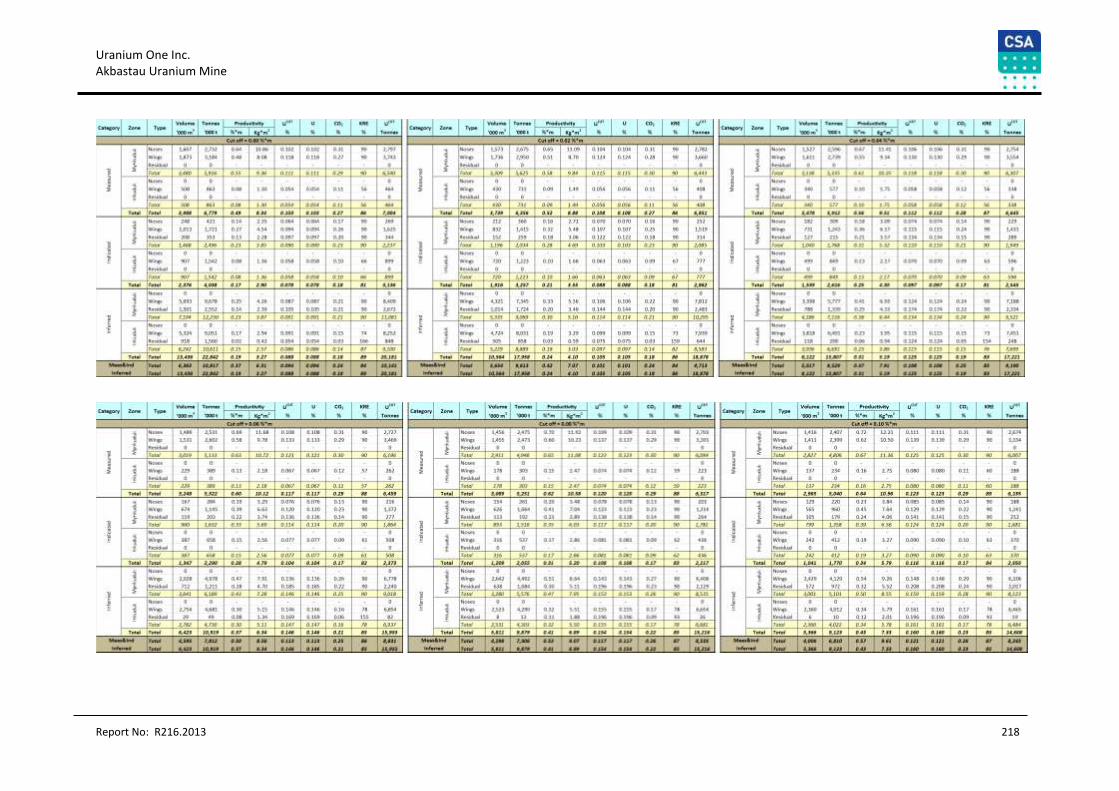
Uranium One Inc. Akbastau Uranium Mine
Report No: R216.2013 218
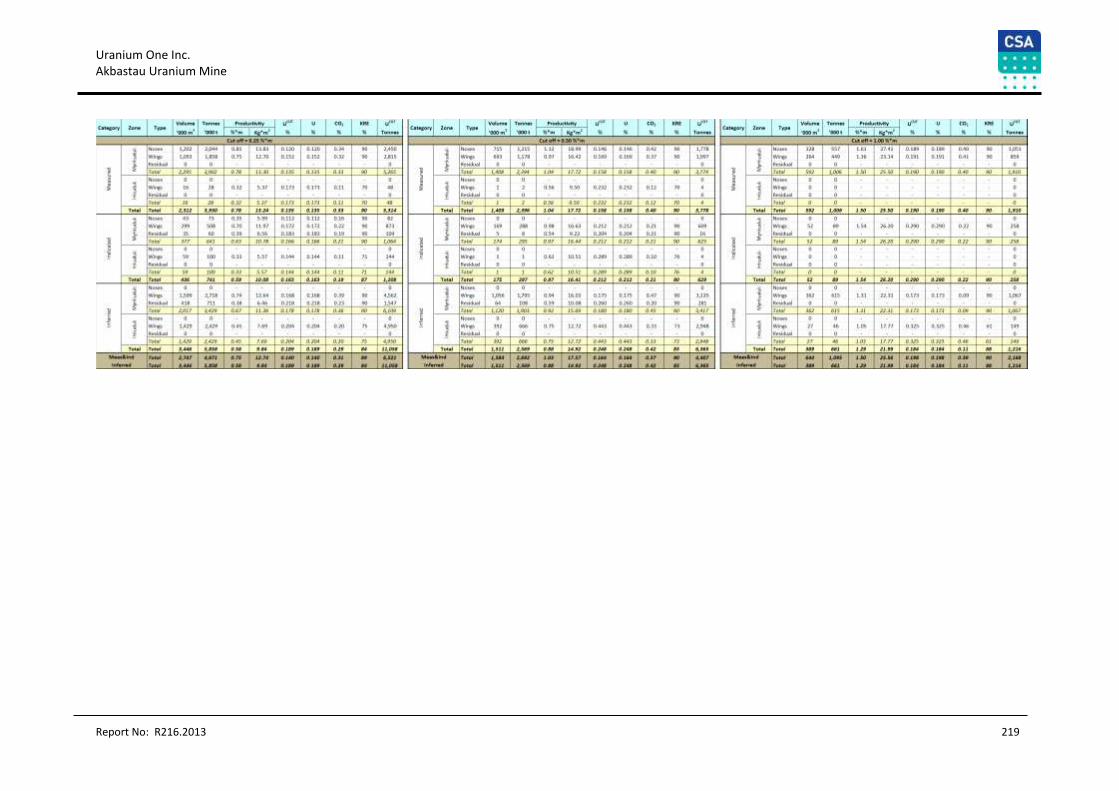
Uranium One Inc. Akbastau Uranium Mine
Report No: R216.2013 219
Uranium One Inc. Akbastau Uranium Mine
Report No: R216.2013 220
Appendix 12: Mineralization of Budenovskoye No. 4 in Non-Permeable Rocks (Non-Extractable Mineralization)
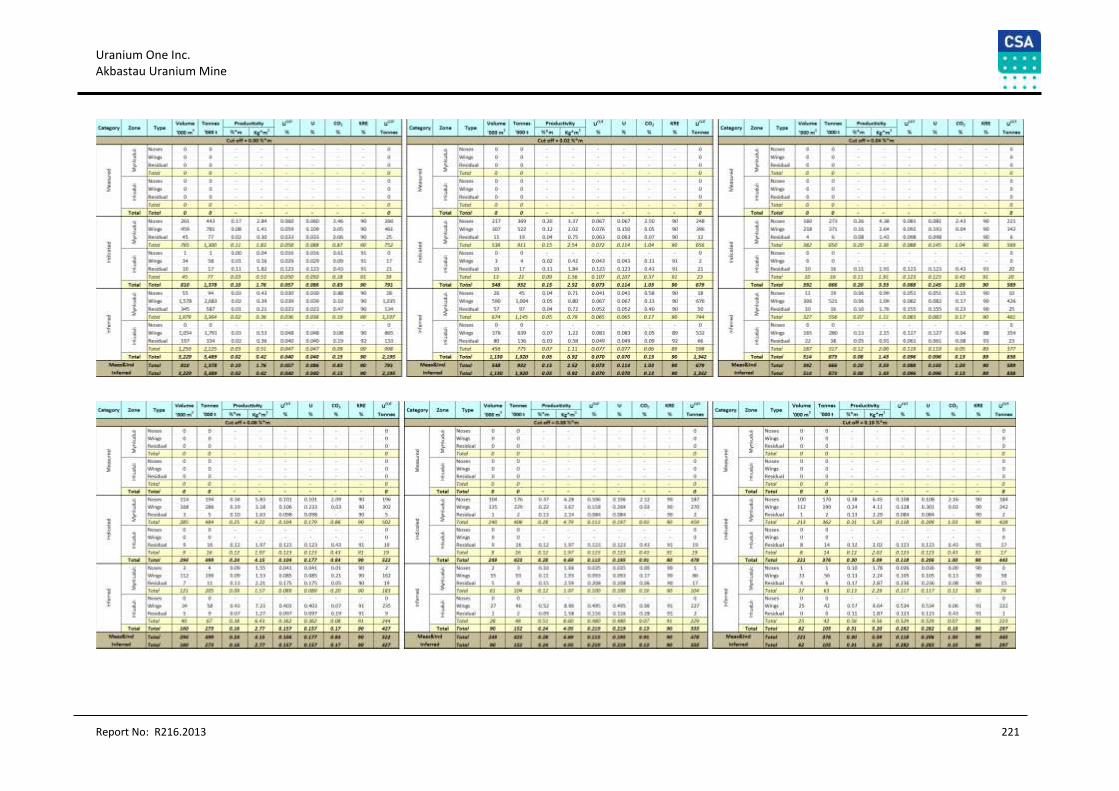
Uranium One Inc. Akbastau Uranium Mine
Report No: R216.2013 221
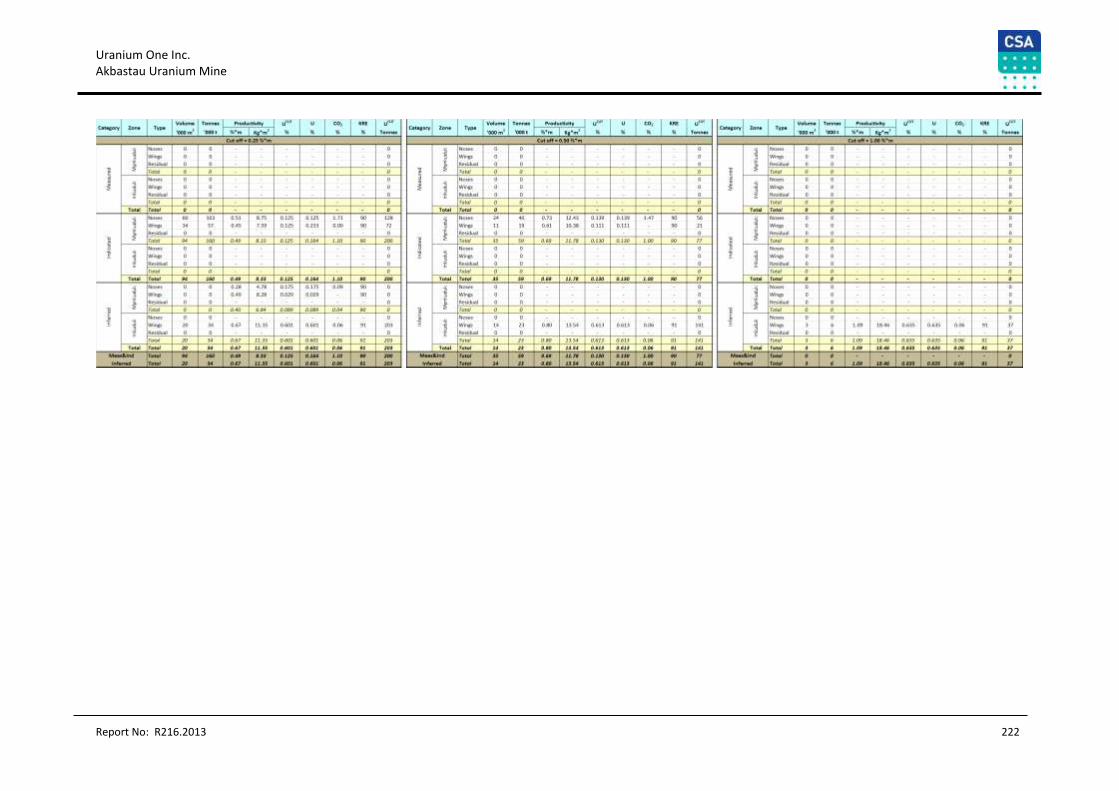
Uranium One Inc. Akbastau Uranium Mine
Report No: R216.2013 222
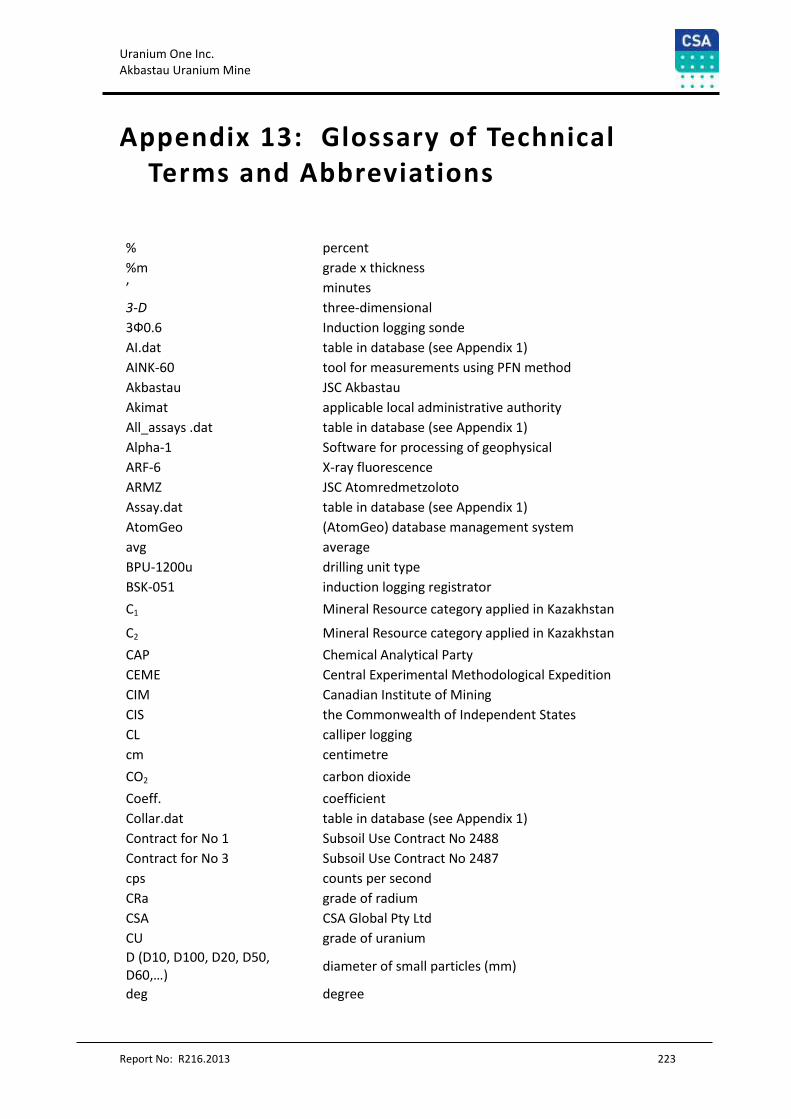
Uranium One Inc. Akbastau Uranium Mine
Report No: R216.2013 223
Appendix 13: Glossary of Technical Terms and Abbreviations
% percent
%m grade x thickness
’ minutes
3-D three-dimensional
3Ф0.6 Induction logging sonde
AI.dat table in database (see Appendix 1)
AINK-60 tool for measurements using PFN method
Akbastau JSC Akbastau
Akimat applicable local administrative authority
All_assays .dat table in database (see Appendix 1)
Alpha-1 Software for processing of geophysical
ARF-6 X-ray fluorescence
ARMZ JSC Atomredmetzoloto
Assay.dat table in database (see Appendix 1)
AtomGeo (AtomGeo) database management system
avg average
BPU-1200u drilling unit type
BSK-051 induction logging registrator
C1 Mineral Resource category applied in Kazakhstan
C2 Mineral Resource category applied in Kazakhstan
CAP Chemical Analytical Party
CEME Central Experimental Methodological Expedition
CIM Canadian Institute of Mining
CIS the Commonwealth of Independent States
CL calliper logging
cm centimetre
CO2 carbon dioxide
Coeff. coefficient
Collar.dat table in database (see Appendix 1)
Contract for No 1 Subsoil Use Contract No 2488
Contract for No 3 Subsoil Use Contract No 2487
cps counts per second
CRa grade of radium
CSA CSA Global Pty Ltd
CU grade of uranium
D (D10, D100, D20, D50, D60,…)
diameter of small particles (mm)
deg degree
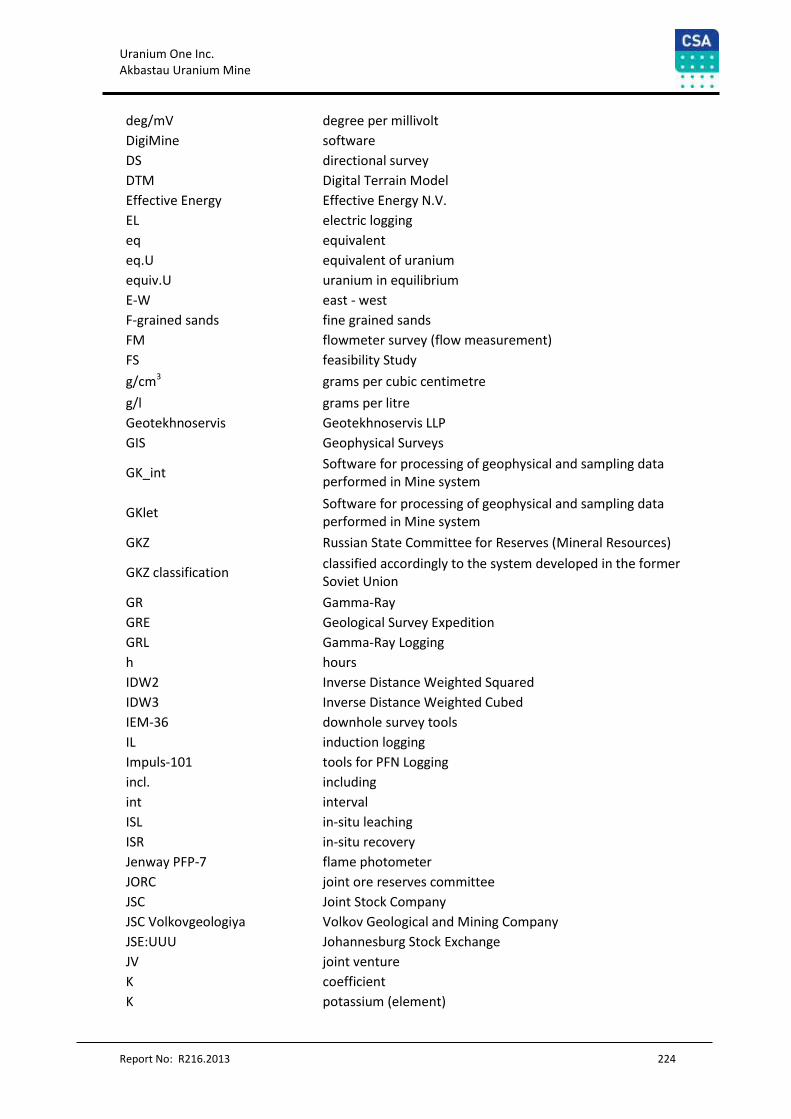
Uranium One Inc. Akbastau Uranium Mine
Report No: R216.2013 224
deg/mV degree per millivolt
DigiMine software
DS directional survey
DTM Digital Terrain Model
Effective Energy Effective Energy N.V.
EL electric logging
eq equivalent
eq.U equivalent of uranium
equiv.U uranium in equilibrium
E-W east - west
F-grained sands fine grained sands
FM flowmeter survey (flow measurement)
FS feasibility Study
g/cm3 grams per cubic centimetre
g/l grams per litre
Geotekhnoservis Geotekhnoservis LLP
GIS Geophysical Surveys
GK_int Software for processing of geophysical and sampling data performed in Mine system
GKlet Software for processing of geophysical and sampling data performed in Mine system
GKZ Russian State Committee for Reserves (Mineral Resources)
GKZ classification classified accordingly to the system developed in the former Soviet Union
GR Gamma-Ray
GRE Geological Survey Expedition
GRL Gamma-Ray Logging
h hours
IDW2 Inverse Distance Weighted Squared
IDW3 Inverse Distance Weighted Cubed
IEM-36 downhole survey tools
IL induction logging
Impuls-101 tools for PFN Logging
incl. including
int interval
ISL in-situ leaching
ISR in-situ recovery
Jenway PFP-7 flame photometer
JORC joint ore reserves committee
JSC Joint Stock Company
JSC Volkovgeologiya Volkov Geological and Mining Company
JSE:UUU Johannesburg Stock Exchange
JV joint venture
K coefficient
K potassium (element)
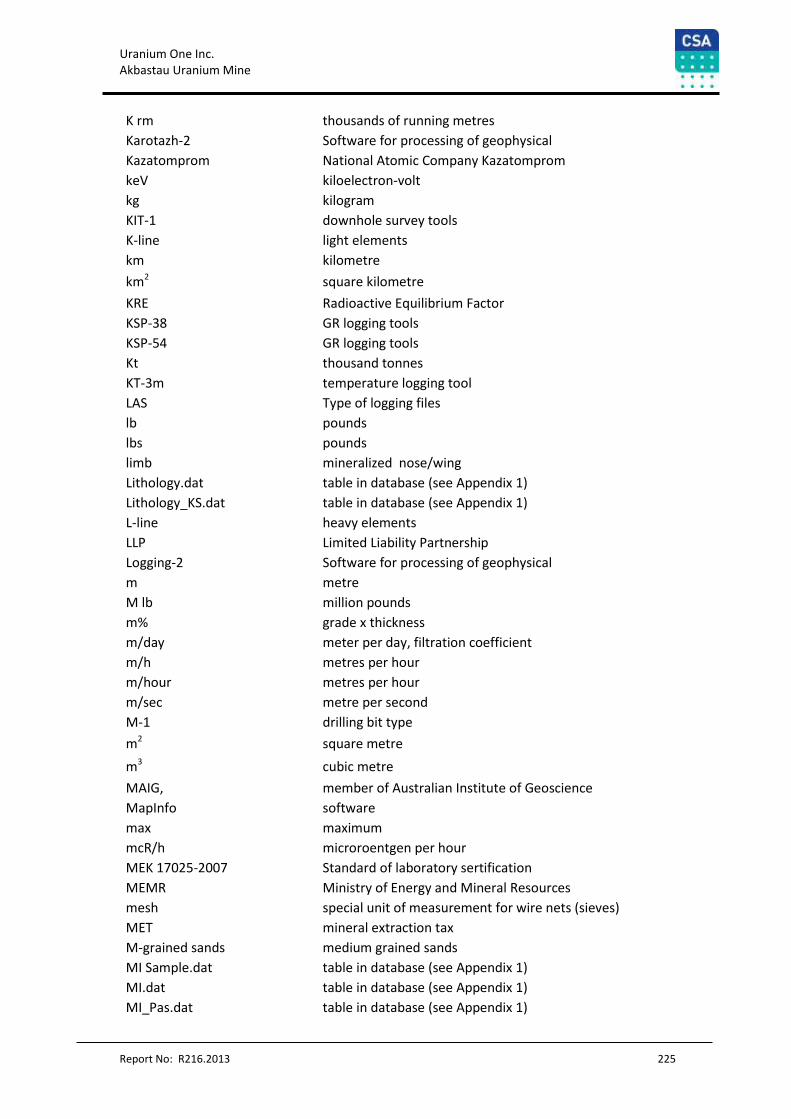
Uranium One Inc. Akbastau Uranium Mine
Report No: R216.2013 225
K rm thousands of running metres
Karotazh-2 Software for processing of geophysical
Kazatomprom National Atomic Company Kazatomprom
keV kiloelectron-volt
kg kilogram
KIT-1 downhole survey tools
K-line light elements
km kilometre
km2 square kilometre
KRE Radioactive Equilibrium Factor
KSP-38 GR logging tools
KSP-54 GR logging tools
Kt thousand tonnes
KT-3m temperature logging tool
LAS Type of logging files
lb pounds
lbs pounds
limb mineralized nose/wing
Lithology.dat table in database (see Appendix 1)
Lithology_KS.dat table in database (see Appendix 1)
L-line heavy elements
LLP Limited Liability Partnership
Logging-2 Software for processing of geophysical
m metre
M lb million pounds
m% grade x thickness
m/day meter per day, filtration coefficient
m/h metres per hour
m/hour metres per hour
m/sec metre per second
M-1 drilling bit type
m2 square metre
m3 cubic metre
MAIG, member of Australian Institute of Geoscience
MapInfo software
max maximum
mcR/h microroentgen per hour
MEK 17025-2007 Standard of laboratory sertification
MEMR Ministry of Energy and Mineral Resources
mesh special unit of measurement for wire nets (sieves)
MET mineral extraction tax
M-grained sands medium grained sands
MI Sample.dat table in database (see Appendix 1)
MI.dat table in database (see Appendix 1)
MI_Pas.dat table in database (see Appendix 1)
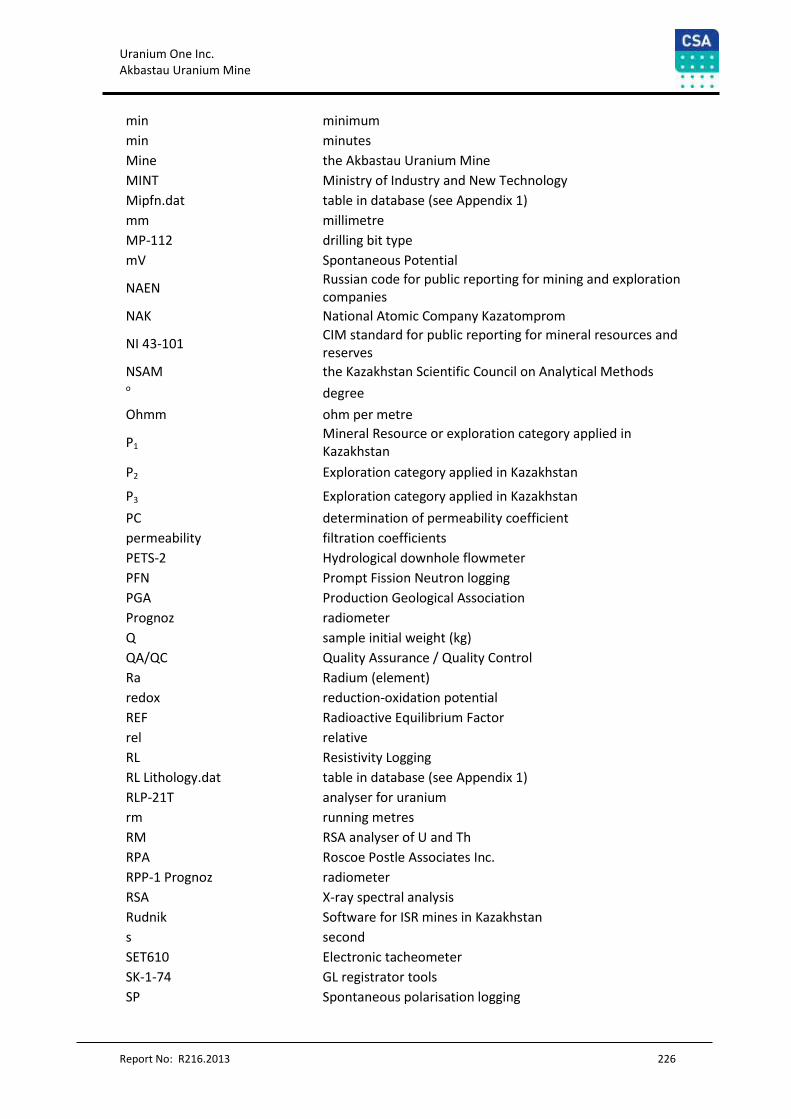
Uranium One Inc. Akbastau Uranium Mine
Report No: R216.2013 226
min minimum
min minutes
Mine the Akbastau Uranium Mine
MINT Ministry of Industry and New Technology
Mipfn.dat table in database (see Appendix 1)
mm millimetre
MP-112 drilling bit type
mV Spontaneous Potential
NAEN Russian code for public reporting for mining and exploration companies
NAK National Atomic Company Kazatomprom
NI 43-101 CIM standard for public reporting for mineral resources and reserves
NSAM the Kazakhstan Scientific Council on Analytical Methods o degree
Ohmm ohm per metre
P1 Mineral Resource or exploration category applied in Kazakhstan
P2 Exploration category applied in Kazakhstan
P3 Exploration category applied in Kazakhstan
PC determination of permeability coefficient
permeability filtration coefficients
PETS-2 Hydrological downhole flowmeter
PFN Prompt Fission Neutron logging
PGA Production Geological Association
Prognoz radiometer
Q sample initial weight (kg)
QA/QC Quality Assurance / Quality Control
Ra Radium (element)
redox reduction-oxidation potential
REF Radioactive Equilibrium Factor
rel relative
RL Resistivity Logging
RL Lithology.dat table in database (see Appendix 1)
RLP-21Т analyser for uranium
rm running metres
RM RSA analyser of U and Th
RPA Roscoe Postle Associates Inc.
RPP-1 Prognoz radiometer
RSA X-ray spectral analysis
Rudnik Software for ISR mines in Kazakhstan
s second
SET610 Electronic tacheometer
SK-1-74 GL registrator tools
SP Spontaneous polarisation logging
Uranium One Inc. Akbastau Uranium Mine
Report No: R216.2013 227
SP KSP-60 GL registrator tools
sq square
STRK ISO Standard of laboratory sertification
SW–NE southwest - northeast
t tonnes
T type Diameter of drilling
T5-K electronic tacheometer
TC 407 electronic tacheometer
Th Thorium (element)
Tl Thallium (element)
TL temperature logging
tpa tonnes per annual
TSR-34 Hydrological downhole flowmeter
TSX:UUU Toronto Stock Exchange
U Uranium (element)
U GT grade x thickness of uranium
U_CUT uranium grade after top cut
U3O8 uranium oxide
UIR-1 tool for measurement of radium
UKP -77 downhole registrator type
Uranium One Uranium One Inc.
V coefficient of variation of commercial component
VIMS Russian Scientific-Research Institute of Mineral Resources
VIRG Russian geophysical institute, Saint-Petersburg, Russia
Vk Factor used for correction of GRL counts to uranium grades
VNIIA Russian Research Institute of Automatics, Moscow, Russia
VNIIHT Russian Research Institute of chemical technology, Moscow, Russia
VPGA Volkov Production Geological Association
XRF X-ray fluorescence
ZFO zone of formation oxidation
ZIF-1200МR drilling unit type
γ gamma
τ mean square deviation оC Celsius degrees