Embed Size (px)
Citation preview
I
Doctoral Thesis in Chemical Engineering
Studies on Rechargeable Fe-air
electrodes in Alkaline electrolyte
Alagar Raj Paulraj
Doctoral Thesis 2019
KTH Royal Institute of technology
Department of Chemical Engineering
School of Engineering Sciences in Chemistry,
Biotechnology and Health
SE-100 44 Stockholm, Sweden
II
Studies on rechargeable Fe-air electrodes in alkaline electrolyte
ALAGAR RAJ PAULRAJ
TRITA-CBH-FOU-2019:10
ISBN: 978-91-7873-087-2
Akademisk avhandling som med tillstånd från Kungliga Tekniska Högskolan
framläggs till offentlig granskning för avläggande av en teknisk
doktorsexamen inom kemiteknik, fredagen den 1 mars 2019 kl 10:00 i
Kollegiesallen, Kungl Tekniska Högskolan, Brinellvägen 8, Stockholm.
Fakultetskomponent: Universitetslektor Carlos Ponce de Leon, University of
Southampton, United Kingdom.
© Alagar Raj Paulraj, Mars 2019
Tryck: US-AB, Stockholm 2019
III
Abstract
Energy storage system is an important component in the energy system based
on variable renewable energy sources into the grid. Energy storage system
could contribute to decarbonization, energy security, offset the demand and
supply of the electricity sector, especially for the electric grid. These can be
either mechanical, electrochemical, chemical, electromagnetic or thermal
devices. The most important functional characteristics of an energy storage
system are capital cost, roundtrip efficiency, energy and power rating,
response times and cycle life. Electrochemical energy storage systems (EES)
have the following edge over the other systems: fast response time, relatively
short duration of storage, size, high efficiency, a decentralized installation
which is closer to generation or consumption site.
The focus of this thesis is on the development of cost-effective iron anode
materials and electrocatalytic air electrodes for Fe-air batteries that
potentially could become as an energy storage system. Iron-based systems
are attractive due to their safety, cheapness, non-toxicity and ubiquitous
availability of materials. However, both the anode and cathode parts have
numerous drawbacks that need to be addressed. The anode exhibits poor
charge efficiency, rate capability and low capacity utilization while the
cathode has sluggish kinetics, poor activity, structural stability and the
numbers of active non-noble metal catalysts are limited.
This work utilized Cu and Sn-doped iron nanomaterials and different
additives (Bi2S3, CNT, LiOH) to enhance the performance of the iron
electrode. The performance of the electrodes were evaluated using the
charge/discharge cycling, rate capability, cyclic voltammetry (CV),
galvanostatic and potentiodynamic polarization measurements, in operando
charging measurements combined with mass spectrometry. The fresh and
cycled electrodes and powders were characterized by ex-situ XRD, BET,
SEM, TEM , XPS and Raman spectroscopy. The most striking results are the
prevention of nanoparticle agglomeration, increased charging efficiency (80-
91%), effect of Cu and Sn dopants on specific capacity (367-603 mAh g-1)
and improved performance of the electrodes at high charge current densities.
In the subsequent air electrode part, non-precious metal La-doped CaMnOx,
nano Co3O4 and NiFeOX electrocatalysts were synthesized using co-
precipitation and hydrothermal methods. Both the single and mixed catalysts
were used as bi-functional catalysts for oxygen reduction and evolution
reactions (ORER). The catalysts were characterized by XRD, SEM, TEM,
BET, Raman and XPS. The electrocatalytic activity and stability were
assessed in alkaline solutions on gas diffusion electrodes and glassy carbon
electrode by linear sweep voltammetry (LSV), CV and rotating disk
IV
electrode (RDE). Furthermore, the mixed catalyst and NiFeOX showed
excellent bifunctional performance such as high activity and stability
achieved by the hybridization of the two catalysts and the effect of catalyst
loading on the electrocatalytic performance. These findings can help to
develop a cost-effective material for Fe-air batteries.
Keywords: Fe-air battery; Cu/Sn-doped nanostructured iron electrodes,
Alkaline electrolytes, Bi-functional OER/ORR catalyst, perovskite/spinel
catalyst, NiFeOx, air electrode;
V
Sammanfattning
Energilagringssystem är en viktig komponent vid integrationen av teknik
som genererar el från förnybara energikällor till nätet. Energilagringssystem
skulle kunna bidra till avkolning, energisäkerhet, utjämna efterfrågan och
utbudet av elsektorn. Energilagringssystem kan vara mekaniska,
elektrokemiska, kemiska, elektromagnetiska eller termiska anordningar. De
viktigaste funktionella egenskaperna hos ett energilagringssystem är
kapitalkostnaden, roundtrip, effektivitet, energi- och effektbedömning,
responstider och cyklingsbarhet. De elektrokemiska energilagringssystemen
(EES) har följande fördelar över de andra systemen: snabb responstid,
relativt kort lagringstid, storlek, hög effektivitet, en decentraliserad
installation som ligger närmare generations- eller konsumtionsläge.
Fokus för denna avhandling handlar om utveckling av kostnadseffektiva
järnanodmaterial och elektrokatalytiska luftelektroder för Fe-luft batterier
som energilagringssystem. Järnbaserade system är attraktiva på grund av
deras säkerhet, billighet, icke-toxicitet och allmänt förekommande
materialtillgänglighet. Både anoden och katoden har emellertid många
nackdelar som behöver åtgärdas. Anoden uppvisar dålig
laddningseffektivitet, laddningskapacitet och låg kapacitetsutnyttjande
medan katoden har trög kinetik, dålig aktivitet, strukturell instabilitet och val
av begränsat antal aktiva icke-ädelmetallkatalysatorer.
Detta arbete utnyttjade Cu- och Sn-dopade järn nanomaterial och olika
tillsatser (Bi2S3, CNT, LiOH) för att förbättra järnelektrodens prestanda.
Elektrodernas prestanda utvärderades med hjälp av laddnings-/urladdnings
cykler, laddningsskapacitet, cyklisk voltammetri (CV), galvanostatisk och
potentiodynamisk polarisationsmätningar, in-operando laddnings mätningar
kombinerade med masspektrometri. Både nya och cyklade elektroder samt
pulver material karakteriserades genom ex-situ XRD, XPS, BET, SEM,
TEM och Raman spektroskopi. De mest slående resultaten är förebyggandet
av agglomerering av nanopartiklar, ökad laddningseffektivitet (80-91%),
effekt av Cu- och Sn-tillsatser på specifik kapacitet (367-603 mAh g-1) och
förbättrad prestanda hos elektroderna vid hög laddningsströmdensitet.
I den efterföljande delen av denna avhandling av luftelektroder
syntetiserades icke-ädel metaller av La-dopade CaMnOx, nano Co3O4 och
NiFeOX katalysatorer med hjälp av utfällning och hydrotermiska metoder.
Både enskilda och blandade katalysatorer användes som bi-funktionella
katalysatorer för syrereduktions och evolutions reaktioner (ORER).
Katalysatorerna karakteriserades med hjälp av XRD, SEM, TEM, BET,
Raman och XPS. Den elektrokatalytiska aktiviteten och stabiliteten
analyserades i alkaliska lösningar med gasdiffusionselektroder och

VI
glaselektrod genom linjär svepvoltammetri (LSV), CV och roterande
skivelektrod (RDE). Dessutom några avgörande observationer noterades om
utmärkt bifunktionell prestanda, såsom aktivitet och stabilitet genom
hybridisering av två katalysatorer, samt inverkan av mängden katalysator på
den elektrokatalytiska prestandan. Dessa resultat kan bidra till att utveckla
ett kostnadseffektivt material för Fe-air batterier.
Nyckelord: Fe-luft batteri; Cu/Sn-dopade nano-strukturerade järnelektroder,
Alkalisk elektrolyt, Bi-funktionell OER/ORR-katalysatorer, perovskit/spinel
katalysator, NiFeOx, luftelektrod;
VII
List of appended papers
Paper 1
Core/Shell Structure Nano-Iron/Iron Carbide Electrodes for
Rechargeable Alkaline Iron Batteries
Alagar Raj Paulraj, Yohannes Kiros, Björn Skårman, Hilmar
Vidarsson
Journal of The Electrochemical Society, 164 (2017), A1665-A1672.
https: doi: 10.1149/2.1431707jes
Paper 2
La0.1Ca0.9MnO3/Co3O4 for oxygen reduction and evolution reactions
(ORER) in alkaline electrolyte
Alagar Raj Paulraj, Yohannes Kiros,
Journal of Solid State Electrochemistry 22 (2018), 1697-1710
https://doi.org/10.1007/s10008-017-3862-2
Paper 3
Electrochemical Performance and in Operando Charge Efficiency
Measurements of Cu/Sn-Doped Nano Iron Electrodes
Alagar Raj Paulraj, Yohannes Kiros, Mylad Chamoun, Henrik
Svengren, Dag Noréus, Mats Göthelid, Björn Skårman, Hilmar
Vidarsson, Malin B. Johansson
Batteries 5 (2019), 1.
https://doi.org/10.3390/batteries5010001
Paper 4
NiFeOx as a bifunctional electrocatalyst for oxygen reduction (OR)
and evolution (OE) reaction in alkaline media
Alagar Raj Paulraj, Yohannes Kiros, Mats Göthelid, Malin Johansson
Catalysts 8 (2018), 328.
https://doi.org/10.3390/catal8080328
VIII
Papers not included in the thesis
Paper 1
Anionic redox chemistry in Na-rich Na2Ru1−ySnyO3 positive electrode
material for Na-ion batteries
Patrick Rozier, Mariyappan Sathiya, Alagar-Raj Paulraj, Dominique
Foix, Thomas Desaunay, Pierre-Louis Taberna, Patrice Simon, Jean-
Marie Tarascon
Electrochemistry Communications 53 (2015), 29–32
https://doi.org/10.1016/j.elecom.2015.02.001
Paper 2
Radiation-induced synthesis of nanoscale Co- and Ni-based electro-
catalysts on carbon for the oxygen reduction reaction
Inna L Soroka, Nadezda V Tarakina, Anton Hermansson, Lukas
Bigum, Rickard Widerberg, Mikael S Andersson, Roland Mathieu,
Alagar R Paulraj, Yohannes Kiros.
Dalton Trans., 46 (2017), 9995–10002.
https: doi: 10.1039/c7dt01162h rsc.li/dalton
IX
Conference presentations based on this thesis
I. Electrochemical Study of Nano-Iron/Iron Carbide as
Rechargeable Electrodes
Alagar Raj Paulraj, Yohannes Kiros, Björn Skårman, Hilmar
Vidarsson
Abstract #96 in the PriME 2016 230nd ECS International
Meeting, Honolulu, Hawaii, 2016
II. Bifunctional Spinel NiFe2O4 Electrocatalyst for Oxygen
Reduction (OR) and Evolution (OE) in Alkaline Media
Alagar Raj Paulraj, Yohannes Kiros,
Abstract #83 in the 232nd ECS International Meeting, National
Harbor, MD, 2017
III. Capacity Limited Cycle Life of Cu/Sn Doped Nano-
Iron/Carbon Electrodes in Alkaline Electrolyte
Alagar Raj Paulraj, Yohannes Kiros, Björn Skårman, Hilmar
Vidarsson
Abstract #2062 in the AiMES 2018 234th ECS International
Meeting, Cancun, Mexico, 2018 |

X
Author’s contributions to the appended publications
Paper 1: I performed all the experimental work, analyzed the data and
wrote the article with guidance of the co-authors.
Paper 2: I performed all the experimental work, analyzed the data and
wrote the article with guidance of the co-author.
Paper 3: I am the principal author. Major part of the experiments was
conducted and written by me. Henrik Svengren designed the insitu
electrochemical GC-MS set-up. Mylad Chamoun carried out the
experiments and wrote that part. XPS and Raman analyses were
performed and analyzed by Mats Göthelid and Malin B. Johansson.
The article was reviewed by all co- authors.
Paper 1: I am the principal author. I performed all the experiments
except XPS and Raman, which were performed and analyzed by Mats
Göthelid and Malin B. Johansson. I wrote the whole article and it was
reviewed by all co- authors.
XI
CONTENTS
1 INTRODUCTION ................................................................. 3
1.1 Need of energy storage .............................................................................. 3
1.2 Battery systems .......................................................................................... 4
1.3 Iron electrodes for alkaline systems ........................................................ 8 1.3.1 Electrochemistry of the Iron electrode .............................................. 9 1.3.2 Challenges in the iron electrode ...................................................... 11 1.3.3 Overcoming Strategies .................................................................... 11
1.4 Bifunctional catalysts for ORR and OER in alkaline metal-air
batteries ............................................................................................................. 13 1.4.1 Non-noble metal catalysts ............................................................... 13 1.4.2 Electrochemical reactions at the positive electrodes ....................... 17
1.5 Scope of the thesis ................................................................................... 19
2 EXPERIMENTAL METHODS ......................................... 23
2.1 Materials synthesis and electrode preparation ..................................... 23 2.1.1 Iron negative electrodes ................................................................... 23 2.1.2 Oxygen electrode materials ............................................................. 25 2.1.3 Composite air electrode preparation ................................................ 27 2.1.4 Physical characterization ................................................................. 28 2.1.5 Electrochemical measurements ....................................................... 30 2.1.6 Air electrode testing ........................................................................ 32
3 RESULTS AND DISCUSSION .......................................... 37
3.1 Phase identification of the Cu and Sn doped iron samples .................. 37
3.2 Surface and porosity of Cu and Sn doped iron samples ...................... 39
3.3 Morphology of the Cu and Sn doped iron samples .............................. 41
3.4 Analysis of surface oxidation state and species of Cu doped iron
sample ................................................................................................................ 42
XII
3.5 Electroanalytical Characterization of Cu and Sn doped iron sample 44 3.5.1 Cyclic voltammetry of Cu doped iron ............................................. 44 3.5.2 Cyclic voltammetry of Cu, CuSn and Sn doped iron....................... 46 3.5.3 Electrode kinetics ............................................................................ 47
3.6 Galvanostatic cycling of Cu, CuSn, and Sn-doped iron electrodes ..... 49 3.6.1 Cu-doped iron electrodes cycling performance ............................... 49 3.6.2 CuSn and Sn-doped iron electrodes cycling performance ............... 54 3.6.3 Effect of charge current density on hydrogen evolution and electrode
performance on Cu, CuSn, and Sn-doped iron electrodes ............................. 56
3.7 Galvanostatic cycling effect on Cu-doped electrode ............................. 60 3.7.1 Impedance evolution along the galvanostatic cycling ..................... 60 3.7.2 Ex-situ XRD phase evolution .......................................................... 62 3.7.3 Ex-situ morphological evolution ..................................................... 63
4 ELECTROCATALYTIC STUDIES ON MIXED-OXIDE
LA-DOPED CAMNOX AND CO3O4 CATALYSTS AND
NIFEOX ......................................................................................... 67
4.1 Phase identification of synthesized particles ......................................... 67
4.2 Surface area characterization ................................................................ 68
4.3 Morphological characterization ............................................................. 69
4.4 Surface species characterization ............................................................ 71
4.5 Electrochemical identification of redox activity ................................... 72 4.5.1 Cyclic voltammetry ......................................................................... 72
4.6 Electrode kinetics .................................................................................... 75 4.6.1 Initial stage of the electrocatalytic activity ...................................... 75 4.6.2 Tafel characteristics ......................................................................... 78
4.7 ORR activity ............................................................................................ 80
4.8 Bifunctional OER and ORR cycling ...................................................... 83 4.8.1 Bifunctional stability of LCMO and Co3O4 based electrodes .......... 83 4.8.2 Bifunctional stability of NiFeOx based electrodes ........................... 86
XIII
4.9 Mass activity comparison between GC vs. GDE composite electrodes
of LCMO+Co3O4 .............................................................................................. 88
4.10 Postmortem analysis of LCMO and Co3O4 cycled electrodes ........ 89
5 CONCLUSION AND OUTLOOK ..................................... 95
6 ACKNOWLEDGMENT ..................................................... 98
7 REFERENCES..................................................................... 99

XIV

1
PART I: INTRODUCTION

2
3
PART I
1 Introduction
1.1 Need of energy storage
Electricity is an important energy carrier that maintains our
comfortable way of life. Currently two-thirds of the energy we
consume comes from fossil fuels. Various national government
agencies, like the US Department of Energy (DOE), and
international energy agencies, predict that this scenario will continue
until 2040, with 54% of energy coming from fossil fuels and 33%
coming from renewables (hydro, solar, wind and geothermal
power)1. Ongoing fossil fuel usage has contributed to the rise of CO2
concentrations above 410 ppmv (parts per million by volume). This
trend will also continue until 2040. Electricity generation alone
contributes 25% of GHG 2. This causes a significant global warming
effect. The 2015 Paris Agreement aims limiting global temperature
level changes to not extending 2ºC above pre-industrial levels by
2100. To achieve this target, carbon-neutral energy production from
renewables needs to account for 60% of total electricity production 1. Renewables are the way to offset fossil-fuel-induced global
warming.
Therefore, sustainability and environmental awareness have
motivated us to diversify our energy sources to include more
renewable ones. The energy generation from renewable sources has
increased at a remarkable rate since the end of the 1990s. It is
expected to increase from 2112 GW in 2016 to 3733 GW by 2040,
with a growth rate of 2.3% per year. Solar and wind energy increased
by 17% and 25% from 2015 to 2016, with a total installed capacity
of 227.1 and 432.9 GW, respectively Global Wind Energy Council,
Global Wind 2015 Report: Annual Market Update3. However, their
intermittent nature requires large-scale energy storage systems
(EES) to store and distribute the energy on demand. Like electricity
generation, EES options are highly diverse, nevertheless must have
4
the following properties: scalability, low life-cycle cost, high current
efficiency and a fast response time for withdrawal from the system 4. EES systems have multiple functions and requirements, such as
meeting the unreliable demands of electricity, distributed energy
storage, maintenance, utilization, load balance, peak shaving,
leveling and stabilizing, and providing an uninterrupted power
supply with frequency and voltage control of transmission and
distribution to the electricity grid. EES are a vital and indispensable
technology for both utility and transmission applications 5-10.
Energy can be stored in chemical, mechanical, electrochemical,
electrical, and thermal forms. Among these, the mechanical form of
energy storage, through pumped hydroelectric storage, composed
96% of the total globally installed capacity of EES in 2016. Of the
remainder, 2% was in thermal storage and 0.9 % was in
electrochemical storage 1. The main advantage of the pumped
hydroelectric storage is its low capital cost compared to other
available storage solutions ($80-200/kWh) 11, 12. However, this
system is site centric and located in ecologically sensitive zones,
which means it affects the site’s flora and fauna. On the other hand,
electrochemical energy storage systems, like batteries, are flexible
in design scale and size, have a low response time, a high round-trip
efficiency, and can be built in any location. They also come in
several different storage formats, including secondary batteries,
supercapacitors, and redox flow batteries. Each type of
electrochemical system can change significantly, based on energy
and power densities, charge and discharge duration, cycling
behavior, and capital cost.
1.2 Battery systems
Batteries are devices that store electrical energy at their anode and
cathode electrodes in the form of chemical energy; in the electrolyte
medium-charged ions and along the external circuit electrons move.
Two chemical reactions take place at the same time in the
electrode/electrolyte interphase: on discharge at the anode (negative
electrode), oxidation occurs, and at the cathode (positive electrode),
reduction occurs. During charging, the reverse of these reactions
5
takes place. From the application point of view, energy delivered
during the discharge should be as high as possible. This output
energy is directly related to the amount of active material in the
battery. The total amount of energy stored in the battery is called
specific energy (Wh/kg), and the speed at which it can be extracted
from the system is defined as specific power (W/kg). The other
important parameter is round-trip efficiency, in which minimum loss
signifies an efficient system with less energy waste. The weight and
volume of the system also play an important role in the application.
Several applications, such as automotive and traction, will require
high power density, while at grid level, large-scale energy storage
applications need high energy density batteries with no weight
limitations. However, a higher rate of withdrawal tends to decrease
the energy density by the Joule heating effect. For the efficient
utilization of the battery, the optimum value of the power and energy
density needs to be fixed. When the battery is not in use, valuable
energy is lost in an unwanted reaction called self-discharge; this
needs to be minimized for effective storage and must be most
reliably redrawn from the battery into the applications. Mechanical
integrity is also an essential criterion because the battery is often
subjected to thermal, mechanical and vibrational shocks. Therefore,
the desired characteristics are maximum energy at optimum power
density, minimum self-discharge, minimum internal resistance,
maximum mechanical robustness and long cycle, cost-effectiveness,
wide availability and less environmental impact 13.
More than a century of research on storage batteries has produced
few viable systems. The lead-acid battery, first demonstrated in
1859 by Gaston Planté, is now ubiquitous due to its cost and
robustness. The lead-acid system has low energy density (30
Wh/kg), toxic raw material and a low life cycle (300 cycles). Since
then, many systems have been developed, such as Ni-Cd, Ni-MH,
and Ni-Fe. The performance of Ni-Cd suffers from memory effect,
and to resuscitate the lost capacity users have to perform a time-
consuming recharging regime. Although the Ni-Cd offers slightly
higher energy and a higher life cycle (1500 cycles) than the lead-
acid battery, toxicity and a higher self-discharge rate of cadmium
6
have urged to replace it with metal hydride electrodes (MH). The
Ni-MH can store more energy than the Ni-Cd. Even though it
delivers less power and is tolerant to overcharge, the high cost of
rare earth elements is a drawback. To circumvent the above
downsides, the MH electrode has been replaced with an iron
electrode, which can provide 1.5 to 2 times more specific energy and
life cycle (2000 cycles at 80% DOD) than lead-acid batteries, with
increased mechanical robustness 14, 15. Overall, iron electrodes are
safer, more environmentally friendly and more cost-effective than
lead, nickel, zinc, cadmium, and metal hydrides.
This chapter highlights the electrochemical characteristics of the
iron electrode in alkaline media. The issues that affect iron
electrodes and approaches to tackling those issues are discussed
here.
Several systems have been developed in the last 100 years from Ni-
based batteries (Ni-MH, Ni-Cd, Ni-Fe, Ni-Zn, NaNiCl2), redox flow
batteries (Vanadium, Zn-Br, Zn-Cl, Zn-Ce, Fe-Cr, V-Br), NaS and
metal-air batteries (Fe-air, Zn-air, Li-air, Al-air and Mg-air) 9, 10, 16-
18. The later type of battery is used in a wide range of applications
due to a combination of anodes from batteries and air cathodes from
fuel cells, which give them high energy and power density, better
safety and environmental viability. Fe-air, Zn-air, Mg-air, Al-air,
and Li-air have a theoretical energy density of 1129, 1353, 6815,
8076 and 11429 Wh kg-1 19. Each system has its own set of merits
and demerits. Even though Al, Mg, Zn, and Li negative electrodes
have a higher theoretical energy density than Fe, the inherent
drawbacks of these metal electrodes are dendrite formation, uneven
metal deposition, corrosion of metal anode and
reactivity/dissolution, posing a severe challenge to widespread
commercialization. Furthermore, they are costlier than the Fe-based
systems. Iron is the fourth most abundant element in the Earth’s
crust (known reserves are 230×109 tons); it is the most available,
least expensive and least toxic element to be used for large-scale
battery energy storage systems US Geological Survey, Mineral
Commodity Summaries20, 21.
7
The air cathode as a positive electrode is widely used in various
electrochemical systems such as metal-air batteries, metal hydride-
air batteries, regenerative fuel cells, and electrolyzers 22-24.
Currently, acidic and alkaline electrolytes are employed in fuel cells
and batteries. For metal-air batteries, alkaline electrolytes are
favored over acidic due to their higher ionic conductivity, activity,
electrode materials corrosion resistance, better safety issues, and
sustainable materials (non-precious metals group), compared to
organic or acidic electrolytes. Moreover, transition metal oxides are
stable and active in an alkaline electrolyte 25. Also, the critical
transition metals and rare earth elements Ni, Ca, Fe, and Mn are
widely available in the earth’s crust. These elements are sustainable.
Ca, Fe, Mn are important constituents in the biomass, and are easily
recyclable.
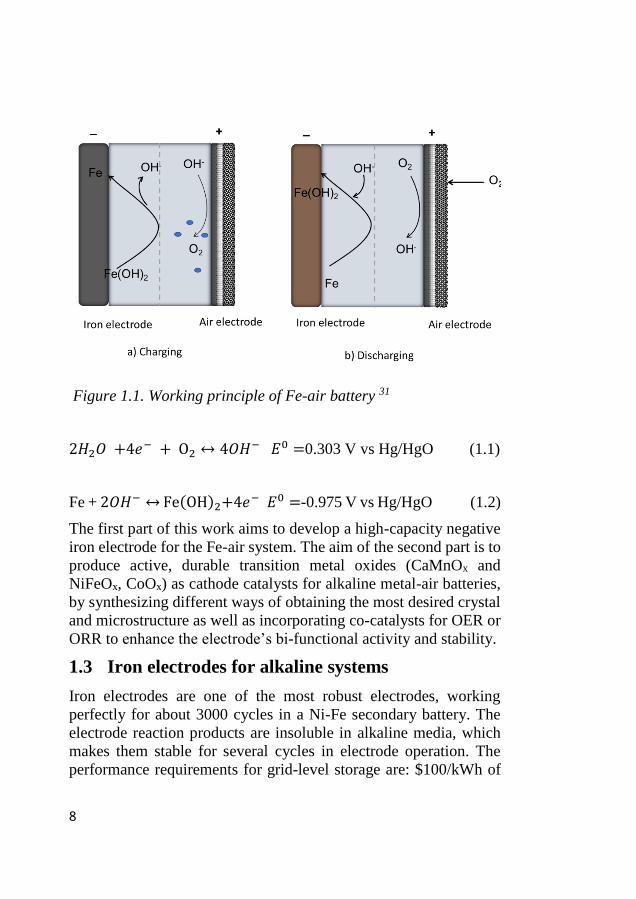
The operation of rechargeable Fe-air batteries (Figure 1. 1) is similar
to that of the Zn-air battery for the air electrode, which catalyzes
both oxygen evolution reaction (OER) and oxygen reduction
reaction (ORR) during charge and discharge respectively, while the
Fe electrode is oxidized during discharge and reduced back to Fe
during charge (Eq 1.1-1.2). There are significant voltage and energy
losses during this charge and discharge cycle, both on the metal and
air electrode operation. The iron electrode undergoes self-corrosion,
parasitic hydrogen evolution and passivation, leading to low
utilization and energy efficiency 4, 26-28. On the other hand, the air
electrode has sluggish kinetics and activity, carbon support
corrosion, and plugging of electrode pore by CO2 29, 30. Altogether,
the downsides mentioned above impede the commercialization of
Fe-air batteries.
8
Figure 1.1. Working principle of Fe-air battery 31
2𝐻2𝑂 +4𝑒− + O2 ↔ 4𝑂𝐻− 𝐸0 =0.303 V vs Hg/HgO (1.1)
Fe + 2𝑂𝐻− ↔ Fe(OH)2+4𝑒− 𝐸0 =-0.975 V vs Hg/HgO (1.2)
The first part of this work aims to develop a high-capacity negative
iron electrode for the Fe-air system. The aim of the second part is to
produce active, durable transition metal oxides (CaMnOx and
NiFeOx, CoOx) as cathode catalysts for alkaline metal-air batteries,
by synthesizing different ways of obtaining the most desired crystal
and microstructure as well as incorporating co-catalysts for OER or
ORR to enhance the electrode’s bi-functional activity and stability.
1.3 Iron electrodes for alkaline systems
Iron electrodes are one of the most robust electrodes, working
perfectly for about 3000 cycles in a Ni-Fe secondary battery. The
electrode reaction products are insoluble in alkaline media, which
makes them stable for several cycles in electrode operation. The
performance requirements for grid-level storage are: $100/kWh of
9
capital cost amortized over a 15-year span, as defined by the US
Department of Energy (DOE). A battery life of over 5000 cycles and
a round-trip efficiency of 80% are required to meet that target 4. The
Ni-Fe battery’s open cell potential is 1.41 V; converting it to Fe-air
makes the cell’s energy density up to 100% and is less costly. Fe-air
life and cost meet the DOE specification. The successful
development of iron electrodes could be used as a negative electrode
in Fe-air and Ni-Fe alkaline batteries. The Fe-air system is the
cheapest, most environmentally friendly, and most robust system of
the batteries available 4, 31.
1.3.1 Electrochemistry of the Iron electrode
The iron electrode is oxidized in the alkaline electrolyte with
oxidation changes from metallic to 2+ then further oxidized into 3+
state. The capacity generating primary reaction is Eq. 1.3 32, 33. First,
the iron is converted into ferrite ion (Eq. 1.4), This ferrite ion is
sparingly soluble, further hydrolyzing and re-precipitate as a
hydroxide species (Eq.1.5) on the electrode 34, 35.This iron hydroxide
is less conductive and passivating the electrode. The thicker layer
tends to prohibit the further discharge of the electrode and increase
the internal resistance, which intern reduces cell voltage and high
rate discharge performance 21, 27.
𝐹𝑒 + 2𝑂𝐻− ↔ Fe(OH)2 + 2𝑒− (1.3)
𝐹𝑒 + 3𝑂𝐻− ↔ 𝐻𝐹𝑒𝑂2− + 𝐻2𝑂 + 2𝑒
− (1.4)
𝐻𝐹𝑒𝑂2− + 𝐻2𝑂 ↔ Fe(OH)2 + 𝑂𝐻
− (1.5)
The reactions Eq.1.3 to 1.5 are desired capacity generating reactions
in the electrode with a theoretical capacity of 960 mAh g-1 36. Further
discharge leads iron oxyhydroxide (Eq. 1.6) and magnetite (Eq. 1.7),
which require higher overpotential and is hard to reduce into the
metallic state 37. Also, magnetite is less conductive compared to pure
iron. As a consequence, internal resistance of cell increases,
resulting in large hysteresis (overpotential) during charging.
Fe(OH)2 + 𝑂𝐻− ↔ 𝐹𝑒𝑂𝑂𝐻 + 𝐻2𝑂 + 𝑒
− (1.6)
3Fe(OH)2 + 2𝑂𝐻− ↔ Fe3O4 + 4𝐻2𝑂 + 2𝑒
− (1.7)
10
Apart from the above reaction, hydrogen evolution is also possible
at open circuit potential (OCV) owing to the thermodynamic
instability of the iron in the water systems. The standard hydrogen
evolution reaction (HER) potential is 40 mV positive to iron
electrode’s OCV.
2𝐻2𝑂 + 2𝑒− ↔ 2𝑂𝐻− + 𝐻2 𝐸
0 = (-0.930 vs Hg/HgO) (1.8)
Hydrogen evolution in alkaline electrolyte proceeds in the following
pathways: Volmer- Heyrovsky pathway or Tafel path by molecular
recombination 38, 39.
Volmer step:
𝐻2𝑂 + 𝑒− ↔ 𝑂𝐻− + 𝐻𝑎𝑑 (1.9)
Heyrovsky step:
𝐻2𝑂 + 𝐻𝑎𝑑 + 𝑒− ↔ 𝑂𝐻− + 𝐻2 (1.10)
Tafel step:
𝐻𝑎𝑑 + 𝐻𝑎𝑑 ↔ 𝐻2 (1.11)
The iron electrode undergoes self-discharge (Eq.1.12) due to the
corrosion process, where the reaction scheme is similar to Eq. 1.3 to
1.5. This is partly due to the low thermodynamic hydrogen evolution
overpotential causing the hydrogen evolution competing with the
iron reduction. These self-discharge rate is as high as 5% per 4 days
that could extend it to 20% in a period of 14 days 14.
𝐹𝑒 + 2𝐻2𝑂 ↔ Fe(OH)2 + 𝐻2 (1.12)
The concentration gradient of the Fe 2+ ions causes the iron
hydroxide film growth. Thicker film tends to inhibit this self-
discharge 14. These self-discharge and hydrogen evolution cause
corrosion and waste of energy in the electrode. Therefore, it lowers
the faradaic efficiency and water loss of the system. Consequently,
overcharging and electrolyte top-up are become mandatory 21, 36.
11
1.3.2 Challenges in the iron electrode
To summarize, the problems beset the iron electrode are hydrogen
evolution accompanied with low charge efficiency, passivation, low
capacity with reduced life, low charge acceptance, low charge
retention, poor rate capability.
1.3.3 Overcoming Strategies
The above-mentioned problems are surmounted by modifying the
structure, and composition by incorporation of additives into the
system, in the electrolyte and electrode, which are added in small
quantities to impart specific function. There are few promising
options to suppress the hydrogen evolution: such as additives that
raise the overpotential of the iron electrode, electrolyte additives that
covers active catalytic site in the electrode/electrolyte interphase,
and conductivity additives in order to decrease the electrode
resistance by carbon, and metal elements such as Cu, Sn, Ni, etc.
1.3.3.1 Electrode additives
Metal Sulfides and pore formers
A wide range of metal sulfides like FeS, PbS, CuS, NiS, and Bi2S3,
FeS, Bi2S3, Bi2O3+K2S have been utilized as electrode additives.
Some of them were discounted in consideration of cost and toxicity.
Commonly used pore formers are metal sulfide, nickel sulfate, and
potassium carbonate 40.
In the electrode, pore formers are used to create enough electrolyte
access to the reaction site. Nickel sulfate and potassium carbonate
are used in very low concentration (0.5% of active material) and are
leached out to the electrolyte forming the pore.
Bismuth sulfide decomposes in a redox reaction, being absorbed into
the oxide lattice at the electrode-electrolyte interface. Iron sulfate
conductivity is higher than magnetite and iron hydroxide. In the
following reactions, 1.13 and 1.14 show bismuth sulfide
decomposes by forming iron sulfide. Iron sulfide enables a high
discharge rate via de-passivating the oxide; modifying the electrode
kinetics and increasing the solubility of iron hydroxide making the
12
reaction fast. The metallic bismuth increases the hydrogen evolution
overpotential and, in addition, charging efficiency increases from
50% to 90% 21.
𝐵𝑖2S3 + 6𝑒− ↔ 2Bi + 3𝑆2− (𝐸0 =-0.920 vs g/HgO) (1.13)
𝑆2− + Fe(OH)2 ↔ FeS + 2𝑂𝐻− (1.14)
1.3.3.2 Electrolyte additive
Most often, Na2S, K2S and LiOH are used as electrolyte additives.
The first two function similar to bismuth sulfide, but are less
effective due to non-uniformity of sulfide adsorption in the electrode
interface. Recently, organosulfur (n-alkanethiols) compounds were
successfully used to suppress the hydrogen evolution. Their
performance is on par with metal sulfide. Sulfur adsorption masks
the electrocatalytic surface site and stays stable over several cycles.
The main advantage of using organosulfur is that recycling the used
electrode is easy to be compared to a bismuth-containing one 21.
LiOH increases the use of iron materials by Li ions incorporated into
the iron hydroxide matrix, by incresing the ionic conductivity. The
intercalated compound also easily reduced back to iron 41, 42.
1.3.3.3 Carbon additive
The discharge products (iron hydroxides) of iron electrodes are
insulating and can passivate the electrodes, which prevents further
oxidation. The electrode passivation and low material use are
overcome by using nano iron and nano iron-carbon composites and
FeS materials 43-51. Particularly, iron-carbon additives, such as
graphene, MWCNT (multi-wall carbon nano tube), CNF (carbon
nano fibre), and amorphous carbon composites showed an increased
capacity performance. However, these nanomaterials had a rapid
capacity decay. The reason for this is nanoparticle agglomeration
and increased hydrogen evolution 52-56. Sundar Rajan et al. used
carbon grafted iron electrodes, which delivered 400 mAh g-1 of
capacity at a 100 mA g-1 discharge rate 57. Kao et al. reported a high
discharge capacity (800 mAh g-1 Fe -Fe 3+) at 3200 mA g-1 in the
presence of Cu 58. The performance results showed that the presence
of Cu and amorphous carbon enhances the iron discharge
13
performance. Chamoun et al. used potassium stannate as an
electrolyte additive, which increased the capacity and efficiency to
400 mAh g-1, with 85% charge efficiency 59. The Sn deposits on the
iron electrode are suggested to suppress the H2 evolution. The
reported works show that special carbons, Cu, and Sn have the
potential to enhance the iron electrode performance.
1.4 Bifunctional catalysts for ORR and OER in
alkaline metal-air batteries
Metal-Air Batteries’ (MAB) charging and discharging reactions are
oxygen evolution (OER) and oxygen reduction reactions (ORR),
which are anodic and cathodic half-cell reactions. These same
reactions are a cornerstone of chemical energy to electrical energy
conversion, as well as storage and conversion devices including
regenerative fuel cells, electrolyzers and photo-electrochemical cells 22. However, the OER and ORR reactions are sluggish and require
larger overpotential to overcome. This leads to voltage losses that
reduce the capacity utilization of the entire metal-air cells. To
circumvent this, an active electrocatalyst is vital for the OER and
ORR reactions. Alkaline electrolytes used in metal-air batteries offer
extra opportunities to enable using both transition metal-based
catalysts and noble metal catalysts. The transition metal-based
oxides are highly stable and corrosion resistive, which provides an
extra advantage to use a wide range of materials in metal-air
systems. In this section, perovskite, spinel type nonnoble metal
catalysts for bifunctional operations are discussed.
1.4.1 Non-noble metal catalysts
Among the of platinum group metals (PGMs), Pt, Pd, and Pt alloys
for ORR and RuO2 and IrO2 for OER are considered state-of-the-art
electrocatalysts 60-64. However, the high cost and limited availability
of PGMs and their alloys limits broad-scale commercialization, and
they also have poor bifunctional stability. Meanwhile, non-noble
metal catalysts such as transition metal oxides of perovskite, layered
double hydroxide (LDH), spinels and pyrochlores, are promising
due to their structural robustness, bi-functional activity, low cost,
14
availability and stability in aqueous alkaline electrolytes 30, 65. They
are thus widely accepted as alternatives for both oxygen reduction
(ORR) and oxygen evolution (OER) reactions. In particular,
perovskites and spinels are attracted due to the high bifunctional
OER and ORR activity and durability and low electrical resistivity.
These perovskites and spinels can also use earth abundant transition
metals. These can be easily synthesized and provide the
morphological flexibility to tune the structure, using the co-
precipitation and hydrothermal methods.
1.4.1.1 Perovskites
Perovskites are ABO3 structure compounds, where A generally
belongs to the group of rare-earth divalent ions ( La, Ce, Sm, Nd,
Gd, Dy, Yd, Ho and Y) or alkaline earth elements (Ca and Sr), while
B is a transition metal trivalent ion (Cr, Mn, Fe, Co, Ni, and Cu). La-
based perovskites are popular due to their high activity, high oxide
ion mobility, mixed ionic and electronic conductivity, and
environmental neutrality66. Several perovskites have been
developed, such as LaCrO3, LaNiO3, LaMnO3, LaFeO3 and LaCoO3 65, 67, 68. Of these, the Mn and Co-based perovskites have a unique
oxidation state and spin configuration that supports stable and high
ORER performance. The perovskites’ bifunctional OER and ORR
activities follow a volcano-type trend. The primary activity
descriptor depends on the occupancy of the eg electronic state; the
secondary descriptors are electronegativity and spin state. The
preferred eg electron occupancy for ORR is a less than and for OER
it should be greater than one 69-71. A-site and B-site substitution
change the oxidation state and eg electron filling from less than one
to more than one in manganese-based perovskites. Changing the A
and B sites produces interesting outcomes, such as increased oxide
ion mobility, oxygen non-stoichiometry, and electronic
conductivity. This could enhance the electrocatalytic properties to
be on par with or even higher than that of PMGs 72, 73. Lanthanides
and alkaline earth group elements have similar ionic radii. Alkaline
earth group elements are easily interchangeable on lanthanum-based
perovskites at high-temperature synthesis. This reduces the rare
earth element in perovskites and thus reduces the material cost. A
15
site substitution increases the current density, surface oxygen
vacancies, conductivity and stable crystal structure 65, while B-site
cations tune the bond-forming ability of B to oxygenated species.
Different combinations of perovskites, such as La1-xCaxMnO3,
CaMnO3, and Ca2Mn2O5, have been studied 74. These have exhibited
high oxygen redox activity and was due to the surface oxygen
vacancies as additional active sites. The distorted structure of
Ca2Mn2O5 (eg≈1) causes molecular porosity, resulting in high OER
performance 75. The above results have shown that Ca substitution
results in mixed valence of Mn (eg < 1) and oxygen vacancies,
resulting in charge compensation that promotes charge transfer and
peroxide reduction. The high-porosity La1-xCaxMnO3 yielded high
conductivity and better bifunctional performance 76, 77. Non-
stoichiometric La0.1Ca0.9MnO3, has an increased amount of Mn4+
concentration due to Ca substitution; this high-oxidation state
provided high conductivity and augmented the ORR performance to
be comparable to MnO2 78-80. However, as it showed a high ORR
performance, its oxygen evolution performance should be improved
for better bifunctional operation.
1.4.1.2 Spinels
Spinels (AB2O4) are another important type of material with earth-
abundant transition metals (Fe, Co, Ni, Cu, and Mn) 81. Recently,
several transition metal oxide spinels and mixed-transition metal
oxide spinels have been reported as either bifunctional or single OE
or OR electrocatalysts in an alkaline environment; these include
cobaltite, ferrites, and manganates. One such spinel, Co3O4, is
considered to be an OER electrocatalyst and has also proven to be a
magnetic p-type semiconductor with structural stability and a low
environmental footprint. As such, it is widely applied in
electrochemical energy storage devices such as Li-ion batteries,
supercapacitors, solid-state sensors, heterogeneous catalysts,
pigments, optical devices, and photocatalysts 82, 83. The mixed
valence state in the Co3O4 has yielded higher OER activity and
stability 84-89. Although its ORR performance is not as good as OER
performance, this is due to its low conductivity and surface
16
interaction. Several works have attempted to improve this
performance by using complex or simple processes to prepare the
Co3O4 with substantial differences in size, shape and surface
properties for various applications 83, 89-94. Moreover, different co-
catalysts have been mixed with Co3O4 to achieve high and stable
bifunctional activity 88, 92, 95-97. Partial substitution on Co3O4
tetrahedral sites with Ni, Mn, Cu or Zn has resulted in improved
performance. The electronegativity difference between Co and the
substitution element tunes the M-O bond, which increases the
catalytic properties. The difference in electronegativity of Mn (1.55)
and Co (1.80), is believed to alter important role in electron
withdrawal and accepting properties 24, 98-101. The majority works
using manganese and cobalt-based catalysts were reported either
alone or with some substitution due to their performance and
abundance. MnO2-perovskite mixed catalysts have been shown to
perform well for bifunctional applications in alkaline electrolyte 102.
1.4.1.3 Layered double hydroxides
Another important class of materials are layered double hydroxides
(LDH): these are mixed-valence, ionically conducting solids with a
layered structure. LDH phase interlayers are filled with carbonate,
nitrate and chloride anions. Their activities are greater than those of
the spinel or rock salt-type structures due to their being easily
oxidizable to metal hydroxide/oxyhydroxide interphases, which are
highly active for the OE reaction 49. Several LDH phases have
performed well on the OER side, such as Ni-Fe, Ni-Co, Co-Fe, Ni-
Ni, Ni-Mn, Mn-Co, Co-Mn, and Co-Ni 103-106. The intercalated
anions are easily removable, which results in different oxide or
spinel phases with mixed-valency states that provide them with
donor-acceptor chemisorption sites for reversible oxygen adsorption
107. In addition, the electron conduction between the mixed valences
of the spinel provides high conductivity and dramatically alters the
bond strength of surface-intermediate species 107, 108. Another
important spinel is NiFe2O4, which has attracted significant interest
due to its low cost, eco-friendliness, widespread availability,
activity, high conductivity, and stability. In both the spinel and LDH
phase, the surface-active compounds are metal hydroxide and
17
oxyhydroxide species with different oxidation states. The
synthesizing method and conditions can alter the structure, valence,
composition and morphology 109.
1.4.2 Electrochemical reactions at the positive electrodes
The OER and ORR are the main reactions that govern the Fe-air
batteries’ charge and discharge operations. As discussed earlier, due
to its slow kinetics it needs to be catalyzed by the bifunctional
catalyst. The ORR at air electrode involves several steps: oxygen
should be brought from atmosphere from the catalyst surface; then
it is absorbed on the active site; there is further transfer of electrons
from the catalyst to oxygen; then there is a weakening and removal
of the oxygen bond; and finally the catalyst surface should release
the hydroxide ion to the electrolyte. The OER is exact opposite to
the ORR 110.
1.4.2.1 Oxygen reduction reaction
The oxygen reduction in alkaline media is proceeded by a series of
complex electrochemical reactions. These reactions are mostly
dictated by the binding energies from the catalyst to oxygen-
containing intermediates (O2−, HO2
− and OH−). The ORR pathway
is given in Table 1.1. Some groups of metals, such as the Pt group,
pyrochlore, and perovskite families, favor the direct 4e- pathway,
whereas the peroxide path is favored by carbon materials, Hg, Au,
most of the transition metals and oxides 25, 67, 30. The corrosive
peroxide species can oxidize the metal species, damaging the binder
and carbon constituents 25.
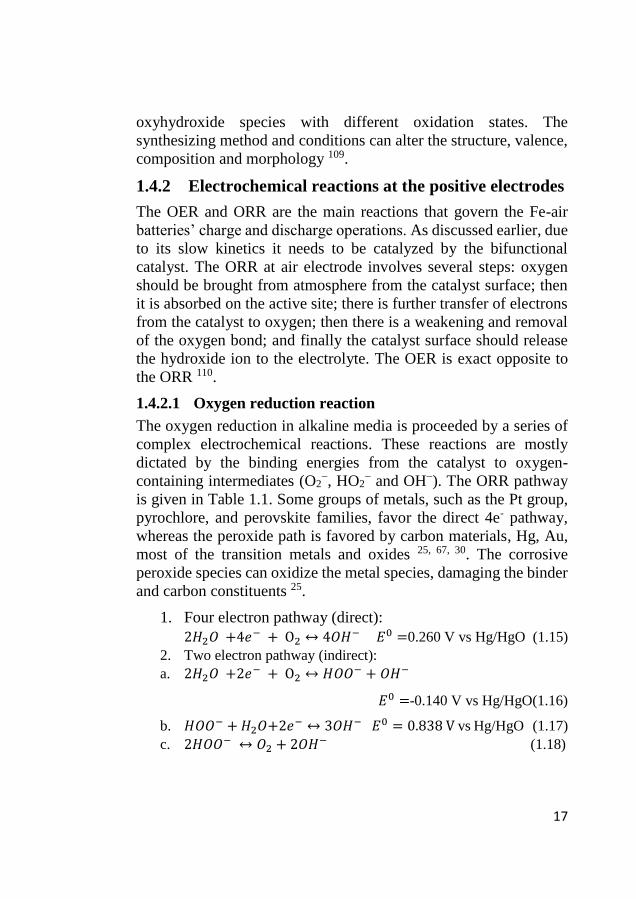
1. Four electron pathway (direct):
2𝐻2𝑂 +4𝑒− + O2 ↔ 4𝑂𝐻− 𝐸0 =0.260 V vs Hg/HgO (1.15)
2. Two electron pathway (indirect):
a. 2𝐻2𝑂 +2𝑒− + O2 ↔ 𝐻𝑂𝑂− + 𝑂𝐻−
𝐸0 =-0.140 V vs Hg/HgO(1.16)
b. 𝐻𝑂𝑂− + 𝐻2𝑂+2𝑒− ↔ 3𝑂𝐻− 𝐸0 = 0.838 V vs Hg/HgO (1.17)
c. 2𝐻𝑂𝑂− ↔ 𝑂2 + 2𝑂𝐻− (1.18)
18
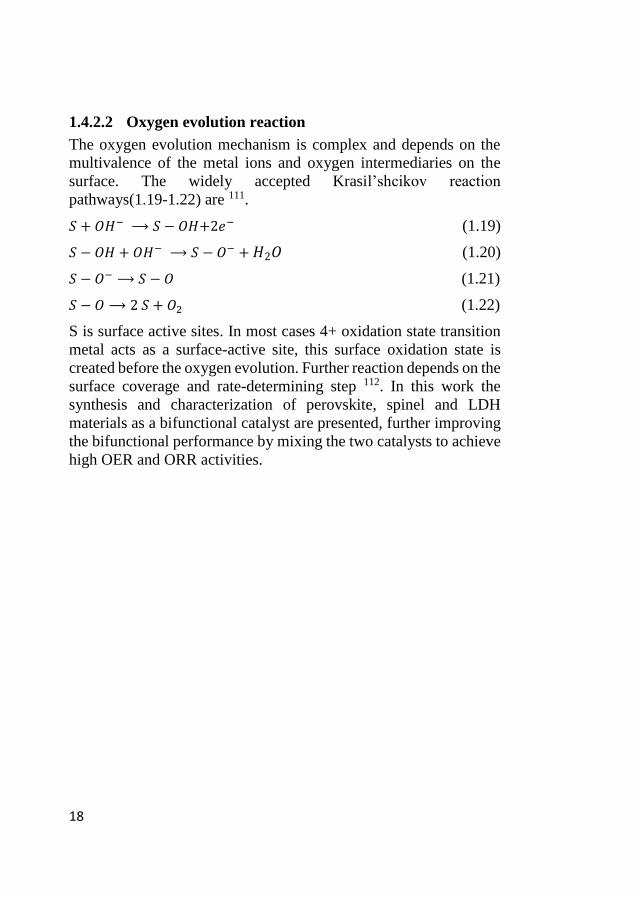
1.4.2.2 Oxygen evolution reaction
The oxygen evolution mechanism is complex and depends on the
multivalence of the metal ions and oxygen intermediaries on the
surface. The widely accepted Krasil’shcikov reaction
pathways(1.19-1.22) are 111.
𝑆 + 𝑂𝐻− ⟶ 𝑆 − 𝑂𝐻+2𝑒− (1.19)
𝑆 − 𝑂𝐻 + 𝑂𝐻− ⟶ 𝑆 − 𝑂− +𝐻2𝑂 (1.20)
𝑆 − 𝑂−⟶ 𝑆 −𝑂 (1.21)
𝑆 − 𝑂 ⟶ 2 𝑆 + 𝑂2 (1.22)
S is surface active sites. In most cases 4+ oxidation state transition
metal acts as a surface-active site, this surface oxidation state is
created before the oxygen evolution. Further reaction depends on the
surface coverage and rate-determining step 112. In this work the
synthesis and characterization of perovskite, spinel and LDH
materials as a bifunctional catalyst are presented, further improving
the bifunctional performance by mixing the two catalysts to achieve
high OER and ORR activities.
19
1.5 Scope of the thesis
This work aims to explore and develop low-cost iron electrodes and
electrocatalytic oxygen electrodes for alkaline Fe-air batteries.
Furthermore, different inexpensive materials are synthesized, and
their performance mechanisms are investigated. The primary goal is
to prepare highly active electrode materials with low environmental
impact and easy preparation methods.
The overall goal is to prepare and characterize a robust electrode for
a positive and negative electrode for a metal-air battery application.
Negative iron electrode materials are studied in papers I and III
regarding specific capacity, charge efficiency, life cycles,
electrochemical activity and the effect of current density on
electrode performances. The air electrode as a positive electrode
material, e.g. spinel and perovskite, is studied with regard to
electrochemical properties, electrocatalytic performance, stability,
and structural stability during and after cycling in papers II and IV.

20

21
PART II: EXPERIMENTAL
METOHDS

22
23
PART II Experimental methods
2 Experimental methods The active materials used in this thesis are Cu and Sn-doped iron-
based negative electrode materials, and perovskite (La1-xCaxMnO3)
and spinel type (CoOx and NiFeOx) based oxygen electrode
materials. In this section, details about used materials, synthesis,
materials characterization methods, electrode manufacturing
procedure, and electrochemical characterizations are explained.
2.1 Materials synthesis and electrode preparation
2.1.1 Iron negative electrodes
2.1.1.1 Materials
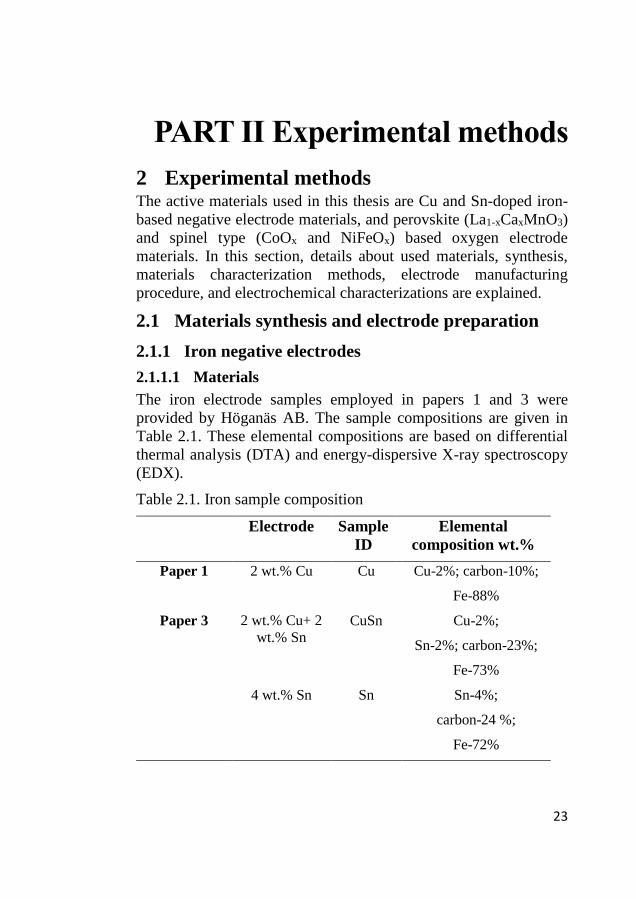
The iron electrode samples employed in papers 1 and 3 were
provided by Höganäs AB. The sample compositions are given in
Table 2.1. These elemental compositions are based on differential
thermal analysis (DTA) and energy-dispersive X-ray spectroscopy
(EDX).
Table 2.1. Iron sample composition
Electrode Sample
ID
Elemental
composition wt.%
Paper 1 2 wt.% Cu Cu Cu-2%; carbon-10%;
Fe-88%
Paper 3 2 wt.% Cu+ 2
wt.% Sn
CuSn Cu-2%;
Sn-2%; carbon-23%;
Fe-73%
4 wt.% Sn Sn Sn-4%;
carbon-24 %;
Fe-72%
24
2.1.1.2 Iron electrode preparations
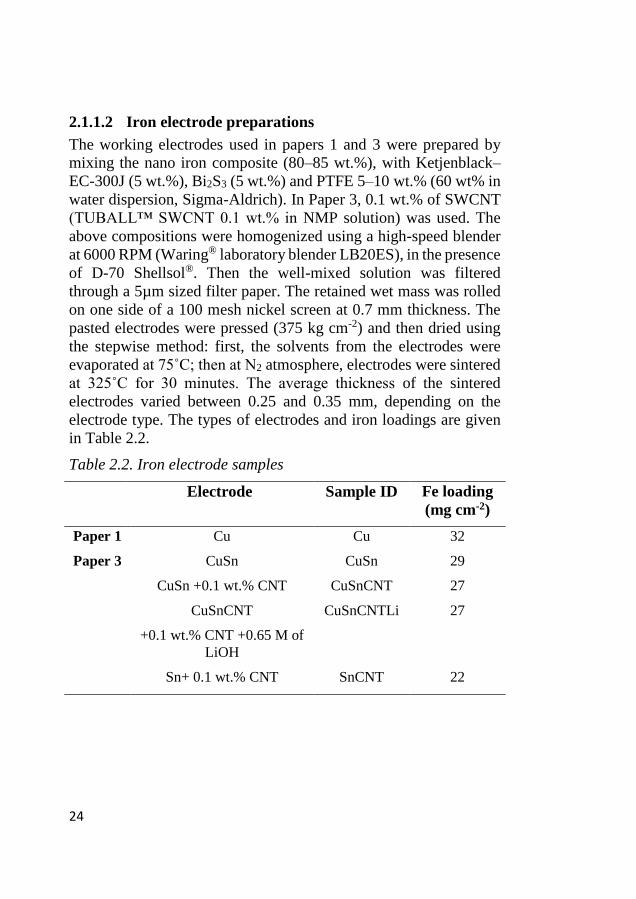
The working electrodes used in papers 1 and 3 were prepared by
mixing the nano iron composite (80–85 wt.%), with Ketjenblack–
EC-300J (5 wt.%), Bi2S3 (5 wt.%) and PTFE 5–10 wt.% (60 wt% in
water dispersion, Sigma-Aldrich). In Paper 3, 0.1 wt.% of SWCNT
(TUBALL™ SWCNT 0.1 wt.% in NMP solution) was used. The
above compositions were homogenized using a high-speed blender
at 6000 RPM (Waring® laboratory blender LB20ES), in the presence
of D-70 Shellsol®. Then the well-mixed solution was filtered
through a 5µm sized filter paper. The retained wet mass was rolled
on one side of a 100 mesh nickel screen at 0.7 mm thickness. The
pasted electrodes were pressed (375 kg cm-2) and then dried using
the stepwise method: first, the solvents from the electrodes were
evaporated at 75˚C; then at N2 atmosphere, electrodes were sintered
at 325˚C for 30 minutes. The average thickness of the sintered
electrodes varied between 0.25 and 0.35 mm, depending on the
electrode type. The types of electrodes and iron loadings are given
in Table 2.2.
Table 2.2. Iron electrode samples
Electrode Sample ID Fe loading
(mg cm-2)
Paper 1 Cu Cu 32
Paper 3 CuSn CuSn 29
CuSn +0.1 wt.% CNT CuSnCNT 27
CuSnCNT
+0.1 wt.% CNT +0.65 M of
LiOH
CuSnCNTLi 27
Sn+ 0.1 wt.% CNT SnCNT 22
25
2.1.2 Oxygen electrode materials
Electrocatalyst activity highly depends on structure, valence,
composition and morphology, and is easily altered by tuning
synthesis methods and conditions 113. By altering the preparation
conditions, the electrocatalytic active metal center can be varied to
have different crystallinity, phase and crystallite size, and oxidation
state 109.
Traditionally, transition metal oxides are prepared through the
conventional solid-state ceramic method, which involves grinding
and firing the precursors of carbonates and nitrates at high
temperature. While this method is time-consuming and energy-
intensive, it only produces a micro-sized wide distribution of
nonuniform and low surface area particles, which have poor
electrochemical activity 114, 115. Nowadays, there are several other
low-temperature routes to produce the nanoparticles by solution-
based methods, such as sol-gel, co-precipitation, hydrothermal,
iono-thermal, micro-emulsion, microwave, and electrochemical
synthesis. Among these several routes, co-precipitation and
hydrothermal synthesis are easily scalable, have low-production
cost, involve fewer toxic chemicals, have high purity, and
homogenous and uniform-sized particles are easily produced 116-
118.
In this thesis, the carbonate- and hydroxide-assisted co-precipitation
method was used in Paper 2 to synthesize perovskite La0.1Ca0.9MnO3
(LCMO) and Co3O4, respectively.
2.1.2.1 Preparation of La 0.1Ca 0.9MnO3
Here the carbonate-assisted co-precipitation method was used
(Paper 2) to prepare the initial carbonate hydroxide product. Then it
was heated to get the final desired product. The precursors of Mn,
La, Ca (1:0.11:0.9) salts were first dissolved in distilled water. Then
to the heated solution (60 oC) was slowly added to the 0.5 M sodium
carbonate solution (60 oC) and stirred vigorously. The precipitated
product was dried at 120 oC for 12 h. The homogenized product was
sintered at 700 oC in air for 6 h and was rapidly quenched in a water-
26
cooled zone. The resultant final product was washed in 5% acetic
acid to remove the unreacted reactant and reduce the strong
alkalinity 23.
2.1.2.2 Preparation of Co3O4
The hydroxide-mediated co-precipitation method was employed
(Paper 2) to get the spinel cobalt oxide. The cobalt acetate
tetrahydrate (9.66 g-VWR chemicals) was solubilized in 200 ml of
methanol (≥99.8%, SIGMA-ALDRICH). The solution was heated
and stirred in a two-necked 0.5 L flat-bottom flask at below 65 oC.
Another 200 ml of deionized water and isopropyl alcohol (1:1) was
added, and the solution temperature was raised to 90 ºC with a
vigorous mixing by magnetic stirring. To avoid evaporation, a reflux
condenser was connected to the two-necked flask. Then 1 M NaOH
(100 ml) was added to the cobalt ion solution. The solution
transformed from pink to blue, to green and finally to a brownish
color upon sol-precipitation. This solution was aged for 16 h in pure
oxygen bubbling at 50 ml min-1. After aging, the solution was
allowed to settle at room temperature for 24 h. Then the precipitant
was centrifuged (3000 rpm) and washed in ethanol and water several
times to remove the unreacted impurities. The final particles were
dried overnight at 60 oC and heated for 2 h at 300 oC to remove the
solvents. The obtained product was used for further characterization
and electrode-making processes.23 The schematic chemical
reactions are described below in equations (2.1-2.2):
Co(CH₃COO)₂+ 2 NaOH → Co(OH)2(s)+ 2 CH3COONa (2.1)
3 Co(OH)2+ ½ O2 → Co3O4(s)+ 3H2O (2.2)
2.1.2.3 Preparation of NiFeOX
The urea-assisted hydrothermal method was used to obtain the
cylindrical shape nanoparticle in Paper 4119. The nickel and iron
chloride salts and urea were dissolved together in 5:10:35 mM ratios
in 80 ml distilled water. The solution was autoclaved (100 bar) in a
Teflon-lined steel vessel at 100 ˚C for 48 h. The reacted product was
centrifuged and washed several times in deionized water and
27
ethanol. The product was dried and sintered at different temperatures
for 4 h (100, 250, 450 and 600 ˚C at the rate of 2 ˚C min-1).
The corresponding reactions are given in the following equations
(2.3-2.5):
CO(NH2)2 + 2H2O → 2NH4+ + CO3
2− (2.3)
(Ni2+, Fe 3+)+ CO32-+ OH-
100 ˚𝐶−48 ℎ𝑟𝑠→ (Ni Fe)2CO3 (OH)2. H2O (2.4)
(Ni Fe)2 CO3 (OH)2. H2O 𝑇 ˚𝐶→ NiFe2O4 + CO2 + H2O (2.5)
2.1.3 Composite air electrode preparation
The composite electrode has an electrocatalyst layer, a current
collector (Ni mesh), and a PTFE layer, which are sandwiched one
over another in a series (Paper 2). The catalyst layer is prepared by
mixing all ingredients with D-70® Shellsol at a required ratio, as
shown in Table 2.3, in a Waring® laboratory blender (LB20ES) at
6000 rpm. The mixed solution was filtered and the retained paste
was rolled onto a 100 mesh Ni-screen. The pasted electrode was
mechanically pressed at 375 kg cm-2. After this, another side of the
electrode was brush painted by 20 wt.% PTFE solution. The roll-
compacted electrode was sintered at 325 oC in N2 atmosphere. The
final electrode dimension was 30*50*0.35(±0.05) mm,3 and the
active materials loadings are shown in Table 2. 3.
28
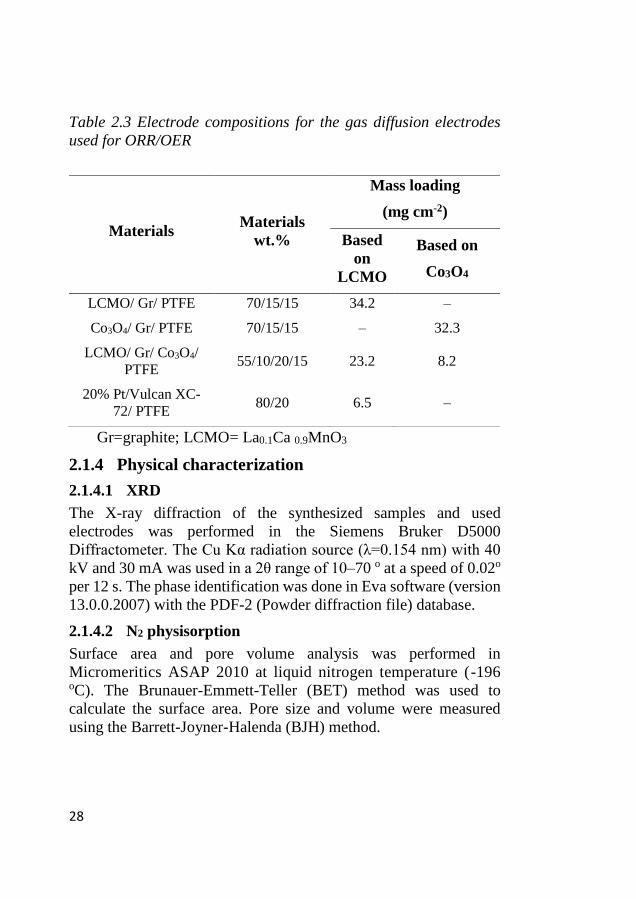
Table 2.3 Electrode compositions for the gas diffusion electrodes
used for ORR/OER
Gr=graphite; LCMO= La0.1Ca 0.9MnO3
2.1.4 Physical characterization
2.1.4.1 XRD
The X-ray diffraction of the synthesized samples and used
electrodes was performed in the Siemens Bruker D5000
Diffractometer. The Cu Kα radiation source (λ=0.154 nm) with 40
kV and 30 mA was used in a 2θ range of 10–70 o at a speed of 0.02o
per 12 s. The phase identification was done in Eva software (version
13.0.0.2007) with the PDF-2 (Powder diffraction file) database.
2.1.4.2 N2 physisorption
Surface area and pore volume analysis was performed in
Micromeritics ASAP 2010 at liquid nitrogen temperature (-196
oC). The Brunauer-Emmett-Teller (BET) method was used to
calculate the surface area. Pore size and volume were measured
using the Barrett-Joyner-Halenda (BJH) method.
Materials Materials
wt.%
Mass loading
(mg cm-2)
Based
on
LCMO
Based on
Co3O4
LCMO/ Gr/ PTFE 70/15/15 34.2 –
Co3O4/ Gr/ PTFE 70/15/15 – 32.3
LCMO/ Gr/ Co3O4/
PTFE 55/10/20/15 23.2 8.2
20% Pt/Vulcan XC-
72/ PTFE 80/20 6.5 –
29
2.1.4.3 Scanning and transmission electron microscopy (SEM-
TEM)
The surface morphology and Energy-dispersive X-ray spectroscopy
(EDX) of the samples was performed using the Zeiss Ultra-55
scanning electron microscope (SEM). The samples were used as
synthesized or dried electrodes. The high-resolution transmission
electron microscope (TEM) images were obtained from JEOL JEM-
2100F.
2.1.4.4 X-ray photoelectron spectroscopy (XPS)
The oxidation state of the samples was analyzed using PHI Quantum
2000 scanning XPS microprobe with monochromatic Al Kα
radiation. The spot size and energy resolution were set to be 0.1×0.1
µm2 and 0.3 eV. The intensity of the peak was calculated from the
area above the background to fit-XPS software.
2.1.4.5 Raman spectroscopy
The Raman spectrum was measured using an imaging spectrometer
(iHR550, Horiba Jobin Yvon) in confocal geometry, using the light
excitation of 532 nm. Further, the scattered light was filtered around
532 nm using a notch filter at ± 50 cm−1.
30
2.1.5 Electrochemical measurements
2.1.5.1 Iron electrode testing
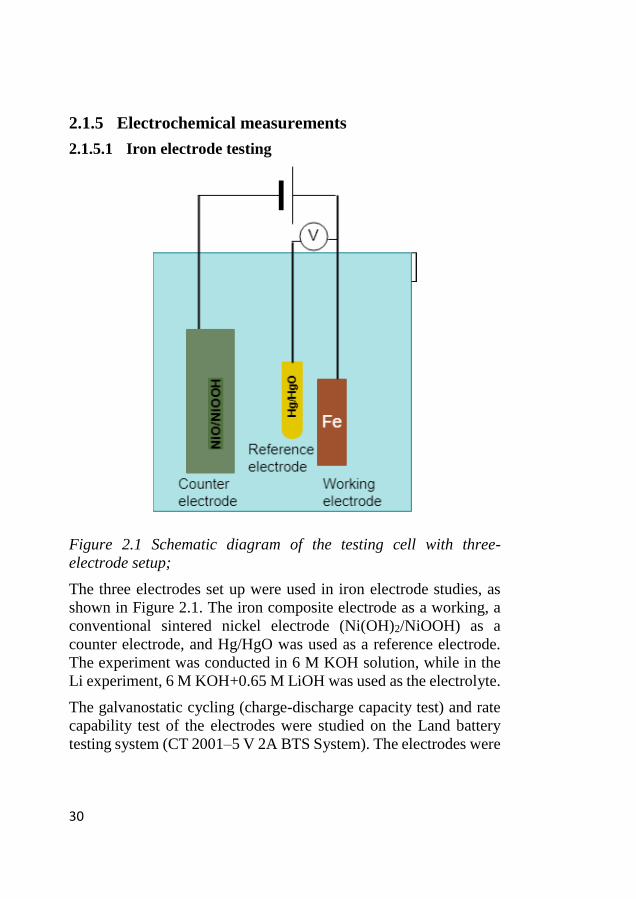
Figure 2.1 Schematic diagram of the testing cell with three-
electrode setup;
The three electrodes set up were used in iron electrode studies, as
shown in Figure 2.1. The iron composite electrode as a working, a
conventional sintered nickel electrode (Ni(OH)2/NiOOH) as a
counter electrode, and Hg/HgO was used as a reference electrode.
The experiment was conducted in 6 M KOH solution, while in the
Li experiment, 6 M KOH+0.65 M LiOH was used as the electrolyte.
The galvanostatic cycling (charge-discharge capacity test) and rate
capability test of the electrodes were studied on the Land battery
testing system (CT 2001–5 V 2A BTS System). The electrodes were
31
charged and discharged at 200 mA g-1 and 100 mA g-1 (approx. C/5
and C/10 h).
The cyclic voltammetry (CV) and polarization experiments were
performed at 1 and 0.167 mV s-1, respectively, on SP-50 potentiostat
(Biologic Science Instruments).
For the galvanostatic polarization, step current was varied from 1
mA cm−2 to 15 mA cm−2 and the step duration was 5 minutes. The
reported results were mass transfer and ohmic resistance corrected 120.
The impedance measurement was conducted on a fully charged
electrode from 100mHz to 100kHz with 5 mV AC amplitude on
Gamry PCI 4 G750 potentiostat, while the analysis was performed
on Biologic science instrument with software (EC-Lab 10.44).
In Paper 3, in operando charge efficiency measurements were
conducted in a two-electrode setup with special provision to the
sample of the evolved gasses in mass spectrometry. The cell setup
and equipment description were based on Svengren et al.’s earlier
work 121. Here, a formed iron electrode (2.25 cm2) was cycled
against the sintered Ni electrode (9 cm2). All the electrodes were
subjected to three different charge current densities 5, 10 and 15 mA
cm-2 and a discharge current density of 5 mA cm-2 for three cycles.
32
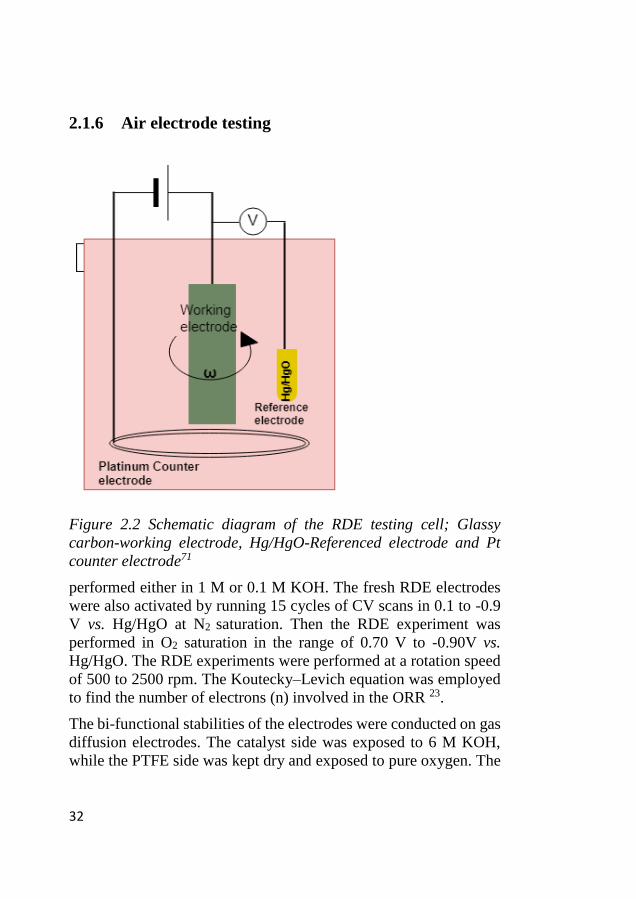
2.1.6 Air electrode testing
Figure 2.2 Schematic diagram of the RDE testing cell; Glassy
carbon-working electrode, Hg/HgO-Referenced electrode and Pt
counter electrode71
performed either in 1 M or 0.1 M KOH. The fresh RDE electrodes
were also activated by running 15 cycles of CV scans in 0.1 to -0.9
V vs. Hg/HgO at N2 saturation. Then the RDE experiment was
performed in O2 saturation in the range of 0.70 V to -0.90V vs.
Hg/HgO. The RDE experiments were performed at a rotation speed
of 500 to 2500 rpm. The Koutecky–Levich equation was employed
to find the number of electrons (n) involved in the ORR 23.
The bi-functional stabilities of the electrodes were conducted on gas
diffusion electrodes. The catalyst side was exposed to 6 M KOH,
while the PTFE side was kept dry and exposed to pure oxygen. The
33
stability test was conducted by 50 potential cycles: -0.35 to 0.70 V
vs. Hg/HgO at 5 mV s-1 scan rate. Meanwhile, the same test was
done on NiFeOx on glassy carbon substrate instead of gas diffusion
electrodes.
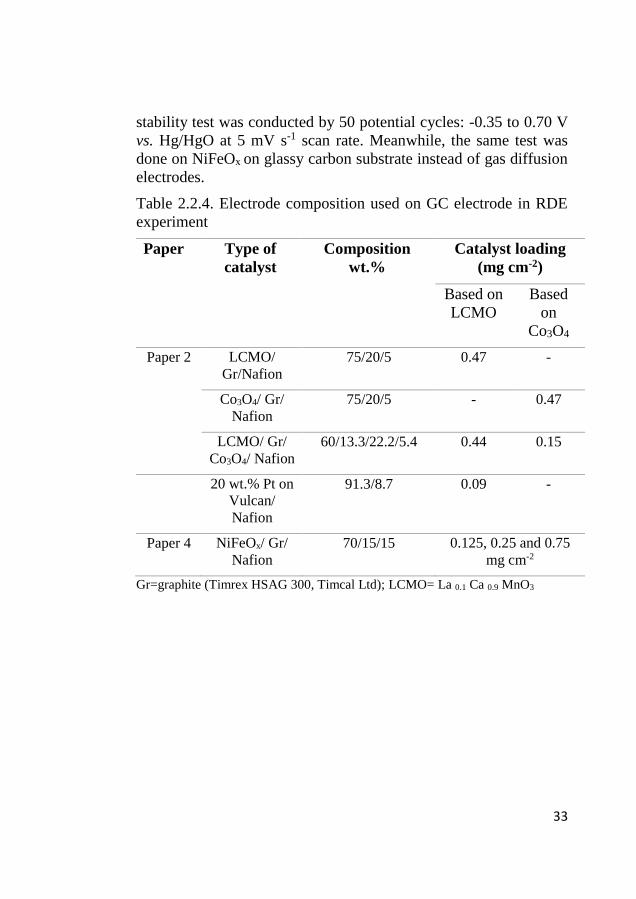
Table 2.2.4. Electrode composition used on GC electrode in RDE
experiment
Paper Type of
catalyst
Composition
wt.%
Catalyst loading
(mg cm-2)
Based on
LCMO
Based
on
Co3O4
Paper 2 LCMO/
Gr/Nafion
75/20/5 0.47 -
Co3O4/ Gr/
Nafion
75/20/5 - 0.47
LCMO/ Gr/
Co3O4/ Nafion
60/13.3/22.2/5.4 0.44 0.15
20 wt.% Pt on
Vulcan/
Nafion
91.3/8.7 0.09 -
Paper 4 NiFeOx/ Gr/
Nafion
70/15/15 0.125, 0.25 and 0.75
mg cm-2
Gr=graphite (Timrex HSAG 300, Timcal Ltd); LCMO= La 0.1 Ca 0.9 MnO3

34

35
PART III: RESULTS AND
DISCUSSION

36
37
PART III RESULTS AND
DISCUSSION
3 Results and Discussion This chapter summarizes the important results attached to this thesis.
The results of the iron electrode materials testing are presented and
discussed in chapter 3. After that, the air electrode results are
summarized and explained in chapter 4.
3 Studies on Cu and Sn-doped nano iron electrodes This section summarizes the results from papers 1 and 3 appended
to this thesis. The samples’ details, characterization method, and
procedure are elaborated in sections 2.1.1 and 2.3.
3.1 Phase identification of the Cu and Sn doped iron
samples
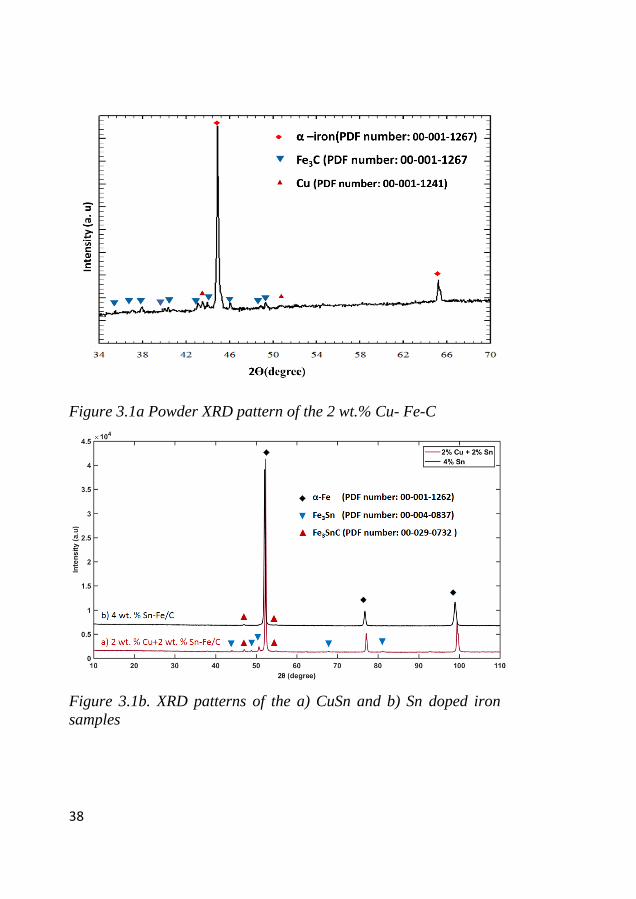
Figure 3.1a and b present XRD patterns of Fe with Cu and CuSn
(CuSn (a) and Sn (b) samples. All three samples have α-iron as a
major phase. The Cu sample also has iron carbide (cementite and
cohenite) and metallic copper as other minor phases and Scherrer
crystallite size at iron plane reflection (211-2ϴ: 44.5-45º) is about
52 nm. Fe3SnC was also observed as a minor phase in only the Sn
sample; when 2 wt.% Cu was introduced with 2 wt.% Sn, with traces
of Fe3SnC. There were no metallic phases of Cu, Sn and carbon
phases due to the low concentrations of the respective elements.
Though the TGA and EDX measurement showed more than 20 wt.%
carbon, it was not observed in XRD, which suggests that carbon is
in the amorphous phase. This carbon may improve electrode
conductivity, as a porous network contributes to ionic conductivity 122, 123. Also, carbon might buffer the volume expansion and improve
electrical conductivity along with Cu, and Sn of the iron electrode
during the electrochemical cycling 124.
38
Figure 3.1a Powder XRD pattern of the 2 wt.% Cu- Fe-C
Figure 3.1b. XRD patterns of the a) CuSn and b) Sn doped iron
samples
39
3.2 Surface and porosity of Cu and Sn doped iron
samples
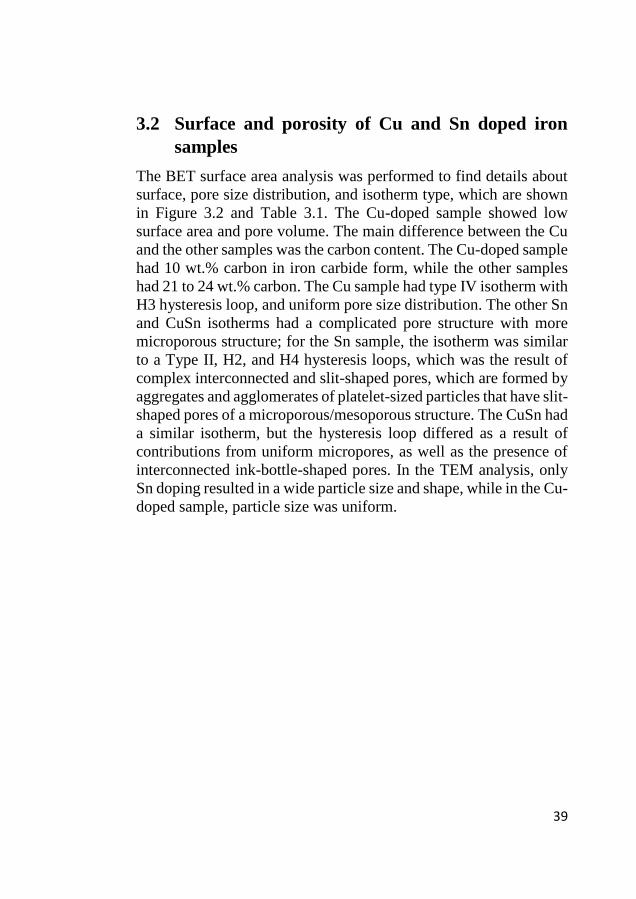
The BET surface area analysis was performed to find details about
surface, pore size distribution, and isotherm type, which are shown
in Figure 3.2 and Table 3.1. The Cu-doped sample showed low
surface area and pore volume. The main difference between the Cu
and the other samples was the carbon content. The Cu-doped sample
had 10 wt.% carbon in iron carbide form, while the other samples
had 21 to 24 wt.% carbon. The Cu sample had type IV isotherm with
H3 hysteresis loop, and uniform pore size distribution. The other Sn
and CuSn isotherms had a complicated pore structure with more
microporous structure; for the Sn sample, the isotherm was similar
to a Type II, H2, and H4 hysteresis loops, which was the result of
complex interconnected and slit-shaped pores, which are formed by
aggregates and agglomerates of platelet-sized particles that have slit-
shaped pores of a microporous/mesoporous structure. The CuSn had
a similar isotherm, but the hysteresis loop differed as a result of
contributions from uniform micropores, as well as the presence of
interconnected ink-bottle-shaped pores. In the TEM analysis, only
Sn doping resulted in a wide particle size and shape, while in the Cu-
doped sample, particle size was uniform.
40
Figure 3.2. The N2 isotherm of Cu, CuSn, and Sn-doped iron
materials.
Table 3.1. BET surface areas and pore characteristics.
Sample
BET surface
area(m2 g-1)
Pore
volume
(cm3 g-1)
Average
pore size
(nm)
Cu 7.4 0.04 22.7
CuSn 55.0 0.09 8.0
Sn 69.2 0.11 9.6
41
3.3 Morphology of the Cu and Sn doped iron samples
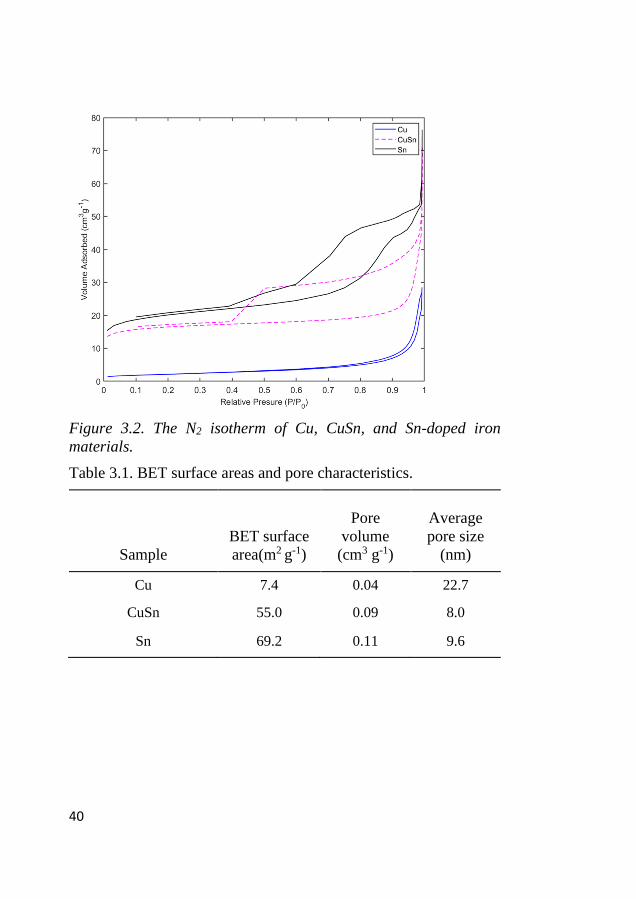
Figure 3.3(a–c) shows TEM and selected area electron diffraction
(SAED) image of Cu sample. In Figure 3.3 (a–b), the particles were
present in a core-shell structure with sizes varying from 20 to 100
nm. Also, one to four particles showed agglomerate iron into one
bigger particle. The shell thickness was around 20 nm, as shown in
Figure 3.3c. The inset Figure 3.3c shows the SAED pattern of core
and shell. The core diffraction interplanar distance was 1.04 Å,
while the shell’s interplanar distance (1.82 Å) was different from the
core. This interplanar distance corresponded to α-iron (220) plane
and Fe3C (cohenite) (122) plane, respectively. This shell carbide
layer might help to prevent nanoparticle growth and agglomeration.
The TEM-SAED results also endorsed the XRD findings as α-iron
and Fe3C cohenite 125.
Figure 3.3. TEM image of Cu sample; a) TEM b) HRTEM; c) SAED
pattern
TEM images of CuSn and Sn samples are shown in Figure 3.4.
Figure 3.4a shows the particle morphology of the CuSn sample,
which had particle sizes varying from 100 to 300 nm spread over the
thin sheet of the carbon layer. The Sn sample (Figure 3.4b) had an
uneven and irregular particle size (30–150 nm). Overall, based on
TEM mass contrast, the CuSn sample had a dark and interconnected
particle, while the Sn sample consisted of thinner and lighter
platelet-shaped particles. Therefore, closely sintered and
interconnected CuSn particles might have higher electrode
conductivity and enhance electrochemical performance 126.
42
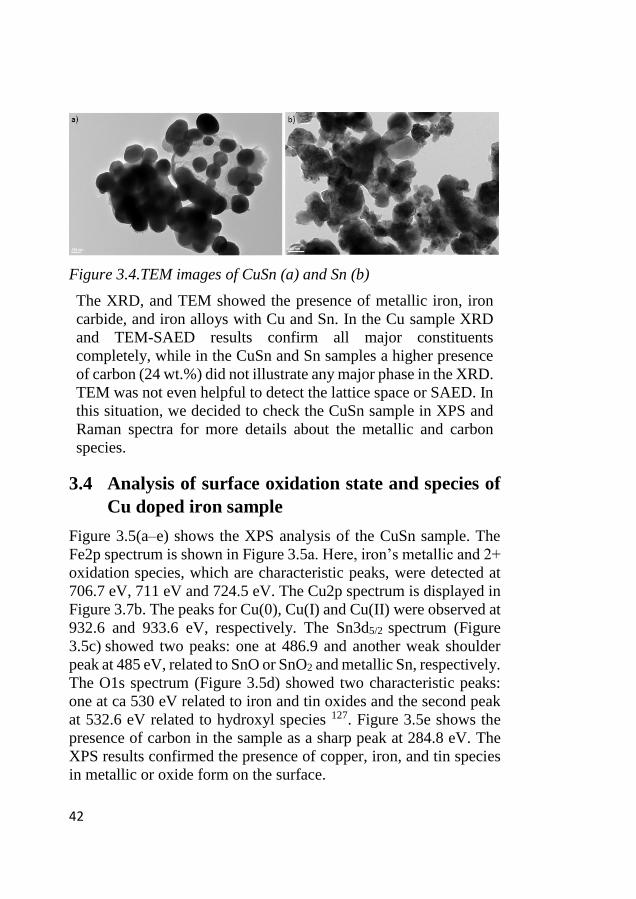
Figure 3.4.TEM images of CuSn (a) and Sn (b)
The XRD, and TEM showed the presence of metallic iron, iron
carbide, and iron alloys with Cu and Sn. In the Cu sample XRD
and TEM-SAED results confirm all major constituents
completely, while in the CuSn and Sn samples a higher presence
of carbon (24 wt.%) did not illustrate any major phase in the XRD.
TEM was not even helpful to detect the lattice space or SAED. In
this situation, we decided to check the CuSn sample in XPS and
Raman spectra for more details about the metallic and carbon
species.
3.4 Analysis of surface oxidation state and species of
Cu doped iron sample
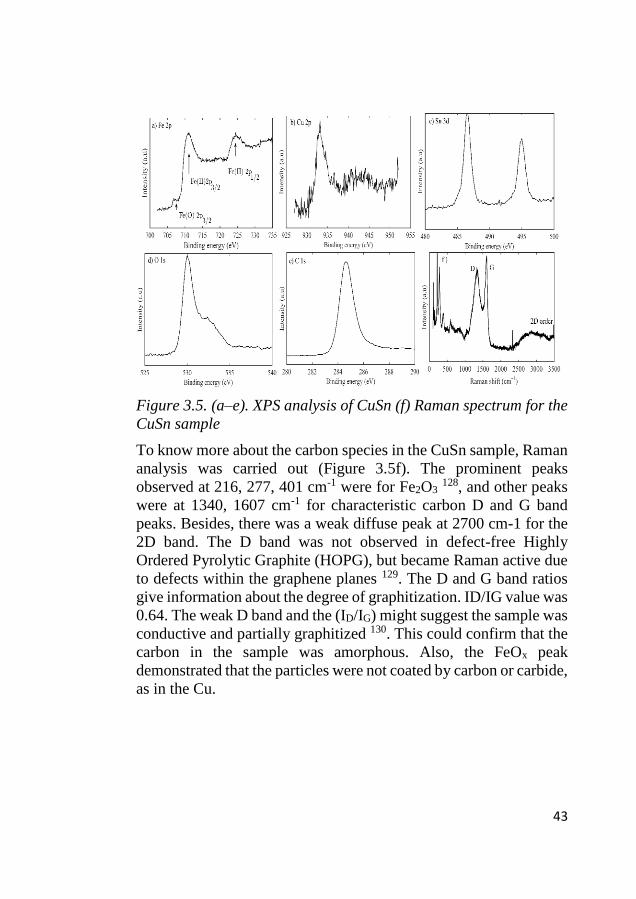
Figure 3.5(a–e) shows the XPS analysis of the CuSn sample. The
Fe2p spectrum is shown in Figure 3.5a. Here, iron’s metallic and 2+
oxidation species, which are characteristic peaks, were detected at
706.7 eV, 711 eV and 724.5 eV. The Cu2p spectrum is displayed in
Figure 3.7b. The peaks for Cu(0), Cu(I) and Cu(II) were observed at
932.6 and 933.6 eV, respectively. The Sn3d5/2 spectrum (Figure
3.5c) showed two peaks: one at 486.9 and another weak shoulder
peak at 485 eV, related to SnO or SnO2 and metallic Sn, respectively.
The O1s spectrum (Figure 3.5d) showed two characteristic peaks:
one at ca 530 eV related to iron and tin oxides and the second peak
at 532.6 eV related to hydroxyl species 127. Figure 3.5e shows the
presence of carbon in the sample as a sharp peak at 284.8 eV. The
XPS results confirmed the presence of copper, iron, and tin species
in metallic or oxide form on the surface.
43
Figure 3.5. (a–e). XPS analysis of CuSn (f) Raman spectrum for the
CuSn sample
To know more about the carbon species in the CuSn sample, Raman
analysis was carried out (Figure 3.5f). The prominent peaks
observed at 216, 277, 401 cm-1 were for Fe2O3 128, and other peaks
were at 1340, 1607 cm-1 for characteristic carbon D and G band
peaks. Besides, there was a weak diffuse peak at 2700 cm-1 for the
2D band. The D band was not observed in defect-free Highly
Ordered Pyrolytic Graphite (HOPG), but became Raman active due
to defects within the graphene planes 129. The D and G band ratios
give information about the degree of graphitization. ID/IG value was
0.64. The weak D band and the (ID/IG) might suggest the sample was
conductive and partially graphitized 130. This could confirm that the
carbon in the sample was amorphous. Also, the FeOx peak
demonstrated that the particles were not coated by carbon or carbide,
as in the Cu.
44
3.5 Electroanalytical Characterization of Cu and Sn
doped iron sample
3.5.1 Cyclic voltammetry of Cu doped iron
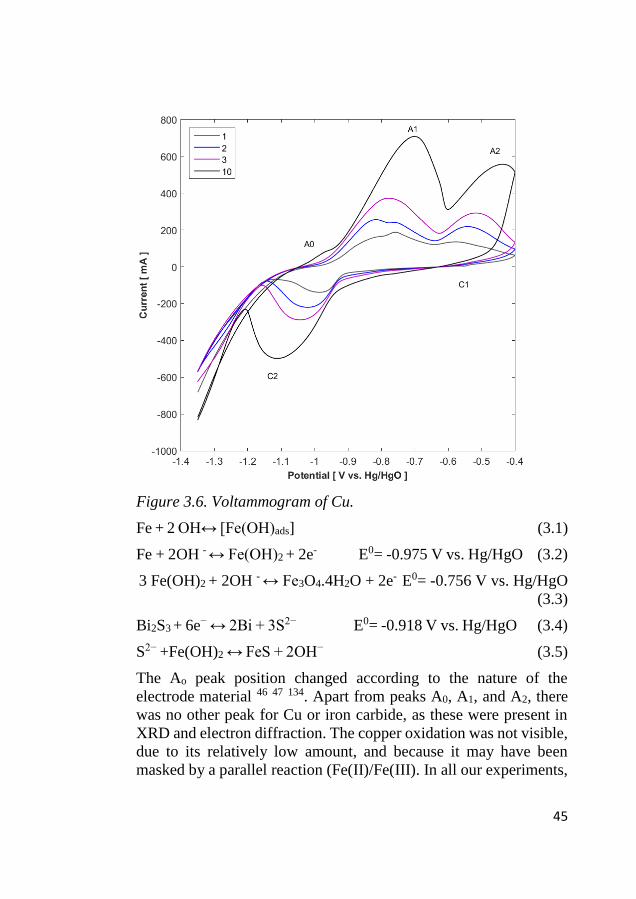
The electrochemical redox activity of the Cu-doped iron was
examined using cyclic voltammetry. Figure 3.6 shows cyclic
voltammogram from first to tenth cycles. During an anodic sweep
of initial cycles, a broad peak was observed (-1 V to -0.7 V)
consisting of two shoulders at -0.825 V and -0.76 V, corresponding
to Equations 3.1 and 3.5, respectively, where the hydroxide ion
chemically reacts to form the in situ sulfide formation at the
electrode structure 28, 131. This formation is entirely dependent on the
availability of iron (II) hydroxide. This double peak evolved to be a
single peak from five cycles onwards. At cycle ten, three well-
developed anodic peaks were observed at A0 (-0.966 V), A1 (-0.70
V), and A2 (-0.44 V). The peak A0 was related to the adsorption of
hydroxide ion (Equation 1) 132, where the A1 peak was related to
oxidation of Fe to Fe(II) (Equation 2), and A2 related Fe(II) to Fe(III)
formation (Equation 3).The redox reactions are shown in equations
3.1 to 3.5 28, 132, 133:
45
Figure 3.6. Voltammogram of Cu.
Fe + 2 OH↔ [Fe(OH)ads] (3.1)
Fe + 2OH - ↔ Fe(OH)2 + 2e- E0= -0.975 V vs. Hg/HgO (3.2)
3 Fe(OH)2 + 2OH - ↔ Fe3O4.4H2O + 2e- E0= -0.756 V vs. Hg/HgO
(3.3)
Bi2S3 + 6e− ↔ 2Bi + 3S2− E0= -0.918 V vs. Hg/HgO (3.4)
S2− +Fe(OH)2 ↔ FeS + 2OH− (3.5)
The Ao peak position changed according to the nature of the
electrode material 46 47 134. Apart from peaks A0, A1, and A2, there
was no other peak for Cu or iron carbide, as these were present in
XRD and electron diffraction. The copper oxidation was not visible,
due to its relatively low amount, and because it may have been
masked by a parallel reaction (Fe(II)/Fe(III). In all our experiments,
46
electrodes were only cycled between the iron oxidation up to a 2+
oxidation state (-1.2 V to -0.75 V vs. Hg/HgO). Therefore, in our
potential operating range, the Cu and iron carbide were stable
enough to maintain their desired function. The reduction direction
had two peaks: one at C1 at -0.55 V for the redox reaction of
Fe(OH)2/FeOOH, which faded after two cycles 47. The second broad
peak (C2) occurred at -1.12 V for Fe(OH)2/Fe, and shifted
cathodically when the number of cycles increased. The broad C1
peak is for the reduction of several species (Fe3O4 to Fe (OH)2,
Fe(OH)2 to Fe). Following this, hydrogen evolution was
predominant from -1.21 V. The Cu-doped iron exhibited a very high
reduction current (0.5 A) at a peak potential of -1.12 V, which is
favorable for better utilization and battery operations at high
discharge rates.
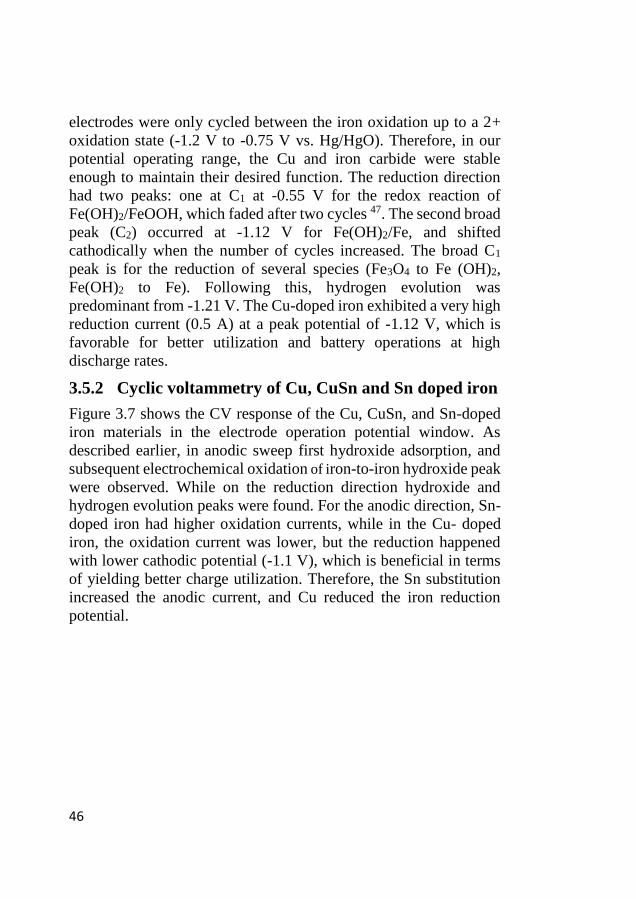
3.5.2 Cyclic voltammetry of Cu, CuSn and Sn doped iron
Figure 3.7 shows the CV response of the Cu, CuSn, and Sn-doped
iron materials in the electrode operation potential window. As
described earlier, in anodic sweep first hydroxide adsorption, and
subsequent electrochemical oxidation of iron-to-iron hydroxide peak
were observed. While on the reduction direction hydroxide and
hydrogen evolution peaks were found. For the anodic direction, Sn-
doped iron had higher oxidation currents, while in the Cu- doped
iron, the oxidation current was lower, but the reduction happened
with lower cathodic potential (-1.1 V), which is beneficial in terms
of yielding better charge utilization. Therefore, the Sn substitution
increased the anodic current, and Cu reduced the iron reduction
potential.
47
Figure 3.7. Voltammogram of Cu, CuSn, and Sn-doped iron.
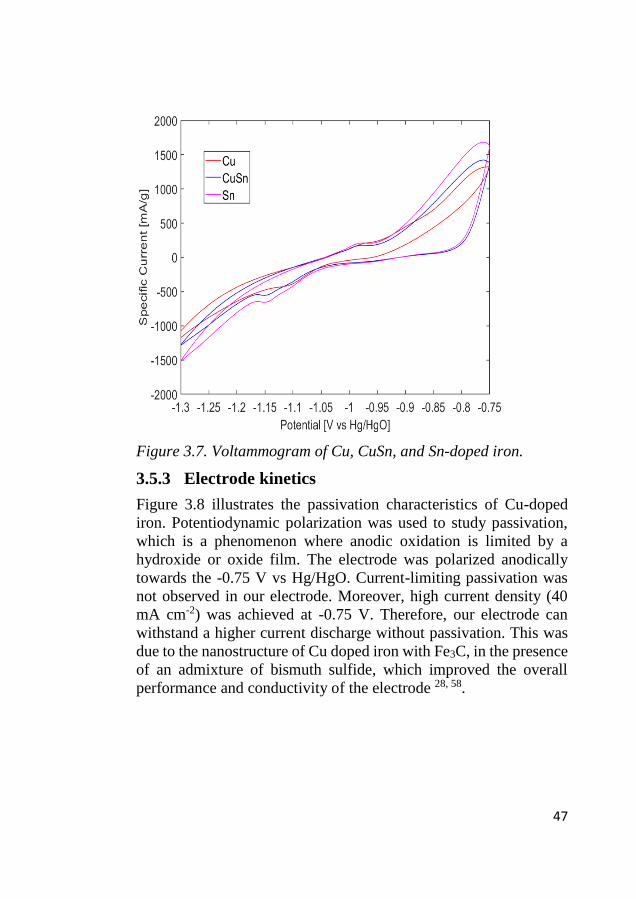
3.5.3 Electrode kinetics
Figure 3.8 illustrates the passivation characteristics of Cu-doped
iron. Potentiodynamic polarization was used to study passivation,
which is a phenomenon where anodic oxidation is limited by a
hydroxide or oxide film. The electrode was polarized anodically
towards the -0.75 V vs Hg/HgO. Current-limiting passivation was
not observed in our electrode. Moreover, high current density (40
mA cm-2) was achieved at -0.75 V. Therefore, our electrode can
withstand a higher current discharge without passivation. This was
due to the nanostructure of Cu doped iron with Fe3C, in the presence
of an admixture of bismuth sulfide, which improved the overall
performance and conductivity of the electrode 28, 58.
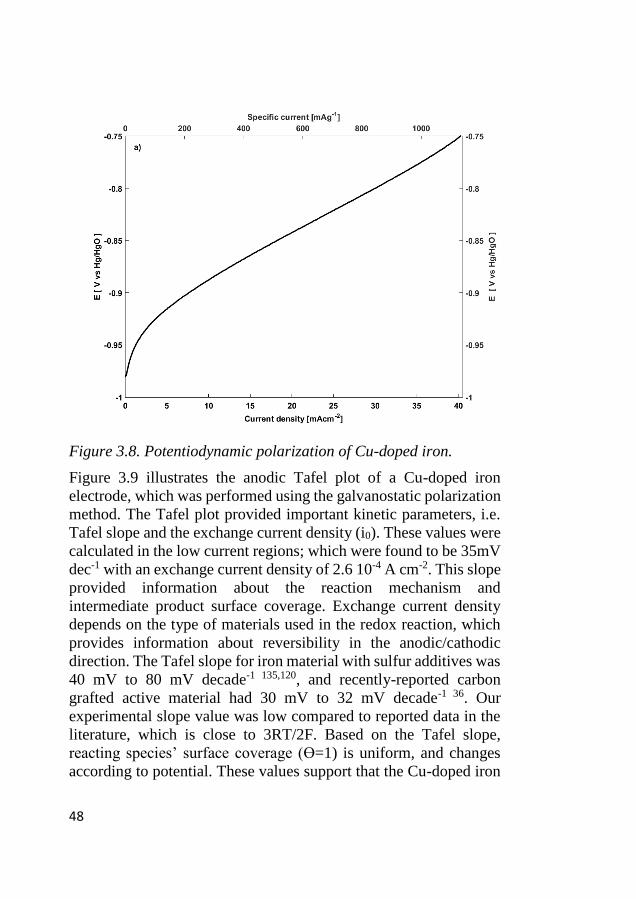
48
Figure 3.8. Potentiodynamic polarization of Cu-doped iron.
Figure 3.9 illustrates the anodic Tafel plot of a Cu-doped iron
electrode, which was performed using the galvanostatic polarization
method. The Tafel plot provided important kinetic parameters, i.e.
Tafel slope and the exchange current density (i0). These values were
calculated in the low current regions; which were found to be 35mV
dec-1 with an exchange current density of 2.6 10-4 A cm-2. This slope
provided information about the reaction mechanism and
intermediate product surface coverage. Exchange current density
depends on the type of materials used in the redox reaction, which
provides information about reversibility in the anodic/cathodic
direction. The Tafel slope for iron material with sulfur additives was
40 mV to 80 mV decade-1 135,120, and recently-reported carbon
grafted active material had 30 mV to 32 mV decade-1 36. Our
experimental slope value was low compared to reported data in the
literature, which is close to 3RT/2F. Based on the Tafel slope,
reacting species’ surface coverage (ϴ=1) is uniform, and changes
according to potential. These values support that the Cu-doped iron
49
with an iron carbide shell most likely accelerated the electrode
kinetics, with an efficient electron transfer reaction between the
electrode/electrolyte interphase, which augmented the high current
charge/discharge, with low overpotentials for the reaction.
Figure 3.9. Galvanostatic polarization of Cu-doped iron.
The above CV and polarization results both directly and indirectly
confirm that these Cu, CuSn, and Sn-doped samples are expected to
perform well in battery electrode cycling.
3.6 Galvanostatic cycling of Cu, CuSn, and Sn-doped
iron electrodes
3.6.1 Cu-doped iron electrodes cycling performance
Galvanostatic cycling of Cu-doped iron electrodes is shown in
Figure 3.10 (a-b). The electrode composition is provided in the
experimental part, Table 2.1.
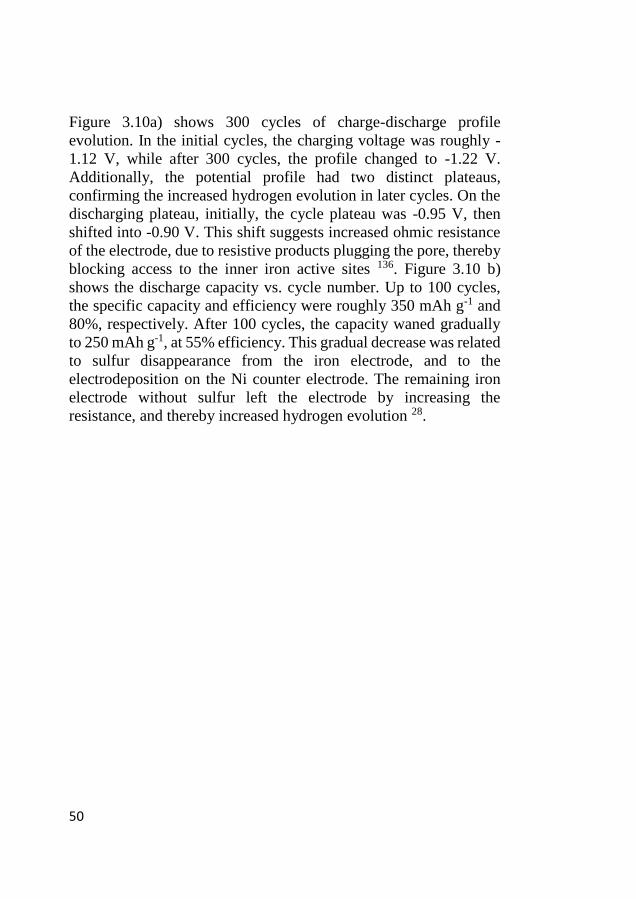
50
Figure 3.10a) shows 300 cycles of charge-discharge profile
evolution. In the initial cycles, the charging voltage was roughly -
1.12 V, while after 300 cycles, the profile changed to -1.22 V.
Additionally, the potential profile had two distinct plateaus,
confirming the increased hydrogen evolution in later cycles. On the
discharging plateau, initially, the cycle plateau was -0.95 V, then
shifted into -0.90 V. This shift suggests increased ohmic resistance
of the electrode, due to resistive products plugging the pore, thereby
blocking access to the inner iron active sites 136. Figure 3.10 b)
shows the discharge capacity vs. cycle number. Up to 100 cycles,
the specific capacity and efficiency were roughly 350 mAh g-1 and
80%, respectively. After 100 cycles, the capacity waned gradually
to 250 mAh g-1, at 55% efficiency. This gradual decrease was related
to sulfur disappearance from the iron electrode, and to the
electrodeposition on the Ni counter electrode. The remaining iron
electrode without sulfur left the electrode by increasing the
resistance, and thereby increased hydrogen evolution 28.
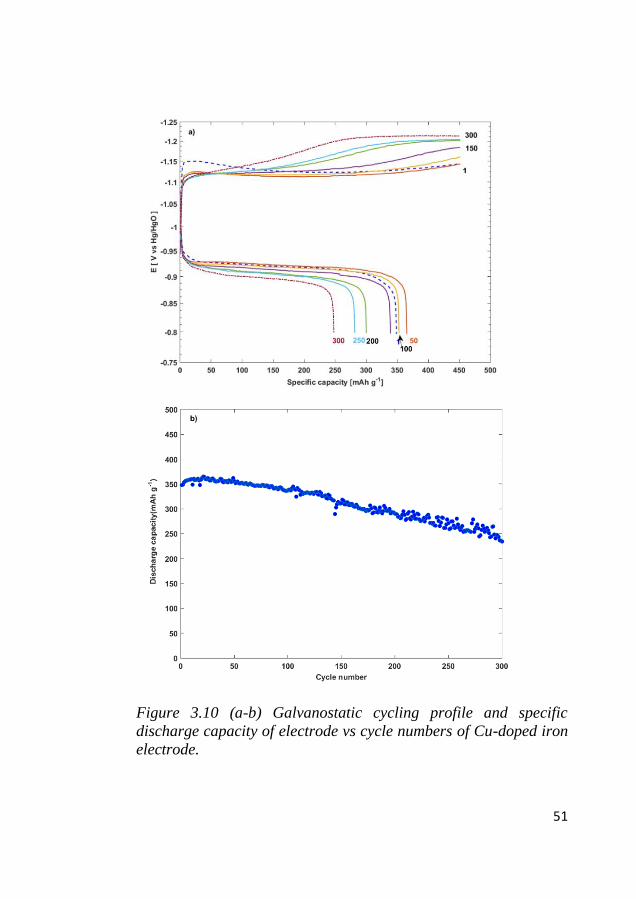
51
Figure 3.10 (a-b) Galvanostatic cycling profile and specific
discharge capacity of electrode vs cycle numbers of Cu-doped iron
electrode.
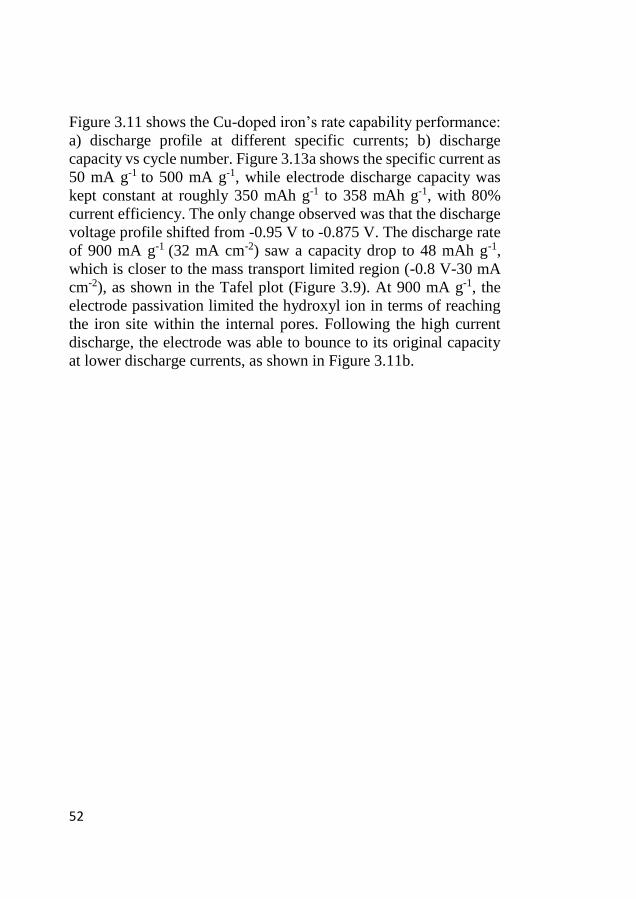
52
Figure 3.11 shows the Cu-doped iron’s rate capability performance:
a) discharge profile at different specific currents; b) discharge
capacity vs cycle number. Figure 3.13a shows the specific current as
50 mA g-1 to 500 mA g-1, while electrode discharge capacity was
kept constant at roughly 350 mAh g-1 to 358 mAh g-1, with 80%
current efficiency. The only change observed was that the discharge
voltage profile shifted from -0.95 V to -0.875 V. The discharge rate
of 900 mA g-1 (32 mA cm-2) saw a capacity drop to 48 mAh g-1,
which is closer to the mass transport limited region (-0.8 V-30 mA
cm-2), as shown in the Tafel plot (Figure 3.9). At 900 mA g-1, the
electrode passivation limited the hydroxyl ion in terms of reaching
the iron site within the internal pores. Following the high current
discharge, the electrode was able to bounce to its original capacity
at lower discharge currents, as shown in Figure 3.11b.
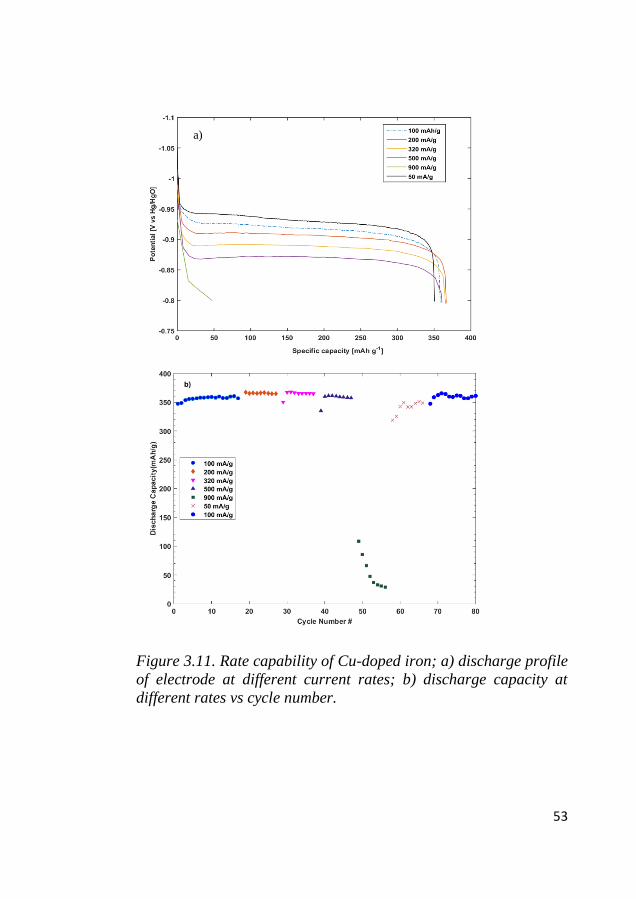
53
Figure 3.11. Rate capability of Cu-doped iron; a) discharge profile
of electrode at different current rates; b) discharge capacity at
different rates vs cycle number.
a)
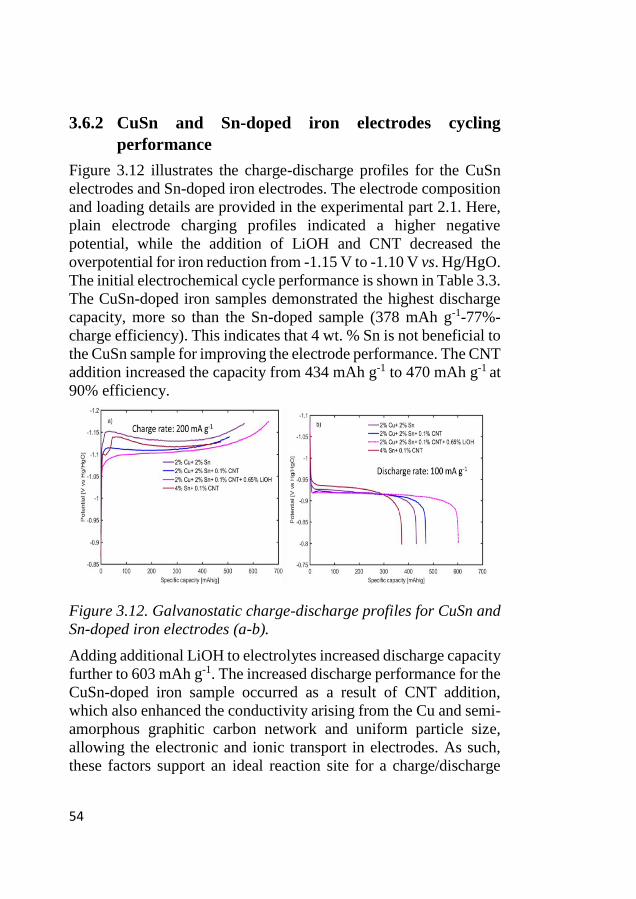
54
3.6.2 CuSn and Sn-doped iron electrodes cycling
performance
Figure 3.12 illustrates the charge-discharge profiles for the CuSn
electrodes and Sn-doped iron electrodes. The electrode composition
and loading details are provided in the experimental part 2.1. Here,
plain electrode charging profiles indicated a higher negative
potential, while the addition of LiOH and CNT decreased the
overpotential for iron reduction from -1.15 V to -1.10 V vs. Hg/HgO.
The initial electrochemical cycle performance is shown in Table 3.3.
The CuSn-doped iron samples demonstrated the highest discharge
capacity, more so than the Sn-doped sample (378 mAh g-1-77%-
charge efficiency). This indicates that 4 wt. % Sn is not beneficial to
the CuSn sample for improving the electrode performance. The CNT
addition increased the capacity from 434 mAh g-1 to 470 mAh g-1 at
90% efficiency.
Figure 3.12. Galvanostatic charge-discharge profiles for CuSn and
Sn-doped iron electrodes (a-b).
Adding additional LiOH to electrolytes increased discharge capacity
further to 603 mAh g-1. The increased discharge performance for the
CuSn-doped iron sample occurred as a result of CNT addition,
which also enhanced the conductivity arising from the Cu and semi-
amorphous graphitic carbon network and uniform particle size,
allowing the electronic and ionic transport in electrodes. As such,
these factors support an ideal reaction site for a charge/discharge
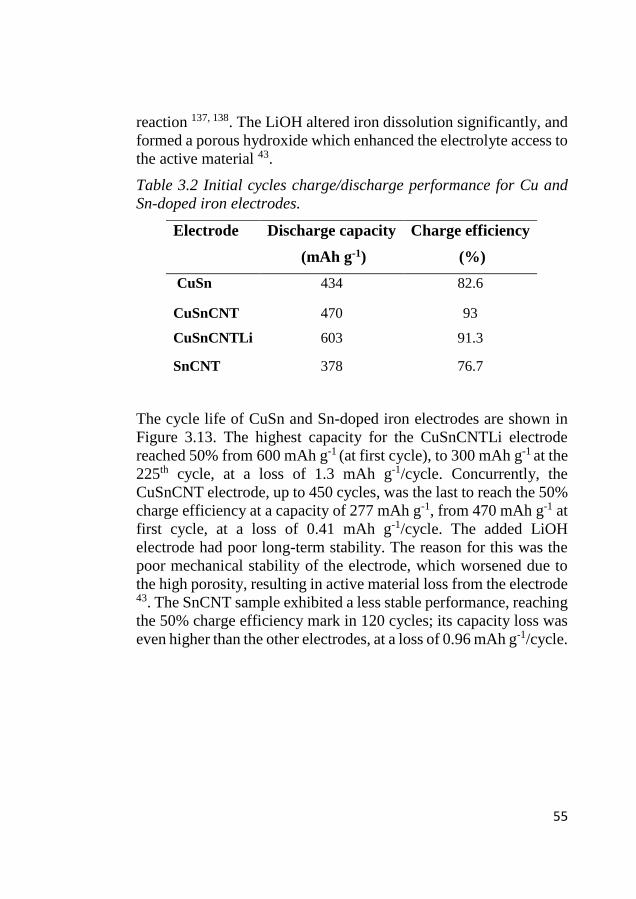
55
reaction 137, 138. The LiOH altered iron dissolution significantly, and
formed a porous hydroxide which enhanced the electrolyte access to
the active material 43.
Table 3.2 Initial cycles charge/discharge performance for Cu and
Sn-doped iron electrodes.
The cycle life of CuSn and Sn-doped iron electrodes are shown in
Figure 3.13. The highest capacity for the CuSnCNTLi electrode
reached 50% from 600 mAh g-1 (at first cycle), to 300 mAh g-1 at the
225th cycle, at a loss of 1.3 mAh g-1/cycle. Concurrently, the
CuSnCNT electrode, up to 450 cycles, was the last to reach the 50%
charge efficiency at a capacity of 277 mAh g-1, from 470 mAh g-1 at
first cycle, at a loss of 0.41 mAh g-1/cycle. The added LiOH
electrode had poor long-term stability. The reason for this was the
poor mechanical stability of the electrode, which worsened due to
the high porosity, resulting in active material loss from the electrode 43. The SnCNT sample exhibited a less stable performance, reaching
the 50% charge efficiency mark in 120 cycles; its capacity loss was
even higher than the other electrodes, at a loss of 0.96 mAh g-1/cycle.
Electrode Discharge capacity
(mAh g-1)
Charge efficiency
(%)
CuSn 434 82.6
CuSnCNT 470 93
CuSnCNTLi 603 91.3
SnCNT 378 76.7
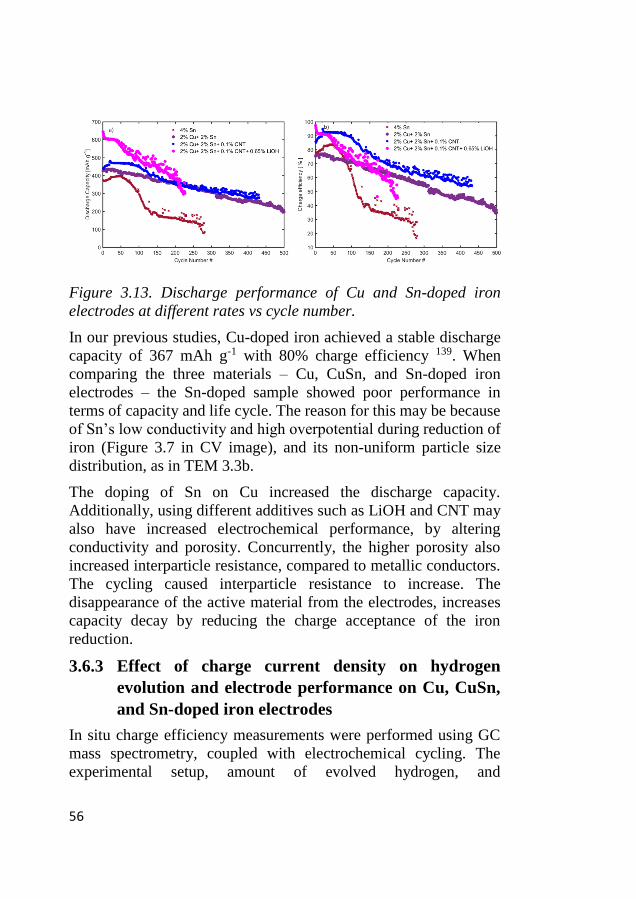
56
Figure 3.13. Discharge performance of Cu and Sn-doped iron
electrodes at different rates vs cycle number.
In our previous studies, Cu-doped iron achieved a stable discharge
capacity of 367 mAh g-1 with 80% charge efficiency 139. When
comparing the three materials – Cu, CuSn, and Sn-doped iron
electrodes – the Sn-doped sample showed poor performance in
terms of capacity and life cycle. The reason for this may be because
of Sn’s low conductivity and high overpotential during reduction of
iron (Figure 3.7 in CV image), and its non-uniform particle size
distribution, as in TEM 3.3b.
The doping of Sn on Cu increased the discharge capacity.
Additionally, using different additives such as LiOH and CNT may
also have increased electrochemical performance, by altering
conductivity and porosity. Concurrently, the higher porosity also
increased interparticle resistance, compared to metallic conductors.
The cycling caused interparticle resistance to increase. The
disappearance of the active material from the electrodes, increases
capacity decay by reducing the charge acceptance of the iron
reduction.
3.6.3 Effect of charge current density on hydrogen
evolution and electrode performance on Cu, CuSn,
and Sn-doped iron electrodes
In situ charge efficiency measurements were performed using GC
mass spectrometry, coupled with electrochemical cycling. The
experimental setup, amount of evolved hydrogen, and
57
corresponding coulomb calculation method were adopted from
Svengren et al 121. We studied the effect of current densities (5, 10,
and 15 mA cm-2) on charge acceptance, as well as discharge
performance on the CuSn and Sn electrodes.
The results are shown in Figure 3.14(a-d). The top plot in each
sample shows the relationship between cell potential and hydrogen
generation velocity vs time. The bottom plot shows the charge
efficiency and cumulative hydrogen capacity vs time. Hydrogen
generation counting time was extended to measure all accumulated
gases in the system. A summary of the results is shown in Table 3.3.
The charge efficiencies resulted in the following order: CuSnCNT >
CuSn > CuSnCNTLi > SnCNT.
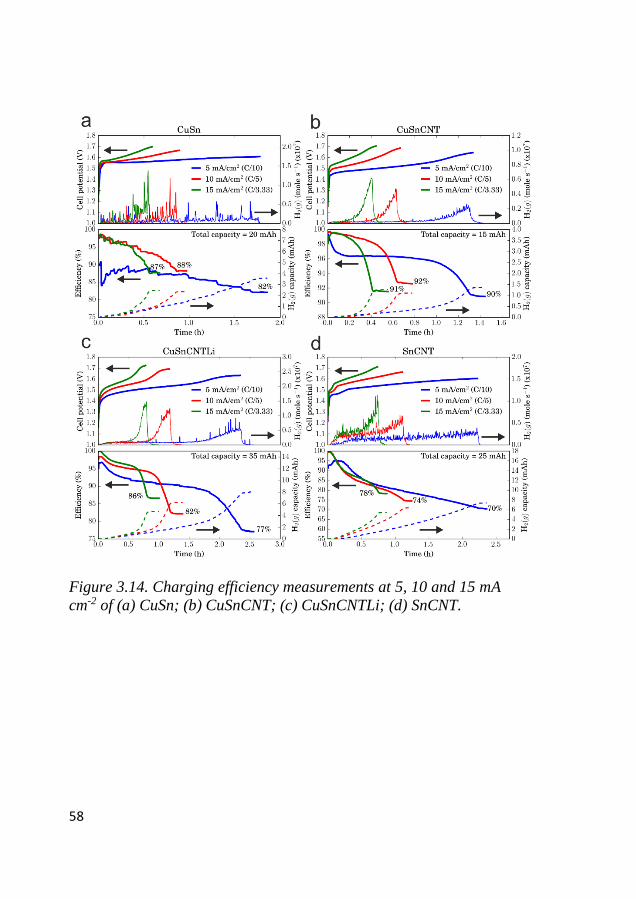
58
Figure 3.14. Charging efficiency measurements at 5, 10 and 15 mA
cm-2 of (a) CuSn; (b) CuSnCNT; (c) CuSnCNTLi; (d) SnCNT.
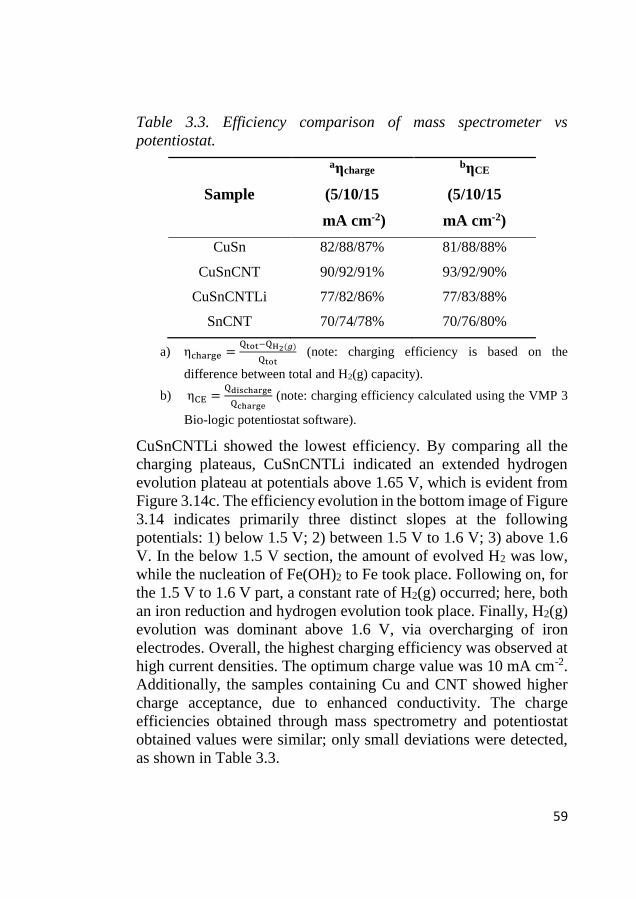
59
Table 3.3. Efficiency comparison of mass spectrometer vs
potentiostat.
Sample
aηcharge
(5/10/15
mA cm-2)
bηCE
(5/10/15
mA cm-2)
CuSn 82/88/87% 81/88/88%
CuSnCNT 90/92/91% 93/92/90%
CuSnCNTLi 77/82/86% 77/83/88%
SnCNT 70/74/78% 70/76/80%
a) ηcharge =Qtot−QH2(𝑔)
Qtot (note: charging efficiency is based on the
difference between total and H2(g) capacity).
b) ηCE =Qdischarge
Qcharge (note: charging efficiency calculated using the VMP 3
Bio-logic potentiostat software).
CuSnCNTLi showed the lowest efficiency. By comparing all the
charging plateaus, CuSnCNTLi indicated an extended hydrogen
evolution plateau at potentials above 1.65 V, which is evident from
Figure 3.14c. The efficiency evolution in the bottom image of Figure
3.14 indicates primarily three distinct slopes at the following
potentials: 1) below 1.5 V; 2) between 1.5 V to 1.6 V; 3) above 1.6
V. In the below 1.5 V section, the amount of evolved H2 was low,
while the nucleation of Fe(OH)2 to Fe took place. Following on, for
the 1.5 V to 1.6 V part, a constant rate of H2(g) occurred; here, both
an iron reduction and hydrogen evolution took place. Finally, H2(g)
evolution was dominant above 1.6 V, via overcharging of iron
electrodes. Overall, the highest charging efficiency was observed at
high current densities. The optimum charge value was 10 mA cm-2.
Additionally, the samples containing Cu and CNT showed higher
charge acceptance, due to enhanced conductivity. The charge
efficiencies obtained through mass spectrometry and potentiostat
obtained values were similar; only small deviations were detected,
as shown in Table 3.3.
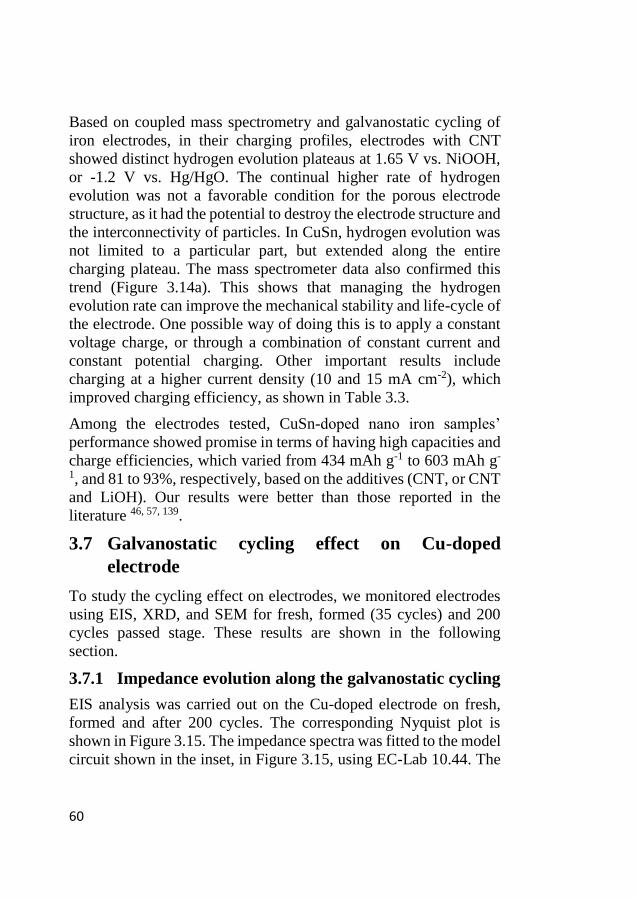
60
Based on coupled mass spectrometry and galvanostatic cycling of
iron electrodes, in their charging profiles, electrodes with CNT
showed distinct hydrogen evolution plateaus at 1.65 V vs. NiOOH,
or -1.2 V vs. Hg/HgO. The continual higher rate of hydrogen
evolution was not a favorable condition for the porous electrode
structure, as it had the potential to destroy the electrode structure and
the interconnectivity of particles. In CuSn, hydrogen evolution was
not limited to a particular part, but extended along the entire
charging plateau. The mass spectrometer data also confirmed this
trend (Figure 3.14a). This shows that managing the hydrogen
evolution rate can improve the mechanical stability and life-cycle of
the electrode. One possible way of doing this is to apply a constant
voltage charge, or through a combination of constant current and
constant potential charging. Other important results include
charging at a higher current density (10 and 15 mA cm-2), which
improved charging efficiency, as shown in Table 3.3.
Among the electrodes tested, CuSn-doped nano iron samples’
performance showed promise in terms of having high capacities and
charge efficiencies, which varied from 434 mAh g-1 to 603 mAh g-
1, and 81 to 93%, respectively, based on the additives (CNT, or CNT
and LiOH). Our results were better than those reported in the
literature 46, 57, 139.
3.7 Galvanostatic cycling effect on Cu-doped
electrode
To study the cycling effect on electrodes, we monitored electrodes
using EIS, XRD, and SEM for fresh, formed (35 cycles) and 200
cycles passed stage. These results are shown in the following
section.
3.7.1 Impedance evolution along the galvanostatic cycling
EIS analysis was carried out on the Cu-doped electrode on fresh,
formed and after 200 cycles. The corresponding Nyquist plot is
shown in Figure 3.15. The impedance spectra was fitted to the model
circuit shown in the inset, in Figure 3.15, using EC-Lab 10.44. The
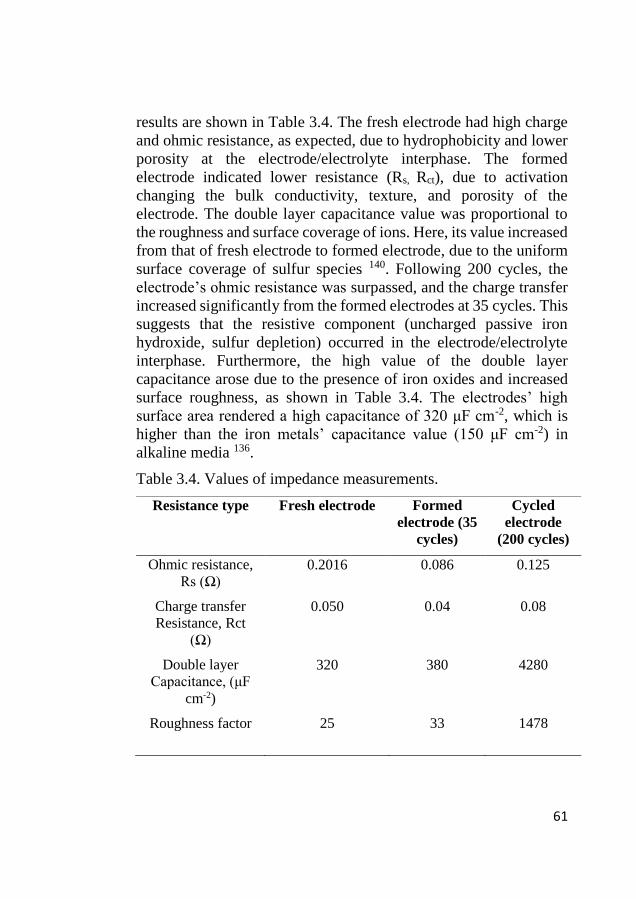
61
results are shown in Table 3.4. The fresh electrode had high charge
and ohmic resistance, as expected, due to hydrophobicity and lower
porosity at the electrode/electrolyte interphase. The formed
electrode indicated lower resistance (Rs, Rct), due to activation
changing the bulk conductivity, texture, and porosity of the
electrode. The double layer capacitance value was proportional to
the roughness and surface coverage of ions. Here, its value increased
from that of fresh electrode to formed electrode, due to the uniform
surface coverage of sulfur species 140. Following 200 cycles, the
electrode’s ohmic resistance was surpassed, and the charge transfer
increased significantly from the formed electrodes at 35 cycles. This
suggests that the resistive component (uncharged passive iron
hydroxide, sulfur depletion) occurred in the electrode/electrolyte
interphase. Furthermore, the high value of the double layer
capacitance arose due to the presence of iron oxides and increased
surface roughness, as shown in Table 3.4. The electrodes’ high
surface area rendered a high capacitance of 320 μF cm-2, which is
higher than the iron metals’ capacitance value (150 μF cm-2) in
alkaline media 136.
Table 3.4. Values of impedance measurements.
Resistance type Fresh electrode Formed
electrode (35
cycles)
Cycled
electrode
(200 cycles)
Ohmic resistance,
Rs (Ω)
0.2016 0.086 0.125
Charge transfer
Resistance, Rct
(Ω)
0.050 0.04 0.08
Double layer
Capacitance, (μF
cm-2)
320 380 4280
Roughness factor 25 33 1478
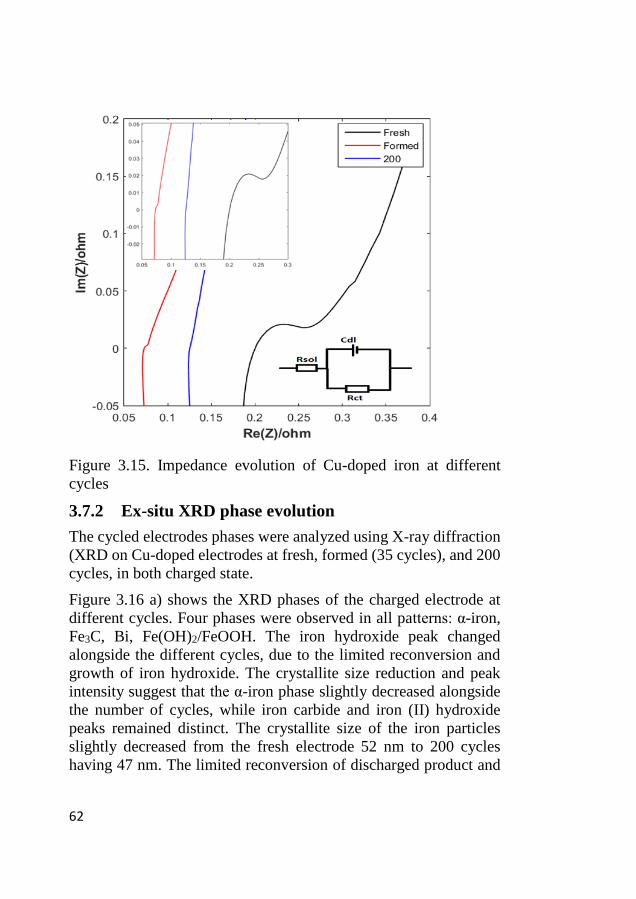
62
Figure 3.15. Impedance evolution of Cu-doped iron at different
cycles
3.7.2 Ex-situ XRD phase evolution
The cycled electrodes phases were analyzed using X-ray diffraction
(XRD on Cu-doped electrodes at fresh, formed (35 cycles), and 200
cycles, in both charged state.
Figure 3.16 a) shows the XRD phases of the charged electrode at
different cycles. Four phases were observed in all patterns: α-iron,
Fe3C, Bi, Fe(OH)2/FeOOH. The iron hydroxide peak changed
alongside the different cycles, due to the limited reconversion and
growth of iron hydroxide. The crystallite size reduction and peak
intensity suggest that the α-iron phase slightly decreased alongside
the number of cycles, while iron carbide and iron (II) hydroxide
peaks remained distinct. The crystallite size of the iron particles
slightly decreased from the fresh electrode 52 nm to 200 cycles
having 47 nm. The limited reconversion of discharged product and
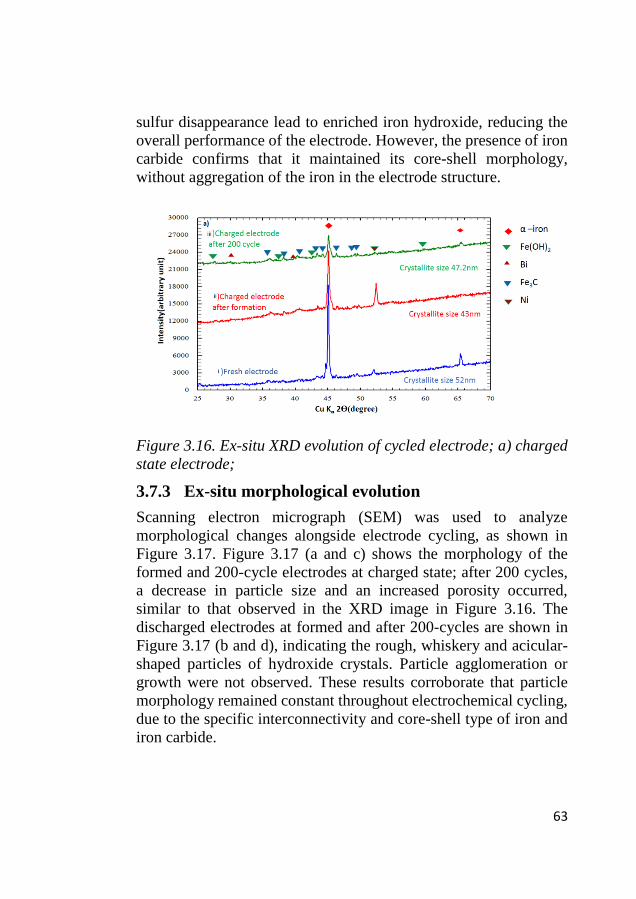
63
sulfur disappearance lead to enriched iron hydroxide, reducing the
overall performance of the electrode. However, the presence of iron
carbide confirms that it maintained its core-shell morphology,
without aggregation of the iron in the electrode structure.
Figure 3.16. Ex-situ XRD evolution of cycled electrode; a) charged
state electrode;
3.7.3 Ex-situ morphological evolution
Scanning electron micrograph (SEM) was used to analyze
morphological changes alongside electrode cycling, as shown in
Figure 3.17. Figure 3.17 (a and c) shows the morphology of the
formed and 200-cycle electrodes at charged state; after 200 cycles,
a decrease in particle size and an increased porosity occurred,
similar to that observed in the XRD image in Figure 3.16. The
discharged electrodes at formed and after 200-cycles are shown in
Figure 3.17 (b and d), indicating the rough, whiskery and acicular-
shaped particles of hydroxide crystals. Particle agglomeration or
growth were not observed. These results corroborate that particle
morphology remained constant throughout electrochemical cycling,
due to the specific interconnectivity and core-shell type of iron and
iron carbide.
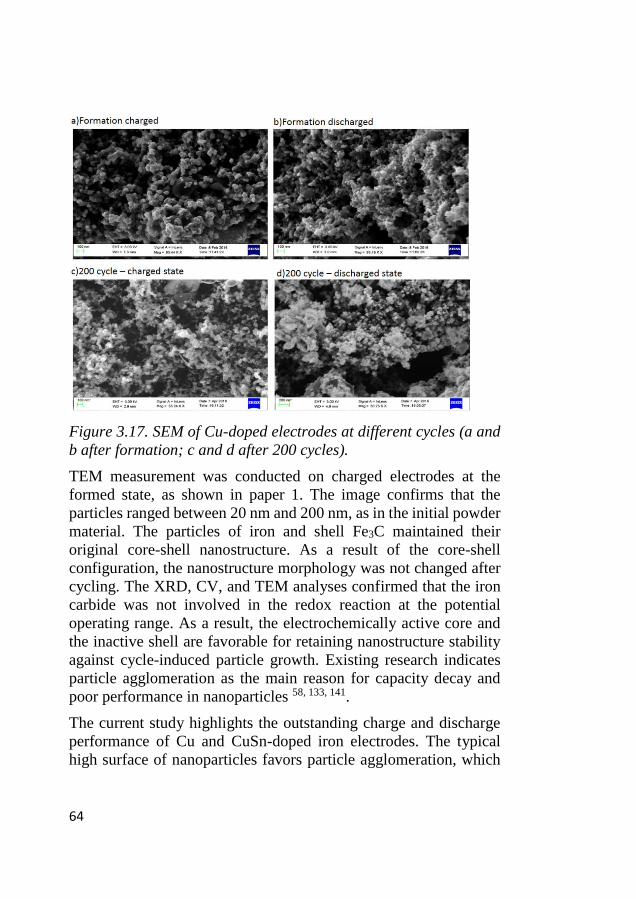
64
Figure 3.17. SEM of Cu-doped electrodes at different cycles (a and
b after formation; c and d after 200 cycles).
TEM measurement was conducted on charged electrodes at the
formed state, as shown in paper 1. The image confirms that the
particles ranged between 20 nm and 200 nm, as in the initial powder
material. The particles of iron and shell Fe3C maintained their
original core-shell nanostructure. As a result of the core-shell
configuration, the nanostructure morphology was not changed after
cycling. The XRD, CV, and TEM analyses confirmed that the iron
carbide was not involved in the redox reaction at the potential
operating range. As a result, the electrochemically active core and
the inactive shell are favorable for retaining nanostructure stability
against cycle-induced particle growth. Existing research indicates
particle agglomeration as the main reason for capacity decay and
poor performance in nanoparticles 58, 133, 141.
The current study highlights the outstanding charge and discharge
performance of Cu and CuSn-doped iron electrodes. The typical
high surface of nanoparticles favors particle agglomeration, which

65
was prohibited by an iron carbide layer or porous semi-graphitic
carbon networks. Furthermore, Cu, CNT, and carbon are able to
maintain constant electrode conductivity, irrespective of charge
state 59.

66
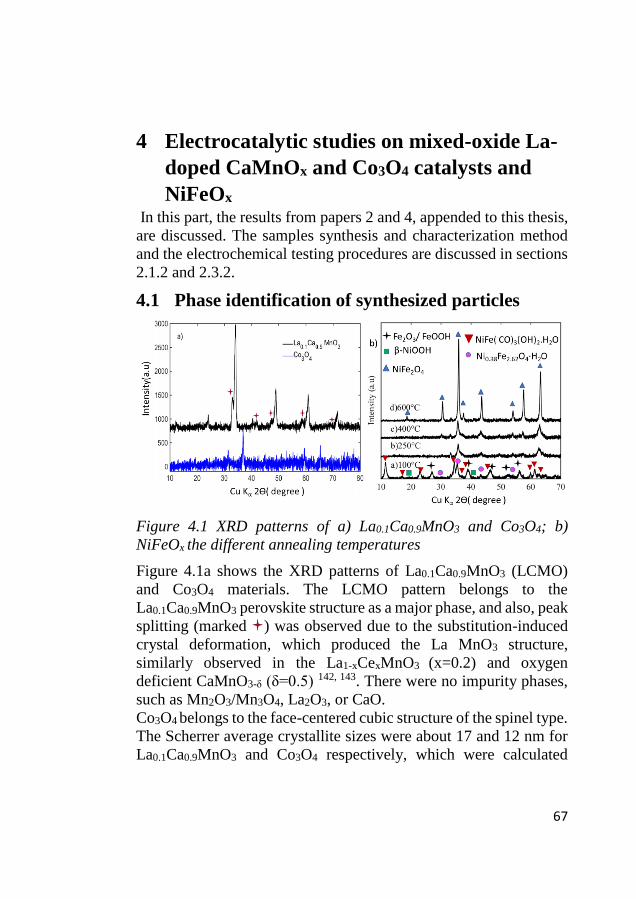
67
4 Electrocatalytic studies on mixed-oxide La-
doped CaMnOx and Co3O4 catalysts and
NiFeOx In this part, the results from papers 2 and 4, appended to this thesis,
are discussed. The samples synthesis and characterization method
and the electrochemical testing procedures are discussed in sections
2.1.2 and 2.3.2.
4.1 Phase identification of synthesized particles
Figure 4.1 XRD patterns of a) La0.1Ca0.9MnO3 and Co3O4; b)
NiFeOx the different annealing temperatures
Figure 4.1a shows the XRD patterns of La0.1Ca0.9MnO3 (LCMO)
and Co3O4 materials. The LCMO pattern belongs to the
La0.1Ca0.9MnO3 perovskite structure as a major phase, and also, peak
splitting (marked ) was observed due to the substitution-induced
crystal deformation, which produced the La MnO3 structure,
similarly observed in the La1-xCexMnO3 (x=0.2) and oxygen
deficient CaMnO3-δ (δ=0.5) 142, 143. There were no impurity phases,
such as Mn2O3/Mn3O4, La2O3, or CaO.
Co3O4 belongs to the face-centered cubic structure of the spinel type.
The Scherrer average crystallite sizes were about 17 and 12 nm for
La0.1Ca0.9MnO3 and Co3O4 respectively, which were calculated
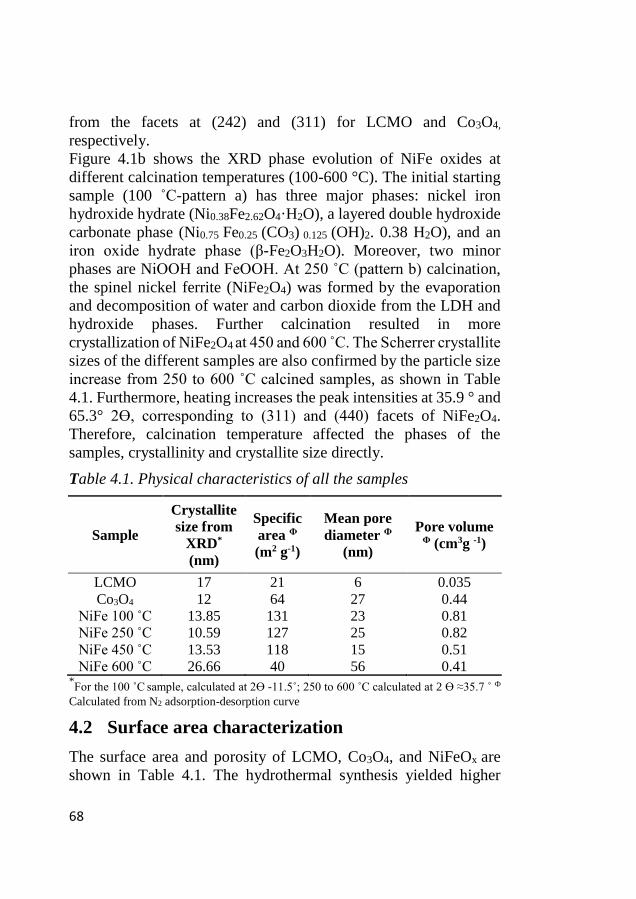
68
from the facets at (242) and (311) for LCMO and Co3O4,
respectively.
Figure 4.1b shows the XRD phase evolution of NiFe oxides at
different calcination temperatures (100-600 °C). The initial starting
sample (100 ˚C-pattern a) has three major phases: nickel iron
hydroxide hydrate (Ni0.38Fe2.62O4·H2O), a layered double hydroxide
carbonate phase (Ni0.75 Fe0.25 (CO3) 0.125 (OH)2. 0.38 H2O), and an
iron oxide hydrate phase (β-Fe2O3H2O). Moreover, two minor
phases are NiOOH and FeOOH. At 250 ˚C (pattern b) calcination,
the spinel nickel ferrite (NiFe2O4) was formed by the evaporation
and decomposition of water and carbon dioxide from the LDH and
hydroxide phases. Further calcination resulted in more
crystallization of NiFe2O4 at 450 and 600 C. The Scherrer crystallite
sizes of the different samples are also confirmed by the particle size
increase from 250 to 600 ˚C calcined samples, as shown in Table
4.1. Furthermore, heating increases the peak intensities at 35.9 ° and
65.3° 2ϴ, corresponding to (311) and (440) facets of NiFe2O4.
Therefore, calcination temperature affected the phases of the
samples, crystallinity and crystallite size directly.
Table 4.1. Physical characteristics of all the samples
Sample
Crystallite
size from
XRD*
(nm)
Specific
area Ф
(m2 g-1)
Mean pore
diameter Ф
(nm)
Pore volume Ф (cm3g -1)
LCMO 17 21 6 0.035
Co3O4 12 64 27 0.44
NiFe 100 ˚C 13.85 131 23 0.81
NiFe 250 ˚C 10.59 127 25 0.82
NiFe 450 ˚C 13.53 118 15 0.51
NiFe 600 ˚C 26.66 40 56 0.41 *For the 100 ˚C sample, calculated at 2ϴ -11.5˚; 250 to 600 ˚C calculated at 2 ϴ ≈35.7 ˚ Ф
Calculated from N2 adsorption-desorption curve
4.2 Surface area characterization
The surface area and porosity of LCMO, Co3O4, and NiFeOx are
shown in Table 4.1. The hydrothermal synthesis yielded higher
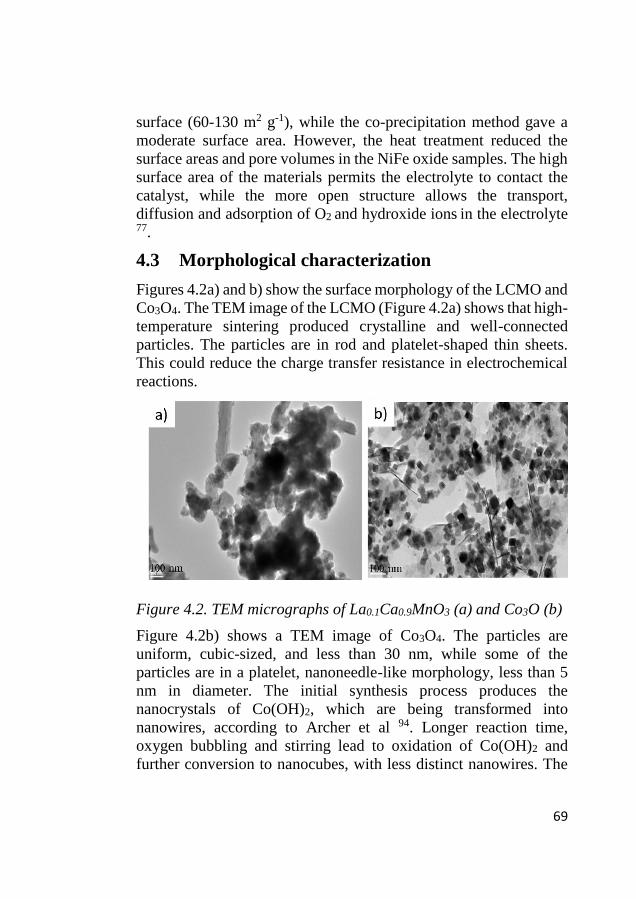
69
surface (60-130 m2 g-1), while the co-precipitation method gave a
moderate surface area. However, the heat treatment reduced the
surface areas and pore volumes in the NiFe oxide samples. The high
surface area of the materials permits the electrolyte to contact the
catalyst, while the more open structure allows the transport,
diffusion and adsorption of O2 and hydroxide ions in the electrolyte 77.
4.3 Morphological characterization
Figures 4.2a) and b) show the surface morphology of the LCMO and
Co3O4. The TEM image of the LCMO (Figure 4.2a) shows that high-
temperature sintering produced crystalline and well-connected
particles. The particles are in rod and platelet-shaped thin sheets.
This could reduce the charge transfer resistance in electrochemical
reactions.
Figure 4.2. TEM micrographs of La0.1Ca0.9MnO3 (a) and Co3O (b)
Figure 4.2b) shows a TEM image of Co3O4. The particles are
uniform, cubic-sized, and less than 30 nm, while some of the
particles are in a platelet, nanoneedle-like morphology, less than 5
nm in diameter. The initial synthesis process produces the
nanocrystals of Co(OH)2, which are being transformed into
nanowires, according to Archer et al 94. Longer reaction time,
oxygen bubbling and stirring lead to oxidation of Co(OH)2 and
further conversion to nanocubes, with less distinct nanowires. The
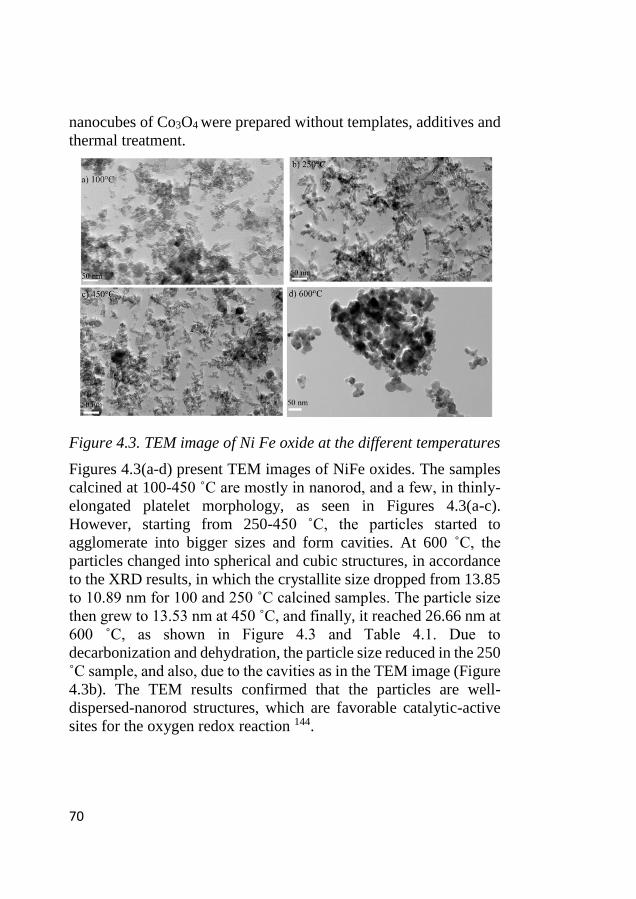
70
nanocubes of Co3O4 were prepared without templates, additives and
thermal treatment.
Figure 4.3. TEM image of Ni Fe oxide at the different temperatures
Figures 4.3(a-d) present TEM images of NiFe oxides. The samples
calcined at 100-450 ˚C are mostly in nanorod, and a few, in thinly-
elongated platelet morphology, as seen in Figures 4.3(a-c).
However, starting from 250-450 ˚C, the particles started to
agglomerate into bigger sizes and form cavities. At 600 ˚C, the
particles changed into spherical and cubic structures, in accordance
to the XRD results, in which the crystallite size dropped from 13.85
to 10.89 nm for 100 and 250 ˚C calcined samples. The particle size
then grew to 13.53 nm at 450 ˚C, and finally, it reached 26.66 nm at
600 ˚C, as shown in Figure 4.3 and Table 4.1. Due to
decarbonization and dehydration, the particle size reduced in the 250
˚C sample, and also, due to the cavities as in the TEM image (Figure
4.3b). The TEM results confirmed that the particles are well-
dispersed-nanorod structures, which are favorable catalytic-active
sites for the oxygen redox reaction 144.
71
4.4 Surface species characterization
The XPS spectra were recorded to analyze the surface oxidation
state of the NiFeOx samples. The XPS spectra of the survey
spectrum, Ni2p, Fe2p, O1s, and C1s regions, are shown in Figures
4.5(a-d). The wide spectrum (Figure 4.5a) confirms the Ni, Fe, O
and C species in the sample. At low-temperature calcination, O1s,
Fe2p and Ni2p peaks were broad, with multiple features, while the
temperature increase sharpens the peaks. This conforms with the
XRD (Figure 4.2) as pure phases forming at higher temperatures. At
low temperatures, Ni2p spectra showed the multiple peaks from 859
to 854 eV, corresponding to Ni 2+ to 3+ oxidation states. The
presence of Ni(OH)2, NiFe(CO)3(OH)2 gave multiple peak splitting
due to the Ni ion being in different coordinations (octahedral and
tetrahedral). The Fe2p3/2 spectra of the four samples did not show
any significant change. At 100 °C, the spectra look closer to Fe2O3 145, 146 (around 712 eV) and NiFe(CO)3(OH)2 (724 eV). Beginning
at 250 to 600 °C, Fe2p spectra shifted to a lower(712 to 710 eV) in
binding the energy of Fe in NiFe2O4 , and the spectra look closer to
the NiFe2O4 147. O1s spectra also follow similar trends to the Ni
spectra. At low temperatures, metal oxides, hydroxide and water
peaks were detected 145 (Figure 4.5d). Further heating at 400-650 °C
resulted as the only peak of metal oxide (NiFe2O4). The XPS results
show multiple surface oxidation species of Ni, Fe and O at low
temperature, particularly at 250 °C. Thus, XPS showed a wide range
of surface functional groups.
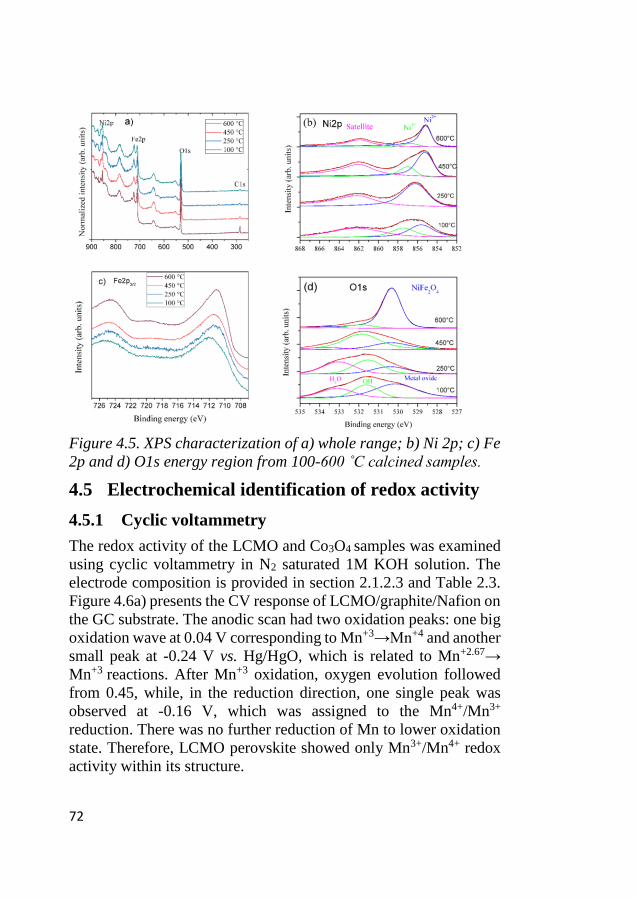
72
Figure 4.5. XPS characterization of a) whole range; b) Ni 2p; c) Fe
2p and d) O1s energy region from 100-600 ˚C calcined samples.
4.5 Electrochemical identification of redox activity
4.5.1 Cyclic voltammetry
The redox activity of the LCMO and Co3O4 samples was examined
using cyclic voltammetry in N2 saturated 1M KOH solution. The
electrode composition is provided in section 2.1.2.3 and Table 2.3.
Figure 4.6a) presents the CV response of LCMO/graphite/Nafion on
the GC substrate. The anodic scan had two oxidation peaks: one big
oxidation wave at 0.04 V corresponding to Mn+3→Mn+4 and another
small peak at -0.24 V vs. Hg/HgO, which is related to Mn+2.67→
Mn+3 reactions. After Mn+3 oxidation, oxygen evolution followed
from 0.45, while, in the reduction direction, one single peak was
observed at -0.16 V, which was assigned to the Mn4+/Mn3+
reduction. There was no further reduction of Mn to lower oxidation
state. Therefore, LCMO perovskite showed only Mn3+/Mn4+ redox
activity within its structure.
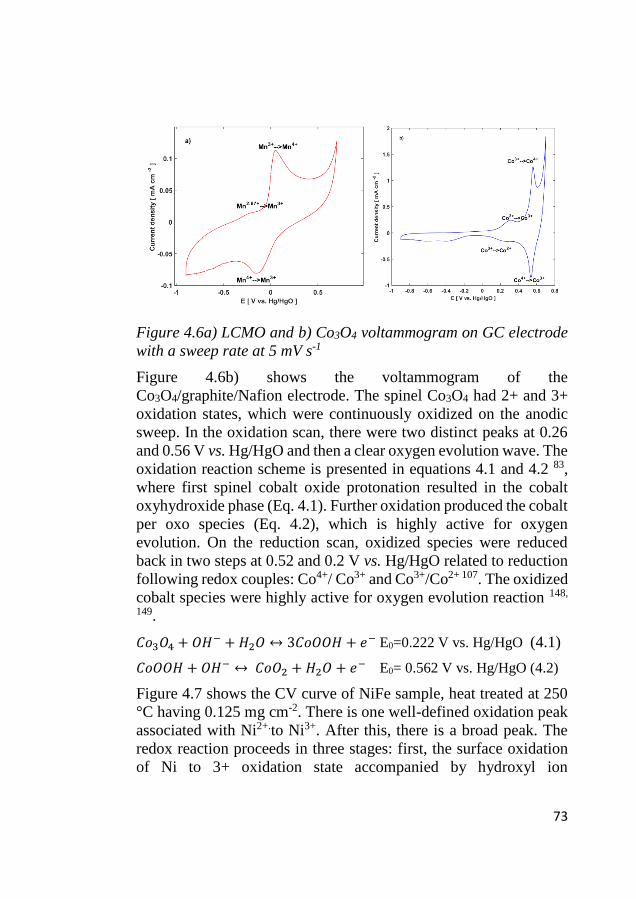
73
Figure 4.6a) LCMO and b) Co3O4 voltammogram on GC electrode
with a sweep rate at 5 mV s-1
Figure 4.6b) shows the voltammogram of the
Co3O4/graphite/Nafion electrode. The spinel Co3O4 had 2+ and 3+
oxidation states, which were continuously oxidized on the anodic
sweep. In the oxidation scan, there were two distinct peaks at 0.26
and 0.56 V vs. Hg/HgO and then a clear oxygen evolution wave. The
oxidation reaction scheme is presented in equations 4.1 and 4.2 83,
where first spinel cobalt oxide protonation resulted in the cobalt
oxyhydroxide phase (Eq. 4.1). Further oxidation produced the cobalt
per oxo species (Eq. 4.2), which is highly active for oxygen
evolution. On the reduction scan, oxidized species were reduced
back in two steps at 0.52 and 0.2 V vs. Hg/HgO related to reduction
following redox couples: Co4+/ Co3+ and Co3+/Co2+ 107. The oxidized
cobalt species were highly active for oxygen evolution reaction 148,
149.
𝐶𝑜3𝑂4 + 𝑂𝐻− +𝐻2𝑂 ↔ 3𝐶𝑜𝑂𝑂𝐻 + 𝑒− E0=0.222 V vs. Hg/HgO (4.1)
𝐶𝑜𝑂𝑂𝐻 + 𝑂𝐻− ↔ 𝐶𝑜𝑂2 +𝐻2𝑂 + 𝑒− E0= 0.562 V vs. Hg/HgO (4.2)
Figure 4.7 shows the CV curve of NiFe sample, heat treated at 250
°C having 0.125 mg cm-2. There is one well-defined oxidation peak
associated with Ni2+.to Ni3+. After this, there is a broad peak. The
redox reaction proceeds in three stages: first, the surface oxidation
of Ni to 3+ oxidation state accompanied by hydroxyl ion
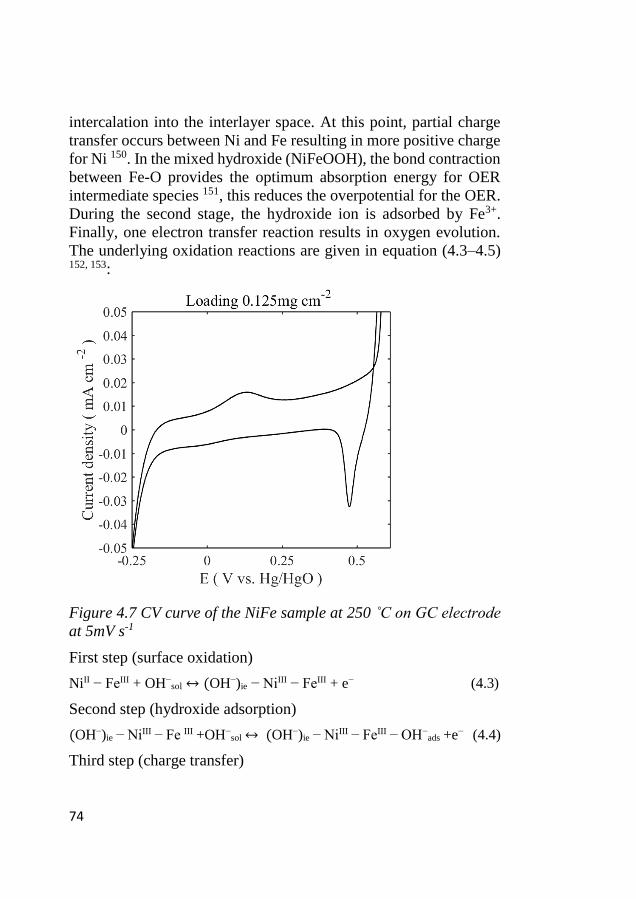
74
intercalation into the interlayer space. At this point, partial charge
transfer occurs between Ni and Fe resulting in more positive charge
for Ni 150. In the mixed hydroxide (NiFeOOH), the bond contraction
between Fe-O provides the optimum absorption energy for OER
intermediate species 151, this reduces the overpotential for the OER.
During the second stage, the hydroxide ion is adsorbed by Fe3+.
Finally, one electron transfer reaction results in oxygen evolution.
The underlying oxidation reactions are given in equation (4.3–4.5) 152, 153:
Figure 4.7 CV curve of the NiFe sample at 250 ˚C on GC electrode
at 5mV s-1
First step (surface oxidation)
NiII − FeIII + OH−sol ↔ (OH−)ie − NiIII − FeIII + e− (4.3)
Second step (hydroxide adsorption)
(OH−)ie − NiIII − Fe III +OH−sol ↔ (OH−)ie − NiIII − FeIII − OH−
ads +e− (4.4)
Third step (charge transfer)
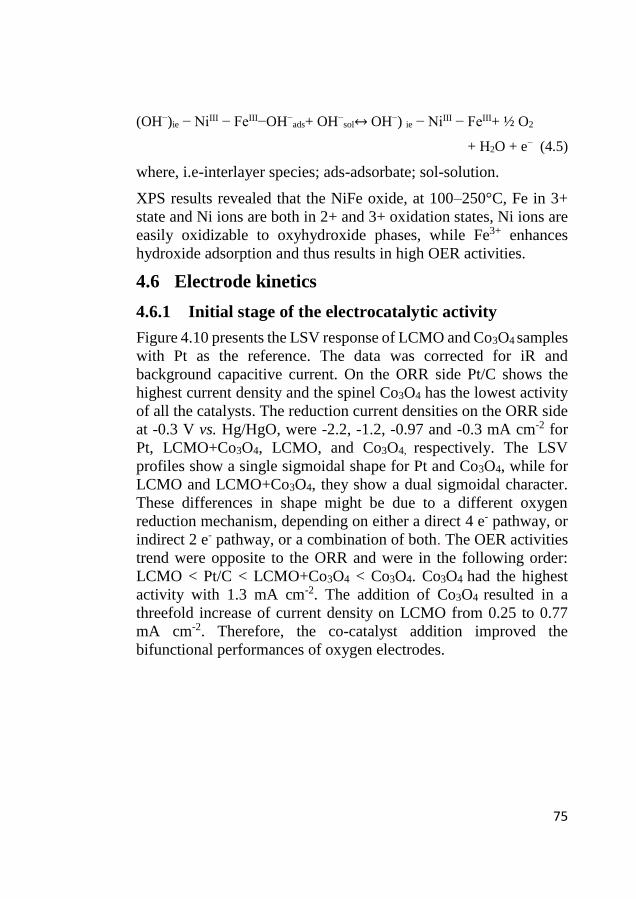
75
(OH−)ie − NiIII − FeIII−OH−ads+ OH−
sol↔ OH−) ie − NiIII − FeIII+ ½ O2
+ H2O + e− (4.5)
where, i.e-interlayer species; ads-adsorbate; sol-solution.
XPS results revealed that the NiFe oxide, at 100–250°C, Fe in 3+
state and Ni ions are both in 2+ and 3+ oxidation states, Ni ions are
easily oxidizable to oxyhydroxide phases, while Fe3+ enhances
hydroxide adsorption and thus results in high OER activities.
4.6 Electrode kinetics
4.6.1 Initial stage of the electrocatalytic activity
Figure 4.10 presents the LSV response of LCMO and Co3O4 samples
with Pt as the reference. The data was corrected for iR and
background capacitive current. On the ORR side Pt/C shows the
highest current density and the spinel Co3O4 has the lowest activity
of all the catalysts. The reduction current densities on the ORR side
at -0.3 V vs. Hg/HgO, were -2.2, -1.2, -0.97 and -0.3 mA cm-2 for
Pt, LCMO+Co3O4, LCMO, and Co3O4, respectively. The LSV
profiles show a single sigmoidal shape for Pt and Co3O4, while for
LCMO and LCMO+Co3O4, they show a dual sigmoidal character.
These differences in shape might be due to a different oxygen
reduction mechanism, depending on either a direct 4 e- pathway, or
indirect 2 e- pathway, or a combination of both. The OER activities
trend were opposite to the ORR and were in the following order:
LCMO < Pt/C < LCMO+Co3O4 < Co3O4. Co3O4 had the highest
activity with 1.3 mA cm-2. The addition of Co3O4 resulted in a
threefold increase of current density on LCMO from 0.25 to 0.77
mA cm-2. Therefore, the co-catalyst addition improved the
bifunctional performances of oxygen electrodes.
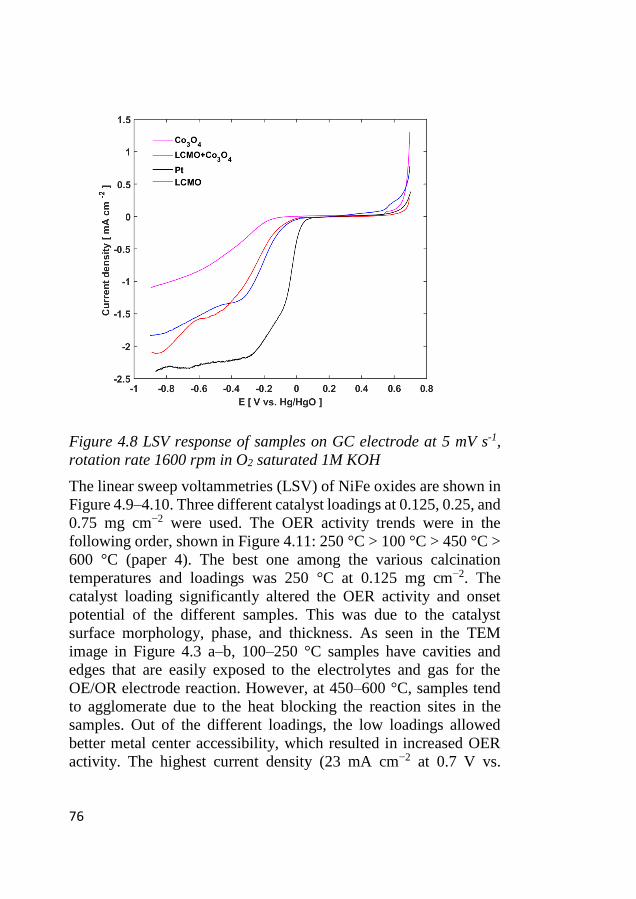
76
Figure 4.8 LSV response of samples on GC electrode at 5 mV s-1,
rotation rate 1600 rpm in O2 saturated 1M KOH
The linear sweep voltammetries (LSV) of NiFe oxides are shown in
Figure 4.9–4.10. Three different catalyst loadings at 0.125, 0.25, and
0.75 mg cm−2 were used. The OER activity trends were in the
following order, shown in Figure 4.11: 250 °C > 100 °C > 450 °C >
600 °C (paper 4). The best one among the various calcination
temperatures and loadings was 250 °C at 0.125 mg cm−2. The
catalyst loading significantly altered the OER activity and onset
potential of the different samples. This was due to the catalyst
surface morphology, phase, and thickness. As seen in the TEM
image in Figure 4.3 a–b, 100–250 °C samples have cavities and
edges that are easily exposed to the electrolytes and gas for the
OE/OR electrode reaction. However, at 450–600 °C, samples tend
to agglomerate due to the heat blocking the reaction sites in the
samples. Out of the different loadings, the low loadings allowed
better metal center accessibility, which resulted in increased OER
activity. The highest current density (23 mA cm−2 at 0.7 V vs.
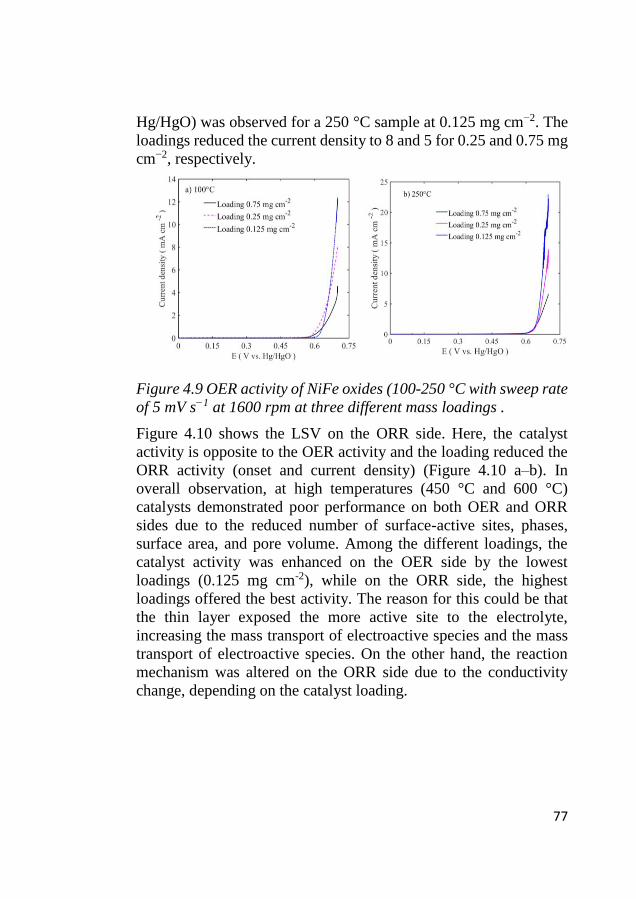
77
Hg/HgO) was observed for a 250 °C sample at 0.125 mg cm−2. The
loadings reduced the current density to 8 and 5 for 0.25 and 0.75 mg
cm−2, respectively.
Figure 4.9 OER activity of NiFe oxides (100-250 °C with sweep rate
of 5 mV s−1 at 1600 rpm at three different mass loadings .
Figure 4.10 shows the LSV on the ORR side. Here, the catalyst
activity is opposite to the OER activity and the loading reduced the
ORR activity (onset and current density) (Figure 4.10 a–b). In
overall observation, at high temperatures (450 °C and 600 °C)
catalysts demonstrated poor performance on both OER and ORR
sides due to the reduced number of surface-active sites, phases,
surface area, and pore volume. Among the different loadings, the
catalyst activity was enhanced on the OER side by the lowest
loadings (0.125 mg cm-2), while on the ORR side, the highest
loadings offered the best activity. The reason for this could be that
the thin layer exposed the more active site to the electrolyte,
increasing the mass transport of electroactive species and the mass
transport of electroactive species. On the other hand, the reaction
mechanism was altered on the ORR side due to the conductivity
change, depending on the catalyst loading.
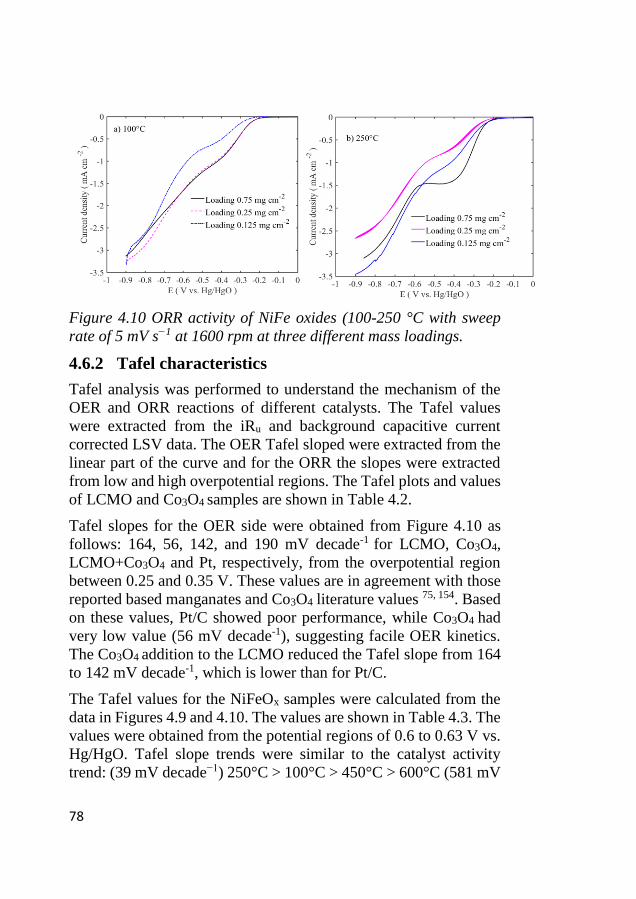
78
Figure 4.10 ORR activity of NiFe oxides (100-250 °C with sweep
rate of 5 mV s−1 at 1600 rpm at three different mass loadings.
4.6.2 Tafel characteristics
Tafel analysis was performed to understand the mechanism of the
OER and ORR reactions of different catalysts. The Tafel values
were extracted from the iRu and background capacitive current
corrected LSV data. The OER Tafel sloped were extracted from the
linear part of the curve and for the ORR the slopes were extracted
from low and high overpotential regions. The Tafel plots and values
of LCMO and Co3O4 samples are shown in Table 4.2.
Tafel slopes for the OER side were obtained from Figure 4.10 as
follows: 164, 56, 142, and 190 mV decade-1 for LCMO, Co3O4,
LCMO+Co3O4 and Pt, respectively, from the overpotential region
between 0.25 and 0.35 V. These values are in agreement with those
reported based manganates and Co3O4 literature values 75, 154. Based
on these values, Pt/C showed poor performance, while Co3O4 had
very low value (56 mV decade-1), suggesting facile OER kinetics.
The Co3O4 addition to the LCMO reduced the Tafel slope from 164
to 142 mV decade-1, which is lower than for Pt/C.
The Tafel values for the NiFeOx samples were calculated from the
data in Figures 4.9 and 4.10. The values are shown in Table 4.3. The
values were obtained from the potential regions of 0.6 to 0.63 V vs.
Hg/HgO. Tafel slope trends were similar to the catalyst activity
trend: (39 mV decade−1) 250°C > 100°C > 450°C > 600°C (581 mV
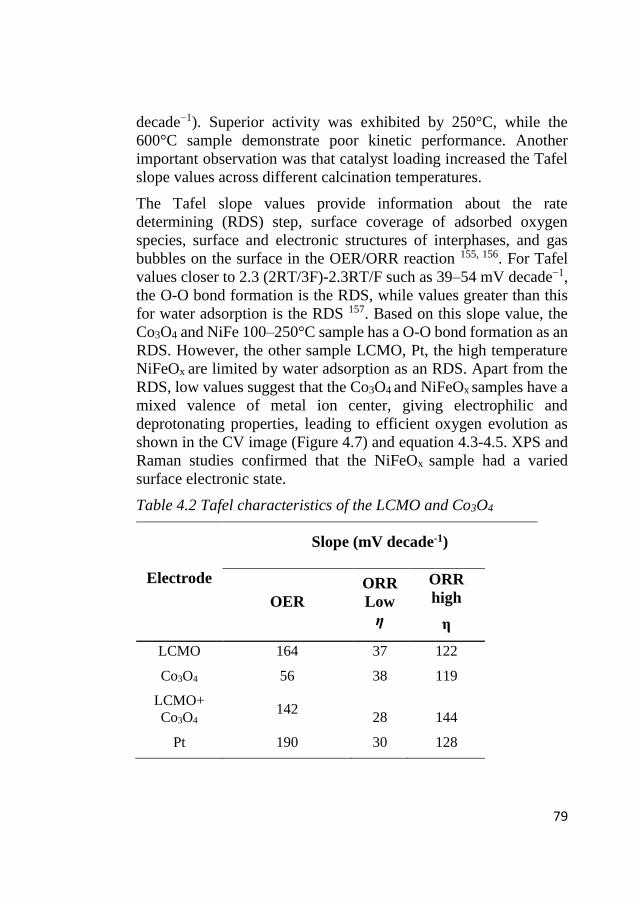
79
decade−1). Superior activity was exhibited by 250°C, while the
600°C sample demonstrate poor kinetic performance. Another
important observation was that catalyst loading increased the Tafel
slope values across different calcination temperatures.
The Tafel slope values provide information about the rate
determining (RDS) step, surface coverage of adsorbed oxygen
species, surface and electronic structures of interphases, and gas
bubbles on the surface in the OER/ORR reaction 155, 156. For Tafel
values closer to 2.3 (2RT/3F)-2.3RT/F such as 39–54 mV decade−1,
the O-O bond formation is the RDS, while values greater than this
for water adsorption is the RDS 157. Based on this slope value, the
Co3O4 and NiFe 100–250°C sample has a O-O bond formation as an
RDS. However, the other sample LCMO, Pt, the high temperature
NiFeOx are limited by water adsorption as an RDS. Apart from the
RDS, low values suggest that the Co3O4 and NiFeOx samples have a
mixed valence of metal ion center, giving electrophilic and
deprotonating properties, leading to efficient oxygen evolution as
shown in the CV image (Figure 4.7) and equation 4.3-4.5. XPS and
Raman studies confirmed that the NiFeOx sample had a varied
surface electronic state.
Table 4.2 Tafel characteristics of the LCMO and Co3O4
Electrode
Slope (mV decade-1)
OER
ORR
Low
η
ORR
high
η
LCMO 164 37 122
Co3O4 56 38 119
LCMO+
Co3O4 142
28 144
Pt 190 30 128
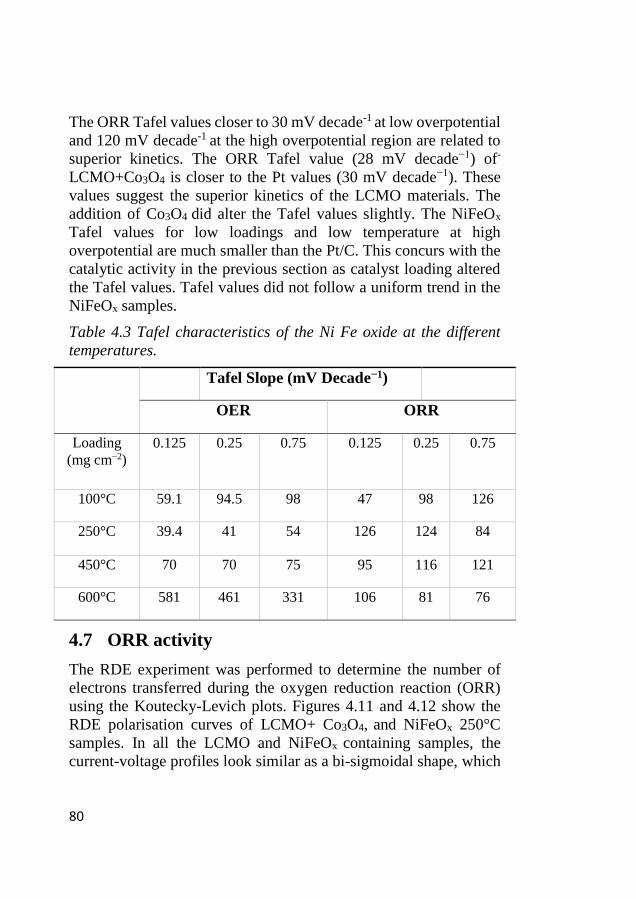
80
The ORR Tafel values closer to 30 mV decade-1 at low overpotential
and 120 mV decade-1 at the high overpotential region are related to
superior kinetics. The ORR Tafel value (28 mV decade−1) of-
LCMO+Co3O4 is closer to the Pt values (30 mV decade−1). These
values suggest the superior kinetics of the LCMO materials. The
addition of Co3O4 did alter the Tafel values slightly. The NiFeOx
Tafel values for low loadings and low temperature at high
overpotential are much smaller than the Pt/C. This concurs with the
catalytic activity in the previous section as catalyst loading altered
the Tafel values. Tafel values did not follow a uniform trend in the
NiFeOx samples.
Table 4.3 Tafel characteristics of the Ni Fe oxide at the different
temperatures.
Tafel Slope (mV Decade−1)
OER ORR
Loading
(mg cm−2)
0.125 0.25 0.75 0.125 0.25 0.75
100°C 59.1 94.5 98 47 98 126
250°C 39.4 41 54 126 124 84
450°C 70 70 75 95 116 121
600°C 581 461 331 106 81 76
4.7 ORR activity
The RDE experiment was performed to determine the number of
electrons transferred during the oxygen reduction reaction (ORR)
using the Koutecky-Levich plots. Figures 4.11 and 4.12 show the
RDE polarisation curves of LCMO+ Co3O4, and NiFeOx 250°C
samples. In all the LCMO and NiFeOx containing samples, the
current-voltage profiles look similar as a bi-sigmoidal shape, which
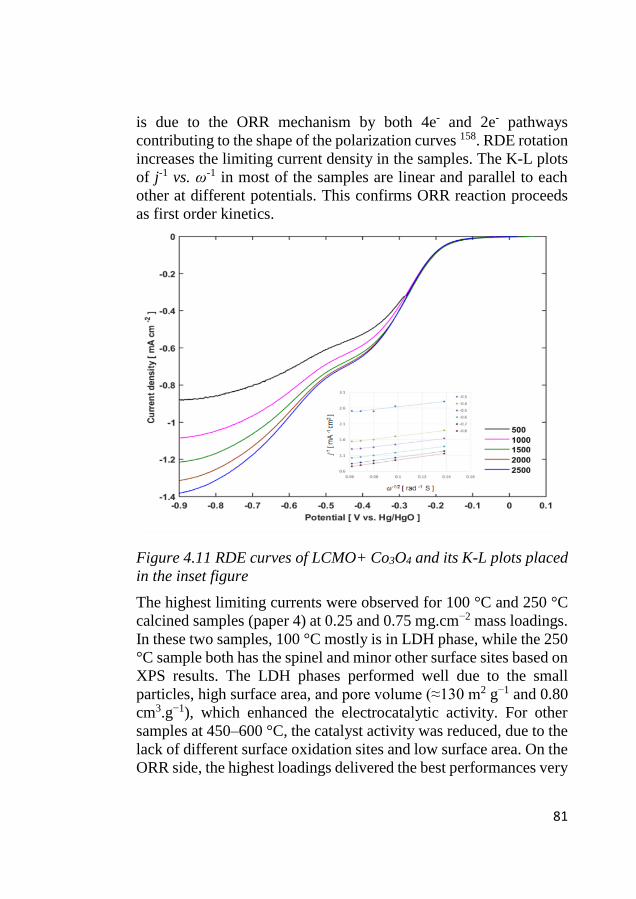
81
is due to the ORR mechanism by both 4e- and 2e- pathways
contributing to the shape of the polarization curves 158. RDE rotation
increases the limiting current density in the samples. The K-L plots
of j-1 vs. ω-1 in most of the samples are linear and parallel to each
other at different potentials. This confirms ORR reaction proceeds
as first order kinetics.
Figure 4.11 RDE curves of LCMO+ Co3O4 and its K-L plots placed
in the inset figure
The highest limiting currents were observed for 100 °C and 250 °C
calcined samples (paper 4) at 0.25 and 0.75 mg.cm−2 mass loadings.
In these two samples, 100 °C mostly is in LDH phase, while the 250
°C sample both has the spinel and minor other surface sites based on
XPS results. The LDH phases performed well due to the small
particles, high surface area, and pore volume (≈130 m2 g−1 and 0.80
cm3.g−1), which enhanced the electrocatalytic activity. For other
samples at 450–600 °C, the catalyst activity was reduced, due to the
lack of different surface oxidation sites and low surface area. On the
ORR side, the highest loadings delivered the best performances very
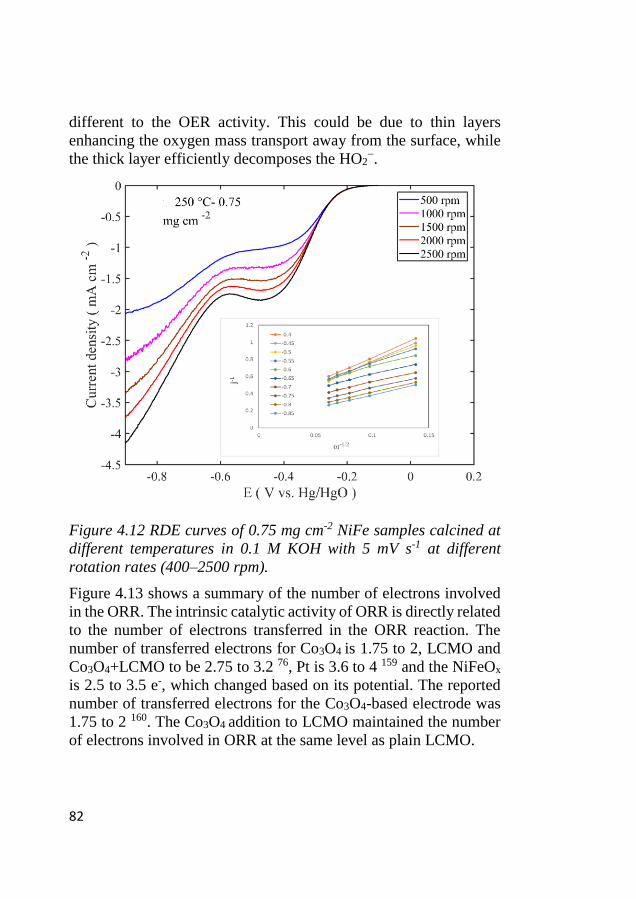
82
different to the OER activity. This could be due to thin layers
enhancing the oxygen mass transport away from the surface, while
the thick layer efficiently decomposes the HO2−.
Figure 4.12 RDE curves of 0.75 mg cm-2 NiFe samples calcined at
different temperatures in 0.1 M KOH with 5 mV s-1 at different
rotation rates (400–2500 rpm).
Figure 4.13 shows a summary of the number of electrons involved
in the ORR. The intrinsic catalytic activity of ORR is directly related
to the number of electrons transferred in the ORR reaction. The
number of transferred electrons for Co3O4 is 1.75 to 2, LCMO and
Co3O4+LCMO to be 2.75 to 3.2 76, Pt is 3.6 to 4 159 and the NiFeOx
is 2.5 to 3.5 e-, which changed based on its potential. The reported
number of transferred electrons for the Co3O4-based electrode was
1.75 to 2 160. The Co3O4 addition to LCMO maintained the number
of electrons involved in ORR at the same level as plain LCMO.
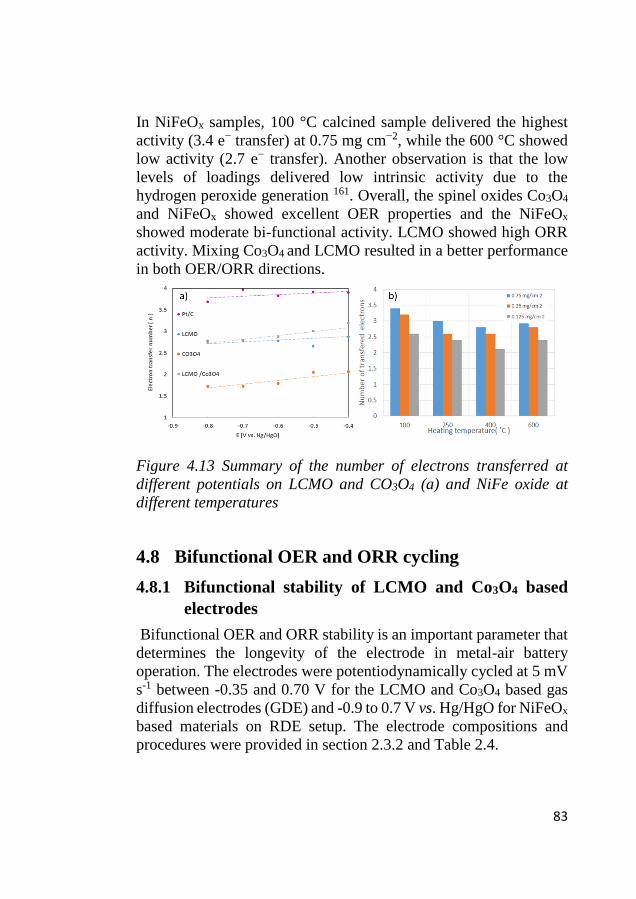
83
In NiFeOx samples, 100 °C calcined sample delivered the highest
activity (3.4 e− transfer) at 0.75 mg cm−2, while the 600 °C showed
low activity (2.7 e− transfer). Another observation is that the low
levels of loadings delivered low intrinsic activity due to the
hydrogen peroxide generation 161. Overall, the spinel oxides Co3O4
and NiFeOx showed excellent OER properties and the NiFeOx
showed moderate bi-functional activity. LCMO showed high ORR
activity. Mixing Co3O4 and LCMO resulted in a better performance
in both OER/ORR directions.
Figure 4.13 Summary of the number of electrons transferred at
different potentials on LCMO and CO3O4 (a) and NiFe oxide at
different temperatures
4.8 Bifunctional OER and ORR cycling
4.8.1 Bifunctional stability of LCMO and Co3O4 based
electrodes
Bifunctional OER and ORR stability is an important parameter that
determines the longevity of the electrode in metal-air battery
operation. The electrodes were potentiodynamically cycled at 5 mV
s-1 between -0.35 and 0.70 V for the LCMO and Co3O4 based gas
diffusion electrodes (GDE) and -0.9 to 0.7 V vs. Hg/HgO for NiFeOx
based materials on RDE setup. The electrode compositions and
procedures were provided in section 2.3.2 and Table 2.4.
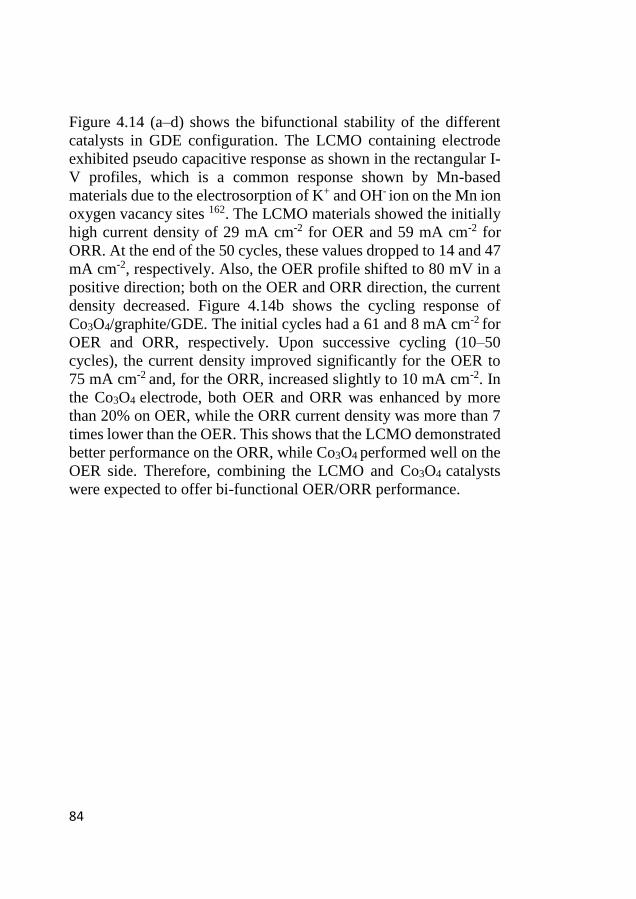
84
Figure 4.14 (a–d) shows the bifunctional stability of the different
catalysts in GDE configuration. The LCMO containing electrode
exhibited pseudo capacitive response as shown in the rectangular I-
V profiles, which is a common response shown by Mn-based
materials due to the electrosorption of K+ and OH- ion on the Mn ion
oxygen vacancy sites 162. The LCMO materials showed the initially
high current density of 29 mA cm-2 for OER and 59 mA cm-2 for
ORR. At the end of the 50 cycles, these values dropped to 14 and 47
mA cm-2, respectively. Also, the OER profile shifted to 80 mV in a
positive direction; both on the OER and ORR direction, the current
density decreased. Figure 4.14b shows the cycling response of
Co3O4/graphite/GDE. The initial cycles had a 61 and 8 mA cm-2 for
OER and ORR, respectively. Upon successive cycling (10–50
cycles), the current density improved significantly for the OER to
75 mA cm-2 and, for the ORR, increased slightly to 10 mA cm-2. In
the Co3O4 electrode, both OER and ORR was enhanced by more
than 20% on OER, while the ORR current density was more than 7
times lower than the OER. This shows that the LCMO demonstrated
better performance on the ORR, while Co3O4 performed well on the
OER side. Therefore, combining the LCMO and Co3O4 catalysts
were expected to offer bi-functional OER/ORR performance.
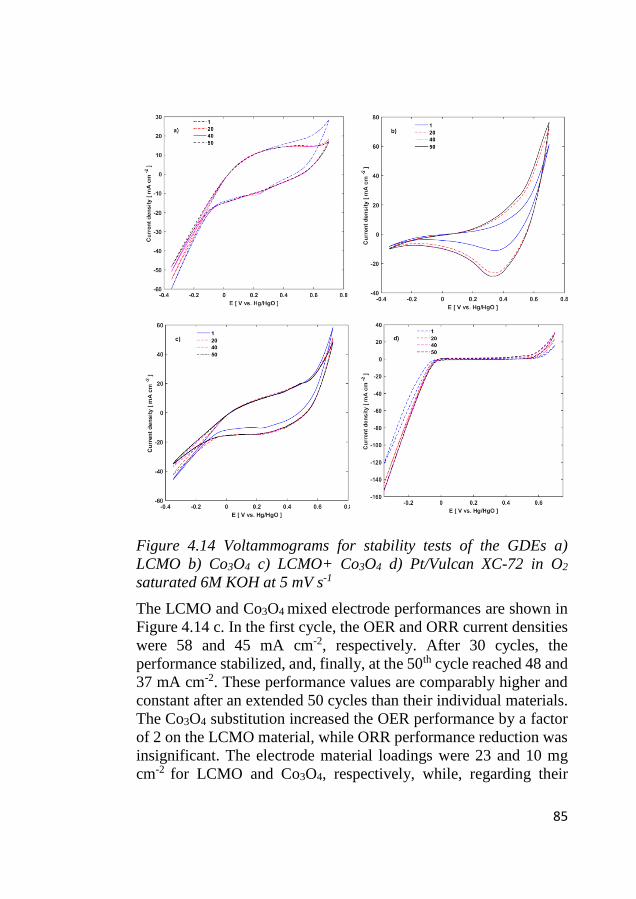
85
Figure 4.14 Voltammograms for stability tests of the GDEs a)
LCMO b) Co3O4 c) LCMO+ Co3O4 d) Pt/Vulcan XC-72 in O2
saturated 6M KOH at 5 mV s-1
The LCMO and Co3O4 mixed electrode performances are shown in
Figure 4.14 c. In the first cycle, the OER and ORR current densities
were 58 and 45 mA cm-2, respectively. After 30 cycles, the
performance stabilized, and, finally, at the 50th cycle reached 48 and
37 mA cm-2. These performance values are comparably higher and
constant after an extended 50 cycles than their individual materials.
The Co3O4 substitution increased the OER performance by a factor
of 2 on the LCMO material, while ORR performance reduction was
insignificant. The electrode material loadings were 23 and 10 mg
cm-2 for LCMO and Co3O4, respectively, while, regarding their
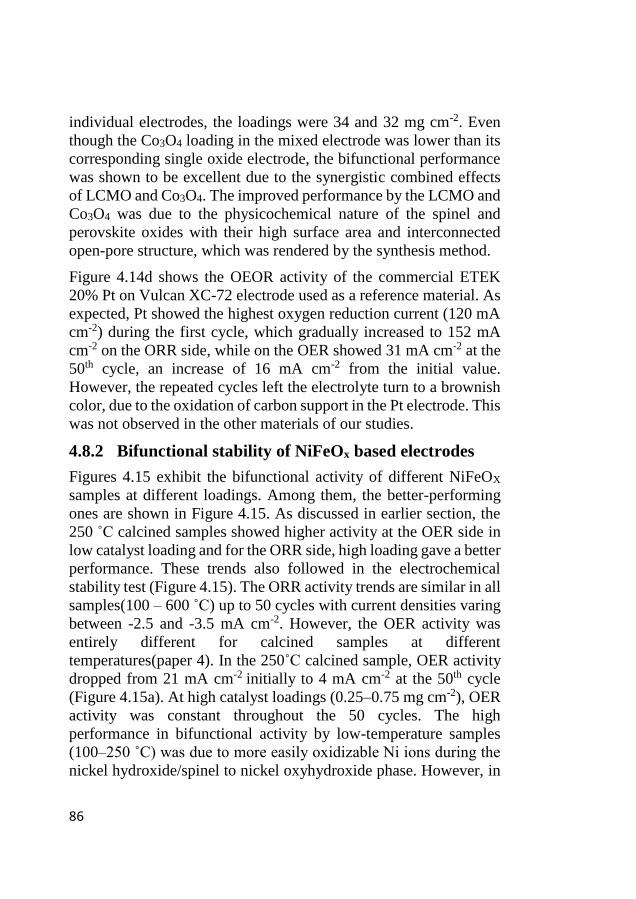
86
individual electrodes, the loadings were 34 and 32 mg cm-2. Even
though the Co3O4 loading in the mixed electrode was lower than its
corresponding single oxide electrode, the bifunctional performance
was shown to be excellent due to the synergistic combined effects
of LCMO and Co3O4. The improved performance by the LCMO and
Co3O4 was due to the physicochemical nature of the spinel and
perovskite oxides with their high surface area and interconnected
open-pore structure, which was rendered by the synthesis method.
Figure 4.14d shows the OEOR activity of the commercial ETEK
20% Pt on Vulcan XC-72 electrode used as a reference material. As
expected, Pt showed the highest oxygen reduction current (120 mA
cm-2) during the first cycle, which gradually increased to 152 mA
cm-2 on the ORR side, while on the OER showed 31 mA cm-2 at the
50th cycle, an increase of 16 mA cm-2 from the initial value.
However, the repeated cycles left the electrolyte turn to a brownish
color, due to the oxidation of carbon support in the Pt electrode. This
was not observed in the other materials of our studies.
4.8.2 Bifunctional stability of NiFeOx based electrodes
Figures 4.15 exhibit the bifunctional activity of different NiFeOX
samples at different loadings. Among them, the better-performing
ones are shown in Figure 4.15. As discussed in earlier section, the
250 ˚C calcined samples showed higher activity at the OER side in
low catalyst loading and for the ORR side, high loading gave a better
performance. These trends also followed in the electrochemical
stability test (Figure 4.15). The ORR activity trends are similar in all
samples(100 – 600 ˚C) up to 50 cycles with current densities varing
between -2.5 and -3.5 mA cm-2. However, the OER activity was
entirely different for calcined samples at different
temperatures(paper 4). In the 250˚C calcined sample, OER activity
dropped from 21 mA cm-2 initially to 4 mA cm-2 at the 50th cycle
(Figure 4.15a). At high catalyst loadings (0.25–0.75 mg cm-2), OER
activity was constant throughout the 50 cycles. The high
performance in bifunctional activity by low-temperature samples
(100–250 ˚C) was due to more easily oxidizable Ni ions during the
nickel hydroxide/spinel to nickel oxyhydroxide phase. However, in
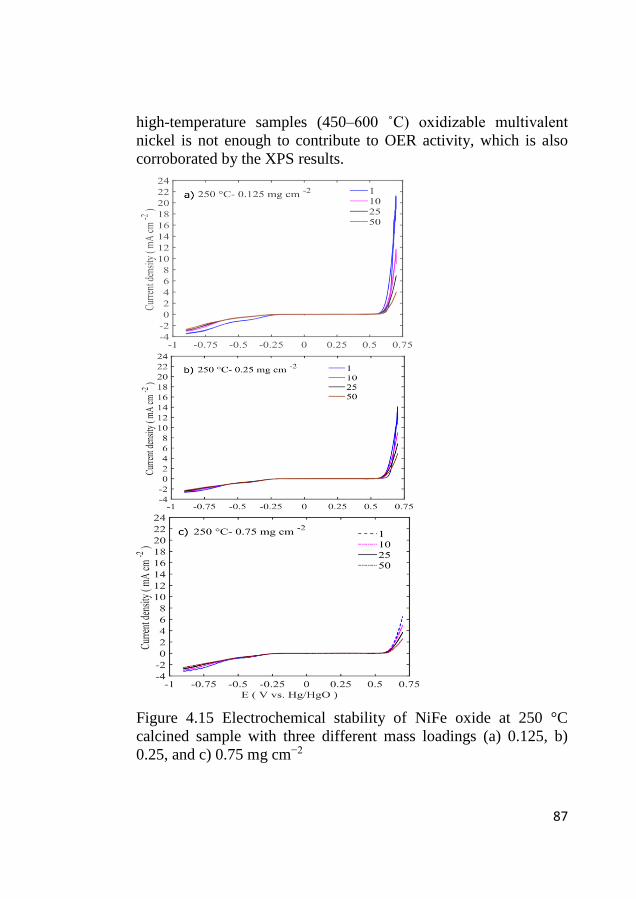
87
high-temperature samples (450–600 ˚C) oxidizable multivalent
nickel is not enough to contribute to OER activity, which is also
corroborated by the XPS results.
Figure 4.15 Electrochemical stability of NiFe oxide at 250 °C
calcined sample with three different mass loadings (a) 0.125, b)
0.25, and c) 0.75 mg cm−2
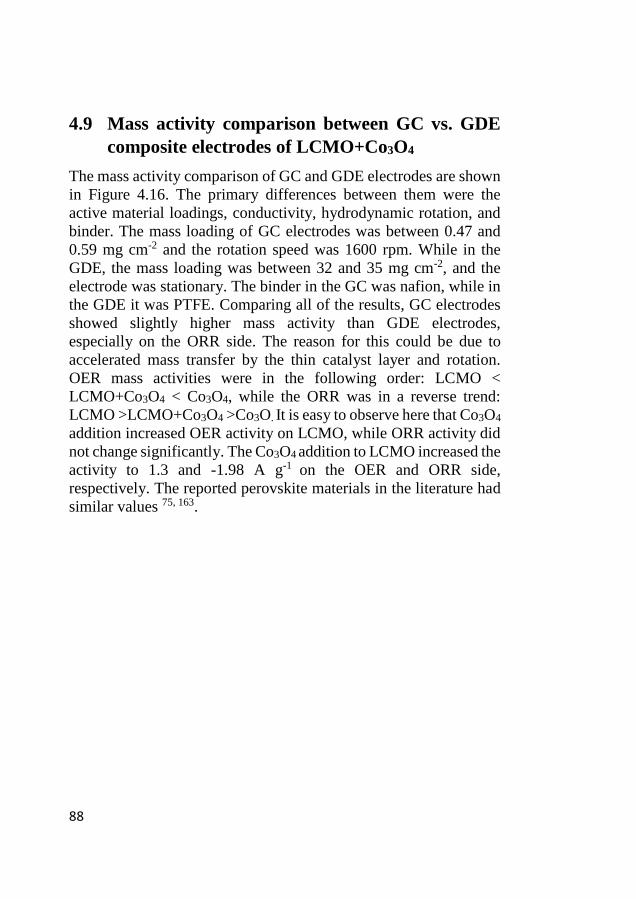
88
4.9 Mass activity comparison between GC vs. GDE
composite electrodes of LCMO+Co3O4
The mass activity comparison of GC and GDE electrodes are shown
in Figure 4.16. The primary differences between them were the
active material loadings, conductivity, hydrodynamic rotation, and
binder. The mass loading of GC electrodes was between 0.47 and
0.59 mg cm-2 and the rotation speed was 1600 rpm. While in the
GDE, the mass loading was between 32 and 35 mg cm-2, and the
electrode was stationary. The binder in the GC was nafion, while in
the GDE it was PTFE. Comparing all of the results, GC electrodes
showed slightly higher mass activity than GDE electrodes,
especially on the ORR side. The reason for this could be due to
accelerated mass transfer by the thin catalyst layer and rotation.
OER mass activities were in the following order: LCMO <
LCMO+Co3O4 < Co3O4, while the ORR was in a reverse trend:
LCMO >LCMO+Co3O4 >Co3O. It is easy to observe here that Co3O4
addition increased OER activity on LCMO, while ORR activity did
not change significantly. The Co3O4 addition to LCMO increased the
activity to 1.3 and -1.98 A g-1 on the OER and ORR side,
respectively. The reported perovskite materials in the literature had
similar values 75, 163.
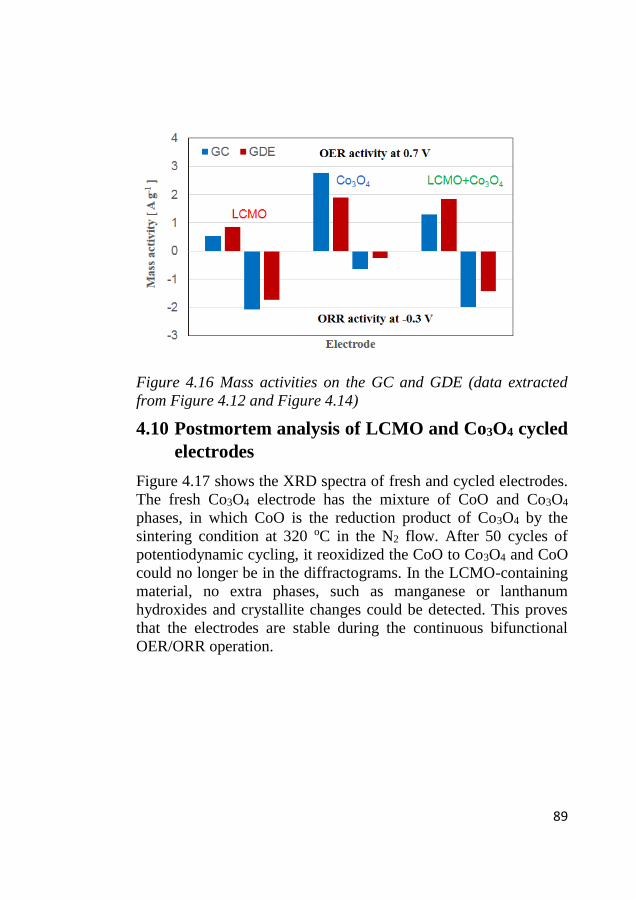
89
Figure 4.16 Mass activities on the GC and GDE (data extracted
from Figure 4.12 and Figure 4.14)
4.10 Postmortem analysis of LCMO and Co3O4 cycled
electrodes
Figure 4.17 shows the XRD spectra of fresh and cycled electrodes.
The fresh Co3O4 electrode has the mixture of CoO and Co3O4
phases, in which CoO is the reduction product of Co3O4 by the
sintering condition at 320 oC in the N2 flow. After 50 cycles of
potentiodynamic cycling, it reoxidized the CoO to Co3O4 and CoO
could no longer be in the diffractograms. In the LCMO-containing
material, no extra phases, such as manganese or lanthanum
hydroxides and crystallite changes could be detected. This proves
that the electrodes are stable during the continuous bifunctional
OER/ORR operation.
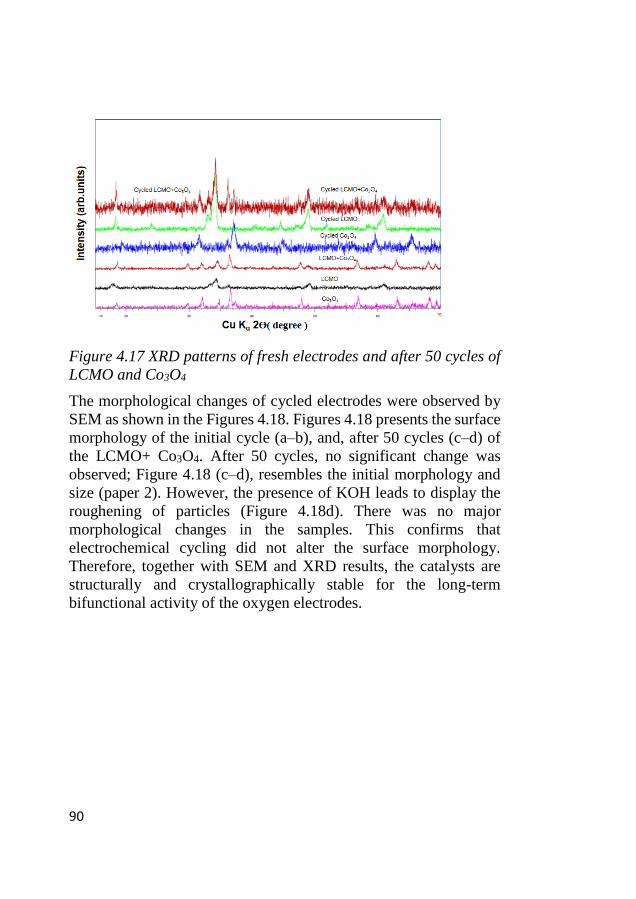
90
Figure 4.17 XRD patterns of fresh electrodes and after 50 cycles of
LCMO and Co3O4
The morphological changes of cycled electrodes were observed by
SEM as shown in the Figures 4.18. Figures 4.18 presents the surface
morphology of the initial cycle (a–b), and, after 50 cycles (c–d) of
the LCMO+ Co3O4. After 50 cycles, no significant change was
observed; Figure 4.18 (c–d), resembles the initial morphology and
size (paper 2). However, the presence of KOH leads to display the
roughening of particles (Figure 4.18d). There was no major
morphological changes in the samples. This confirms that
electrochemical cycling did not alter the surface morphology.
Therefore, together with SEM and XRD results, the catalysts are
structurally and crystallographically stable for the long-term
bifunctional activity of the oxygen electrodes.
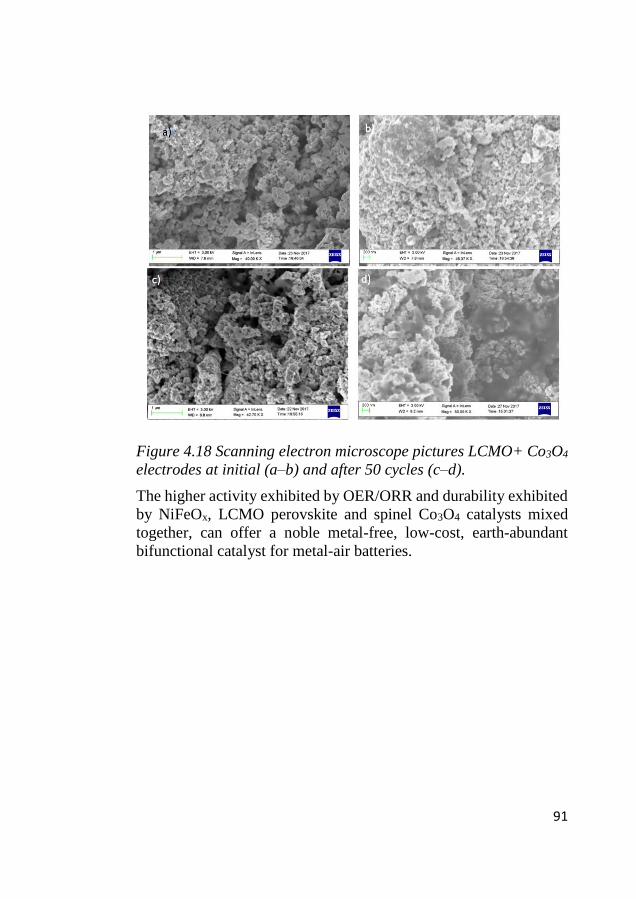
91
Figure 4.18 Scanning electron microscope pictures LCMO+ Co3O4
electrodes at initial (a–b) and after 50 cycles (c–d).
The higher activity exhibited by OER/ORR and durability exhibited
by NiFeOx, LCMO perovskite and spinel Co3O4 catalysts mixed
together, can offer a noble metal-free, low-cost, earth-abundant
bifunctional catalyst for metal-air batteries.

92

93
PART IV: FINAL REMARKS

94
95
PART IV Final remarks
5 Conclusion and outlook Cu-doped, CuSn-doped and Sn-doped nano iron active materials
were utilized as negative electrodes in alkaline electrolyte for
application in Fe-air batteries.
The Cu-doped electrode showed a stable electrode performance of
360 mAh g−1 at 80% charging efficiency; the capacity was even
stable at 360 mAh g−1 and also at 500 mA g−1. The Cu presence
increased the electrode kinetics in cyclic voltammetry and
polarization studies. Impedance analysis shows the increase of
surface roughness and reduced ohmic resistance upon cycling. The
ex-situ cycled electrode’s TEM and XRD analysis confirmed that
the core shell structure of iron carbide material was intact. Thus, the
nanoparticle core-shell structure was preserved.
Among the CuSn- and Sn-doped nano-iron/carbon composites, the
CuSn electrode exhibited 470 and 603 mAh g-1 with 91 to 93%
charge efficiency upon addition of CNT and LiOH, respectively.
The increased charge and discharge performances are due to the Cu,
Sn and Fe having been uniformly distributed on the carbon network.
Even though the CNT with LiOH additions increased the
performance to 91% and 603 mAh g-1, its cycling stability was
compromised due to the higher rate of hydrogen evolution, which
was confirmed through the in-operando MS. There were three
distinct hydrogen evolution regions: the first one was less than 1.5
V for the reduction of Fe(OH)2 to Fe and the least amount of
hydrogen; the second region is between 1.5–1.6 V for both iron
reduction and constant hydrogen evolution; finally, the higher rate
for hydrogen evolution is above 1.65 V. This higher rate of hydrogen
evolution at the end of the charge plateau made the electrodes fail
rapidly. The different charge current density experiment showed that
the charging at high current density increased the charging
efficiency and performance, and also reduced the amount of evolved
hydrogen due to the current limitation for hydrogen evolution
96
reaction. These findings will help to develop a suitable charging
algorithm in a way to limit the hydrogen evolution for the iron
electrode.
The decay in capacity is associated with the disappearance of sulfur
from the electrode having Cu and CuSn electrodes, while Sn nano-
sized non-uniform particles made the electrodes mechanically
unstable. The Cu and CuSn doping made a positive contribution to
the electrode performance. However, only Sn doping reduced the
performance. This Cu and CuSn nano-iron/carbon composite is a
suitable negative electrode for the alkaline Fe-air battery
application.
LCMO, Co3O4 and NiFeOx-based non-noble metal catalysts were
developed using facile methods. The resultant nanomaterials of both
the spinels and the perovskite and LDH phases showed uniform
particles with interconnected networks, and high surface and pore
volume for the efficient gas-liquid-solid reaction. The heat treatment
was used to fine-tune the particle size, phases and surface oxidation
states in the NiFeOx catalyst.
The RDE study of mixed La0.1Ca0.9MnO3 with Co3O4 catalyst
showed that the optimum performance on the amount of electron
transfer was around 3.2 e and this electrode has exhibited superior
bi-functional activity and stability for both the ORR and OER. The
mass activity performance on GC and GDE was similar on the OER
direction, while on the ORR direction there was a minor difference
due to electrode composition and rotation. The mass activities of
mixed catalysts on the OER and ORR side were found to be 1.3 and
1.98 A g−1, respectively. The high activity of the mixed catalyst
could be attributed to the synergistic effect and structural robustness
of perovskite and spinel oxides. The cycled GDE electrodes showed
a similar phase and structure to fresh electrodes in the ex-situ XRD
and SEM measurements. The blending of two different catalysts
could be a strategy to reduce the high overpotential on OER/ORR.
In the NiFeOx catalyst materials, the low-temperature treated
catalyst (250˚C) obtained the highest OER current density as 23 mA
97
cm-2 at 0.7 V and 41 mV decade-1 as the OER Tafel slope, while on
the ORR side, the reaction followed a quasi-4 e pathway and had a
124 mV decade-1 of Tafel slope. This higher activity was attributed
to a mixed chemical state and heterogeneous distribution of Ni ions
in the spinel structure at low temperature as illustrated by XPS.
Another important observation is that the catalyst loading changed
the activity of the OER/ORR. The thinner catalyst (0.125 mg cm-2)
on the OER increased the performance, in contrast to the OER,
where a thicker catalyst (0.75 mg cm-2) achieved more electron
transfer per oxygen molecule in the ORR.
Bifunctional stability on the ORR side and fairly stable activity on
the OER side after 50 cycles was observed. The TEM, XPS and
Raman showed elongated-thin nanoparticles with a mixed Ni
oxidation state, which further improved the electrocatalytic activity.
The mixing of two different catalysts with nanoparticle approach
will help to develop a low-cost electrocatalyst for bifunctional
oxygen electrodes for alkaline metal-air batteries.
Future work could be to increase the iron negative electrode life
cycles with stable charge efficiency by developing charging
algorithms and tuning the capacity utilization to limit the hydrogen
evolution and capacity decay. On the air electrode side, bifunctional
OER and ORR activity on GDL electrode should be performed with
optimum catalyst, highly conductive and stable carbonaceous
materials with different additives.
98
6 Acknowledgment First of all, I would like to thank my supervisor Docent Yohannes
Kiros for his encouragement, support, insights and mentoring me all
the way during the studies. I would like to thank Professor Lar
Petterson for giving me the opportunity to do my Ph.D in Chemical
Engineering.
I would like to extend my gratitude to Fe-air (FAIR) project leaders
and colleagues; Professor Dag Noréus, Mylad Chamoun, Dr. Björn
Skårman, and Dr. Hilmar Vidarsson, and Dr. Gunder Karlsson for
their valuable input and discussions during this thesis work.
I would like to thank Professor Mats Göthelid Dr. Malin. Johansson
for their contributions on XPS and Raman studies and Dr. Henrik
Svengren for his in-situ GC MS electrochemical studies.
Thanks to all my chemical technology and process technology
colleagues and researchers. I also wish to thank the enjoyable time I
spent with Zahri, Fatima, Sandra, Jerry, Saiman, Jonas, Pirouz,
Jorge, Pouya and Mahmoud and Efthymios. And my special thanks
to Fatima, Zahri, Saiman for their gym and Jerry Solis for his
restaurant tours.
I would like to thank for the time I spent in oversees during the
conference with Hyeyun Kim, Maria, Kevin, Fabian.
I would like to thank my friends outside the department: Sriram,
Vigneshwaran, Vali and Alagappan for their valuable suggestions
and their support during these years.
I gratefully acknowledge the Swedish Energy Agency (STEM) for
the financial support to carry out my Ph.D.
Finally, I would like to thank my family and friends for their endless
support, love and encouragement.
99
7 References [1] T. M. Gür Energy Environ. Sci. 2018, 11, 2696-2767.
[2] U. E. P. Agency. 2017, Nov 10, 2017.
[3] Global Wind Energy Council, Global Wind 2015 Report: Annual
Market Update, April 2016
[4] S. R. Narayanan, G. K. S. Prakash, A. Manohar, B. Yang, S.
Malkhandi, A. Kindler Solid State Ionics. 2012, 216, 105-109.
[5] H. Ibrahim, A. Ilinca, J. Perron Renewable and Sustainable
Energy Reviews. 2008, 12, 1221-1250.
[6] I. Hadjipaschalis, A. Poullikkas, V. Efthimiou Renewable and
Sustainable Energy Reviews. 2009, 13, 1513-1522.
[7] S. Vazquez, S. M. Lukic, E. Galvan, L. G. Franquelo, J. M.
Carrasco IEEE Transactions on Industrial Electronics. 2010, 57,
3881-3895.
[8] A. Castillo, D. F. Gayme Energ Convers Manage. 2014, 87, 885-
894.
[9] D. O. Akinyele, R. K. Rayudu Sustainable Energy Technologies
and Assessments. 2014, 8, 74-91.
[10] H. Chen, T. N. Cong, W. Yang, C. Tan, Y. Li, Y. Ding Progress
in Natural Science. 2009, 19, 291-312.
[11] D. Larcher, J. M. Tarascon Nat Chem. 2015, 7, 19-29.
[12] M. K. Ravikumar, S. Rathod, N. Jaiswal, S. Patil, A. Shukla
Journal of Solid State Electrochemistry. 2016, 1-22.
[13] D. Linden, T. B. Reddy, Handbook of batteries, New York :
McGraw-Hill, New York, 2002.
[14] K. Vijayamohanan, T. S. Balasubramanian, A. K. Shukla
Journal of Power Sources. 1991, 34, 269-285.
[15] A. H. Abdalla, C. I. Oseghale, J. O. G. Posada, P. J. Hall, IET
Renewable Power Generation, 2016, 10, 1529-1534.
[16] M. S. Whittingham Proceedings of the IEEE. 2012, 100, 1518-
1534.
[17] B. Dunn, H. Kamath, J.-M. Tarascon Science. 2011, 334, 928-
935.
[18] M. Yekini Suberu, M. Wazir Mustafa, N. Bashir Renewable
and Sustainable Energy Reviews. 2014, 35, 499-514.
100
[19] Y. Li, J. Lu ACS Energy Letters. 2017, 2, 1370-1377.
[20] US Geological Survey, Mineral Commodity Summaries, Jan.
2016.
[21] S. Malkhandi, B. Yang, A. K. Manohar, G. K. S. Prakash, S. R.
Narayanan Journal of the American Chemical Society. 2012, 135,
347-353.
[22] Y. Gorlin, T. F. Jaramillo Journal of the American Chemical
Society. 2010, 132, 13612-13614.
[23] A. R. Paulraj, Y. Kiros Journal of Solid State Electrochemistry.
2018.
[24] W. Song, Z. Ren, S.-Y. Chen, Y. Meng, S. Biswas, P. Nandi,
H. A. Elsen, P.-X. Gao, S. L. Suib ACS Applied Materials &
Interfaces. 2016, 8, 20802-20813.
[25] L. Jörissen J Power Sources. 2006, 155, 23-32.
[26] K. Vijayamohanan, A. K. Shukla, S. Sathyanarayana Journal
of Power Sources. 1987, 21, 53-57.
[27] A. K. Manohar, C. Yang, S. Malkhandi, B. Yang, G. K. Surya
Prakash, S. R. Narayanan Journal of The Electrochemical Society.
2012, 159, A2148-A2155.
[28] A. K. Manohar, C. Yang, S. R. Narayanan Journal of The
Electrochemical Society. 2015, 162, A1864-A1872.
[29] R. D. McKerracher, C. Ponce de Leon, R. G. A. Wills, A. A.
Shah, F. C. Walsh ChemPlusChem. 2015, 80, 323-335.
[30] H. Osgood, S. V. Devaguptapu, H. Xu, J. Cho, G. Wu Nano
Today. 2016, 11, 601-625.
[31] R. D. McKerracher, C. P. d. Leon, R. G. A. Wills, A. A. Shah,
F. C. Walsh ChemPlusChem. 2015, 80, 323-335.
[32] L. Öjefors Journal of The Electrochemical Society. 1976, 123,
1691-1696.
[33] B. Andersson, L. Öjefors Journal of The Electrochemical
Society. 1976, 123, 824-828.
[34] N. Jayalakshmi, V. S. Muralidharan Journal of Power Sources.
1990, 32, 277-286.
[35] G. P. Kalaignan, V. S. Muralidharan, K. I. Vasu J Appl
Electrochem. 1987, 17, 1083-1092.
101
[36] M. K. Ravikumar, A. S. Rajan, S. Sampath, K. R. Priolkar, A.
K. Shukla Journal of The Electrochemical Society. 2015, 162,
A2339-A2350.
[37] K. Vijayamohanan, A. K. Shukla, S. Sathyanarayana Journal
of Power Sources. 1990, 32, 329-339.
[38] R. Carta, S. Dernini, A. M. Polcaro, P. F. Ricci, G. Tola, ,
Journal of Electroanalytical Chemistry, 1988, 251, 257-268.
[39] I. Flis-Kabulska, J. Flis International Journal of Hydrogen
Energy. 2014, 39, 3597-3605.
[40] L. Öjefors Electrochimica Acta. 1976, 21, 263-266.
[41] J. Černý, K. Micka Journal of Power Sources. 1989, 25, 111-
122.
[42] P. R. Vassie, A. C. C. Tseung Electrochimica Acta. 1976, 21,
299-302.
[43] D. Lei, D. C. Lee, A. Magasinski, E. Zhao, D. Steingart, G.
Yushin ACS Appl Mater Interfaces. 2016, 8, 2088-2096.
[44] W. Jiang, F. Liang, J. Wang, L. Su, Y. Wu, L. Wang Rsc Adv.
2014, 4, 15394-15399.
[45] A. Ito, L. Zhao, S. Okada, J.-i. Yamaki Journal of Power
Sources. 2011, 196, 8154-8159.
[46] E. Shangguan, L. Guo, F. Li, Q. Wang, J. Li, Q. Li, Z. Chang,
X.-Z. Yuan Journal of Power Sources. 2016, 327, 187-195.
[47] E. Shangguan, F. Li, J. Li, Z. Chang, Q. Li, X.-Z. Yuan, H.
Wang Journal of Power Sources. 2015, 291, 29-39.
[48] B. T. Hang, T. Watanabe, M. Eashira, I. Watanabe, S. Okada,
J.-i. Yamaki Electrochemical and Solid-State Letters. 2005, 8,
A476-A480.
[49] B. T. Hang, T. Watanabe, M. Eashira, S. Okada, J.-i. Yamaki,
S. Hata, S.-H. Yoon, I. Mochida Journal of Power Sources. 2005,
150, 261-271.
[50] B. T. Hang, M. Eashira, I. Watanabe, S. Okada, J.-I. Yamaki,
S.-H. Yoon, I. Mochida Journal of Power Sources. 2005, 143, 256-
264.
[51] C. Y. Kao, K. S. Chou Journal of Power Sources. 2010, 195,
2399-2404.
102
[52] D. Lei, D.-C. Lee, A. Magasinski, E. Zhao, D. Steingart, G.
Yushin ACS Applied Materials & Interfaces. 2016, 8, 2088-2096.
[53] T. Kim, Y. Ohata, J. Kim, C. K. Rhee, J. Miyawaki, S.-H. Yoon
Carbon. 2014, 80, 698-707.
[54] K.-C. Huang, K.-S. Chou Electrochemistry Communications.
2007, 9, 1907-1912.
[55] C. X. Guo, C. M. Li Nano Energy. 2017, 42, 166-172.
[56] X. Wu, H. B. Wu, W. Xiong, Z. Le, F. Sun, F. Liu, J. Chen, Z.
Zhu, Y. Lu Nano Energy. 2016, 30, 217-224.
[57] A. S. Rajan, S. Sampath, A. K. Shukla Energy Environ. Sci.
2014, 7, 1110-1116.
[58] C.-Y. Kao, Y.-R. Tsai, K.-S. Chou J Power Sources. 2011, 196,
5746-5750.
[59] M. Chamoun, B. Skårman, H. Vidarsson, R. I. Smith, S. Hull,
M. Lelis, D. Milcius, D. Noréus Journal of The Electrochemical
Society. 2017, 164, A1251-A1257.
[60] Y. Li, H. Dai Chemical Society Reviews. 2014, 43, 5257-5275.
[61] Y. Lee, J. Suntivich, K. J. May, E. E. Perry, Y. Shao-Horn The
Journal of Physical Chemistry Letters. 2012, 3, 399-404.
[62] J. Chen, B. Lim, E. P. Lee, Y. Xia Nano Today. 2009, 4, 81-95.
[63] A. Morozan, B. Jousselme, S. Palacin Energy Environ. Sci.
2011, 4, 1238-1254.
[64] R. D. McKerracher, C. Alegre, V. Baglio, A. S. Aricò, C. Ponce
de León, F. Mornaghini, M. Rodlert, F. C. Walsh Electrochimica
Acta. 2015, 174, 508-515.
[65] D. Chen, C. Chen, Z. M. Baiyee, Z. Shao, F. Ciucci Chemical
Reviews. 2015, 115, 9869-9921.
[66] X. Li, W. Qu, J. Zhang, H. Wang Journal of The
Electrochemical Society. 2011, 158, A597-A604.
[67] H. Zhu, P. Zhang, S. Dai ACS Catalysis. 2015, 5, 6370-6385.
[68] J. Sunarso, A. A. J. Torriero, W. Zhou, P. C. Howlett, M.
Forsyth The Journal of Physical Chemistry C. 2012, 116, 5827-
5834.
[69] J. Suntivich, K. J. May, H. A. Gasteiger, J. B. Goodenough, Y.
Shao-Horn Science. 2011, 334, 1383-1385.
103
[70] J. Suntivich, H. A. Gasteiger, N. Yabuuchi, H. Nakanishi, J. B.
Goodenough, Y. Shao-Horn Nat Chem. 2011, 3, 647-647.
[71] W. T. Hong, M. Risch, K. A. Stoerzinger, A. Grimaud, J.
Suntivich, Y. Shao-Horn Energy Environ. Sci. 2015, 8, 1404-1427.
[72] M. S. D. Read, M. Saiful Islam, G. W. Watson, F. King, F. E.
Hancock Journal of Materials Chemistry. 2000, 10, 2298-2305.
[73] Y. Liu, J. Dong, D. Y. Xing Eur. Phys. J. B. 1998, 3, 185-188.
[74] X. Han, T. Zhang, J. Du, F. Cheng, J. Chen Chemical Science.
2013, 4, 368-376.
[75] J. Kim, X. Yin, K.-C. Tsao, S. Fang, H. Yang Journal of the
American Chemical Society. 2014, 136, 14646-14649.
[76] V. Celorrio, L. Calvillo, E. Dann, G. Granozzi, A. Aguadero,
D. Kramer, A. E. Russell, D. J. Fermin Catalysis Science &
Technology. 2016, 6, 7231-7238.
[77] M. Bursell, M. Pirjamali, Y. Kiros Electrochimica Acta. 2002,
47, 1651-1660.
[78] H. Morimoto, M. Kamata, T. Esaka Journal of The
Electrochemical Society. 1996, 143, 567-570.
[79] H. Morimoto, T. Esaka, S. Takai Materials Research Bulletin.
1997, 32, 1359-1366.
[80] G. Karlsson Electrochimica Acta. 1985, 30, 1555-1561.
[81] Y. Yan, B. Y. Xia, B. Zhao, X. Wang J Mater Chem A. 2016,
4, 17587-17603.
[82] N. N. Binitha, P. V. Suraja, Z. Yaakob, M. R. Resmi, P. P. Silija
J Sol-Gel Sci Techn. 2010, 53, 466-469.
[83] T. Meng, Q.-Q. Xu, Z.-H. Wang, Y.-T. Li, Z.-M. Gao, X.-Y.
Xing, T.-Z. Ren Electrochimica Acta. 2015, 180, 104-111.
[84] S. Zhao, B. Rasimick, W. Mustain, H. Xu Applied Catalysis B:
Environmental. 2017, 203, 138-145.
[85] Y. Huang, M. Zhang, P. Liu, L. Wang, F. Cheng Ionics. 2016,
1-8.
[86] S. K. Singh, V. M. Dhavale, S. Kurungot ACS Applied
Materials & Interfaces. 2015, 7, 21138-21149.
[87] R. Ramsundar, J. Debgupta, V. Pillai, P. Joy Electrocatalysis.
2015, 6, 331-340.
104
[88] H. M. A. Amin, H. Baltruschat, D. Wittmaier, K. A. Friedrich
Electrochimica Acta. 2015, 151, 332-339.
[89] M. Aghazadeh J Appl Electrochem. 2012, 42, 89-94.
[90] W. Liu, H. Yang, L. Zhao, S. Liu, H. Wang, S. Chen
Electrochimica Acta. 2016, 207, 293-300.
[91] A. J. Esswein, M. J. McMurdo, P. N. Ross, A. T. Bell, T. D.
Tilley The Journal of Physical Chemistry C. 2009, 113, 15068-
15072.
[92] Y. Liang, Y. Li, H. Wang, J. Zhou, J. Wang, T. Regier, H. Dai
Nat Mater. 2011, 10, 780-786.
[93] J. Jiang, W. Shi, S. Song, Q. Hao, W. Fan, X. Xia, X. Zhang,
Q. Wang, C. liu, D. Yan Journal of Power Sources. 2014, 248, 1281-
1289.
[94] X. W. Lou, D. Deng, J. Y. Lee, J. Feng, L. A. Archer Advanced
Materials. 2008, 20, 258-262.
[95] D. Wittmaier, S. Aisenbrey, N. Wagner, K. A. Friedrich
Electrochimica Acta. 2014, 149, 355-363.
[96] Z. Song, Y. Zhang, W. Liu, S. Zhang, G. Liu, H. Chen, J. Qiu
Electrochimica Acta. 2013, 112, 120-126.
[97] J. Xu, P. Gao, T. S. Zhao Energy Environ. Sci. 2012, 5, 5333-
5339.
[98] M. De Koninck, S.-C. Poirier, B. Marsan Journal of The
Electrochemical Society. 2007, 154, A381-A388.
[99] D. U. Lee, B. J. Kim, Z. Chen J Mater Chem A. 2013, 1, 4754-
4762.
[100] Y. Liang, H. Wang, J. Zhou, Y. Li, J. Wang, T. Regier, H. Dai
Journal of the American Chemical Society. 2012, 134, 3517-3523.
[101] S. Trasatti Journal of Electroanalytical Chemistry and
Interfacial Electrochemistry. 1980, 111, 125-131.
[102] P. H. Benhangi, A. Alfantazi, E. Gyenge Electrochimica Acta.
2014, 123, 42-50.
[103] S. Anantharaj, K. Karthick, M. Venkatesh, T. V. S. V. Simha,
A. S. Salunke, L. Ma, H. Liang, S. Kundu Nano Energy.
[104] S. Anantharaj, K. Karthick, S. Kundu Materials Today
Energy. 2017, 6, 1-26.
105
[105] L. Trotochaud, S. L. Young, J. K. Ranney, S. W. Boettcher
Journal of the American Chemical Society. 2014, 136, 6744-6753.
[106] D. A. Corrigan Journal of The Electrochemical Society. 1987,
134, 377-384.
[107] M. Hamdani, R. Singh, P. Chartier Int. J. Electrochem. Sci.
2010, 5, 556.
[108] L. Hu, L. Wu, M. Liao, X. Hu, X. Fang Advanced Functional
Materials. 2012, 22, 998-1004.
[109] N.-L. Wu, W.-R. Liu, S.-J. Su Electrochimica Acta. 2003, 48,
1567-1571.
[110] R. Cao, J.-S. Lee, M. Liu, J. Cho Advanced Energy Materials.
2012, 2, 816-829.
[111] E. L. Miller, R. E. Rocheleau Journal of The Electrochemical
Society. 1997, 144, 3072-3077.
[112] Y. Vlamidis, E. Scavetta, M. Gazzano, D. Tonelli
Electrochimica Acta. 2016, 188, 653-660.
[113] J. Du, C. Chen, F. Cheng, J. Chen Inorganic Chemistry. 2015,
54, 5467-5474.
[114] C. Yuan, H. B. Wu, Y. Xie, X. W. Lou Angewandte Chemie
International Edition. 2014, 53, 1488-1504.
[115] F. Cheng, J. Shen, B. Peng, Y. Pan, Z. Tao, J. Chen Nature
Chemistry. 2010, 3, 79.
[116] M. E. G. Lyons, R. L. Doyle, M. P. Browne, I. J. Godwin, A.
A. S. Rovetta Current Opinion in Electrochemistry. 2017, 1, 40-45.
[117] M. Srivastava, S. Chaubey, A. K. Ojha Materials Chemistry
and Physics. 2009, 118, 174-180.
[118] P. Dolcet, S. Diodati, F. Zorzi, P. Voepel, C. Seitz, B. Smarsly,
S. Mascotto, F. Nestola, S. Gross Green Chemistry. 2018.
[119] A. Paulraj, Y. Kiros, M. Göthelid, M. Johansson Catalysts.
2018, 8, 328.
[120] T. S. Balasubramanian, A. K. Shukla Journal of Power
Sources. 1993, 41, 99-105.
[121] H. Svengren, M. Chamoun, J. Grins, M. Johnsson
ChemElectroChem. 2018, 5, 44-50.
[122] F. Li, Y. Pan, H. Wang, X. Huang, Q. Zhang, Z. Peng, Y. Tang
Journal of The Electrochemical Society. 2017, 164, A1333-A1338.
106
[123] B. Wang, T. Liu, A. Liu, G. Liu, L. Wang, T. Gao, D. Wang,
X. S. Zhao Advanced Energy Materials. 2016, 6, 1600426.
[124] R. Li, Y. Wang, C. Zhou, C. Wang, X. Ba, Y. Li, X. Huang,
J. Liu Advanced Functional Materials. 2015, 25, 5384-5394.
[125] V. Ciupina, G. Prodan, F. Dumitrache, I. Morjan, R.
Alexandrescu, E. Popovici, I. Soare, L. Albu, R. Birjega, B. David,
O. Schneeweiss Proceedings SPIE 5924, Complex Mediums VI:
Light and Complexity, 592418 (23 August 2005).
[126] F. Li, E. Shangguan, J. Li, L. Li, J. Yang, Z. Chang, Q. Li, X.-
Z. Yuan, H. Wang Electrochimica Acta. 2015, 178, 34-44.
[127] A. Annamalai, P. S. Shinde, T. H. Jeon, H. H. Lee, H. G. Kim,
W. Choi, J. S. Jang Solar Energy Materials and Solar Cells. 2016,
144, 247-255.
[128] K. Xie, Z. Lu, H. Huang, W. Lu, Y. Lai, J. Li, L. Zhou, Y. Liu
Journal of Materials Chemistry. 2012, 22, 5560-5567.
[129] L. Bokobza, J.-L. Bruneel, M. Couzi C. 2015, 1, 77.
[130] K.-H. Wu, D.-W. Wang, D.-S. Su ChemElectroChem. 2016,
n/a-n/a.
[131] G. Valyulene, A. Zhelene, V. Jasulaitene, B. Shimkunaite
Russian Journal of Applied Chemistry. 2007, 80, 1322-1326.
[132] B. T. Hang, D. H. Thang J Alloy Compd. 2016, 655, 44-49.
[133] B. T. Hang, S. H. Yoon, S. Okada, J. Yamaki Journal of Power
Sources. 2007, 168, 522-532.
[134] B. T. Hang, T. Watanabe, M. Egashira, I. Watanabe, O.
Shigeto, J. Yamaki Journal of Power Sources. 2006, 155, 461-469.
[135] K. Vijayamohanan, A. K. Shukia, S. Sathyanarayana Journal
of Electroanalytical Chemistry and Interfacial Electrochemistry.
1990, 289, 55-68.
[136] K. Vijayamohanan, A. K. Shukla, S. Sathyanarayana Journal
of Electroanalytical Chemistry and Interfacial Electrochemistry.
1990, 295, 59-70.
[137] B. Wang, Y. Xie, T. Liu, H. Luo, B. Wang, C. Wang, L. Wang,
D. Wang, S. Dou, Y. Zhou Nano Energy. 2017, 42, 363-372.
[138] B. Wang, W. Al Abdulla, D. Wang, X. S. Zhao Energy
Environ. Sci. 2015, 8, 869-875.
107
[139] A. R. Paulraj, Y. Kiros, B. Skårman, H. Vidarsson Journal of
The Electrochemical Society. 2017, 164, A1665-A1672.
[140] B. Yang, S. Malkhandi, A. K. Manohar, G. K. S. Prakash, S.
R. Narayanan Energy Environ. Sci. 2014, 7, 2753-2763.
[141] K. C. Huang, K. S. Chou Electrochemistry Communications.
2007, 9, 1907-1912.
[142] C. Lucas, I. Eiroa, M. R. Nunes, P. A. Russo, M. M. L. Ribeiro
Carrott, M. I. da Silva Pereira, M. E. Melo Jorge Journal of Solid
State Electrochemistry. 2009, 13, 943-950.
[143] J. Du, T. Zhang, F. Cheng, W. Chu, Z. Wu, J. Chen Inorganic
Chemistry. 2014, 53, 9106-9114.
[144] M. Prabu, K. Ketpang, S. Shanmugam Nanoscale. 2014, 6,
3173-3181.
[145] M. Soldemo, E. Lundgren, J. Weissenrieder Surf Sci. 2016,
644, 172-179.
[146] T. Yamashita, P. Hayes Applied Surface Science. 2008, 254,
2441-2449.
[147] G. H. Jaffari, A. K. Rumaiz, J. C. Woicik, S. I. Shah J Appl
Phys. 2012, 111, 093906.
[148] S. Palmas, F. Ferrara, A. Vacca, M. Mascia, A. M. Polcaro
Electrochimica Acta. 2007, 53, 400-406.
[149] S. Palmas, F. Ferrara, A. Pisu, C. Cannas Chemical Papers.
2007, 61, 77-82.
[150] Q. Zhao, J. Yang, M. Liu, R. Wang, G. Zhang, H. Wang, H.
Tang, C. Liu, Z. Mei, H. Chen, F. Pan ACS Catalysis. 2018, 5621-
5629.
[151] S. Klaus, Y. Cai, M. W. Louie, L. Trotochaud, A. T. Bell The
Journal of Physical Chemistry C. 2015, 119, 7243-7254.
[152] M. A. Oliver-Tolentino, J. Vázquez-Samperio, A. Manzo-
Robledo, R. d. G. González-Huerta, J. L. Flores-Moreno, D.
Ramírez-Rosales, A. Guzmán-Vargas The Journal of Physical
Chemistry C. 2014, 118, 22432-22438.
[153] E. B. Castro, C. A. Gervasi International Journal of Hydrogen
Energy. 2000, 25, 1163-1170.
[154] M. E. Lyons, M. P. Brandon Int. J. Electrochem. Sci. 2008, 3,
1386-1424.
108
[155] J. O. Bockris, T. Otagawa The Journal of Physical Chemistry.
1983, 87, 2960-2971.
[156] P. Hosseini-Benhangi, M. A. Garcia-Contreras, A. Alfantazi,
E. L. Gyenge Journal of The Electrochemical Society. 2015, 162,
F1356-F1366.
[157] T. A. C., C. E. B., S. S. L., A. N. H., M. I. G., F. Laszlo, B.
Eric, K. Qing, R. R. C., K. M. L., Z. M. J., S. D. R. Angewandte
Chemie International Edition. 2016, 55, 10381-10385.
[158] J. Tulloch, S. W. Donne Journal of Power Sources. 2009, 188,
359-366.
[159] Y. J. Sa, K. Kwon, J. Y. Cheon, F. Kleitz, S. H. Joo J Mater
Chem A. 2013, 1, 9992-10001.
[160] P. Thangasamy, K. Selvakumar, M. Sathish, S. M. S. Kumar,
R. Thangamuthu Catalysis Science & Technology. 2017, 7, 1227-
1234.
[161] G. Zhang, Q. Wei, X. Yang, A. C. Tavares, S. Sun Applied
Catalysis B: Environmental. 2017, 206, 115-126.
[162] J. T. Mefford, W. G. Hardin, S. Dai, K. P. Johnston, K. J.
Stevenson Nat Mater. 2014, 13, 726-732.
[163] K. Nishio, S. Molla, T. Okugaki, S. Nakanishi, I. Nitta, Y.
Kotani Journal of Power Sources. 2015, 278, 645-651.
![IRON SHARPENS IRON “iron [does sharpen] iron…one man [does sharpen] another…” (Proverbs 27:17)](https://img.pdfslide.net/doc/110x75/56649c925503460f9494dd37/iron-sharpens-iron-iron-does-sharpen-ironone-man-does-sharpen-another.jpg)