Embed Size (px)
Citation preview
arX
iv:1
001.
2574
v2 [
astr
o-ph
.CO
] 2
6 Ja
n 20
10
Probing the Inner Jet of the Quasar PKS 1510−089 with
Multi-waveband Monitoring during Strong Gamma-ray Activity
Alan P. Marscher1, Svetlana G. Jorstad1,2, Valeri M. Larionov2,3, Margo F. Aller4, Hugh D.
Aller4, Anne Lahteenmaki5, Ivan Agudo 6, Paul S. Smith7, Mark Gurwell8, Vladimir A.
Hagen-Thorn2,3, Tatiana S. Konstantinova2, Elena G. Larionova2, Liudmila V. Larionova2,
Daria A. Melnichuk2, Dmitry A. Blinov2, Evgenia N. Kopatskaya2, Ivan S.Troitsky2, Merja
Tornikoski5, Talvikki Hovatta5, Gary D. Schmidt 7, Francesca D. D’Arcangelo1,9, Dipesh
Bhattarai1, Brian Taylor1,10, Alice R. Olmstead1, Emily Manne-Nicholas1, Mar
Roca-Sogorb6, Jose L. Gomez 6, Ian M. McHardy11, Omar Kurtanidze12, Maria G.
Nikolashvili12, Givi N. Kimeridze12, and Lorand A. Sigua12
ABSTRACT
We present results from monitoring the multi-waveband flux, linear polariza-
tion, and parsec-scale structure of the quasar PKS 1510−089, concentrating on
1Institute for Astrophysical Research, Boston University, 725 Commonwealth Avenue, Boston, MA 02215
2Astronomical Institute, St. Petersburg State University, Universitetskij Pr. 28, Petrodvorets, 198504
St. Petersburg, Russia
3Isaac Newton Institute of Chile, St. Petersburg Branch, St. Petersburg, Russia
4Astronomy Department, University of Michigan, 830 Dennison, 500 Church St., Ann Arbor, Michigan
48109-1042
5Metsahovi Radio Observatory, Helsinki University of Technology TKK, Metsahovintie 114, FIN-02540
Kylmala, Finland
6Instituto de Astrofısica de Andalucıa, CSIC, Apartado 3004, 18080, Granada, Spain
7Steward Observatory, University of Arizona, Tucson, AZ 85721-0065
8Harvard-Smithsonian Center for Astrophysics, 60 Garden St., Cambridge, MA 02138
9Current address: MIT Lincoln Laboratory, 244 WoodSt., Lexington, MA, 02421
10Lowell Observatory, Flagstaff, AZ 86001
11Department of Physics and Astronomy, University of Southampton, Southampton, SO17 1BJ, United
Kingdom
12Abastumani Astrophysical Observatory, Mt. Kanobili, Abastumani, Georgia
– 2 –
eight major γ-ray flares that occurred during the interval 2009.0-2009.5. The
γ-ray peaks were essentially simultaneous with maxima at optical wavelengths,
although the flux ratio of the two wavebands varied by an order of magnitude.
The optical polarization vector rotated by 720◦ during a 5-day period encom-
passing six of these flares. This culminated in a very bright, ∼ 1 day, optical
and γ-ray flare as a bright knot of emission passed through the highest-intensity,
stationary feature (the “core”) seen in 43 GHz Very Long Baseline Array im-
ages. The knot continued to propagate down the jet at an apparent speed of
22c and emit strongly at γ-ray energies as a months-long X-ray/radio outburst
intensified. We interpret these events as the result of the knot following a spiral
path through a mainly toroidal magnetic field pattern in the acceleration and
collimation zone of the jet, after which it passes through a standing shock in the
43 GHz core and then continues downstream. In this picture, the rapid γ-ray
flares result from scattering of infrared seed photons from a relatively slow sheath
of the jet as well as from optical synchrotron radiation in the faster spine. The
2006-2009.7 radio and X-ray flux variations are correlated at very high signifi-
cance; we conclude that the X-rays are mainly from inverse Compton scattering
of infrared seed photons by 20-40 MeV electrons.
Subject headings: quasars: individual (PKS 1510−089) — polarization— gamma
rays: general — radio continuum: galaxies — X-rays: galaxies
1. Introduction
Attempts to understand relativistic jets of blazars have been greatly advanced by the
availability of instruments such as the Very Long Baseline Array (VLBA), the Rossi X-ray
Timing Explorer (RXTE), and, most recently, the Fermi Gamma-ray Space Telescope, to-
gether with more traditional telescopes. Long-term multi-waveband monitoring of a number
of blazars with these facilities is now providing valuable insights into the physical processes in
the jets (e.g., Marscher et al. 2008; Chatterjee et al. 2008; Larionov et al. 2008). This paper
presents a rich set of observations of the γ-ray bright quasar PKS 1510−089 (z = 0.361),
whose jet exhibits apparent motions of emission features that are among the fastest (as high
as 45c) of all blazars observed thus far (Jorstad et al. 2005). We analyze motions of fea-
tures in the parsec-scale radio jet alongside variability of the optical polarization and flux
from radio through γ-ray frequencies. The relative timing of correlated variations probes
the structure and physics of the innermost jet regions where the flow is accelerated and
collimated, and where the emitting electrons are energized.
– 3 –
2. Observations and Data Analysis
Our observations include imaging with the VLBA at 43 GHz in both total and linearly
polarized intensity, with angular resolution near 0.10 milliarcseconds (mas), or a projected
distance of 0.50 pc (for H◦ = 71 km s−1 Mpc−1 and the concordance cosmology; Spergel et al.
2007). We processed the data and created images in a manner identical to that described
by Jorstad et al. (2005).
We derived 0.1-200 GeV γ-ray fluxes by analyzing data from the Large Area Telescope
(LAT) of the Fermi Gamma-ray Space Telescope with the standard software (Atwood et al.
2009). Photon counts from a circular region of radius 20◦ centered on PKS 1510−089 were
fit by single power-law spectral models of this source, PKS 1502+106, and PKS 1508−055,
plus model v02 of the Galactic and extragalactic backgrounds. The mean slope of the photon
spectrum for 2009.0-2009.5 for 7-day integrations, −2.48 ± 0.05, matched that reported by
Abdo et al. (2009) for 2008.6-2008.83. Our final fluxes are from 1-day integrations using this
slope, with a detection criterion that the maximum-likelihood test statistic (Mattox et al.
1996) exceed 9.0.
We obtained 2.4-10 keV X-ray fluxes with the RXTE PCA. We processed the data as
described by Marscher et al. (2008), fitting the photon count spectrum with a single power
law plus photoelectric absorption corresponding to a neutral hydrogen column density of
8 × 1020 cm−2. In addition, we measured flux densities at: 14.5 GHz with the 26 m antenna
of the University of Michigan Radio Astronomy Observatory (see Aller et al. 1985); 37 GHz
with the 14 m telescope of the Metsahovi Radio Observatory (see Terasranta et al. 1998);
and frequencies near 230 GHz with the Submillimeter Array (see Gurwell et al. 2007).
We measured the degree of optical linear polarization P and its position angle χ with:
the 0.4 m telescope of St. Petersburg State University; the 0.7 m telescope at the Crimean
Astrophysical Observatory; the PRISM camera on the Lowell Observatory 1.83 m Perkins
Telescope; the Steward Observatory 2.3 and 1.54 m telescopes 1; and the 2.2 m telescope
at Calar Alto Observatory, under the MAPCAT program. The data analysis procedures
for the various telescopes are described in D’Arcangelo et al. (2007); Larionov et al. (2008);
Jorstad et al. (2010). We also obtained optical (R-band) flux densities from photometric
observations at the six telescopes listed above, the 2.0 m Liverpool Telescope, and the 0.7 m
Meniscus Telescope of Abastumani Astrophysical Observatory. We have added data from
Yale University 2.
1Data listing: http://james.as.arizona.edu/∼psmith/Fermi
2Data listing: http://www.astro.yale.edu/smarts/glast
– 4 –
3. Observational Results and Discussion
A number of flares are apparent in the 2008-09 radio to γ-ray light curves (Fig. 1, which
includes γ-ray data from AGILE in 2008 March; D’Ammando et al. 2009). Of particular
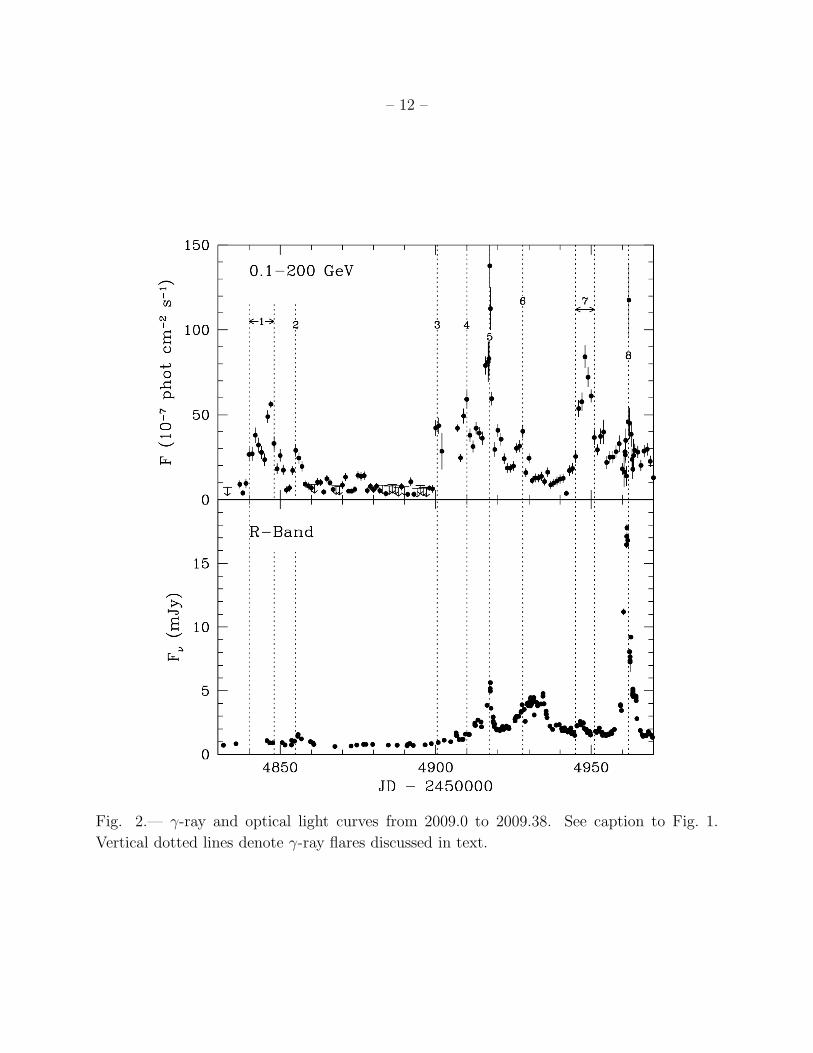
interest is the first half of 2009 (Fig. 2), during which eight major γ-ray flares are apparent.
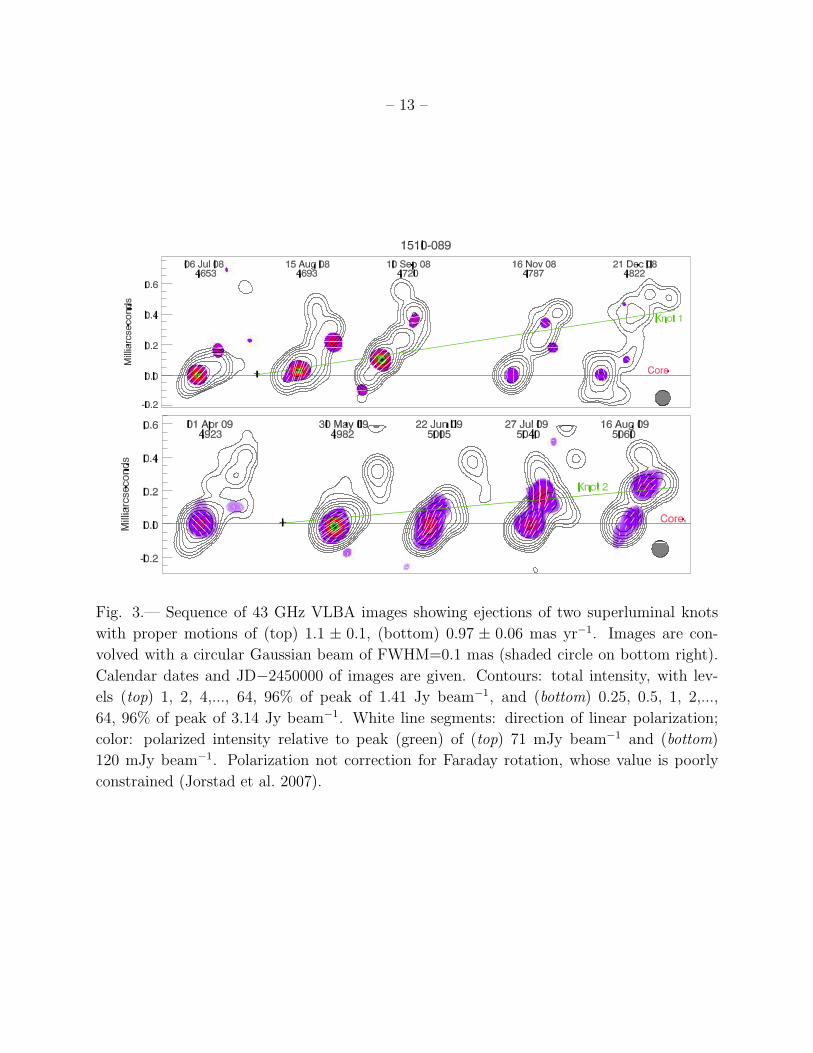
The VLBA images (Fig. 3) feature a bright “core,” presumed stationary, from which knots of
emission separate at apparent superluminal speeds. We detect two new knots, with apparent
speeds of 24±2 c and 21.6±0.6 c. The first passed the core on JD 2454675±20, as the X-ray
flux reached a sharp peak, and ∼ 2 weeks after a broad maximum in the 14.5 GHz flux (see
Fig. 1). The second knot passed the core on JD 2454959 ± 4, essentially simultaneous with
the extremely sharp, high-amplitude optical/γ-ray flare 8 on JD 2454962 (Fig. 2). We argue
below that this knot was responsible for flares 3-8 and possibly 1-2.
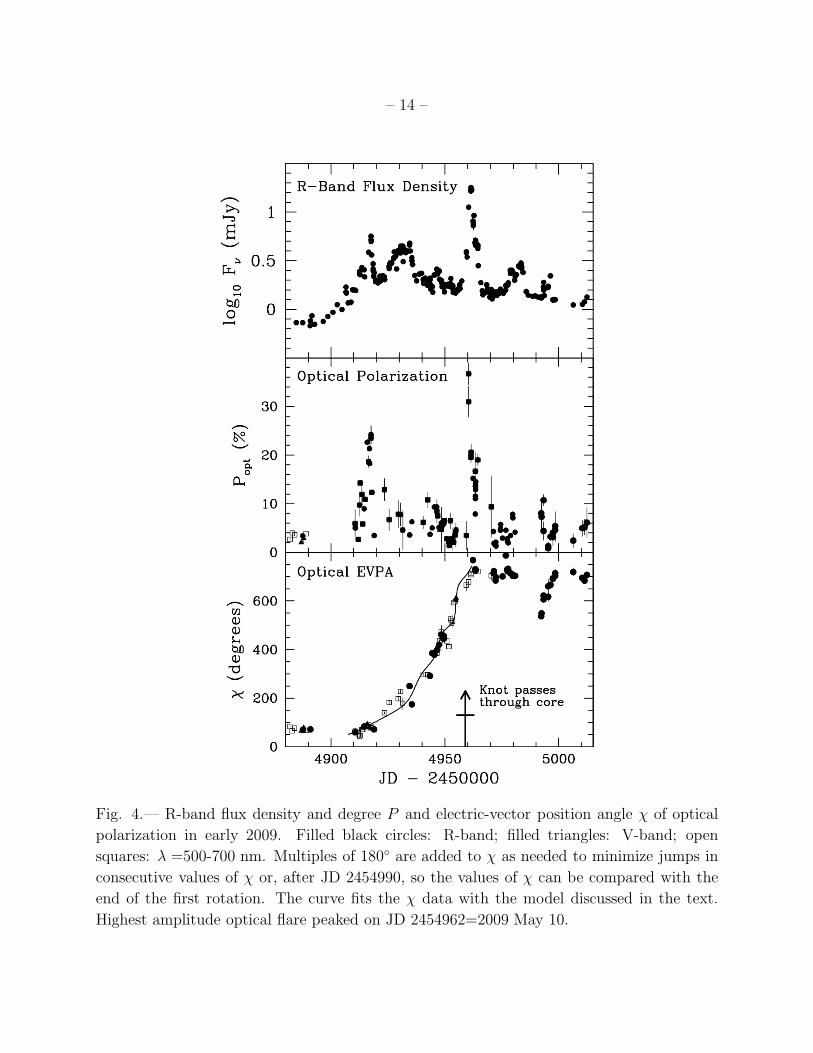
Flare 8 coincides with the end of a 50-day rotation of χ by 720◦ that started near flare 3
(see Fig. 4). This striking phenomenon can be explained either by a stochastic process or by
a coherent magnetic field geometry of the flaring region. In the stochastic interpretation, the
magnetic field is turbulent (see Jones 1988; Marscher et al. 1992; D’Arcangelo 2009) and the
apparent rotation results from a random walk of the resultant polarization vector direction
as cells with random magnetic field orientations enter and then exit the emission region.
According to our simulations (described by D’Arcangelo et al. 2007), one rotation by > 720◦
similar to that of PKS 1510−089 and lasting 50±10 days occurs once per ∼ 2, 000 days. The
probability that such a random apparent rotation would coincide so closely with a specific
50-day period of elevated γ-ray flux is extremely small, ∼ 0.1%. Furthermore, the model
predicts equally probable clockwise and counterclockwise rotations of χ in the same object,
while the ∼ 180◦ rotation of χ between JD 2454990 and 2455000 (see Fig. 4) proceeded at
the same counterclockwise rate as during the final stage of the larger rotation. This implies
that the rotation is dictated by geometry, with the accompanying minor flare occurring in
the same location as flare 8.
We observed a similar, but shorter, rotation of the optical polarization in BL Lac in
2005 (Marscher et al. 2008). We apply our phenomenological model developed to explain
that event to PKS 1510−089. A moving emission feature follows a spiral path as it propa-
gates through the toroidal magnetic field of the acceleration and collimation zone of the jet
(Komissarov et al. 2007). The spiral motion is caused either by rotation of the flow (Vlahakis
2006) or a helical stream of electron-positron pairs injected from the black hole’s ergosphere
(Williams 2004). The secular increase in the rate of rotation (see Fig. 4) is due to an increas-
ing Doppler factor as the flow accelerates until it reaches the core, since the Lorentz factor
increases as the cross-sectional radius of the jet (Vlahakis & Konigl 2004; Vlahakis 2006;
Komissarov et al. 2007). [However, the rest-frame angular velocity of the emission feature
– 5 –
cannot decrease to conserve specific angular momentum as the jet expands (Steffen et al.
1995; Vlahakis 2006), hence the spiral path followed by the centroid of the feature must
maintain a constant radius of helical motion to avoid this.] The emission feature must cover
most of the cross-section of the jet in order to create substantial flares and to cancel most of
the polarization (from different orientations of the toroidal magnetic field across the feature)
while leaving a residual of . 10%, with χ rotating systematically as the feature proceeds
down the jet. Front-to-back light-travel time delays also cancel some polarization by stretch-
ing the feature along the spiral path as viewed by the observer. Synchrotron flares occur
when the energization of electrons increases suddenly over some or all of the emission region;
our model does not attempt to explain these sudden surges in particle acceleration. The
solid curve in the bottom panel of Figure 4 shows the fit to the variation of χ of the model,
with parameter values that are typical but probably not unique. The bulk Lorentz factor
increases linearly with longitudinal distance down the jet from a value of 8 at the onset of
the rotation to 24 at the end. The viewing angle of the jet axis is 1.4◦ in the model, so the
Doppler factor increases from 15 to 38 during this time, and the final apparent speed is 21c,
matching the observed value within the uncertainties. The inflections of the curve are due to
changing aberration, which we calculate with the equations of Konigl & Choudhuri (1985).
The scenario proposed in that paper, in which the jet twists from helical instabilities, can
explain the rotation of χ but not the observed low, randomly changing degree of polarization.
The secular increase both in the rate of rotation of χ and in optical flux during the first half
of the outburst results from the acceleration of the flow and consequent enhanced beaming.
Flare 8, featuring the highest optical flux observed since 1948 (Liller & Liller 1975),
occurred as the rotation of χ was ending and the new superluminal knot was passing the
core. This event can be explained by compression of the knot by a standing conical shock
(Marscher et al. 2008). According to our model, when the knot passed the core it was
propagating down the jet at 0.3 pc day−1 in our frame, and had traveled 17 pc downstream
since the rotation of χ began. The transverse radius of the jet at this point is ∼ 2 × 10¹⁷
cm, based on the opening angle of the jet ∼ 0.2◦ derived by Jorstad et al. (2005). The
propagation rate, plus the 1-day timescale of the flare, sets the longitudinal size of the
optical flare region at ∼ 0.3 pc. We associate this size with the distance moved by an
electron radiating at R-band before it loses too much energy to continue doing so. To
determine the energy loss rate for all of the events, we first calculate the ratio of γ-ray
(> 100 MeV) to synchrotron luminosity (which equals the ratio of inverse-Compton to
synchrotron loss rate), ζgs, of the peak of flares 1-8 to be 70, 30, 40, 40, 30, 10, 40, and
9, respectively. We estimate the luminosity of the synchrotron radiation, whose spectral
energy distribution peaks at infrared wavelengths, as the R-band flux density multiplied by
νR = 4.7 × 10¹⁴ Hz, by 1.27 to correct for extinction (Schlegel et al. 1998), and then by
– 6 –
6 to convert roughly to bolometric luminosity (see Kataoka et al. 2008). We then derive
that the magnetic field B ∼ [(6 × 10⁶ s)(Γ/20)c/(0.3ξ pc)]2/3(δ/40)1/3 ∼ 0.4ξ−2/3 G during
flare 8, where ξ ≡ (uB + uphot)/uB, ξζgs ∼ 9 if the seed photons originate from outside the
emission feature, ξ ∼ 1 for mainly first-order SSC, and ξ ∼ ζ1/2gs ∼ 3 for combined first-
and second-order SSC. We therefore obtain B ∼ 0.1–0.4 G, with the highest value for the
first-order SSC case. The (toroidal) magnetic field at the start of the rotation of χ was then
∼ 1 G.
The 50-day rotation of χ implies that a single moving emission feature was responsible for
the entire outburst encompassing flares 3-8. We identify this feature as the superluminal knot
seen later in the VLBA images (Fig. 3), whose polarization vector lies in the same direction
as in the optical shortly after flare 8. Our observations therefore demonstrate that the high-
energy emission from the jet of PKS 1510−089 is quite complex, arising from different regions
and probably by multiple emission mechanisms as a single disturbance propagates down the
jet. Both the γ-ray and optical emission is highly variable, but not always in unison. This
is unexpected, since when B ∼ 0.1–1 G, electrons with the same energies, γe ∼ 103.5±0.3 in
rest-mass units, should be involved in optical synchrotron radiation and inverse Compton
scattering of optical or IR photons to γ-ray energies.
When the emission feature was close to the base of the jet, electrons in the jet could
have scattered the broad emission-line region or accretion-disk photons to γ-ray energies
as the disturbance first became optically thin to photon-photon pair production (see, e.g.,
Ghisellini & Tavecchio 2009; Dermer et al. 2009). We speculate that this could correspond
to flares 1-2. In this case, the subsequent quiescent period would imply that there is a section
of the jet where neither seed photons nor electrons with γe & 103 are abundant.
We conclude that some or all of γ-ray flares 1-4 and 7, with very weak optical coun-
terparts, were caused by sudden increases in the local seed photon field at optical or IR
wavelengths rather than by increased energization of electrons. The time scales of variabil-
ity limit the size of each source of seed photons to a . 1 pc—not much larger than the
cross-sectional radius of the jet, ∼ 0.1 pc—while the luminosity of each would need to be
∼ 3×1043(ζgs/60)(Γ/20)−2(B/0.4 G)2(a/0.1 pc)2erg s−1 if the source lies at the periphery of
the jet, and higher if more remote. This luminosity is too high for any commonly occurring
cosmic object located parsecs from the central engine, but could be obtained in a relatively
slow sheath surrounding the ultra-fast spine of the jet responsible for the high superluminal
motion (Ghisellini et al. 2005). Moving knots or standing shocks in the sheath could produce
the requisite number of seed photons while being too poorly beamed to contribute substan-
tially to the observed flux. The relatively slow motion and gradual evolution of such features
implies that they should persist for years, in which case another series of flares in the near
– 7 –
future should exhibit a similar pattern of variability and appearance of a superluminal knot.
Flares 5 and 8 included rapid optical flaring that required sudden energization of elec-
trons to γ ∼ 103.5±0.3. This suggests that the flaring γ-rays could have been created by the
SSC process, an inference that is supported by the lower value of ζgs than for the other flares.
This ratio was, however, much greater than unity, which implies that second-order scattering
contributed significantly to the γ-ray flux (e.g., Bloom & Marscher 1996). We should there-
fore expect a different slope of the γ-ray photon spectrum for these flares than for flares 1-4
and 7. There are a sufficient number of photon counts to measure the slopes for flares 5,
7, and 8: −2.36 ± 0.09, −2.73 ± 0.17, and −1.92 ± 0.21, respectively. The probability that
these are the same is ∼ 0.2%. Detailed modeling is needed to determine the slopes expected
for the different radiation mechanisms.
The extremely high optical flux and polarization of flare 8 imply that the magnetic
field was higher and more ordered for this event than for other flares. This is consistent
with our interpretation that the 43 GHz core—where flare 8 occurred—is a standing shock.
The low value of ζgs implies that the magnetic field was compressed by a factor ∼ 2 over
the previous flare. We suggest that the emission region responsible for flare 5, when the
polarization increased to > 20%, was a subset of the entire disturbance, so that there was less
cancellation of the polarization. This indicates that the flare was caused by unusually efficient
energization of electrons over only part of the disturbance, although we have insufficient
information to determine the cause. In contrast, flares 6 and 7 occurred when the polarization
was quite low, which implies that electrons were accelerated less intensely throughout the
entire disturbance.
The flare in 2008 September (JD 2454700-2454750; Fig. 1) is of a different nature than
flares 1-8. It took place one month after a very bright superluminal knot passed through
the core (which coincided with the peak of a major X-ray flare), consistent with the finding
of Jorstad et al. (2001) and Lahteenmaki & Valtaoja (2003) that high γ-ray states often
follow the time when a new superluminal knot coincides with the core or a millimeter-wave
outburst starts. The frequency-dependent delays — the emission peaked first at optical,
then γ-ray (10-day lag), and then radio and X-ray (24-day lag) frequencies — contrast with
the simultaneity of the optical and γ-ray maxima of flares 2, 5, 7, and 8. The time delays
imply that a power law is maintained over only a limited range of electron energies, with the
range changing as a knot separates from the core.
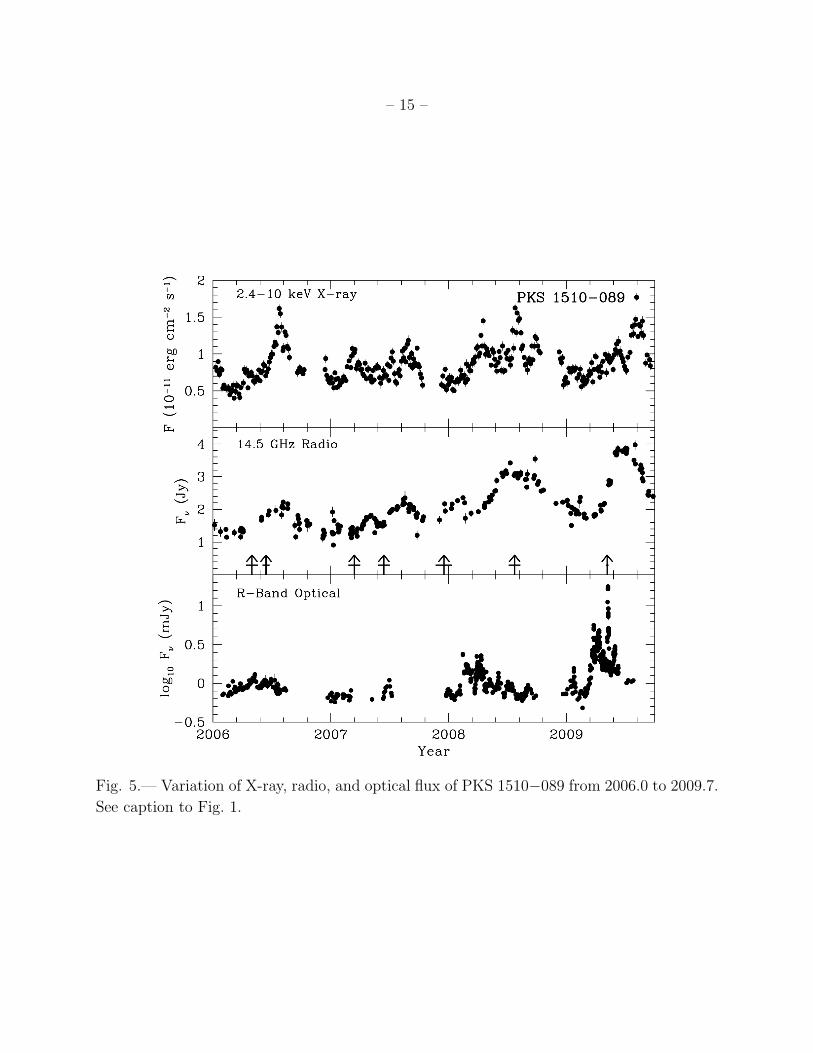
Since 1996, the X-ray emission has correlated better with the 14.5 GHz variations than
with those at higher frequencies (Marscher 2006). During the 2006-2009 period covered
by Figure 5, the correlation is significant at > 99% confidence. The electrons radiating
at 14.5 GHz near the core have energies γe ∼ 20-40 in rest mass units, far too small to
– 8 –
scatter the 14.5 GHz photons to X-ray energies. For this reason, we conclude, as have
Kataoka et al. (2008), that these electrons produce the X-rays via inverse Compton scattering
of IR seed photons from either the sheath of the jet or a source outside the jet, such as a
dust torus (B lazejowski et al. 2000). In this case, the X-ray variability is in response to
both the evolution of the electron energy distribution—which affects the radio emission in
a similar way — and changes in the seed photon density as a knot propagates down the
jet. In the observer’s frame, the radiative energy loss time scale of γe ∼ 30 electrons,
tloss ∼ 3×10⁷B−2ζ−1gs δ
−1 s, ∼ 5 days when B ∼ 0.4 G and δζgs ∼ 400. This is commensurate
with the fastest X-ray and radio variability that we have observed.
4. Conclusions
Our comprehensive dataset has revealed some patterns that allow us to probe the loca-
tions and causes of the high-energy emission in PKS 1510−089. The rotation of the optical
polarization vector over 50 days in 2009, as multiple γ-ray and optical flares took place, im-
plies that a single emission feature—the superluminal knot later seen in our VLBA images—
was responsible for these variations. As for BL Lac (Marscher et al. 2008), we model this as
a structure that followed a spiral path through a helical magnetic field where the jet flow ac-
celerates. The γ-ray to synchrotron flux ratio varied greatly among the different flares. This
requires local sources of seed photons from both within the jet and just outside, probably in
a surrounding sheath. As a consequence, flares erupt at a variety of locations as disturbances
pass down the jet. Future comprehensive multi-waveband monitoring plus VLBA imaging
will determine the extent to which our findings apply to the general population of blazars.
Funding of this research included NASA grants NNX08AJ64G and NNX08AV65G and
NNX08AV65G, NSF grants AST-0907893 and AST-0607523 (U. Michigan), Russian RFBR
grant 09-02-0092, Spanish “Ministerio de Ciencia e Innovacion” grant AYA2007-67626-C03-
03, the Academy of Finland, the University of Michigan, and Georgian National Science
Foundation grant GNSF/ST08/4-404. The VLBA is an instrument of the National Ra-
dio Astronomy Observatory, a facility of the NSF, operated under cooperative agreement
by Associated Universities, Inc. The Calar Alto Observatory is jointly operated by the
Max-Planck-Institut fur Astronomie and the Instituto de Astrofısica de Andalucıa-CSIC.
The SMA is a joint project between the Smithsonian Astrophysical Observatory and the
Academia Sinica Institute of Astronomy and Astrophysics, funded by the Smithsonian In-
stitution and the Academia Sinica. The Liverpool Telescope, operated on the island of La
Palma by Liverpool John Moores University in the Spanish Observatorio del Roque de los
Muchachos of the Instituto de Astrofisica de Canarias, is funded by the UK Science and
– 9 –
Technology Facilities Council.
Facilities: VLBA, RXTE, Fermi, Liverpool:2m, Perkins, Steward:2.3m,1.54m, Calar
Alto:2.2m, UMRAO, SMA
REFERENCES
Abdo, A., et al. 2009, ApJS, 183, 46
Aller, H. D., et al. 1985, ApJS, 59, 513
Atwood, W. B., et al. 2009, ApJ, 697, 1071
B lazejowski, et al. 2000, ApJ, 545, 107
Bloom, S. D., & Marscher, A. P. 1996, ApJ, 461, 657
Chatterjee, R., et al. 2008, ApJ, 689, 79
D’Ammando, F. 2009, A&A, 508, 181
D’Arcangelo, F. D., et al. 2007, ApJ, 659, L107
D’Arcangelo, F. D. 2009, Ph.D. Thesis, Boston University
Dermer, C. D., Finke, J. D., Krug, H., & Bottcher, M. 2009, ApJ, 692, 32
Ghisellini, G., & Tavecchio, F. 2009, MNRAS, 397, 985
Ghisellini, G., Tavecchio, F., & Chiaberge, M. 2005, A&A, 432, 401
Gurwell, M. A., Peck, A. B., Hostler, S. R., Darrah, M. R., & Katz, C. A. 2007, in From
Z-Machines to ALMA: (Sub)millimeter Spectroscopy of Galaxies, ed. A. J. Baker et
al., ASP Conf. Ser., 375, 234
Jones, T. W. 1988, ApJ, 332, 678
Jorstad, S. G., et al. 2001, ApJ, 556, 738
Jorstad, S. G., et al. 2005, AJ, 130, 1418
Jorstad, S. G., et al. 2007, AJ, 134, 799
Jorstad, S. G., et al. 2010, ApJ, submitted
– 10 –
Kataoka, J., et al. 2008, ApJ, 672, 787
Komissarov, S. S., Barkov, M. V., Vlahakis, N., & Konigl, A. 2007, MNRAS, 380, 51
Konigl, A., & Choudhuri, A. R. 1985, ApJ, 289, 188
Latheenmaki, A., & Valtaoja, E. 2003, ApJ, 580,85
Larionov, V. M., et al. 2008, A&A, 492, 389
Liller, M. H., & Liller, W. 1975, ApJ, 199, 133
Marscher, A. P. 2006, in Variability of Blazars II: Entering the GLAST Era, ed. H. R. Miller,
K. Marshall, J. R. Webb, & M. F. Aller, ASP Conf. Ser., 350, 155
Marscher, A. P., et al. 2008, Nature, 452, 966
Marscher, A. P., Gear, W. K., & Travis, J. P. 1992, in Variability of Blazars, ed. E. Valtaoja
& M. Valtonen (Cambridge U. Press), 85
Mattox, J. R., et al. 1996, ApJ, 461, 396
Schlegel, D. J., Finkbeiner, D. P., & Davis, M. 1998, ApJ, 500, 525
Spergel, D. N. et al. 2007, ApJS, 170, 377
Steffen, W., et al. 1995, A&A, 302, 335
Terasranta, H., et al. 1998, A&AS, 132, 305
Vlahakis, N. 2006, in Blazar Variability Workshop II: Entering the GLAST Era, ed. H. R.
Miller et al., ASP Conf. Ser., 350, 169
Vlahakis, N., & Konigl, A. 2004, ApJ, 605,656
Williams, R. K. 2004, ApJ, 611, 952
This preprint was prepared with the AAS LATEX macros v5.2.
– 11 –
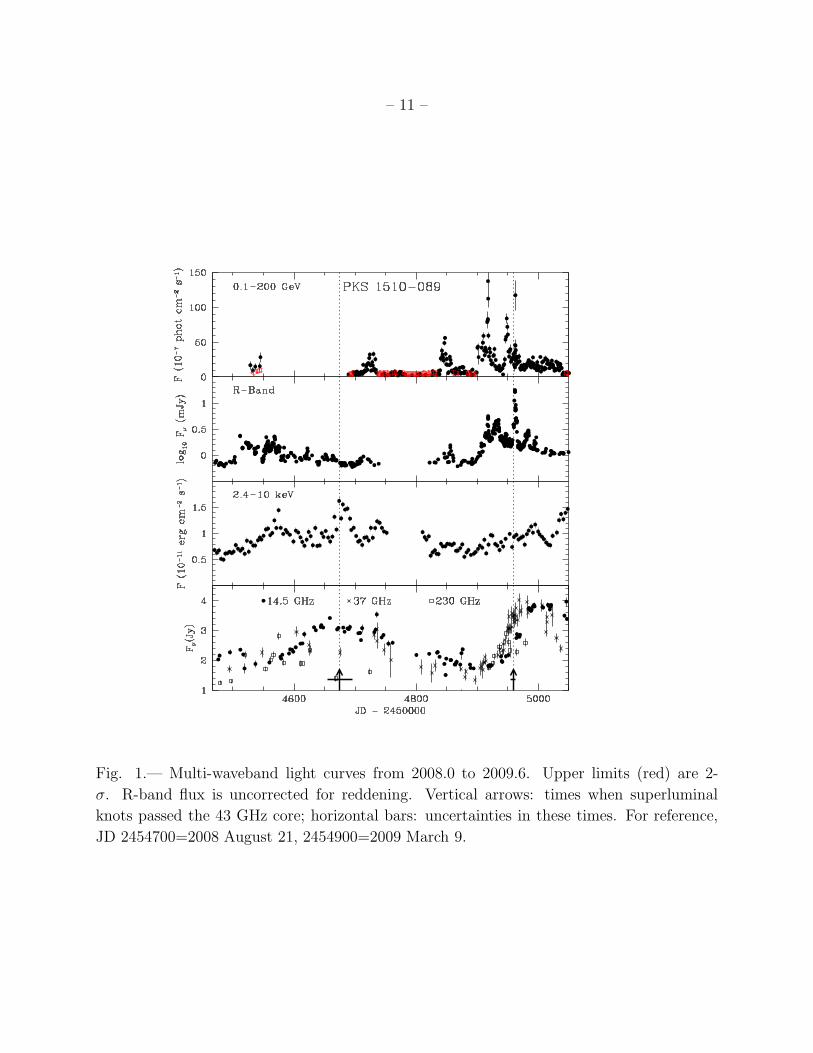
Fig. 1.— Multi-waveband light curves from 2008.0 to 2009.6. Upper limits (red) are 2-
σ. R-band flux is uncorrected for reddening. Vertical arrows: times when superluminal
knots passed the 43 GHz core; horizontal bars: uncertainties in these times. For reference,
JD 2454700=2008 August 21, 2454900=2009 March 9.
– 12 –
Fig. 2.— γ-ray and optical light curves from 2009.0 to 2009.38. See caption to Fig. 1.
Vertical dotted lines denote γ-ray flares discussed in text.
– 13 –
Fig. 3.— Sequence of 43 GHz VLBA images showing ejections of two superluminal knots
with proper motions of (top) 1.1 ± 0.1, (bottom) 0.97 ± 0.06 mas yr−1. Images are con-
volved with a circular Gaussian beam of FWHM=0.1 mas (shaded circle on bottom right).
Calendar dates and JD−2450000 of images are given. Contours: total intensity, with lev-
els (top) 1, 2, 4,..., 64, 96% of peak of 1.41 Jy beam−1, and (bottom) 0.25, 0.5, 1, 2,...,
64, 96% of peak of 3.14 Jy beam−1. White line segments: direction of linear polarization;
color: polarized intensity relative to peak (green) of (top) 71 mJy beam−1 and (bottom)
120 mJy beam−1. Polarization not correction for Faraday rotation, whose value is poorly
constrained (Jorstad et al. 2007).
– 14 –
Fig. 4.— R-band flux density and degree P and electric-vector position angle χ of optical
polarization in early 2009. Filled black circles: R-band; filled triangles: V-band; open
squares: λ =500-700 nm. Multiples of 180◦ are added to χ as needed to minimize jumps in
consecutive values of χ or, after JD 2454990, so the values of χ can be compared with the
end of the first rotation. The curve fits the χ data with the model discussed in the text.
Highest amplitude optical flare peaked on JD 2454962=2009 May 10.
– 15 –
Fig. 5.— Variation of X-ray, radio, and optical flux of PKS 1510−089 from 2006.0 to 2009.7.
See caption to Fig. 1.
![arXiv:1304.3167v1 [astro-ph.SR] 11 Apr 2013](https://img.pdfslide.net/doc/110x75/589450b81a28ab46038bc3e1/arxiv13043167v1-astro-phsr-11-apr-2013.jpg)
![arXiv:1010.0397v1 [astro-ph.IM] 3 Oct 2010](https://img.pdfslide.net/doc/110x75/5869bac11a28ab3f7c8b9dca/arxiv10100397v1-astro-phim-3-oct-2010.jpg)
![arXiv:1208.2734v1 [astro-ph.IM] 14 Aug 2012](https://img.pdfslide.net/doc/110x75/58a2c5d01a28abf0458bb69a/arxiv12082734v1-astro-phim-14-aug-2012.jpg)
![arXiv:2109.07200v1 [astro-ph.SR] 15 Sep 2021](https://img.pdfslide.net/doc/110x75/6159ea45dfca0503312afefd/arxiv210907200v1-astro-phsr-15-sep-2021.jpg)
![arXiv:1602.04199v2 [astro-ph.HE] 18 Feb 2016](https://img.pdfslide.net/doc/110x75/587185cb1a28ab613f8ba7d2/arxiv160204199v2-astro-phhe-18-feb-2016.jpg)
![arXiv:1112.5336v2 [astro-ph.CO] 22 Mar 2012](https://img.pdfslide.net/doc/110x75/589054a11a28abfe7f8be4ce/arxiv11125336v2-astro-phco-22-mar-2012.jpg)
![arXiv:1801.02094v2 [astro-ph.IM] 9 Feb 2018](https://img.pdfslide.net/doc/110x75/62092be8a3f15373502c4bcb/arxiv180102094v2-astro-phim-9-feb-2018.jpg)
![arXiv:2111.03094v1 [astro-ph.HE] 4 Nov 2021](https://img.pdfslide.net/doc/110x75/620e12dc5cc670596f27365f/arxiv211103094v1-astro-phhe-4-nov-2021.jpg)
![arXiv:1007.3672v1 [astro-ph.CO] 21 Jul 2010](https://img.pdfslide.net/doc/110x75/58a04b401a28ab78628b9718/arxiv10073672v1-astro-phco-21-jul-2010.jpg)
![arXiv:1111.1183v1 [astro-ph.IM] 4 Nov 2011](https://img.pdfslide.net/doc/110x75/587708c71a28ab0f538b9f78/arxiv11111183v1-astro-phim-4-nov-2011.jpg)
![arXiv:2108.10888v2 [astro-ph.EP] 1 Sep 2021](https://img.pdfslide.net/doc/110x75/6238a9e5a36ee4276e1520f3/arxiv210810888v2-astro-phep-1-sep-2021.jpg)
![arXiv:1304.5017v1 [astro-ph.EP] 18 Apr 2013](https://img.pdfslide.net/doc/110x75/58a0313f1a28aba94a8c587d/arxiv13045017v1-astro-phep-18-apr-2013.jpg)
![arXiv:1306.5105v1 [astro-ph.CO] 21 Jun 2013](https://img.pdfslide.net/doc/110x75/58a2c2251a28aba27f8b53d2/arxiv13065105v1-astro-phco-21-jun-2013.jpg)
![arXiv:0801.1232v5 [astro-ph] 28 May 2008](https://img.pdfslide.net/doc/110x75/58a2e1111a28ab2d678b7e40/arxiv08011232v5-astro-ph-28-may-2008.jpg)
![arXiv:1208.2957v1 [astro-ph.EP] 14 Aug 2012](https://img.pdfslide.net/doc/110x75/624238bbd5e99f06bb3dcc30/arxiv12082957v1-astro-phep-14-aug-2012.jpg)
![arXiv:1909.12840v2 [astro-ph.HE] 19 Nov 2019](https://img.pdfslide.net/doc/110x75/62411db5d23d5c6d7579b33c/arxiv190912840v2-astro-phhe-19-nov-2019.jpg)
![arXiv:1010.5618v1 [astro-ph.SR] 27 Oct 2010](https://img.pdfslide.net/doc/110x75/586cb4a71a28ab42788bb85a/arxiv10105618v1-astro-phsr-27-oct-2010.jpg)
![arXiv:2108.05358v1 [astro-ph.EP] 11 Aug 2021](https://img.pdfslide.net/doc/110x75/6214dd016bed09360a440c54/arxiv210805358v1-astro-phep-11-aug-2021.jpg)
![arXiv:2106.15656v1 [astro-ph.CO] 29 Jun 2021](https://img.pdfslide.net/doc/110x75/62077fc1112eea46f360b98f/arxiv210615656v1-astro-phco-29-jun-2021.jpg)
![arXiv:2109.08926v1 [astro-ph.GA] 18 Sep 2021](https://img.pdfslide.net/doc/110x75/62530957b3ba0e63f54fd47f/arxiv210908926v1-astro-phga-18-sep-2021.jpg)
![arXiv:1003.2504v1 [astro-ph.CO] 12 Mar 2010](https://img.pdfslide.net/doc/110x75/588daf6f1a28ab87218bbad9/arxiv10032504v1-astro-phco-12-mar-2010.jpg)
![arXiv:1803.04091v3 [astro-ph.EP] 23 May 2018](https://img.pdfslide.net/doc/110x75/622d05769c11f635db165e90/arxiv180304091v3-astro-phep-23-may-2018.jpg)
![arXiv:1905.10659v1 [astro-ph.EP] 25 May 2019](https://img.pdfslide.net/doc/110x75/620685b0ef589d5ca97ed9c9/arxiv190510659v1-astro-phep-25-may-2019.jpg)
![andIvanYu.Zolotukhin arXiv:1002.2360v1 [astro-ph.IM] 11](https://img.pdfslide.net/doc/110x75/628f0f80605a8c519c006bbd/-arxiv10022360v1-astro-phim-11-.jpg)
![arXiv:1501.00963v2 [astro-ph.IM] 8 Jan 2015](https://img.pdfslide.net/doc/110x75/61d3af84d7cef76f5e315015/arxiv150100963v2-astro-phim-8-jan-2015.jpg)
![arXiv:1812.02759v2 [astro-ph.IM] 10 Dec 2018](https://img.pdfslide.net/doc/110x75/616a331911a7b741a34fe51a/arxiv181202759v2-astro-phim-10-dec-2018.jpg)
![arXiv:1302.4342v1 [astro-ph.HE] 18 Feb 2013](https://img.pdfslide.net/doc/110x75/589d8e231a28ab7c4a8bbb68/arxiv13024342v1-astro-phhe-18-feb-2013.jpg)
![arXiv:1301.5572v3 [astro-ph.IM] 31 May 2016](https://img.pdfslide.net/doc/110x75/58667a731a28abbe408b4d14/arxiv13015572v3-astro-phim-31-may-2016.jpg)