Embed Size (px)
Citation preview
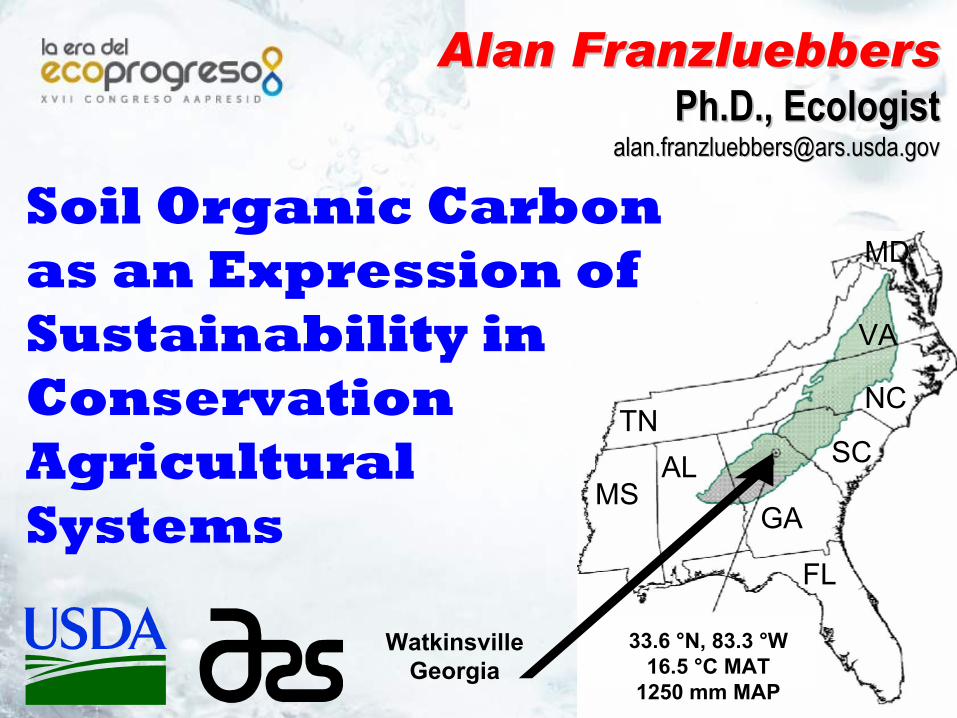
Alan FranzluebbersAlan FranzluebbersPh.D., EcologistPh.D., Ecologist
[email protected]@ars.usda.gov
Watkinsville Georgia
TN
MSAL
GA
FL
VA
NC
SC
MD
33.6 °N, 83.3 °W16.5 °C MAT
1250 mm MAP
Soil Organic Carbon as an Expression of Sustainability in Conservation Agricultural Systems
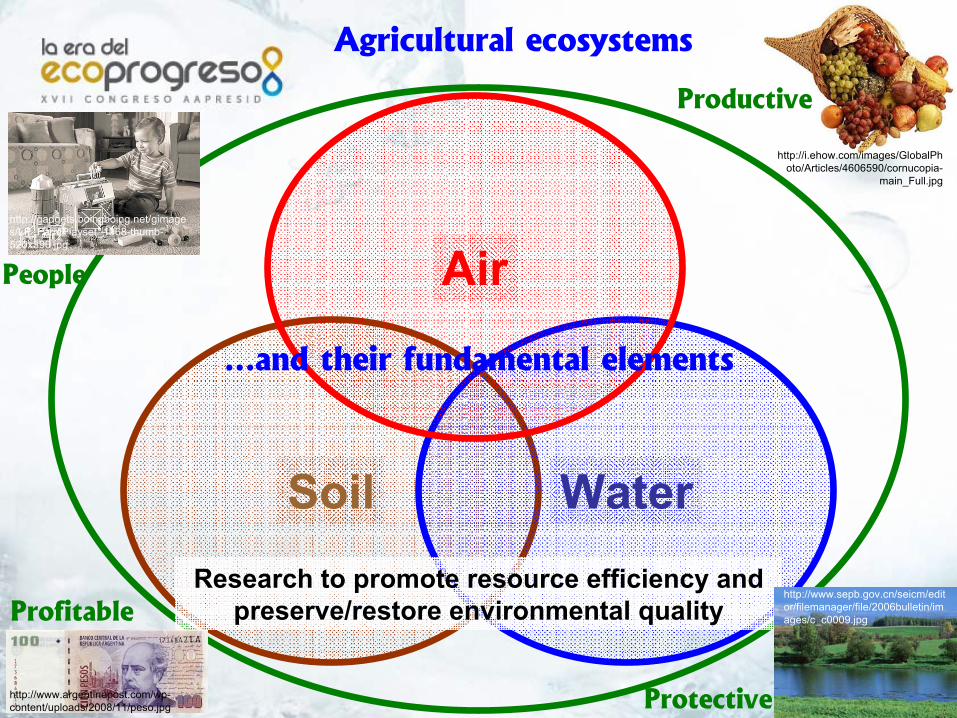
Soil Water
Air
Research to promote resource efficiency and preserve/restore environmental quality
People
http://gadgets.boingboing.net/gimages/LP_FarmPlayset_1968-thumb-520x390.jpg
Profitable
http://www.argentinepost.com/wp-content/uploads/2008/11/peso.jpg
http://i.ehow.com/images/GlobalPhoto/Articles/4606590/cornucopia-
main_Full.jpg
Productive
http://www.sepb.gov.cn/seicm/editor/filemanager/file/2006bulletin/images/c_c0009.jpg
Protective
Agricultural ecosystems
…and their fundamental elements
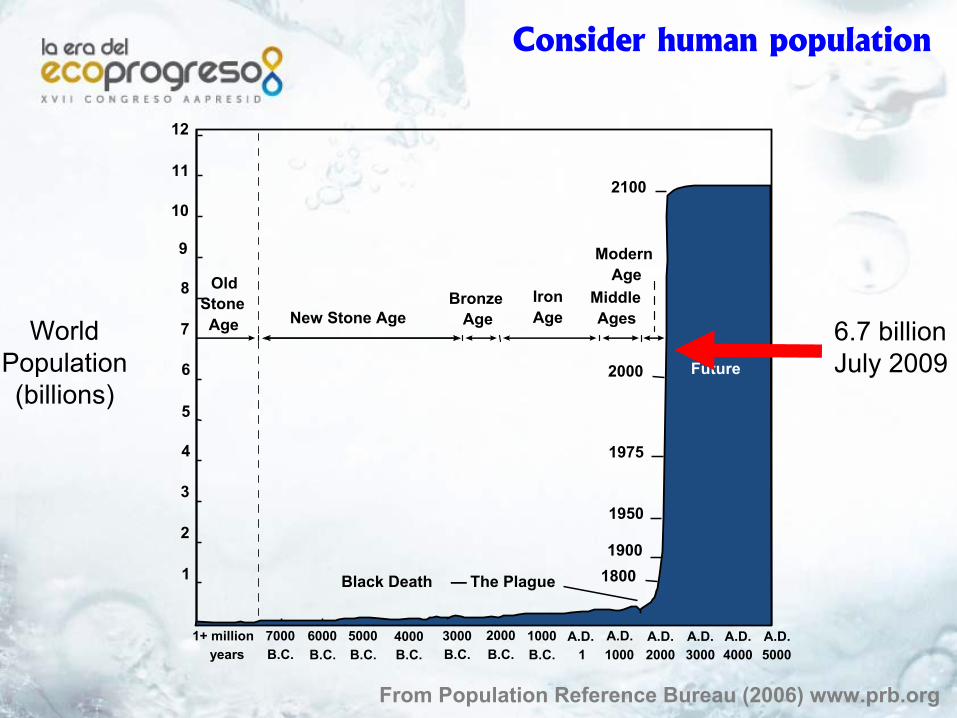
From Population Reference Bureau (2006) www.prb.org
A.D.2000
A.D.1000
A.D.1
1000B.C.
2000B.C.
3000B.C.
4000B.C.
5000B.C.
6000B.C.
7000B.C.
1+ million years
8
7
6
5
2
1
4
3
OldStoneAge New Stone Age
BronzeAge
IronAge
MiddleAges
ModernAge
Black Death — The Plague
9
10
11
12
A.D.3000
A.D.4000
A.D.5000
18001900
1950
1975
2000
2100
Future
WorldPopulation(billions)
6.7 billionJuly 2009
Consider human population
From Tilman et al. (2002) Nature 418:671-677
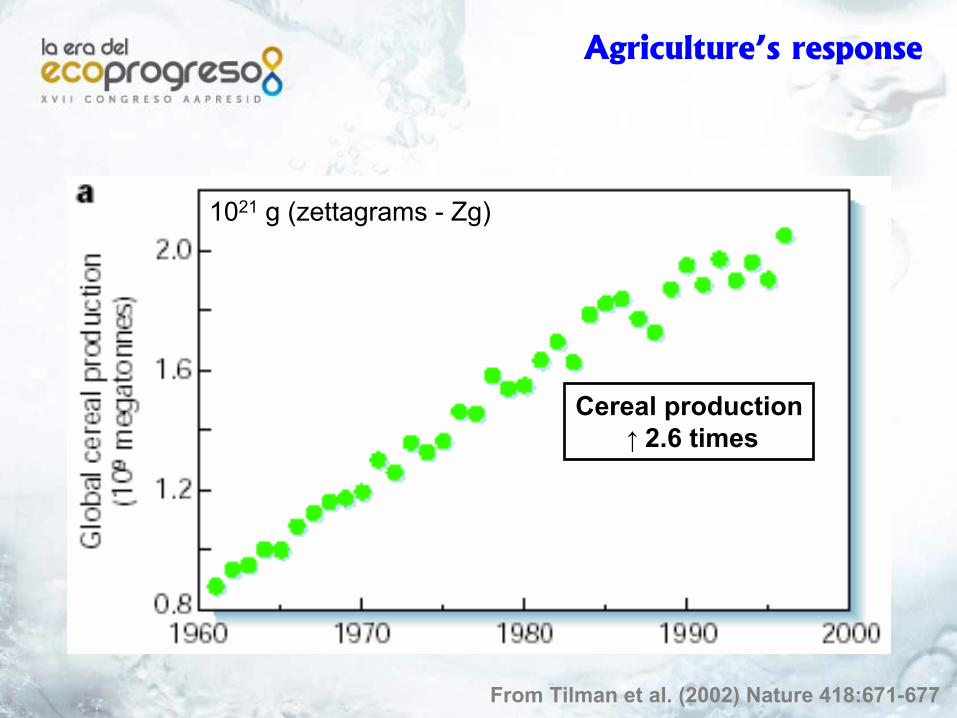
1021 g (zettagrams - Zg)
Agriculture’s response
Cereal production↑ 2.6 times
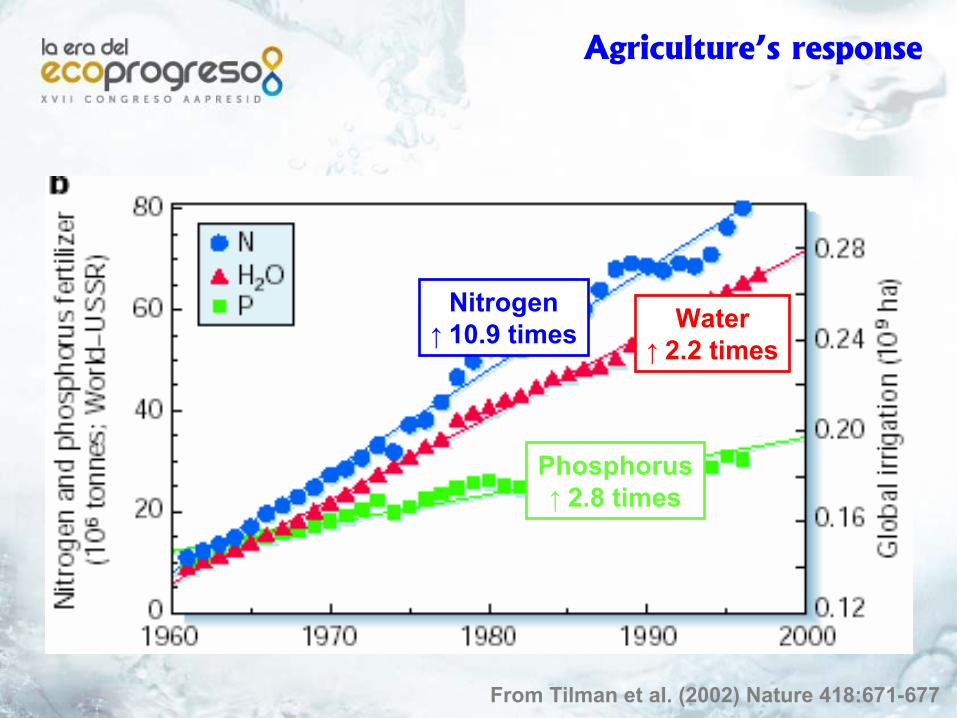
From Tilman et al. (2002) Nature 418:671-677
Agriculture’s response
Phosphorus↑ 2.8 times
Nitrogen↑ 10.9 times Water
↑ 2.2 times
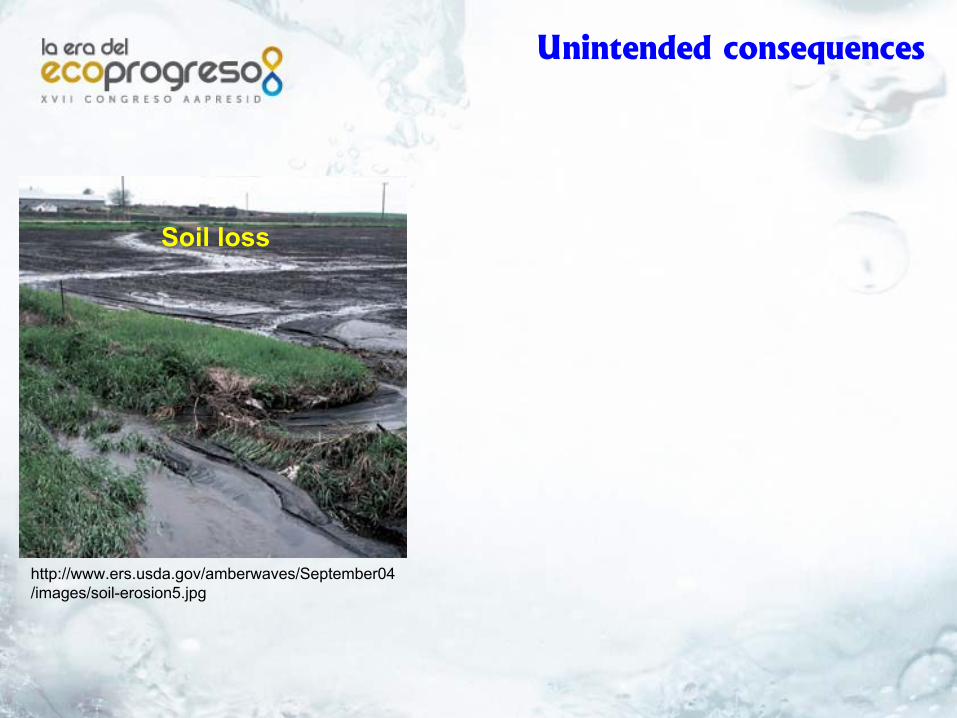
Unintended consequences
http://www.ers.usda.gov/amberwaves/September04/images/soil-erosion5.jpg
Soil loss
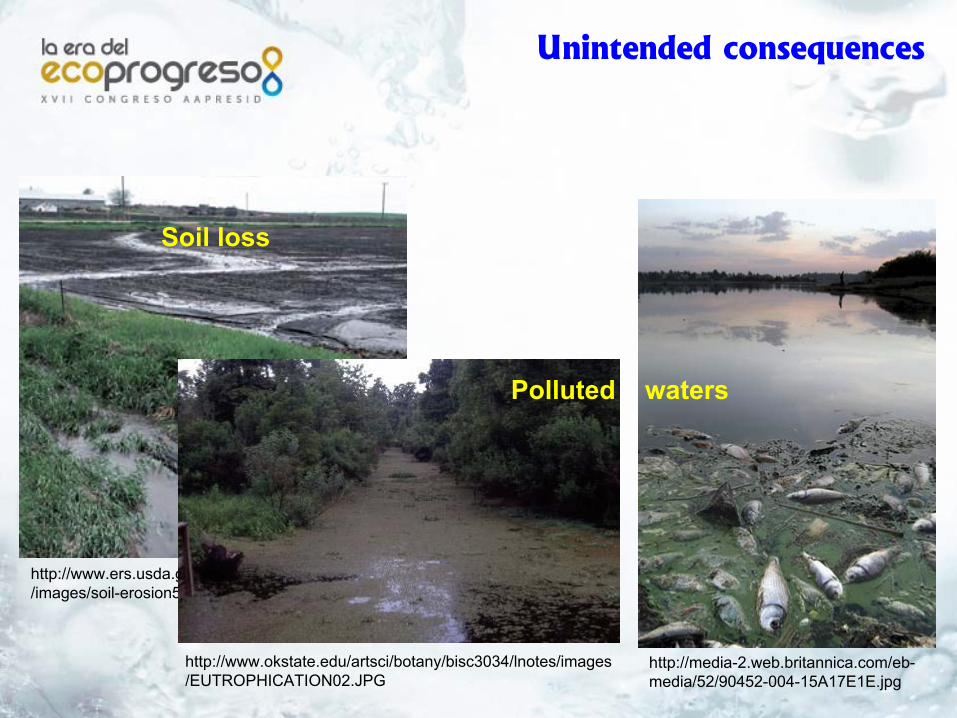
Unintended consequences
http://www.ers.usda.gov/amberwaves/September04/images/soil-erosion5.jpg
Soil loss
http://media-2.web.britannica.com/eb-media/52/90452-004-15A17E1E.jpg
http://www.okstate.edu/artsci/botany/bisc3034/lnotes/images/EUTROPHICATION02.JPG
Polluted waters
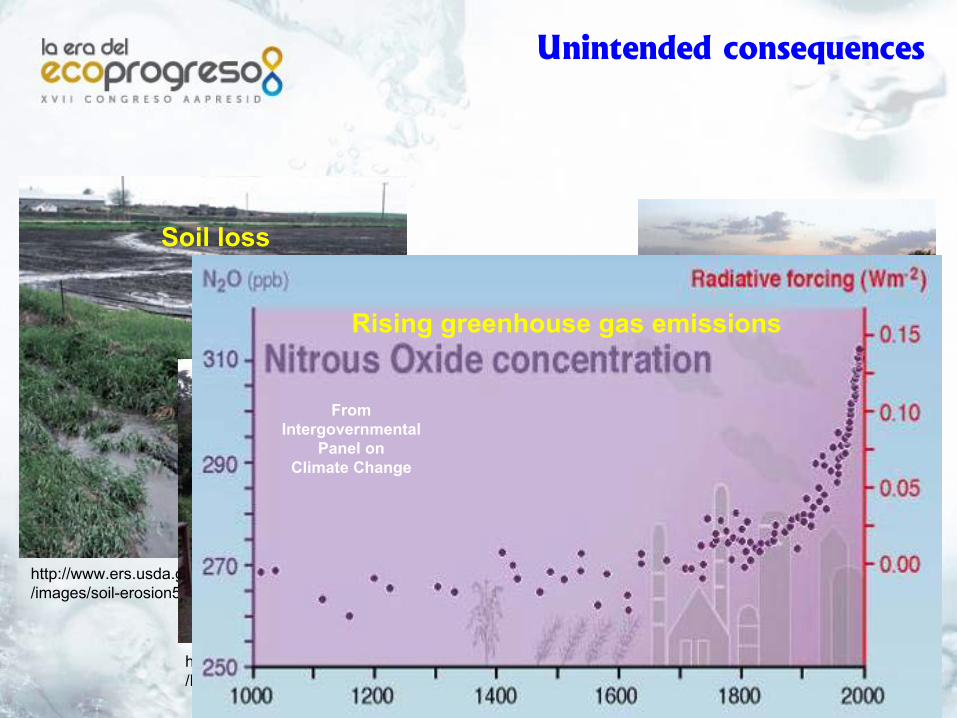
Unintended consequences
http://www.ers.usda.gov/amberwaves/September04/images/soil-erosion5.jpg
Soil loss
http://media-2.web.britannica.com/eb-media/52/90452-004-15A17E1E.jpg
http://www.okstate.edu/artsci/botany/bisc3034/lnotes/images/EUTROPHICATION02.JPG
Polluted waters From
IntergovernmentalPanel on
Climate Change
Rising greenhouse gas emissions
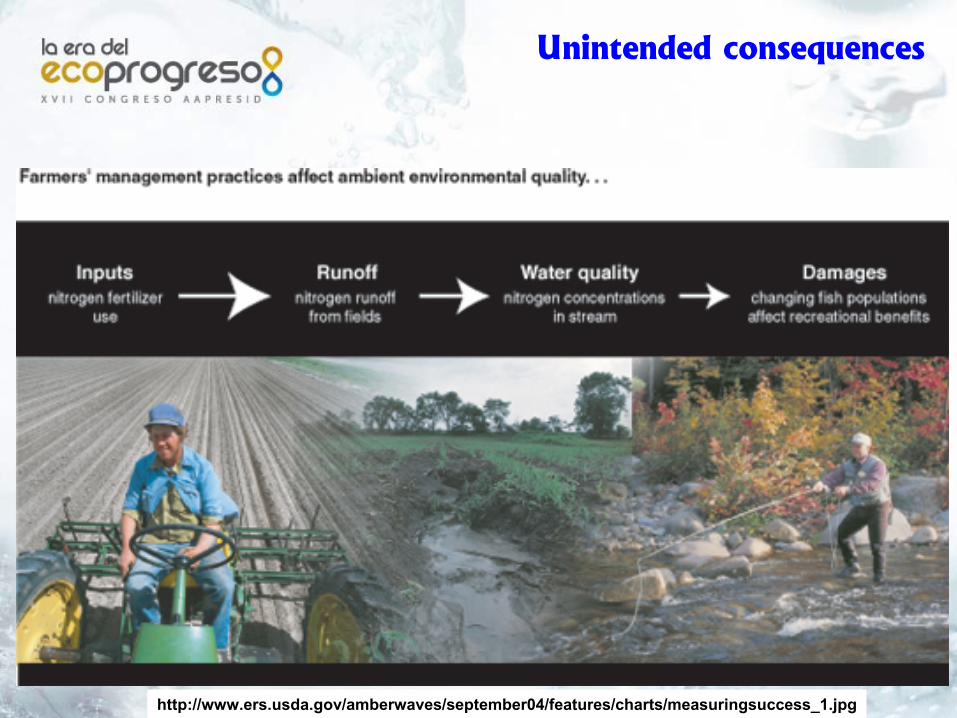
Unintended consequences
http://www.ers.usda.gov/amberwaves/september04/features/charts/measuringsuccess_1.jpg
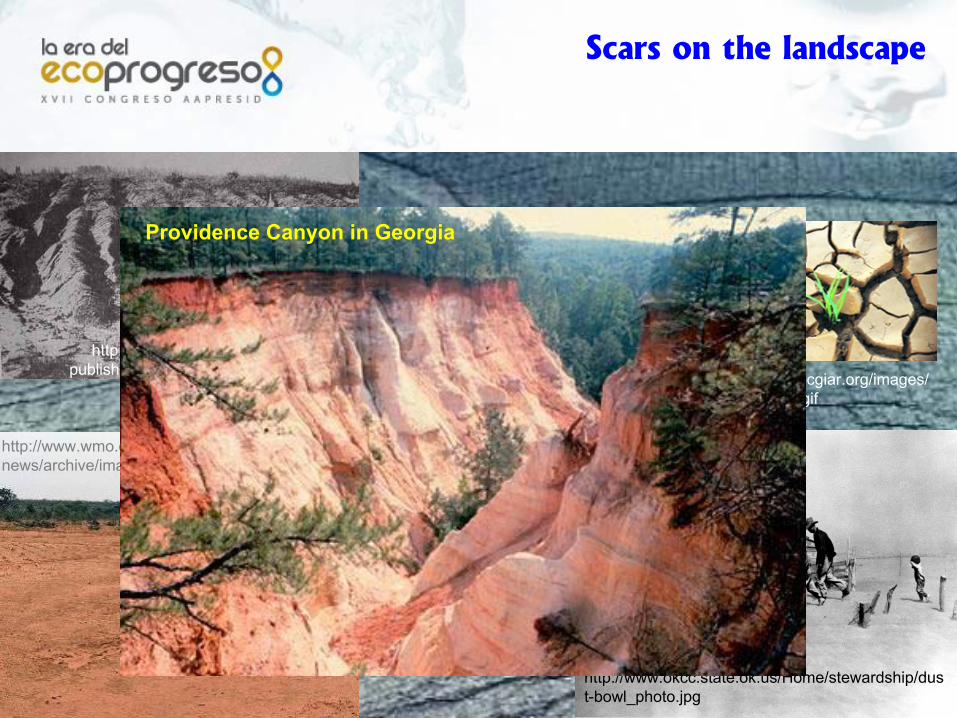
Scars on the landscape
http://www.cgiar.org/images/des_fact1.gif
http://www.wmo.ch/pages/mediacentre/news/archive/images/desert.jpg
http://www.cgca.net/serf-publishing/fig15gullyerosion.jpg
http://www.okcc.state.ok.us/Home/stewardship/dust-bowl_photo.jpg
Providence Canyon in Georgia
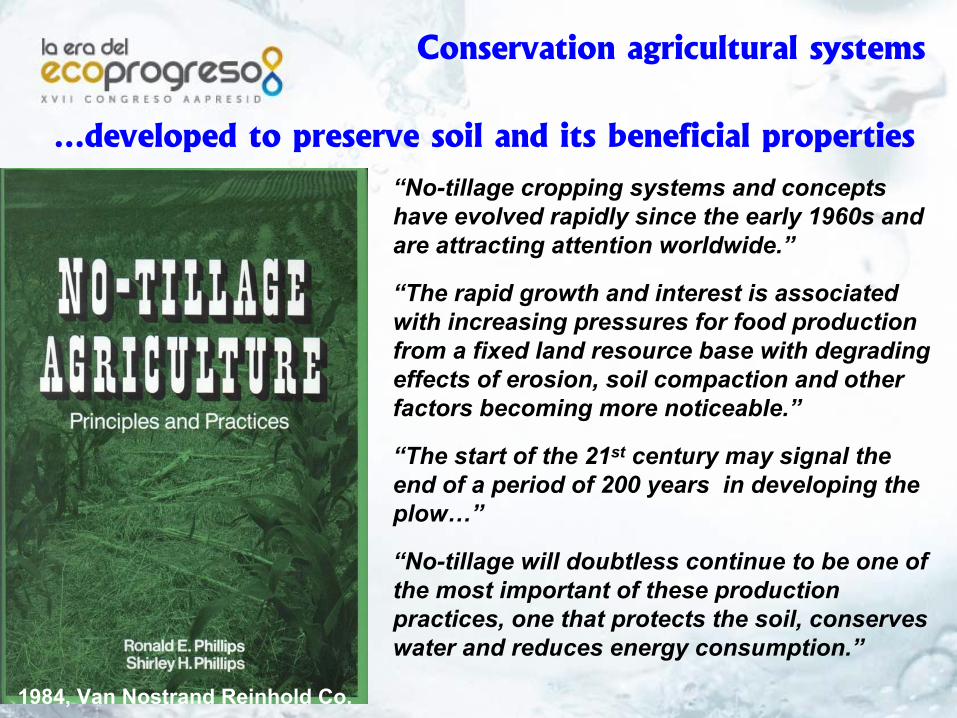
Conservation agricultural systems
…developed to preserve soil and its beneficial properties
1984, Van Nostrand Reinhold Co.
“No-tillage cropping systems and concepts have evolved rapidly since the early 1960s and are attracting attention worldwide.”
“The rapid growth and interest is associated with increasing pressures for food production from a fixed land resource base with degrading effects of erosion, soil compaction and other factors becoming more noticeable.”
“The start of the 21st century may signal the end of a period of 200 years in developing the plow…”
“No-tillage will doubtless continue to be one of the most important of these production practices, one that protects the soil, conserves water and reduces energy consumption.”
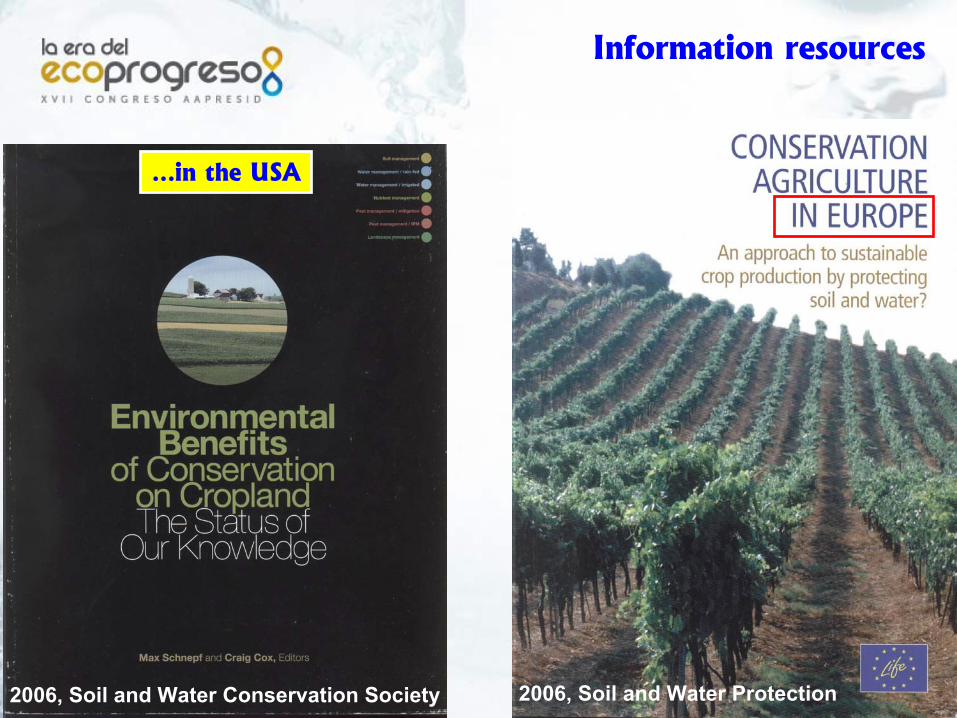
Information resources
2006, Soil and Water Conservation Society
…in the USA
2006, Soil and Water Protection
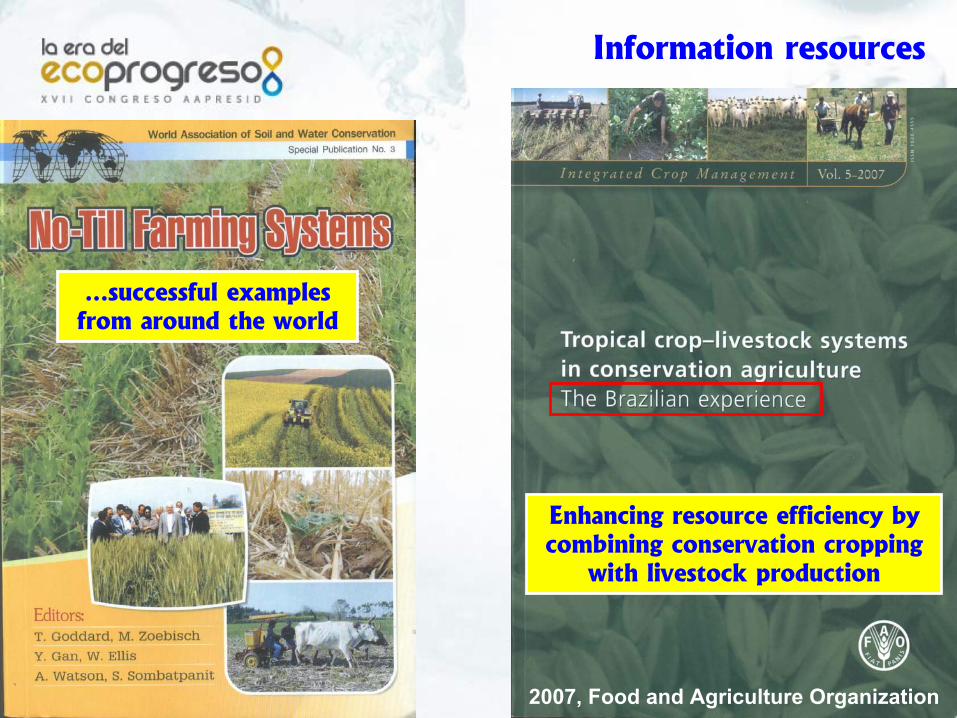
Information resources
…successful examples from around the world
2007, Food and Agriculture Organization
Enhancing resource efficiency by combining conservation cropping
with livestock production
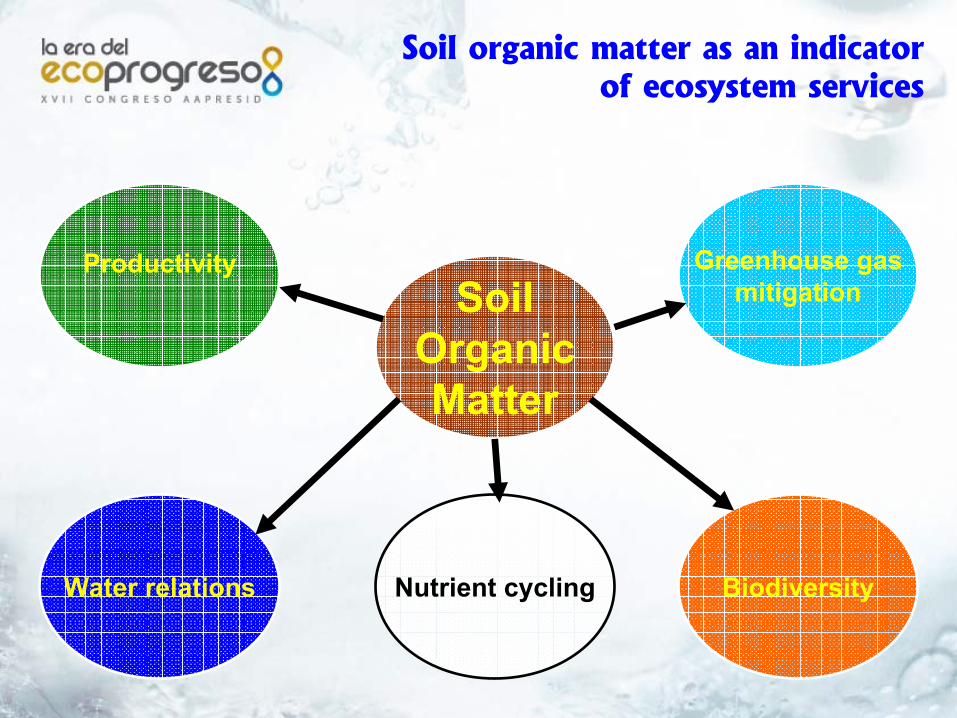
ProductivitySoil
OrganicMatter
Water relations BiodiversityNutrient cycling
Greenhouse gasmitigation
Soil organic matter as an indicatorof ecosystem services
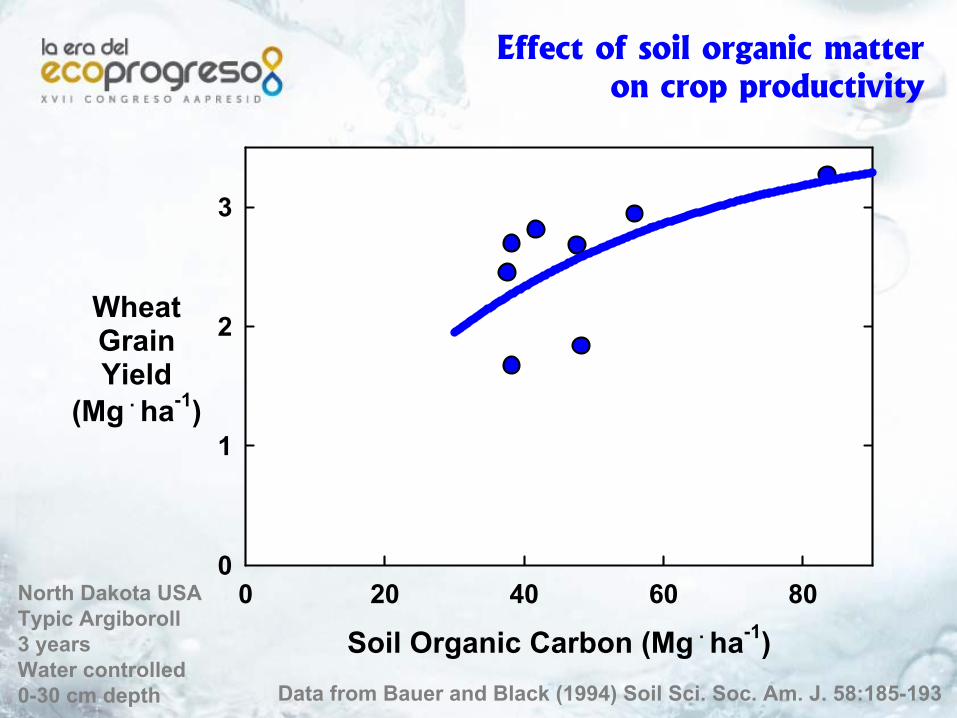
Effect of soil organic matteron crop productivity
Soil Organic Carbon (Mg . ha-1)0 20 40 60 80
WheatGrainYield
(Mg . ha-1)
0
1
2
3
Data from Bauer and Black (1994) Soil Sci. Soc. Am. J. 58:185-193
North Dakota USATypic Argiboroll3 yearsWater controlled0-30 cm depth
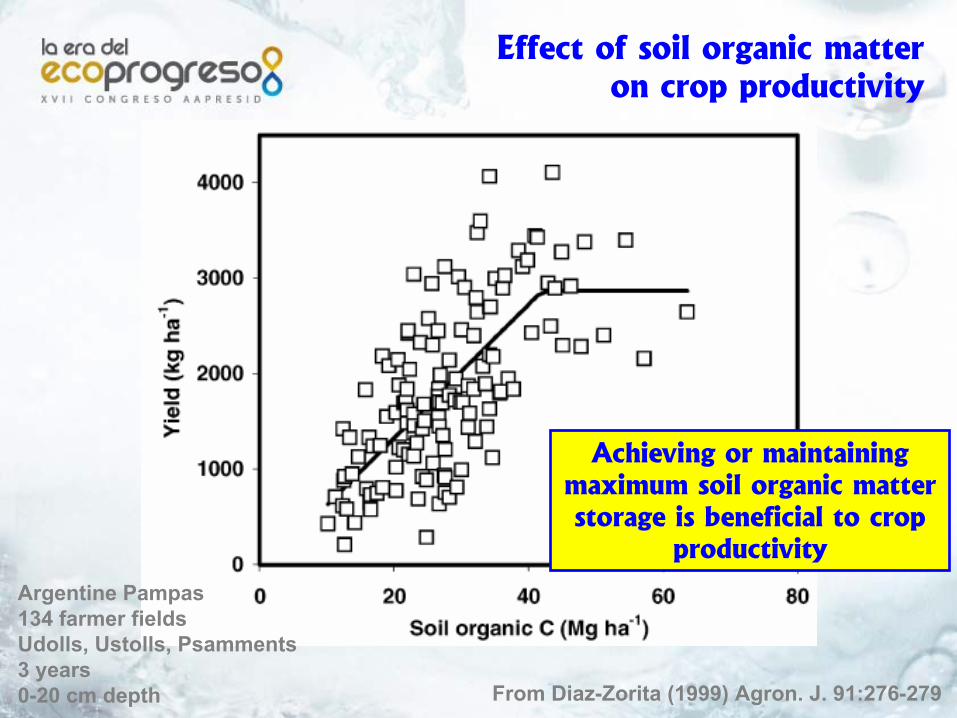
Effect of soil organic matteron crop productivity
From Diaz-Zorita (1999) Agron. J. 91:276-279
Argentine Pampas134 farmer fieldsUdolls, Ustolls, Psamments3 years0-20 cm depth
Achieving or maintaining maximum soil organic matter storage is beneficial to crop
productivity
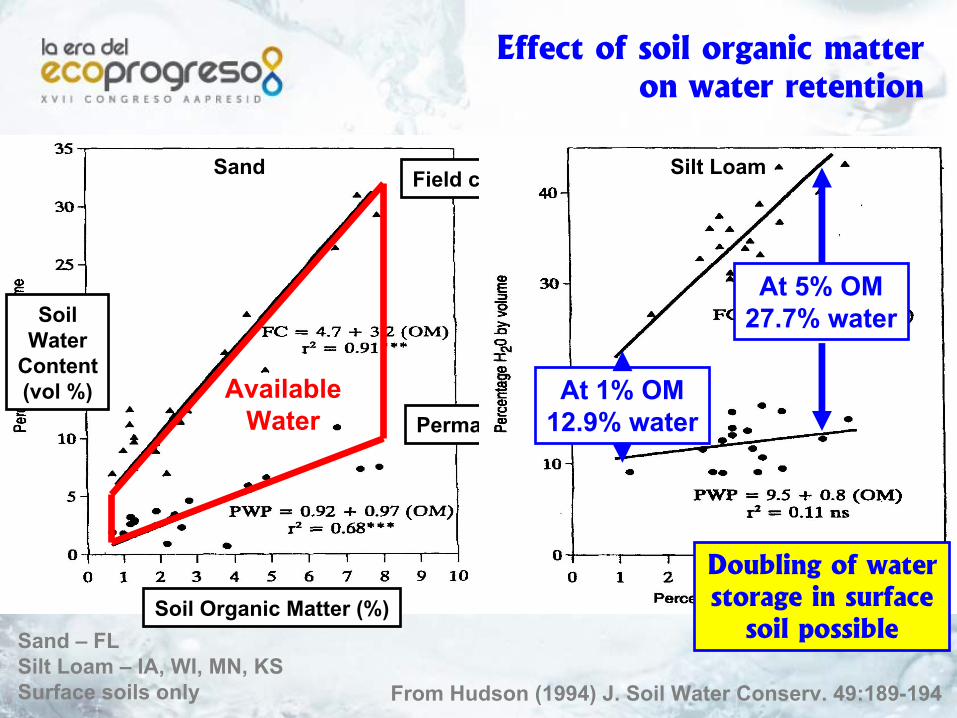
Effect of soil organic matteron water retention
From Hudson (1994) J. Soil Water Conserv. 49:189-194
Sand
Permanent wilting point
Field capacity Silt Loam
Sand – FLSilt Loam – IA, WI, MN, KSSurface soils only
AvailableWater
At 1% OM12.9% water
At 5% OM27.7% water
Soil Organic Matter (%)
SoilWater
Content(vol %)
Doubling of water storage in surface
soil possible
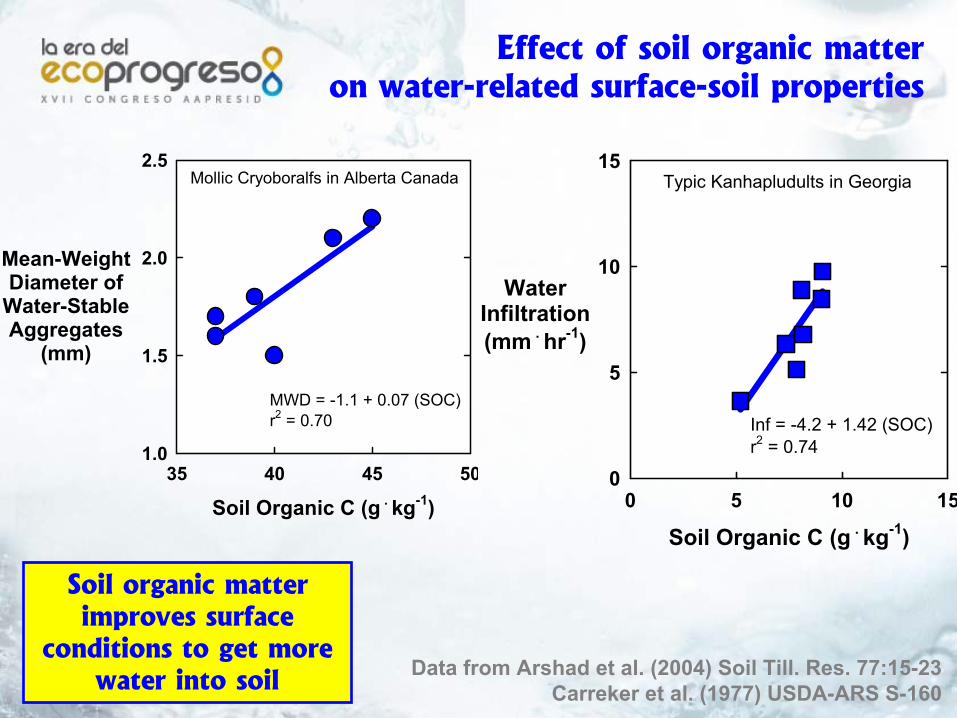
Effect of soil organic matteron water-related surface-soil properties
Soil Organic C (g . kg-1)35 40 45 50
Mean-WeightDiameter of
Water-StableAggregates
(mm)
1.0
1.5
2.0
2.5
MWD = -1.1 + 0.07 (SOC)r2 = 0.70
Mollic Cryoboralfs in Alberta Canada
Soil Organic C (g . kg-1)0 5 10 15
WaterInfiltration(mm . hr-1)
0
5
10
15Typic Kanhapludults in Georgia
Inf = -4.2 + 1.42 (SOC)r2 = 0.74
Data from Arshad et al. (2004) Soil Till. Res. 77:15-23Carreker et al. (1977) USDA-ARS S-160
Soil organic matter improves surface
conditions to get more water into soil
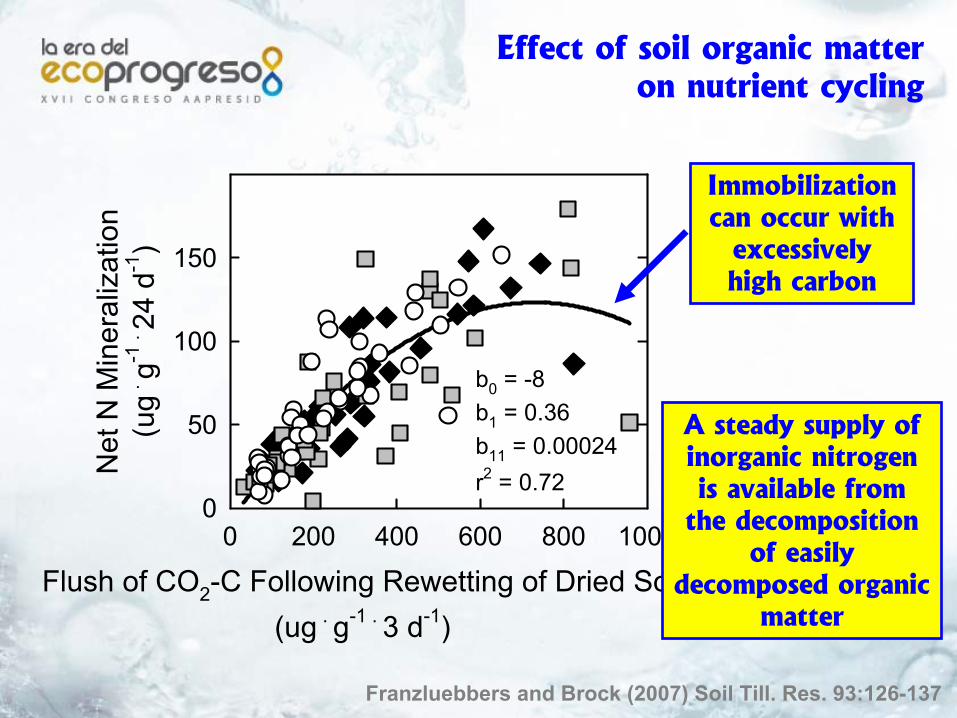
Effect of soil organic matteron nutrient cycling
Flush of CO2-C Following Rewetting of Dried Soil(ug . g-1 . 3 d-1)
0 200 400 600 800 1000
Net
N M
iner
aliz
atio
n(u
g . g-1
. 24
d-1
)
0
50
100
150
b0 = -8b1 = 0.36b11 = 0.00024r2 = 0.72
Franzluebbers and Brock (2007) Soil Till. Res. 93:126-137
A steady supply of inorganic nitrogen is available from
the decomposition of easily
decomposed organic matter
Immobilization can occur with
excessively high carbon
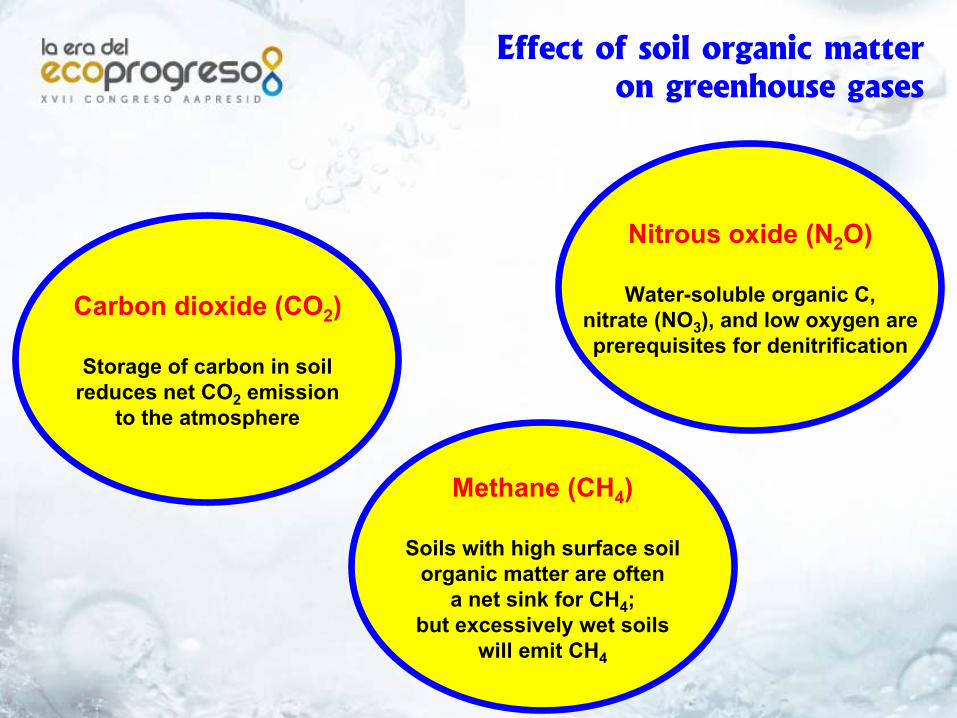
Effect of soil organic matteron greenhouse gases
Carbon dioxide (CO2)
Storage of carbon in soilreduces net CO2 emission
to the atmosphere
Methane (CH4)
Soils with high surface soilorganic matter are often
a net sink for CH4;but excessively wet soils
will emit CH4
Nitrous oxide (N2O)
Water-soluble organic C,nitrate (NO3), and low oxygen areprerequisites for denitrification
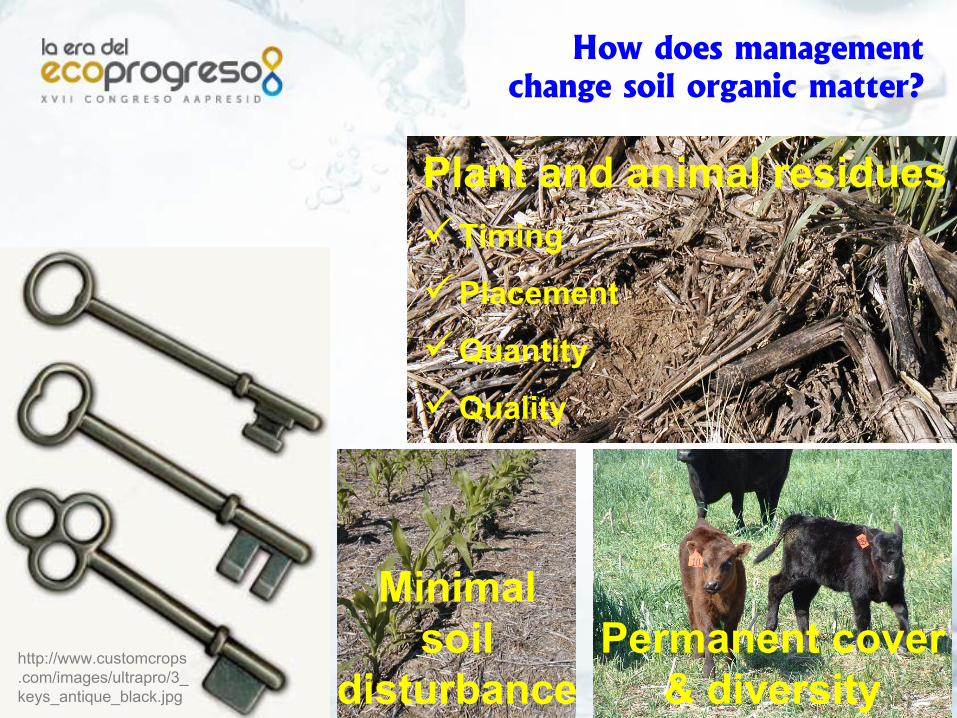
How does managementchange soil organic matter?
http://www.customcrops.com/images/ultrapro/3_keys_antique_black.jpg
Plant and animal residuesTiming
Placement
Quantity
Quality
Minimalsoil
disturbancePermanent cover
& diversity
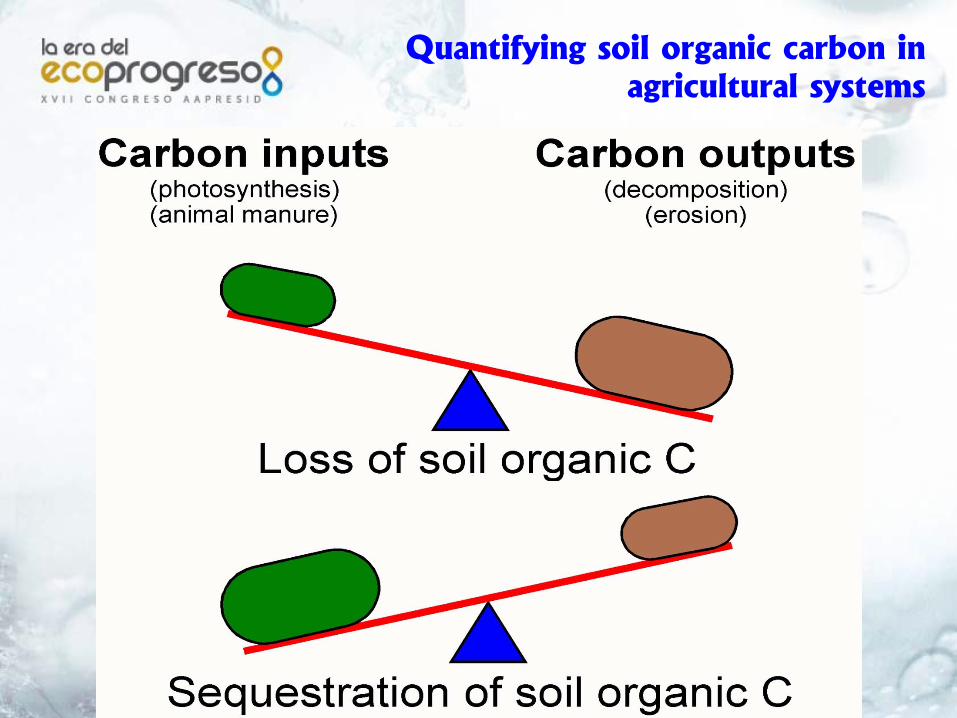
Quantifying soil organic carbon inagricultural systems
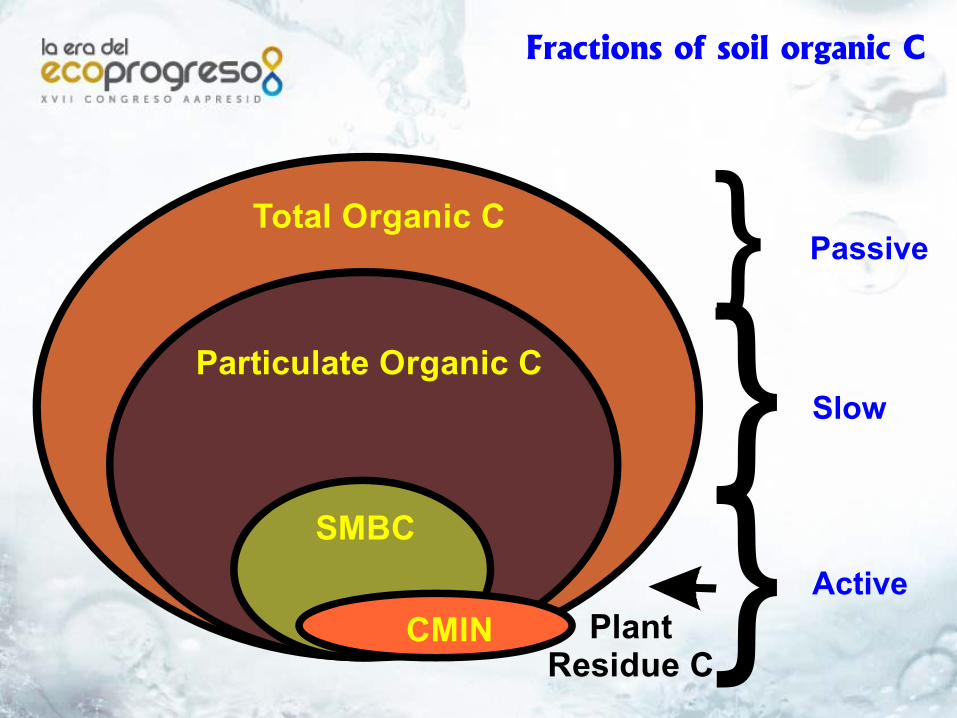
Fractions of soil organic C
Total Organic C
Particulate Organic C
SMBC
CMIN PlantResidue C
Active
Slow
Passive
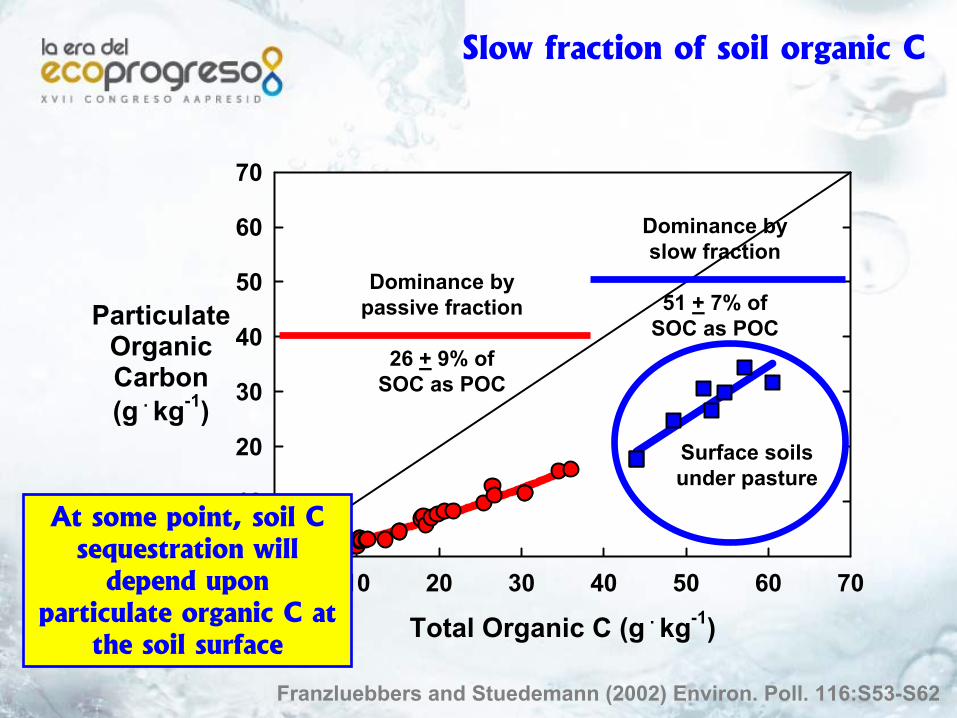
Slow fraction of soil organic C
Total Organic C (g . kg-1)0 10 20 30 40 50 60 70
ParticulateOrganicCarbon(g . kg-1)
0
10
20
30
40
50
60
70
Franzluebbers and Stuedemann (2002) Environ. Poll. 116:S53-S62
Dominance by passive fraction
26 + 9% ofSOC as POC
Dominance by slow fraction
51 + 7% ofSOC as POC
At some point, soil C sequestration will
depend upon particulate organic C at
the soil surface
Surface soils under pasture
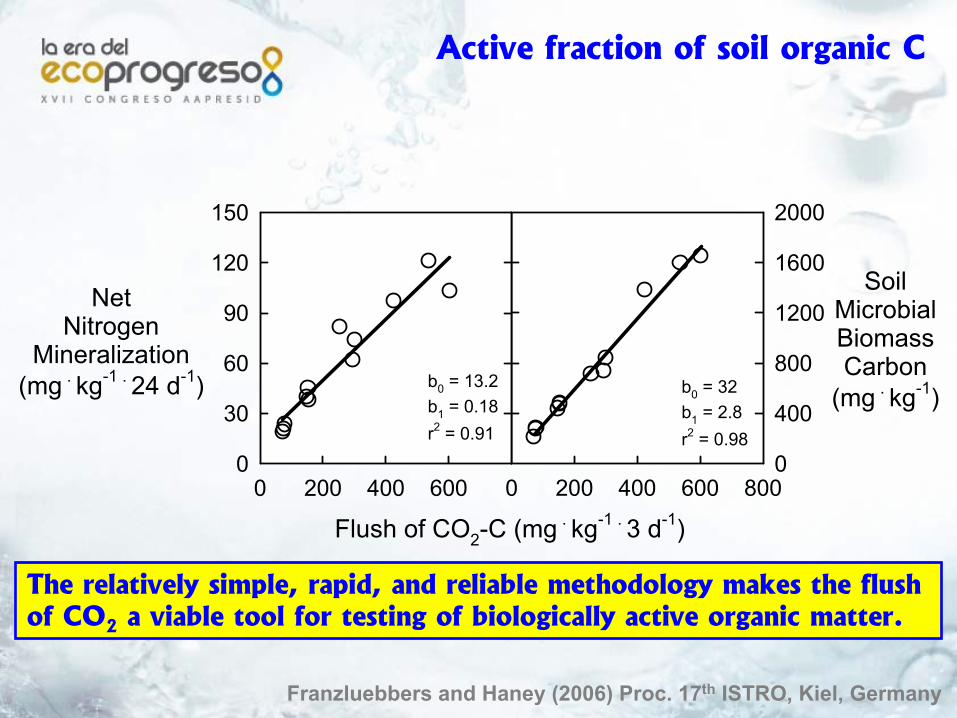
Active fraction of soil organic C
0 200 400 600 800
SoilMicrobialBiomassCarbon
(mg . kg-1)
0
400
800
1200
1600
2000
Flush of CO2-C (mg . kg-1 . 3 d-1)0 200 400 600
NetNitrogen
Mineralization(mg . kg-1 . 24 d-1)
0
30
60
90
120
150
b0 = 32b1 = 2.8r2 = 0.98
b0 = 13.2b1 = 0.18r2 = 0.91
Franzluebbers and Haney (2006) Proc. 17th ISTRO, Kiel, Germany
The relatively simple, rapid, and reliable methodology makes the flush of CO2 a viable tool for testing of biologically active organic matter.
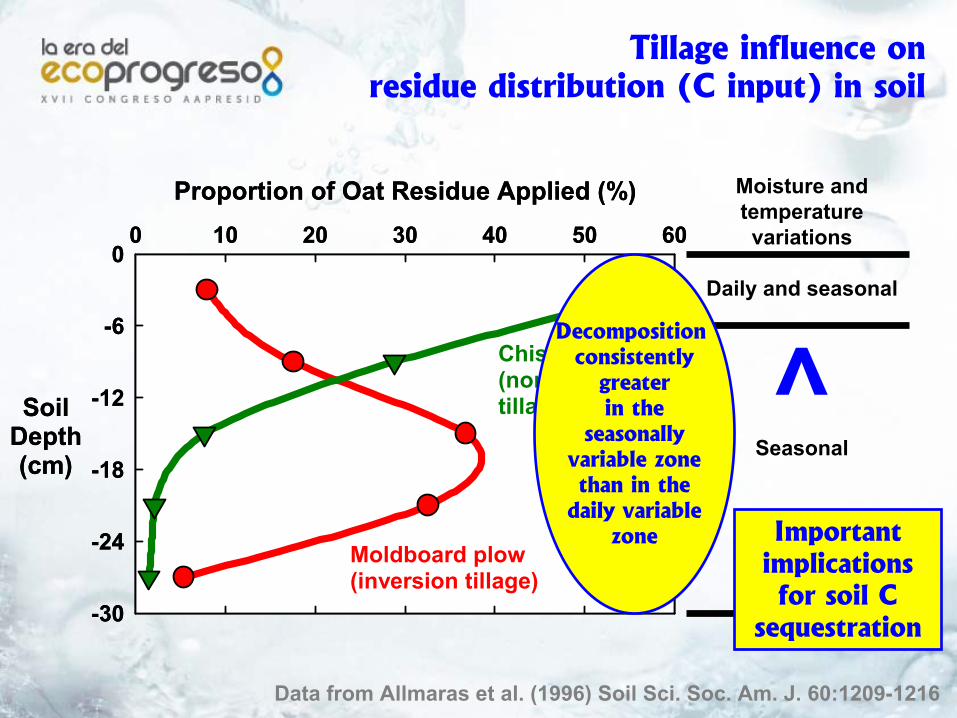
Tillage influence onresidue distribution (C input) in soil
Data from Allmaras et al. (1996) Soil Sci. Soc. Am. J. 60:1209-1216
Proportion of Oat Residue Applied (%)0 10 20 30 40 50 60
SoilDepth(cm)
-30
-24
-18
-12
-6
0
Moldboard plow(inversion tillage)
Proportion of Oat Residue Applied (%)0 10 20 30 40 50 60
SoilDepth(cm)
-30
-24
-18
-12
-6
0
Moldboard plow(inversion tillage)
Chisel plow(non-inversiontillage)
Seasonal
Moisture and temperature variations
Daily and seasonal
Decomposition consistently
greaterin the
seasonallyvariable zonethan in the
daily variablezone Important
implications for soil C
sequestration
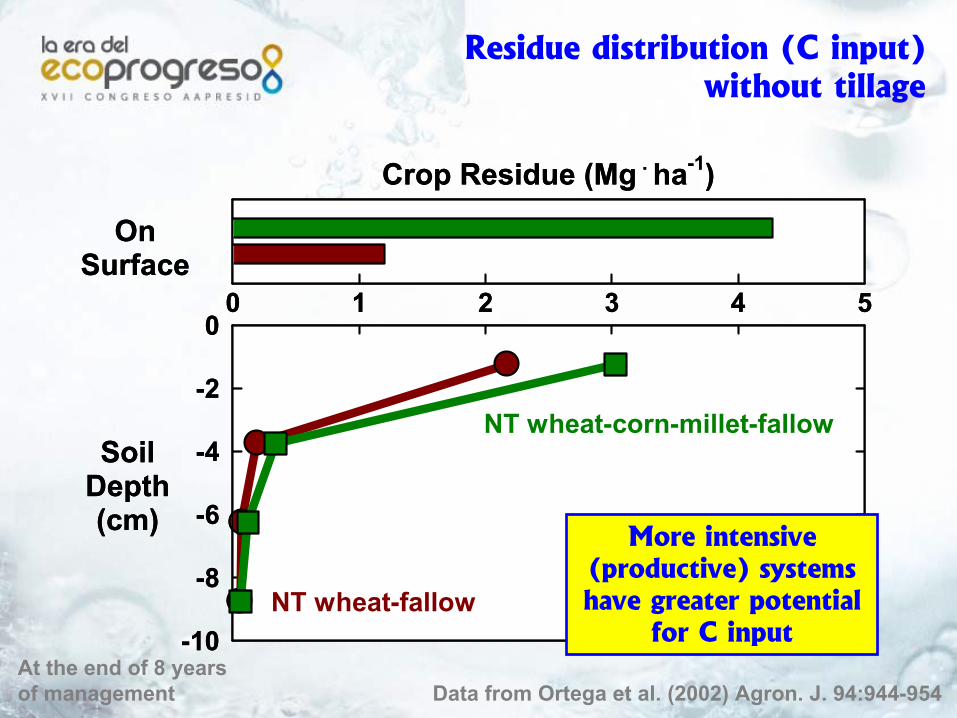
Data from Ortega et al. (2002) Agron. J. 94:944-954
Crop Residue (Mg . ha-1)
0 1 2 3 4 5
SoilDepth(cm)
-10
-8
-6
-4
-2
0
NT wheat-fallow
OnSurface
Crop Residue (Mg . ha-1)
0 1 2 3 4 5
SoilDepth(cm)
-10
-8
-6
-4
-2
0
NT wheat-fallow
OnSurface
NT wheat-corn-millet-fallow
Residue distribution (C input)without tillage
At the end of 8 years of management
More intensive (productive) systems have greater potential
for C input
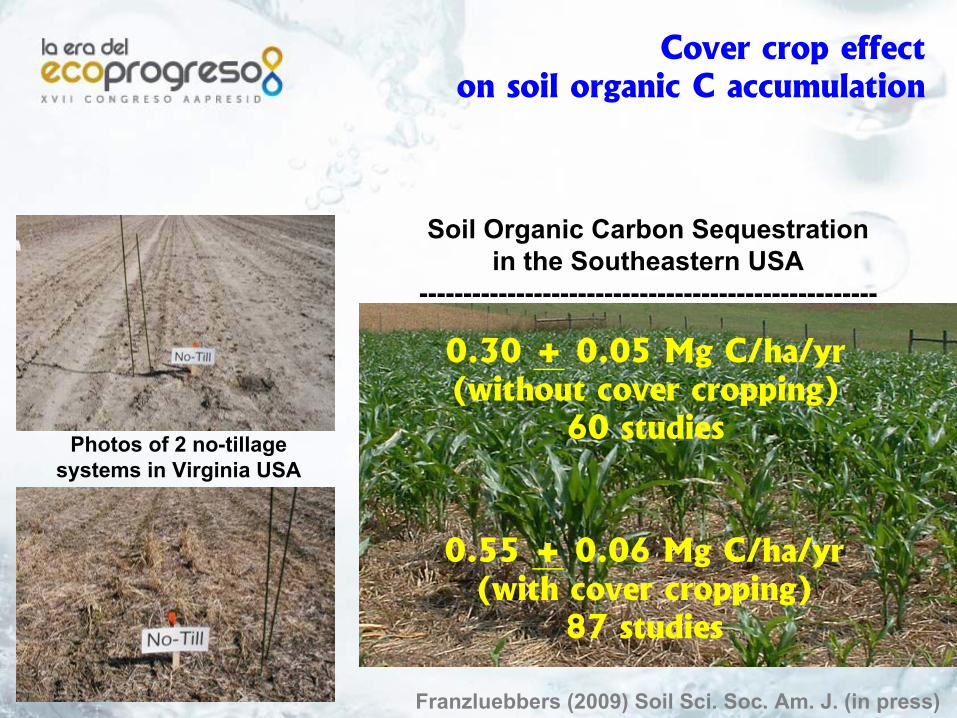
Soil Organic Carbon Sequestrationin the Southeastern USA
----------------------------------------------------
0.30 + 0.05 Mg C/ha/yr(without cover cropping)
60 studies
0.55 + 0.06 Mg C/ha/yr(with cover cropping)
87 studies
Franzluebbers (2009) Soil Sci. Soc. Am. J. (in press)
Photos of 2 no-tillage systems in Virginia USA
Cover crop effecton soil organic C accumulation
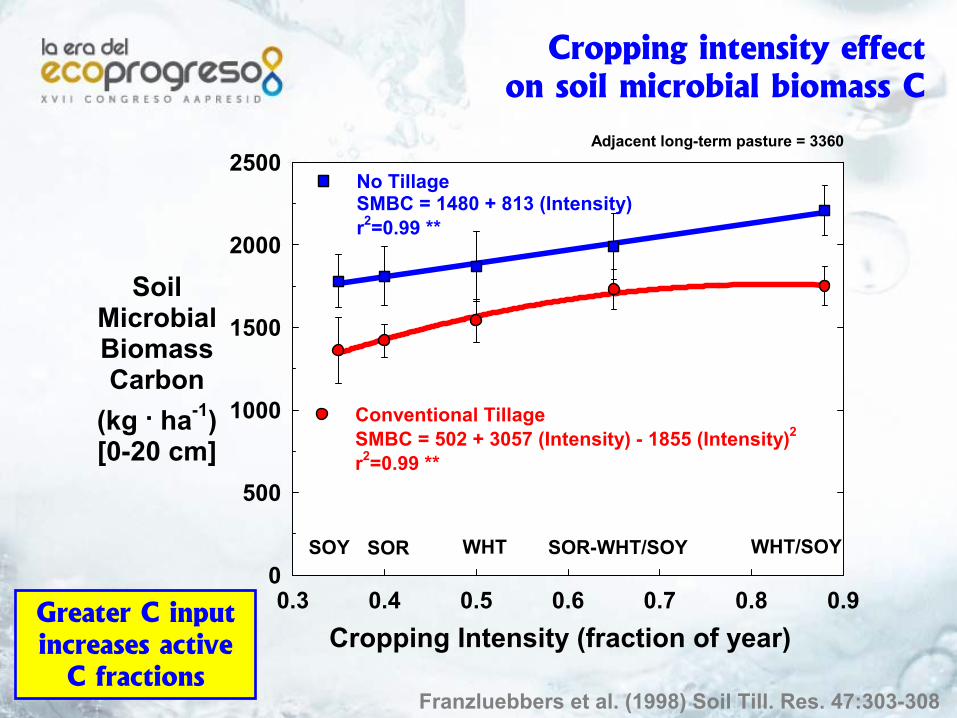
Franzluebbers et al. (1998) Soil Till. Res. 47:303-308
Cropping intensity effecton soil microbial biomass C
0.3 0.4 0.5 0.6 0.7 0.8 0.9
SoilMicrobialBiomassCarbon
(kg . ha-1)[0-20 cm]
0
500
1000
1500
2000
2500
Conventional TillageSMBC = 502 + 3057 (Intensity) - 1855 (Intensity)2
r2=0.99 **
No TillageSMBC = 1480 + 813 (Intensity)r2=0.99 **
Cropping Intensity (fraction of year)
SOY SOR WHT SOR-WHT/SOY WHT/SOY
Adjacent long-term pasture = 3360
Greater C input increases active
C fractions
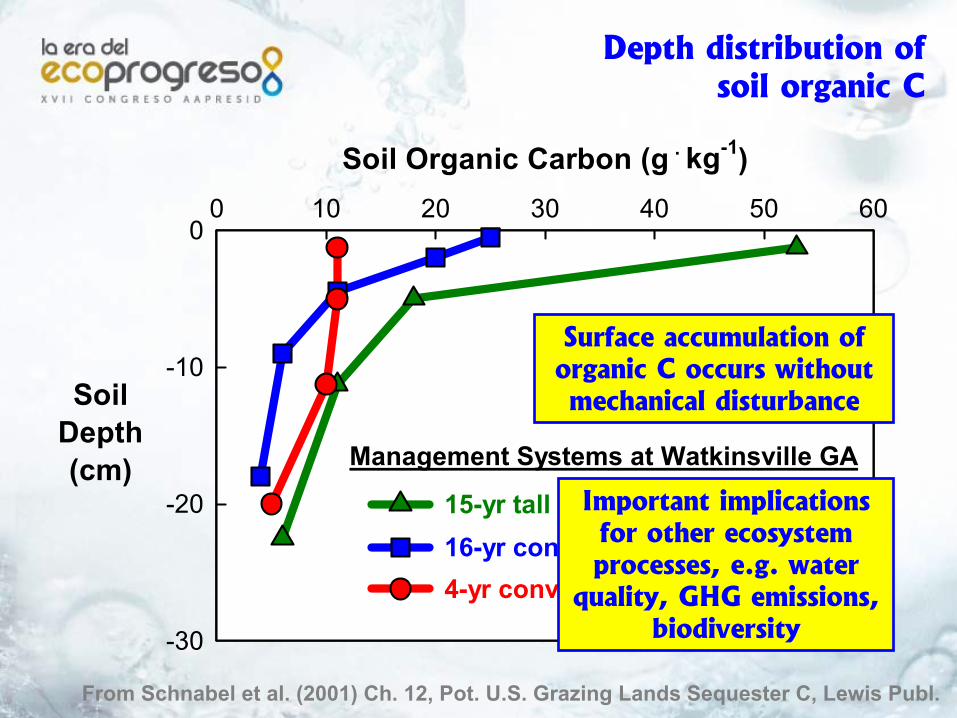
Depth distribution ofsoil organic C
Soil Organic Carbon (g . kg-1)0 10 20 30 40 50 60
SoilDepth(cm)
-30
-20
-10
0
4-yr conventional tillage
Management Systems at Watkinsville GA
16-yr conservation tillage4-yr conventional tillage
Management Systems at Watkinsville GA
15-yr tall fescue pasture16-yr conservation tillage4-yr conventional tillage
Management Systems at Watkinsville GA
From Schnabel et al. (2001) Ch. 12, Pot. U.S. Grazing Lands Sequester C, Lewis Publ.
Surface accumulation of organic C occurs without mechanical disturbance
Important implications for other ecosystem processes, e.g. water
quality, GHG emissions, biodiversity
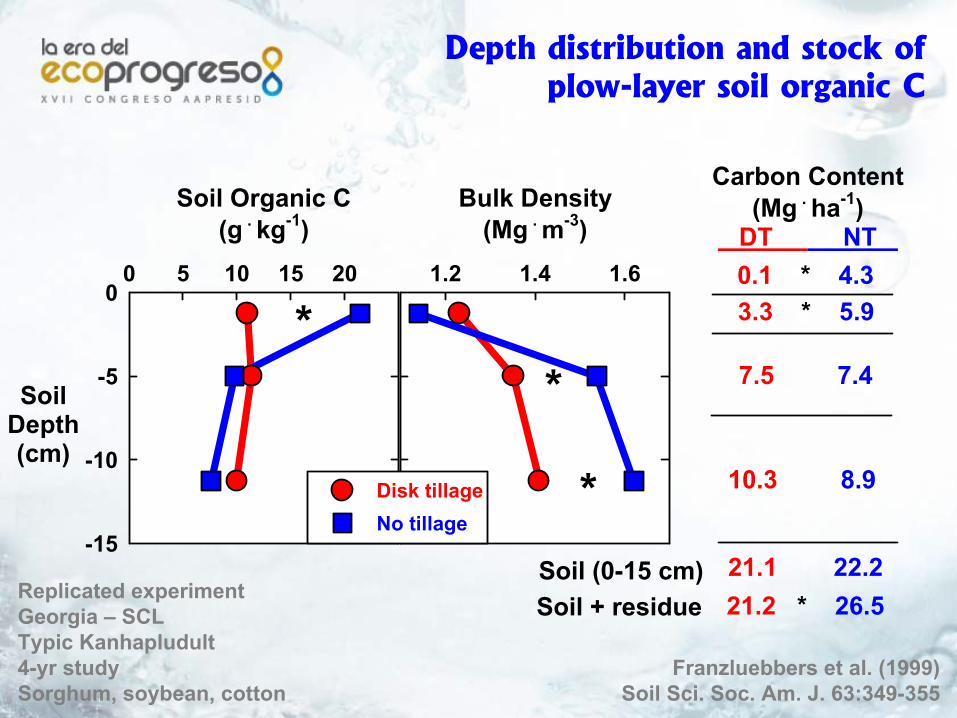
Bulk Density(Mg . m-3)
1.2 1.4 1.6
*
*
Franzluebbers et al. (1999)Soil Sci. Soc. Am. J. 63:349-355
Soil Organic C(g . kg-1)
0 5 10 15 20
SoilDepth(cm)
-15
-10
-5
0*
Disk tillageNo tillage
3.3 * 5.9
7.5 7.4
10.3 8.9
Soil (0-15 cm)Soil + residue
21.1 22.221.2 * 26.5
Carbon Content(Mg . ha-1)
DT NT 0.1 * 4.3
Replicated experimentGeorgia – SCLTypic Kanhapludult4-yr studySorghum, soybean, cotton
Depth distribution and stock ofplow-layer soil organic C
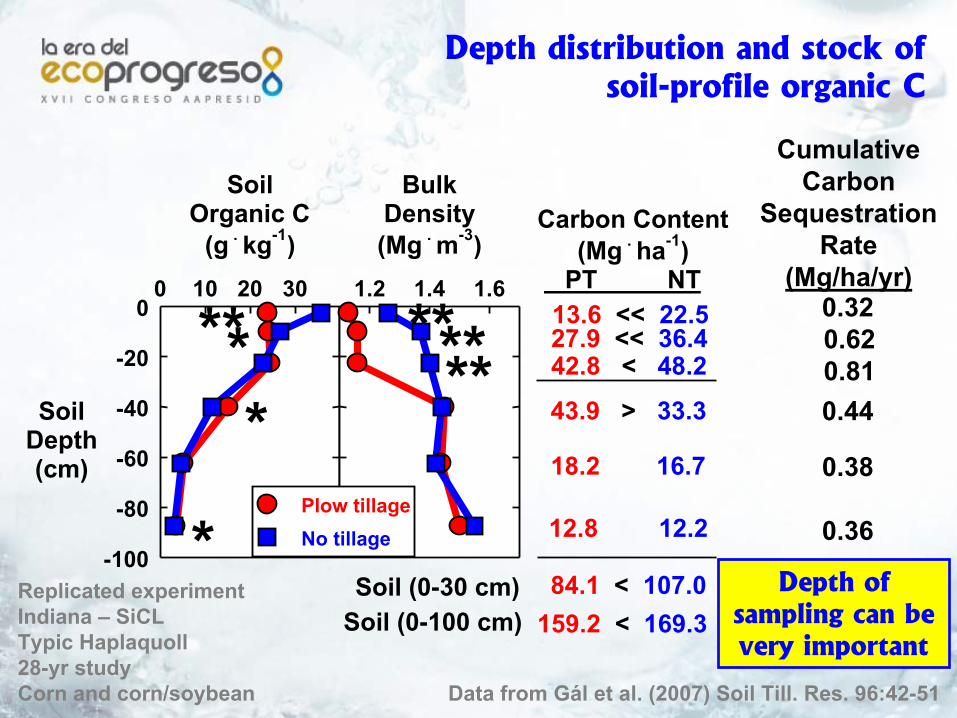
Data from Gál et al. (2007) Soil Till. Res. 96:42-51
Replicated experimentIndiana – SiCLTypic Haplaquoll28-yr studyCorn and corn/soybean
0.620.810.44
0.38
0.36
0.32
CumulativeCarbon
SequestrationRate
(Mg/ha/yr)
Carbon Content(Mg . ha-1)
PT NT 13.6 << 22.527.9 << 36.442.8 < 48.2
43.9 > 33.3
12.8 12.2
18.2 16.7
159.2 < 169.3Soil (0-100 cm)
SoilOrganic C
(g . kg-1)0 10 20 30
SoilDepth(cm)
-100
-80
-60
-40
-20
0
BulkDensity(Mg . m-3)
1.2 1.4 1.6
***
Plow tillageNo tillage
*
*
******
Soil (0-30 cm) 84.1 < 107.0 Depth of sampling can be very important
Depth distribution and stock ofsoil-profile organic C
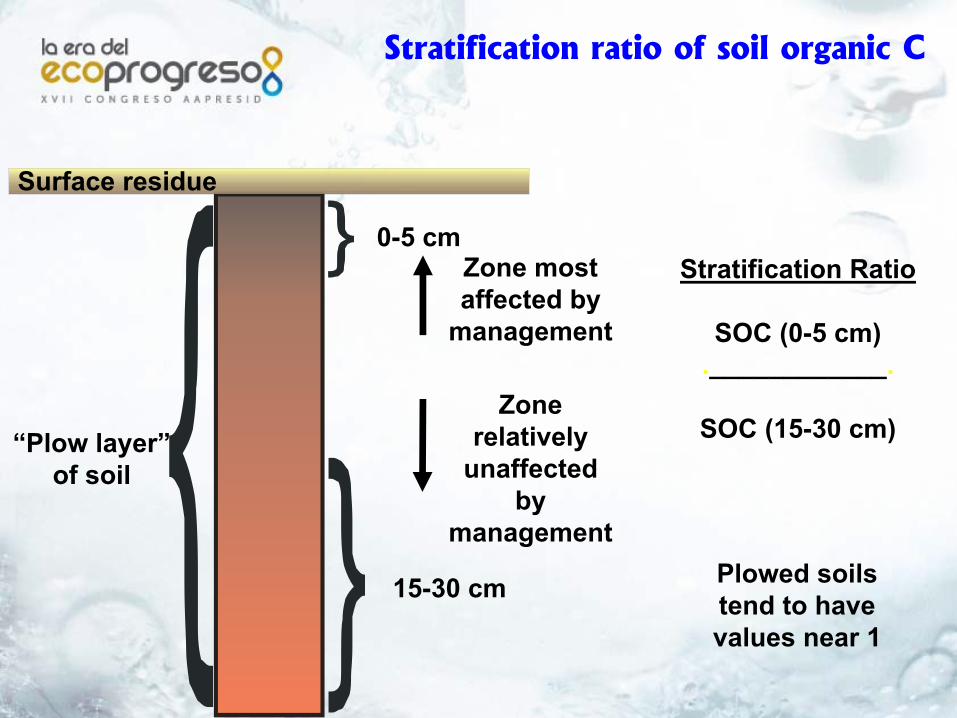
Stratification ratio of soil organic C
Surface residue
“Plow layer”of soil
Zone most affected by
management
Zone relatively
unaffected by
management
Stratification Ratio
SOC (0-5 cm).____________.
SOC (15-30 cm)
0-5 cm
15-30 cm Plowed soils tend to have values near 1
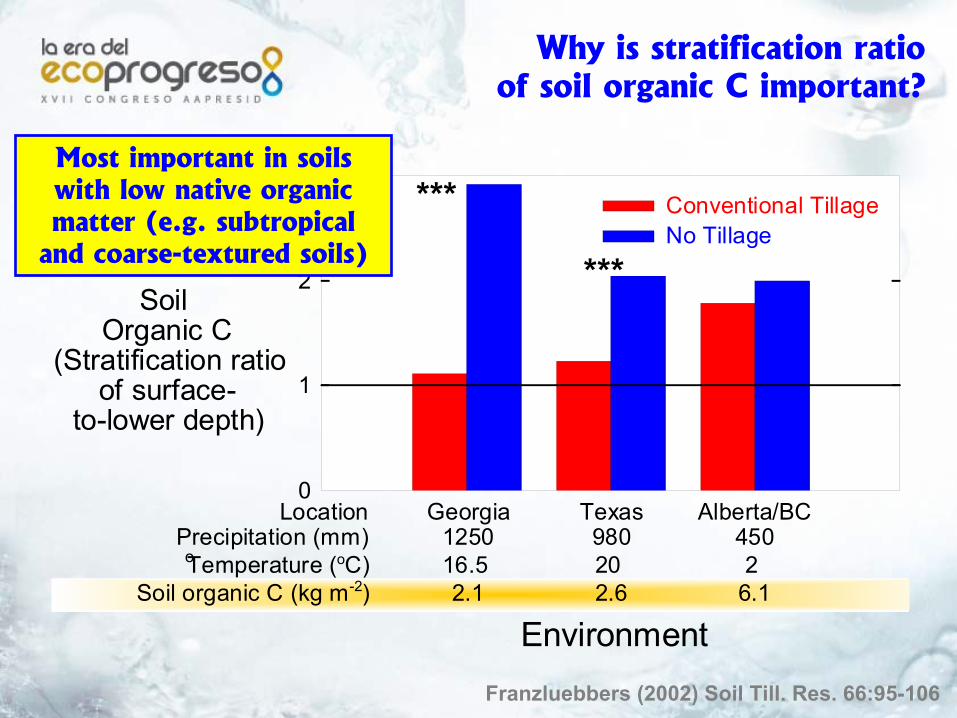
Why is stratification ratioof soil organic C important?
Environment
SoilOrganic C
(Stratification ratioof surface-
to-lower depth)
0
1
2
3***
***
Texas98020 2.6
Georgia125016.5 2.1
Alberta/BC4502
6.1
Conventional TillageNo Tillage
LocationPrecipitation (mm)Temperature (oC)o
Soil organic C (kg m-2)
Franzluebbers (2002) Soil Till. Res. 66:95-106
Most important in soils with low native organic matter (e.g. subtropical
and coarse-textured soils)
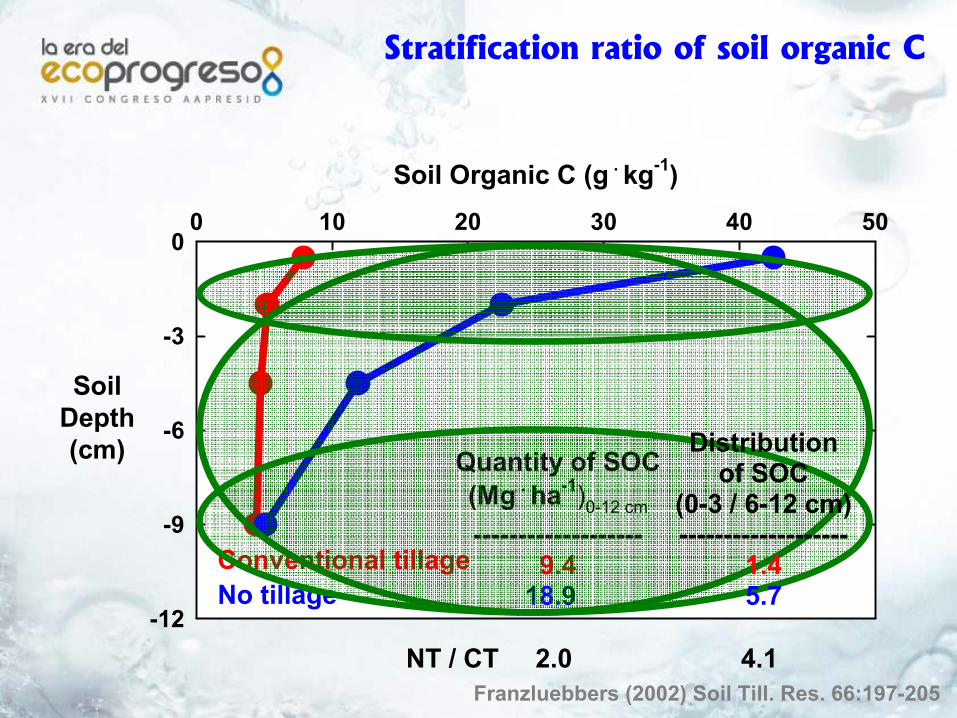
Stratification ratio of soil organic C
Soil Organic C (g . kg-1)0 10 20 30 40 50
SoilDepth(cm)
-12
-9
-6
-3
0
Conventional tillageNo tillage
Quantity of SOC(Mg . ha-1)0-12 cm
-------------------9.4
18.9
Distributionof SOC
(0-3 / 6-12 cm)-------------------
1.45.7
NT / CT 2.0 4.1Franzluebbers (2002) Soil Till. Res. 66:197-205
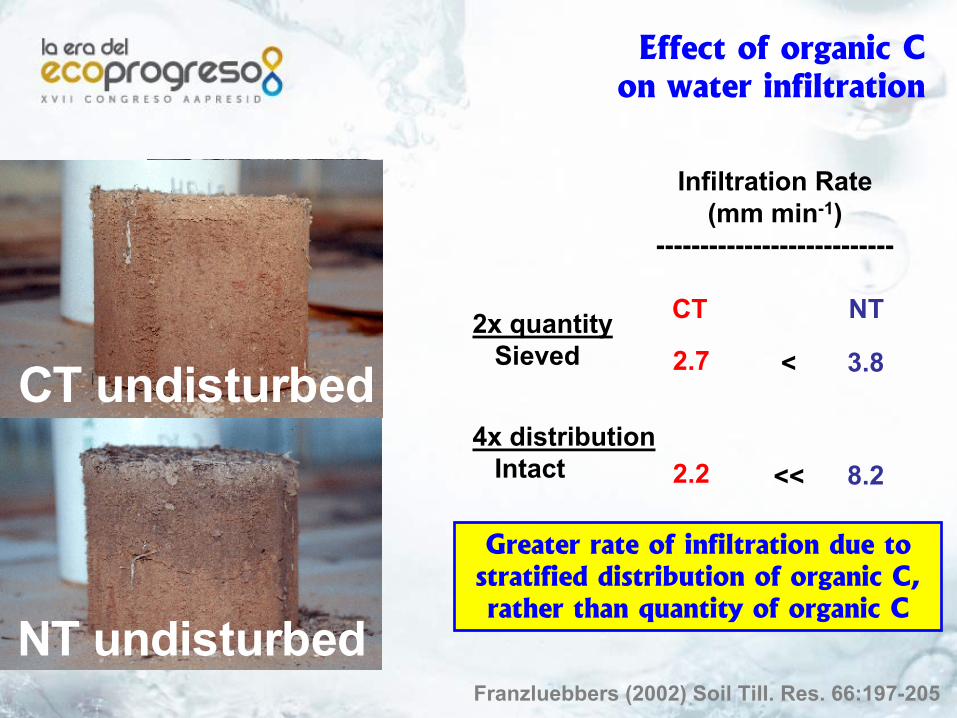
Effect of organic Con water infiltration
CT undisturbed
NT undisturbed
CT NT
Infiltration Rate(mm min-1)
---------------------------
2x quantitySieved 2.7 3.8<
4x distributionIntact 2.2 8.2<<
Greater rate of infiltration due to stratified distribution of organic C, rather than quantity of organic C
Franzluebbers (2002) Soil Till. Res. 66:197-205
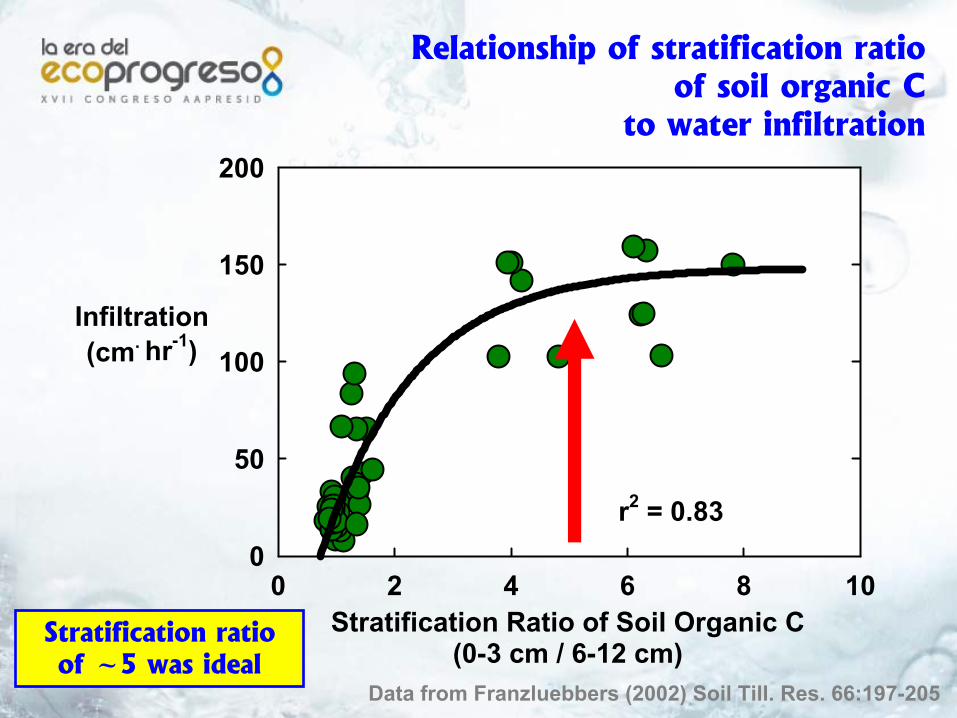
Relationship of stratification ratioof soil organic C
to water infiltration
Data from Franzluebbers (2002) Soil Till. Res. 66:197-205
Stratification Ratio of Soil Organic C(0-3 cm / 6-12 cm)
0 2 4 6 8 10
Infiltration(cm. hr-1)
0
50
100
150
200
r2 = 0.83
Stratification ratio of ~5 was ideal
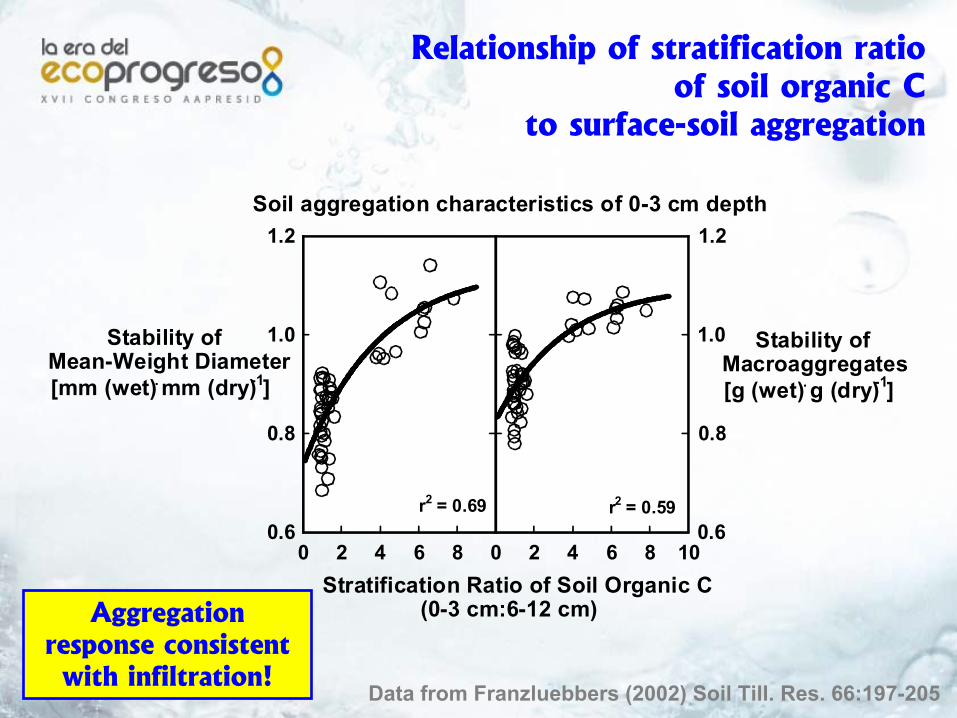
Relationship of stratification ratioof soil organic C
to surface-soil aggregation
Stratification Ratio of Soil Organic C(0-3 cm:6-12 cm)
0 2 4 6 8
Stability ofMean-Weight Diameter[mm (wet) . mm (dry)-1]
0.6
0.8
1.0
1.2
r2 = 0.69
0 2 4 6 8 10
Stability ofMacroaggregates[g (wet) . g (dry)-1]
0.6
0.8
1.0
1.2
r2 = 0.59
Soil aggregation characteristics of 0-3 cm depth
Data from Franzluebbers (2002) Soil Till. Res. 66:197-205
Aggregation response consistent with infiltration!
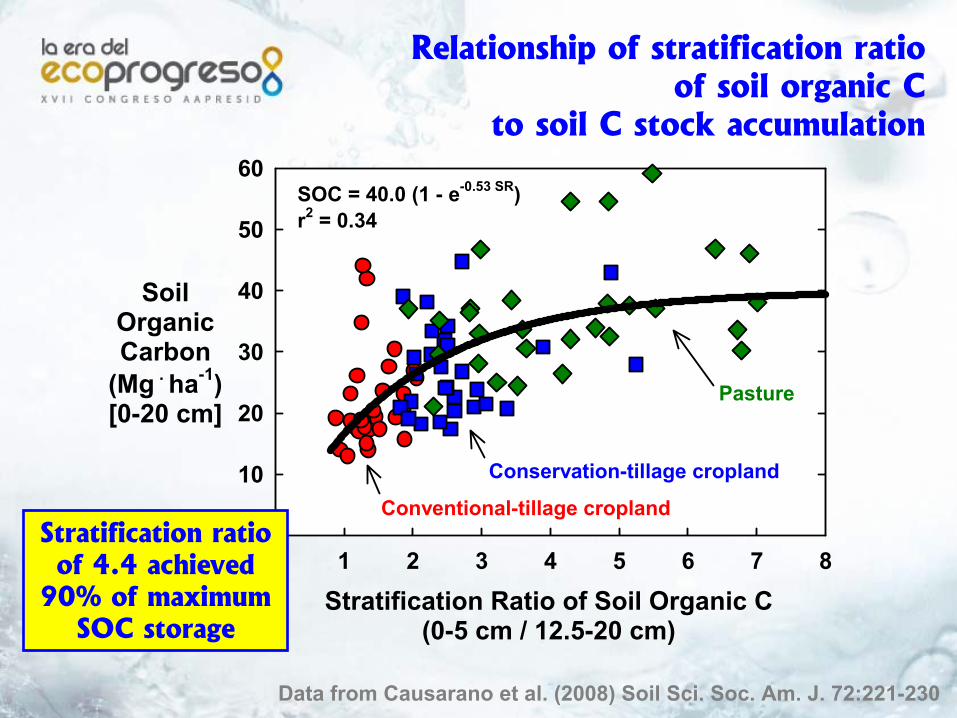
Relationship of stratification ratioof soil organic C
to soil C stock accumulation
Stratification Ratio of Soil Organic C(0-5 cm / 12.5-20 cm)
0 1 2 3 4 5 6 7 8
SoilOrganicCarbon
(Mg . ha-1)[0-20 cm]
0
10
20
30
40
50
60
Conservation-tillage cropland
Conventional-tillage cropland
Pasture
SOC = 40.0 (1 - e-0.53 SR)r2 = 0.34
Data from Causarano et al. (2008) Soil Sci. Soc. Am. J. 72:221-230
Stratification ratio of 4.4 achieved
90% of maximum SOC storage
Calculatingsoil organic C sequestration
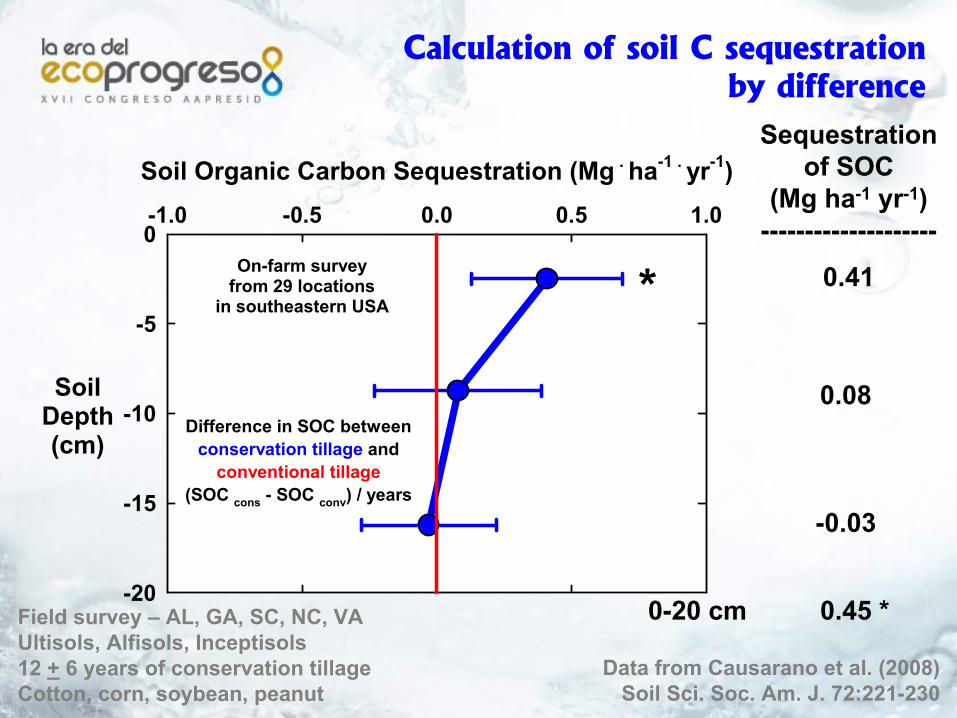
Soil Organic Carbon Sequestration (Mg . ha-1 . yr-1)-1.0 -0.5 0.0 0.5 1.0
SoilDepth(cm)
-20
-15
-10
-5
0
Difference in SOC betweenconservation tillage and
conventional tillage(SOC cons - SOC conv) / years
On-farm surveyfrom 29 locations
in southeastern USA *
Data from Causarano et al. (2008)Soil Sci. Soc. Am. J. 72:221-230
Field survey – AL, GA, SC, NC, VAUltisols, Alfisols, Inceptisols12 + 6 years of conservation tillageCotton, corn, soybean, peanut
Sequestration of SOC
(Mg ha-1 yr-1)--------------------
0.41
0-20 cm 0.45 *
0.08
-0.03
Calculation of soil C sequestrationby difference
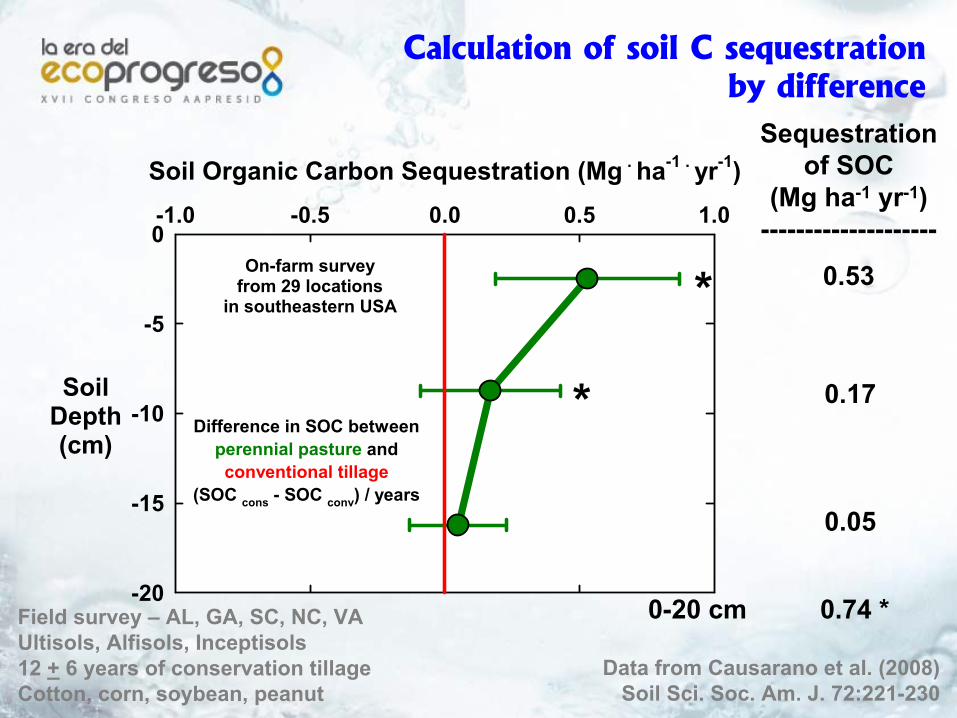
Soil Organic Carbon Sequestration (Mg . ha-1 . yr-1)-1.0 -0.5 0.0 0.5 1.0
SoilDepth(cm)
-20
-15
-10
-5
0
Difference in SOC betweenperennial pasture andconventional tillage
(SOC cons - SOC conv) / years
On-farm surveyfrom 29 locations
in southeastern USA
Data from Causarano et al. (2008)Soil Sci. Soc. Am. J. 72:221-230
*
*
Field survey – AL, GA, SC, NC, VAUltisols, Alfisols, Inceptisols12 + 6 years of conservation tillageCotton, corn, soybean, peanut
Sequestration of SOC
(Mg ha-1 yr-1)--------------------
0.53
0-20 cm 0.74 *
0.17
0.05
Calculation of soil C sequestrationby difference
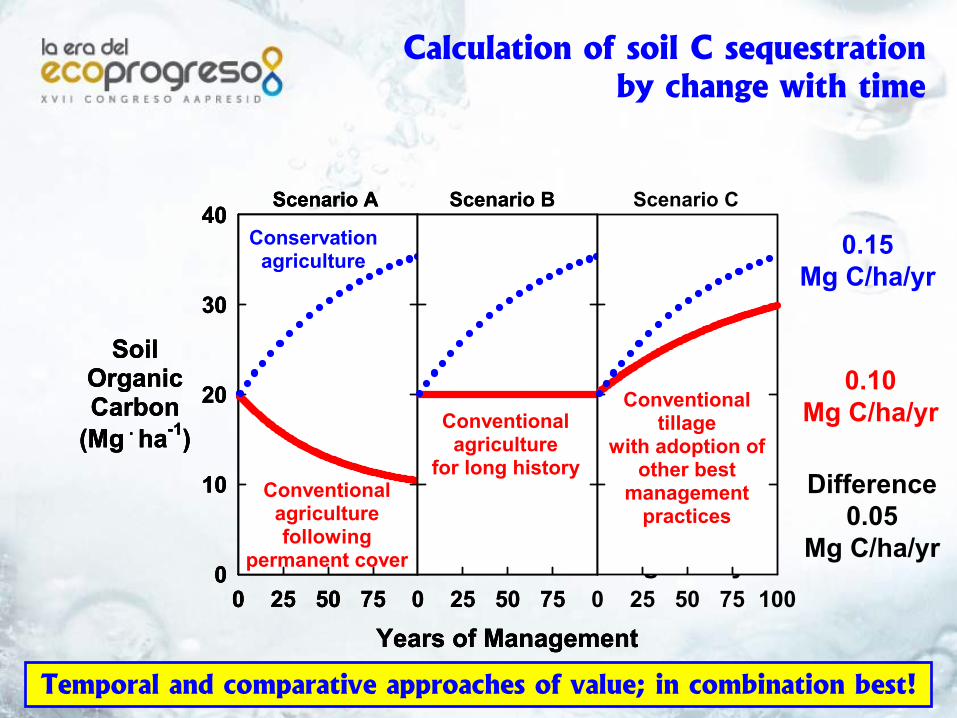
0.15Mg C/ha/yr
0.00Mg C/ha/yr
Difference0.15
Mg C/ha/yr
0.15Mg C/ha/yr
-0.10Mg C/ha/yr
Difference0.25
Mg C/ha/yr
Years of Management0 25 50 75
SoilOrganicCarbon
(Mg . ha-1)
0
10
20
30
40
Conventionalagriculturefollowing
permanent cover
Conservationagriculture
Scenario A
Years of Management0 25 50 75
SoilOrganicCarbon
(Mg . ha-1)
0
10
20
30
40
Conventionalagriculturefollowing
permanent cover
Conservationagriculture
Scenario A
0 25 50 75
Scenario B
Conventionalagriculture
for long history
Years of Management0 25 50 75
SoilOrganicCarbon
(Mg . ha-1)
0
10
20
30
40
Conventionalagriculturefollowing
permanent cover
Conservationagriculture
Scenario A
0 25 50 75
Scenario B
0 25 50 75 100
Scenario C
Conventionalagriculture
for long history
Conventionaltillage
with adoption ofother best
managementpractices
0.15Mg C/ha/yr
0.10Mg C/ha/yr
Difference0.05
Mg C/ha/yr
Temporal and comparative approaches of value; in combination best!
Calculation of soil C sequestrationby change with time
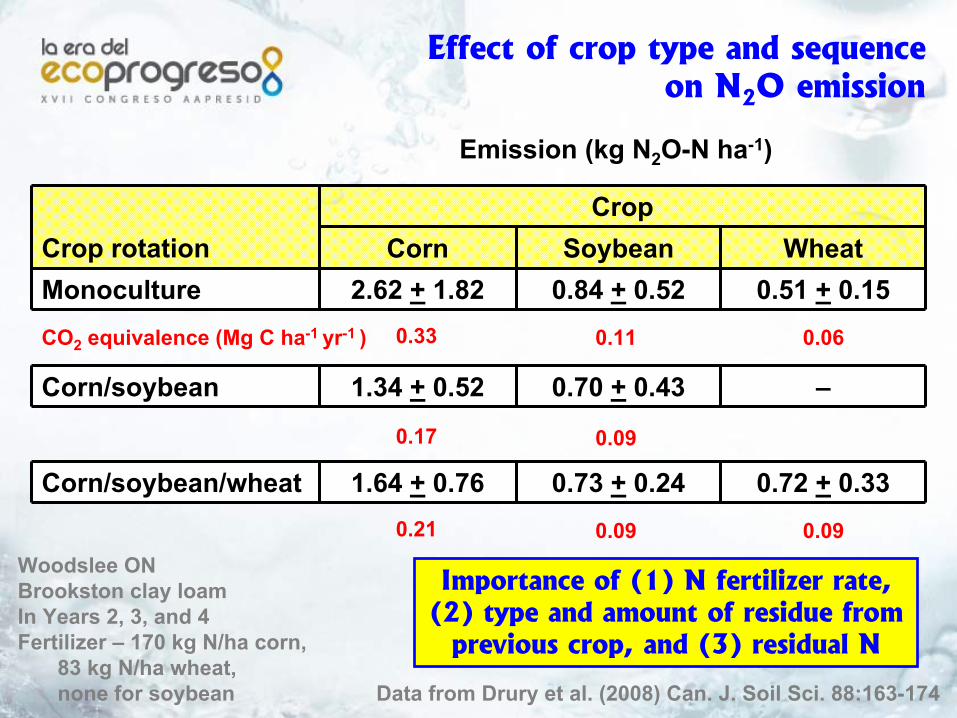
Effect of crop type and sequenceon N2O emission
Data from Drury et al. (2008) Can. J. Soil Sci. 88:163-174
Woodslee ONBrookston clay loamIn Years 2, 3, and 4Fertilizer – 170 kg N/ha corn,
83 kg N/ha wheat, none for soybean
Crop rotationCrop
Corn Soybean WheatMonoculture 2.62 + 1.82 0.84 + 0.52 0.51 + 0.15
Emission (kg N2O-N ha-1)
Corn/soybean 1.34 + 0.52 0.70 + 0.43 –
Corn/soybean/wheat 1.64 + 0.76 0.73 + 0.24 0.72 + 0.33
Importance of (1) N fertilizer rate, (2) type and amount of residue from
previous crop, and (3) residual N
0.33 0.11 0.06CO2 equivalence (Mg C ha-1 yr-1 )
0.17 0.09
0.21 0.09 0.09
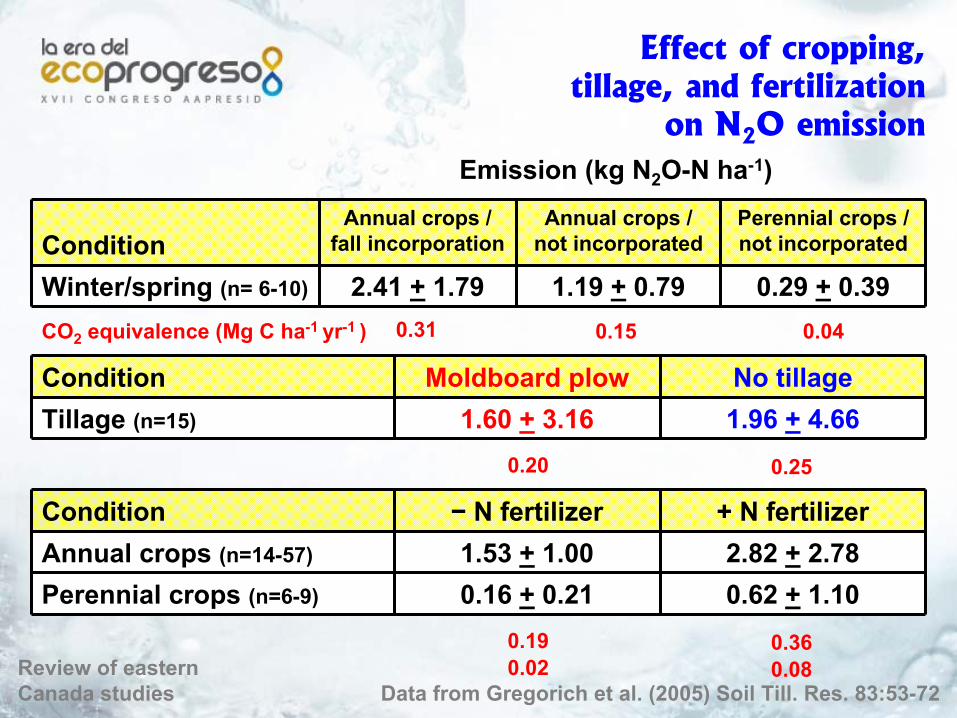
Effect of cropping,tillage, and fertilization
on N2O emission
Data from Gregorich et al. (2005) Soil Till. Res. 83:53-72
ConditionAnnual crops /
fall incorporationAnnual crops /
not incorporatedPerennial crops / not incorporated
Winter/spring (n= 6-10) 2.41 + 1.79 1.19 + 0.79 0.29 + 0.39
Emission (kg N2O-N ha-1)
Condition Moldboard plow No tillageTillage (n=15) 1.60 + 3.16 1.96 + 4.66
Condition − N fertilizer + N fertilizerAnnual crops (n=14-57) 1.53 + 1.00 2.82 + 2.78Perennial crops (n=6-9) 0.16 + 0.21 0.62 + 1.10
0.31 0.15 0.04CO2 equivalence (Mg C ha-1 yr-1 )
0.20 0.25
0.19 0.360.02 0.08Review of eastern
Canada studies
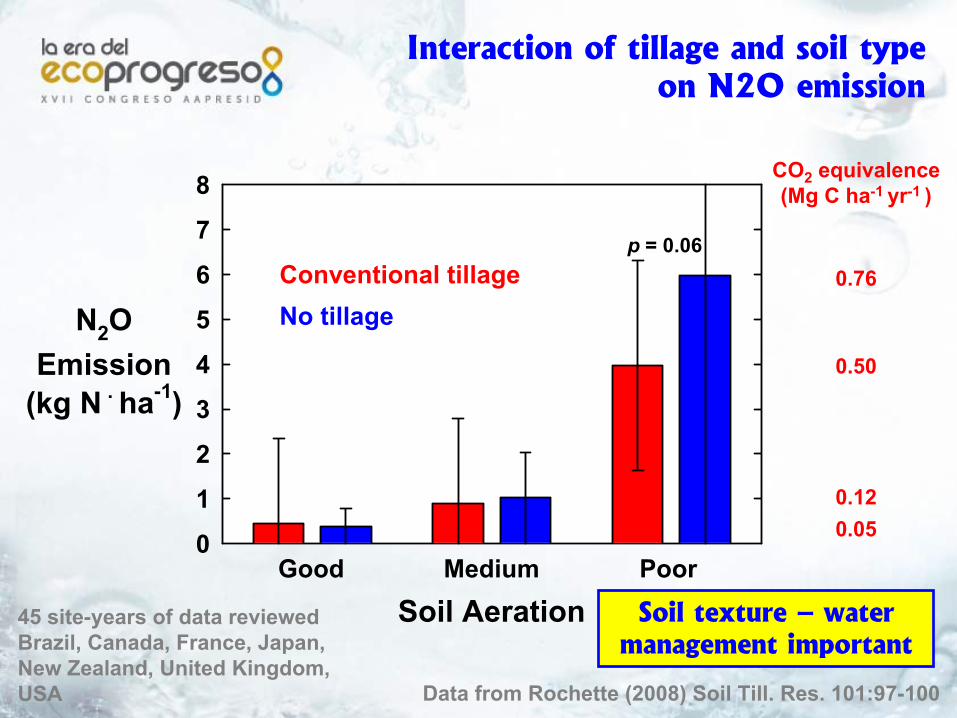
Interaction of tillage and soil typeon N2O emission
Data from Rochette (2008) Soil Till. Res. 101:97-100
Soil Aeration
N2OEmission
(kg N . ha-1)
0
1
2
3
4
5
6
7
8
Good Medium
Conventional tillageNo tillage
Poor
p = 0.06
45 site-years of data reviewedBrazil, Canada, France, Japan,New Zealand, United Kingdom, USA
0.50
0.120.05
CO2 equivalence(Mg C ha-1 yr-1 )
0.76
Soil texture – water management important
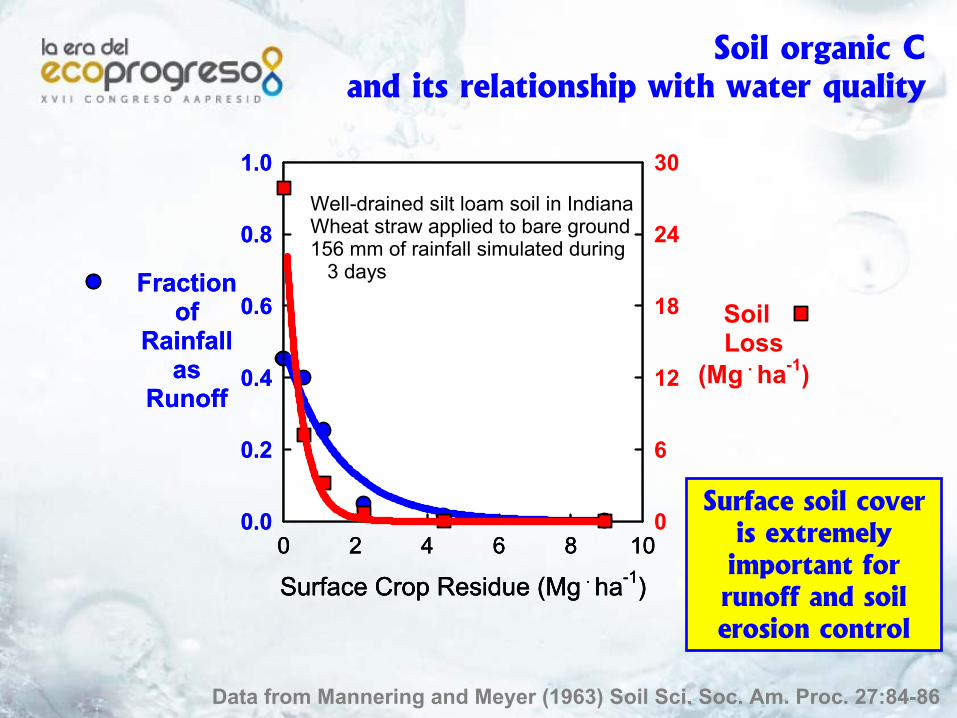
Soil organic Cand its relationship with water quality
Surface Crop Residue (Mg . ha-1)0 2 4 6 8 10
Fractionof
Rainfallas
Runoff
0.0
0.2
0.4
0.6
0.8
1.0
Well-drained silt loam soil in IndianaWheat straw applied to bare ground156 mm of rainfall simulated during 3 days
Surface Crop Residue (Mg . ha-1)0 2 4 6 8 10
Fractionof
Rainfallas
Runoff
0.0
0.2
0.4
0.6
0.8
1.0
Surface Crop Residue (Mg . ha-1)0 2 4 6 8 10
Soil Loss
(Mg . ha-1)
0
6
12
18
24
30
Well-drained silt loam soil in IndianaWheat straw applied to bare ground156 mm of rainfall simulated during 3 days
Data from Mannering and Meyer (1963) Soil Sci. Soc. Am. Proc. 27:84-86
Surface soil cover is extremely important for runoff and soil erosion control
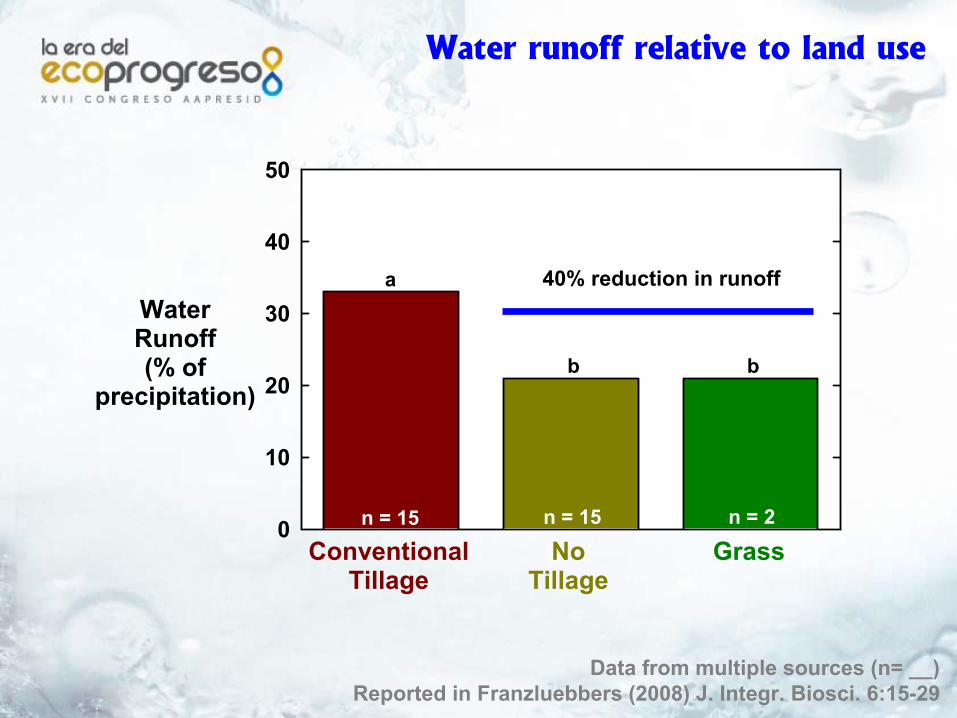
Water runoff relative to land use
WaterRunoff(% of
precipitation)
0
10
20
30
40
50
n = 15 n = 15 n = 2
a
b b
ConventionalTillage
NoTillage
Grass
Data from multiple sources (n= __)Reported in Franzluebbers (2008) J. Integr. Biosci. 6:15-29
40% reduction in runoff
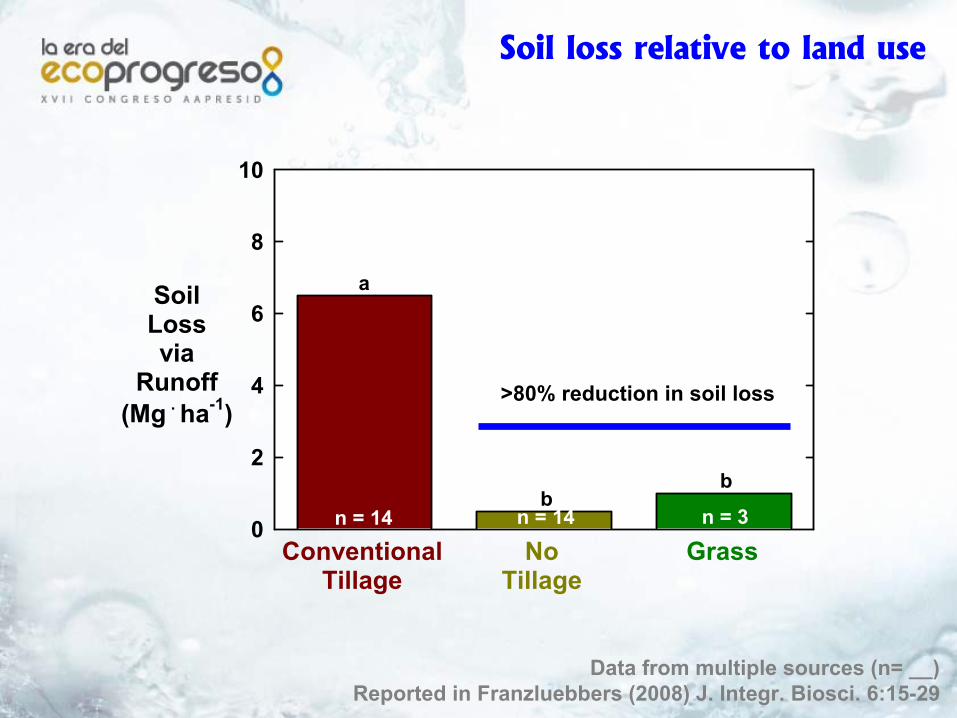
Soil loss relative to land use
Data from multiple sources (n= __)Reported in Franzluebbers (2008) J. Integr. Biosci. 6:15-29
SoilLossvia
Runoff(Mg . ha-1)
0
2
4
6
8
10
n = 14 n = 14 n = 3
a
bb
ConventionalTillage
NoTillage
Grass
>80% reduction in soil loss
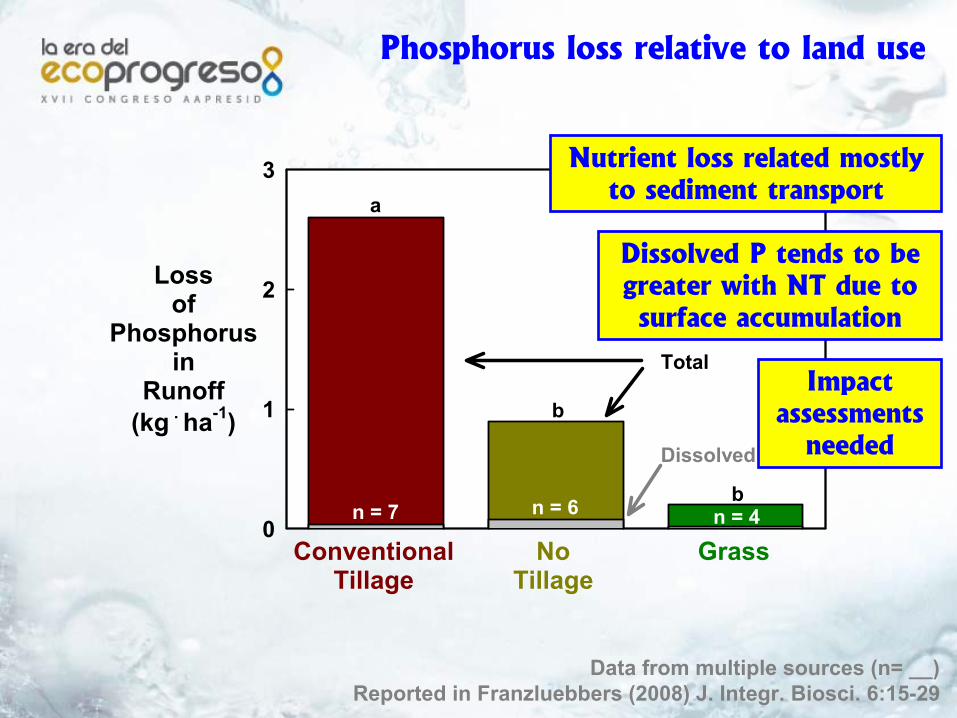
Phosphorus loss relative to land use
Data from multiple sources (n= __)Reported in Franzluebbers (2008) J. Integr. Biosci. 6:15-29
Lossof
Phosphorusin
Runoff(kg . ha-1)
0
1
2
3
n = 4
a
b
b
ConventionalTillage
NoTillage
Grassn = 7 n = 6
Total
Dissolved
Nutrient loss related mostly to sediment transport
Dissolved P tends to be greater with NT due to surface accumulation
Impact assessments
needed
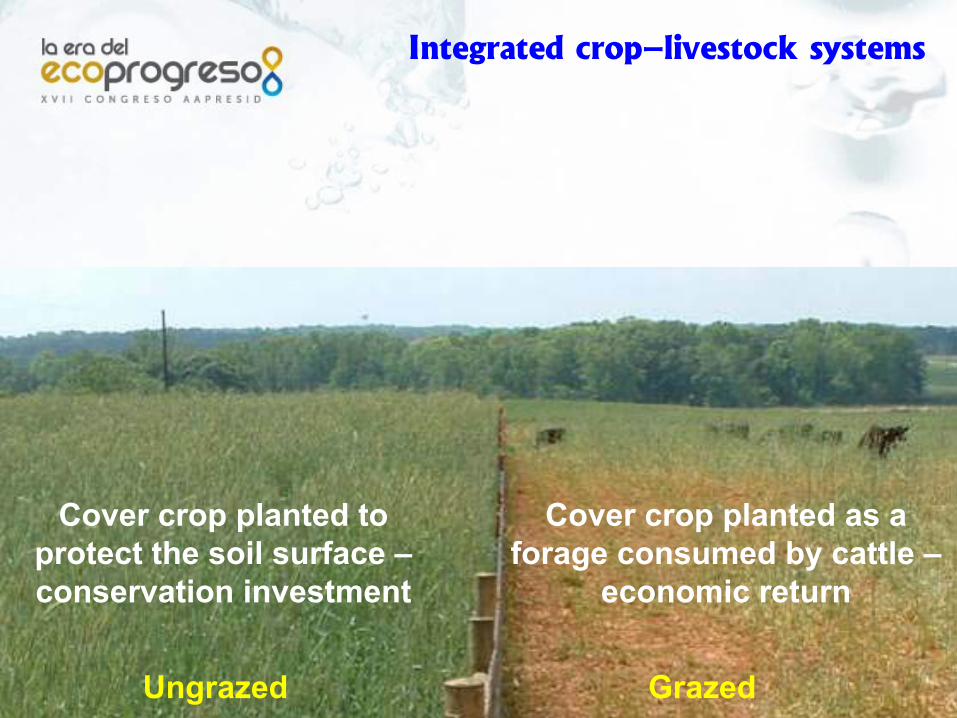
Ungrazed Grazed
Cover crop planted to protect the soil surface –conservation investment
Cover crop planted as a forage consumed by cattle –
economic return
Integrated crop–livestock systems
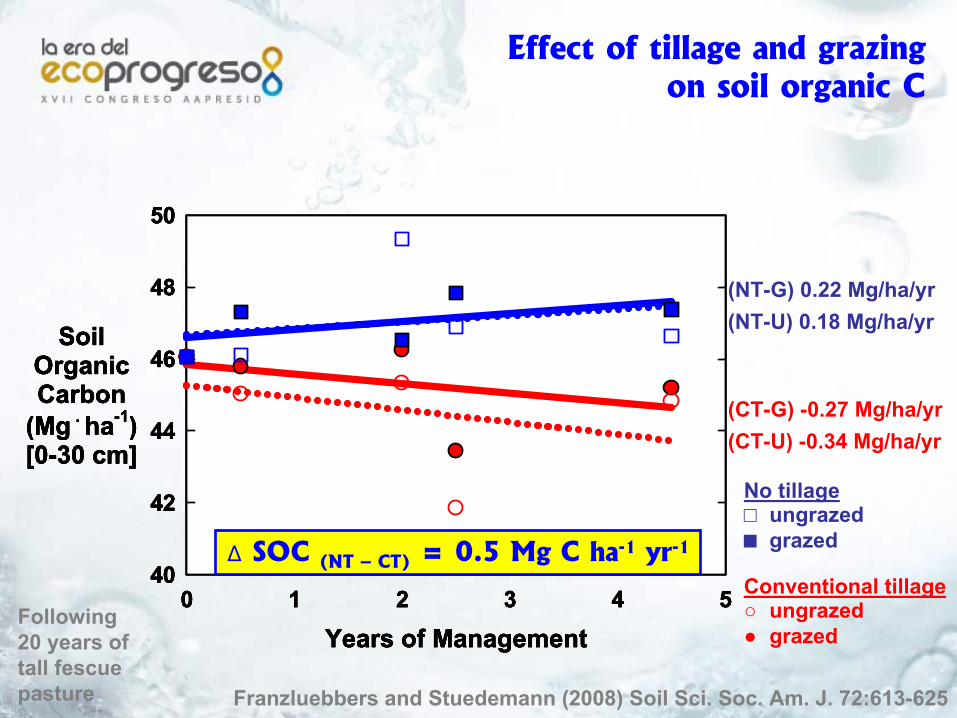
No tillage□ ungrazed■ grazed
Conventional tillage○ ungrazed● grazed
Franzluebbers and Stuedemann (2008) Soil Sci. Soc. Am. J. 72:613-625
Years of Management0 1 2 3 4 5
SoilOrganicCarbon
(Mg . ha-1)[0-30 cm]
40
42
44
46
48
50
Years of Management0 1 2 3 4 5
SoilOrganicCarbon
(Mg . ha-1)[0-30 cm]
40
42
44
46
48
50
Years of Management0 1 2 3 4 5
SoilOrganicCarbon
(Mg . ha-1)[0-30 cm]
40
42
44
46
48
50
Years of Management0 1 2 3 4 5
SoilOrganicCarbon
(Mg . ha-1)[0-30 cm]
40
42
44
46
48
50
(CT-U) -0.34 Mg/ha/yr(CT-G) -0.27 Mg/ha/yr
(NT-G) 0.22 Mg/ha/yr(NT-U) 0.18 Mg/ha/yr
∆ SOC (NT – CT) = 0.5 Mg C ha-1 yr-1
Effect of tillage and grazingon soil organic C
Following 20 years of tall fescue pasture
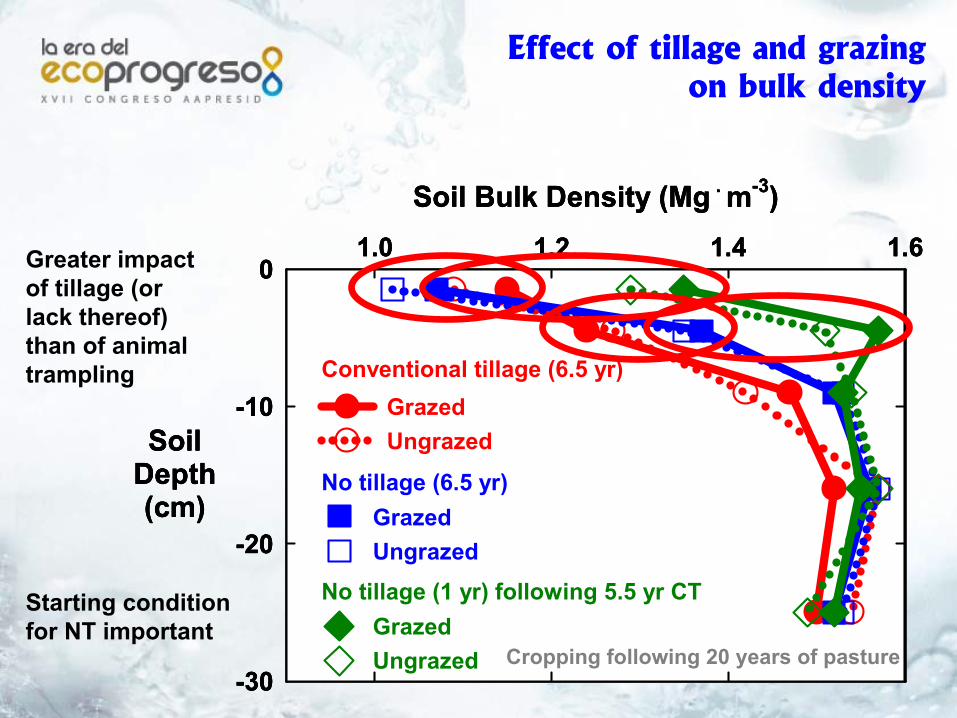
Soil Bulk Density (Mg . m-3)1.0 1.2 1.4 1.6
SoilDepth(cm)
-30
-20
-10
0
Conventional tillage (6.5 yr)GrazedUngrazed
Soil Bulk Density (Mg . m-3)1.0 1.2 1.4 1.6
SoilDepth(cm)
-30
-20
-10
0
Conventional tillage (6.5 yr)GrazedUngrazed
No tillage (6.5 yr)GrazedUngrazed
Soil Bulk Density (Mg . m-3)1.0 1.2 1.4 1.6
SoilDepth(cm)
-30
-20
-10
0
Conventional tillage (6.5 yr)GrazedUngrazed
No tillage (6.5 yr)GrazedUngrazed
No tillage (1 yr) following 5.5 yr CTGrazedUngrazed
Greater impact of tillage (or lack thereof) than of animal trampling
Starting condition for NT important
Effect of tillage and grazingon bulk density
Cropping following 20 years of pasture
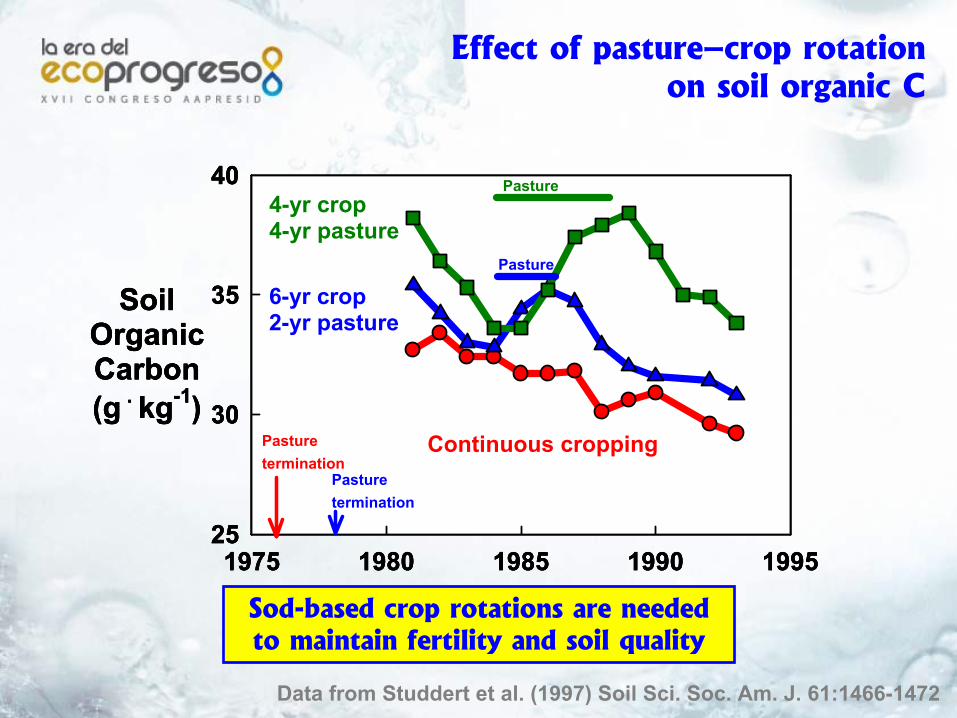
Effect of pasture–crop rotationon soil organic C
Data from Studdert et al. (1997) Soil Sci. Soc. Am. J. 61:1466-1472
Year1975 1980 1985 1990 1995
SoilOrganicCarbon(g . kg-1)
25
30
35
40
Continuous croppingPasturetermination
Year1975 1980 1985 1990 1995
SoilOrganicCarbon(g . kg-1)
25
30
35
40
Continuous croppingPasturetermination
6-yr crop2-yr pasture
Pasturetermination
Pasture
Year1975 1980 1985 1990 1995
SoilOrganicCarbon(g . kg-1)
25
30
35
40
Continuous croppingPasturetermination
6-yr crop2-yr pasture
Pasturetermination
Pasture
4-yr crop4-yr pasture
Pasture
Sod-based crop rotations are needed to maintain fertility and soil quality
Franzluebbers et al. (2001) Soil Sci. Soc. Am. J. 65:834-841 and unpublished data
Years of Management0 1 2 3 4 5 6 7 8
SoilOrganicCarbon
(Mg . ha-1)
12
14
16
18
20
22
24
Cut for hay
Years of Management0 1 2 3 4 5 6 7 8
SoilOrganicCarbon
(Mg . ha-1)
12
14
16
18
20
22
24
Cut for hay
Unharvested
Years of Management0 1 2 3 4 5 6 7 8
SoilOrganicCarbon
(Mg . ha-1)
12
14
16
18
20
22
24
Unharvested
Cut for hay
Lowgrazing pressure
Years of Management0 1 2 3 4 5 6 7 8
SoilOrganicCarbon
(Mg . ha-1)
12
14
16
18
20
22
24
Unharvested
Cut for hay
Lowgrazing pressure
Highgrazing
pressure
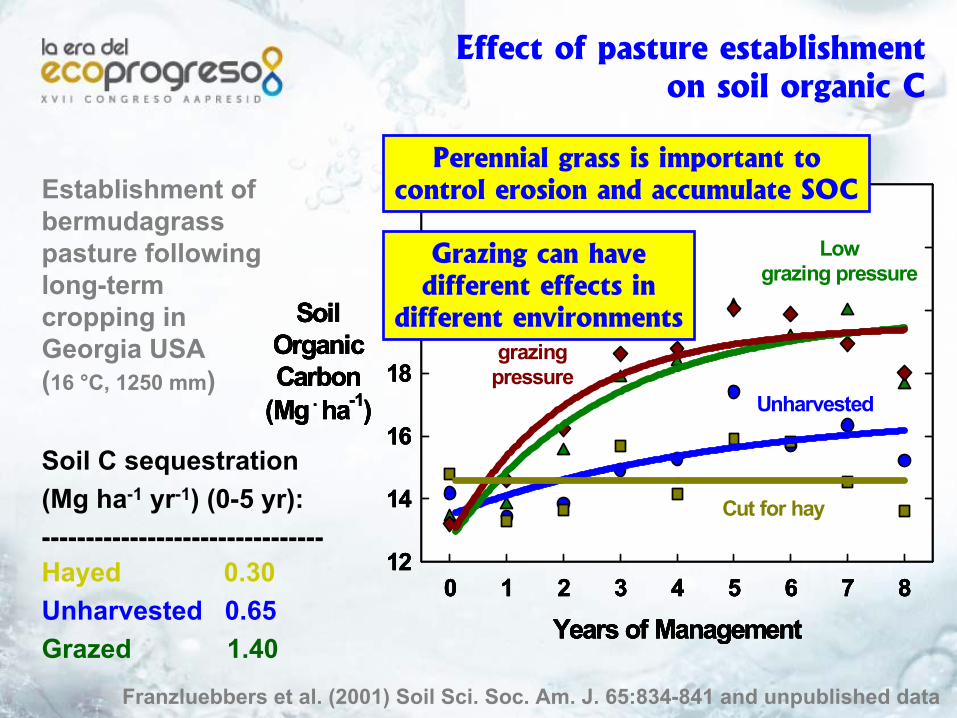
Establishment of bermudagrasspasture following long-term cropping in Georgia USA (16 °C, 1250 mm)
Soil C sequestration(Mg ha-1 yr-1) (0-5 yr):--------------------------------Hayed 0.30Unharvested 0.65Grazed 1.40
Perennial grass is important to control erosion and accumulate SOC
Grazing can have different effects in
different environments
Effect of pasture establishmenton soil organic C
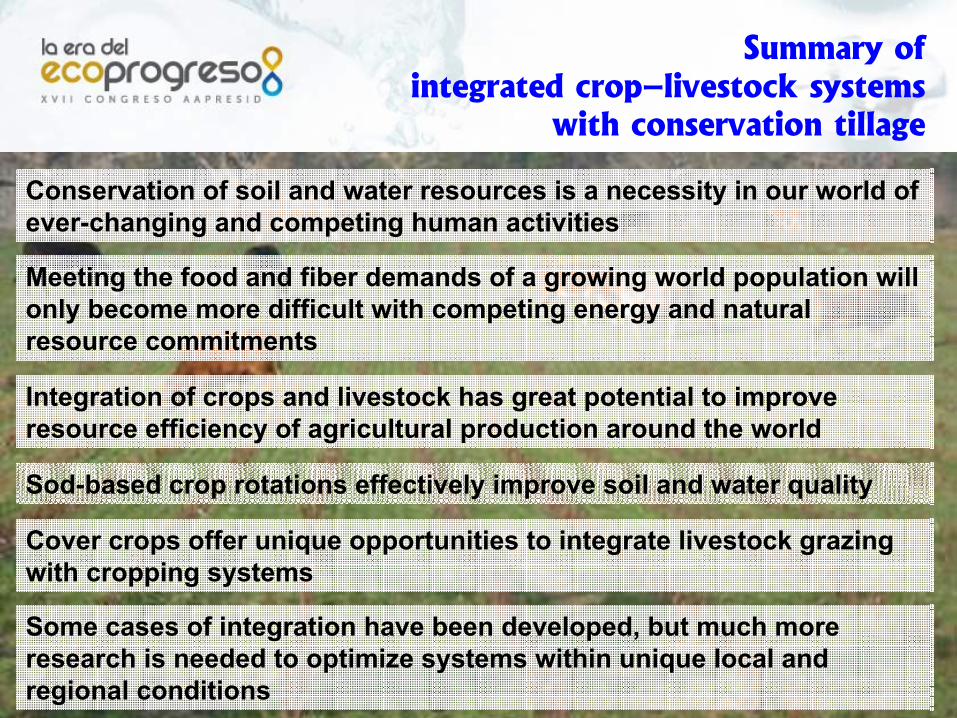
Conservation of soil and water resources is a necessity in our world of ever-changing and competing human activities
Meeting the food and fiber demands of a growing world population will only become more difficult with competing energy and natural resource commitments
Integration of crops and livestock has great potential to improve resource efficiency of agricultural production around the world
Some cases of integration have been developed, but much more research is needed to optimize systems within unique local and regional conditions
Sod-based crop rotations effectively improve soil and water quality
Cover crops offer unique opportunities to integrate livestock grazing with cropping systems
Summary ofintegrated crop–livestock systems
with conservation tillage
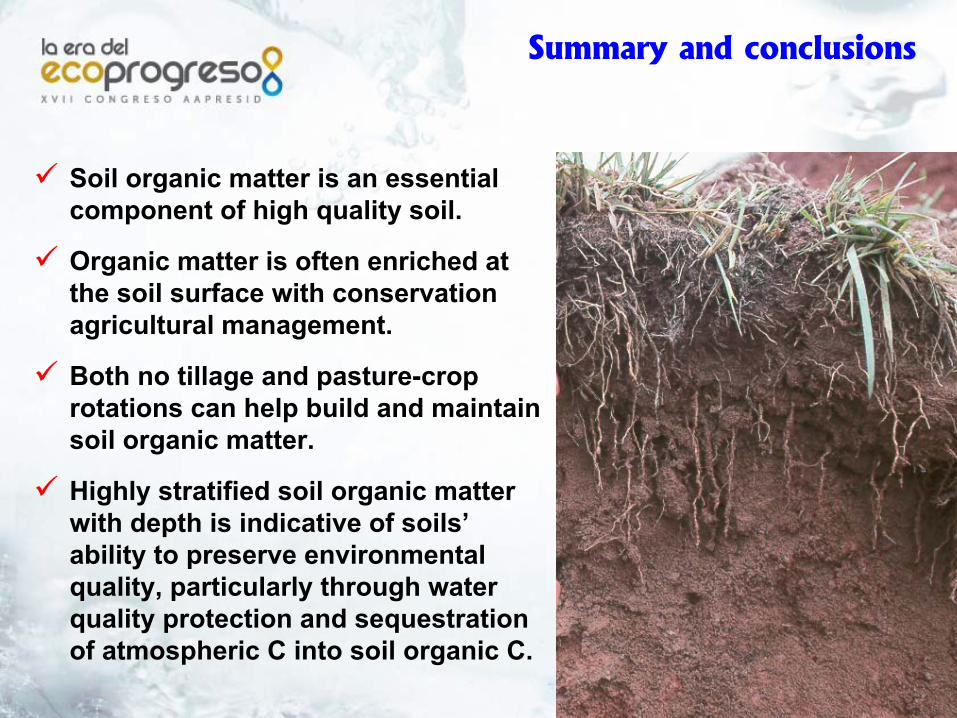
Summary and conclusions
Soil organic matter is an essential component of high quality soil.
Organic matter is often enriched at the soil surface with conservation agricultural management.
Both no tillage and pasture-crop rotations can help build and maintain soil organic matter.
Highly stratified soil organic matter with depth is indicative of soils’ability to preserve environmental quality, particularly through water quality protection and sequestration of atmospheric C into soil organic C.
Acknowledgements
FundingAgricultural Research Service
(ARS)US-Department of EnergyMadison County Cattleman’s
AssociationUSDA-National Research
Initiative – Soil ProcessesCotton IncorporatedGeorgia Commodity
Commission for CornThe Organic CenterARS GRACEnet team