Embed Size (px)
Citation preview
Institute of the North • Anchorage, Alaska • 1 907 771.2444 • [email protected]
www.arcticenergysummit.org
Abstract— Gas hydrate may contain significant gas resources in both onshore arctic and offshore regions throughout the world. The BP-DOE collaborative research project is designed to help determine whether or not gas hydrate can become a technically and economically recoverable gas resource. Reservoir characterization, development scenario modeling, and associated studies indicated that 0-0.34 Trillion Cubic Meters (0-12 Trillion Cubic Feet – TCF) gas may be technically recoverable from 0.92 Trillion Cubic Meters (33 TCF) gas-in-place (GIP) Eileen trend gas hydrate beneath industry infrastructure within the Milne Point Unit (MPU), Prudhoe Bay Unit (PBU), and Kuparuk River Unit (KRU) areas on the Alaska North Slope (ANS). Reservoir modeling indicated sufficient potential for technical recovery to justify proceeding into field operations to acquire basic physical reservoir and fluid data to help mitigate the large range of uncertainty in recoverable resource. The BP-DOE collaborative research project was approved to proceed into a field data acquisition program including: 122-183 meters (400-600 feet) core, extensive wireline logs, and wireline production tests within the Mount Elbert gas hydrate prospect in the MPU. Successful drilling and data acquisition in the Mount Elbert-01 stratigraphic test well was completed between February 3-19, 2007. Future studies, if approved by BP and DOE, could acquire additional data and include production testing.
Index Terms— Alaska, gas hydrate, resources, production.
I. INTRODUCTION HIS cooperative research between BP Exploration (Alaska), Inc. (BPXA) and the U.S. Department of Energy (DOE) is helping to characterize and assess
Alaska North Slope (ANS) gas hydrate resources and to
Manuscript received September 26, 2007. This paper was prepared as an
account of work sponsored by the U.S. Department of Energy under Collaborative Agreement Award DE-FC-01NT41332 with BP Exploration (Alaska), Inc.
Robert Hunter is with ASRC Energy Services, 3900 C St., Suite 702, Anchorage, AK 99503 (phone: 907-339-6377; fax: 907-339-6253; e-mail: [email protected] or [email protected]).
Scott Digert is with BP Exploration (Alaska), Inc., P.O. Box 196612, Anchorage, AK 99503
Ray Boswell is with the U.S. Department of Energy, National Energy Technology Lab, 3610 Collins Ferry Road, P.O. Box 880, Morgantown, WV 26507-0880
Tim Collett is with the U.S. Geological Survey, Denver Federal Center, MS-939, Box 25046, Denver, CO 80225
identify technical and commercial factors that could enable government and industry to understand the future development potential of this possible unconventional energy resource. Reservoir characterization, reservoir modeling, and associated studies culminated in approval to proceed into a 2007 stratigraphic test to acquire data designed to better characterize the physical system, reduce the uncertainty regarding resource productivity, and design potential future test programs. Collaborative research partners include U.S. Geological Survey (USGS), Arctic Slope Regional Corporation Energy Services, Ryder Scott Company, APA-RPS Engineering, University of Arizona, University of Alaska Fairbanks, Oregon State University, Pacific Northwest National Lab, Lawrence Berkeley National Lab, and others. Gas hydrate may contain a significant portion of world gas resources within onshore arctic and offshore regions petroleum systems. In the United States, accumulations of gas hydrate occur within pressure-temperature stability regions in both onshore near-permafrost and also offshore regions. USGS probabilistic estimates indicate that gas hydrate may contain a mean of 16.7 Trillion cubic meters (590 Trillion Cubic Feet – TCF) in-place ANS gas resources (Figure 1). Up to 0.93 Trillion cubic meters (33 Trillion Cubic Feet – TCF) in-place gas hydrate resources are interpreted within shallow sand reservoirs beneath ANS production infrastructure within the Eileen trend (Figure 2). Gas hydrate accumulations require the presence of all petroleum system components including source, migration, trap, seal, charge, and reservoir. Future exploitation of gas hydrate would require developing feasible, safe, and environmentally-benign production technology, initially within areas of industry infrastructure. The information and technology being developed in this onshore ANS program will be an important component to assessing the possible productivity of the potentially much larger marine hydrate resource. The resource potential of gas hydrate remains unproven, but if proven, could increase ANS gas resources and could support greater U.S. energy independence. In 1972, the existence of natural gas hydrate within ANS shallow sand reservoirs was confirmed by data acquired in the Northwest Eileen State-02 well. Although significant in-place gas may be trapped within the gas hydrate-bearing formations beneath existing ANS infrastructure, it has been primarily known as a shallow gas hazard during the drilling of the hundreds of well penetrations targeting deeper oil-bearing
Robert B. Hunter, Scott A. Digert, Ray Boswell, and Timothy S. Collett
Alaska Gas Hydrate Research and Stratigraphic Test Preliminary Results
T

Institute of the North • Anchorage, Alaska • 1 907 771.2444 • [email protected]
www.arcticenergysummit.org
formations and has drawn little resource attention due to no ANS gas export infrastructure and unknown potential productivity. Characterization of ANS gas hydrate-bearing reservoirs and improved modeling of potential gas hydrate dissociation processes led to increasing interest to collaboratively study gas hydrate resource and production feasibility. If gas can be technically produced from gas hydrate and if studies help prove production capability at economically viable rates, then gas dissociated from ANS gas hydrate could help supplement fuel gas for existing operations, provide additional lean gas for reservoir energy pressure support, provide fuel gas to help establish long-term production of portions of the geographically-coincident 20-25 billion barrels viscous oil resource, and/or potentially supplement conventional export-gas in the longer term. As part of a multi-year effort to encourage these feasibility studies, the DOE also supports significant laboratory and numerical modeling efforts focused on the small scale behaviors of gas hydrate. Concurrently, the USGS has assessed the in-place resource potential and participated in field operations with DOE and others to acquire data within many naturally occurring gas hydrate accumulations throughout the world (see related paper Arctic Gas Hydrate
Energy Assessment Studies in this volume). There remain significant challenges in quantifying the fraction of these in-place resources that might eventually become a technically-feasible or possibly a commercial natural gas reserve. This study estimates this ANS resource within the Eileen trend and recommends additional research, data acquisition, and field operations. A “chicken and egg” problem has hindered unproven resource research and development in the past; an “unconventional” resource commonly requires a few positive examples before it can generate stand-alone interest from industry. This was true for tight gas resources in the 1950-1960’s, Coal-Bed-Methane plays in the 1970-1980’s and the shale gas resources in the 1990-2000’s. In each case, the resource was thought to be technically infeasible and uneconomic until the combination of market, technology (new or newly applied), and positive field experience helped motivate widespread adoption of unconventional recovery techniques in an effort to prove whether or not the resource could be technically and commercially produced. In an attempt to bridge this gap, gas hydrate reservoir modeling efforts were coupled with a series of possible regional reservoir development models to quantify a suite of potential recoverable reserve outcomes. The regional reservoir
Figure 1: ANS gas hydrate stability zone extent and location of Eileen and Tarn gas hydrate trends [1].

Institute of the North • Anchorage, Alaska • 1 907 771.2444 • [email protected]
www.arcticenergysummit.org
development model indicated that 0-0.34 Trillion Cubic Meters (0-12 Trillion Cubic Feet – TCF) gas may be technically recoverable from 0.93 Trillion Cubic Meters (33 Trillion Cubic Feet – TCF) in-place Eileen trend gas hydrate beneath ANS industry infrastructure within the Milne Point Unit (MPU), Prudhoe Bay Unit (PBU), and Kuparuk River Unit (KRU) areas. Studies of the technical viability of gas hydrate production included a range of type-well forecasts and development scenarios, using the limited available theoretical models, as there is no available analog information and little available actual physical data and no sustained flow data. Possible production scenarios included conventional depressurization and either thermal or chemical stimulation. This work indicated the range of 0-0.34 Trillion Cubic Meters of recoverable resource, with large uncertainty within this range, but with sufficient potential for technical recovery to justify field operations to acquire basic reservoir and fluid data.
The collaborative research project was approved to proceed into a field data acquisition program including: 122-183 meters (400-600 feet) core, extensive wireline log program,
and wireline production tests within the Mount Elbert gas hydrate MPU prospect interpreted from the Milne 3D seismic survey (Figures 3-4). These field studies led to successful acquisition of critical data to help mitigate uncertainty in potential gas hydrate productivity. Successful Mount Elbert-01 stratigraphic test drilling and data acquisition was conducted between February 3-19, 2007. Although production test assessment is underway with data evaluation, a production test has not been designed or approved at this time. Further studies, if designed and approved, could acquire additional gas hydrate-bearing reservoir data and include production testing, likely from a gravel pad within production infrastructure.
II. STRATIGRAPHIC TEST PRELIMINARY RESULTS
A. Results Summary This research program is designed to help assess whether the currently unproven gas hydrate resource may become a
Figure 2: Eileen and Tarn gas hydrate trends and ANS field infrastructure with gas-in-place (GIP) and potential recoverable resource, modified after [2].
Eileen Trend, 0.93 Trillion M3 GIP, 0-0.34 Trillion M3 Recoverable?
Tarn Trend

Institute of the North • Anchorage, Alaska • 1 907 771.2444 • [email protected]
www.arcticenergysummit.org
new unconventional gas resource. The major research objectives accomplished in early 2007 included acquisition of all recommended stratigraphic test well drilling and core, log, and wireline production test data. Acquired data included 131 meters (430 feet) of core (30.5 meters (100 feet) gas hydrate-bearing), extensive wireline logging, and wireline production testing operations using the Modular Dynamics Testing (MDT) downhole tool. Significant pre-well planning, inclusion of hydrate experts, and onsite vigilance were key elements to safely drilling and acquiring these data in February 2007 on an exploration ice pad in the Milne Point Unit on the Alaska North Slope (Figure 5). Chilled oil-based drilling fluid mitigated operational safety concerns and enhanced core and data acquisition by maintaining gas hydrate and borehole stability during openhole drilling and operations. The well test successfully demonstrated the ability to safely and effectively acquire data and wireline production test data within shallow gas hydrate-bearing reservoirs over seven to ten days (versus the standard approach to drill and case this interval within two to four days).
A XX A’
The stratigraphic test validated the 3D seismic interpretation of the MPU gas hydrate-bearing Mount Elbert prospect (Figures 3-4). A total of 261 onsite core subsamples were preserved for later analyses at various labs for interstitial water geochemistry, physical properties, thermal properties, organic geochemistry, petrophysics, and mechanical properties.
A A’XXA A’XX
West East
Figure 3: Seismic Amplitude map, Mount Elbert prospect within 3-way fault-bounded closure. The X marks the approximate Mount Elbert-01 location.
Figure 4: Seismic traverse A-A’ (Figure 3) From West to East illustrates interpreted zone C and D gas hydrate-bearing intervals. The subparallel red and green lines mark range of base gas hydrate stability. Note corroborating evidence of gas hydrate within zones C and D in the prominent velocity pull-up directly beneath these zones.
Figure 5: Doyon 14 rig and pipeshed, February 2007, during early operations on Mount Elbert-01, ANS MPU
Institute of the North • Anchorage, Alaska • 1 907 771.2444 • [email protected]
www.arcticenergysummit.org
Acquired open-hole wireline logs included gamma-ray, resistivity, neutron-density porosity, Dipole Sonic Acoustic porosity, Nuclear Magnetic Resonance, Formation Imaging, Electromagnetic Propagation, geochemical neutron activation logging, and caliper. MDT wireline production testing was accomplished within two gas hydrate-bearing reservoir intervals and acquired four extensive, long shut-in period tests. MDT analyses are helping to improve understanding of gas hydrate dissociation, gas production, formation cooling, and long-term production potential as well as helping to calibrate reservoir simulation models. Four gas samples and one pre-gas hydrate dissociation formation water sample were obtained. The Gas Hydrate Stratigraphic Test accomplished several ”firsts”, including: 1. First significant ANS gas hydrate bearing core (30.5 meters (100 feet) of 131 meters (430 feet) acquired), 2. First wireline retrievable coring system application on ANS with conventional drilling rig, 3. First extensive ANS open hole multi-day data acquisition program in gas hydrate section, 4. First in world open-hole dual packer MDT program in gas hydrate bearing reservoir sands, 5. First ANS MDT sampling of both gas and water in gas hydrate-bearing reservoirs, and 6. First in world reservoir temperature data tracking at the MDT inlet port during flow and shut-in periods.
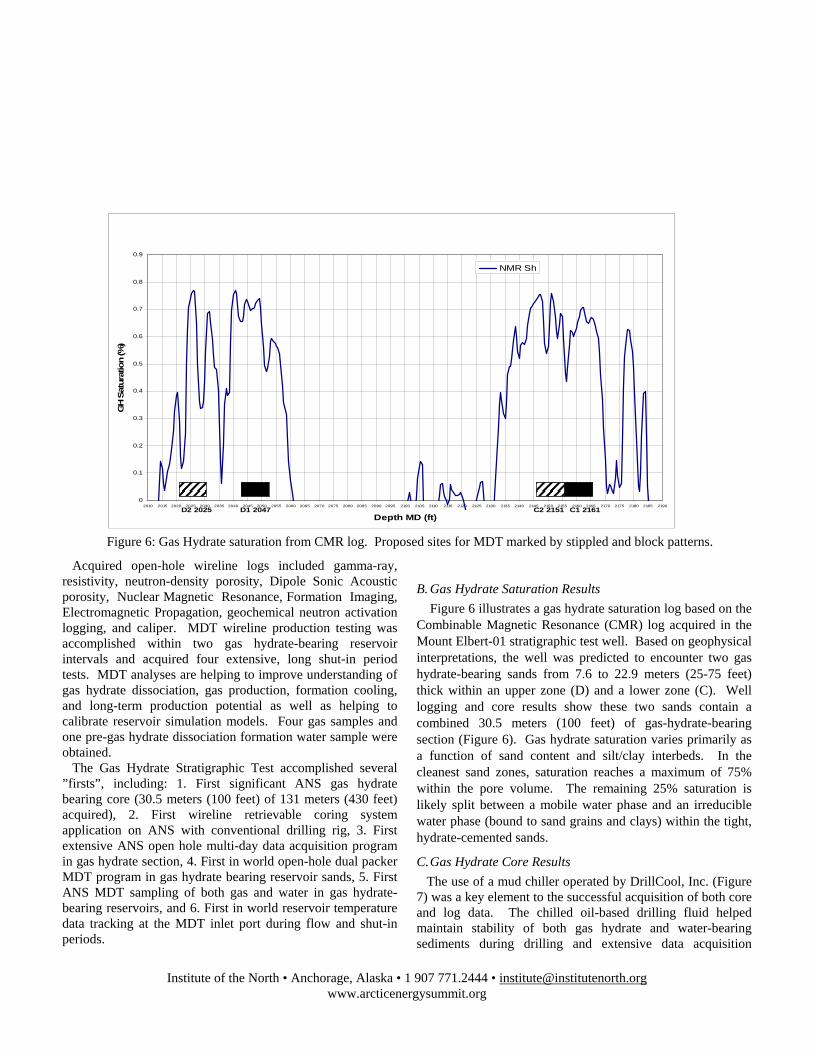
B. Gas Hydrate Saturation Results Figure 6 illustrates a gas hydrate saturation log based on the
Combinable Magnetic Resonance (CMR) log acquired in the Mount Elbert-01 stratigraphic test well. Based on geophysical interpretations, the well was predicted to encounter two gas hydrate-bearing sands from 7.6 to 22.9 meters (25-75 feet) thick within an upper zone (D) and a lower zone (C). Well logging and core results show these two sands contain a combined 30.5 meters (100 feet) of gas-hydrate-bearing section (Figure 6). Gas hydrate saturation varies primarily as a function of sand content and silt/clay interbeds. In the cleanest sand zones, saturation reaches a maximum of 75% within the pore volume. The remaining 25% saturation is likely split between a mobile water phase and an irreducible water phase (bound to sand grains and clays) within the tight, hydrate-cemented sands.
C. Gas Hydrate Core Results The use of a mud chiller operated by DrillCool, Inc. (Figure 7) was a key element to the successful acquisition of both core and log data. The chilled oil-based drilling fluid helped maintain stability of both gas hydrate and water-bearing sediments during drilling and extensive data acquisition
0
0.1
0.2
0.3
0.4
0.5
0.6
0.7
0.8
0.9
2010 2015 2020 2025 2030 2035 2040 2045 2050 2055 2060 2065 2070 2075 2080 2085 2090 2095 2100 2105 2110 2115 2120 2125 2130 2135 2140 2145 2150 2155 2160 2165 2170 2175 2180 2185 2190
Depth MD (ft)
GH
Sat
urat
ion
(%)
NMR Sh
C1 2161C2 2151D1 2047D2 2025
Figure 6: Gas Hydrate saturation from CMR log. Proposed sites for MDT marked by stippled and block patterns.

Institute of the North • Anchorage, Alaska • 1 907 771.2444 • [email protected]
www.arcticenergysummit.org
operations. Over the 2.5 day coring program, 153 meters (504 feet) of mixed gas hydrate and water-bearing sediments were cored in 23 core runs. A total of 131 meters (430 feet) core was recovered, yielding an approximately 85% core recovery efficiency, comparable to that recovered by similar methods in the 2002 Mallik gas hydrate core as reported in GSC Bulletin 585. The wireline core recovery enabled quick drilling and recovery of each core. Maximum core recovery possible per core run was up to 7.3 meters (24 feet) plus a few centimeters in core-catcher.
Approximately 30.5 meters (100 feet) of 153.5 meters (503 feet) cored was gas hydrate-bearing as shown in Figure 6. These results validated the 3D seismic interpretation of the Mount Elbert prospect (Figures 3-4). During core retrieval to the surface, the core passes through the upper limit of the gas hydrate stability zone and any gas hydrate-bearing sediment begins to dissociate into gas and water. Therefore, the core is kept as cold as possible, and rapid processing of the core from the wireline retrieval from reservoir to surface at the rig floor, to the pipe shed, and to the processing and subsampling area helps preserve remaining gas hydrate within the core (Figures 8-16). Initial core processing was accomplished onsite, primarily to ensure that time and temperature-dependent measurements and subsamples were obtained before gas hydrate completely dissociated from the core. The core is scraped to reveal sediment beneath the rind of oil-based mud (Figure 12) to allow onsite description and choosing intervals for subsampling. Various subsamples are taken (Figure 13) for both time/temperature-dependent onsite analyses and for later offsite analyses.
Core temperature provides an indicator of gas hydrate presence (Figure 14). Over the first several minutes of onsite core processing, gas and water are actively dissociating from gas hydrate. This endothermic reaction cools the core and freezes the pore water. Samples of gas hydrate were placed into water (Figure 15-16); where gas hydrate is present, the water causes the gas to more actively dissociate from the hydrate. Headspace gas evolves and can be studied qualitatively in syringes (Figure 15) or in petri-dishes or cans (Figure 16). During and following subsampling, an onsite description of the core was completed. Certain subsamples were acquired for further onsite processing to determine the saturation and composition of pore waters (Figures 17-19). Coring with the oil-based drilling fluid also ensured that only natural pore waters were present within the core. Samples were scraped to obtain a cleaner sediment from the innermost portion of the core and placed into a press to squeeze pure pore waters from the sample for later laboratory analyses. A total of 261 total subsamples were processed onsite, primarily to preserve time and temperature dependent data. Eleven of these samples were preserved, four in methane-charged pressure vessels and seven in liquid nitrogen. Other samples were obtained for physical property measurements, petrophysics, water chemistry, thermal properties, and microbiological and organic geochemistry studies. Subsamples of the core will be analyzed at various labs. The remaining whole core is currently stored in freezers within a refrigerated unit at the ASRC Fabrication shop in Anchorage.
D. Gas Hydrate Wireline Logging Preliminary Results Obtaining high-quality open hole logs was a primary data
acquisition priority. Evaluation of these logs is in-progress. High-quality open hole logs were obtained, due in large part to the chilled, oil-based drilling fluids maintaining gas hydrate and borehole stability (Figure 7). A full suite of wireline logs was obtained, some with initial difficulties due to the cold (-1 degree C; 30 degree F) wellbore temperatures. Open-hole wireline logs acquired included gamma-ray, resistivity, neutron-density porosity, Dipole Sonic Acoustic porosity, Nuclear Magnetic Resonance, Formation Imaging, Electromagnetic Propagation, geochemical neutron activation logging, and caliper. As shown in Figure 6, the CMR logs were a direct indicator of gas hydrate saturation and helped in planning the Modular Dynamics Testing (MDT) wireline production test data acquisition.
Figure 7: DrillCool, Inc. Heat Exchange Mud Chilling Unit onsite at Mount Elbert-01 Ice Pad.

Institute of the North • Anchorage, Alaska • 1 907 771.2444 • [email protected]
www.arcticenergysummit.org
Figure 8: Core barrel inner liner separation in cold pipeshed processing area. Rig mats on pipe racks provided working surface.
Figure 9: Cutting inner core barrel into 3 foot core segments in pipeshed. Core end is visible lower left side of photo.
Figure 10: Transport of 3 foot core segments in lined box via forklift from pipeshed to core processing “cold” trailer.
Figure 11: Subsampling gas hydrate-bearing core in core processing “cold” trailer.

Institute of the North • Anchorage, Alaska • 1 907 771.2444 • [email protected]
www.arcticenergysummit.org
Figure 12: Core layout processing in “cold” trailer.
Figure 13: Foam inserts mark where core was subsampled for headspace gas, microbiology, interstitial water and physical properties.
Figure 14: Temperature probe testing used to show decreasing temperature with time during gas hydrate dissociation in hydrate-bearing core samples during onsite subsampling.
Figure 15: Gas hydrate-bearing sediment placed in syringe to monitor gas escape.

Institute of the North • Anchorage, Alaska • 1 907 771.2444 • [email protected]
www.arcticenergysummit.org
Figure 16: Gas hydrate-bearing samples in water bubble with gas escape.
Figure 17: Whole core sample is scraped to remove oil-based drilling mud contamination.
Figure 18: Cleaner innermost portion of core prior to placement into drill-press to remove formation water for later laboratory analyses.
Figure 19: Core press to obtain interstitial water samples.

Institute of the North • Anchorage, Alaska • 1 907 771.2444 • [email protected]
www.arcticenergysummit.org
E. Gas Hydrate Wireline Production Testing Results Following the major logging runs, the second major data priority was to perform extensive wireline production testing using the Modular Dynamics Testing (MDT) tool. Even though the MDT wireline production tests are small-scale, the results of these tests within two gas hydrate-bearing zones (Figure 6) are enabling a better understanding of the nature of gas hydrate dissociation, gas production, formation cooling, and long-term production test potential. The MDT tests were the first in the world open-hole, dual packer tests within gas hydrate-bearing sediments. The data acquired also included the first reservoir temperature measurements at the tool inlet using a small programmable capsule to measure time, temperature, and pressure (Figure 20) mounted to the tool within a screen welded to the tool (Figure 21).
The MDT program also obtained four gas samples and one pore water sample. Recorded observations indicated major formation cooling during gas hydrate dissociation and gas production during pressure draw-down. The response of the formation during shut-in and pressure build-up following production indicated that gas production during gas hydrate dissociation may have reduced formation permeability to flow, possibly due to the reformation of gas hydrate or formation of ice during the testing. An alternative under investigation involves potential gas storage effects within the
tool or borehole due to minimal produced gas. Analyses and modeling of these test results are underway. Primary MDT test intervals were selected after evaluation of the CMR log (Figure 6) and based on reservoir quality and fluid saturation criteria, resulting in the four primary zones-of-interest. Figures 22-23 illustrate typical MDT results from one of the four tested zones from onsite analyses by Steve Hancock, RPS-APA Engineering. MDT analyses and reservoir modeling history match studies are underway.
The preliminary results of MDT data acquisition are presented here as data analyses are still underway at the time of this writing. Reservoir modeling and history matching of MDT results are also in-progress. Figures 22-23 illustrate the 11-hour Zone C2 MDT test profiles with flow and build-up periods.
1) Zone C2 MDT test summary
• Planned longer duration test • First flow with Flowing Bottom Hole Pressure (FBHP) above hydrate stability pressure • Classic porous media response on first build-up • Second flow with FBHP below hydrate stability pressure
Figure 20: DSTmicro capsule data logger used to record time, temperature, and pressure during coring and during MDT logging operations. Data logger on right was destroyed during operations outside capsule pressure rating.
Data loggers inside Screen welded on pipe Screen
Uninflated MDT Packers
Figure 21: Photo of MDT tool with screen- mounted DSTmicro capsules welded to tool.

Institute of the North • Anchorage, Alaska • 1 907 771.2444 • [email protected]
www.arcticenergysummit.org
• Second build-up distinct/different from first build-up • Extended third flow with FBHP below hydrate stability pressure; third build-up severely dampened • 400 psi purposefully maintained in third flow period • Acquired gas sample • Fourth flow ended with no inflow
2) Miscellaneous MDT testing results
• Star-Oddi pressure and temperature logger data at MDT inlet to facilitate pressure/temperature match
• MDT probe tests of hydrate zones 621.5 Meters (2039 feet) and 619.4 Meters (2032 feet) failed due to lack of seal (soft water-bearing sediments) • MDT packer test of water zone at 620.6 Meters (2036 feet) failed due to inlet plugging (fines migration); noted declining pump performance • MDT packer test of water zone 613.3 Meters (2012 feet) failed: pump failed, sediment wear and plugging • MDT testing terminated (note extended initial testing in gas hydrate bearing zones enabled MDT tool to remain in-hole until testing terminated by probe and pump failures due primarily to anticipated fines migration
III. CONCLUSION The maximum gas hydrate saturation as calculated by the CMR and associated logs is approximately 75% (Figure 6). Data is still being analyzed, but preliminary results indicate that although there is some mobile water in the hydrate-bearing formation, it might not be enough to maintain dissociation of gas hydrate through depressurization alone by producing the mobile water component. The pressure build-up periods during MDT testing were extensive (up to 12 hours) and the abnormal build-ups after drawdown below gas hydrate stability pressure suggest that gas production from gas hydrate at these temperatures closer to the base permafrost may not be sustainable over a potential future long-term production test without thermal and/or chemical stimulation. However, it needs to be emphasized that this is only a single well location, and that alternate cases could be considered at higher temperatures and/or where conditions could better allow unstimulated production. The C2 MDT test shown in the annotated graph (Figure 24) demonstrates that the formation response to initial drawdown is typical of porous media (albeit tight formation) response when pressures were maintained above the gas hydrate stability zone; this initial drawdown shows where only free connate water was flowing. However, once pressures were allowed to draw-down below the gas hydrate stability zone to induce gas (and water) dissociation, the following two shut-in periods show an abnormal pressure rebound. Causes of this abnormality remain under investigation, but may be associated with reformation of hydrate or possibly the formation of ice within the porous media. Future field operations, including potential long-term production testing, are under consideration. Importantly, analyses of the stratigraphic test core, log, and MDT data will also help us better understand reservoir properties,
0
250
500
750
1000
1250
1500
1750
0.00 2.00 4.00 6.00 8.00 10.00 12.00
Test Time, hours
FBH
P, p
si
Initial Hydrostatic
End 2nd Build-up97.6 min
End 2nd Flow15.7 min
End 1st Build-up39.8 min
End 1st Flow15.5 min
Packer Set
Gas SampleEvent
FinalHydrostatic
End 3rd Flow116.9 min
End 4th Build-up60.7 min
End 4th Flow14.2 min
End 3rd Build-up266.4 min
Figure 22: MDT test pressures, flow, and build-up periods in gas hydrate-bearing zone C2
0
250
500
750
1000
1250
1500
1750
2000
0.0 1.0 2.0 3.0 4.0 5.0 6.0 7.0 8.0 9.0 10.0 11.0 12.0
Test Time, hours
FBH
P, p
si
30.0
31.0
32.0
33.0
34.0
35.0
36.0
37.0
38.0
FBH
T, o F
FBHPHSP @ FBHTHSP @ FBHT-3FFBHT
Figure 23: MDT test pressures and temperatures in gas hydrate-bearing zone C2

Institute of the North • Anchorage, Alaska • 1 907 771.2444 • [email protected]
www.arcticenergysummit.org
permeabilities and saturations. These variables are very leveraging to understanding potential gas producibility from gas hydrate-bearing reservoirs and to design, assessment, and planning of potential future production test operations.
ACKNOWLEDGMENT This project builds upon the accomplishments of many
prior government, academic, and industry studies. DOE and BPXA support of this research is gratefully acknowledged. DOE National Energy Technology Lab (NETL) staff Brad Tomer, Richard Baker, Tom Mroz, and others have enabled continuation of this and associated research. Stratigraphic test well planning and field operations efforts of BPXA staff Scott Digert, Micaela Weeks, Larry Vendl, Dennis Urban, Dan Kara, Paul Hanson, and others led to successful well operations and data acquisition. State of Alaska Department of Natural Resources led by Dr. Mark Myers, Bob Swenson, Paul Decker, and others actively supported the Methane Hydrate Act of 2005 to enable continued project funding. Seismic studies accomplished by Tanya Inks at Interpretation Services, Inc. and by USGS scientists Tim Collett, Myung Lee, Warren Agena, and David Taylor identified MPU gas hydrate prospects. Field operations and wellsite support by USGS staff Bill Winters, Bill Waite, and Tom Lorenson; NETL staff Kelly Rose and Eilis Rosenbaum; Oregon State University staff Marta Torres and Rick Colwell; and Steve Hancock of RPS-APA Energy is gratefully acknowledged. Steve Hancock and Schlumberger’s Peter Weinheber helped design the wireline testing program. Reservoir models benefited from initial studies by the University of Calgary (Dr.
Pooladi-Darvish and Dr. Huifang Hong) and the University of Alaska Fairbanks (Dr. Shirish Patil and Dr. Abhijit Dandekar) The University of Arizona reservoir characterization studies led by Dr. Bob Casavant with Dr. Karl Glass, Ken Mallon, Dr. Roy Johnson, and Dr. Mary Poulton have described the structural and stratigraphic architecture of the ANS Sagavanirktok formation gas hydrate-bearing reservoir sands.
DISCLAIMER This paper was prepared as an account of work sponsored
by an agency of the United States Government. Neither the United States Government nor any agency thereof, nor any of their employees, makes any warranty, express or implied, or assumes any legal liability or responsibility for the accuracy, completeness, or usefulness of any information, apparatus, product, or process disclosed, or represents that its use would not infringe privately owned rights. Reference herein to any specific commercial product, process, or service by trade name, trademark, manufacturer, or otherwise does not necessarily constitute or imply its endorsement, recommendation, or favoring by the United States Government or any agency thereof. The views and opinions of authors expressed herein do not necessarily state or reflect those of the United States Government or any agency thereof nor of BP Exploration (Alaska) Inc.
REFERENCES [1] Collett, T.S., 1993, Natural gas hydrates of the Prudhoe Bay and
Kuparuk River area, North Slope, Alaska: American Association of Petroleum Geologists Bulletin 77/5, p. 793-812.
[2] Collett, T.S., 2004, Alaska North Slope Gas Hydrate Energy Resources: U.S. Geological Survey Open-File Report 2004-1454, 7 p.
0
250
500
750
1000
1250
1500
1750
0.00 2.00 4.00 6.00 8.00 10.00 12.00
Test Time, hours
FBH
P, p
si
Initial Hydrostatic
End 2nd Build-up97.6 min
End 2nd Flow15.7 min
End 1st Build-up39.8 min
End 1st Flow15.5 min
Packer Set
Gas SampleEvent
FinalHydrostatic
Estimated Hydrate Stability Pressure
End 3rd Flow116.9 min
End 4th Build-up60.7 min
End 4th Flow14.2 min
End 3rd Build-up266.4 min
Tight Porous Media Response above Stability Pressures
Abnormal Porous Media Response; Drawdown below Stability Pressures
Figure 24: C2 MDT test preliminary interpretations.