Embed Size (px)
Citation preview
ALASKA PERFORMANCE
SCHOLARSHIPOUTCOMES REPORT 2015
Alaska Commission on Postsecondary EducationAlaska Department of Education & Early DevelopmentAlaska Department of Labor and Workforce DevelopmentUniversity of Alaska
By Brian RaePrincipal ResearcherAlaska Commission on Postsecondary Education
A N S W E R S
Respectfully Presented to the Alaska Legislature, Governor and Public by the ANSWERS Partner Organizations

Version 2/02/2015 11:30a
TABLE OF CONTENTS
EXECUTIVE SUMMARY...........................................................................................................................................................................1
ALASKA PERFORMANCE SCHOLARSHIP STATISTICS AT A GLANCE ...........................................................................................2
ALASKA PERFORMANCE SCHOLARSHIP FOURTH ANNUAL OUTCOMES REPORT ....................................................................3
A New Focus – Distinguishing Standard Versus Career & Technical Education APS Eligibility ...........................................4
CHARACTERISTICS OF ALASKA’S HIGH SCHOOL GRADUATES IN AY14......................................................................................6
APS Eligibility and Use by Geographic Areas .................................................................................................................................6
Exhibit 1: Percentage of AY14 Public High School Graduates, APS Eligibility and Use by Region, Fall Following Graduation ............................................................................................................................................6
Exhibit 2: Percentage of AY14 and AY11 Public High School Graduates, Standard APS Eligibility and Use by Region, Fall Following Graduation ............................................................................................................................................7
Exhibit 3: AY14 APS Eligibility and Use by District / Region .....................................................................................................9
APS Eligibility and Use by Graduates’ Characteristics ................................................................................................................11
Exhibit 4: Standard APS-Eligible Public High School Graduates, Percentage of Eligible and Recipients by Ethnicity, Race and Gender, AY11-AY14 and Four-Year Averages ...................................................................................12
APS Eligibility and Use by Scholarship Award Level and Postsecondary Institution Location ............................................13
Exhibit 5: Standard APS Eligibility by Award Level and Graduation Year ............................................................................13
Exhibit 6: AY14 and AY11 Standard APS-Eligible Public High School Graduates by Award Level, Recipients Fall Following Graduation .........................................................................................................................................14
Exhibit 7: AY14 Public High School Graduates’ In-State and Out-of-State Attendance Patterns by Standard APS Eligibility and Award Levels, Fall 2014 .........................................................................................................16
Exhibit 8: AY11 Public High School Graduates’ In-State and Out-of-State Attendance Patterns by Standard APS Eligibility and Award Levels, Fall 2011 .........................................................................................................16
APS Recipients’ Attendance Patterns ............................................................................................................................................17
Exhibit 9: APS Recipients and Postsecondary Attendance in Fall 2014 by Institution and Graduating Year, Public and Private/Homeschooled ...............................................................................17
Exhibit 10: APS Expenditures by Students’ Degree/Certificate Pursuit, Fall 2014 Awards ...............................................18
Exhibit 11: APS Expenditures by Students’ Award Levels, Fall 2014 Awards ......................................................................19
COMPARING ELIGIBILITY TYPES – STANDARD AND CTE APS-ELIGIBLE GRADUATES .........................................................20
Exhibit 12: WorkKeys-based Eligibility by High School Graduation Year, Percentage of Total Eligible Graduates .....21
Exhibit 13: AY14 Public High School Graduates, Standard and CTE APS-Eligible and Recipients by Ethnicity and Gender ................................................................................................................................................................22
Exhibit 14: AY14 CTE APS-Eligible Graduates Reported As Enrolled, Fall 2014 ...................................................................23
THE INAUGURAL CLASS OF AY11 – PURSUIT AND PERSISTENCE..............................................................................................24
Exhibit 15: Retention of AY11 Public High School Graduates Attending a Postsecondary Institution in Alaska the Fall Following Graduation by APS Eligibility ..............................................................................................................................24
Exhibit 16: Retention of AY11 Public High School Graduates Attending a Postsecondary Institution Outside Alaska the Fall Following Graduation by APS Eligibility ........................................................................................................................25
Exhibit 17: Retention of AY11 Public High School Graduates Not Enrolled the Fall Following Graduation by APS Eligibility .............................................................................................................................................................................26
Exhibit 18: Fall 2011 APS Recipients and Continued Attendance by Various Attributes ...................................................28
APS RECIPIENTS ATTENDING THE UNIVERSITY OF ALASKA ......................................................................................................29
Exhibit 19: UA First-Time Freshmen in Fall 2014 Taking Remedial Courses .........................................................................29
Exhibit 20: High School Graduates Pursuing Postsecondary Education at UA within One Year of Graduation ...........30
Exhibit 21: Average Credit Hours Attempted in AY12, AY13 and AY14 for APS Recipients and Other First-Time Freshmen ...........................................................................................................................................................32
Exhibit 22: College Persistence of Students Entering in Fall 2011 and Fall 2012 .................................................................34
Exhibit 23: APS Recipients Who Have Completed a Degree or Certificate .........................................................................35
APS RECIPIENTS’ EMPLOYMENT AND EARNING PATTERNS WHILE IN SCHOOL ...................................................................36
Exhibit 24: AY13 High School Graduates Receiving APS Award Enrolled Full-time in AY14, Percentage Working at Any Time During Academic Year, by Award Level ........................................................................36
Exhibit 25: AY13 High School Graduates Receiving APS Award Enrolled Full-time in AY14, Percentage Working in Four Quarters During Academic Year, by Award Level ................................................................37
Exhibit 26: AY13 High School Graduates Receiving APS Award In Fall 2014, Average Earnings for Those Working in Four Quarters During Academic Year, By Award Level ...................................38
CONCLUSION..........................................................................................................................................................................................39
APPENDIX A : Data Sources for the 2015 APS Outcomes Report .................................................................................................40
APPENDIX B : Determining APS Eligibility.........................................................................................................................................41
APPENDIX C : Participating APS Institutions and Programs of Study ..........................................................................................43
APPENDIX D : AY14 Alaska Public High School Graduates Attending Postsecondary Education by State Where Enrolled .......................................................................................................................................................................46
APPENDIX E : Glossary .........................................................................................................................................................................47
APPENDIX F : Alaska Regions Referenced in the APS Report.......................................................................................................49
ACKNOWLEDGEMENTS .......................................................................................................................................................................50
ALASKA PERFORMANCE SCHOLARSHIP OUTCOMES REPORT | 20151 SUMMARY
A N S W E R S
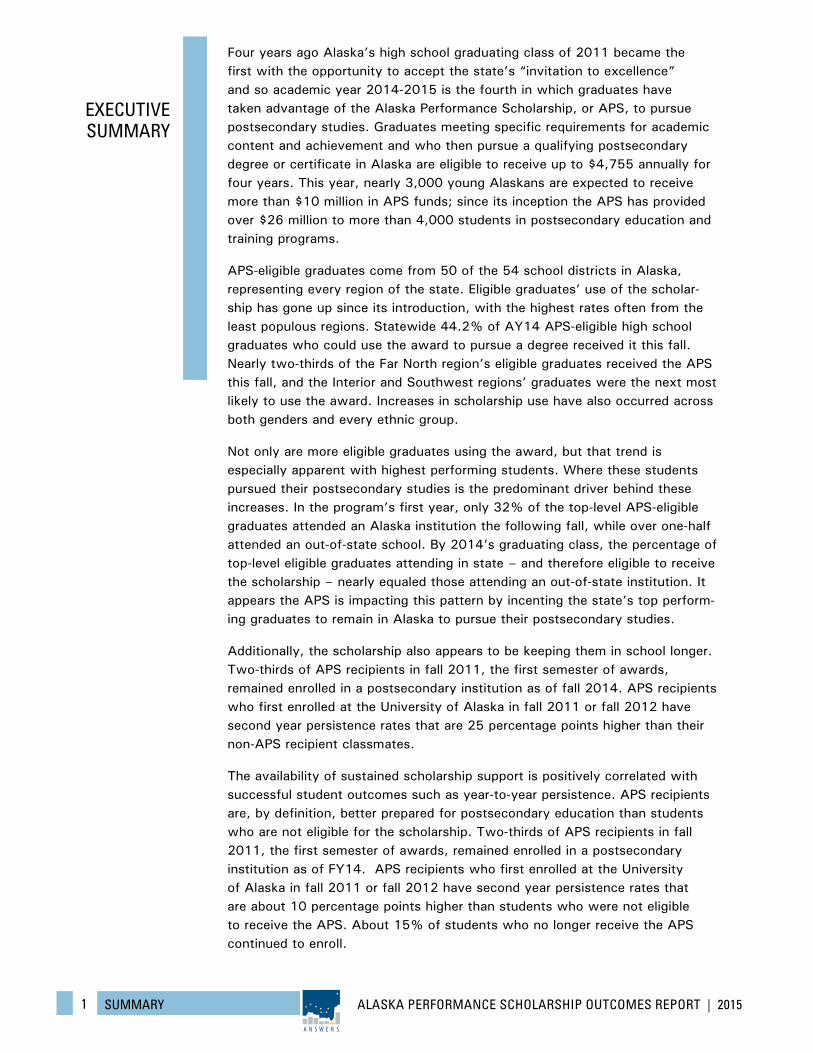
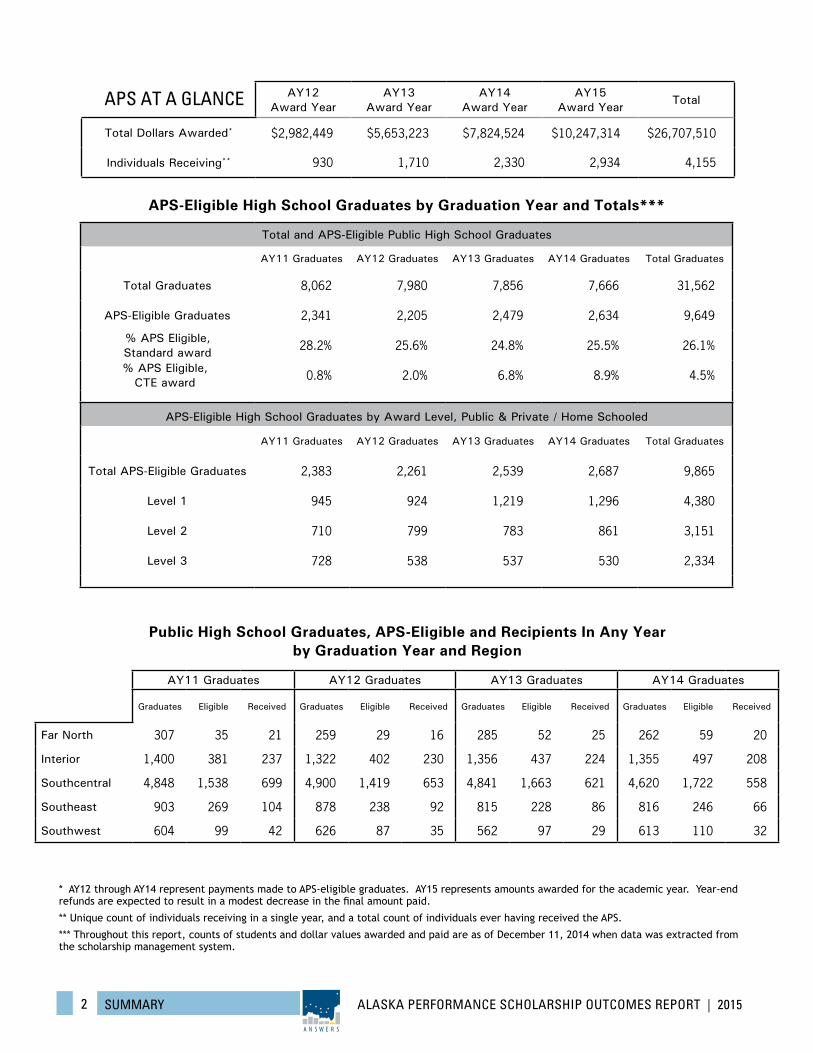
Four years ago Alaska’s high school graduating class of 2011 became the first with the opportunity to accept the state’s “invitation to excellence” and so academic year 2014-2015 is the fourth in which graduates have taken advantage of the Alaska Performance Scholarship, or APS, to pursue postsecondary studies. Graduates meeting specific requirements for academic content and achievement and who then pursue a qualifying postsecondary degree or certificate in Alaska are eligible to receive up to $4,755 annually for four years. This year, nearly 3,000 young Alaskans are expected to receive more than $10 million in APS funds; since its inception the APS has provided over $26 million to more than 4,000 students in postsecondary education and training programs.
APS-eligible graduates come from 50 of the 54 school districts in Alaska, representing every region of the state. Eligible graduates’ use of the scholar-ship has gone up since its introduction, with the highest rates often from the least populous regions. Statewide 44.2% of AY14 APS-eligible high school graduates who could use the award to pursue a degree received it this fall. Nearly two-thirds of the Far North region’s eligible graduates received the APS this fall, and the Interior and Southwest regions’ graduates were the next most likely to use the award. Increases in scholarship use have also occurred across both genders and every ethnic group.
Not only are more eligible graduates using the award, but that trend is especially apparent with highest performing students. Where these students pursued their postsecondary studies is the predominant driver behind these increases. In the program’s first year, only 32% of the top-level APS-eligible graduates attended an Alaska institution the following fall, while over one-half attended an out-of-state school. By 2014’s graduating class, the percentage of top-level eligible graduates attending in state – and therefore eligible to receive the scholarship – nearly equaled those attending an out-of-state institution. It appears the APS is impacting this pattern by incenting the state’s top perform-ing graduates to remain in Alaska to pursue their postsecondary studies.
Additionally, the scholarship also appears to be keeping them in school longer. Two-thirds of APS recipients in fall 2011, the first semester of awards, remained enrolled in a postsecondary institution as of fall 2014. APS recipients who first enrolled at the University of Alaska in fall 2011 or fall 2012 have second year persistence rates that are 25 percentage points higher than their non-APS recipient classmates.
The availability of sustained scholarship support is positively correlated with successful student outcomes such as year-to-year persistence. APS recipients are, by definition, better prepared for postsecondary education than students who are not eligible for the scholarship. Two-thirds of APS recipients in fall 2011, the first semester of awards, remained enrolled in a postsecondary institution as of FY14. APS recipients who first enrolled at the University of Alaska in fall 2011 or fall 2012 have second year persistence rates that are about 10 percentage points higher than students who were not eligible to receive the APS. About 15% of students who no longer receive the APS continued to enroll.
EXECUTIVE SUMMARY
ALASKA PERFORMANCE SCHOLARSHIP OUTCOMES REPORT | 20152 SUMMARY
A N S W E R S
Total and APS-Eligible Public High School Graduates
AY11 Graduates AY12 Graduates AY13 Graduates AY14 Graduates Total Graduates
Total Graduates 8,062 7,980 7,856 7,666 31,562
APS-Eligible Graduates 2,341 2,205 2,479 2,634 9,649
% APS Eligible, Standard award 28.2% 25.6% 24.8% 25.5% 26.1%
% APS Eligible, CTE award 0.8% 2.0% 6.8% 8.9% 4.5%
APS-Eligible High School Graduates by Award Level, Public & Private / Home Schooled
AY11 Graduates AY12 Graduates AY13 Graduates AY14 Graduates Total Graduates
Total APS-Eligible Graduates 2,383 2,261 2,539 2,687 9,865
Level 1 945 924 1,219 1,296 4,380
Level 2 710 799 783 861 3,151
Level 3 728 538 537 530 2,334
APS AT A GLANCE
* AY12 through AY14 represent payments made to APS-eligible graduates. AY15 represents amounts awarded for the academic year. Year-end refunds are expected to result in a modest decrease in the final amount paid.
** Unique count of individuals receiving in a single year, and a total count of individuals ever having received the APS.
*** Throughout this report, counts of students and dollar values awarded and paid are as of December 11, 2014 when data was extracted from the scholarship management system.
AY11 Graduates AY12 Graduates AY13 Graduates AY14 Graduates
Graduates Eligible Received Graduates Eligible Received Graduates Eligible Received Graduates Eligible Received
Far North 307 35 21 259 29 16 285 52 25 262 59 20
Interior 1,400 381 237 1,322 402 230 1,356 437 224 1,355 497 208
Southcentral 4,848 1,538 699 4,900 1,419 653 4,841 1,663 621 4,620 1,722 558
Southeast 903 269 104 878 238 92 815 228 86 816 246 66
Southwest 604 99 42 626 87 35 562 97 29 613 110 32
AY12 Award Year
AY13 Award Year
AY14 Award Year
AY15 Award Year
Total
Total Dollars Awarded* $2,982,449 $5,653,223 $7,824,524 $10,247,314 $26,707,510
Individuals Receiving** 930 1,710 2,330 2,934 4,155
APS-Eligible High School Graduates by Graduation Year and Totals***
Public High School Graduates, APS-Eligible and Recipients In Any Year by Graduation Year and Region
ALASKA PERFORMANCE SCHOLARSHIP OUTCOMES REPORT | 20153 INTRODUCTION
A N S W E R S
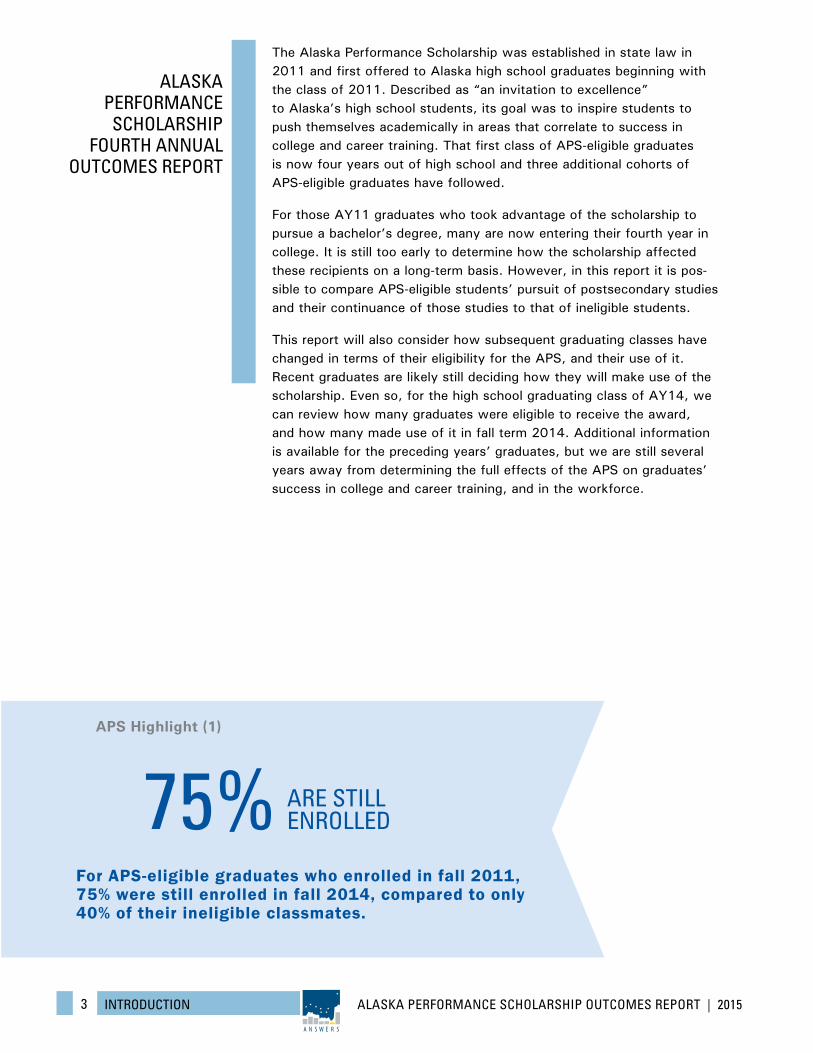
The Alaska Performance Scholarship was established in state law in 2011 and first offered to Alaska high school graduates beginning with the class of 2011. Described as “an invitation to excellence” to Alaska’s high school students, its goal was to inspire students to push themselves academically in areas that correlate to success in college and career training. That first class of APS-eligible graduates is now four years out of high school and three additional cohorts of APS-eligible graduates have followed.
For those AY11 graduates who took advantage of the scholarship to pursue a bachelor’s degree, many are now entering their fourth year in college. It is still too early to determine how the scholarship affected these recipients on a long-term basis. However, in this report it is pos-sible to compare APS-eligible students’ pursuit of postsecondary studies and their continuance of those studies to that of ineligible students.
This report will also consider how subsequent graduating classes have changed in terms of their eligibility for the APS, and their use of it. Recent graduates are likely still deciding how they will make use of the scholarship. Even so, for the high school graduating class of AY14, we can review how many graduates were eligible to receive the award, and how many made use of it in fall term 2014. Additional information is available for the preceding years’ graduates, but we are still several years away from determining the full effects of the APS on graduates’ success in college and career training, and in the workforce.
ALASKA PERFORMANCE
SCHOLARSHIP FOURTH ANNUAL
OUTCOMES REPORT
For APS-eligible graduates who enrolled in fall 2011, 75% were still enrolled in fall 2014, compared to only 40% of their ineligible classmates.
APS Highlight (1)
75% ARE STILL ENROLLED
ALASKA PERFORMANCE SCHOLARSHIP OUTCOMES REPORT | 20154 INTRODUCTION
A N S W E R S
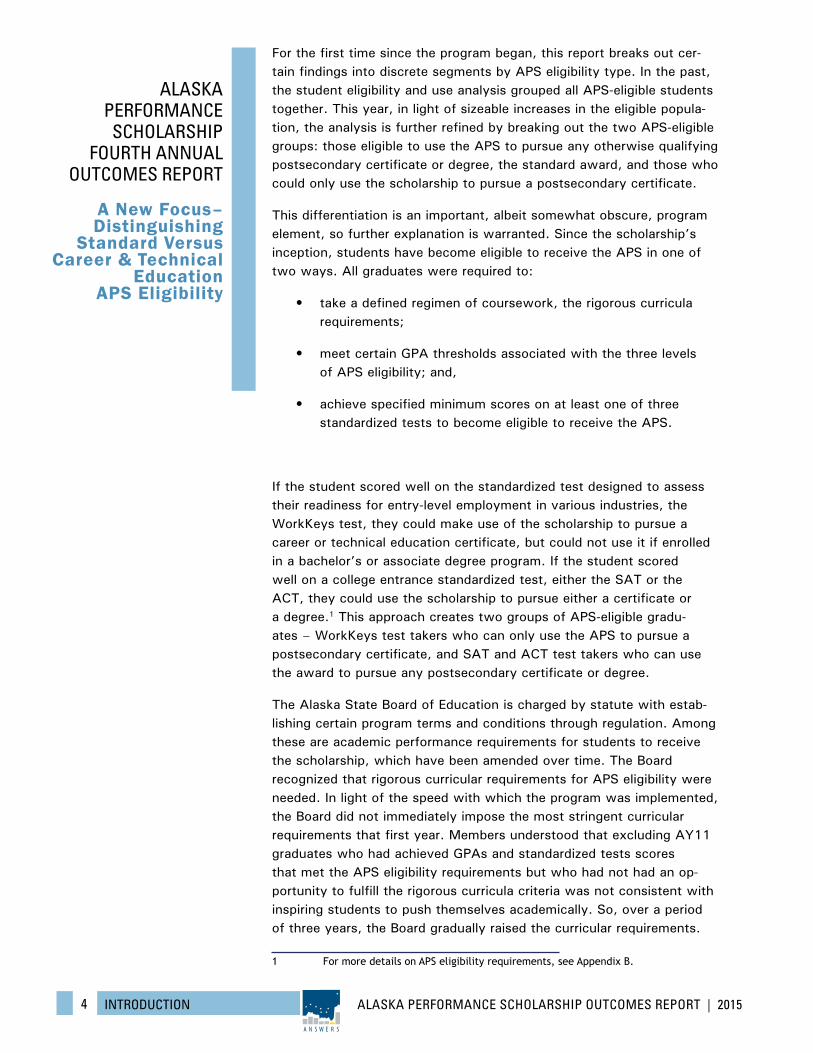
For the first time since the program began, this report breaks out cer-tain findings into discrete segments by APS eligibility type. In the past, the student eligibility and use analysis grouped all APS-eligible students together. This year, in light of sizeable increases in the eligible popula-tion, the analysis is further refined by breaking out the two APS-eligible groups: those eligible to use the APS to pursue any otherwise qualifying postsecondary certificate or degree, the standard award, and those who could only use the scholarship to pursue a postsecondary certificate.
This differentiation is an important, albeit somewhat obscure, program element, so further explanation is warranted. Since the scholarship’s inception, students have become eligible to receive the APS in one of two ways. All graduates were required to:
• take a defined regimen of coursework, the rigorous curricula requirements;
• meet certain GPA thresholds associated with the three levels of APS eligibility; and,
• achieve specified minimum scores on at least one of three standardized tests to become eligible to receive the APS.
If the student scored well on the standardized test designed to assess their readiness for entry-level employment in various industries, the WorkKeys test, they could make use of the scholarship to pursue a career or technical education certificate, but could not use it if enrolled in a bachelor’s or associate degree program. If the student scored well on a college entrance standardized test, either the SAT or the ACT, they could use the scholarship to pursue either a certificate or a degree.1 This approach creates two groups of APS-eligible gradu-ates – WorkKeys test takers who can only use the APS to pursue a postsecondary certificate, and SAT and ACT test takers who can use the award to pursue any postsecondary certificate or degree.
The Alaska State Board of Education is charged by statute with estab-lishing certain program terms and conditions through regulation. Among these are academic performance requirements for students to receive the scholarship, which have been amended over time. The Board recognized that rigorous curricular requirements for APS eligibility were needed. In light of the speed with which the program was implemented, the Board did not immediately impose the most stringent curricular requirements that first year. Members understood that excluding AY11 graduates who had achieved GPAs and standardized tests scores that met the APS eligibility requirements but who had not had an op-portunity to fulfill the rigorous curricula criteria was not consistent with inspiring students to push themselves academically. So, over a period of three years, the Board gradually raised the curricular requirements.
1 For more details on APS eligibility requirements, see Appendix B.
ALASKA PERFORMANCE
SCHOLARSHIP FOURTH ANNUAL
OUTCOMES REPORT
A New Focus– Distinguishing
Standard Versus Career & Technical
Education APS Eligibility
ALASKA PERFORMANCE SCHOLARSHIP OUTCOMES REPORT | 20155 INTRODUCTION
A N S W E R S
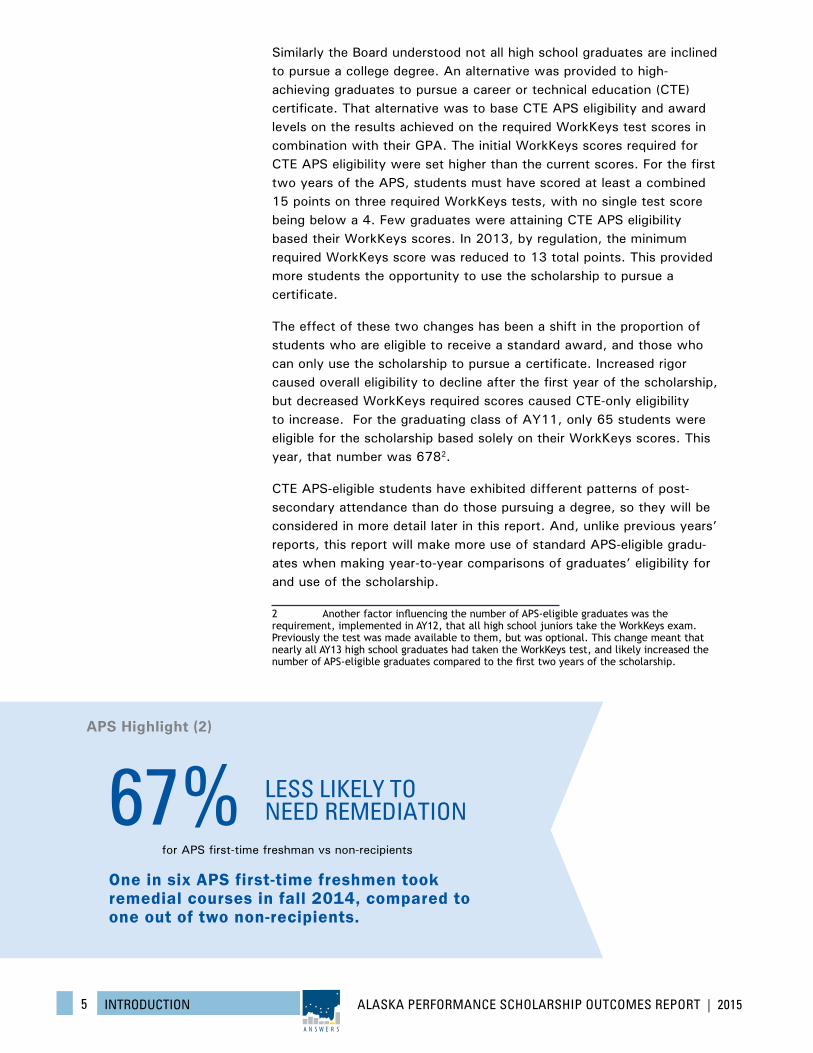
Similarly the Board understood not all high school graduates are inclined to pursue a college degree. An alternative was provided to high-achieving graduates to pursue a career or technical education (CTE) certificate. That alternative was to base CTE APS eligibility and award levels on the results achieved on the required WorkKeys test scores in combination with their GPA. The initial WorkKeys scores required for CTE APS eligibility were set higher than the current scores. For the first two years of the APS, students must have scored at least a combined 15 points on three required WorkKeys tests, with no single test score being below a 4. Few graduates were attaining CTE APS eligibility based their WorkKeys scores. In 2013, by regulation, the minimum required WorkKeys score was reduced to 13 total points. This provided more students the opportunity to use the scholarship to pursue a certificate.
The effect of these two changes has been a shift in the proportion of students who are eligible to receive a standard award, and those who can only use the scholarship to pursue a certificate. Increased rigor caused overall eligibility to decline after the first year of the scholarship, but decreased WorkKeys required scores caused CTE-only eligibility to increase. For the graduating class of AY11, only 65 students were eligible for the scholarship based solely on their WorkKeys scores. This year, that number was 6782.
CTE APS-eligible students have exhibited different patterns of post-secondary attendance than do those pursuing a degree, so they will be considered in more detail later in this report. And, unlike previous years’ reports, this report will make more use of standard APS-eligible gradu-ates when making year-to-year comparisons of graduates’ eligibility for and use of the scholarship.
2 Another factor influencing the number of APS-eligible graduates was the requirement, implemented in AY12, that all high school juniors take the WorkKeys exam. Previously the test was made available to them, but was optional. This change meant that nearly all AY13 high school graduates had taken the WorkKeys test, and likely increased the number of APS-eligible graduates compared to the first two years of the scholarship.
One in six APS first-time freshmen took remedial courses in fall 2014, compared to one out of two non-recipients.
APS Highlight (2)
LESS LIKELY TO NEED REMEDIATION
for APS first-time freshman vs non-recipients
67%
ALASKA PERFORMANCE SCHOLARSHIP OUTCOMES REPORT | 20156 CHARACTERISTICS
A N S W E R S
EXHIBIT 1
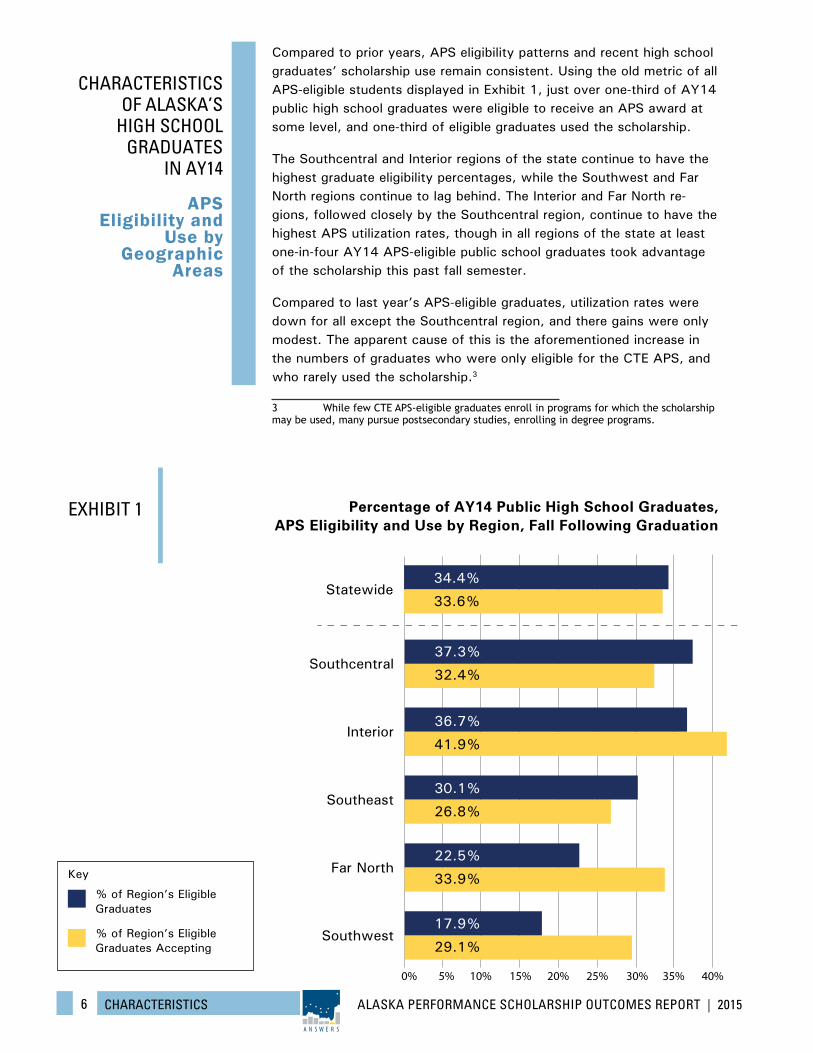
Compared to prior years, APS eligibility patterns and recent high school graduates’ scholarship use remain consistent. Using the old metric of all APS-eligible students displayed in Exhibit 1, just over one-third of AY14 public high school graduates were eligible to receive an APS award at some level, and one-third of eligible graduates used the scholarship.
The Southcentral and Interior regions of the state continue to have the highest graduate eligibility percentages, while the Southwest and Far North regions continue to lag behind. The Interior and Far North re-gions, followed closely by the Southcentral region, continue to have the highest APS utilization rates, though in all regions of the state at least one-in-four AY14 APS-eligible public school graduates took advantage of the scholarship this past fall semester.
Compared to last year’s APS-eligible graduates, utilization rates were down for all except the Southcentral region, and there gains were only modest. The apparent cause of this is the aforementioned increase in the numbers of graduates who were only eligible for the CTE APS, and who rarely used the scholarship.3
3 While few CTE APS-eligible graduates enroll in programs for which the scholarship may be used, many pursue postsecondary studies, enrolling in degree programs.
CHARACTERISTICS OF ALASKA’S
HIGH SCHOOL GRADUATES
IN AY14
APS Eligibility and
Use by Geographic
Areas
45%40%35%30%25%20%15%10%5%0%
Far North33.9%
22.5%
Interior41.9%
36.7%
Southwest29.1%
17.9%
Southcentral32.4%
37.3%
Southeast26.8%
30.1%
Statewide33.6%
34.4%
Percentage of AY14 Public High School Graduates, APS Eligibility and Use by Region, Fall Following Graduation
% of Region’s Eligible Graduates
Key
% of Region’s Eligible Graduates Accepting
ALASKA PERFORMANCE SCHOLARSHIP OUTCOMES REPORT | 20157 CHARACTERISTICS
A N S W E R S
EXHIBIT 2 Percentage of AY14 and AY11 Public High School Graduates, Standard APS Eligibility and Use by Region,
Fall Following Graduation
% of Region’s Collegiate Eligible Graduates
Key
% of Region’s Collegiate Eligible Graduates Accepting
50% 55%45%40% 65% 70%60%35%30%25%20%15%10%5%0%
50% 55%45%40% 65% 70%60%35%30%25%20%15%10%5%0%
Statewide
AY14
AY11
31.3%
13.7%
Southwest
44.9%
11.3%AY14
AY11
Southeast
33.0%
24.5%
29.6%
28.0%
AY14
AY11
Southcentral
42.5%
28.0%
34.3%
31.5%
AY14
AY11
Interior
54.6%
27.2%
51.9%
27.0%
AY14
AY11
51.5%
10.7%
Far North
64.3%
10.7%AY14
AY11
44.2%
25.5%
36.8%
28.2%
ALASKA PERFORMANCE SCHOLARSHIP OUTCOMES REPORT | 20158 CHARACTERISTICS
A N S W E R S
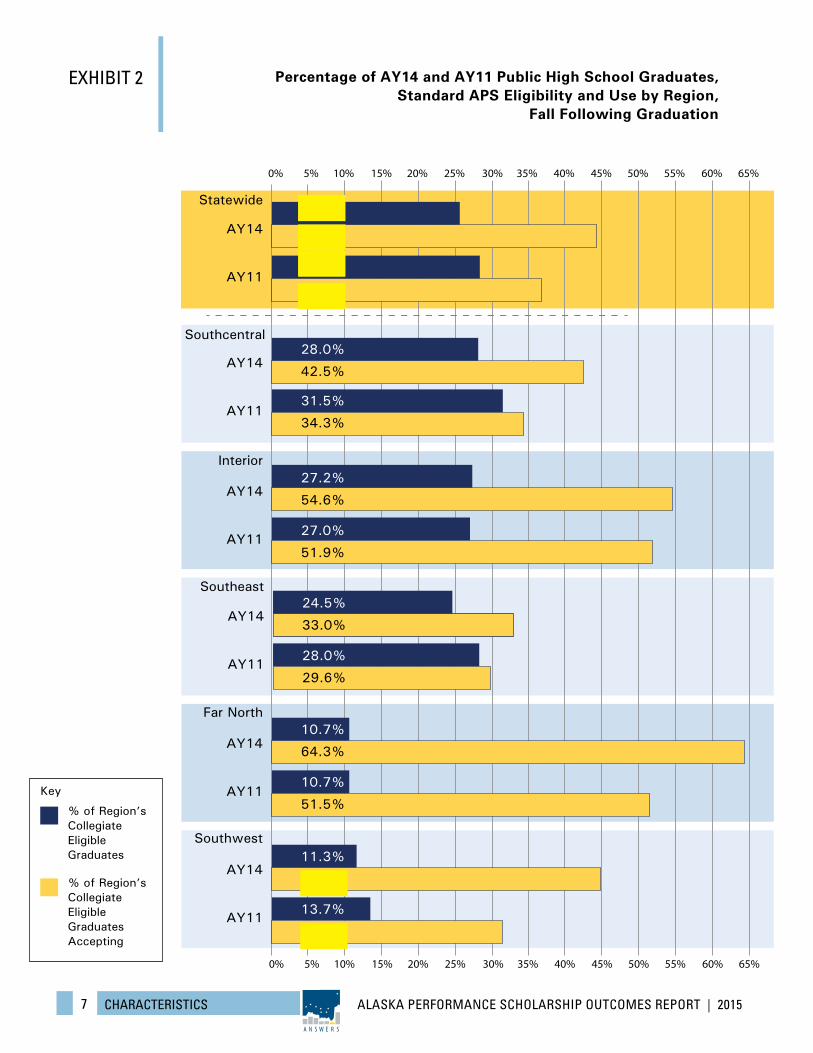
As noted, Exhibit 1 includes all APS-eligible graduates. That was not the case for AY14 graduates who achieved a standard APS award, meaning they could pursue either a degree or a certificate program and receive the scholarship: eligibility rates are much lower, and utilization rates much higher for standard APS-eligible graduates. (See Exhibit 2, AY14 data.) Eligibility dropped from one-in-three graduates to one-in-four, but utilization increased for this subset of APS-eligible graduates to over 44%.
By recompiling the data from the first APS Outcomes Report to include only standard APS-eligible graduates, we can compare eligibility and utilization rates over time. (See Exhibit 2, AY11 data.) There has been a small decline in the percentage of AY14 stan-dard APS-eligible graduates compared to the AY11 graduating class. Statewide 28.2% of AY11 graduates were eligible for a standard scholarship, falling to 25.5% for AY14 graduates. This may be based on the increased rigor of curricula required of the AY14 graduating class, though students’ transcript data needed to determine the full impact of changing curricular requirements on APS eligibility is unavailable. Only 36.8% of eligible AY11 graduates used the scholarship the fall following graduation, compared to 44.2% of AY14 eligible graduates.
Standard APS eligibility in the Far North and Interior regions barely changed since the beginning of the program, while the Southcentral and Southeast regions saw the largest declines in standard eligibility rates. There the declines were largely offset by the percentage increases of APS-eligible students who did use the scholarship. The Southwest region saw its APS utilization rate go from 31.3% to 44.9%, meaning nearly one-half of standard APS-eligible students in that region pursued a degree and received an APS award the fall after graduation. The Far North region saw a gain of 12.8 percentage points in the scholarship’s utilization, where nearly two-in-three APS-eligible students used their scholarship. All other regions saw smaller, though still positive, changes in their students’ utilization rates.
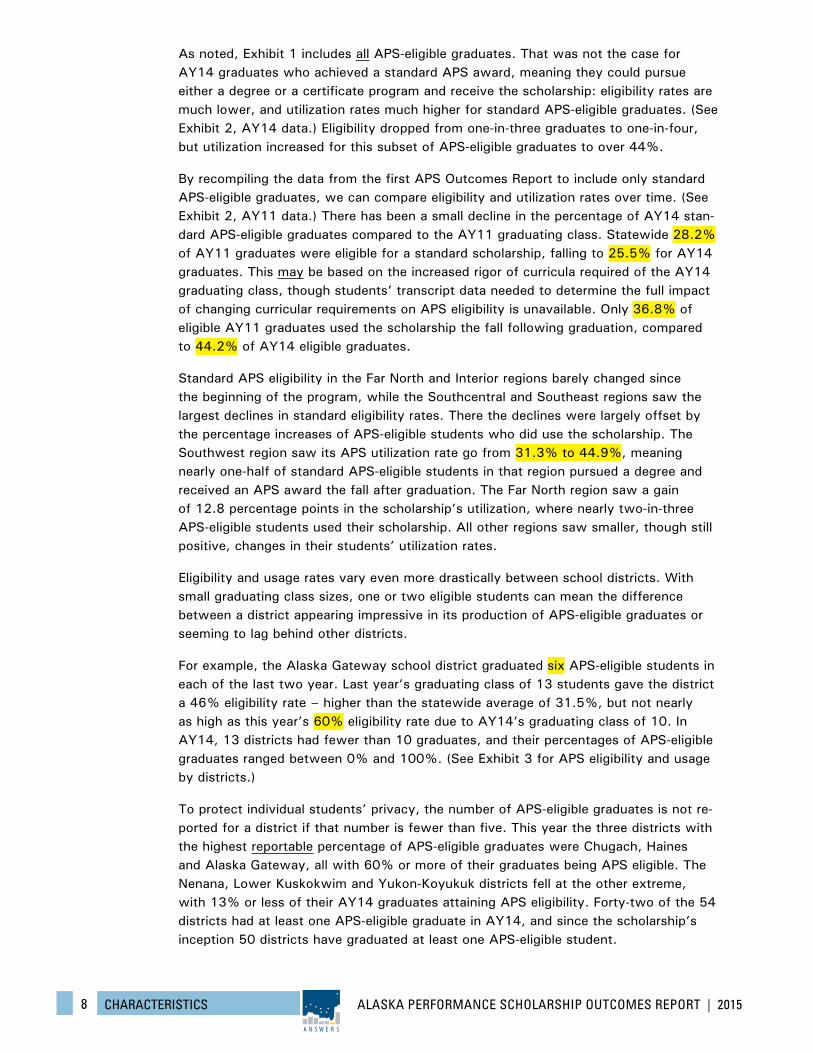
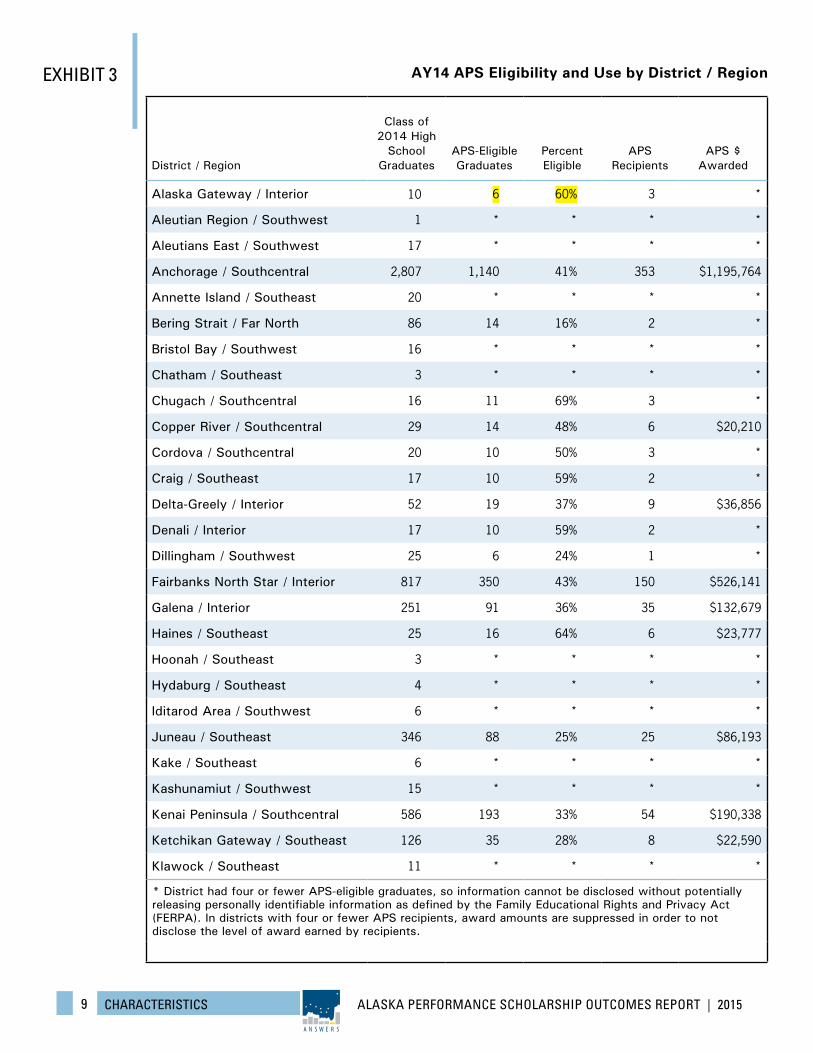
Eligibility and usage rates vary even more drastically between school districts. With small graduating class sizes, one or two eligible students can mean the difference between a district appearing impressive in its production of APS-eligible graduates or seeming to lag behind other districts.
For example, the Alaska Gateway school district graduated six APS-eligible students in each of the last two year. Last year’s graduating class of 13 students gave the district a 46% eligibility rate – higher than the statewide average of 31.5%, but not nearly as high as this year’s 60% eligibility rate due to AY14’s graduating class of 10. In AY14, 13 districts had fewer than 10 graduates, and their percentages of APS-eligible graduates ranged between 0% and 100%. (See Exhibit 3 for APS eligibility and usage by districts.)
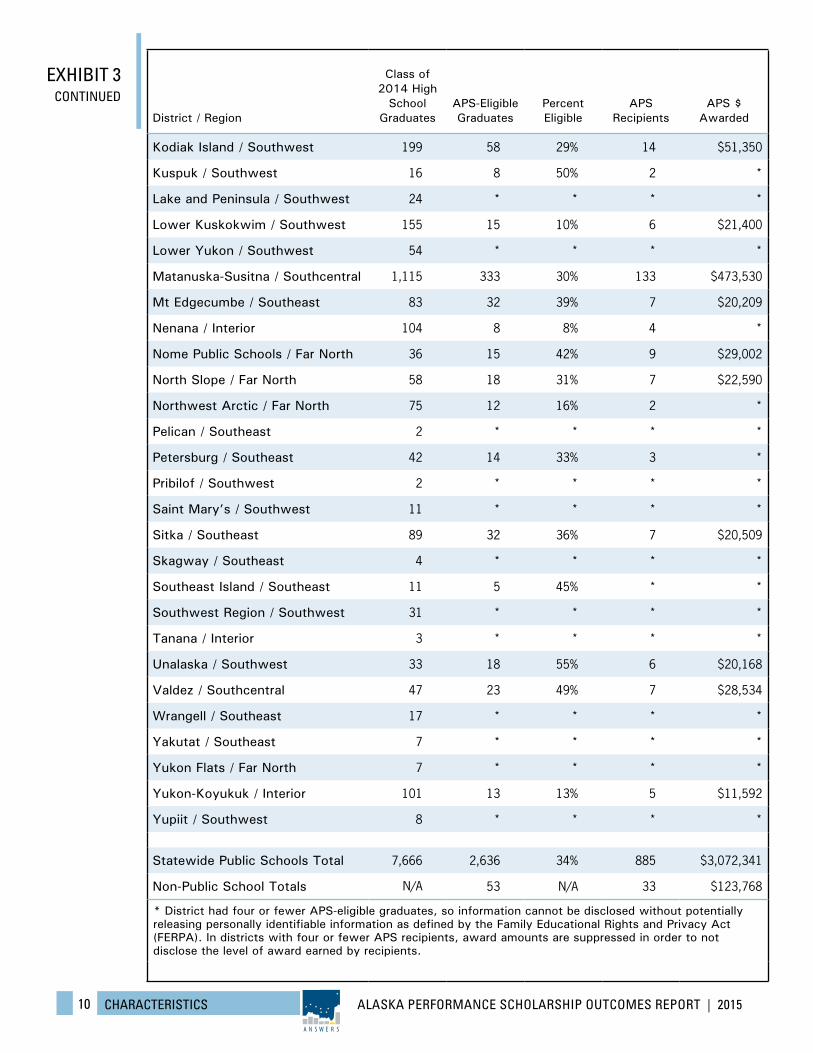
To protect individual students’ privacy, the number of APS-eligible graduates is not re-ported for a district if that number is fewer than five. This year the three districts with the highest reportable percentage of APS-eligible graduates were Chugach, Haines and Alaska Gateway, all with 60% or more of their graduates being APS eligible. The Nenana, Lower Kuskokwim and Yukon-Koyukuk districts fell at the other extreme, with 13% or less of their AY14 graduates attaining APS eligibility. Forty-two of the 54 districts had at least one APS-eligible graduate in AY14, and since the scholarship’s inception 50 districts have graduated at least one APS-eligible student.
ALASKA PERFORMANCE SCHOLARSHIP OUTCOMES REPORT | 20159 CHARACTERISTICS
A N S W E R S
AY14 APS Eligibility and Use by District / Region
District / Region
Class of 2014 High
School Graduates
APS-Eligible Graduates
Percent Eligible
APS Recipients
APS $ Awarded
Alaska Gateway / Interior 10 6 60% 3 *
Aleutian Region / Southwest 1 * * * *
Aleutians East / Southwest 17 * * * *
Anchorage / Southcentral 2,807 1,140 41% 353 $1,195,764
Annette Island / Southeast 20 * * * *
Bering Strait / Far North 86 14 16% 2 *
Bristol Bay / Southwest 16 * * * *
Chatham / Southeast 3 * * * *
Chugach / Southcentral 16 11 69% 3 *
Copper River / Southcentral 29 14 48% 6 $20,210
Cordova / Southcentral 20 10 50% 3 *
Craig / Southeast 17 10 59% 2 *
Delta-Greely / Interior 52 19 37% 9 $36,856
Denali / Interior 17 10 59% 2 *
Dillingham / Southwest 25 6 24% 1 *
Fairbanks North Star / Interior 817 350 43% 150 $526,141
Galena / Interior 251 91 36% 35 $132,679
Haines / Southeast 25 16 64% 6 $23,777
Hoonah / Southeast 3 * * * *
Hydaburg / Southeast 4 * * * *
Iditarod Area / Southwest 6 * * * *
Juneau / Southeast 346 88 25% 25 $86,193
Kake / Southeast 6 * * * *
Kashunamiut / Southwest 15 * * * *
Kenai Peninsula / Southcentral 586 193 33% 54 $190,338
Ketchikan Gateway / Southeast 126 35 28% 8 $22,590
Klawock / Southeast 11 * * * *
* District had four or fewer APS-eligible graduates, so information cannot be disclosed without potentially releasing personally identifiable information as defined by the Family Educational Rights and Privacy Act (FERPA). In districts with four or fewer APS recipients, award amounts are suppressed in order to not disclose the level of award earned by recipients.
EXHIBIT 3
ALASKA PERFORMANCE SCHOLARSHIP OUTCOMES REPORT | 201510 CHARACTERISTICS
A N S W E R S
District / Region
Class of 2014 High
School Graduates
APS-Eligible Graduates
Percent Eligible
APS Recipients
APS $ Awarded
Kodiak Island / Southwest 199 58 29% 14 $51,350
Kuspuk / Southwest 16 8 50% 2 *
Lake and Peninsula / Southwest 24 * * * *
Lower Kuskokwim / Southwest 155 15 10% 6 $21,400
Lower Yukon / Southwest 54 * * * *
Matanuska-Susitna / Southcentral 1,115 333 30% 133 $473,530
Mt Edgecumbe / Southeast 83 32 39% 7 $20,209
Nenana / Interior 104 8 8% 4 *
Nome Public Schools / Far North 36 15 42% 9 $29,002
North Slope / Far North 58 18 31% 7 $22,590
Northwest Arctic / Far North 75 12 16% 2 *
Pelican / Southeast 2 * * * *
Petersburg / Southeast 42 14 33% 3 *
Pribilof / Southwest 2 * * * *
Saint Mary’s / Southwest 11 * * * *
Sitka / Southeast 89 32 36% 7 $20,509
Skagway / Southeast 4 * * * *
Southeast Island / Southeast 11 5 45% * *
Southwest Region / Southwest 31 * * * *
Tanana / Interior 3 * * * *
Unalaska / Southwest 33 18 55% 6 $20,168
Valdez / Southcentral 47 23 49% 7 $28,534
Wrangell / Southeast 17 * * * *
Yakutat / Southeast 7 * * * *
Yukon Flats / Far North 7 * * * *
Yukon-Koyukuk / Interior 101 13 13% 5 $11,592
Yupiit / Southwest 8 * * * *
Statewide Public Schools Total 7,666 2,636 34% 885 $3,072,341
Non-Public School Totals N/A 53 N/A 33 $123,768
* District had four or fewer APS-eligible graduates, so information cannot be disclosed without potentially releasing personally identifiable information as defined by the Family Educational Rights and Privacy Act (FERPA). In districts with four or fewer APS recipients, award amounts are suppressed in order to not disclose the level of award earned by recipients.
EXHIBIT 3 CONTINUED
ALASKA PERFORMANCE SCHOLARSHIP OUTCOMES REPORT | 201511 CHARACTERISTICS
A N S W E R S
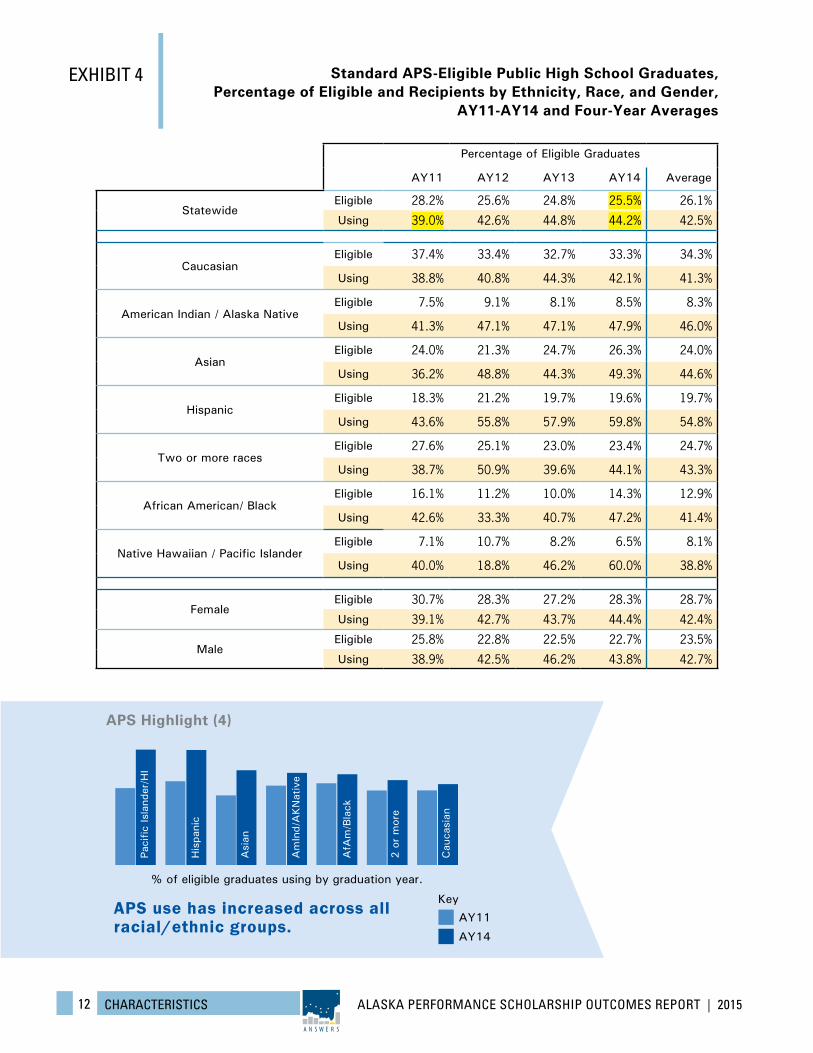
Most scholarship eligibility and use trends continued across ethnic groups and genders. (See Exhibit 4.) Focusing again on AY14 graduates eligible for a standard APS award, just over one-quarter were eligible. There has been a slight downward trend in standard APS eligibility, with the greatest decline coming between the first and second years’ graduates, when the scholarship’s curricular requirements for achieving APS eligibility became increasingly rigorous.
Eligibility differences across ethnic and racial groups still remain. One-third of AY14 Caucasian graduates were eligible for standard APS awards, while fewer than one-in-ten American Indian / Alaska Native or Native Hawaiian / Pacific Islander students were eligible to use the scholarship to pursue a degree.
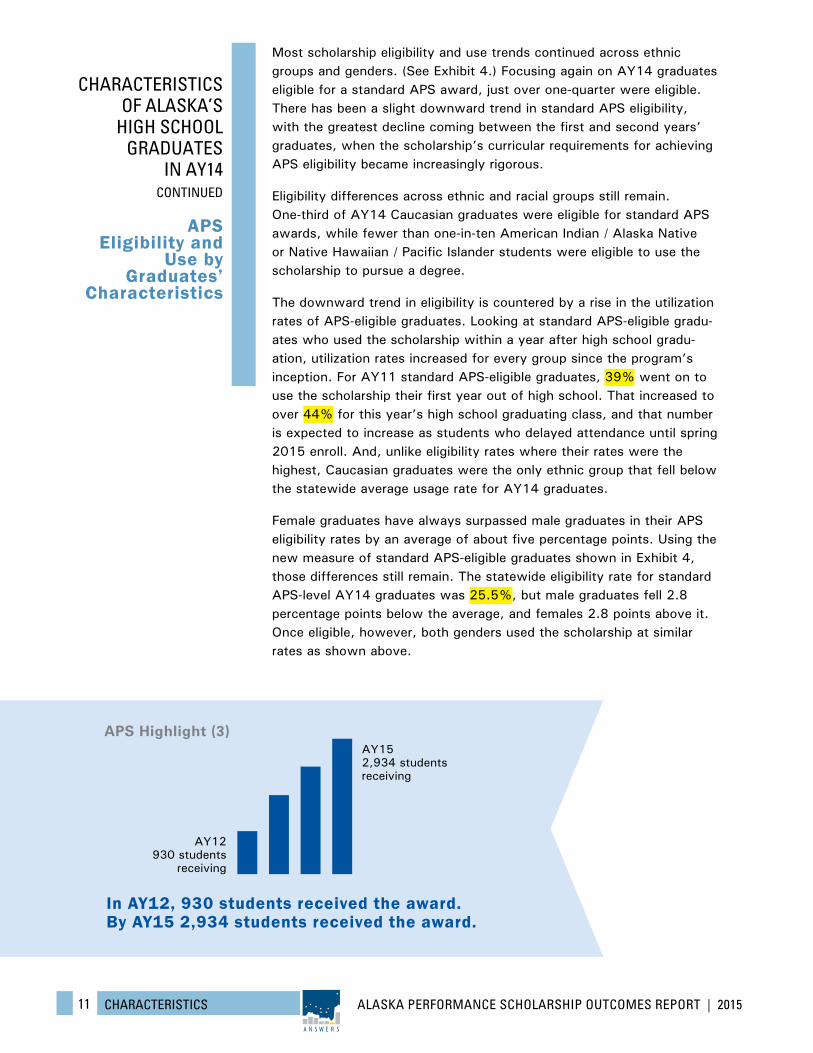
The downward trend in eligibility is countered by a rise in the utilization rates of APS-eligible graduates. Looking at standard APS-eligible gradu-ates who used the scholarship within a year after high school gradu-ation, utilization rates increased for every group since the program’s inception. For AY11 standard APS-eligible graduates, 39% went on to use the scholarship their first year out of high school. That increased to over 44% for this year’s high school graduating class, and that number is expected to increase as students who delayed attendance until spring 2015 enroll. And, unlike eligibility rates where their rates were the highest, Caucasian graduates were the only ethnic group that fell below the statewide average usage rate for AY14 graduates.
Female graduates have always surpassed male graduates in their APS eligibility rates by an average of about five percentage points. Using the new measure of standard APS-eligible graduates shown in Exhibit 4, those differences still remain. The statewide eligibility rate for standard APS-level AY14 graduates was 25.5%, but male graduates fell 2.8 percentage points below the average, and females 2.8 points above it. Once eligible, however, both genders used the scholarship at similar rates as shown above.
CHARACTERISTICS OF ALASKA’S
HIGH SCHOOL GRADUATES
IN AY14 CONTINUED
APS Eligibility and
Use by Graduates’
Characteristics
In AY12, 930 students received the award. By AY15 2,934 students received the award.
AY15 2,934 students receiving
AY12 930 students
receiving
APS Highlight (3)
ALASKA PERFORMANCE SCHOLARSHIP OUTCOMES REPORT | 201512 CHARACTERISTICS
A N S W E R S
Standard APS-Eligible Public High School Graduates, Percentage of Eligible and Recipients by Ethnicity, Race, and Gender,
AY11-AY14 and Four-Year Averages
Percentage of Eligible Graduates
AY11 AY12 AY13 AY14 Average
StatewideEligible 28.2% 25.6% 24.8% 25.5% 26.1%
Using 39.0% 42.6% 44.8% 44.2% 42.5%
CaucasianEligible 37.4% 33.4% 32.7% 33.3% 34.3%
Using 38.8% 40.8% 44.3% 42.1% 41.3%
American Indian / Alaska NativeEligible 7.5% 9.1% 8.1% 8.5% 8.3%
Using 41.3% 47.1% 47.1% 47.9% 46.0%
AsianEligible 24.0% 21.3% 24.7% 26.3% 24.0%
Using 36.2% 48.8% 44.3% 49.3% 44.6%
HispanicEligible 18.3% 21.2% 19.7% 19.6% 19.7%
Using 43.6% 55.8% 57.9% 59.8% 54.8%
Two or more racesEligible 27.6% 25.1% 23.0% 23.4% 24.7%
Using 38.7% 50.9% 39.6% 44.1% 43.3%
African American/ BlackEligible 16.1% 11.2% 10.0% 14.3% 12.9%
Using 42.6% 33.3% 40.7% 47.2% 41.4%
Native Hawaiian / Pacific IslanderEligible 7.1% 10.7% 8.2% 6.5% 8.1%
Using 40.0% 18.8% 46.2% 60.0% 38.8%
FemaleEligible 30.7% 28.3% 27.2% 28.3% 28.7%
Using 39.1% 42.7% 43.7% 44.4% 42.4%
MaleEligible 25.8% 22.8% 22.5% 22.7% 23.5%
Using 38.9% 42.5% 46.2% 43.8% 42.7%
EXHIBIT 4
APS use has increased across all racial/ethnic groups.
APS Highlight (4)
Paci
fic
Isla
nder
/HI
His
pani
c
Asi
an
Am
Ind/
AKN
ativ
e
AfA
m/B
lack
2 o
r m
ore
Cau
casi
an
AY11
Key
AY14
% of eligible graduates using by graduation year.
ALASKA PERFORMANCE SCHOLARSHIP OUTCOMES REPORT | 201513 CHARACTERISTICS
A N S W E R S
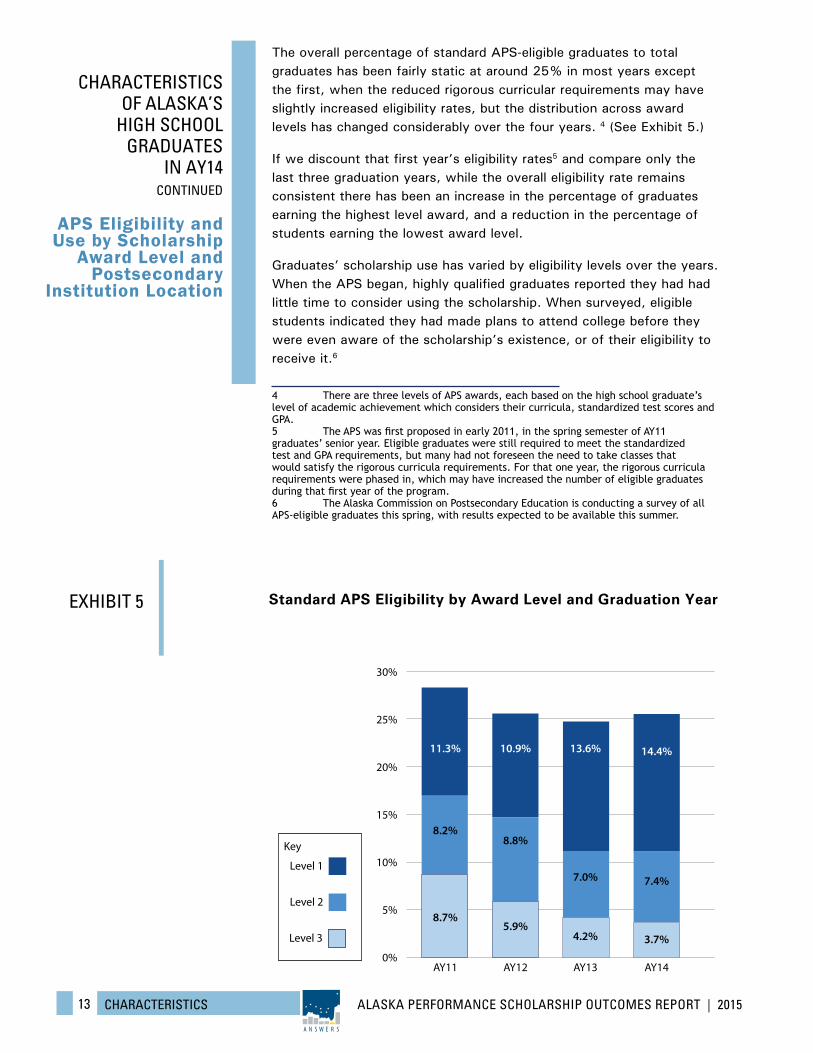
The overall percentage of standard APS-eligible graduates to total graduates has been fairly static at around 25% in most years except the first, when the reduced rigorous curricular requirements may have slightly increased eligibility rates, but the distribution across award levels has changed considerably over the four years. 4 (See Exhibit 5.)
If we discount that first year’s eligibility rates5 and compare only the last three graduation years, while the overall eligibility rate remains consistent there has been an increase in the percentage of graduates earning the highest level award, and a reduction in the percentage of students earning the lowest award level.
Graduates’ scholarship use has varied by eligibility levels over the years. When the APS began, highly qualified graduates reported they had had little time to consider using the scholarship. When surveyed, eligible students indicated they had made plans to attend college before they were even aware of the scholarship’s existence, or of their eligibility to receive it.6
4 There are three levels of APS awards, each based on the high school graduate’s level of academic achievement which considers their curricula, standardized test scores and GPA.5 The APS was first proposed in early 2011, in the spring semester of AY11 graduates’ senior year. Eligible graduates were still required to meet the standardized test and GPA requirements, but many had not foreseen the need to take classes that would satisfy the rigorous curricula requirements. For that one year, the rigorous curricula requirements were phased in, which may have increased the number of eligible graduates during that first year of the program. 6 The Alaska Commission on Postsecondary Education is conducting a survey of all APS-eligible graduates this spring, with results expected to be available this summer.
CHARACTERISTICS OF ALASKA’S
HIGH SCHOOL GRADUATES
IN AY14 CONTINUED
APS Eligibility and Use by Scholarship
Award Level and Postsecondary
Institution Location
EXHIBIT 5
0%
5%
10%
15%
20%
25%
30%
Level 1
Key
Level 2
Level 3
11.3%
8.7%
8.2%
AY11
10.9%
5.9%
8.8%
AY12
13.6% 14.4%
4.2%
7.0% 7.4%
3.7%
AY13 AY14
Standard APS Eligibility by Award Level and Graduation Year
ALASKA PERFORMANCE SCHOLARSHIP OUTCOMES REPORT | 201514 CHARACTERISTICS
A N S W E R S
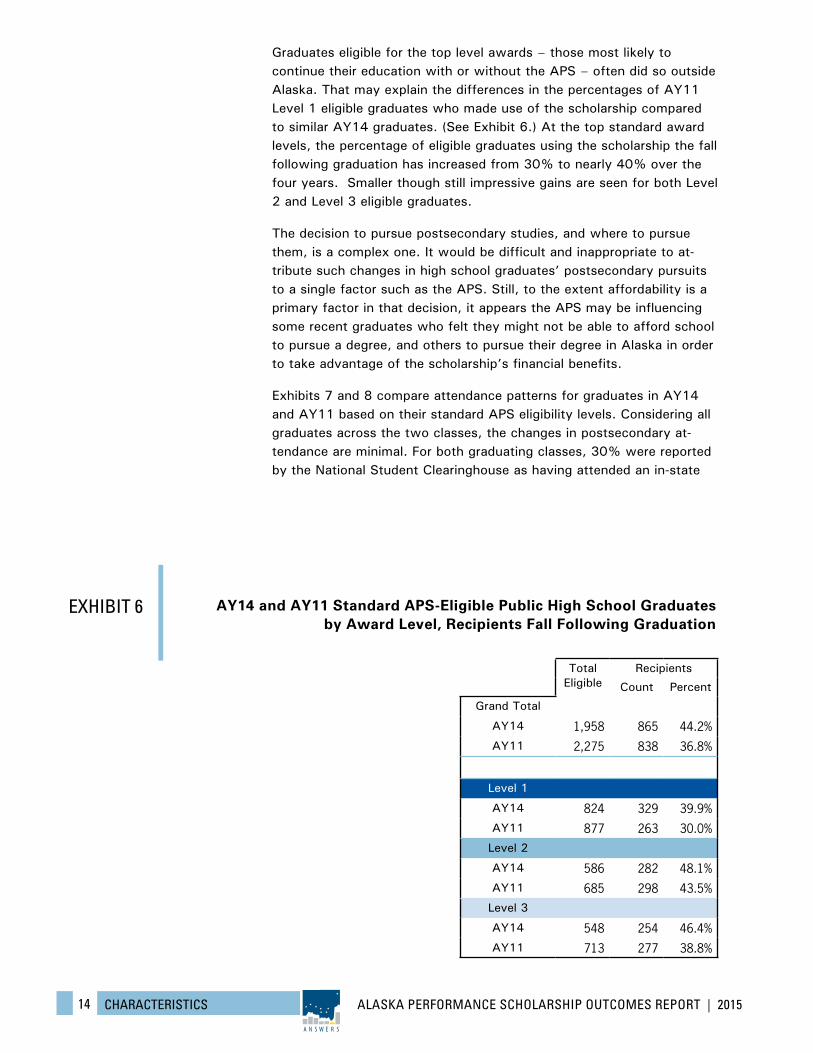
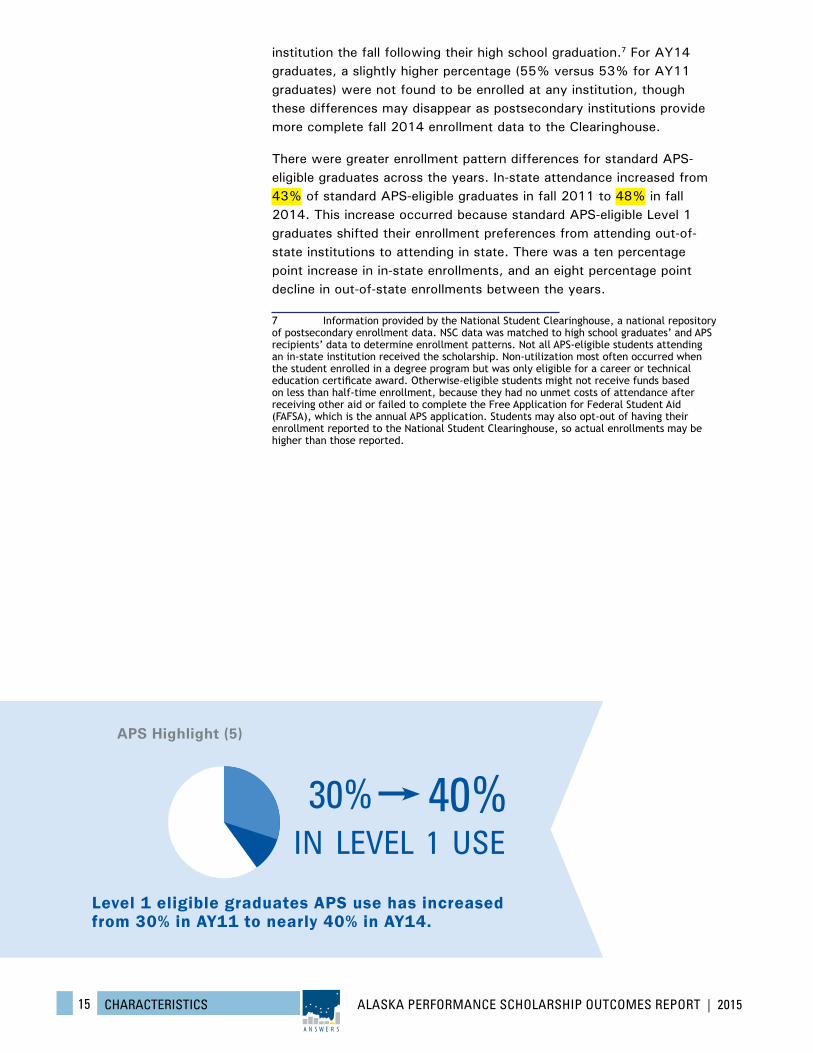
Graduates eligible for the top level awards – those most likely to continue their education with or without the APS – often did so outside Alaska. That may explain the differences in the percentages of AY11 Level 1 eligible graduates who made use of the scholarship compared to similar AY14 graduates. (See Exhibit 6.) At the top standard award levels, the percentage of eligible graduates using the scholarship the fall following graduation has increased from 30% to nearly 40% over the four years. Smaller though still impressive gains are seen for both Level 2 and Level 3 eligible graduates.
The decision to pursue postsecondary studies, and where to pursue them, is a complex one. It would be difficult and inappropriate to at-tribute such changes in high school graduates’ postsecondary pursuits to a single factor such as the APS. Still, to the extent affordability is a primary factor in that decision, it appears the APS may be influencing some recent graduates who felt they might not be able to afford school to pursue a degree, and others to pursue their degree in Alaska in order to take advantage of the scholarship’s financial benefits.
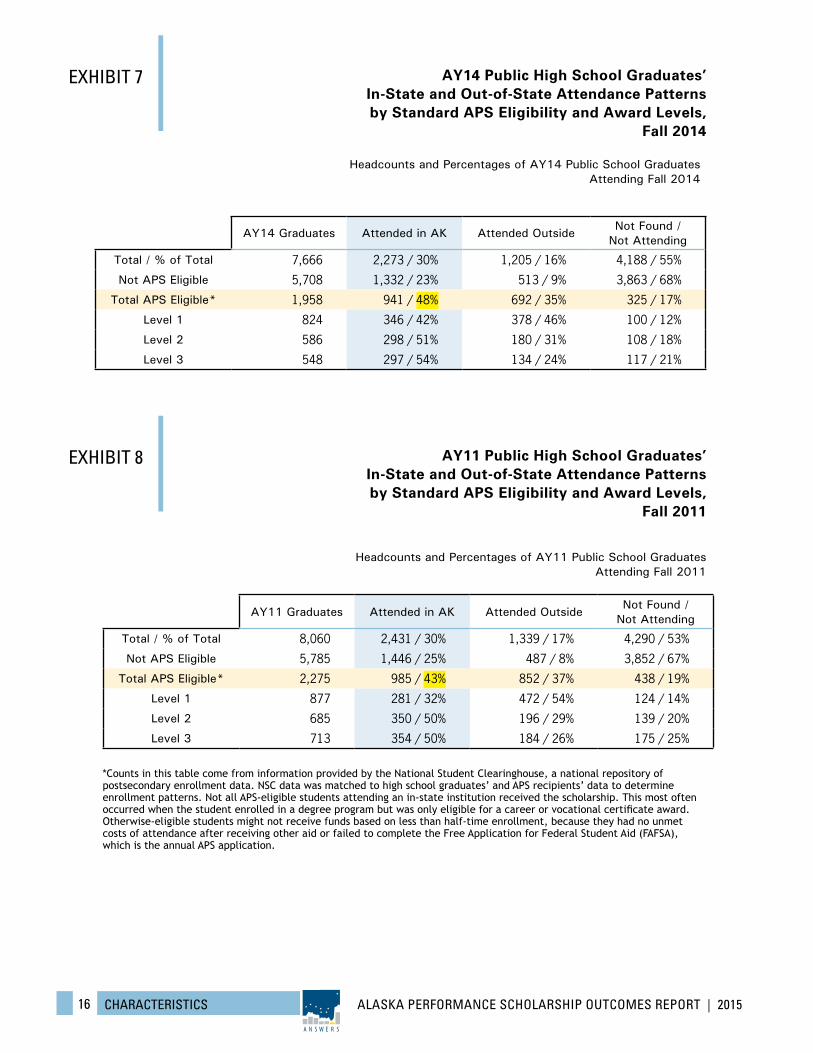
Exhibits 7 and 8 compare attendance patterns for graduates in AY14 and AY11 based on their standard APS eligibility levels. Considering all graduates across the two classes, the changes in postsecondary at-tendance are minimal. For both graduating classes, 30% were reported by the National Student Clearinghouse as having attended an in-state
EXHIBIT 6 AY14 and AY11 Standard APS-Eligible Public High School Graduates by Award Level, Recipients Fall Following Graduation
Total Eligible
Recipients
Count Percent
Grand Total
AY14 1,958 865 44.2%AY11 2,275 838 36.8%
Level 1
AY14 824 329 39.9%AY11 877 263 30.0%
Level 2
AY14 586 282 48.1%AY11 685 298 43.5%
Level 3
AY14 548 254 46.4%AY11 713 277 38.8%
ALASKA PERFORMANCE SCHOLARSHIP OUTCOMES REPORT | 201515 CHARACTERISTICS
A N S W E R S
institution the fall following their high school graduation.7 For AY14 graduates, a slightly higher percentage (55% versus 53% for AY11 graduates) were not found to be enrolled at any institution, though these differences may disappear as postsecondary institutions provide more complete fall 2014 enrollment data to the Clearinghouse.
There were greater enrollment pattern differences for standard APS-eligible graduates across the years. In-state attendance increased from 43% of standard APS-eligible graduates in fall 2011 to 48% in fall 2014. This increase occurred because standard APS-eligible Level 1 graduates shifted their enrollment preferences from attending out-of-state institutions to attending in state. There was a ten percentage point increase in in-state enrollments, and an eight percentage point decline in out-of-state enrollments between the years.
7 Information provided by the National Student Clearinghouse, a national repository of postsecondary enrollment data. NSC data was matched to high school graduates’ and APS recipients’ data to determine enrollment patterns. Not all APS-eligible students attending an in-state institution received the scholarship. Non-utilization most often occurred when the student enrolled in a degree program but was only eligible for a career or technical education certificate award. Otherwise-eligible students might not receive funds based on less than half-time enrollment, because they had no unmet costs of attendance after receiving other aid or failed to complete the Free Application for Federal Student Aid (FAFSA), which is the annual APS application. Students may also opt-out of having their enrollment reported to the National Student Clearinghouse, so actual enrollments may be higher than those reported.
Level 1 eligible graduates APS use has increased from 30% in AY11 to nearly 40% in AY14.
APS Highlight (5)
30% 40%IN LEVEL 1 USE
ALASKA PERFORMANCE SCHOLARSHIP OUTCOMES REPORT | 201516 CHARACTERISTICS
A N S W E R S
AY14 Public High School Graduates’ In-State and Out-of-State Attendance Patterns by Standard APS Eligibility and Award Levels,
Fall 2014
Headcounts and Percentages of AY14 Public School Graduates Attending Fall 2014
AY14 Graduates Attended in AK Attended OutsideNot Found /
Not Attending
Total / % of Total 7,666 2,273 / 30% 1,205 / 16% 4,188 / 55%
Not APS Eligible 5,708 1,332 / 23% 513 / 9% 3,863 / 68%
Total APS Eligible* 1,958 941 / 48% 692 / 35% 325 / 17%
Level 1 824 346 / 42% 378 / 46% 100 / 12%
Level 2 586 298 / 51% 180 / 31% 108 / 18%
Level 3 548 297 / 54% 134 / 24% 117 / 21%
AY11 Public High School Graduates’ In-State and Out-of-State Attendance Patterns by Standard APS Eligibility and Award Levels,
Fall 2011
Headcounts and Percentages of AY11 Public School Graduates Attending Fall 2011
AY11 Graduates Attended in AK Attended OutsideNot Found /
Not Attending
Total / % of Total 8,060 2,431 / 30% 1,339 / 17% 4,290 / 53%
Not APS Eligible 5,785 1,446 / 25% 487 / 8% 3,852 / 67%
Total APS Eligible* 2,275 985 / 43% 852 / 37% 438 / 19%
Level 1 877 281 / 32% 472 / 54% 124 / 14%
Level 2 685 350 / 50% 196 / 29% 139 / 20%
Level 3 713 354 / 50% 184 / 26% 175 / 25%
*Counts in this table come from information provided by the National Student Clearinghouse, a national repository of postsecondary enrollment data. NSC data was matched to high school graduates’ and APS recipients’ data to determine enrollment patterns. Not all APS-eligible students attending an in-state institution received the scholarship. This most often occurred when the student enrolled in a degree program but was only eligible for a career or vocational certificate award. Otherwise-eligible students might not receive funds based on less than half-time enrollment, because they had no unmet costs of attendance after receiving other aid or failed to complete the Free Application for Federal Student Aid (FAFSA), which is the annual APS application.
EXHIBIT 7
EXHIBIT 8
ALASKA PERFORMANCE SCHOLARSHIP OUTCOMES REPORT | 201517 CHARACTERISTICS
A N S W E R S
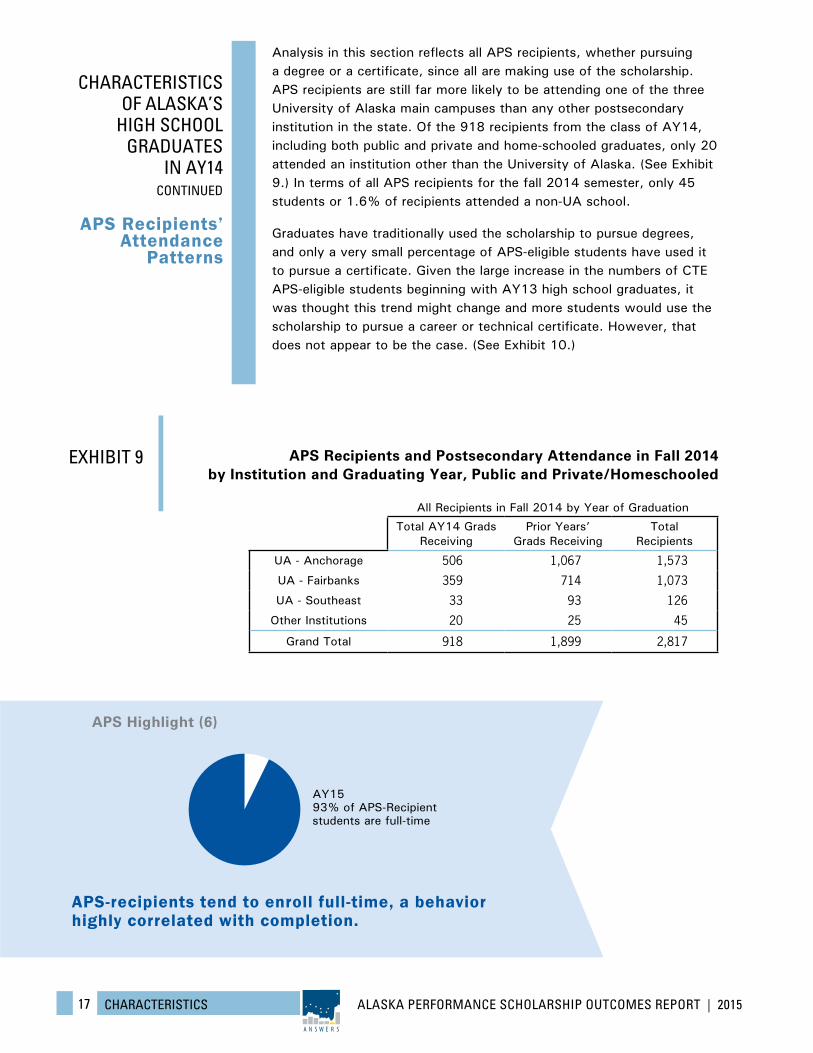
Analysis in this section reflects all APS recipients, whether pursuing a degree or a certificate, since all are making use of the scholarship. APS recipients are still far more likely to be attending one of the three University of Alaska main campuses than any other postsecondary institution in the state. Of the 918 recipients from the class of AY14, including both public and private and home-schooled graduates, only 20 attended an institution other than the University of Alaska. (See Exhibit 9.) In terms of all APS recipients for the fall 2014 semester, only 45 students or 1.6% of recipients attended a non-UA school.
Graduates have traditionally used the scholarship to pursue degrees, and only a very small percentage of APS-eligible students have used it to pursue a certificate. Given the large increase in the numbers of CTE APS-eligible students beginning with AY13 high school graduates, it was thought this trend might change and more students would use the scholarship to pursue a career or technical certificate. However, that does not appear to be the case. (See Exhibit 10.)
CHARACTERISTICS OF ALASKA’S
HIGH SCHOOL GRADUATES
IN AY14 CONTINUED
APS Recipients’ Attendance
Patterns
EXHIBIT 9 APS Recipients and Postsecondary Attendance in Fall 2014 by Institution and Graduating Year, Public and Private/Homeschooled
All Recipients in Fall 2014 by Year of Graduation
Total AY14 Grads Receiving
Prior Years’ Grads Receiving
Total Recipients
UA - Anchorage 506 1,067 1,573
UA - Fairbanks 359 714 1,073
UA - Southeast 33 93 126
Other Institutions 20 25 45
Grand Total 918 1,899 2,817
AY15 93% of APS-Recipient students are full-time
APS-recipients tend to enroll full-time, a behavior highly correlated with completion.
APS Highlight (6)
ALASKA PERFORMANCE SCHOLARSHIP OUTCOMES REPORT | 201518 CHARACTERISTICS
A N S W E R S
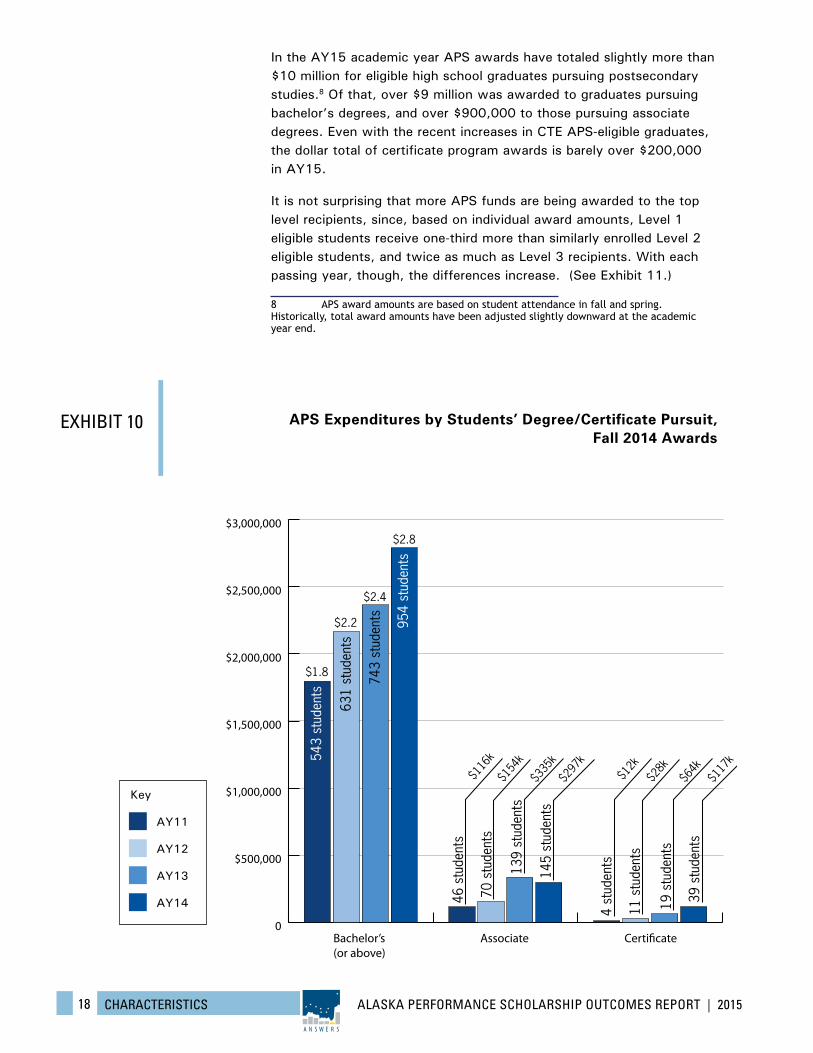
In the AY15 academic year APS awards have totaled slightly more than $10 million for eligible high school graduates pursuing postsecondary studies.8 Of that, over $9 million was awarded to graduates pursuing bachelor’s degrees, and over $900,000 to those pursuing associate degrees. Even with the recent increases in CTE APS-eligible graduates, the dollar total of certificate program awards is barely over $200,000 in AY15.
It is not surprising that more APS funds are being awarded to the top level recipients, since, based on individual award amounts, Level 1 eligible students receive one-third more than similarly enrolled Level 2 eligible students, and twice as much as Level 3 recipients. With each passing year, though, the differences increase. (See Exhibit 11.)
8 APS award amounts are based on student attendance in fall and spring. Historically, total award amounts have been adjusted slightly downward at the academic year end.
EXHIBIT 10 APS Expenditures by Students’ Degree/Certificate Pursuit, Fall 2014 Awards
Bachelor’s(or above)
Associate Certi�cate
$1.8
$116
k$1
54k
$335
k$2
97k
$2.2
$2.4
$2.8
$12k
$28k
$64k
$117
k
0
$500,000
$1,000,000
$1,500,000
$2,000,000
$2,500,000
$3,000,000
954
stud
ents
543
stud
ents
743
stud
ents
631
stud
ents
145
stud
ents
46 s
tude
nts
139
stud
ents
70 s
tude
nts
39 s
tude
nts
4 st
uden
ts
19 s
tude
nts
11 s
tude
ntsAY12
AY14
AY11
AY13
Key
ALASKA PERFORMANCE SCHOLARSHIP OUTCOMES REPORT | 201519 CHARACTERISTICS
A N S W E R S
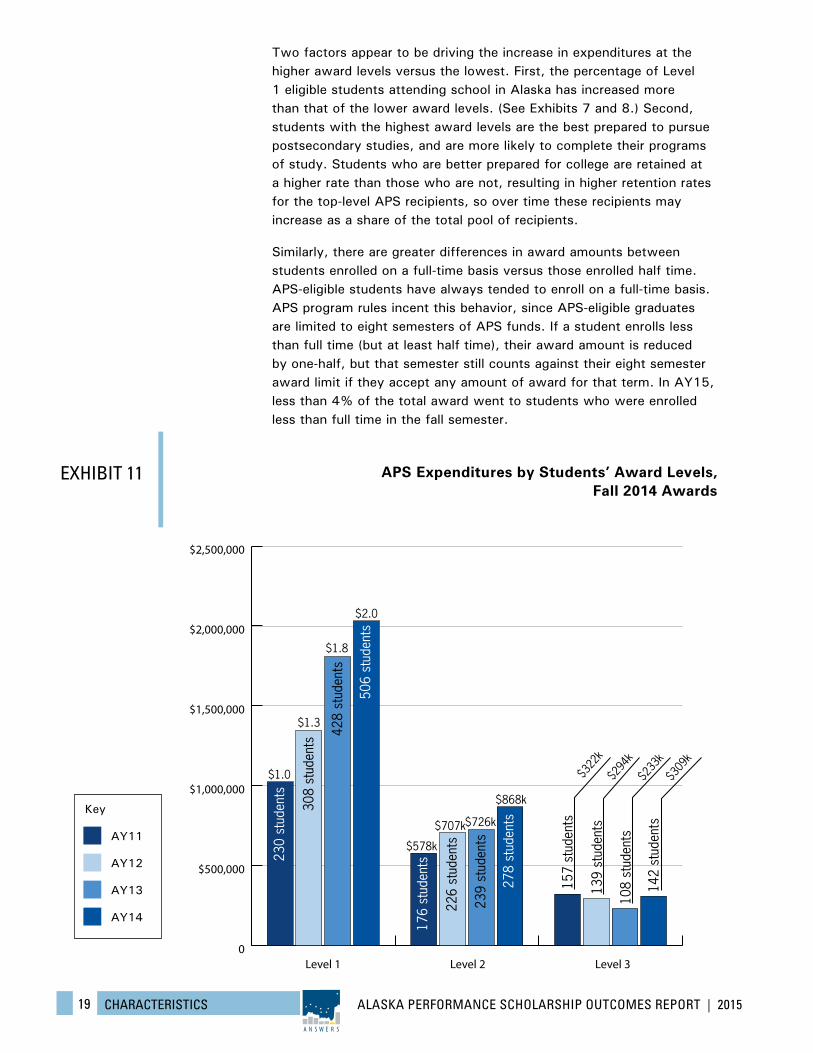
Two factors appear to be driving the increase in expenditures at the higher award levels versus the lowest. First, the percentage of Level 1 eligible students attending school in Alaska has increased more than that of the lower award levels. (See Exhibits 7 and 8.) Second, students with the highest award levels are the best prepared to pursue postsecondary studies, and are more likely to complete their programs of study. Students who are better prepared for college are retained at a higher rate than those who are not, resulting in higher retention rates for the top-level APS recipients, so over time these recipients may increase as a share of the total pool of recipients.
Similarly, there are greater differences in award amounts between students enrolled on a full-time basis versus those enrolled half time. APS-eligible students have always tended to enroll on a full-time basis. APS program rules incent this behavior, since APS-eligible graduates are limited to eight semesters of APS funds. If a student enrolls less than full time (but at least half time), their award amount is reduced by one-half, but that semester still counts against their eight semester award limit if they accept any amount of award for that term. In AY15, less than 4% of the total award went to students who were enrolled less than full time in the fall semester.
EXHIBIT 11
Level 1 Level 2 Level 30
$500,000
$1,000,000
$1,500,000
$2,000,000
$2,500,000
142
stud
ents
157
stud
ents
108
stud
ents
139
stud
ents
506
stud
ents
230
stud
ents
428
stud
ents
308
stud
ents
278
stud
ents
176
stud
ents
239
stud
ents
226
stud
ents
$322
k$2
94k
$233
k$3
09k
$1.0
$1.3
$1.8
$2.0
$578k
$707k$726k
$868k
APS Expenditures by Students’ Award Levels, Fall 2014 Awards
AY12
AY14
AY11
AY13
Key
ALASKA PERFORMANCE SCHOLARSHIP OUTCOMES REPORT | 201520 ELIGIBILITY
A N S W E R S
Eligibility requirements for most new scholarships or grants are subject to modification driven by public policy goals associated with a given program. Those changes in requirements can make comparisons across years more difficult, and the APS is no exception, where a fast rollout of the scholarship was followed by a fine tuning of its eligibility requirements.
Students can become eligible for the APS, as noted previously, by 1) taking a rigorous curriculum while in high school, 2) achieving certain high school GPAs, and 3) achieving certain threshold scores on any of three standardized tests. Two of the tests are designed to assess college-readiness and the other is designed to assess readiness for entry-level employment in various industries. The differences in eligibil-ity types are determined based on the test scores the student used to become eligible.
For students taking the SAT or ACT exams, if they score sufficiently high on the test, they become eligible to receive the APS, and the higher they score, the higher their potential award level.9 Students’ SAT- or ACT-based awards can be used to pursue any eligible postsecondary education program, whether bachelor’s, associate, or graduate degrees as well as career and technical education certificates. There are no restrictions on the type of postsecondary education these scholarships can be used for, so long as the institution and the program are eligible to receive APS funds. We refer to these as standard APS-eligible awards.
There is only a single test score threshold for students who become eligible based on their WorkKeys scores. Their award level is then determined by their overall high school GPA. Students who become APS eligible based on WorkKeys scores can only use the scholarship to pursue career and technical education certificates – the scholarship cannot be applied to enrollment in a degree program. We refer to these students as CTE APS-eligible graduates.
For AY11 and AY12 graduates, students taking the WorkKeys exam had to score a total of 15 points in three different testing areas, with no single testing area score lower than a 5. For AY13 and AY14 graduates, the relevant thresholds scores were lowered to a total of 13 points, with no single score below a 4. This change is the most likely cause in a large increase in CTE APS-eligible students.
Students can have both types of APS eligibility – one based on their CTE eligibility, the other on their standard award eligibility. CTE eligibil-ity can never be lower than standard eligibility, since standard awards can be used to pursue either a degree or a certificate, though students can be eligible to receive a higher level award to apply to a certificate based on their CTE eligibility.
9 For more information on APS eligibility rules, see Appendix B.
COMPARING ELIGIBILITY TYPES –
STANDARD & CTE APS-ELIGIBLE
GRADUATES
ALASKA PERFORMANCE SCHOLARSHIP OUTCOMES REPORT | 201521 ELIGIBILITY
A N S W E R S
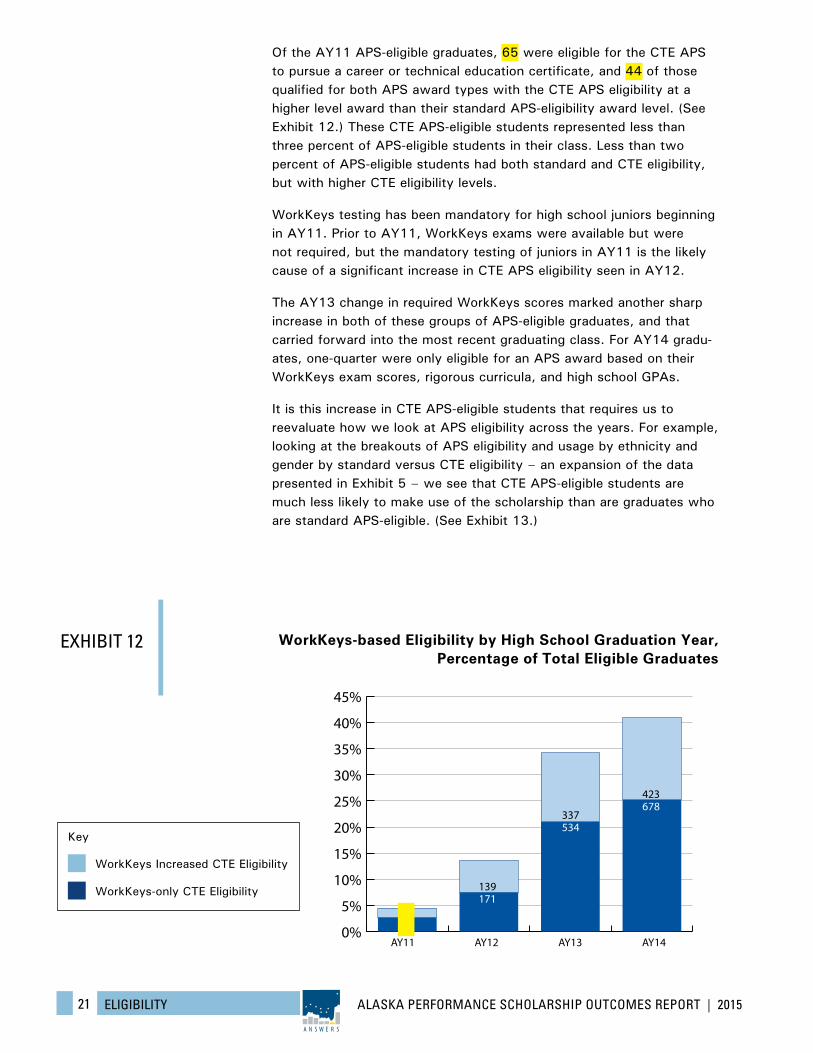
Of the AY11 APS-eligible graduates, 65 were eligible for the CTE APS to pursue a career or technical education certificate, and 44 of those qualified for both APS award types with the CTE APS eligibility at a higher level award than their standard APS-eligibility award level. (See Exhibit 12.) These CTE APS-eligible students represented less than three percent of APS-eligible students in their class. Less than two percent of APS-eligible students had both standard and CTE eligibility, but with higher CTE eligibility levels.
WorkKeys testing has been mandatory for high school juniors beginning in AY11. Prior to AY11, WorkKeys exams were available but were not required, but the mandatory testing of juniors in AY11 is the likely cause of a significant increase in CTE APS eligibility seen in AY12.
The AY13 change in required WorkKeys scores marked another sharp increase in both of these groups of APS-eligible graduates, and that carried forward into the most recent graduating class. For AY14 gradu-ates, one-quarter were only eligible for an APS award based on their WorkKeys exam scores, rigorous curricula, and high school GPAs.
It is this increase in CTE APS-eligible students that requires us to reevaluate how we look at APS eligibility across the years. For example, looking at the breakouts of APS eligibility and usage by ethnicity and gender by standard versus CTE eligibility – an expansion of the data presented in Exhibit 5 – we see that CTE APS-eligible students are much less likely to make use of the scholarship than are graduates who are standard APS-eligible. (See Exhibit 13.)
EXHIBIT 12
AY11 AY12 AY13 AY140%
5%
10%
15%
20%
25%
30%
35%
40%
45%
4465
139171
337534
423678
WorkKeys-based Eligibility by High School Graduation Year, Percentage of Total Eligible Graduates
WorkKeys-only CTE Eligibility
WorkKeys Increased CTE Eligibility
Key
ALASKA PERFORMANCE SCHOLARSHIP OUTCOMES REPORT | 201522 ELIGIBILITY
A N S W E R S
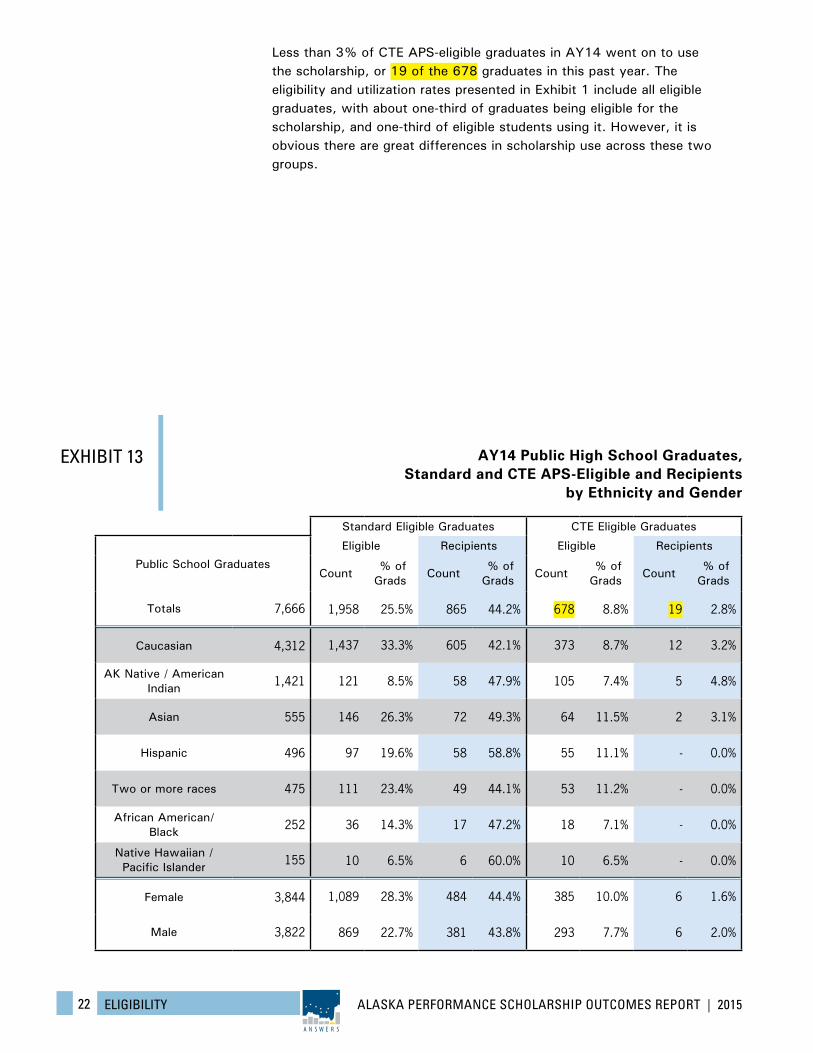
Less than 3% of CTE APS-eligible graduates in AY14 went on to use the scholarship, or 19 of the 678 graduates in this past year. The eligibility and utilization rates presented in Exhibit 1 include all eligible graduates, with about one-third of graduates being eligible for the scholarship, and one-third of eligible students using it. However, it is obvious there are great differences in scholarship use across these two groups.
EXHIBIT 13 AY14 Public High School Graduates, Standard and CTE APS-Eligible and Recipients
by Ethnicity and Gender
Standard Eligible Graduates CTE Eligible Graduates
Public School Graduates
Eligible Recipients Eligible Recipients
Count% of
GradsCount
% of Grads
Count% of
GradsCount
% of Grads
Totals 7,666 1,958 25.5% 865 44.2% 678 8.8% 19 2.8%
Caucasian 4,312 1,437 33.3% 605 42.1% 373 8.7% 12 3.2%
AK Native / American Indian 1,421 121 8.5% 58 47.9% 105 7.4% 5 4.8%
Asian 555 146 26.3% 72 49.3% 64 11.5% 2 3.1%
Hispanic 496 97 19.6% 58 58.8% 55 11.1% - 0.0%
Two or more races 475 111 23.4% 49 44.1% 53 11.2% - 0.0%
African American/ Black 252 36 14.3% 17 47.2% 18 7.1% - 0.0%
Native Hawaiian / Pacific Islander 155 10 6.5% 6 60.0% 10 6.5% - 0.0%
Female 3,844 1,089 28.3% 484 44.4% 385 10.0% 6 1.6%
Male 3,822 869 22.7% 381 43.8% 293 7.7% 6 2.0%
ALASKA PERFORMANCE SCHOLARSHIP OUTCOMES REPORT | 201523 ELIGIBILITY
A N S W E R S
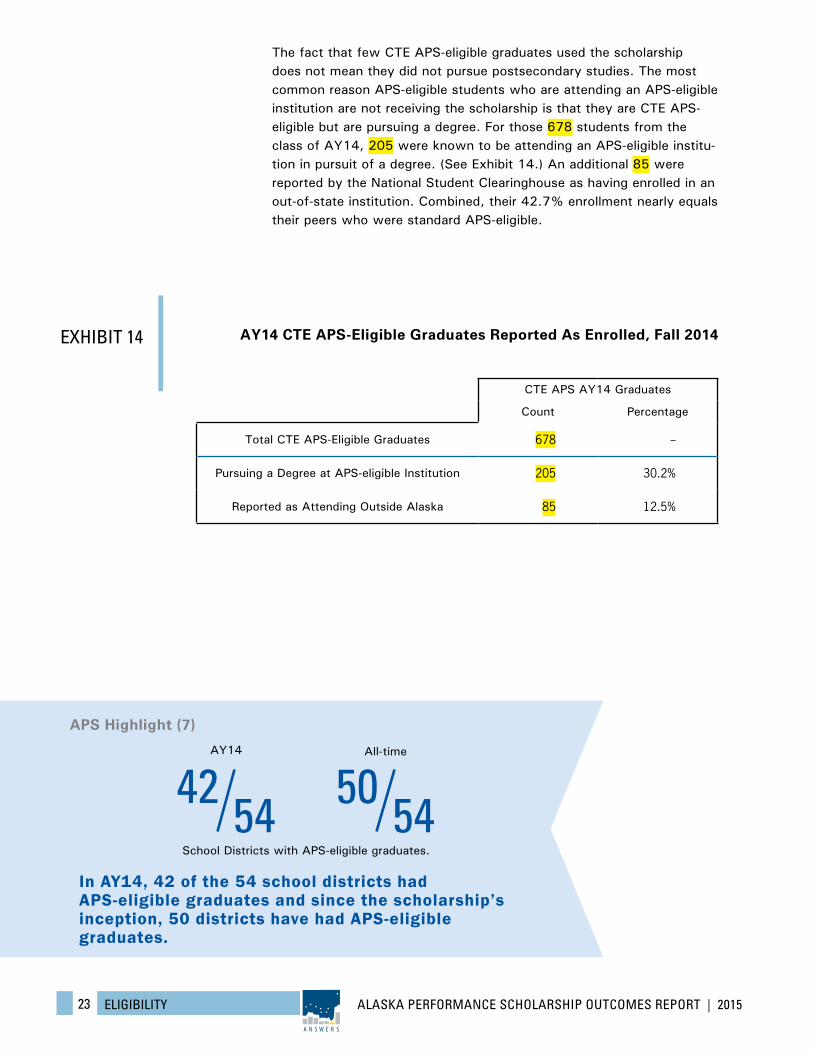
The fact that few CTE APS-eligible graduates used the scholarship does not mean they did not pursue postsecondary studies. The most common reason APS-eligible students who are attending an APS-eligible institution are not receiving the scholarship is that they are CTE APS-eligible but are pursuing a degree. For those 678 students from the class of AY14, 205 were known to be attending an APS-eligible institu-tion in pursuit of a degree. (See Exhibit 14.) An additional 85 were reported by the National Student Clearinghouse as having enrolled in an out-of-state institution. Combined, their 42.7% enrollment nearly equals their peers who were standard APS-eligible.
EXHIBIT 14 AY14 CTE APS-Eligible Graduates Reported As Enrolled, Fall 2014
CTE APS AY14 Graduates
Count Percentage
Total CTE APS-Eligible Graduates 678 --
Pursuing a Degree at APS-eligible Institution 205 30.2%
Reported as Attending Outside Alaska 85 12.5%
In AY14, 42 of the 54 school districts had APS-eligible graduates and since the scholarship’s inception, 50 districts have had APS-eligible graduates.
School Districts with APS-eligible graduates.
AY14 All-time
5442 5450APS Highlight (7)
ALASKA PERFORMANCE SCHOLARSHIP OUTCOMES REPORT | 201524 CLASS OF AY11
A N S W E R S
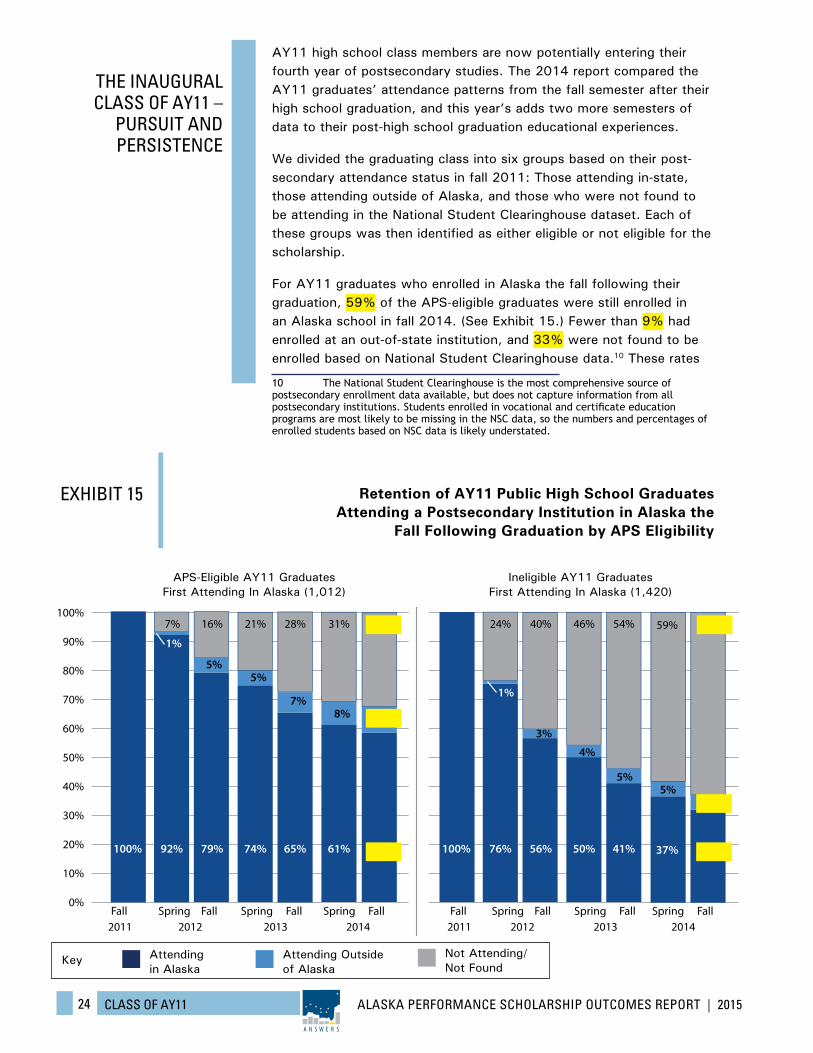
AY11 high school class members are now potentially entering their fourth year of postsecondary studies. The 2014 report compared the AY11 graduates’ attendance patterns from the fall semester after their high school graduation, and this year’s adds two more semesters of data to their post-high school graduation educational experiences.
We divided the graduating class into six groups based on their post-secondary attendance status in fall 2011: Those attending in-state, those attending outside of Alaska, and those who were not found to be attending in the National Student Clearinghouse dataset. Each of these groups was then identified as either eligible or not eligible for the scholarship.
For AY11 graduates who enrolled in Alaska the fall following their graduation, 59% of the APS-eligible graduates were still enrolled in an Alaska school in fall 2014. (See Exhibit 15.) Fewer than 9% had enrolled at an out-of-state institution, and 33% were not found to be enrolled based on National Student Clearinghouse data.10 These rates
10 The National Student Clearinghouse is the most comprehensive source of postsecondary enrollment data available, but does not capture information from all postsecondary institutions. Students enrolled in vocational and certificate education programs are most likely to be missing in the NSC data, so the numbers and percentages of enrolled students based on NSC data is likely understated.
THE INAUGURAL CLASS OF AY11 –
PURSUIT AND PERSISTENCE
EXHIBIT 15 Retention of AY11 Public High School Graduates Attending a Postsecondary Institution in Alaska the
Fall Following Graduation by APS Eligibility
0%
10%
20%
30%
40%
50%
60%
70%
80%
90%
100%
20122011Fall Spring Fall Spring Fall
2013Spring Fall
2014
28%21%16%7%
7%
5%5%
1%
65%
31%
8%
61%
33%
9%
59%74%79%92%100%
20122011Fall Spring Fall Spring Fall
2013Spring Fall
2014
54%46%40%24%
5%
4%
3%
1%
41%
59%
5%
37%
63%
5%
32%50%56%76%100%
APS-Eligible AY11 Graduates First Attending In Alaska (1,012)
Ineligible AY11 Graduates First Attending In Alaska (1,420)
Key Attending Outside of Alaska
Attending in Alaska
Not Attending/ Not Found
ALASKA PERFORMANCE SCHOLARSHIP OUTCOMES REPORT | 201525 CLASS OF AY11
A N S W E R S
were quite different than those of ineligible graduates who first enrolled in an Alaska institution. By fall 2014, only 32% of these students re-mained enrolled at an Alaska school, and 5% were found to be enrolled out-of-state, leaving 63% either not enrolled or not found.
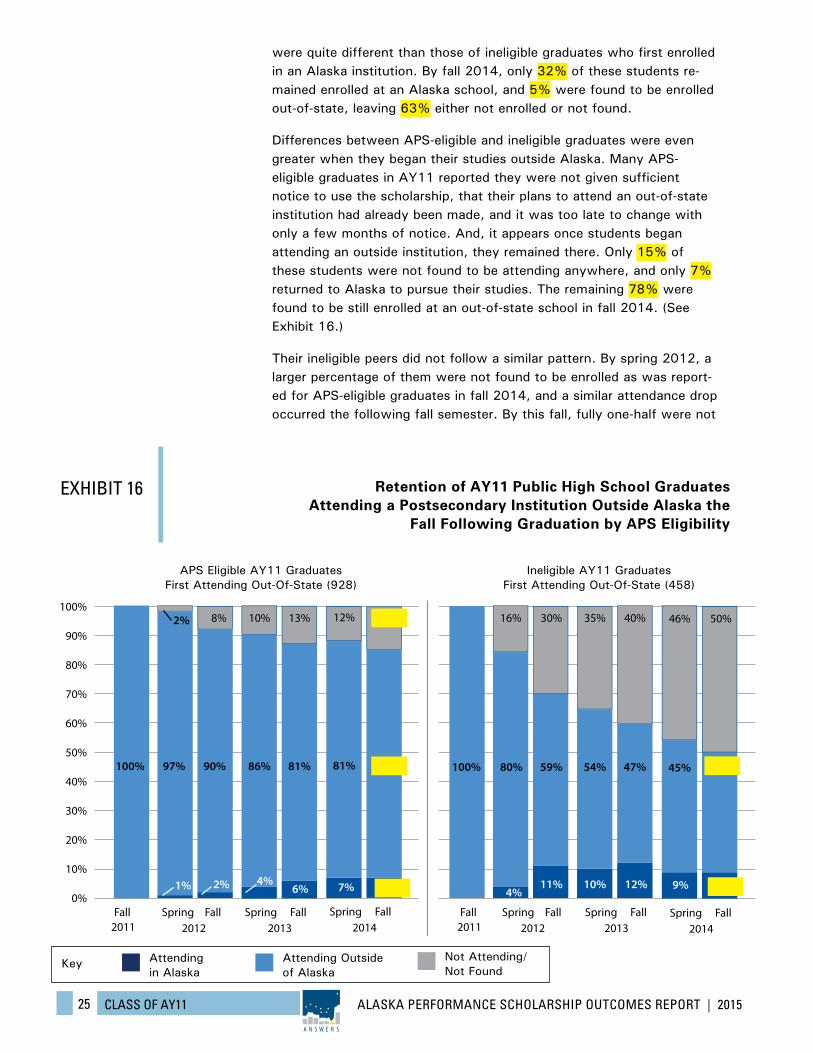
Differences between APS-eligible and ineligible graduates were even greater when they began their studies outside Alaska. Many APS-eligible graduates in AY11 reported they were not given sufficient notice to use the scholarship, that their plans to attend an out-of-state institution had already been made, and it was too late to change with only a few months of notice. And, it appears once students began attending an outside institution, they remained there. Only 15% of these students were not found to be attending anywhere, and only 7% returned to Alaska to pursue their studies. The remaining 78% were found to be still enrolled at an out-of-state school in fall 2014. (See Exhibit 16.)
Their ineligible peers did not follow a similar pattern. By spring 2012, a larger percentage of them were not found to be enrolled as was report-ed for APS-eligible graduates in fall 2014, and a similar attendance drop occurred the following fall semester. By this fall, fully one-half were not
0%
10%
20%
30%
40%
50%
60%
70%
80%
90%
100%
20122011Fall Spring Fall Spring Fall
2013
13%10%8%2%
81%86%90%97%
6%4%
Spring Fall2014
15%12%
78%81%
7%7%1%
100%
20122011Fall Spring Fall Spring Fall
2013
40%35%30%16%
47%54%59%80%
12%10%
Spring Fall2014
50%46%
41%45%
9%9%11%4%
100%
2%
Key Attending Outside of Alaska
Attending in Alaska
Not Attending/ Not Found
EXHIBIT 16 Retention of AY11 Public High School Graduates Attending a Postsecondary Institution Outside Alaska the
Fall Following Graduation by APS Eligibility
APS Eligible AY11 Graduates First Attending Out-Of-State (928)
Ineligible AY11 Graduates First Attending Out-Of-State (458)
ALASKA PERFORMANCE SCHOLARSHIP OUTCOMES REPORT | 201526 CLASS OF AY11
A N S W E R S
found to be enrolled, and only 9% had returned to Alaska to continue their studies. The remaining 41% were still attending out-of-state, or just over one-half the rate of their APS-eligible peers.
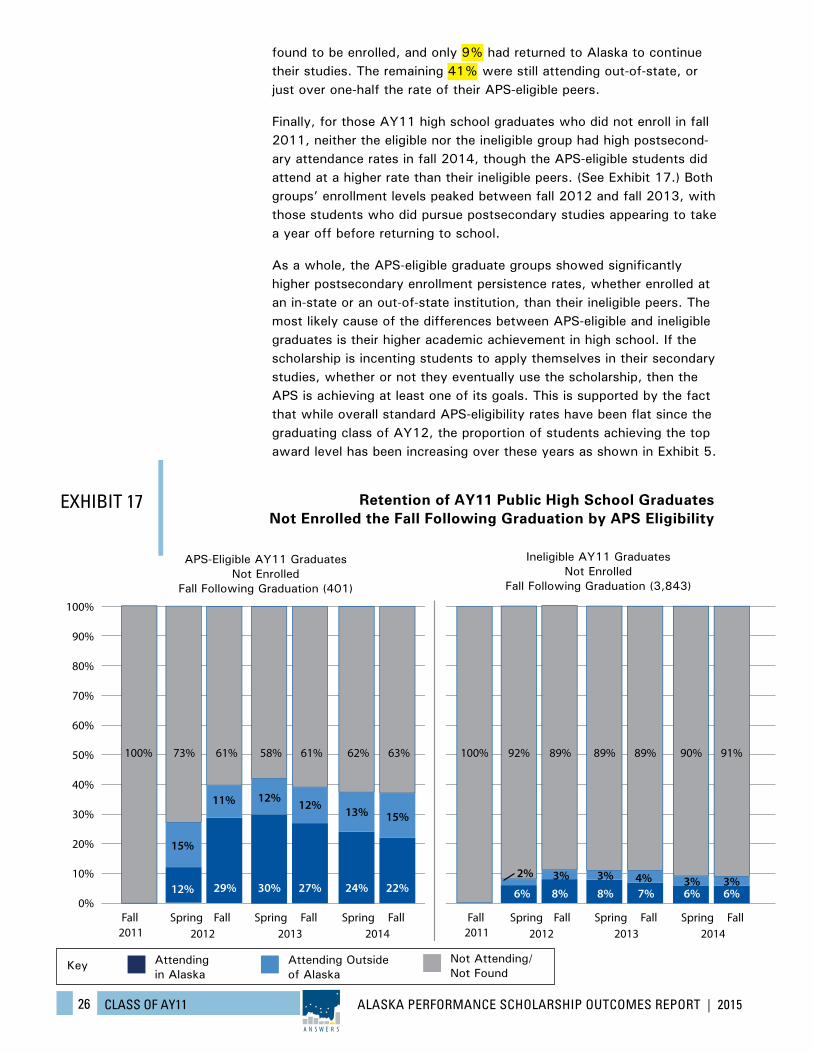
Finally, for those AY11 high school graduates who did not enroll in fall 2011, neither the eligible nor the ineligible group had high postsecond-ary attendance rates in fall 2014, though the APS-eligible students did attend at a higher rate than their ineligible peers. (See Exhibit 17.) Both groups’ enrollment levels peaked between fall 2012 and fall 2013, with those students who did pursue postsecondary studies appearing to take a year off before returning to school.
As a whole, the APS-eligible graduate groups showed significantly higher postsecondary enrollment persistence rates, whether enrolled at an in-state or an out-of-state institution, than their ineligible peers. The most likely cause of the differences between APS-eligible and ineligible graduates is their higher academic achievement in high school. If the scholarship is incenting students to apply themselves in their secondary studies, whether or not they eventually use the scholarship, then the APS is achieving at least one of its goals. This is supported by the fact that while overall standard APS-eligibility rates have been flat since the graduating class of AY12, the proportion of students achieving the top award level has been increasing over these years as shown in Exhibit 5.
EXHIBIT 17 Retention of AY11 Public High School Graduates Not Enrolled the Fall Following Graduation by APS Eligibility
APS-Eligible AY11 Graduates Not Enrolled
Fall Following Graduation (401)
Ineligible AY11 Graduates Not Enrolled
Fall Following Graduation (3,843)
0%
10%
20%
30%
40%
50%
60%
70%
80%
90%
100%
20122011Fall Spring Fall Spring Fall
2013
61%58%61%73%
12%12%11%
15%
27%30%
Spring Fall2014
63%62%
15%13%
22%24%29%12%
100%
20122011Fall Spring Fall Spring Fall
2013
89%89%89%92%
4%3%3%2%
7%8%
Spring Fall2014
91%90%
3%3%6%6%8%6%
100%
Key Attending Outside of Alaska
Attending in Alaska
Not Attending/ Not Found
ALASKA PERFORMANCE SCHOLARSHIP OUTCOMES REPORT | 201527 CLASS OF AY11
A N S W E R S
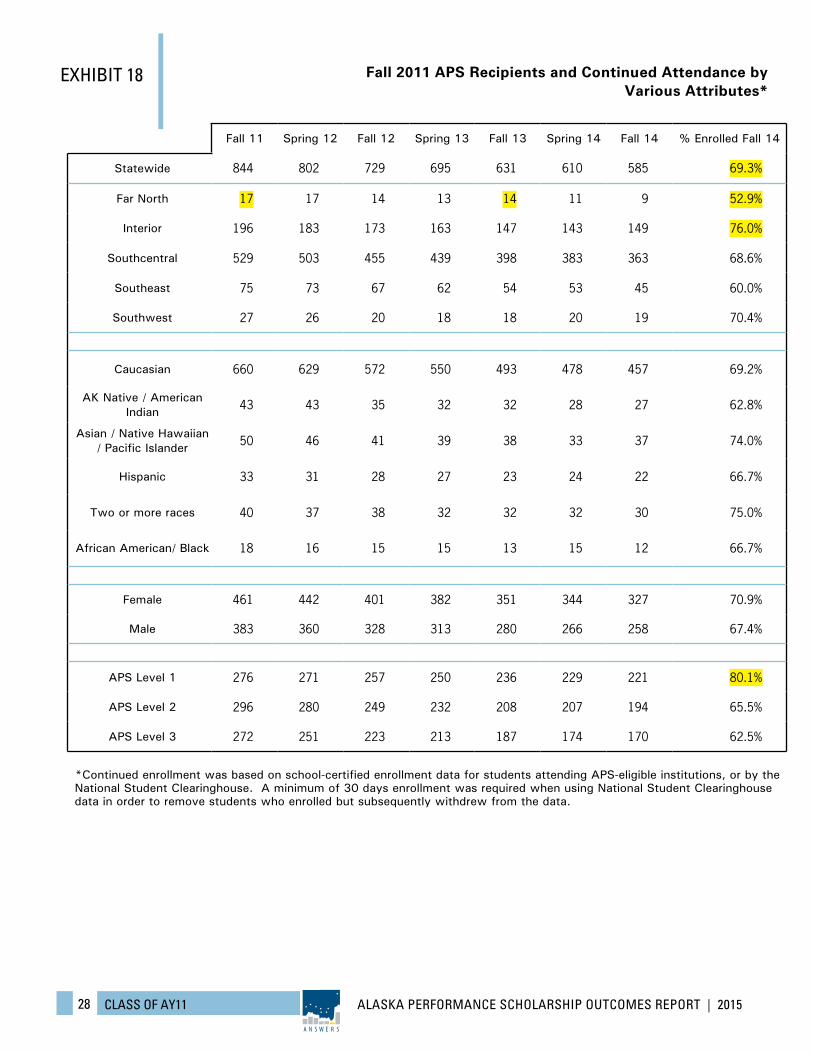
APS recipients’ pattern of continued attendance has not been consis-tent across the demographic groups and across regions, though the differences were smaller than might have been expected. (See Exhibit 18.) About 69% of APS recipients enrolled in fall 2011 continued their postsecondary studies in fall 2014. Recipients from the Interior region were most likely to still be enrolled, with 76% still pursuing their studies, and those from the Far North region were least likely at 52.9%. However, the issue of small numbers of students again comes into play. For enrollments in fall 2013 the Far North region led the state – 14 of 17 of the region’s fall 2011 APS recipients, over 80%, remained enrolled.
Similar swings occurred across the ethnic groups, though the vari-ance between continued attendance percentages were much smaller. Three-quarters of recipients characterizing themselves as being two or more races were enrolled in fall 2014, the highest percentage of any ethnicity in both of the last two years we have tracked continued at-tendance patterns. For fall 2014, American Indian / Alaska Natives had the lowest continuation rate, but again, small numbers are a significant factor when presenting as a percentage of the population. For fall 2013, American Indian / Alaska Native students had the second highest reported rate, at over 72%.
As noted earlier, female high school graduates are more likely to be eligible for the APS, but both males and females use the scholarship at similar rates. However, for the AY11 graduates receiving the scholar-ship in fall 2011, females again lead in their continued enrollment in postsecondary studies. This follows the pattern for all postsecondary attendance, nationally and statewide.
Much larger differences in continued enrollment occurred across APS eligibility levels. For Level 1 recipients in fall 2011, 80% were still en-rolled in fall 2014. That was a 14 percentage point increase compared to enrollments for Level 2 recipients, and 17 points for Level 3.
ALASKA PERFORMANCE SCHOLARSHIP OUTCOMES REPORT | 201528 CLASS OF AY11
A N S W E R S
Fall 11 Spring 12 Fall 12 Spring 13 Fall 13 Spring 14 Fall 14 % Enrolled Fall 14
Statewide 844 802 729 695 631 610 585 69.3%
Far North 17 17 14 13 14 11 9 52.9%
Interior 196 183 173 163 147 143 149 76.0%
Southcentral 529 503 455 439 398 383 363 68.6%
Southeast 75 73 67 62 54 53 45 60.0%
Southwest 27 26 20 18 18 20 19 70.4%
Caucasian 660 629 572 550 493 478 457 69.2%
AK Native / American Indian 43 43 35 32 32 28 27 62.8%
Asian / Native Hawaiian / Pacific Islander 50 46 41 39 38 33 37 74.0%
Hispanic 33 31 28 27 23 24 22 66.7%
Two or more races 40 37 38 32 32 32 30 75.0%
African American/ Black 18 16 15 15 13 15 12 66.7%
Female 461 442 401 382 351 344 327 70.9%
Male 383 360 328 313 280 266 258 67.4%
APS Level 1 276 271 257 250 236 229 221 80.1%
APS Level 2 296 280 249 232 208 207 194 65.5%
APS Level 3 272 251 223 213 187 174 170 62.5%
EXHIBIT 18 Fall 2011 APS Recipients and Continued Attendance by Various Attributes*
*Continued enrollment was based on school-certified enrollment data for students attending APS-eligible institutions, or by the National Student Clearinghouse. A minimum of 30 days enrollment was required when using National Student Clearinghouse data in order to remove students who enrolled but subsequently withdrew from the data.
ALASKA PERFORMANCE SCHOLARSHIP OUTCOMES REPORT | 201529 UNIVERSITY OF ALASKA
A N S W E R S
APS RECIPIENTS ATTENDING THE
UNIVERSITY OF ALASKA
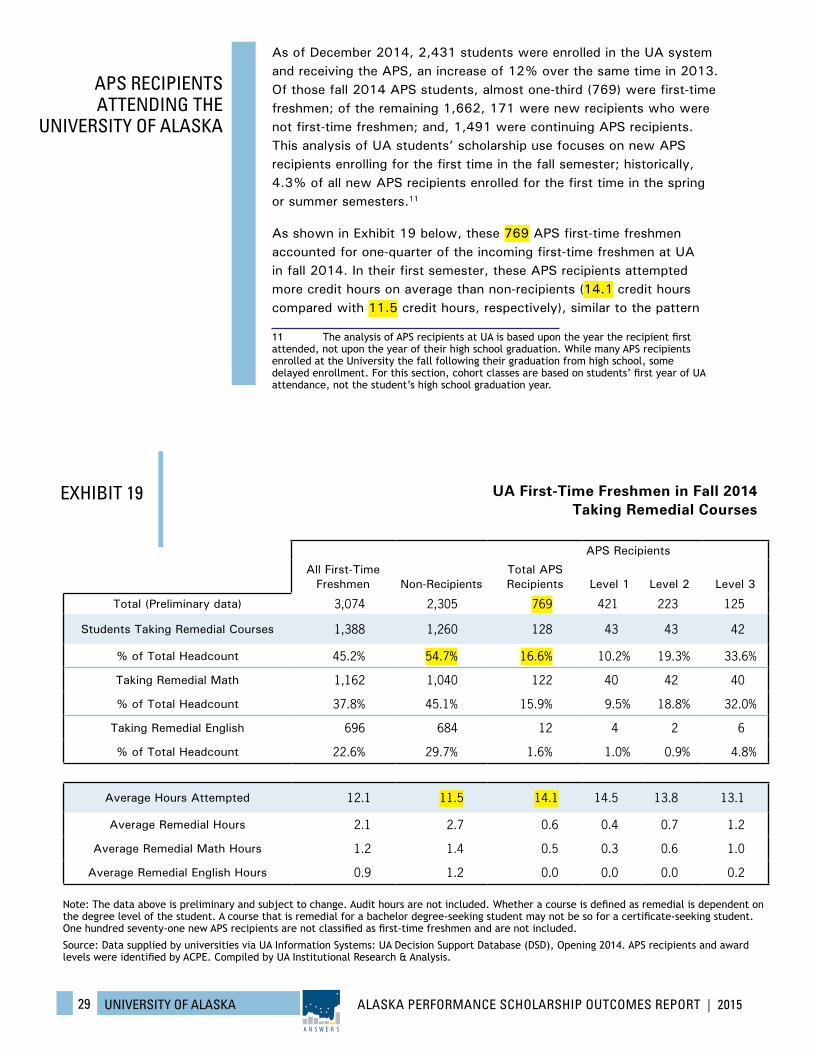
As of December 2014, 2,431 students were enrolled in the UA system and receiving the APS, an increase of 12% over the same time in 2013. Of those fall 2014 APS students, almost one-third (769) were first-time freshmen; of the remaining 1,662, 171 were new recipients who were not first-time freshmen; and, 1,491 were continuing APS recipients. This analysis of UA students’ scholarship use focuses on new APS recipients enrolling for the first time in the fall semester; historically, 4.3% of all new APS recipients enrolled for the first time in the spring or summer semesters.11
As shown in Exhibit 19 below, these 769 APS first-time freshmen accounted for one-quarter of the incoming first-time freshmen at UA in fall 2014. In their first semester, these APS recipients attempted more credit hours on average than non-recipients (14.1 credit hours compared with 11.5 credit hours, respectively), similar to the pattern
11 The analysis of APS recipients at UA is based upon the year the recipient first attended, not upon the year of their high school graduation. While many APS recipients enrolled at the University the fall following their graduation from high school, some delayed enrollment. For this section, cohort classes are based on students’ first year of UA attendance, not the student’s high school graduation year.
EXHIBIT 19 UA First-Time Freshmen in Fall 2014 Taking Remedial Courses
All First-Time Freshmen Non-Recipients
APS Recipients
Total APS Recipients Level 1 Level 2 Level 3
Total (Preliminary data) 3,074 2,305 769 421 223 125
Students Taking Remedial Courses 1,388 1,260 128 43 43 42
% of Total Headcount 45.2% 54.7% 16.6% 10.2% 19.3% 33.6%
Taking Remedial Math 1,162 1,040 122 40 42 40
% of Total Headcount 37.8% 45.1% 15.9% 9.5% 18.8% 32.0%
Taking Remedial English 696 684 12 4 2 6
% of Total Headcount 22.6% 29.7% 1.6% 1.0% 0.9% 4.8%
Average Hours Attempted 12.1 11.5 14.1 14.5 13.8 13.1
Average Remedial Hours 2.1 2.7 0.6 0.4 0.7 1.2
Average Remedial Math Hours 1.2 1.4 0.5 0.3 0.6 1.0
Average Remedial English Hours 0.9 1.2 0.0 0.0 0.0 0.2
Note: The data above is preliminary and subject to change. Audit hours are not included. Whether a course is defined as remedial is dependent on the degree level of the student. A course that is remedial for a bachelor degree-seeking student may not be so for a certificate-seeking student. One hundred seventy-one new APS recipients are not classified as first-time freshmen and are not included.
Source: Data supplied by universities via UA Information Systems: UA Decision Support Database (DSD), Opening 2014. APS recipients and award levels were identified by ACPE. Compiled by UA Institutional Research & Analysis.
ALASKA PERFORMANCE SCHOLARSHIP OUTCOMES REPORT | 201530 UNIVERSITY OF ALASKA
A N S W E R S
observed in prior years. About one in six first-time freshmen APS recipi-ents took a developmental course in fall 2014 (16.6%), versus more than one out of two non-recipients (54.7%). Enrollment in develop-mental coursework decreased for both APS recipient and non-recipient first-time freshmen by approximately four percentage points compared to fall 2013.
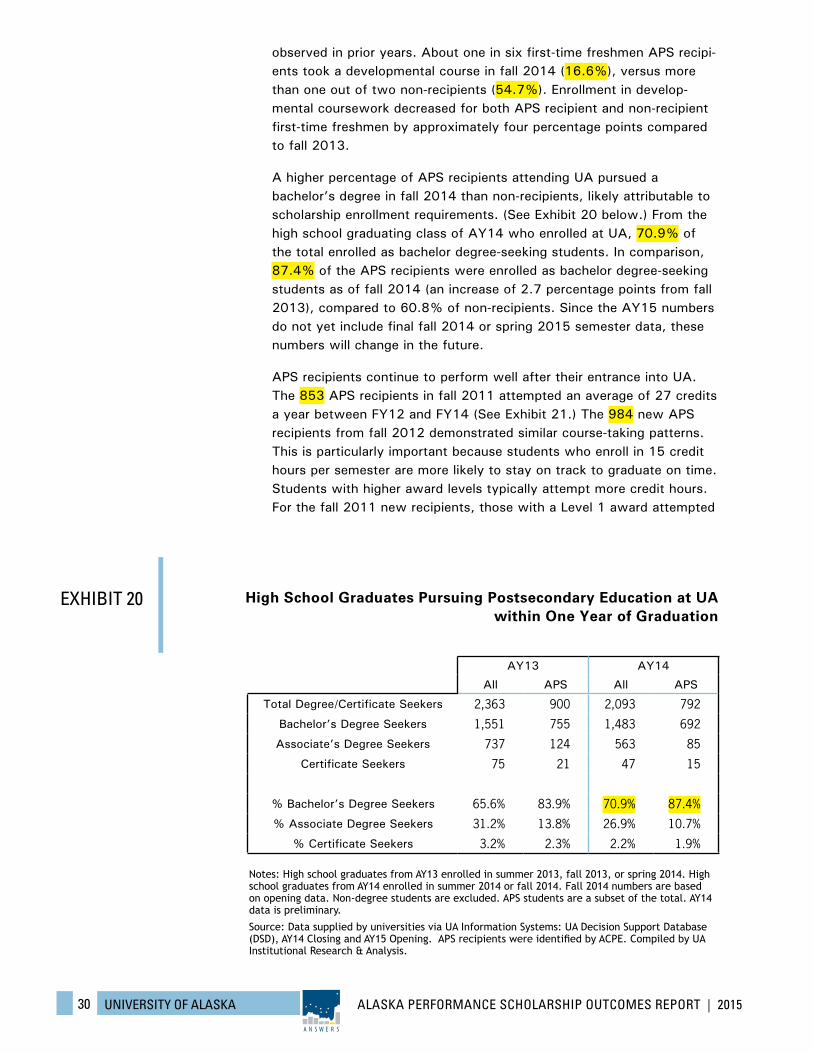
A higher percentage of APS recipients attending UA pursued a bachelor’s degree in fall 2014 than non-recipients, likely attributable to scholarship enrollment requirements. (See Exhibit 20 below.) From the high school graduating class of AY14 who enrolled at UA, 70.9% of the total enrolled as bachelor degree-seeking students. In comparison, 87.4% of the APS recipients were enrolled as bachelor degree-seeking students as of fall 2014 (an increase of 2.7 percentage points from fall 2013), compared to 60.8% of non-recipients. Since the AY15 numbers do not yet include final fall 2014 or spring 2015 semester data, these numbers will change in the future.
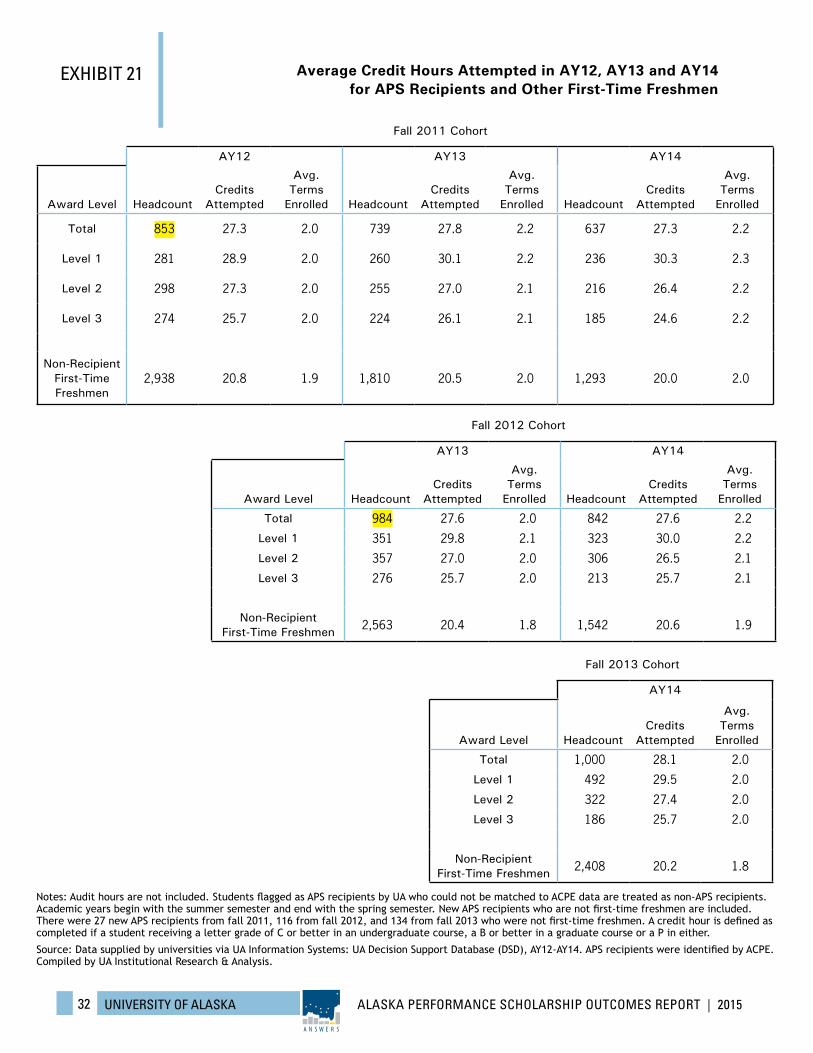
APS recipients continue to perform well after their entrance into UA. The 853 APS recipients in fall 2011 attempted an average of 27 credits a year between FY12 and FY14 (See Exhibit 21.) The 984 new APS recipients from fall 2012 demonstrated similar course-taking patterns. This is particularly important because students who enroll in 15 credit hours per semester are more likely to stay on track to graduate on time. Students with higher award levels typically attempt more credit hours. For the fall 2011 new recipients, those with a Level 1 award attempted
EXHIBIT 20
Notes: High school graduates from AY13 enrolled in summer 2013, fall 2013, or spring 2014. High school graduates from AY14 enrolled in summer 2014 or fall 2014. Fall 2014 numbers are based on opening data. Non-degree students are excluded. APS students are a subset of the total. AY14 data is preliminary.
Source: Data supplied by universities via UA Information Systems: UA Decision Support Database (DSD), AY14 Closing and AY15 Opening. APS recipients were identified by ACPE. Compiled by UA Institutional Research & Analysis.
AY13 AY14
All APS All APS
Total Degree/Certificate Seekers 2,363 900 2,093 792
Bachelor’s Degree Seekers 1,551 755 1,483 692
Associate’s Degree Seekers 737 124 563 85
Certificate Seekers 75 21 47 15
% Bachelor’s Degree Seekers 65.6% 83.9% 70.9% 87.4%
% Associate Degree Seekers 31.2% 13.8% 26.9% 10.7%
% Certificate Seekers 3.2% 2.3% 2.2% 1.9%
High School Graduates Pursuing Postsecondary Education at UA within One Year of Graduation
ALASKA PERFORMANCE SCHOLARSHIP OUTCOMES REPORT | 201531 UNIVERSITY OF ALASKA
A N S W E R S
approximately three more credit hours (or one class) in each academic year than the Level 3 recipients. Students receiving Level 1 awards also complete a higher percentage of credit hours than those with Level 2 or 3 awards.
For members of this same 2011 cohort, Level 2 and Level 3 award recipients performed similarly to non-recipients in the percentage of credits completed versus attempted in AY13 and AY14, but ended each year with four to five more credit hours earned than their non-APS eligible cohorts. While not included in Exhibit 21, APS first-time fresh-men recipients are completing more than two classes’ of credit hours in their first year than are non-APS first-time freshmen on average, and continue this pattern into their subsequent years of study. After four years of studies, these differences could amount to over 24 credit hours, or more than a semester and one-half at the full-time equivalent of 15 credit hours per semester.
At the same time, UA has worked to increase the number of credit hours completed per semester for all of its students. It has implemented a number of programs to support timely graduation by encouraging students to make conscious choices about their education, such as the UA system’s Stay on Track campaign and use of the academic advis-ing tool DegreeWorks. Stay on Track urges students to do more than choose classes every semester by building a plan to get through college faster and at lower cost. The campaign engages students through social media, contests, and other communication efforts and provides direct links to tools, advice from those working to graduate in four years, and suggestions for keeping one’s self on track. DegreeWorks is a web-based tool that allows students to see their progress to graduation and evaluate hypothetical scenarios based on what majors they choose.
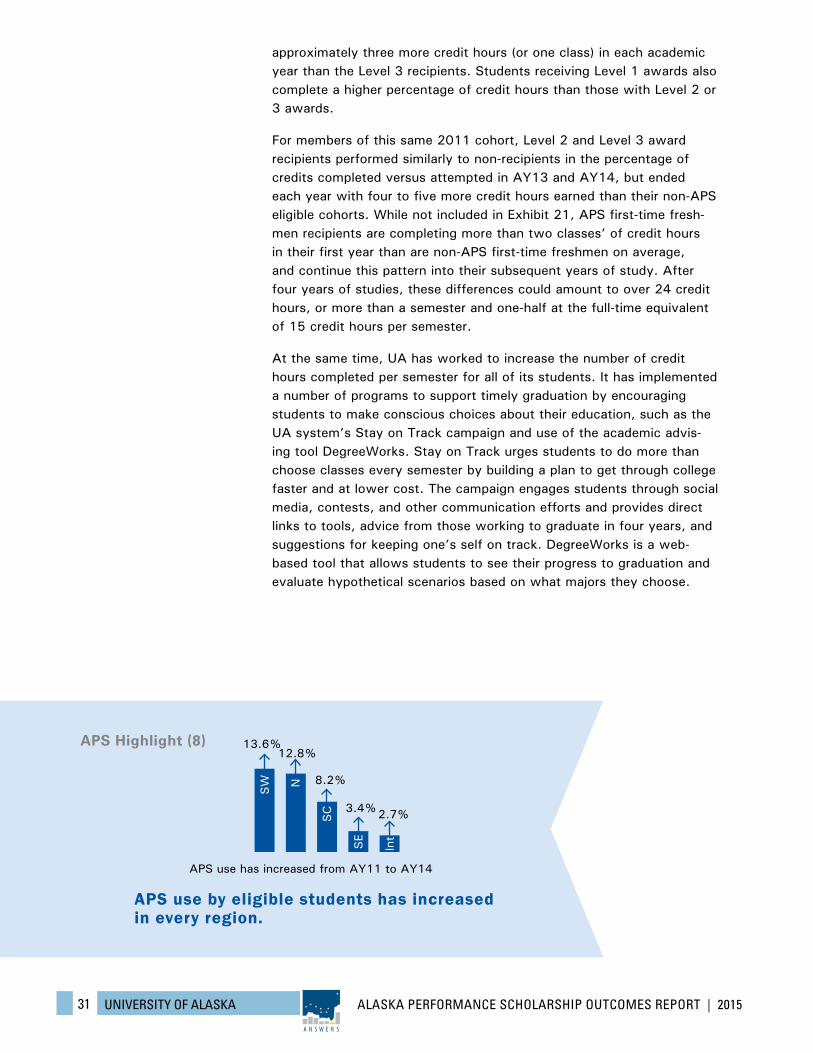
APS use by eligible students has increased in every region.
APS use has increased from AY11 to AY14
13.6%12.8%
8.2%
3.4%2.7%
SW
SE
Int
N
SC
APS Highlight (8)
ALASKA PERFORMANCE SCHOLARSHIP OUTCOMES REPORT | 201532 UNIVERSITY OF ALASKA
A N S W E R S
Fall 2012 Cohort
AY13 AY14
Award Level HeadcountCredits
Attempted
Avg. Terms
Enrolled HeadcountCredits
Attempted
Avg. Terms
Enrolled
Total 984 27.6 2.0 842 27.6 2.2
Level 1 351 29.8 2.1 323 30.0 2.2
Level 2 357 27.0 2.0 306 26.5 2.1
Level 3 276 25.7 2.0 213 25.7 2.1
Non-Recipient
First-Time Freshmen 2,563 20.4 1.8 1,542 20.6 1.9
Fall 2011 Cohort
AY12 AY13 AY14
Award Level HeadcountCredits
Attempted
Avg. Terms
Enrolled HeadcountCredits
Attempted
Avg. Terms
Enrolled HeadcountCredits
Attempted
Avg. Terms
Enrolled
Total 853 27.3 2.0 739 27.8 2.2 637 27.3 2.2
Level 1 281 28.9 2.0 260 30.1 2.2 236 30.3 2.3
Level 2 298 27.3 2.0 255 27.0 2.1 216 26.4 2.2
Level 3 274 25.7 2.0 224 26.1 2.1 185 24.6 2.2
Non-Recipient First-Time Freshmen
2,938 20.8 1.9 1,810 20.5 2.0 1,293 20.0 2.0
Fall 2013 Cohort
AY14
Award Level HeadcountCredits
Attempted
Avg. Terms
Enrolled
Total 1,000 28.1 2.0
Level 1 492 29.5 2.0
Level 2 322 27.4 2.0
Level 3 186 25.7 2.0
Non-Recipient
First-Time Freshmen 2,408 20.2 1.8
Notes: Audit hours are not included. Students flagged as APS recipients by UA who could not be matched to ACPE data are treated as non-APS recipients. Academic years begin with the summer semester and end with the spring semester. New APS recipients who are not first-time freshmen are included. There were 27 new APS recipients from fall 2011, 116 from fall 2012, and 134 from fall 2013 who were not first-time freshmen. A credit hour is defined as completed if a student receiving a letter grade of C or better in an undergraduate course, a B or better in a graduate course or a P in either.
Source: Data supplied by universities via UA Information Systems: UA Decision Support Database (DSD), AY12-AY14. APS recipients were identified by ACPE. Compiled by UA Institutional Research & Analysis.
EXHIBIT 21 Average Credit Hours Attempted in AY12, AY13 and AY14 for APS Recipients and Other First-Time Freshmen
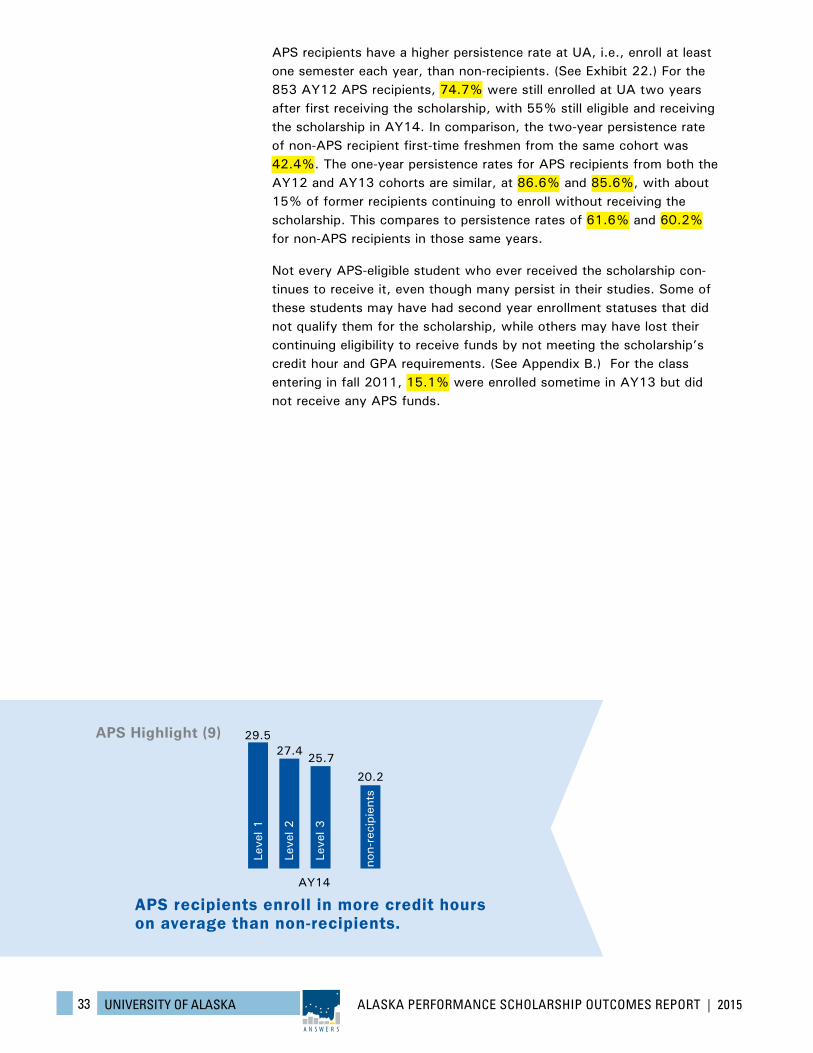
ALASKA PERFORMANCE SCHOLARSHIP OUTCOMES REPORT | 201533 UNIVERSITY OF ALASKA
A N S W E R S
APS recipients have a higher persistence rate at UA, i.e., enroll at least one semester each year, than non-recipients. (See Exhibit 22.) For the 853 AY12 APS recipients, 74.7% were still enrolled at UA two years after first receiving the scholarship, with 55% still eligible and receiving the scholarship in AY14. In comparison, the two-year persistence rate of non-APS recipient first-time freshmen from the same cohort was 42.4%. The one-year persistence rates for APS recipients from both the AY12 and AY13 cohorts are similar, at 86.6% and 85.6%, with about 15% of former recipients continuing to enroll without receiving the scholarship. This compares to persistence rates of 61.6% and 60.2% for non-APS recipients in those same years.
Not every APS-eligible student who ever received the scholarship con-tinues to receive it, even though many persist in their studies. Some of these students may have had second year enrollment statuses that did not qualify them for the scholarship, while others may have lost their continuing eligibility to receive funds by not meeting the scholarship’s credit hour and GPA requirements. (See Appendix B.) For the class entering in fall 2011, 15.1% were enrolled sometime in AY13 but did not receive any APS funds.
APS recipients enroll in more credit hours on average than non-recipients.
AY14
APS Highlight (9)
Leve
l 1
Leve
l 2
Leve
l 3
non-
reci
pien
ts
29.527.4
25.7
20.2
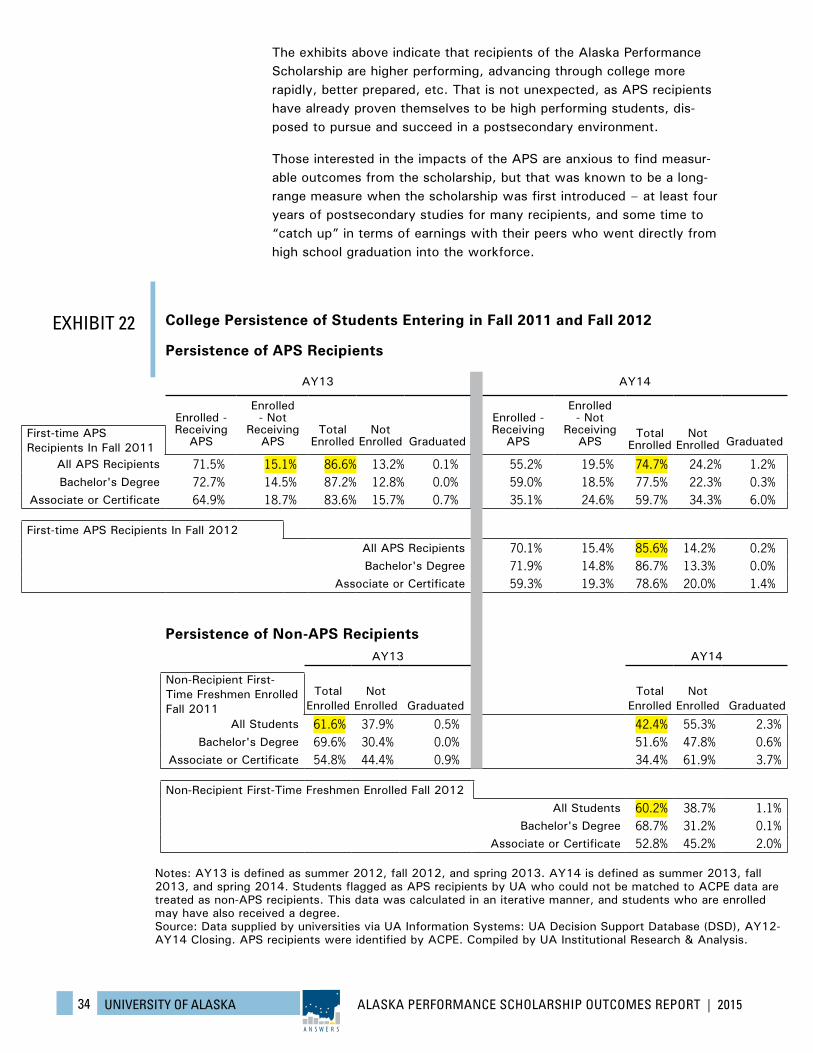
ALASKA PERFORMANCE SCHOLARSHIP OUTCOMES REPORT | 201534 UNIVERSITY OF ALASKA
A N S W E R S
EXHIBIT 22
AY13 AY14
Enrolled - Receiving
APS
Enrolled - Not
Receiving APS
Total Enrolled
Not Enrolled Graduated
Enrolled - Receiving
APS
Enrolled - Not
Receiving APS
Total Enrolled
Not Enrolled Graduated
First-time APS Recipients In Fall 2011
All APS Recipients 71.5% 15.1% 86.6% 13.2% 0.1% 55.2% 19.5% 74.7% 24.2% 1.2%Bachelor's Degree 72.7% 14.5% 87.2% 12.8% 0.0% 59.0% 18.5% 77.5% 22.3% 0.3%
Associate or Certificate 64.9% 18.7% 83.6% 15.7% 0.7% 35.1% 24.6% 59.7% 34.3% 6.0%
First-time APS Recipients In Fall 2012All APS Recipients 70.1% 15.4% 85.6% 14.2% 0.2%Bachelor's Degree 71.9% 14.8% 86.7% 13.3% 0.0%
Associate or Certificate 59.3% 19.3% 78.6% 20.0% 1.4%
AY13 AY14
Total Enrolled
Not Enrolled Graduated
Total Enrolled
Not Enrolled Graduated
Non-Recipient First-Time Freshmen Enrolled Fall 2011
All Students 61.6% 37.9% 0.5% 42.4% 55.3% 2.3%Bachelor's Degree 69.6% 30.4% 0.0% 51.6% 47.8% 0.6%
Associate or Certificate 54.8% 44.4% 0.9% 34.4% 61.9% 3.7%
Non-Recipient First-Time Freshmen Enrolled Fall 2012All Students 60.2% 38.7% 1.1%
Bachelor's Degree 68.7% 31.2% 0.1%Associate or Certificate 52.8% 45.2% 2.0%
Persistence of Non-APS Recipients
Persistence of APS Recipients
College Persistence of Students Entering in Fall 2011 and Fall 2012
Notes: AY13 is defined as summer 2012, fall 2012, and spring 2013. AY14 is defined as summer 2013, fall 2013, and spring 2014. Students flagged as APS recipients by UA who could not be matched to ACPE data are treated as non-APS recipients. This data was calculated in an iterative manner, and students who are enrolled may have also received a degree.Source: Data supplied by universities via UA Information Systems: UA Decision Support Database (DSD), AY12-AY14 Closing. APS recipients were identified by ACPE. Compiled by UA Institutional Research & Analysis.
The exhibits above indicate that recipients of the Alaska Performance Scholarship are higher performing, advancing through college more rapidly, better prepared, etc. That is not unexpected, as APS recipients have already proven themselves to be high performing students, dis-posed to pursue and succeed in a postsecondary environment.
Those interested in the impacts of the APS are anxious to find measur-able outcomes from the scholarship, but that was known to be a long-range measure when the scholarship was first introduced – at least four years of postsecondary studies for many recipients, and some time to “catch up” in terms of earnings with their peers who went directly from high school graduation into the workforce.
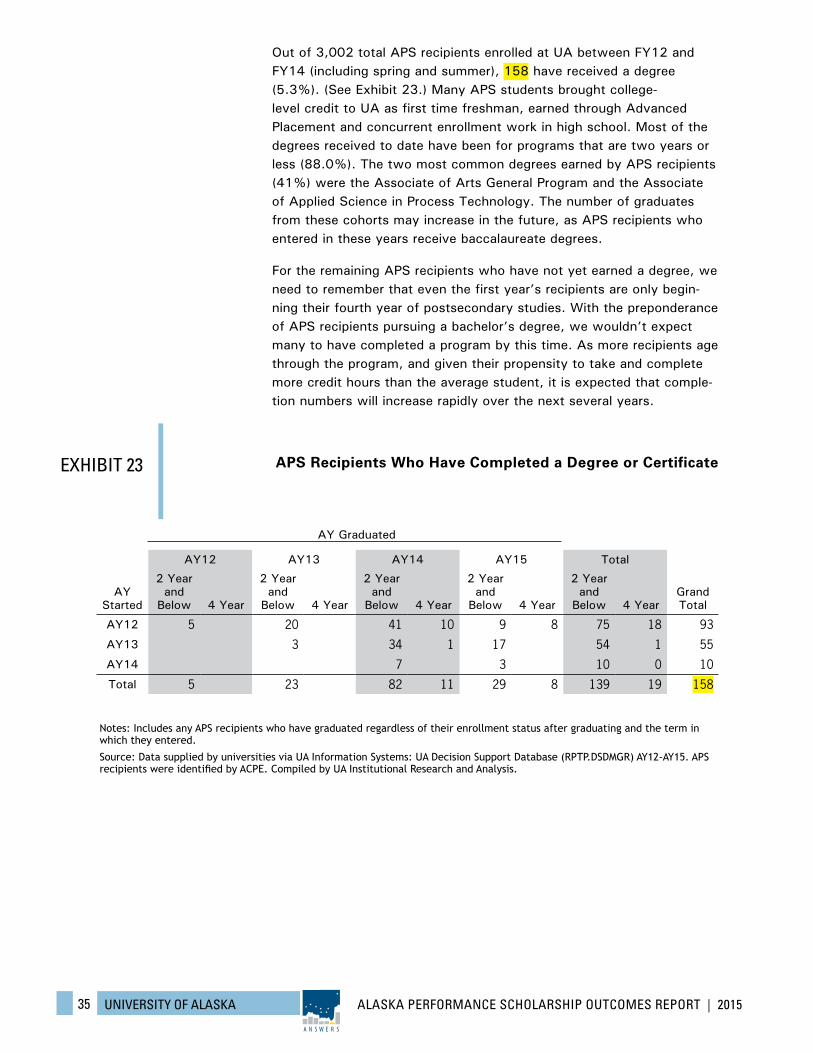
ALASKA PERFORMANCE SCHOLARSHIP OUTCOMES REPORT | 201535 UNIVERSITY OF ALASKA
A N S W E R S
Out of 3,002 total APS recipients enrolled at UA between FY12 and FY14 (including spring and summer), 158 have received a degree (5.3%). (See Exhibit 23.) Many APS students brought college-level credit to UA as first time freshman, earned through Advanced Placement and concurrent enrollment work in high school. Most of the degrees received to date have been for programs that are two years or less (88.0%). The two most common degrees earned by APS recipients (41%) were the Associate of Arts General Program and the Associate of Applied Science in Process Technology. The number of graduates from these cohorts may increase in the future, as APS recipients who entered in these years receive baccalaureate degrees.
For the remaining APS recipients who have not yet earned a degree, we need to remember that even the first year’s recipients are only begin-ning their fourth year of postsecondary studies. With the preponderance of APS recipients pursuing a bachelor’s degree, we wouldn’t expect many to have completed a program by this time. As more recipients age through the program, and given their propensity to take and complete more credit hours than the average student, it is expected that comple-tion numbers will increase rapidly over the next several years.
Notes: Includes any APS recipients who have graduated regardless of their enrollment status after graduating and the term in which they entered.
Source: Data supplied by universities via UA Information Systems: UA Decision Support Database (RPTP.DSDMGR) AY12-AY15. APS recipients were identified by ACPE. Compiled by UA Institutional Research and Analysis.
EXHIBIT 23 APS Recipients Who Have Completed a Degree or Certificate
AY12 AY13 AY14 AY15 Total
AY Started
2 Year and
Below 4 Year
2 Year and
Below 4 Year
2 Year and
Below 4 Year
2 Year and
Below 4 Year
2 Year and
Below 4 YearGrand Total
AY12 5 20 41 10 9 8 75 18 93
AY13 3 34 1 17 54 1 55
AY14 7 3 10 0 10
Total 5 23 82 11 29 8 139 19 158
AY Graduated
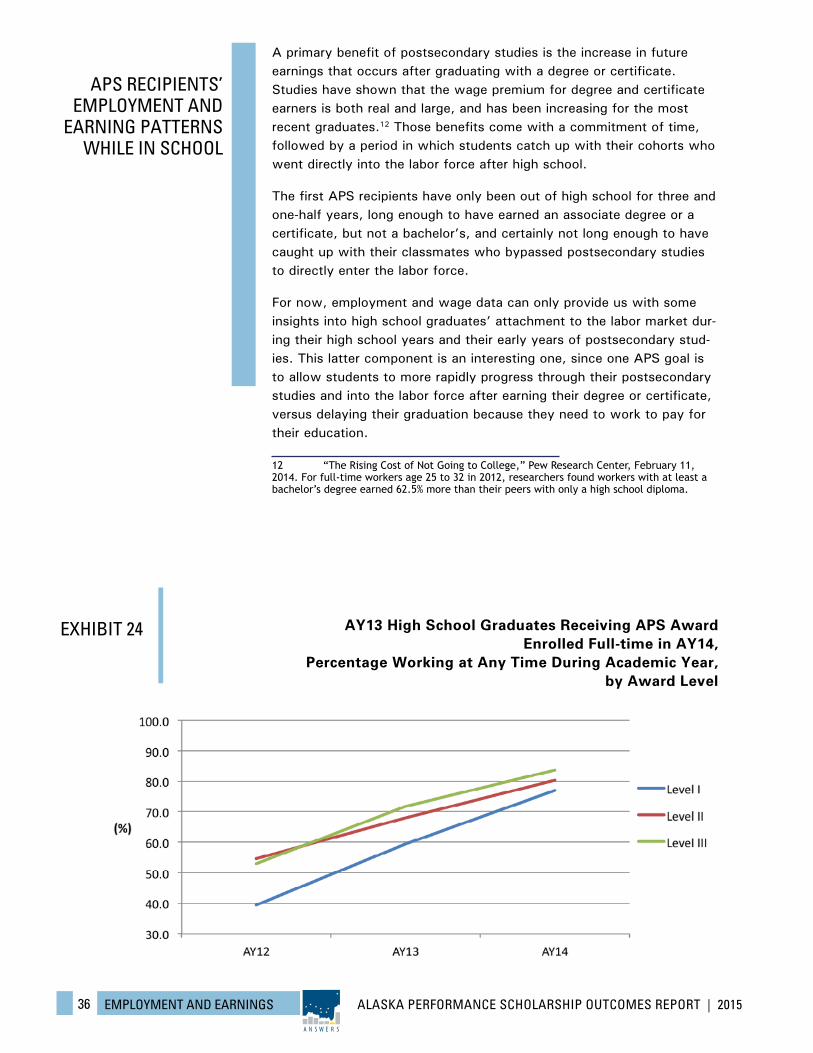
ALASKA PERFORMANCE SCHOLARSHIP OUTCOMES REPORT | 201536 EMPLOYMENT AND EARNINGS
A N S W E R S
A primary benefit of postsecondary studies is the increase in future earnings that occurs after graduating with a degree or certificate. Studies have shown that the wage premium for degree and certificate earners is both real and large, and has been increasing for the most recent graduates.12 Those benefits come with a commitment of time, followed by a period in which students catch up with their cohorts who went directly into the labor force after high school.
The first APS recipients have only been out of high school for three and one-half years, long enough to have earned an associate degree or a certificate, but not a bachelor’s, and certainly not long enough to have caught up with their classmates who bypassed postsecondary studies to directly enter the labor force.
For now, employment and wage data can only provide us with some insights into high school graduates’ attachment to the labor market dur-ing their high school years and their early years of postsecondary stud-ies. This latter component is an interesting one, since one APS goal is to allow students to more rapidly progress through their postsecondary studies and into the labor force after earning their degree or certificate, versus delaying their graduation because they need to work to pay for their education.
12 “The Rising Cost of Not Going to College,” Pew Research Center, February 11, 2014. For full-time workers age 25 to 32 in 2012, researchers found workers with at least a bachelor’s degree earned 62.5% more than their peers with only a high school diploma.
APS RECIPIENTS’ EMPLOYMENT AND
EARNING PATTERNS WHILE IN SCHOOL
EXHIBIT 24 AY13 High School Graduates Receiving APS Award Enrolled Full-time in AY14,
Percentage Working at Any Time During Academic Year, by Award Level
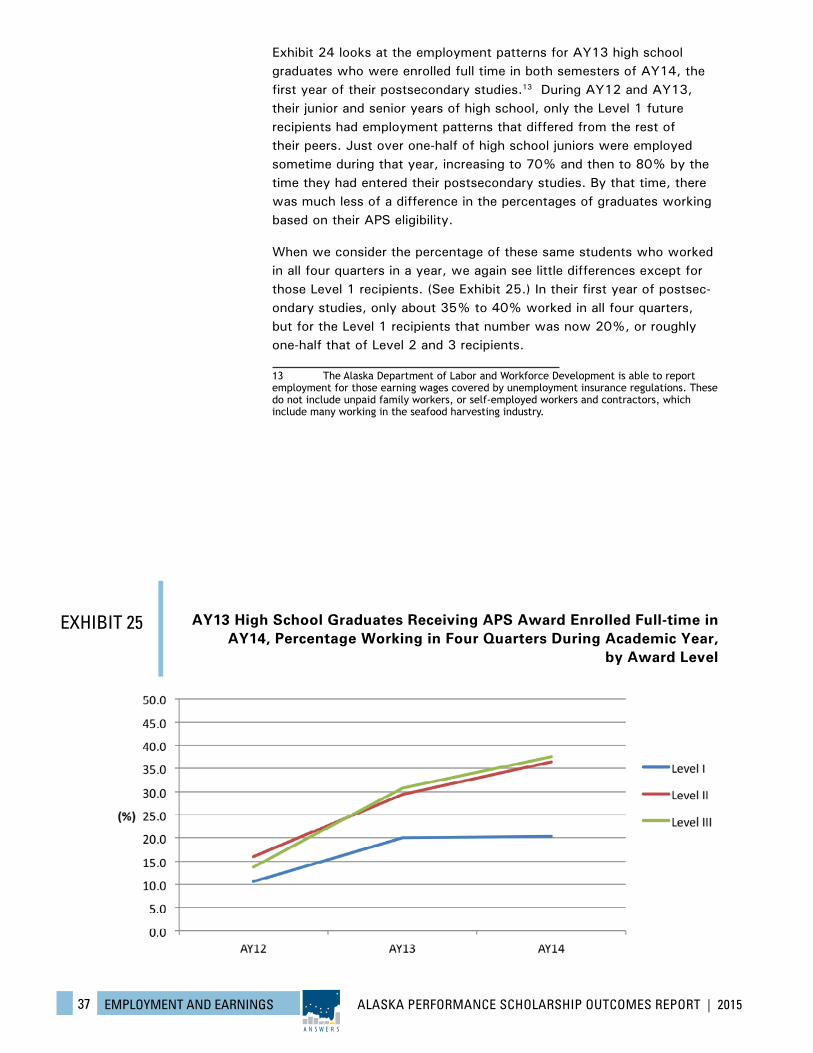
ALASKA PERFORMANCE SCHOLARSHIP OUTCOMES REPORT | 201537 EMPLOYMENT AND EARNINGS
A N S W E R S
Exhibit 24 looks at the employment patterns for AY13 high school graduates who were enrolled full time in both semesters of AY14, the first year of their postsecondary studies.13 During AY12 and AY13, their junior and senior years of high school, only the Level 1 future recipients had employment patterns that differed from the rest of their peers. Just over one-half of high school juniors were employed sometime during that year, increasing to 70% and then to 80% by the time they had entered their postsecondary studies. By that time, there was much less of a difference in the percentages of graduates working based on their APS eligibility.
When we consider the percentage of these same students who worked in all four quarters in a year, we again see little differences except for those Level 1 recipients. (See Exhibit 25.) In their first year of postsec-ondary studies, only about 35% to 40% worked in all four quarters, but for the Level 1 recipients that number was now 20%, or roughly one-half that of Level 2 and 3 recipients.
13 The Alaska Department of Labor and Workforce Development is able to report employment for those earning wages covered by unemployment insurance regulations. These do not include unpaid family workers, or self-employed workers and contractors, which include many working in the seafood harvesting industry.
EXHIBIT 25 AY13 High School Graduates Receiving APS Award Enrolled Full-time in AY14, Percentage Working in Four Quarters During Academic Year,
by Award Level
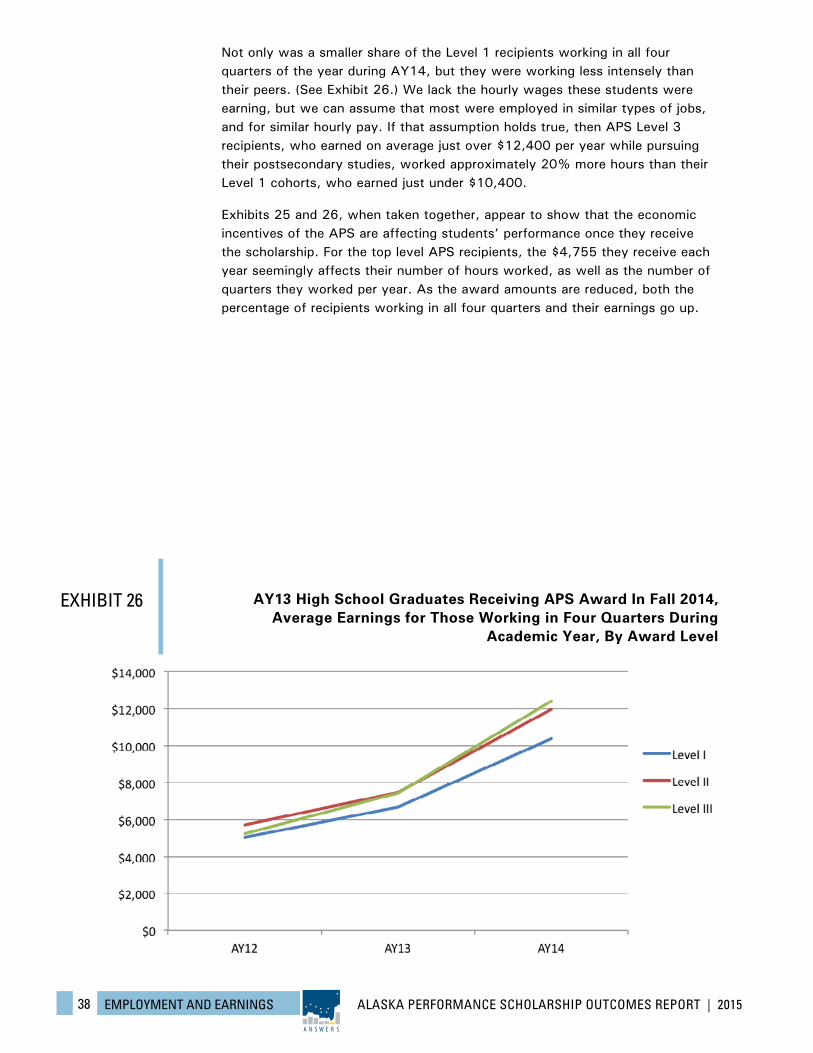
ALASKA PERFORMANCE SCHOLARSHIP OUTCOMES REPORT | 201538 EMPLOYMENT AND EARNINGS
A N S W E R S
Not only was a smaller share of the Level 1 recipients working in all four quarters of the year during AY14, but they were working less intensely than their peers. (See Exhibit 26.) We lack the hourly wages these students were earning, but we can assume that most were employed in similar types of jobs, and for similar hourly pay. If that assumption holds true, then APS Level 3 recipients, who earned on average just over $12,400 per year while pursuing their postsecondary studies, worked approximately 20% more hours than their Level 1 cohorts, who earned just under $10,400.
Exhibits 25 and 26, when taken together, appear to show that the economic incentives of the APS are affecting students’ performance once they receive the scholarship. For the top level APS recipients, the $4,755 they receive each year seemingly affects their number of hours worked, as well as the number of quarters they worked per year. As the award amounts are reduced, both the percentage of recipients working in all four quarters and their earnings go up.
EXHIBIT 26 AY13 High School Graduates Receiving APS Award In Fall 2014, Average Earnings for Those Working in Four Quarters During
Academic Year, By Award Level
ALASKA PERFORMANCE SCHOLARSHIP OUTCOMES REPORT | 201539 CONCLUSION
A N S W E R S
Each year, as new high school graduates become eligible for the APS and others continue to make use of it, this report tries to answer a seemingly simple question: is the APS producing its intended outcomes? While a conclusive answer has not yet emerged from the data, recipients’ performances suggest that the answer will be yes.
From a research perspective, lacking a control group of similarly qualified graduates who lack access to the scholarship and with whose academic performance APS recipients may be compared, it is not possible to identify specific APS impacts on recipients. Nevertheless, what we do know is that APS recipients exhibit notable, positive differences in their postsecondary pursuits compared to non-recipients in many areas.
The percentage of standard APS-eligible high school graduates has changed little since the current eligibility requirements were implemented in the second year of the program – about one-in-four graduates qualify for a standard award. Still there have been strong increases in the percentages of graduates eligible for the top award level and eligible graduates using their award—both indicators that the APS is motivating students to attain higher levels of academic achievement and remain in Alaska for the pursuit of that goal.
APS eligibility is an indicator that graduates are preparing themselves to pursue postsecondary studies, and their subsequent performance seems to support this. Once enrolled, recipients are taking more credit hours than their ineligible peers, with fewer remedial credits. As a result, APS recipients are progressing more rapidly towards their program completion than their peers and accelerating their progress to a credential.
APS recipients are also persisting in their studies at higher rates than their peers. Again, their high achievement during high school likely predisposes APS-eligible students to continue with their postsecondary pursuits.
Another factor for APS recipients is that the scholarship appears to be influencing their employment patterns, allowing them to focus more time on their studies and less time on working to cover their cost of attendance. This trend of higher award amounts leading to less attachment to the workforce and fewer hours worked was noted in last year’s report, and the pattern continued this year.
All of the above characteristics of APS recipients support the scholarship’s goals – to inspire students to push themselves academically in areas that highly correlate to success in college and career training. While difficult to assign a cause and effect relationship between scholarship receipt and enhanced academic performance, the data demonstrates APS recipients are performing at high levels in their pursuit of a postsecondary credential, and will soon be reaping the benefits of their efforts.
In future years’ reports, as APS program graduates move into the workforce, it will be possible to begin to describe the return on the investment through Alaska’s statewide scholarship.
CONCLUSION
ALASKA PERFORMANCE SCHOLARSHIP OUTCOMES REPORT | 201540 APPENDIX A
A N S W E R S
APPENDIX A
Data Sources for the 2015 APS Outcomes Report
Information on high school graduates is available from several sources. EED main-tains information on public school students in its K-12 data system, which is the primary source for information on socioeconomic and demographic information on APS-eligible public school students, and allows for comparing those eligible stu-dents to the student body as a whole. The EED public school graduates’ data can be considered to be in its final form, with only minor updates or changes expected.
Private and home schooled high school graduates must apply for the APS through EED, and must provide evidence of having met the academic requirements to re-ceive the scholarship. However, since not all private and home schooled students are required to provide information to EED, and their APS applications contain very little demographic and no socioeconomic information, we cannot compare the APS-eligible private and home schooled graduates to all non- public school students in the state. For that reason, several tables and charts presented in this report represent only public school graduates.
For students pursing postsecondary education at one of the University of Alaska campuses, UA’s student information system is the primary source of information about their progress toward attaining their degree or certificate. Incorporating the information on Alaska high school graduates provided by EED, the Institutional Research & Analysis (IRA) unit at UA provided characteristics of APS-eligible students, including findings on enrollments for students attending any UA school. Data included in this report was collected early in the fall semester, and will change once complete semester data becomes available.
DOLWD is able to link its labor force and wage data to high school and postsec-ondary graduates, a capability that provides valuable information on the effects of the APS. While it is well-documented that total lifetime earnings are closely tied to education, APS recipients are still only marginally attached to the workforce. At this time, the benefits of receiving APS funds are more likely associated with the students’ abilities to focus their time and attention on their studies, versus having to earn an income in order to afford postsecondary education. Though it is still too soon to be certain how receipt of the APS affects students’ labor force participation subsequent to their postsecondary pursuits, some preliminary data is available for prior years’ APS recipients and is presented in this report.
ACPE collects information on those students who complete the Free Application for Federal Student Aid (FAFSA), and collects additional information on students receiving the APS, as well as students receiving other grants and loans it admin-isters. ACPE also contracts with the National Student Clearinghouse (NSC) to receive information on Alaska students and their pursuit of postsecondary educa-tion, either in or outside the state14.
By combining the data available from these different sources, this third annual report provides additional information to create a profile of the state’s most recent graduates, of APS-eligible students, and of APS recipients.
14 NSC reports that it receives enrollment data on 98% of all U.S. higher education students from 3,600 postsecondary institutions. NSC is more likely to miss students in smaller schools and those pursuing certificates and vocational licenses. For Alaska, the NSC database contains information only from the UA system and Alaska Pacific University. Slight errors may occur with the algorithm to match students, which may result in reports not being consistently equal.
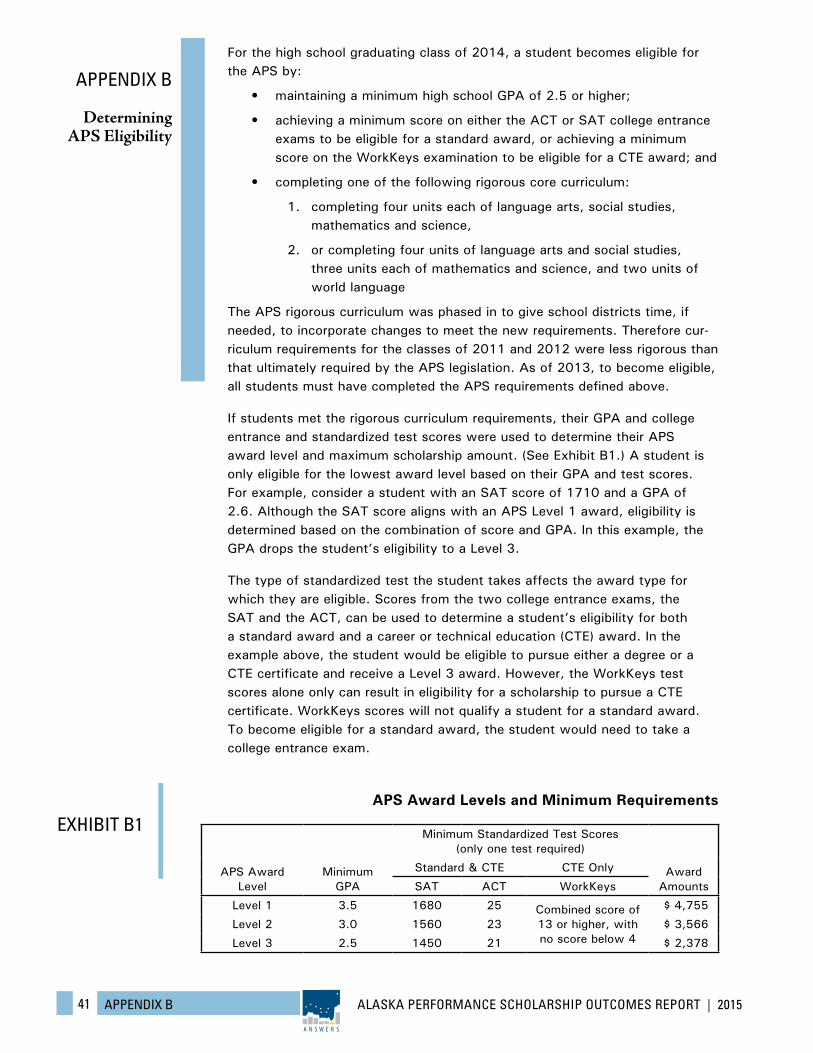
ALASKA PERFORMANCE SCHOLARSHIP OUTCOMES REPORT | 201541 APPENDIX B
A N S W E R S
APPENDIX B
Determining APS Eligibility
APS Award Level
Minimum GPA
Minimum Standardized Test Scores (only one test required)
Award Amounts
Standard & CTE CTE Only
SAT ACT WorkKeys
Level 1 3.5 1680 25 Combined score of 13 or higher, with no score below 4
$ 4,755
Level 2 3.0 1560 23 $ 3,566
Level 3 2.5 1450 21 $ 2,378
APS Award Levels and Minimum Requirements
EXHIBIT B1
For the high school graduating class of 2014, a student becomes eligible for the APS by:
• maintaining a minimum high school GPA of 2.5 or higher;
• achieving a minimum score on either the ACT or SAT college entrance exams to be eligible for a standard award, or achieving a minimum score on the WorkKeys examination to be eligible for a CTE award; and
• completing one of the following rigorous core curriculum:
1. completing four units each of language arts, social studies, mathematics and science,
2. or completing four units of language arts and social studies, three units each of mathematics and science, and two units of world language
The APS rigorous curriculum was phased in to give school districts time, if needed, to incorporate changes to meet the new requirements. Therefore cur-riculum requirements for the classes of 2011 and 2012 were less rigorous than that ultimately required by the APS legislation. As of 2013, to become eligible, all students must have completed the APS requirements defined above.
If students met the rigorous curriculum requirements, their GPA and college entrance and standardized test scores were used to determine their APS award level and maximum scholarship amount. (See Exhibit B1.) A student is only eligible for the lowest award level based on their GPA and test scores.For example, consider a student with an SAT score of 1710 and a GPA of 2.6. Although the SAT score aligns with an APS Level 1 award, eligibility is determined based on the combination of score and GPA. In this example, the GPA drops the student’s eligibility to a Level 3.
The type of standardized test the student takes affects the award type for which they are eligible. Scores from the two college entrance exams, the SAT and the ACT, can be used to determine a student’s eligibility for both a standard award and a career or technical education (CTE) award. In the example above, the student would be eligible to pursue either a degree or a CTE certificate and receive a Level 3 award. However, the WorkKeys test scores alone only can result in eligibility for a scholarship to pursue a CTE certificate. WorkKeys scores will not qualify a student for a standard award. To become eligible for a standard award, the student would need to take a college entrance exam.
ALASKA PERFORMANCE SCHOLARSHIP OUTCOMES REPORT | 201542 APPENDIX B
A N S W E R S
RECEIVING THE SCHOLARSHIP
To actually receive the APS, a student must:
submit a FAFSA or an approved alternative application no later than June 30 for the following academic year15;
enroll in a qualified postsecondary program at one of the 27 participating institutions, or pursue an approved certificate or vocational licensure program at one of six CTE institutions in the state;
enroll in:
at least 12 credit hours for each semester (total of 24 per academic year) to receive the full amount of their APS award during their freshman year, and 15 credit hours each semester (total of 30 per academic year) in subsequent years; or
at least 6 credit hours to receive a half-time award16; or a qualifying clock-hour CTE program.
have an unmet cost of attendance17 of $500 or more.
15 For AY13 graduates, the FAFSA and alternative application deadlines were extended to December 13, 2013, because of the availability of funding to provide additional scholarships after the June 30 filing deadline. For AY14 graduates, the application deadline was extended to December 15, 201416 Students pursuing graduate degrees have lower credit hour limit requirements.17 The cost of attendance includes tuition, fees, books, required tools and supplies, room, board and transportation. To determine qualifying unmet cost of attendance, this amount is reduced by all other non-loan aid (scholarships, grants, etc.). If the unmet cost of attendance is less than $500, a student does not receive any APS funds. If the unmet cost of attendance is greater than $500 but less than the available APS award amount, the student receives up to the amount of the unmet cost of attendance.
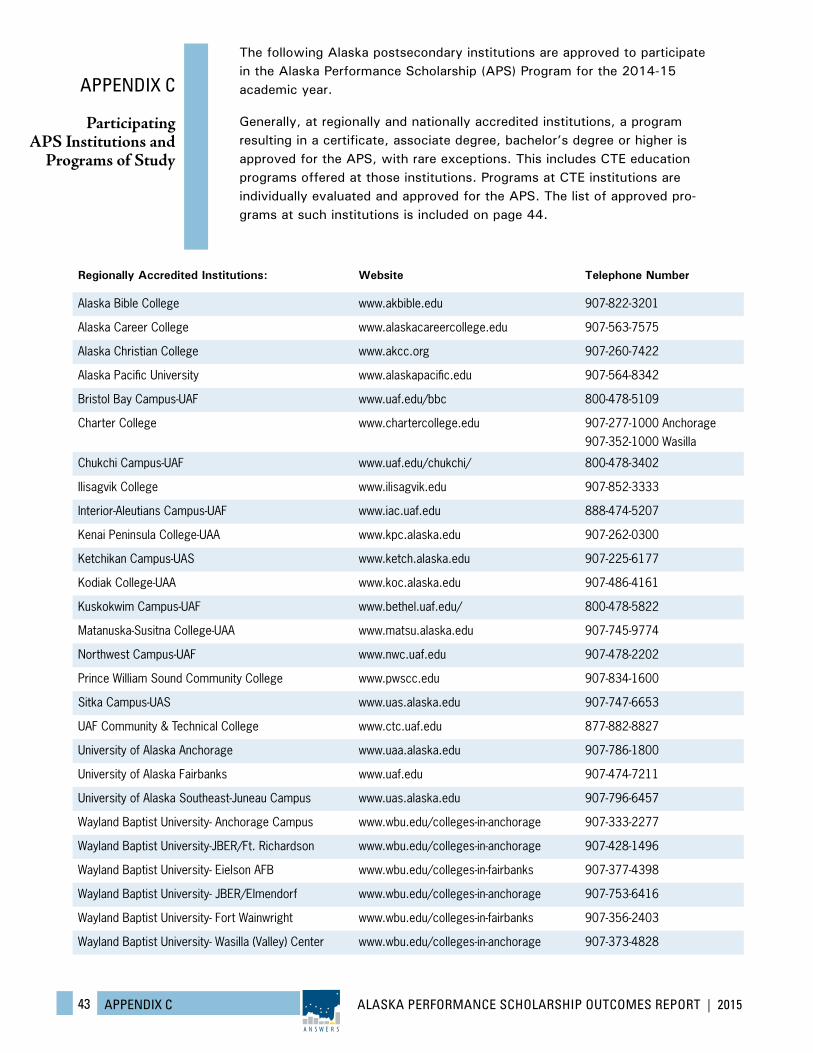
ALASKA PERFORMANCE SCHOLARSHIP OUTCOMES REPORT | 201543 APPENDIX C
A N S W E R S
APPENDIX C
Participating APS Institutions and
Programs of Study
Regionally Accredited Institutions: Website Telephone Number
Alaska Bible College www.akbible.edu 907-822-3201
Alaska Career College www.alaskacareercollege.edu 907-563-7575
Alaska Christian College www.akcc.org 907-260-7422
Alaska Pacific University www.alaskapacific.edu 907-564-8342
Bristol Bay Campus-UAF www.uaf.edu/bbc 800-478-5109
Charter College www.chartercollege.edu 907-277-1000 Anchorage 907-352-1000 Wasilla
Chukchi Campus-UAF www.uaf.edu/chukchi/ 800-478-3402
Ilisagvik College www.ilisagvik.edu 907-852-3333
Interior-Aleutians Campus-UAF www.iac.uaf.edu 888-474-5207
Kenai Peninsula College-UAA www.kpc.alaska.edu 907-262-0300
Ketchikan Campus-UAS www.ketch.alaska.edu 907-225-6177
Kodiak College-UAA www.koc.alaska.edu 907-486-4161
Kuskokwim Campus-UAF www.bethel.uaf.edu/ 800-478-5822
Matanuska-Susitna College-UAA www.matsu.alaska.edu 907-745-9774
Northwest Campus-UAF www.nwc.uaf.edu 907-478-2202
Prince William Sound Community College www.pwscc.edu 907-834-1600
Sitka Campus-UAS www.uas.alaska.edu 907-747-6653
UAF Community & Technical College www.ctc.uaf.edu 877-882-8827
University of Alaska Anchorage www.uaa.alaska.edu 907-786-1800
University of Alaska Fairbanks www.uaf.edu 907-474-7211
University of Alaska Southeast-Juneau Campus www.uas.alaska.edu 907-796-6457
Wayland Baptist University- Anchorage Campus www.wbu.edu/colleges-in-anchorage 907-333-2277
Wayland Baptist University-JBER/Ft. Richardson www.wbu.edu/colleges-in-anchorage 907-428-1496
Wayland Baptist University- Eielson AFB www.wbu.edu/colleges-in-fairbanks 907-377-4398
Wayland Baptist University- JBER/Elmendorf www.wbu.edu/colleges-in-anchorage 907-753-6416
Wayland Baptist University- Fort Wainwright www.wbu.edu/colleges-in-fairbanks 907-356-2403
Wayland Baptist University- Wasilla (Valley) Center www.wbu.edu/colleges-in-anchorage 907-373-4828
The following Alaska postsecondary institutions are approved to participate in the Alaska Performance Scholarship (APS) Program for the 2014-15 academic year.
Generally, at regionally and nationally accredited institutions, a program resulting in a certificate, associate degree, bachelor’s degree or higher is approved for the APS, with rare exceptions. This includes CTE education programs offered at those institutions. Programs at CTE institutions are individually evaluated and approved for the APS. The list of approved pro-grams at such institutions is included on page 44.
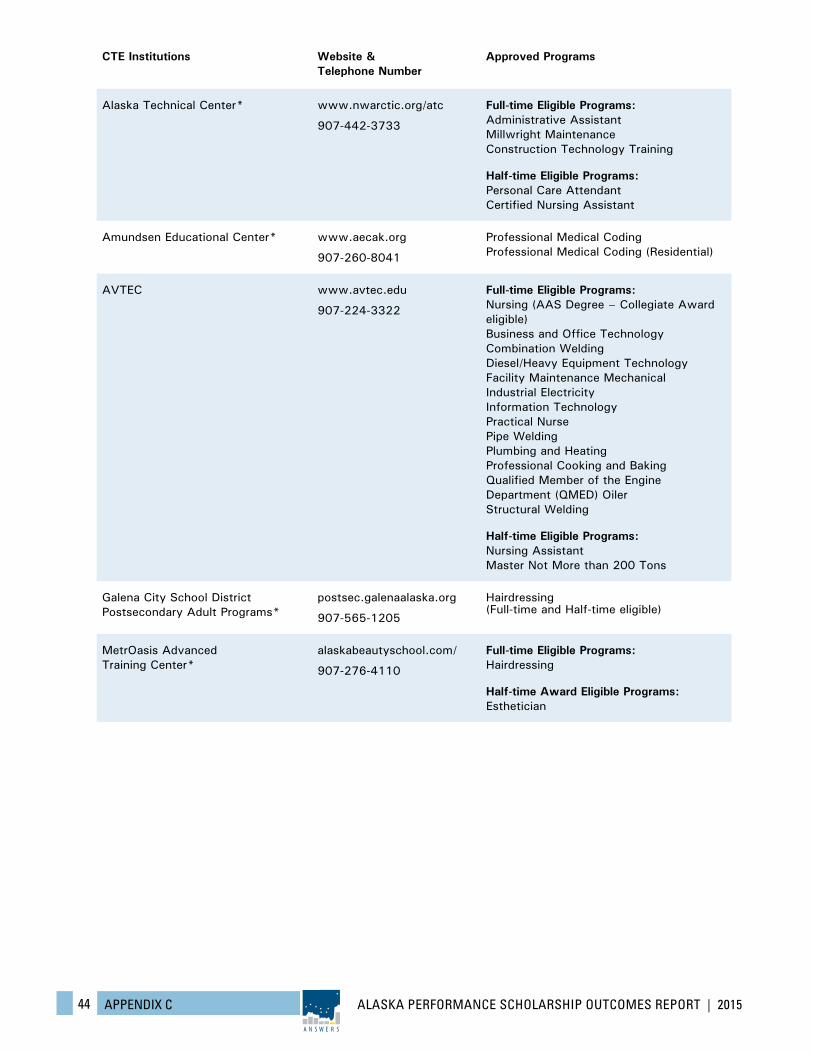
ALASKA PERFORMANCE SCHOLARSHIP OUTCOMES REPORT | 201544 APPENDIX C
A N S W E R S
CTE Institutions Website & Telephone Number
Approved Programs
Alaska Technical Center* www.nwarctic.org/atc
907-442-3733
Full-time Eligible Programs:Administrative AssistantMillwright MaintenanceConstruction Technology Training
Half-time Eligible Programs:Personal Care AttendantCertified Nursing Assistant
Amundsen Educational Center* www.aecak.org
907-260-8041
Professional Medical CodingProfessional Medical Coding (Residential)
AVTEC www.avtec.edu
907-224-3322
Full-time Eligible Programs:Nursing (AAS Degree – Collegiate Award eligible)Business and Office TechnologyCombination WeldingDiesel/Heavy Equipment TechnologyFacility Maintenance MechanicalIndustrial ElectricityInformation TechnologyPractical NursePipe WeldingPlumbing and HeatingProfessional Cooking and BakingQualified Member of the Engine Department (QMED) OilerStructural Welding
Half-time Eligible Programs:Nursing AssistantMaster Not More than 200 Tons
Galena City School District Postsecondary Adult Programs*
postsec.galenaalaska.org
907-565-1205
Hairdressing (Full-time and Half-time eligible)
MetrOasis Advanced Training Center*
alaskabeautyschool.com/
907-276-4110
Full-time Eligible Programs:Hairdressing
Half-time Award Eligible Programs:Esthetician
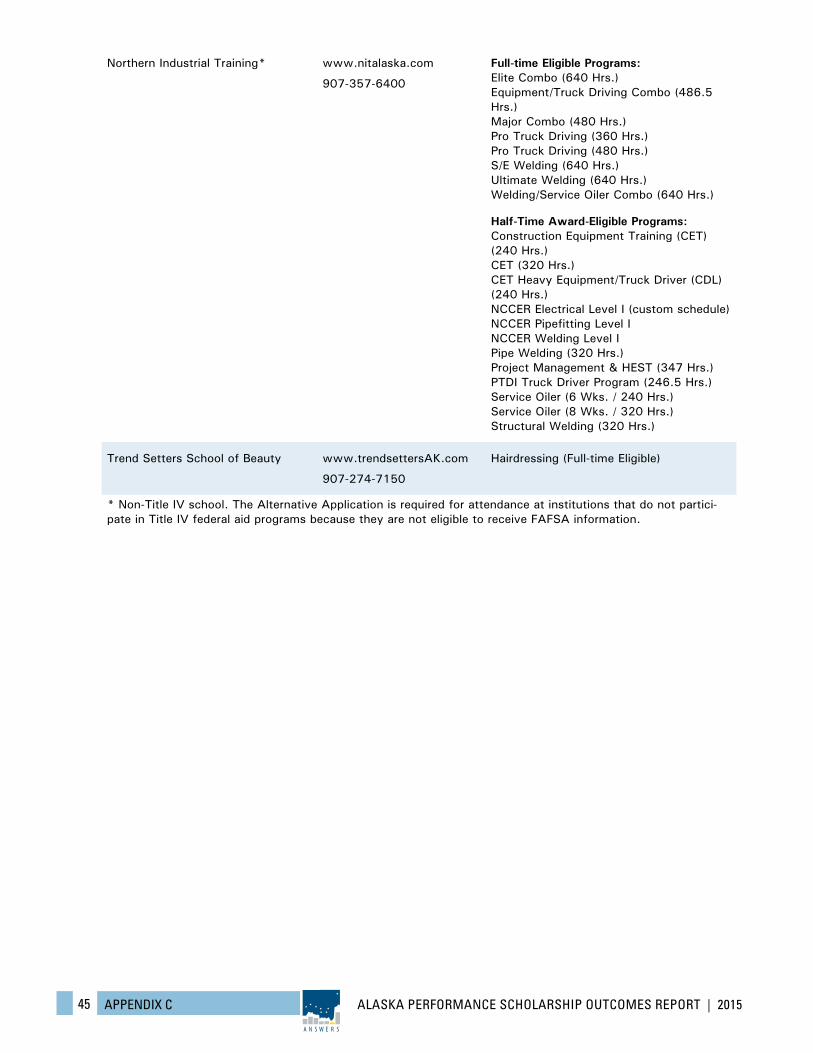
ALASKA PERFORMANCE SCHOLARSHIP OUTCOMES REPORT | 201545 APPENDIX C
A N S W E R S
Northern Industrial Training* www.nitalaska.com
907-357-6400
Full-time Eligible Programs:Elite Combo (640 Hrs.)Equipment/Truck Driving Combo (486.5 Hrs.)Major Combo (480 Hrs.)Pro Truck Driving (360 Hrs.)Pro Truck Driving (480 Hrs.)S/E Welding (640 Hrs.)Ultimate Welding (640 Hrs.)Welding/Service Oiler Combo (640 Hrs.)
Half-Time Award-Eligible Programs:Construction Equipment Training (CET) (240 Hrs.)CET (320 Hrs.)CET Heavy Equipment/Truck Driver (CDL) (240 Hrs.)NCCER Electrical Level I (custom schedule)NCCER Pipefitting Level INCCER Welding Level IPipe Welding (320 Hrs.)Project Management & HEST (347 Hrs.)PTDI Truck Driver Program (246.5 Hrs.)Service Oiler (6 Wks. / 240 Hrs.)Service Oiler (8 Wks. / 320 Hrs.)Structural Welding (320 Hrs.)
Trend Setters School of Beauty www.trendsettersAK.com
907-274-7150
Hairdressing (Full-time Eligible)
* Non-Title IV school. The Alternative Application is required for attendance at institutions that do not partici-pate in Title IV federal aid programs because they are not eligible to receive FAFSA information.
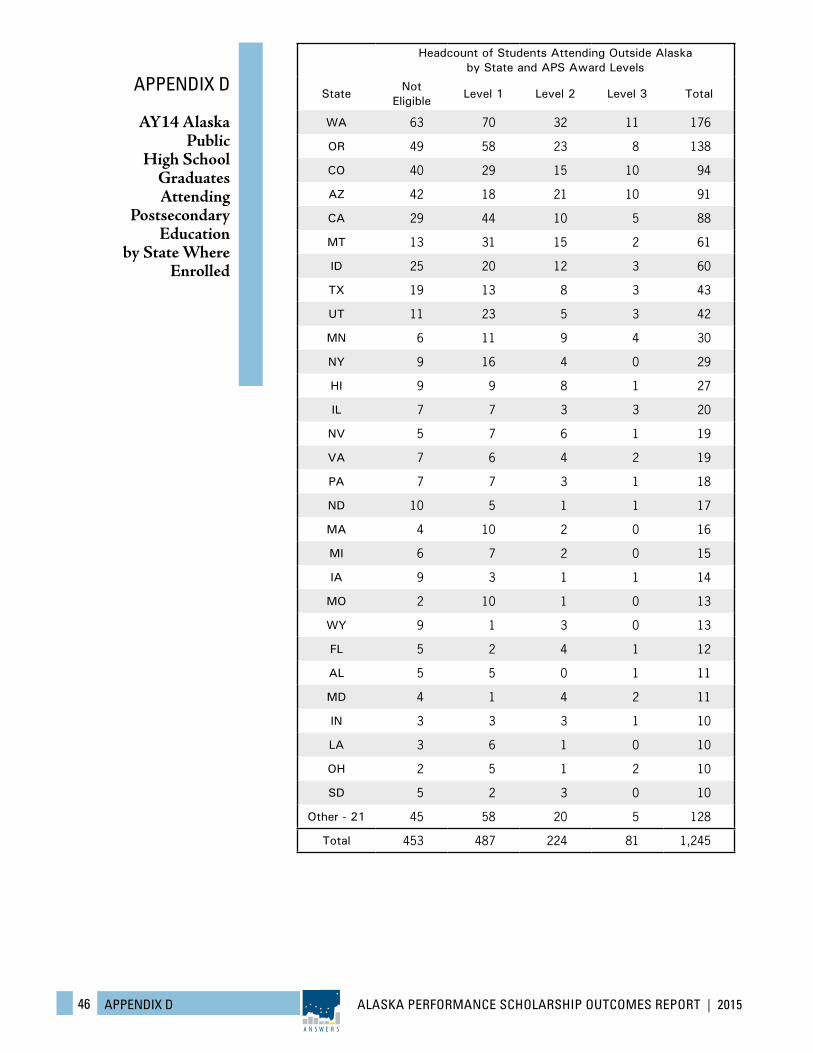
ALASKA PERFORMANCE SCHOLARSHIP OUTCOMES REPORT | 201546 APPENDIX D
A N S W E R S
APPENDIX D
AY14 Alaska Public
High School Graduates Attending
Postsecondary Education
by State Where Enrolled
Headcount of Students Attending Outside Alaska by State and APS Award Levels
StateNot
EligibleLevel 1 Level 2 Level 3 Total
WA 63 70 32 11 176
OR 49 58 23 8 138
CO 40 29 15 10 94
AZ 42 18 21 10 91
CA 29 44 10 5 88
MT 13 31 15 2 61
ID 25 20 12 3 60
TX 19 13 8 3 43
UT 11 23 5 3 42
MN 6 11 9 4 30
NY 9 16 4 0 29
HI 9 9 8 1 27
IL 7 7 3 3 20
NV 5 7 6 1 19
VA 7 6 4 2 19
PA 7 7 3 1 18
ND 10 5 1 1 17
MA 4 10 2 0 16
MI 6 7 2 0 15
IA 9 3 1 1 14
MO 2 10 1 0 13
WY 9 1 3 0 13
FL 5 2 4 1 12
AL 5 5 0 1 11
MD 4 1 4 2 11
IN 3 3 3 1 10
LA 3 6 1 0 10
OH 2 5 1 2 10
SD 5 2 3 0 10
Other - 21 45 58 20 5 128
Total 453 487 224 81 1,245
ALASKA PERFORMANCE SCHOLARSHIP OUTCOMES REPORT | 201547 APPENDIX E
A N S W E R S
APPENDIX EGlossary
Glossary18
Academic Year: A period of time schools use to measure a quantity of study. Academic years can vary from school to school and even from educational program to educational program at the same school, but for the Alaska Performance Scholarship the academic year begins on July 1st of any given year, and runs through June 30th. For example, the 2014 academic year (AY14) began on July 1, 2013 and runs through June 30, 2014
Alaska Performance Scholarship (APS): The state’s merit-based finan-cial aid program, providing assistance to Alaska’s high school graduates from the class of AY11 and more recent who met certain academic performance measures and who are attending qualifying postsecondary educational institu-tions in Alaska.
CTE Award: Funds provide to APS-eligible students to pursue a certificate at an APS-eligible institution. Graduates can become eligible for CTE awards based either on their SAT/ACT college entrance exam scores or their WorkKeys scores and GPA.
Certification (of student roster data): Certification is a process where a postsecondary institution verifies the data reported on a student’s FAFSA, and confirms that the student has qualifying enrollment and unmet cost of at-tendance at that school.
Costs of Attendance: For purposes of the APS, Alaska Administrative Code defines cost of attendance as the tuition, fees, books, required tools and supplies, room and board and transportation costs required to attend an APS-eligible postsecondary institution, in accordance with the standard budgets published by the institution. Costs differ based on students’ dependency status, with independent students normally having higher calculated costs based on living off campus.
Dependency Status (Independent / Dependent): Federal financial aid regulations define an independent student as one of the following: at least 24 years old, married, a graduate or professional student, a veteran, a member of the armed forces, an orphan, a ward of the court, or someone with legal dependents other than a spouse. Independent students do not include their parents’ income and asset information on their FAFSAs. A student who does not meet any of the criteria for an independent student is considered to be dependent. Dependent students are required to provide parent income and asset information on their FAFSAs.
18 Some definitions provided by the U.S. Department of Education, available at http://studentaid.ed.gov/PORTALSWebApp/students/english/Glossary.jsp, and by “FinAid! The SmartStudent Guide to Financial Aid,” available at www.finaid.org.
ALASKA PERFORMANCE SCHOLARSHIP OUTCOMES REPORT | 201548 APPENDIX E
A N S W E R S
Enrollment Status (full time, half time): For undergraduates, “full time” requires taking at least 12 credit hours during the recipient’s first two semesters of the scholarship, and at least 15 hours per semester in subsequent semesters. “Half time” requires taking at least 6 credit hours in a semester during the first two semesters, then 7.5 hours in subsequent semesters. For graduate students, full time requires 10 credit hours, and 5 for half time. Students pursuing a certificate are considered: full time if attending 30 clock hours a week for at least 12 weeks; or, half time if attending 15 clock hours a week for at least six weeks.
Family Educational Rights and Privacy Act (FERPA): FERPA (20 U.S.C. § 1232g; 34 CFR Part 99) is a Federal law that protects the privacy of student education records. The law applies to all schools that receive funds under an applicable program of the U.S. Department of Education. FERPA gives parents certain rights with respect to their children’s education records. These rights transfer to the student when he or she reaches the age of 18 or attends a school beyond the high school level.
Free Application for Federal Student Aid, or FAFSA: Federal form used to apply for federal need-based aid, such as Pell Grants, federal student loans, and many state grants. Submitting a FAFSA by June 30th is one of the requirements for a student to receive an APS award, though the application date has been extended in past years.
National Student Clearinghouse (NSC): NSC is a non-profit organiza-tion that collects and stores students’ enrollment and transcript data for more than 3,500 colleges and universities. NSC data allows us to determine how many students attended an out-of-state postsecondary institution.
Standard Award: Funds provide to APS-eligible students to pursue a degree, either a bachelor’s or an associate’s, at an APS-eligible institution. Graduates become eligible for collegiate awards based on their SAT/ACT col-lege entrance exam scores.
Unmet Costs of Attendance: The student’s costs of attendance minus all other non-loan and non-self-help aid for which a student is eligible. Non-loan aid includes UA Scholars awards, state and federal grants and other scholar-ships. The expected family contribution (EFC) identified on completion of the FAFSA is considered self-help and does not impact the Alaska Performance Scholarship amount a student may receive.
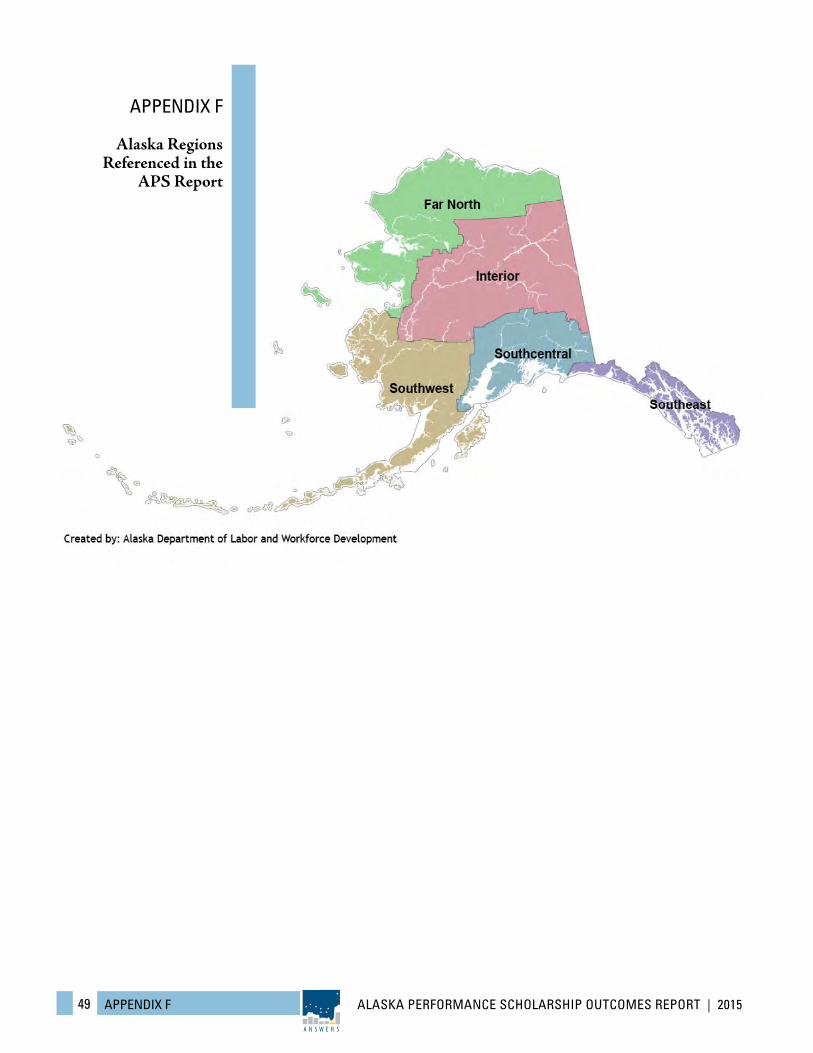
ALASKA PERFORMANCE SCHOLARSHIP OUTCOMES REPORT | 201549 APPENDIX F
A N S W E R S
APPENDIX F
Alaska Regions Referenced in the
APS Report
ALASKA PERFORMANCE SCHOLARSHIP OUTCOMES REPORT | 201550 ACKNOWLEDGEMENTS
A N S W E R S
The Alaska Performance Scholarship Outcomes Report would not have been possible without the considerable efforts of staff in the research sections at each of the four partnering agencies. ACPE would like to acknowledge the following agencies and staff, and thank them for their contributions to this, the 2015 Alaska Performance Scholarship Outcomes Report.
ALASKA DEPARTMENT OF EDUCATION & EARLY DEVELOPMENT ASSESSMENT, ACCOUNTABILITY & INFORMATION MANAGEMENT Erik McCormick, DirectorBrian Laurent, Data Management SupervisorEric Caldwell, Research Analyst
UNIVERSITY OF ALASKA SYSTEMWIDE INSTITUTIONAL RESEARCH & ANALYSIS
Gwendolyn Gruenig, Associate VPCindy Collins, DirectorStephanie Virgo, Sponsored Programs Analyst
ALASKA DEPARTMENT OF LABOR AND WORKFORCE DEVELOPMENT RESEARCH & ANALYSIS SECTION
Rob Kreiger, State Programs SupervisorYuancie Lee, State Programs Economist
For more information about the Alaska Performance Scholarship, or to contact ACPE, visit:
APS.alaska.gov
ACKNOWLEDGEMENTS
A N S W E R S
MISSION STATEMENT: Deliver outcomes information to Alaska stakeholders to assess, evaluate and improve the state’s educa-
tion and career development spectrum.