Embed Size (px)
Citation preview
Alaska Student Loan Corporation
LOAN FOrgiveNess
OutcOmes repOrt
March 2014
Yakutat | April 2013
Acpe LOAN FOrgiveNess repOrt | 2014
respectFuLLy preseNted by
Alaska Commission on Postsecondary Education
This report was compiled by Brian Rae, Assistant Director of Research & Analysis (ACPE), with assistance from Carol Druyvestein, Business Analyst Officer (ACPE) and Jeff Wockenfuss, Programmer Analyst (ACPE).
03/11/2014
cOmpiLed by
Acpe LOAN FOrgiveNess repOrt | 2014
1 summAry
2 At-A-gLANce
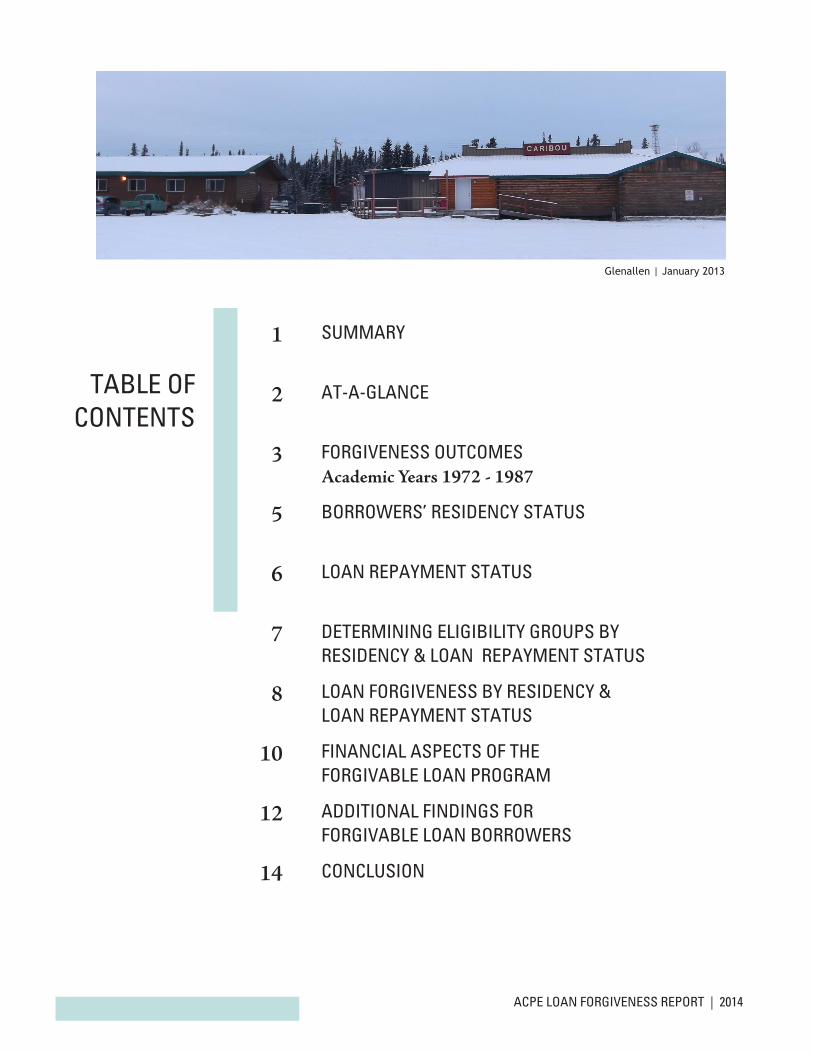
3 FOrgiveNess OutcOmesAcademic Years 1972 - 1987
5 bOrrOWers’ resideNcy stAtus
6 LOAN repAymeNt stAtus
7 determiNiNg eLigibiLity grOups by resideNcy & LOAN repAymeNt stAtus
8 LOAN FOrgiveNess by resideNcy & LOAN repAymeNt stAtus
10 FiNANciAL Aspects OF tHe FOrgivAbLe LOAN prOgrAm
12 AdditiONAL FiNdiNgs FOr FOrgivAbLe LOAN bOrrOWers
14 cONcLusiON
tAbLe OF cONteNts
Glenallen | January 2013
1 Acpe LOAN FOrgiveNess repOrt | 2014summAry
Between 1972 and 1987, over 56,000 Alaska students borrowed at least one Alaska Student Loan Program (ASLP) loan that provided, under certain conditions, for up to 50% forgiveness of the loan principal and accrued interest. Over 68% of these borrowers failed to receive even partial loan forgiveness, and only 21.8% received the maximum 50% forgiveness.
While Alaska residency was one of the requirements for loan forgiveness, failure to be a resident does not appear to be the primary reason so many borrowers were apparently ineligible for loan forgiveness. Nearly one-half of all borrowers applied for a Permanent Fund Dividend (PFD) in each of the five years subsequent to ending school enrollment and entering repayment. An even larger portion, nearly three-quarters, claimed residency in at least one of those years.
We lack a means to determine degree completion for this borrower population as a whole, though the minority receiving forgiveness benefits were required to document they had earned the postsecondary degree or credential for which the loan had been borrowed. Only 50% of borrowers with the strongest residency ties to Alaska - those who applied for a PFD in all five years subsequent to the start of their loan repayment - received any forgiveness benefit. This contributes to a likely conclusion that borrowers’ failure to complete their program of study, and not their residency status, was the primary factor in so few receiving loan forgiveness benefits.
Nearly 40% of all borrowers eventually defaulted on their loan and therefore lost eligibility to take out additional loans; and 17.7% of borrowers had loans which were written off as an expense to the loan program, though the rate at which either occurred decreased as both PFD filings and percent loan forgiveness increased. Approximately $425 million in forgivable loans were made to borrowers who took out an aggregate $606 million in both forgivable and non-forgivable loans. Of these, $73 million in accrued principal and interest on the forgivable loans was written off as uncollectible debt, and a total of $116 million was written off on the combined forgivable and non-forgivable loans. The total amount written off was over 50% more than the $76 million in loan forgiveness borrowers received.
summAry
2 Acpe LOAN FOrgiveNess repOrt | 2014At-A-gLANce
FOrgiveNess OutcOmes
Academic Years 1972 - 1987
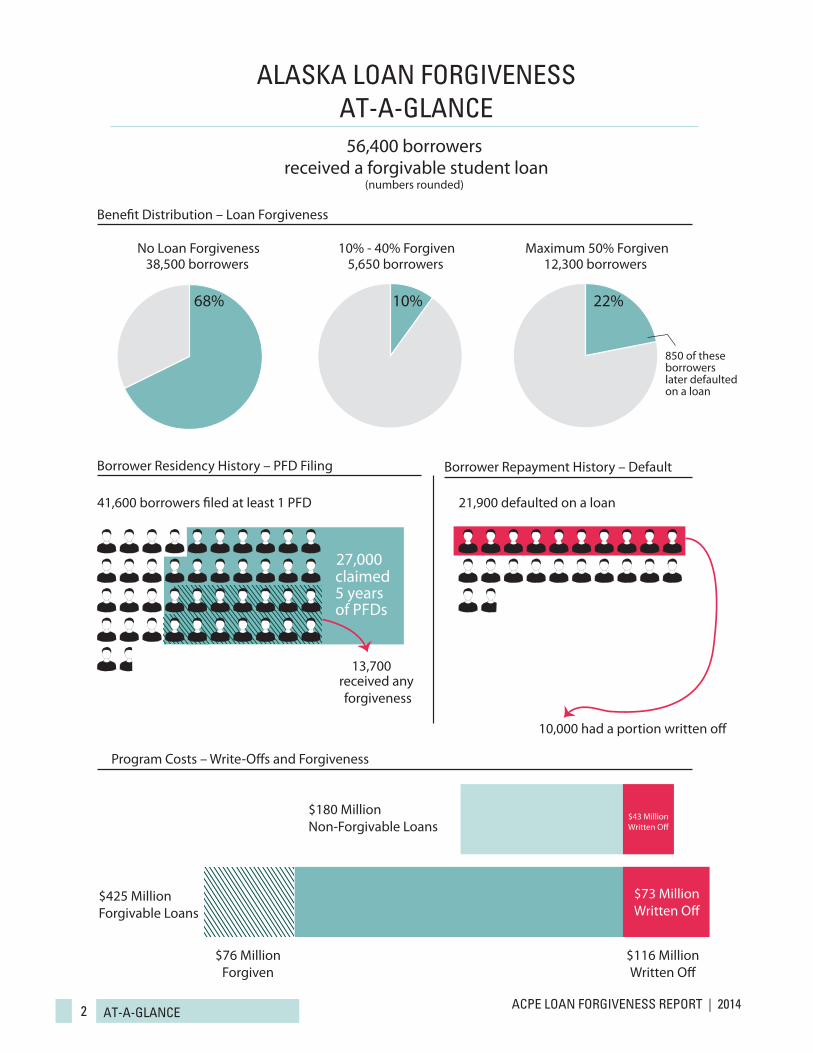
56,400 borrowers
(numbers rounded)
41,600 borrowers �led at least 1 PFD 21,900 defaulted on a loan
Borrower Residency History – PFD Filing Borrower Repayment History – Default
Program Costs – Write-O�s and Forgiveness
Bene�t Distribution – Loan Forgiveness
No Loan Forgiveness38,500 borrowers
68% 22%
12,300 borrowers
850 of theseborrowerslater defaultedon a loan
10%
5,650 borrowers10% - 40% Forgiven Maximum 50% Forgiven
$425 MillionForgivable Loans
$76 MillionForgiven
$73 MillionWritten O�
$180 MillionNon-Forgivable Loans
received a forgivable student loan
$43 MillionWritten O�
$73 MillionWritten O�
$116 MillionWritten O�
27,000claimed5 yearsof PFDs
13,700 received any forgiveness
10,000 had a portion written o�
ALAskA LOAN FOrgiveNess At-A-gLANce
3 Acpe LOAN FOrgiveNess repOrt | 2014FOrgiveNess OutcOmes
The State of Alaska, through the Alaska Student Loan Program administered by the Alaska Commission on Postsecondary Education (ACPE), funded student loans which provided for substantial forgiveness benefits. Forgivable loans first became available in academic year 1972, and continued through the 1987 academic year. Borrowers could receive up to 50% forgiveness of both their principal and accrued interest, under certain conditions. Borrowers received a 10% incremental benefit for each year they met the requirements, up to the maximum 50% forgiveness.
A total of 56,435 borrowers were identified as having received one or more forgivable loans. Of these, 68.2% failed to receive even a partial forgiveness, and only 21.8% received the full 50% forgiveness.
In order to qualify for forgiveness borrowers had to satisfy three conditions:
1. Complete the degree or certificate program for which the loan(s) was borrowed;
2. Reside in Alaska for at least a year after beginning their loan repayment, and continue to reside for five years to receive the full 50% of forgiveness; 1 and
3. Not default on their loan contract.
Borrowers meeting these three conditions could apply for loan forgiveness, whereby they attested to and documented their eligibility. A borrower’s applicable loan(s) was credited with a 10% reduction in both principal and accrued interest for each year they met these requirements.
The Legislature clearly intended that these three requirements for loan forgiveness would elicit certain behaviors from participating state residents. Conceptually these behaviors would benefit the state as residents would complete their degree or certificate, reside in Alaska, and stay current on their loan repayments.
ACPE had no mechanism by which to independently determine the eligibility status of all borrowers, since it had no access to information on borrowers’ state of residence (aside from their provided mailing addresses) nor their degree completion. The only
1 The forgiveness program as originally designed required a borrower to return to Alaska within one year of graduation in order to receive loan forgiveness, with certain exemptions available to delay the required residency dates. After residing in the state for two years, the borrower could receive 10% forgiveness. In practice, many borrowers were allowed to receive forgiveness based on their residency several years after the end of their active borrowing. This is likely attributable to borrowers returning to school at a later time and completing their degree program before then applying for forgiveness on the loan(s).
FOrgiveNess OutcOmes
Academic Years 1972 - 1987
4 Acpe LOAN FOrgiveNess repOrt | 2014FOrgiveNess OutcOmes
requirement which ACPE could directly determine was a borrower’s loan default status. Because of this, ACPE cannot definitively report the reason most borrowers failed to receive loan forgiveness – whether underutilization was due to loan default, residency requirements or degree completion.
However, by utilizing available information, this report can provide some insights into borrowers’ behaviors and identify why less than one-third took any advantage of the loan’s forgiveness provisions. By using data sources such as the state’s Permanent Fund Dividend and ACPE’s loan management databases, we can determine who met, and didn’t meet, the residency and repayment requirements.
5 Acpe LOAN FOrgiveNess repOrt | 2014resideNcy stAtus
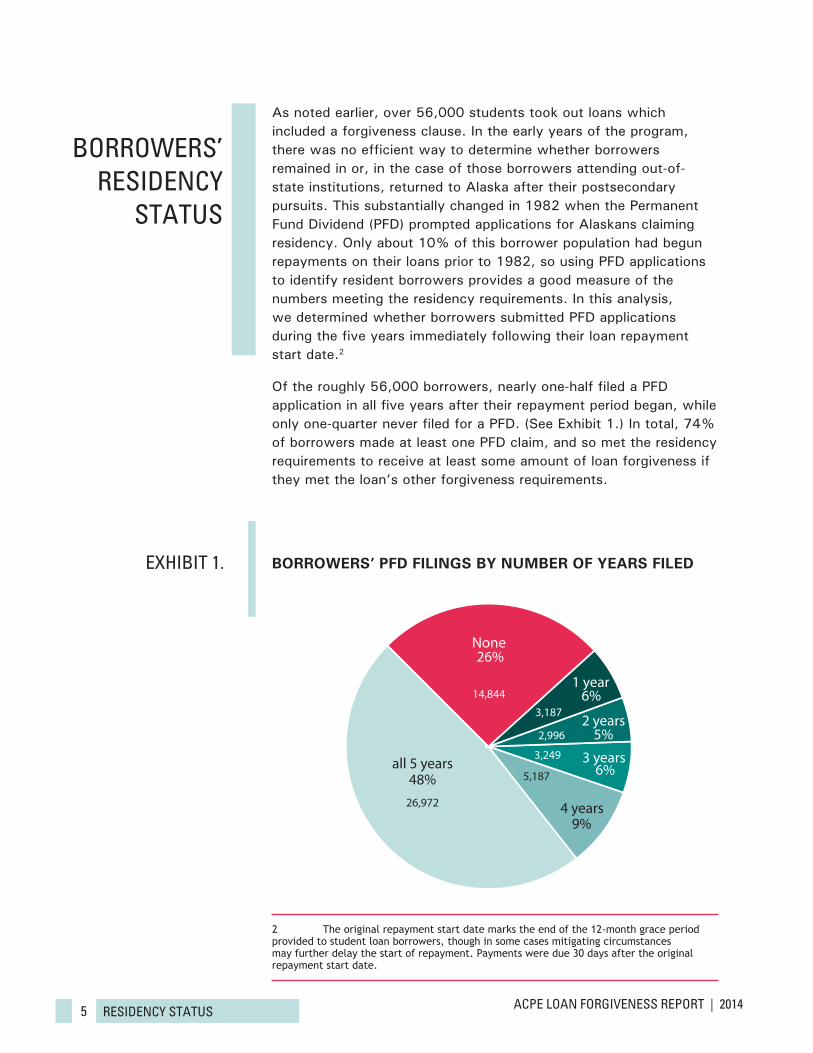
As noted earlier, over 56,000 students took out loans which included a forgiveness clause. In the early years of the program, there was no efficient way to determine whether borrowers remained in or, in the case of those borrowers attending out-of-state institutions, returned to Alaska after their postsecondary pursuits. This substantially changed in 1982 when the Permanent Fund Dividend (PFD) prompted applications for Alaskans claiming residency. Only about 10% of this borrower population had begun repayments on their loans prior to 1982, so using PFD applications to identify resident borrowers provides a good measure of the numbers meeting the residency requirements. In this analysis, we determined whether borrowers submitted PFD applications during the five years immediately following their loan repayment start date.2
Of the roughly 56,000 borrowers, nearly one-half filed a PFD application in all five years after their repayment period began, while only one-quarter never filed for a PFD. (See Exhibit 1.) In total, 74% of borrowers made at least one PFD claim, and so met the residency requirements to receive at least some amount of loan forgiveness if they met the loan’s other forgiveness requirements.
2 The original repayment start date marks the end of the 12-month grace period provided to student loan borrowers, though in some cases mitigating circumstances may further delay the start of repayment. Payments were due 30 days after the original repayment start date.
eXHibit 1.
bOrrOWers’ resideNcy
stAtus
BORROWERS’ PFD FILINGS BY NUMBER OF YEARS FILED
26,972
14,844
None26%
6%
5%
6%
9%
48%
1 year
2 years
3 years
4 years
all 5 years
3,187
2,996
3,249
5,187
6 Acpe LOAN FOrgiveNess repOrt | 2014repAymeNt stAtus
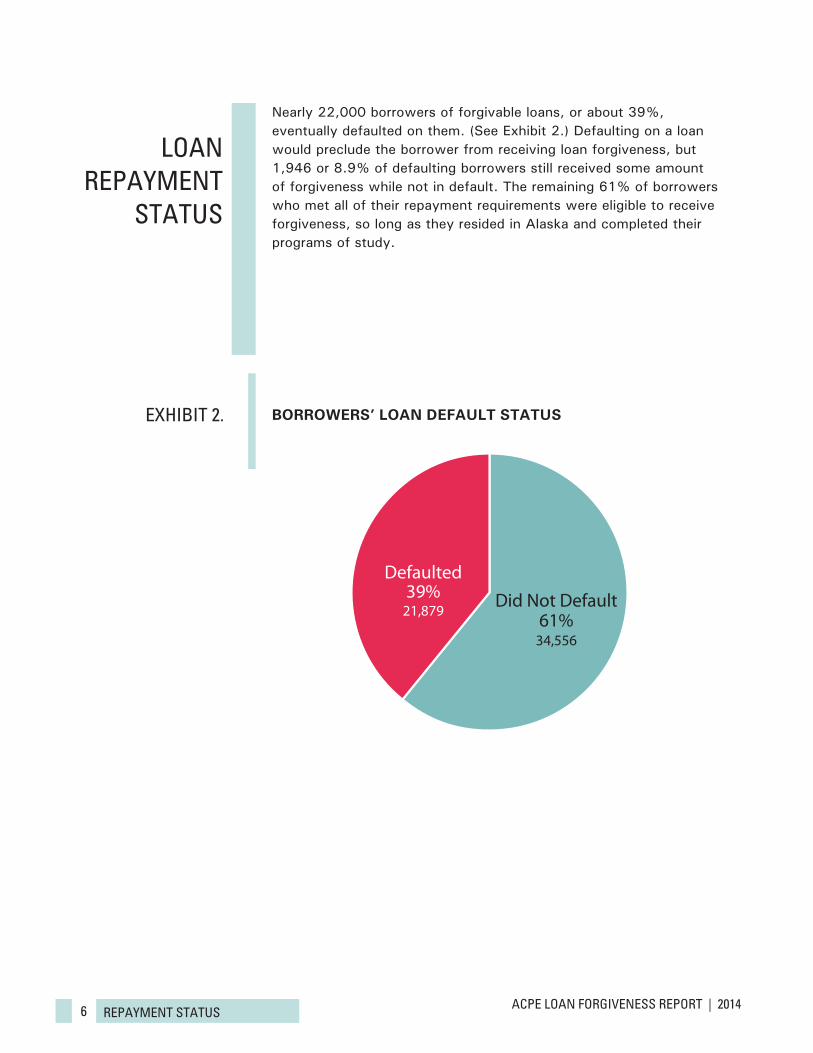
Nearly 22,000 borrowers of forgivable loans, or about 39%, eventually defaulted on them. (See Exhibit 2.) Defaulting on a loan would preclude the borrower from receiving loan forgiveness, but 1,946 or 8.9% of defaulting borrowers still received some amount of forgiveness while not in default. The remaining 61% of borrowers who met all of their repayment requirements were eligible to receive forgiveness, so long as they resided in Alaska and completed their programs of study.
eXHibit 2.
LOAN repAymeNt
stAtus
BORROWERS’ LOAN DEFAULT STATUS
Did Not DefaultDefaulted
61%
39%
34,556
21,879
7 Acpe LOAN FOrgiveNess repOrt | 2014determiNiNg eLigibiLity
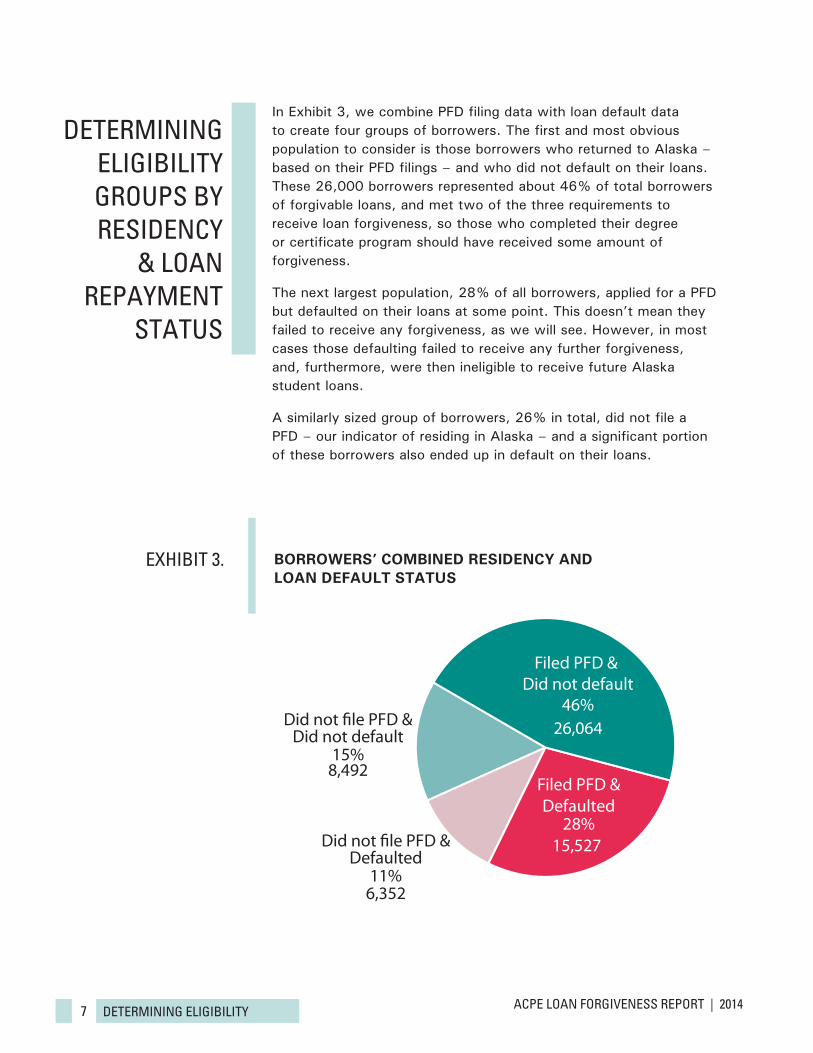
In Exhibit 3, we combine PFD filing data with loan default data to create four groups of borrowers. The first and most obvious population to consider is those borrowers who returned to Alaska – based on their PFD filings – and who did not default on their loans. These 26,000 borrowers represented about 46% of total borrowers of forgivable loans, and met two of the three requirements to receive loan forgiveness, so those who completed their degree or certificate program should have received some amount of forgiveness.
The next largest population, 28% of all borrowers, applied for a PFD but defaulted on their loans at some point. This doesn’t mean they failed to receive any forgiveness, as we will see. However, in most cases those defaulting failed to receive any further forgiveness, and, furthermore, were then ineligible to receive future Alaska student loans.
A similarly sized group of borrowers, 26% in total, did not file a PFD – our indicator of residing in Alaska – and a significant portion of these borrowers also ended up in default on their loans.
eXHibit 3.
determiNiNg eLigibiLity grOups by resideNcy
& LOAN repAymeNt
stAtus
DefaultedFiled PFD &
28%15,527
DefaultedDid not �le PFD &
11%6,352
Did not defaultDid not �le PFD &
15%8,492
Filed PFD & Did not default
46%26,064
BORROWERS’ COMBINED RESIDENCY AND LOAN DEFAULT STATUS
8 Acpe LOAN FOrgiveNess repOrt | 2014LOAN FOrgiveNess
Completion of a degree or certificate program is a very important milestone for all borrowers, not just those with forgivable loans. For borrowers wanting to take advantage of Alaska’s loan forgiveness benefit, however, program completion was a requirement, as borrowers who failed to complete were ineligible for this very substantial benefit.
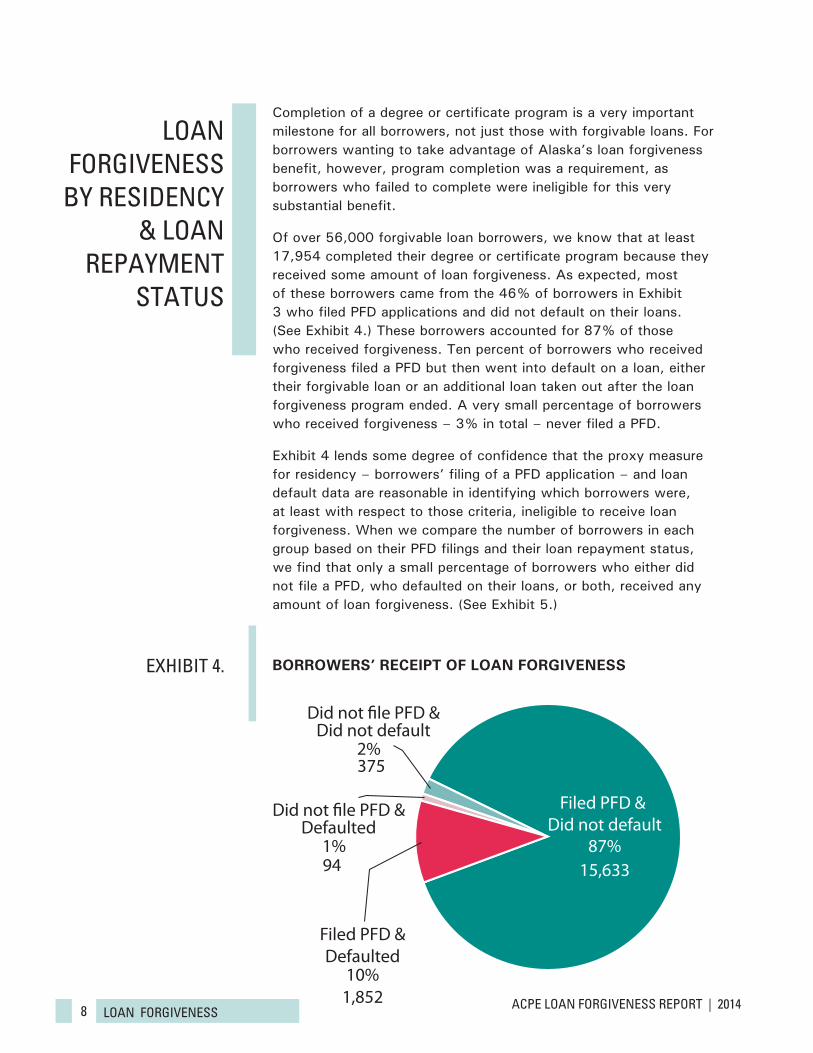
Of over 56,000 forgivable loan borrowers, we know that at least 17,954 completed their degree or certificate program because they received some amount of loan forgiveness. As expected, most of these borrowers came from the 46% of borrowers in Exhibit 3 who filed PFD applications and did not default on their loans. (See Exhibit 4.) These borrowers accounted for 87% of those who received forgiveness. Ten percent of borrowers who received forgiveness filed a PFD but then went into default on a loan, either their forgivable loan or an additional loan taken out after the loan forgiveness program ended. A very small percentage of borrowers who received forgiveness – 3% in total – never filed a PFD.
Exhibit 4 lends some degree of confidence that the proxy measure for residency – borrowers’ filing of a PFD application – and loan default data are reasonable in identifying which borrowers were, at least with respect to those criteria, ineligible to receive loan forgiveness. When we compare the number of borrowers in each group based on their PFD filings and their loan repayment status, we find that only a small percentage of borrowers who either did not file a PFD, who defaulted on their loans, or both, received any amount of loan forgiveness. (See Exhibit 5.)
eXHibit 4.
LOAN FOrgiveNess
by resideNcy & LOAN
repAymeNt stAtus
DefaultedFiled PFD &
10%1,852
DefaultedDid not �le PFD &
1%94
Did not defaultDid not �le PFD &
2%375
Filed PFD & Did not default
87%15,633
BORROWERS’ RECEIPT OF LOAN FORGIVENESS
9 Acpe LOAN FOrgiveNess repOrt | 2014LOAN FOrgiveNess
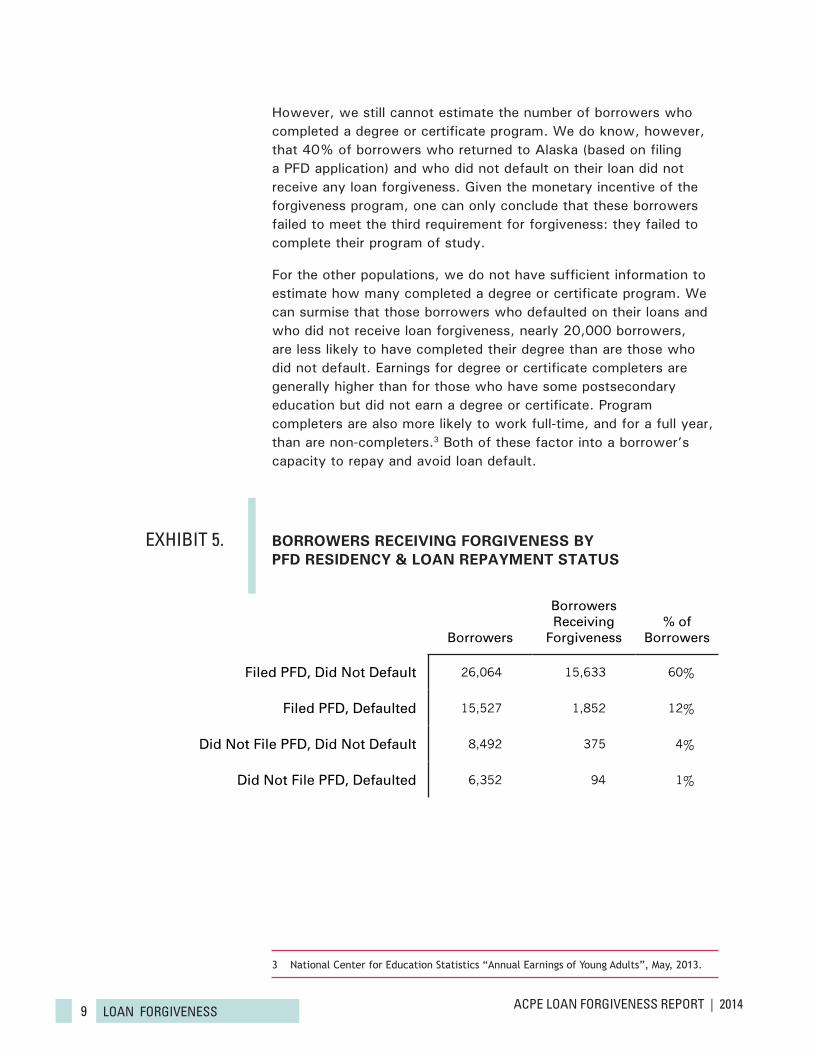
However, we still cannot estimate the number of borrowers who completed a degree or certificate program. We do know, however, that 40% of borrowers who returned to Alaska (based on filing a PFD application) and who did not default on their loan did not receive any loan forgiveness. Given the monetary incentive of the forgiveness program, one can only conclude that these borrowers failed to meet the third requirement for forgiveness: they failed to complete their program of study.
For the other populations, we do not have sufficient information to estimate how many completed a degree or certificate program. We can surmise that those borrowers who defaulted on their loans and who did not receive loan forgiveness, nearly 20,000 borrowers, are less likely to have completed their degree than are those who did not default. Earnings for degree or certificate completers are generally higher than for those who have some postsecondary education but did not earn a degree or certificate. Program completers are also more likely to work full-time, and for a full year, than are non-completers.3 Both of these factor into a borrower’s capacity to repay and avoid loan default.
3 National Center for Education Statistics “Annual Earnings of Young Adults”, May, 2013.
eXHibit 5.
Borrowers
Borrowers Receiving
Forgiveness% of
Borrowers
Filed PFD, Did Not Default 26,064 15,633 60%
Filed PFD, Defaulted 15,527 1,852 12%
Did Not File PFD, Did Not Default 8,492 375 4%
Did Not File PFD, Defaulted 6,352 94 1%
BORROWERS RECEIVING FORGIVENESS BY PFD RESIDENCY & LOAN REPAYMENT STATUS
10 Acpe LOAN FOrgiveNess repOrt | 2014FiNANciAL Aspects
Headcounts and percentages of borrowers receiving forgiveness provide one measure of how the program affected borrowers. Other important measures are the amounts of loans, and loan forgiveness and loan write-offs associated with forgivable loans.
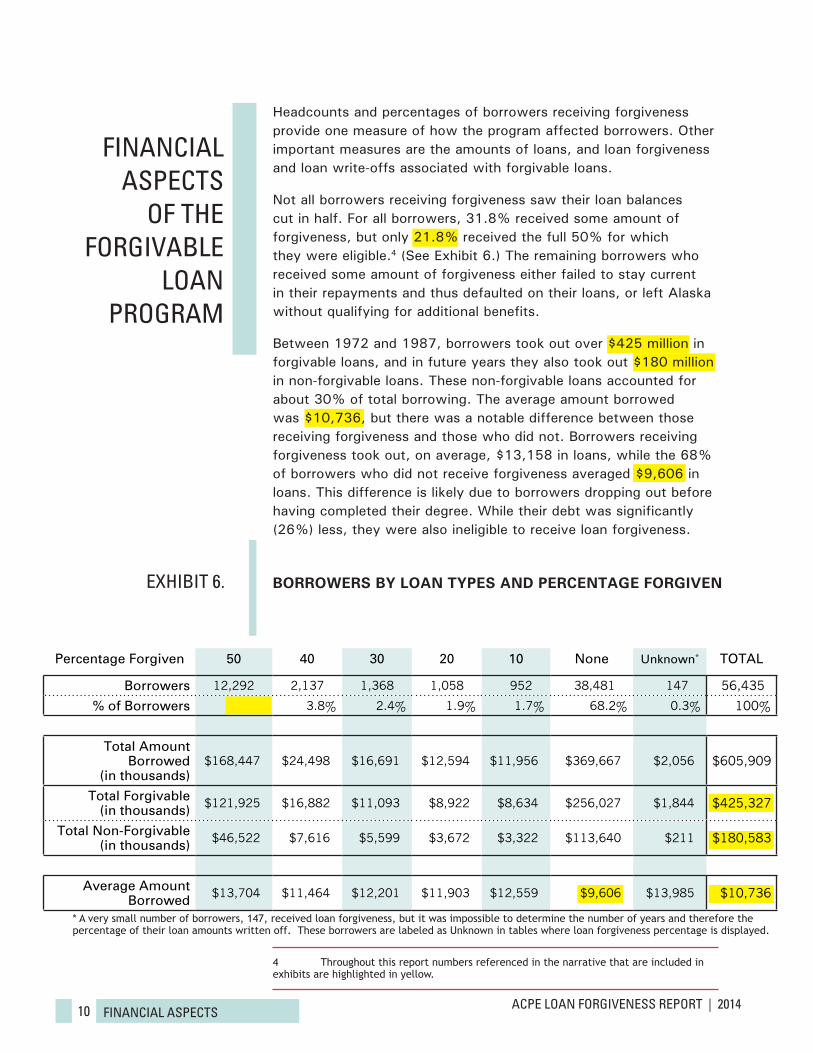
Not all borrowers receiving forgiveness saw their loan balances cut in half. For all borrowers, 31.8% received some amount of forgiveness, but only 21.8% received the full 50% for which they were eligible.4 (See Exhibit 6.) The remaining borrowers who received some amount of forgiveness either failed to stay current in their repayments and thus defaulted on their loans, or left Alaska without qualifying for additional benefits.
Between 1972 and 1987, borrowers took out over $425 million in forgivable loans, and in future years they also took out $180 million in non-forgivable loans. These non-forgivable loans accounted for about 30% of total borrowing. The average amount borrowed was $10,736, but there was a notable difference between those receiving forgiveness and those who did not. Borrowers receiving forgiveness took out, on average, $13,158 in loans, while the 68% of borrowers who did not receive forgiveness averaged $9,606 in loans. This difference is likely due to borrowers dropping out before having completed their degree. While their debt was significantly (26%) less, they were also ineligible to receive loan forgiveness.
4 Throughout this report numbers referenced in the narrative that are included in exhibits are highlighted in yellow.
eXHibit 6.
FiNANciAL Aspects
OF tHe FOrgivAbLe
LOAN prOgrAm
Percentage Forgiven 50 40 30 20 10 None Unknown* TOTAL
Borrowers 12,292 2,137 1,368 1,058 952 38,481 147 56,435
% of Borrowers 21.8% 3.8% 2.4% 1.9% 1.7% 68.2% 0.3% 100%
Total Amount Borrowed
(in thousands)$168,447 $24,498 $16,691 $12,594 $11,956 $369,667 $2,056 $605,909
Total Forgivable (in thousands) $121,925 $16,882 $11,093 $8,922 $8,634 $256,027 $1,844 $425,327
Total Non-Forgivable (in thousands) $46,522 $7,616 $5,599 $3,672 $3,322 $113,640 $211 $180,583
Average Amount Borrowed $13,704 $11,464 $12,201 $11,903 $12,559 $9,606 $13,985 $10,736
BORROWERS BY LOAN TYPES AND PERCENTAGE FORGIVEN
* A very small number of borrowers, 147, received loan forgiveness, but it was impossible to determine the number of years and therefore the percentage of their loan amounts written off. These borrowers are labeled as Unknown in tables where loan forgiveness percentage is displayed.
11 Acpe LOAN FOrgiveNess repOrt | 2014FiNANciAL Aspects
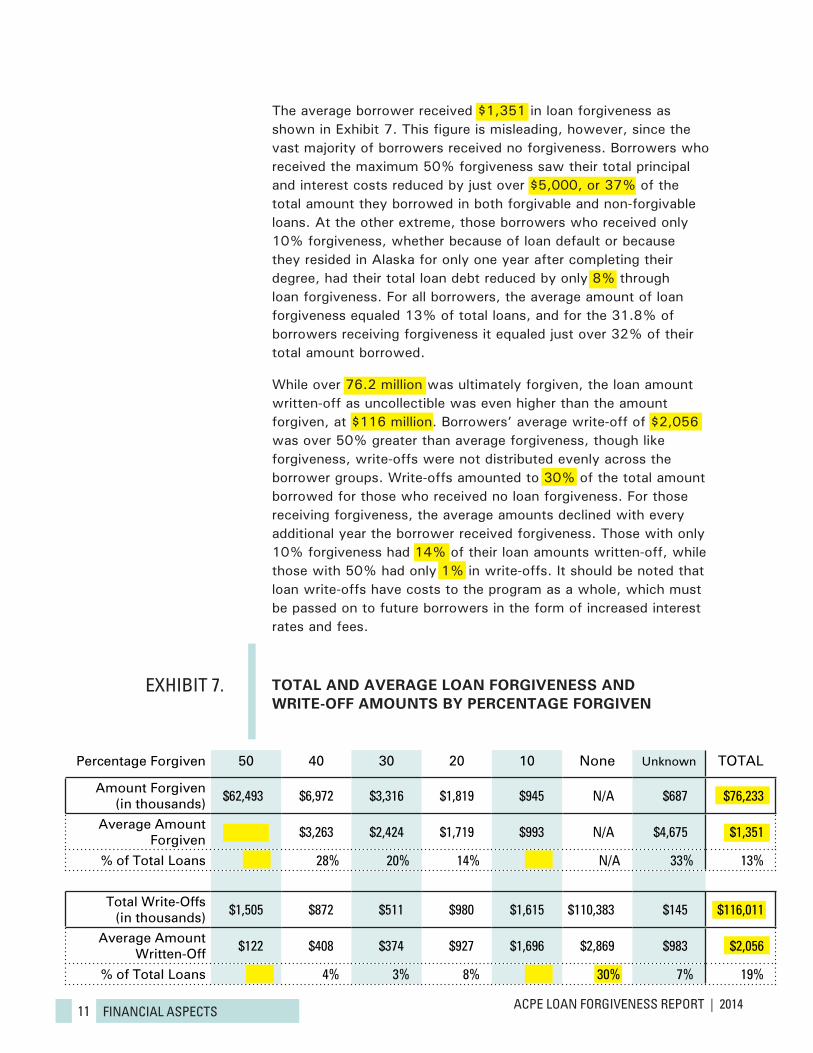
The average borrower received $1,351 in loan forgiveness as shown in Exhibit 7. This figure is misleading, however, since the vast majority of borrowers received no forgiveness. Borrowers who received the maximum 50% forgiveness saw their total principal and interest costs reduced by just over $5,000, or 37% of the total amount they borrowed in both forgivable and non-forgivable loans. At the other extreme, those borrowers who received only 10% forgiveness, whether because of loan default or because they resided in Alaska for only one year after completing their degree, had their total loan debt reduced by only 8% through loan forgiveness. For all borrowers, the average amount of loan forgiveness equaled 13% of total loans, and for the 31.8% of borrowers receiving forgiveness it equaled just over 32% of their total amount borrowed.
While over 76.2 million was ultimately forgiven, the loan amount written-off as uncollectible was even higher than the amount forgiven, at $116 million. Borrowers’ average write-off of $2,056 was over 50% greater than average forgiveness, though like forgiveness, write-offs were not distributed evenly across the borrower groups. Write-offs amounted to 30% of the total amount borrowed for those who received no loan forgiveness. For those receiving forgiveness, the average amounts declined with every additional year the borrower received forgiveness. Those with only 10% forgiveness had 14% of their loan amounts written-off, while those with 50% had only 1% in write-offs. It should be noted that loan write-offs have costs to the program as a whole, which must be passed on to future borrowers in the form of increased interest rates and fees.
eXHibit 7. TOTAL AND AVERAGE LOAN FORGIVENESS AND WRITE-OFF AMOUNTS BY PERCENTAGE FORGIVEN
Percentage Forgiven 50 40 30 20 10 None Unknown TOTAL
Amount Forgiven (in thousands) $62,493 $6,972 $3,316 $1,819 $945 N/A $687 $76,233
Average Amount Forgiven $5,084 $3,263 $2,424 $1,719 $993 N/A $4,675 $1,351
% of Total Loans 37% 28% 20% 14% 8% N/A 33% 13%
Total Write-Offs (in thousands) $1,505 $872 $511 $980 $1,615 $110,383 $145 $116,011
Average Amount Written-Off $122 $408 $374 $927 $1,696 $2,869 $983 $2,056
% of Total Loans 1% 4% 3% 8% 14% 30% 7% 19%
12 Acpe LOAN FOrgiveNess repOrt | 2014AdditiONAL FiNdiNgs
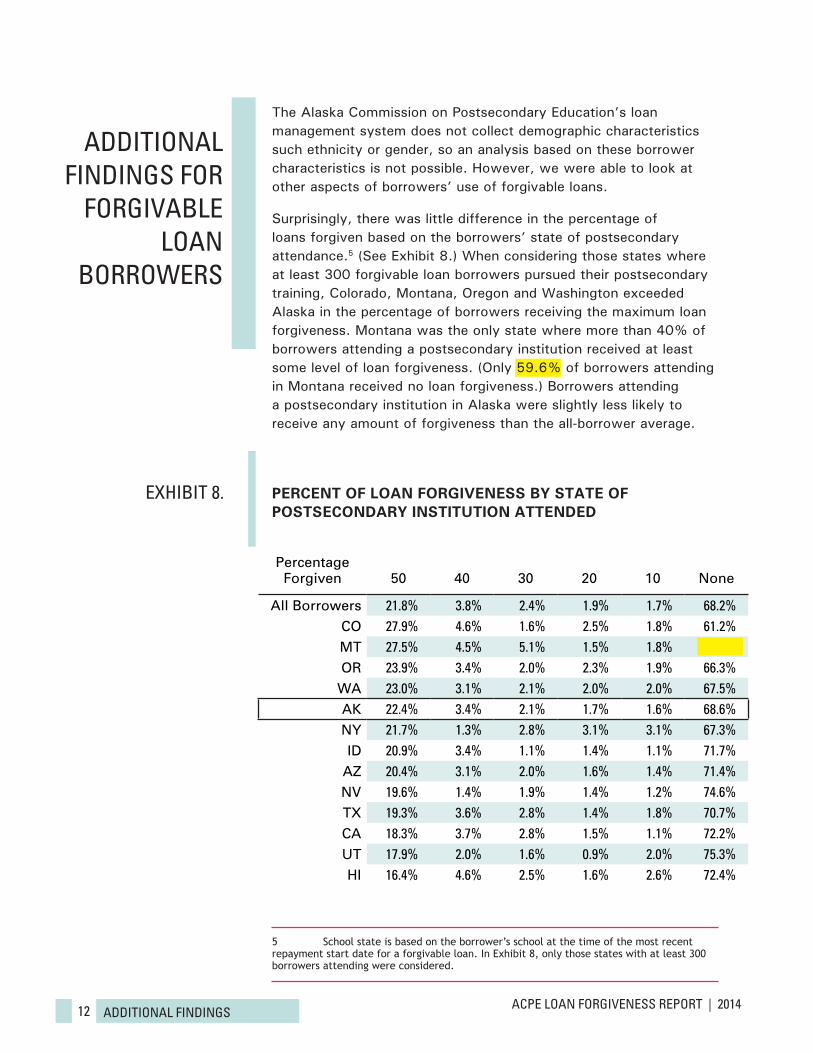
The Alaska Commission on Postsecondary Education’s loan management system does not collect demographic characteristics such ethnicity or gender, so an analysis based on these borrower characteristics is not possible. However, we were able to look at other aspects of borrowers’ use of forgivable loans.
Surprisingly, there was little difference in the percentage of loans forgiven based on the borrowers’ state of postsecondary attendance.5 (See Exhibit 8.) When considering those states where at least 300 forgivable loan borrowers pursued their postsecondary training, Colorado, Montana, Oregon and Washington exceeded Alaska in the percentage of borrowers receiving the maximum loan forgiveness. Montana was the only state where more than 40% of borrowers attending a postsecondary institution received at least some level of loan forgiveness. (Only 59.6% of borrowers attending in Montana received no loan forgiveness.) Borrowers attending a postsecondary institution in Alaska were slightly less likely to receive any amount of forgiveness than the all-borrower average.
5 School state is based on the borrower’s school at the time of the most recent repayment start date for a forgivable loan. In Exhibit 8, only those states with at least 300 borrowers attending were considered.
AdditiONAL FiNdiNgs FOr
FOrgivAbLe LOAN
bOrrOWers
eXHibit 8. PERCENT OF LOAN FORGIVENESS BY STATE OF POSTSECONDARY INSTITUTION ATTENDED
Percentage Forgiven 50 40 30 20 10 None
All Borrowers 21.8% 3.8% 2.4% 1.9% 1.7% 68.2%CO 27.9% 4.6% 1.6% 2.5% 1.8% 61.2%MT 27.5% 4.5% 5.1% 1.5% 1.8% 59.6%OR 23.9% 3.4% 2.0% 2.3% 1.9% 66.3%
WA 23.0% 3.1% 2.1% 2.0% 2.0% 67.5%AK 22.4% 3.4% 2.1% 1.7% 1.6% 68.6%NY 21.7% 1.3% 2.8% 3.1% 3.1% 67.3%ID 20.9% 3.4% 1.1% 1.4% 1.1% 71.7%
AZ 20.4% 3.1% 2.0% 1.6% 1.4% 71.4%NV 19.6% 1.4% 1.9% 1.4% 1.2% 74.6%TX 19.3% 3.6% 2.8% 1.4% 1.8% 70.7%CA 18.3% 3.7% 2.8% 1.5% 1.1% 72.2%UT 17.9% 2.0% 1.6% 0.9% 2.0% 75.3%HI 16.4% 4.6% 2.5% 1.6% 2.6% 72.4%
13 Acpe LOAN FOrgiveNess repOrt | 2014AdditiONAL FiNdiNgs
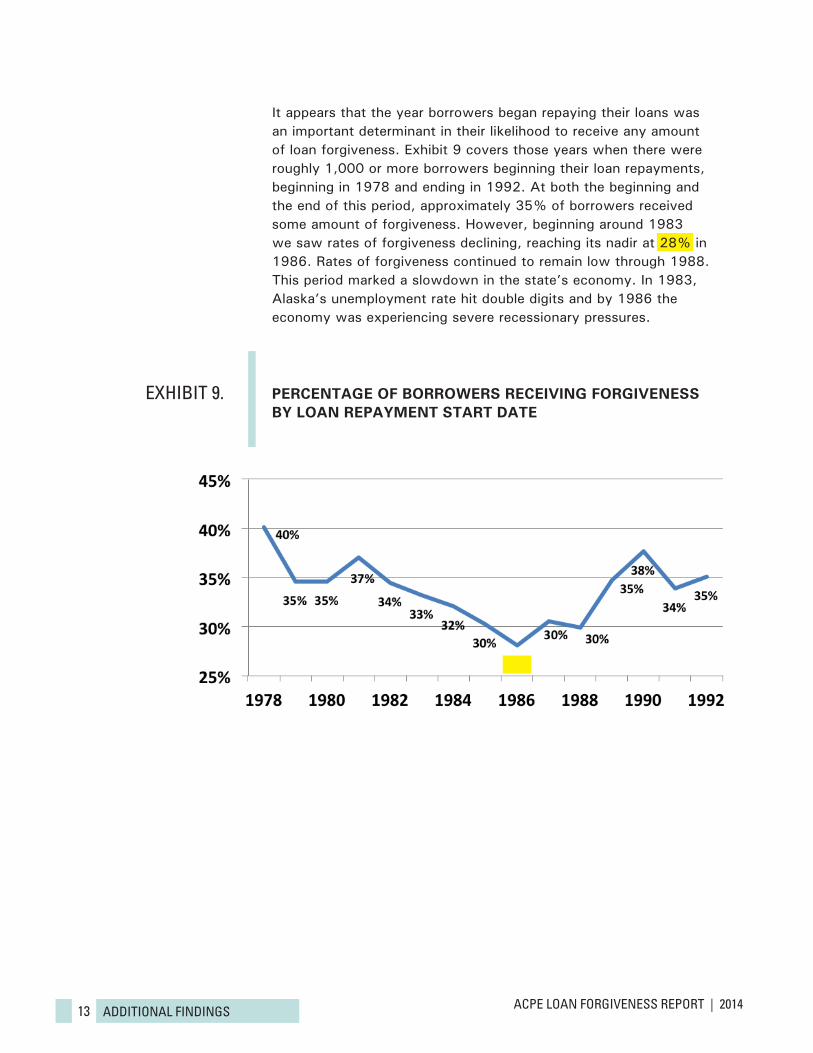
It appears that the year borrowers began repaying their loans was an important determinant in their likelihood to receive any amount of loan forgiveness. Exhibit 9 covers those years when there were roughly 1,000 or more borrowers beginning their loan repayments, beginning in 1978 and ending in 1992. At both the beginning and the end of this period, approximately 35% of borrowers received some amount of forgiveness. However, beginning around 1983 we saw rates of forgiveness declining, reaching its nadir at 28% in 1986. Rates of forgiveness continued to remain low through 1988. This period marked a slowdown in the state’s economy. In 1983, Alaska’s unemployment rate hit double digits and by 1986 the economy was experiencing severe recessionary pressures.
eXHibit 9. PERCENTAGE OF BORROWERS RECEIVING FORGIVENESS BY LOAN REPAYMENT START DATE
14 Acpe LOAN FOrgiveNess repOrt | 2014cONcLusiON
Alaska’s student loan forgiveness strategy, as indicated through its qualification requirements, had three main goals: 1) having borrowers obtain their degree or certificate; 2) having borrowers return to and/or continue to reside in Alaska; and 3) having borrowers repay their loan as agreed.
We know that slightly less than one-half of borrowers returned to the state for at least five years based on PFD records. An additional number of borrowers, 1,466 in total, received 50% forgiveness but did not file at least five years of PFD applications, but they still met the loan’s five-year eligibility requirement. These two groups represent just over 50% of borrowers, so a significant number maintained their residency in Alaska, even though most did not receive any loan forgiveness.
For the goal of loan repayment, we know that nearly 22,000 borrowers defaulted on their loans, and of these 20,000 received no loan forgiveness. Defaulting borrowers accounted for 39% of all forgivable loan borrowers. Of all borrowers defaulting, nearly 10,000 had some amount of their loans written off as uncollectible. As a result the costs associated with loan write-offs were more than 50% greater than for loan forgiveness.
Finally, while we recognize the lack of program completion data, we can say that 17,954 borrowers at some point met all three criteria to receive some amount of loan forgiveness. Of these only 12,292 received the full 50% forgiveness, meaning they remained in Alaska for at least five years. However, 848 of these borrowers eventually defaulted on at least one of their student loans.
If the true success of the program is measured by attainment of an educational credential, long-term residency, and repayment of the loan obligation, then only 20.2% or 11,444 borrowers achieved those objectives.
cONcLusiON
Nome | November 2013