Embed Size (px)
Citation preview

Alaska Visitor Statistics Program V
Technical Appendix
Prepared for:
State of Alaska Department of Commerce, Community
and Economic Development
February 2008

Table of Contents
Introduction .............................................................................................................................. 1 Visitor Volume .......................................................................................................................... 2
Total Traffic .............................................................................................................................. 2 Visitor/Resident Ratios .............................................................................................................. 3
Visitor Survey ............................................................................................................................ 5 Survey Population .................................................................................................................... 5 Survey Design .......................................................................................................................... 5 Survey Staff .............................................................................................................................. 5 Survey Locations ...................................................................................................................... 6 Sample Sizes ............................................................................................................................ 7 Sampling Procedure ................................................................................................................. 7 Online Component .................................................................................................................. 9 Response Rates....................................................................................................................... 10 Margins of Error ..................................................................................................................... 11 Data Processing...................................................................................................................... 12
Ratios ...................................................................................................................................... 15 Weighting ............................................................................................................................... 17 Code Changes and Definitions .............................................................................................. 18 Survey Instrument .................................................................................................................. 20
Alaska Visitor Statistics Program V: Technical Appendix McDowell Group, Inc. • Page 1
Introduction
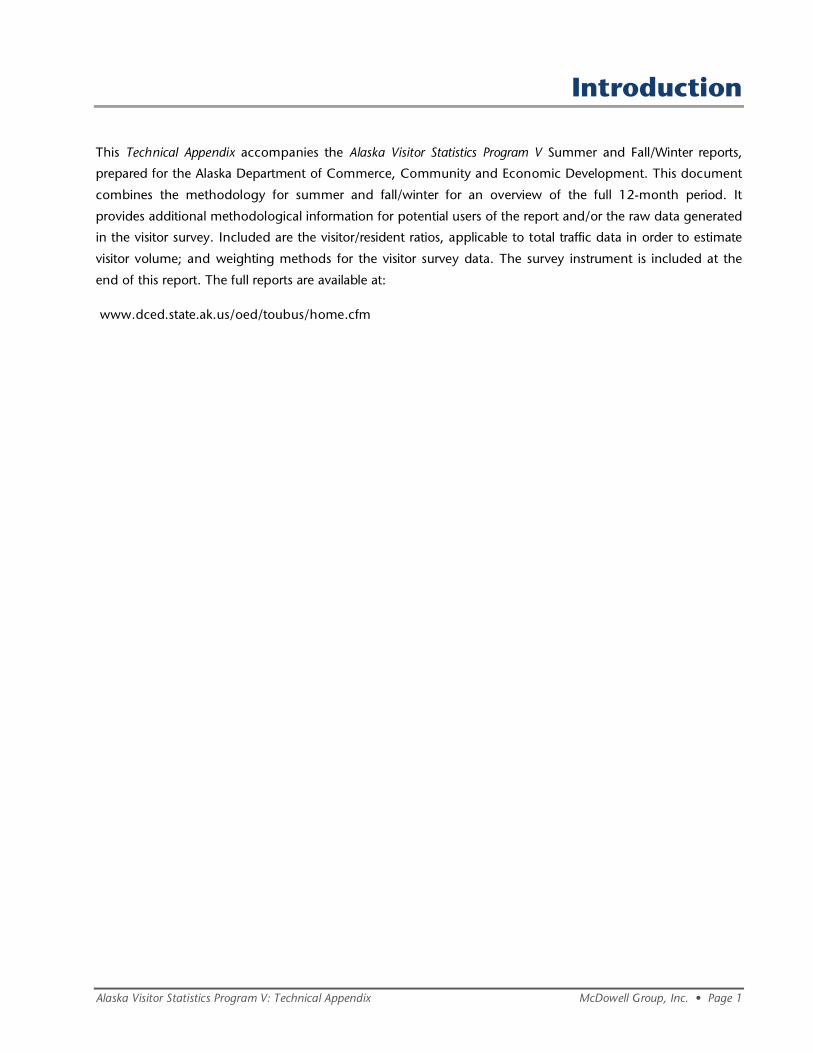
This Technical Appendix accompanies the Alaska Visitor Statistics Program V Summer and Fall/Winter reports,
prepared for the Alaska Department of Commerce, Community and Economic Development. This document
combines the methodology for summer and fall/winter for an overview of the full 12-month period. It
provides additional methodological information for potential users of the report and/or the raw data generated
in the visitor survey. Included are the visitor/resident ratios, applicable to total traffic data in order to estimate
visitor volume; and weighting methods for the visitor survey data. The survey instrument is included at the
end of this report. The full reports are available at:
www.dced.state.ak.us/oed/toubus/home.cfm

Alaska Visitor Statistics Program V: Technical Appendix McDowell Group, Inc. • Page 2
Visitor Volume
Total Traffic
The process of counting visitors to Alaska starts with traffic data. For AVSP V, exit traffic data was used. The
following table shows each exit point, along with the type and source of the data. As in AVSP III and IV, the
summer period consists of May 1 through September 30, and the fall/winter period consists of October 1
through April 30.
Exit Points and Data Sources AVSP V
Exit Point Type of Data Sources of Data
Domestic Air
Anchorage Enplaning passengers exiting the state Anchorage International Airport; Alaska Airlines
Fairbanks Enplaning passengers exiting the state Fairbanks International Airport;
Alaska Airlines
Juneau Enplaning passengers exiting the state Alaska Airlines
Ketchikan Enplaning passengers exiting the state Alaska Airlines
Sitka Enplaning passengers exiting the state Alaska Airlines
Other Enplaning passengers exiting the state Alaska Airlines
International Air
Anchorage Enplaning passengers exiting the state Anchorage International Airport
Fairbanks Enplaning passengers exiting the state Fairbanks International Airport
Highway
Fraser Border Station
(Klondike Highway)
Occupants of private vehicles, motorcoaches, and
commercial vehicles crossing the border
Yukon Department of Tourism and Culture
Pleasant Border Station (Haines Highway)
Occupants of private vehicles, motorcoaches, and commercial vehicles crossing the border
Yukon Department of Tourism and Culture
Beaver Creek Border
Station (Alcan Highway)
Occupants of private vehicles, motorcoaches, and
commercial vehicles crossing the border
Yukon Department of Tourism and Culture
Little Gold Border Station
(Top of the World Highway)
Occupants of private vehicles, motorcoaches, and
commercial vehicles crossing the border
Yukon Department of Tourism and Culture
Cruise Ship
All southbound ships Cruise ship passengers sailing southbound from
Alaska ports to Canada/US ports
Cruise Line Agencies of Alaska
Ferry
Bellingham Ferry passengers disembarking at Bellingham Alaska Marine Highway System
Prince Rupert Ferry passengers disembarking at Prince Rupert Alaska Marine Highway System
Because all commercial airlines besides Alaska Airlines only fly directly out-of-state, enplanement data from
Anchorage and Fairbanks airports was used to determine exiting passengers aboard non-Alaska Airlines flights.
Alaska Airlines, which operates flights within Alaska as well as out-of-state, provided an exact count of
outbound passengers for each exit point.

Alaska Visitor Statistics Program V: Technical Appendix McDowell Group, Inc. • Page 3
Visitor/Resident Ratios
In order to estimate total visitor traffic, visitor/resident ratios were applied to the total traffic data. A
visitor/resident ratio is the proportion of out-of-state visitors to Alaska residents for each exit mode. For most
exit points, these ratios were collected in the form of “tallies” at the same time surveys were conducted.
McDowell Group surveyors tallied over 78,000 people as they were exiting Alaska between May 1, 2006 and
April 30, 2007. The following table shows the number of people tallied for each exit mode.
Visitor/Resident Tally Contacts, by Mode
AVSP V
Exit Mode Summer 2006
Fall/Winter
2006-07 Full Year
Domestic Air 37,220 22,265 59,485
International Air 8,010 4,171 12,181
Highway 3,499 1,469 4,968
Ferry 974 706 1,680
Cruise ship1 0 0 0
Total 49,703 28,611 78,314
1 As in previous AVSP studies, 100 percent of cruise passengers were assumed to be out-of-state visitors.
All exiting passengers were assumed to be leaving Alaska for the last time (meaning, not re-entering on the
same trip), with the exception of highway travelers. Highway traffic had to be adjusted for “last exit” visitors,
because some of the traffic recorded in border crossing data re-enters Alaska and exits a second time – for
example, many highway visitors exit Alaska on the Alcan highway, drive to Skagway, and exit the state a
second time via the Alaska Marine Highway. This issue is explained further in the highway section, below.
Domestic and International Air
For each flight selected for surveying (see Sampling Procedures, below), a surveyor would position
themselves directly outside the jetway before boarding.1 As passengers boarded, the surveyor would ask, “Are
you an Alaska resident?” and their response was recorded. Every passenger boarding each selected flight was
tallied.
For the domestic air mode, ratios were compiled by location, by month, and applied to passenger
enplanement data by location, by month.2 International air ratios were compiled by location, by airline, and
applied to passenger enplanement data by location and airline.
Highway
Highway tallies were collected during all survey sample periods. Shifts were four to five hours long. Survey/tally
stations were set up adjacent to the border station on three highways: Alcan, Haines Highway, and Klondike 1 The one exception to this collection method occurred in Sitka, where the infrequency of flights and small size of the boarding area allowed both surveys and tallies to be conducted outside of the secure area. Tallies were conducted as passengers waited in line to go through security. 2 Because passengers flying directly out of state from “other” destinations (Petersburg, Wrangell, Yakutat, and Cordova) were not sampled in the survey, tallies were not conducted for these exit points. The visitor/resident ratio for these passengers was based on a compilation of Juneau, Ketchikan, and Sitka ratios.

Alaska Visitor Statistics Program V: Technical Appendix McDowell Group, Inc. • Page 4
Highway. Because of the time required to access the border station at the Top of the World Highway, the
survey station was set up on the road before drivers boarded the ferry at Dawson City. There was no risk of
compromising the sample, because all highway travelers crossing the border necessarily drive on to Dawson
City. (The Top of the World Highway is closed during the fall/winter study period.)
In addition to the standard visitor/resident question, highway travelers were asked: “Are you re-entering Alaska
on this trip?” The final ratio that was applied to traffic data reflected only “last exit” visitors, to avoid double-
counting of those travelers who were re-entering Alaska and exiting by another mode or a different highway.
Visitor/resident ratios were applied to exiting personal vehicle traffic by location.
There were two highway modes that, as in previous AVSP’s, were not sampled: motorcoaches and
commercial vehicles. Visitor/resident ratios and adjustment for last exit visitors for these modes were based on
a number of sources, including interviews with tour operators, cruise passenger tour data, and interviews with
border officials. Because visitor traffic among these two highway modes is so small, they are combined with
other highway traffic for the purposes of the visitor volume estimate.
Cruise Ship
No tallies were conducted for cruise passengers. As in previous AVSP studies, all cruise passengers were
designated as out-of-state visitors. Based on interviews with cruise industry officials, the number of Alaska
residents that participate in Alaska cruises is statistically insignificant.
Ferry
As in the other exit modes, surveyors would ask passengers aboard sampled ferry voyages exiting Alaska
whether they were a resident or visitor. Nearly 1,700 tallies were conducted of ferry passengers over the 12-
month period. In addition, the project team was able to procure actual passenger origin by month and
destination from the Alaska Marine Highway System, compiled from reservation data.
Alaska Visitor Statistics Program V: Technical Appendix McDowell Group, Inc. • Page 5
Visitor Survey
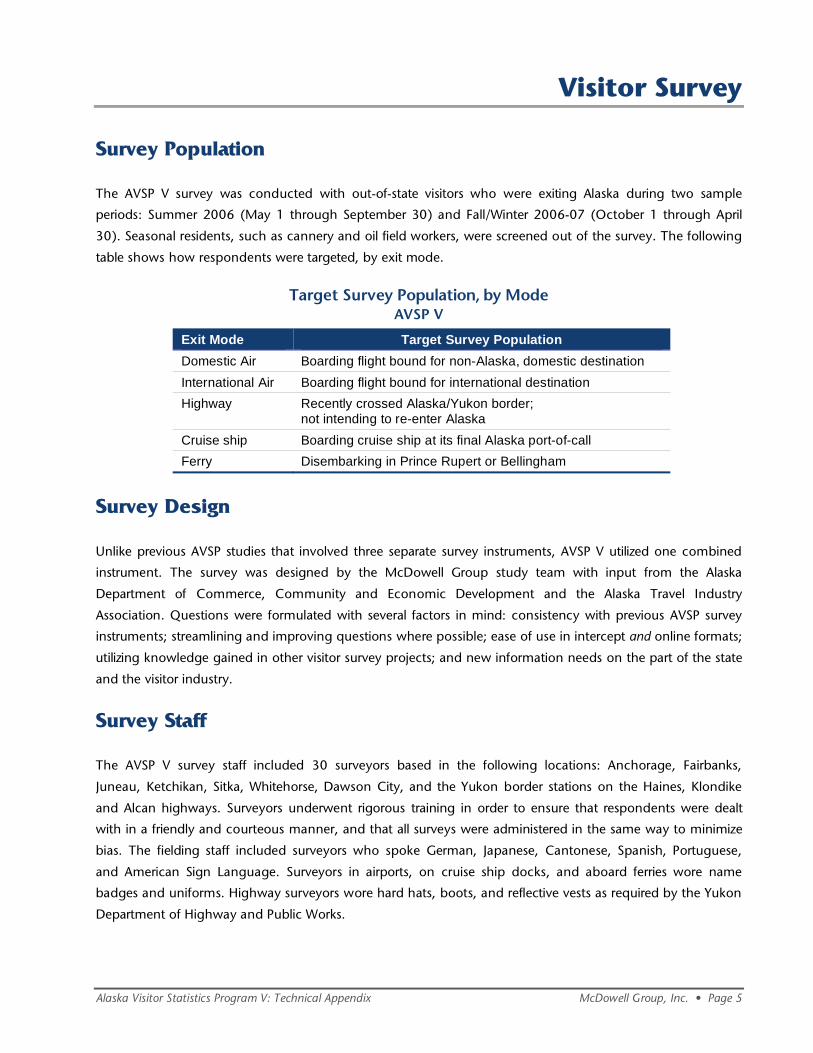
Survey Population
The AVSP V survey was conducted with out-of-state visitors who were exiting Alaska during two sample
periods: Summer 2006 (May 1 through September 30) and Fall/Winter 2006-07 (October 1 through April
30). Seasonal residents, such as cannery and oil field workers, were screened out of the survey. The following
table shows how respondents were targeted, by exit mode.
Target Survey Population, by Mode AVSP V
Exit Mode Target Survey Population
Domestic Air Boarding flight bound for non-Alaska, domestic destination
International Air Boarding flight bound for international destination
Highway Recently crossed Alaska/Yukon border; not intending to re-enter Alaska
Cruise ship Boarding cruise ship at its final Alaska port-of-call
Ferry Disembarking in Prince Rupert or Bellingham
Survey Design
Unlike previous AVSP studies that involved three separate survey instruments, AVSP V utilized one combined
instrument. The survey was designed by the McDowell Group study team with input from the Alaska
Department of Commerce, Community and Economic Development and the Alaska Travel Industry
Association. Questions were formulated with several factors in mind: consistency with previous AVSP survey
instruments; streamlining and improving questions where possible; ease of use in intercept and online formats;
utilizing knowledge gained in other visitor survey projects; and new information needs on the part of the state
and the visitor industry.
Survey Staff
The AVSP V survey staff included 30 surveyors based in the following locations: Anchorage, Fairbanks,
Juneau, Ketchikan, Sitka, Whitehorse, Dawson City, and the Yukon border stations on the Haines, Klondike
and Alcan highways. Surveyors underwent rigorous training in order to ensure that respondents were dealt
with in a friendly and courteous manner, and that all surveys were administered in the same way to minimize
bias. The fielding staff included surveyors who spoke German, Japanese, Cantonese, Spanish, Portuguese,
and American Sign Language. Surveyors in airports, on cruise ship docks, and aboard ferries wore name
badges and uniforms. Highway surveyors wore hard hats, boots, and reflective vests as required by the Yukon
Department of Highway and Public Works.

Alaska Visitor Statistics Program V: Technical Appendix McDowell Group, Inc. • Page 6
Survey Locations
The following table shows where surveys were conducted. These exit locations account for virtually 100
percent of visitors exiting Alaska. The limited number of visitors using other modes and locations does not
warrant including them in the sample.3 In every survey location, online invitation cards were also distributed.
Survey Locations AVSP V - Summer 2006
Exit Mode Survey Location
Domestic Air
Anchorage International Airport
Fairbanks International Airport
Juneau International Airport
Ketchikan International Airport
Sitka Airport
International Air
Anchorage International Airport
Fairbanks International Airport
Highway
Fraser Border Station (Klondike Highway)
Pleasant Border Station (Haines Highway)
Beaver Creek Border Station (Alcan Highway)
Dawson City (Top of the World Highway)
Cruise Ship
Ketchikan cruise ship docks
Juneau cruise ship docks
Skagway cruise ship docks
Sitka cruise ship lightering docks
Icy Strait Point cruise ship lightering docks
Ferry
Aboard Alaska Marine Highway ferries sailing to Bellingham and Prince Rupert
3 Un-sampled exit modes include: commercial vehicles, private planes, private boats, pedestrians, and airplane passengers flying directly out-of-state from Cordova, Yakutat, Petersburg, and Wrangell.

Alaska Visitor Statistics Program V: Technical Appendix McDowell Group, Inc. • Page 7
Sample Sizes
The AVSP V survey program included 3,758 intercept surveys (in-person interviews) and 3,179 surveys
completed online, for a total of 6,937 surveys. The total sample exceeded the target sample of 6,500 by a
significant margin, largely due to the higher-than-expected online response rate. The following table shows
the number of completed surveys, by exit mode.
Sample Sizes, by Mode AVSP V
SUMMER FALL/WINTER FULL YEAR
Exit Mode Intercept Online Total Intercept Online Total Intercept Online Total
Domestic Air 1,528 1,917 3,445 782 223 1,005 2,310 2,140 4,450
International Air 274 299 573 123 0 123 397 299 696
Highway 246 85 331 101 0 101 347 85 432
Cruise ship 503 475 978 0 0 0 503 475 978
Ferry 152 180 332 49 0 49 201 180 381
Total 2,703 2,956 5,659 1,055 223 1,278 3,758 3,179 6,937
Sampling Procedure
The sampling process starts with creating a target number of intercept surveys, by month, for each mode and
exit point. These targets were largely based on estimated traffic volume (for which the study team had
extensive records from the 2005 Alaska Travelers Survey). The sample targets were adjusted to ensure
appropriate sample sizes. For example, summer visitors exiting by ferry represent only 0.7 percent of all visitors.
If they were represented proportionally in the sample, the target would be too small for analysis (18 out of
2,500 surveys). The summer ferry target became 150 surveys. Similarly, the summer international air sample
was adjusted upwards because there was particular interest in this market on the part of the State and the
visitor industry. These visitors represent 1.0 percent of total summer exiting visitors, but had a target of 200
surveys.
After sample targets were determined for each mode and exit point, monthly targets were determined based
on traffic volume, and daily targets based on expected visitor frequency and surveyor capacity. Survey days
were selected by month, based on a random start.
Following are more specific sampling procedures for each exit mode.
Domestic and International Air
The air samples were created using flight schedules for all airlines carrying passengers out of the state. For
each sample day, flights were selected based on a random start. For each flight that was selected, surveyors
had a target number of surveys to complete among boarding passengers. Surveyors would approach
randomly selected passengers in the boarding area and complete the required number of surveys. Each
surveyor was badged, which allowed them into the secure area of the airport. Official airport security badges,

Alaska Visitor Statistics Program V: Technical Appendix McDowell Group, Inc. • Page 8
coupled with the heightened compliance with travel security, contributed to the high response rates among
domestic and international air passengers.
Highway
The highway sample was based on monthly traffic levels at each of the border stations. Survey stations were
set up adjacent to the border station on three highways (Alcan, Haines Highway, and Klondike Highway), and
near the Dawson City ferry dock on the Top of the World Highway (in the summer period only). Surveyors
would work in four to five-hour shifts on each sample day. When motorists had completed their Customs
interview (or before boarding the ferry at Dawson City), they were directed by signs to pull over to the side of
the road, where surveyors would conduct their tally of all motorists, and would randomly select respondents
for the intercept survey. Highway travelers who were re-entering Alaska on the same trip were screened out of
the survey.
Surveyors were certified in flagging and stopping vehicles by the Yukon Department of Highways and Public
Works. They were also able to use official, government-issued signs and cones. The official appearance of the
survey stations and surveyors themselves, as well as their proximity to border stations, likely played a role in the
high response rate among highway travelers.
Cruise Ship
The cruise ship sample was selected based on the expected volume of passengers at each “last port of call” in
Alaska – that is, every port that represented the final stop before the ship exited Alaska, and continued on to
non-Alaska ports. Cruise Line Agencies of Alaska provided the 2006 cruise ship schedule, including each
ship’s route and capacity. Although Ketchikan represented the bulk of exiting passengers, the 2006 cruise
ship schedule included several other last-call ports: Juneau, Skagway, Sitka, and Icy Strait Point (near Hoonah).
The appropriate number of surveys was conducted in each location to reflect actual exiting volume. Survey
targets also reflected passenger volume by cruise line – for example, if 30 percent of all exiting cruise
passengers were expected to be sailing with Princess Cruises, 30 percent of the targeted ships were Princess
ships.
Surveyors would station themselves outside the targeted ship several hours prior to boarding. They
approached randomly selected passengers to complete surveys before they boarded their ship. Where
necessary, surveyors were given special permission by private dock owners to interview passengers in the
embarkation areas.
Ferry
Ferry passengers were surveyed onboard Alaska Marine Highway vessels bound for Bellingham and Prince
Rupert. Sampled vessels were selected randomly by month among all southbound voyages. Surveyors would
approach randomly selected passengers during sample periods in public areas of the ferry. Because surveyors
sailed along with passengers, there was ample time to survey passengers who purchased staterooms as well as
those who did not. The fall/winter sample was handled differently due to the low target sample of ferry
visitors. Ferry passengers were surveyed onboard vessels bound for Bellingham and Prince Rupert while they
were docked in Ketchikan, between arrival and departure.

Alaska Visitor Statistics Program V: Technical Appendix McDowell Group, Inc. • Page 9
Online Component
The AVSP V survey methodology included an online sample in addition to the intercept sample. The online
sample was targeted by distributing “invitation cards” to visitors during intercept sample periods (see image,
below). The color-printed postcard contained a message from the State of Alaska inviting visitors to share
information about their trip over the Internet (see below). Recipients were directed to a web address, and
each postcard had a unique password. Respondents would then go online and self-administer the survey.
For every intercept survey that was completed, surveyors distributed a target number of invitation cards. Cards
were distributed to visitors departing on the same flights, ferry voyages, cruise sailings, etc. as intercept
respondents. (For the fall/winter sample, cards were distributed only in the Anchorage and Fairbanks airports.
There were not enough visitors in other locations to justify card distribution.)
The online survey was designed to mirror the intercept survey to the greatest extent possible. Questions were
asked in the same order, with nearly identical wording to the intercept survey. More explicit directions were
necessary for some questions to minimize confusion. If respondents had questions or difficulties filling out the
survey, there was a link on the bottom of each screen to contact the Help Desk.
The online method allowed for certain efficiencies not possible in the intercept format. These included
automated skip patterns and auto-sum functions in the expenditure section. Destinations visited were
automatically linked to a personalized menu as respondents progressed to the activities and expenditures
sections. In addition, the self-administered format eliminated the need for data entry.

Alaska Visitor Statistics Program V: Technical Appendix McDowell Group, Inc. • Page 10
Response Rates
Response rates show the percentage of people who completed a survey out of the total number of people
targeted.
In intercept surveys, the response rate is the number of total surveys, divided by the number of qualified,
targeted respondents approached by surveyors. For example, for the summer Domestic Air mode, there were
1,630 qualified respondents – that is, out-of-state residents who were exiting Alaska. Of this number, 130
declined to be interviewed. The response rate for summer Domestic Air is 1,500 divided by 1,630, or 92.0
percent.
For the online survey, the response rate is the number of people who completed the online survey, out of the
total number of people who received invitation cards. (Only out-of-state visitors exiting Alaska were given
cards.) For example, there were 11,011 cards distributed to summer visitors exiting the state via Domestic Air.
Of these visitors, 2,111 completed the online survey. The response rate for summer Domestic Air online
respondents is 2,111 divided by 11,011, or 19.2 percent.
Response Rates, by Mode
AVSP V
SUMMER FALL/WINTER
Exit Mode Intercept Online Intercept Online
Domestic Air 92.0% 19.2% 86.6% 10.8%
International Air 81.5% 20.3% 89.7% n/a
Highway 83.6% 13.5% 97.1% n/a
Cruise ship 72.3% 13.7% n/a n/a
Ferry 89.0% 13.1% 76.9% n/a
Total 85.6% 17.5% 87.3% 10.8%
The overall response rate for the summer intercept sample was 85.6 percent, and for the fall/winter intercept
sample 87.3 percent. Rates differed somewhat by mode, as expected. Domestic air respondents generally
show the highest intercept response rates because they often have plenty of time (and little to do) while they
are waiting for their flight. Ferry passengers are also almost always willing to be interviewed, as they are
onboard for significant periods of time. Cruise passengers show slightly lower response rates – they are
approached as they return to their ship, occasionally in inclement weather, and can be anxious to embark.
Online response rates also correspond to project team expectations for each exit mode. Ferry, highway, and
cruise ship passengers are often several days from returning home when they receive the invitation card. This
makes them more likely to lose the card or forget about it when compared to air passengers, who are usually
returning home that same day.
Although response rates differ by mode and by survey method, the data is not adversely affected. As
explained in Data Weighting, above, all data is weighted according to traffic volumes by mode and location.
Given the length and complexity of the survey instrument, response rates exceeded expectations for the
intercept sample. Nearly nine out of ten visitors approached agreed to complete a 10 to 20 minute survey,

Alaska Visitor Statistics Program V: Technical Appendix McDowell Group, Inc. • Page 11
sometimes in rainy, windy, or buggy weather, with a pin as an incentive. Several factors helped: well-trained,
friendly surveyors; the eagerness of respondents to share information about their recently completed trip; and,
in the case of ferry and air respondents, the lack of other available activities.
Response rates far exceeded expectations for the online sample. Based on a test conducted in the summer of
2005, the study team projected a response rate of 12 percent for the Domestic Air mode. The actual response
rate for summer Domestic Air was 19.2 percent, and 17.5 percent for all modes combined. The higher
response rate likely resulted from the high quality of the invitation cards and the generous incentives offered.
Incentives
Incentives are commonly used in surveys to maximize response rates. For AVSP V, incentives were used in
both the intercept and online surveys. Intercept respondents were given an Alaska keepsake pin. Summer
online respondents were entered into a monthly drawing to win a Denali Park Resorts package. All summer
respondents were also entered into a drawing for a Princess cruise to Alaska, Mexico, or the Caribbean.
Fall/winter online respondents were entered into a drawing to win one of two Alyeska Resort packages. All
fall/winter respondents were entered into a drawing for a Holland America cruise to Alaska, Mexico, Canada or
the Caribbean.
Margins of Error
The following table shows the maximum margin of error for the intercept and combined samples. The
maximum margin for the summer data is ±1.4 percent for the overall sample and ±1.9 percent for the
intercept sample. The maximum margin for the fall/winter data is ±2.7 percent for the overall sample and
±3.0 percent for the intercept sample. The combined sample is used for most data in the reports, with a few
categories based to intercept respondents only. Sample sizes and margins of error for specific subgroups are
presented in the introduction to each section and/or chapter where those subgroups are profiled.
Visitor Survey Margin of Error AVSP V
SUMMER FALL/WINTER
Survey Method Sample Size
Maximum Margin of Error Sample Size
Maximum Margin of Error
Intercept 2,703 ±1.9% 1,055 ±3.0%
Online 2,956 n/a 223 n/a
Total 5,659 ±1.4% 1,278 ±2.7%
Note: The data presented in AVSP reports is based to either intercept data or total data. Data based only to online respondents is not reported.
While the margin factors in the table above give general guidelines for the margin of error, most data in AVSP
reports are more accurate than the maximum factors suggest. The margin is based not only on the number of
respondents in the base of each question, but on the statistic itself. The expression “maximum margin of
error” applies only if the attribute being sampled is distributed 50-50 among the population, such as gender.
For gender, the maximum margin of error for the total summer sample is ±1.4 percent.

Alaska Visitor Statistics Program V: Technical Appendix McDowell Group, Inc. • Page 12
However, the potential for error decreases as soon as the survey result moves toward either end of the bell
curve. If a survey response is around 80 percent for the total summer sample of 5,659, the maximum error
decreases to ±1.1 percent. This margin would apply, for example, to the survey result for trip purpose – 82
percent of all visitors said they were traveling for vacation/pleasure. That same margin would apply to
responses around 20 percent. At the 90 and 10 percent level, the maximum margin for the total sample
decreases even further, to ±0.77 percent.
Data Processing
Data Weighting
Survey data is often “weighted” to properly reflect known characteristics of a population. The primary
weighting in AVSP is by exit mode. For example, the summer sample included 235 surveys of visitors who
exited the state by ferry, or 4.0 percent of all surveys. However, this market represents only 0.7 percent of all
visitors. In order for these visitors to be properly represented in the overall visitor market, their surveys are
“weighted down.” Similarly, visitors exiting by cruise ship represented 17.4 percent of all summer surveys, but
46.5 percent of all exiting visitors. Their data is “weighted up.” All AVSP data was weighted by exit mode to
reflect actual traffic volumes.
Summer online data was weighted by one additional factor: the geographic distribution of visitor origin.
Online respondents from international countries and from certain geographical regions of the US were slightly
less likely to respond to the survey. Because the intercept method ensured accurate distribution by origin,
online data was weighted to reflect origin distribution in the intercept sample.
Fall/winter online data was weighted by trip purpose. Online respondents traveling for vacation/pleasure were
more likely to respond to the survey. Because the intercept method ensured accurate distribution by trip
purpose, online data was weighted to reflect trip purpose distribution in the intercept sample.
Combining Data Sets
As explained earlier in this chapter, the visitor survey included two different methodologies: online and
intercept. The online survey targeted the same visitor population as the intercept survey – invitation cards were
distributed to visitors on the same flights, ferry vessels, cruise ships, and during the same highway periods as
intercept respondents. (In the fall/winter study period, cards were only distributed in the Anchorage and
Fairbanks airports.) However, because the online survey (naturally) received lower response rates, and
because the survey was in a different format, several issues had to be addressed before combining the two
data sets.
This first issue is bias. Self-selection bias occurs when the characteristics of respondents who choose to answer
a survey differ from those of the overall target population. Even though the response rates for the summer
online survey far exceeded expectations at 18 percent, there was the possibility that the population that chose
to respond to the survey differed from the population in the intercept survey. To address this issue, the study
team compared a wide range of demographic variables between the two samples, including gender, origin,

Alaska Visitor Statistics Program V: Technical Appendix McDowell Group, Inc. • Page 13
age, income, and education. Only origin presented a potential bias; this was addressed with weighting, as
described above.
The results to other survey questions were carefully compared to detect any sign of additional bias among
online respondents. The only other apparent bias was in trip planning. Online respondents were more likely to
use nearly all trip planning sources, particularly the Internet. For questions regarding trip planning sources,
only intercept data is presented in the report.
The second issue is the difference in survey formats. Although the online survey was designed to mirror the
intercept survey, results showed that some questions worked better in a personal interview format than online.
In an intercept survey, the interviewer is able to explain and clarify questions when necessary. Following is a
list of survey questions where the reported data reverts to the intercept sample only due to misinterpretation in
the online survey.
Party size. Respondents were asked how many people were traveling in their party, sharing expenses.
Interviewers were able to clarify this question if a respondent (mistakenly) answered with the number of
people in their tour group, for example. Online respondents were not given this opportunity to clarify their
response. As a result, the average party size among online respondents was higher than among intercept
respondents.
Activity participation. Certain activities generated much higher participation rates in the online survey when
compared to the intercept survey. These activities tended to be categories that online respondents appeared
to interpret more broadly than in the intercept survey, including historical/cultural attractions, Native cultural
tours/activities, and shows/Alaska entertainment. Activities that had more straightforward definitions
(shopping, birdwatching, White Pass and Yukon Railroad, visiting friends and relatives, and fishing, among
others) yielded very similar results for the two samples. It appears that the guidance of the surveyor was
essential for respondents to understand some activity categories, and not over-report by counting one activity
in two categories, for example.
Transportation between communities. Although this question specifically asked what modes were used to
travel between communities, it appears that some online respondents misinterpreted this question to refer to
modes of transportation used at any point on their trip. For example, online cruise respondents were much
more likely to say they used motorcoach, train, and air to travel between communities when compared to the
intercept sample. The online respondents were often referring to shore excursions and their travel to get in or
out of the state. This was a difficult question for online respondents to understand without the aid of a
surveyor.
Expenditures. Questions on expenditures tend to be difficult for visitors to answer, whether intercept or
online. Respondents have to rely on their memory, sometimes on purchases made days or weeks beforehand.
The level of detail requested on this survey was particularly challenging: visitors were asked for their purchases
in each community, in six different categories, in addition to overall spending in the state, spending on
packages, and more. The differences in expenditure results between the intercept and online samples
indicated that the online respondents had difficulty with the complexity of this part of the survey. For
example, some questions referred to spending by party, others asked for per person prices. The overall

Alaska Visitor Statistics Program V: Technical Appendix McDowell Group, Inc. • Page 14
spending question asked the respondent to discount travel to and from Alaska. In the field, surveyors could
help clarify these questions.
Throughout the AVSP reports, the data in the above categories is accompanied by a footnote and the
statement “based to intercept respondents only.”
Despite the fact that some online results were not used in AVSP reports, it is important to recognize the value
of introducing the online survey to the AVSP process. It increased the overall sample size for most questions in
the summer survey, from 2,703 to 5,659. The large sample size was critical to providing useful data at the
subgroup level, including communities, region of origin, and other subgroups. In addition, the intercept-only
samples remain large enough in most cases to ensure significant confidence in the data.

Alaska Visitor Statistics Program V: Technical Appendix McDowell Group, Inc. • Page 15
Ratios
The following tables shows the visitor/resident ratios applied to traffic data, including airport enplanements,
ferry disembarkations, cruise passenger volumes, and highway border crossings. Each percentage represents
the proportion of out-of-state visitors out of total traffic. The first table shows summer ratios; the second table
shows fall/winter ratios.
Visitor/Resident Ratios AVSP V - Summer 2006
DOMESTIC AIR May June July August September
Anchorage 54.4% 70.3% 79.4% 76.9% 71.2%
Fairbanks 38.1% 64.3% 63.5% 66.2% 62.8%
Juneau 36.5% 69.8% 74.5% 69.6% 59.5%
Ketchikan 50.5% 75.5% 80.4% 85.2% 80.8%
Sitka 54.0% 74.6% 76.0% 76.0% 54.0%
Other 44.0% 72.8% 70.3% 75.0% 66.9%
INTERNATIONAL AIR (applied by airline, full season)
Anchorage China Air Japan Korean Condor Air China
50.0% 99.7% 91.3% 81.1% 99.7%
Fairbanks Condor Japan Air North
69.0% 98.0% 65.6%
FERRY May June July August September
Bellingham 42.7% 53.8% 69.4% 67.4% 55.3%
Prince Rupert 55.4% 65.8% 82.4% 80.1% 64.8%
HIGHWAY PERSONAL VEHICLE (applied by location, full season)
Beaver Creek (Alcan) 40.2%
Fraser (Skagway) 38.4%
Little Gold (Dawson) 42.0%
Pleasant (Haines) 23.1%
HIGHWAY MOTORCOACH (applied by location, full season)
Beaver Creek (Alcan) 10.0%
Fraser (Skagway) 0.0%
Little Gold (Dawson) 10.0%
Pleasant (Haines) 0.0%
HIGHWAY TRUCKS (applied by location, full season)
Beaver Creek (Alcan) 60.0%
Fraser (Skagway) 100.0%
Little Gold (Dawson) 60.0%
Pleasant (Haines) 0.0%
CRUISE (full season)
All locations 100.0%

Alaska Visitor Statistics Program V: Technical Appendix McDowell Group, Inc. • Page 16
Visitor/Resident Ratios AVSP V – Fall/Winter 2006-07
DOMESTIC AIR
Oct Nov Dec Jan Feb Mar Apr
Anchorage 44.3% 37.2% 31.9% 31.7% 31.2% 31.8% 34.2%
Fairbanks 27.1% 27.0% 19.1% 22.8% 23.7% 27.2% 20.1%
Juneau 18.3% 17.4% 28.7% 19.6% 25.2% 20.0% 24.2%
Oct-Dec Jan-Apr
Ketchikan 32.1% 26.3%
Sitka 17.7% 26.3%
Other 24.4% 24.7%
INTERNATIONAL AIR (applied by airline, full season)
Anchorage/Fairbanks China Air Japan Condor Air North
15.8% 100.0% 81.1% 0.0%
FERRY (applied by location, full season)
Bellingham 42.7%
Prince Rupert 55.4%
HIGHWAY PERSONAL VEHICLE
Oct-Dec Jan-Apr
Beaver Creek (Alcan) 10.2% 13.1%
Fraser (Skagway) 15.3% 22.4%
Pleasant (Haines) 38.6% 15.6%
HIGHWAY MOTORCOACH (applied by location, full season)
Beaver Creek (Alcan) 50.0%
Fraser (Skagway) 50.0%
Pleasant (Haines) 50.0%
HIGHWAY TRUCKS (applied by location, full season)
Beaver Creek (Alcan) 60.0%
Fraser (Skagway) 100.0%
Pleasant (Haines) 0.0%

Alaska Visitor Statistics Program V: Technical Appendix McDowell Group, Inc. • Page 17
Weighting
AVSP Summer data was weighted using the following distributions.
Data Weighting AVSP V – Summer 2006
By Origin (Online data only)
Western US 38.8%
Southern US 19.4
Eastern US 13.3
Midwest US 13.2
Canada 6.0
Other International 15.4
By Domestic Air Exit Location
Anchorage 77.2%
Fairbanks 9.3
Juneau 6.1
Ketchikan 4.6
Sitka 2.7
By Exit Mode
Domestic Air 47.5%
International Air 1.0
Cruise 46.9
Ferry 0.7
Highway POV 3.8
AVSP Fall/Winter data was weighted using the following distributions.
Data Weighting AVSP V – Fall/Winter 2006-07
By Trip Purpose (Online data only)
Visiting friends/relatives 42.3%
Business 39.0
Vacation/pleasure 11.9
Business and pleasure 6.8
By Domestic Air Exit Location
Anchorage 83.5%
Fairbanks 7.9
Juneau 4.7
Ketchikan 2.8
Sitka 1.1
By Exit Mode
Domestic Air 95.0%
International Air 1.7
Ferry 0.7
Highway POV 2.6

Alaska Visitor Statistics Program V: Technical Appendix McDowell Group, Inc. • Page 18
Code Changes and Definitions
This chapter presents code changes between the printed survey and the survey data. It also presents the
definitions of certain sub-groups.
Origin
The following table shows how countries of origin were re-coded for data processing.
Country of Origin (Question 2a) Survey Code DP Code Australia 51 01 Austria 52 02 Belgium 53 03 Canada 54 04 China 55 05 France 56 06 Germany 57 07 India 58 08 Italy 59 09 Japan 60 10 Korea 61 11 Mexico 62 12 Netherlands 63 13 New Zealand 64 14 Russia 65 15 Spain 66 16 Sweden 67 17 Switzerland 68 18 Taiwan 69 19 United Kingdom 70 20 United States 70 21 Other 97 22
The following table shows how geographical regions were grouped for sub-group profiles.
World Regions (Question 2a) Codes Europe 02, 03, 06, 07, 09, 13, 15, 16, 17, 18, 20, 23 German-Speaking Europe (GSE) 02, 07, 18 Australia/New Zealand 01, 14 Asia 05, 08, 10, 11, 19, 24 US Regions (Question 2b) Codes Western US 03, 05, 06, 11, 12, 26, 28, 31, 37, 44, 47, 51 Midwestern US 13, 14, 15, 16, 22, 23, 27, 34, 35, 41, 50 Southern US 01, 04, 09, 10, 17, 18, 24, 25, 33, 36, 40, 42, 43, 46 Eastern US 07, 08, 19, 20, 21, 29, 30, 32, 38, 39, 45, 48, 49

Alaska Visitor Statistics Program V: Technical Appendix McDowell Group, Inc. • Page 19
Destinations
The following table shows how destinations within Alaska were re-coded for data processing.
Destinations (Question 9a) Survey Code DP Code Other Southeast 30 40 Other Southcentral 31 41 Other Kenai Peninsula 32 42 Other Interior 33 43 Other Southwest 34 44 Other Far North 35 45 Other 97 46
The following table shows how Alaska destinations were grouped into regions for sub-group analysis.
Alaska Regions (Question 9a) Codes Southeast 07, 09, 11, 12, 14, 18, 20, 23, 24, 29, 40 Southcentral 03, 06, 17, 19, 21, 25, 27, 28, 41
Kenai Peninsula (subnet) 10, 13, 22, 42 Interior 04, 05, 08, 26, 43 Southwest 15, 44 Far North 16, 45 Other 46

Alaska Visitor Statistics Program V: Technical Appendix McDowell Group, Inc. • Page 20
Survey Instrument
See attached.

AVSP V Survey 8/10/06 Page 1 McDowell Group, Inc.
Alaska Visitor Statistics Program V
State of Alaska
Department of Commerce, Community
& Economic Development
A. Interviewer Name: B. Date:
C. Mode and Location
DOMESTIC AIR INTERNATIONAL AIR CRUISE SHIP HIGHWAY D. Vehicle Type
01 Anchorage 06 Anchorage 10 Ketchikan 15 Alcan 01 RV/camper
02 Fairbanks 07 Fairbanks 11 Skagway 16 Dawson City 02 Car/truck/van
03 Juneau FERRY 12 Sitka 17 Skagway 03 Motorcoach/bus
04 Ketchikan 08 to Bellingham 13 Juneau 18 Haines 97 Other
05 Sitka 09 to Prince Rupert 14 Hoonah
E. Airline and Flight # F. Refusals
1. What was the main purpose for this trip? (Read 1-4)
1 Vacation/pleasure
2 Visiting friends or relatives If Seasonal Worker, Discontinue
3 Business (Includes commercial fishing, guiding, oil field work, etc.)
4 Business and pleasure
2. Which state or country are you visiting from?
U.S.
01 Alabama 14 Iowa 27 Nevada 40 South Dakota
02 Arizona 15 Kansas 28 New Hampshire 41 Tennessee
03 Arkansas 16 Kentucky 29 New Jersey 42 Texas
04 California 17 Louisiana 30 New Mexico 43 Utah
05 Colorado 18 Maine 31 New York 44 Vermont
06 Connecticut 19 Massachusetts 32 North Carolina 45 Virginia
07 Delaware 20 Maryland 33 North Dakota 46 Washington
08 Florida 21 Michigan 34 Ohio 47 Washington, D.C.
09 Georgia 22 Minnesota 35 Oklahoma 48 West Virginia
10 Hawaii 23 Mississippi 36 Oregon 49 Wisconsin
11 Idaho 24 Missouri 37 Pennsylvania 50 Wyoming
12 Illinois 25 Montana 38 Rhode Island
13 Indiana 26 Nebraska 39 South Carolina
International
51 Australia 57 Germany 63 Netherlands 69 Taiwan
52 Austria 58 India 64 New Zealand 70 United Kingdom
53 Belgium 59 Italy 65 Russia 97 Other
54 Canada 60 Japan 66 Spain
55 China 61 Korea 67 Sweden
56 France 62 Mexico 68 Switzerland
3. What mode of transportation did you use to enter Alaska?
1 Air 3 Highway 3a. What type of vehicle were you using?
2 State ferry 4 Cruise ship 1 RV/Camper 2 Car/truck/van 3 Motorcoach/bus
7 Other 7 Other
4. Did you use any of the following modes of transportation to travel between communities within Alaska? (Read 1-8)
01 Air 03 Alaska Railroad 05 Rental vehicle 07 Personal vehicle 09 None of the above
02 State ferry 04 Motorcoach or bus 06 Rental RV 08 Personal RV 99 Don’t know/refused
5. Is this your first trip to Alaska? 1 Yes (Skip to #8) 2 No
6. Not including this trip, how many times have you been to Alaska for vacation?
97 Used to live here 99 DK/Ref.
7. On your last trip to Alaska, which mode of transportation did you use to . . .
A. Enter Alaska? 1 Air 2 State ferry 3 Highway 4 Cruise ship 7 Other
B. Exit Alaska? 1 Air 2 State ferry 3 Highway 4 Cruise ship 7 Other
8. On this current trip, how many nights total were you in Alaska? If you overnighted on a cruise ship or ferry, please include all nights on board.

AVSP V Survey 8/10/06 Page 2 McDowell Group, Inc.
9. Where in Alaska did you stay each night while on your trip? 9a. How many nights and what type of lodging?
Hotel/ motel Lodge B&B
Private home
State/Nat’l Campground
CommercialCampground
Wilderness Camping
Cruise Ship
State Ferry Other
01 State ferry
02 Cruise ship
10. DAY
VISIT?
03 Anchorage 03
04 Denali/Healy/ Cantwell
04
05 Fairbanks 05
06 Girdwood/Alyeska 06
07 Glacier Bay/ Gustavus
07
08 Glennallen 08
09 Haines 09
10 Homer 10
11 Hoonah/ Icy Strait Point
11
12 Juneau 12
13 Kenai/Soldotna 13
14 Ketchikan 14
15 Kodiak 15
16 Nome 16
17 Palmer/Wasilla 17
18 Petersburg 18
19 Portage 19
20 Prince of Wales Is. 20
21 Prince William Sound
21
22 Seward 22
23 Sitka 23
24 Skagway 24
25 Talkeetna 25
26 Tok 26
27 Valdez 27
28 Whittier 28
29 Wrangell 29
30 Other So.East 30
31 Other So.Central 31
32 Other Kenai Pen.
32
33 Other Interior 33
34 Other So. West 34
35 Other Far North 35
97 Other 97
10. Did you visit any communities or destinations without spending the night? 00 None OR

AVSP V Survey 8/10/06 Page 3 McDowell Group, Inc.
Record all expenditures in US Dollars
NON-CRUISE VISITORS ONLY
11. Excluding transportation to and from Alaska, can you estimate how much your traveling party spent on your entire Alaska trip? $ 98 Don’t know 99 Ref.
12. Did your party purchase any multi-day packages that included lodging, transportation, and activities?
1 Yes 12a. Which of the following best describes this package? (Read 1-5)
01 Fishing lodge package
2 No 02 Wilderness lodge package
8 Don’t know 03 Motorcoach tour
9 Refused 04 Rail package
05 Adventure tour (hiking, biking, kayaking, rafting)
07 Other
12b. Can you estimate the price per person for this package? $ 98 Don’t know 99 Ref.
STATE FERRY PASSENGERS ONLY
13. Can you estimate the price per person for your ferry tickets? $ 98 Don’t know 99 Ref.
CRUISE VISITORS ONLY
14. What was the name of your cruise line? 98 Don’t know 99 Ref.
15. Which of the following best describes your Alaska trip? (Read 1-4)
1 Round trip cruise from Vancouver or Seattle
2 Cruise one-way, fly one-way
3 Cruise with an overnight Alaska land tour
4 In-state cruise
7 Other
16. Did you spend any nights in Alaska on your own, in addition to your cruise or land tour package?
1 Yes 2 No
17. Can you estimate the price per person $ 98 Don’t know 99 Ref. for your cruise or cruise/tour package?
17a. Did this price include airfare? 1 Yes 2 No 98 Don’t know 99 Ref.
18. Can you estimate what your traveling party spent
on the rest of your Alaska trip? Please include $ 98 Don’t know 99 Ref. tours your party bought before and during your trip.
19. Now I’d like to ask you about your party’s spending in each community. Let’s start with (community). While in (community), about how much did your party spend on lodging? Show categories.
If “none,” enter $0. If “don’t know,” leave blank.
Include all communites from Q9/10 Lodging
Tours
Activities Entertain.
Gifts
Souvenirs Clothing
Food
Beverage
Rental Cars
Fuel Transportation Other
(If any DK, ask
for total)
a. $ $ $ $ $ $ $
b. $ $ $ $ $ $ $
c. $ $ $ $ $ $ $
d. $ $ $ $ $ $ $
e. $ $ $ $ $ $ $
f. $ $ $ $ $ $ $
g. $ $ $ $ $ $ $
h. $ $ $ $ $ $ $
i. $ $ $ $ $ $ $
j. $ $ $ $ $ $ $
k. $ $ $ $ $ $ $
l. $ $ $ $ $ $ $
m. $ $ $ $ $ $ $
n. $ $ $ $ $ $ $
o. $ $ $ $ $ $ $
p. $ $ $ $ $ $ $

AVSP V Survey 8/10/06 Page 4 McDowell Group, Inc.
20. Which tours or activities did you participate in while in Alaska? (Show list)
21. Where did you participate in these activities?
01 Biking
02 Bird watching
03 Business
04 Camping
05 City/sightseeing tours
06 Day cruises
Whale watch, wildlife, glacier, riverboat
07 Dog sledding
08 Fishing (guided)
09 Fishing (unguided)
10 Flightseeing
11 Gold panning/mine tour
12 Hiking/nature walk
13 Historical/cultural attractions Pioneer Park, festivals, Russian history
14 Hunting
15 Kayaking/canoeing
16 Museums
17 Native cultural tours/activities
18 Rafting
19 Salmon bake
20 Shopping
21 Shows/Alaska entertainment
22 Train – Alaska Railroad
23 Train – White Pass/Yukon SKAGWAY
24 Tramway/gondola
25 Visiting friends/relatives
26 Wildlife viewing
27 Northern Lights viewing
28 Snow skiing/boarding
29 Snowmobiling
97 Other activity:
97 Other activity:
97 Other activity:

AVSP V Survey 8/10/06 Page 5 McDowell Group, Inc.
(SKIP Q22-Q23 FOR BUSINESS-ONLY TRAVELERS)
22. How well did your trip to Alaska live up to what you expected from an Alaska vacation? Was it… (Read 1-5)
5 Much higher than expectations 3 About what you expected 2 Below expectations 8 Don’t know
4 Higher than expectations 1 Far below expectations 9 Refused
23. In terms of value for the money, how does Alaska compare with other vacation destinations you’ve visited in the past five years? Was it… (Read 1-5)
5 Much better 3 About the same 2 Worse 8 Don’t know
4 Better 1 Much worse 9 Refused
24. Please tell me whether you were very satisfied, satisfied, dissatisfied, or very dissatisfied with the
following aspects of your Alaska trip:
Very
Satisfied
Satisfied
Neither/
Neutral
Dissatisfied
Very
Dissatisfied
Did not
use
DK/
Ref.
a. Your overall experience in Alaska 5 4 3 2 1 6 9
b. Accommodations 5 4 3 2 1 6 9
c. Restaurants 5 4 3 2 1 6 9
d. Shopping 5 4 3 2 1 6 9
e. Visitor information services 5 4 3 2 1 6 9
f. Sightseeing 5 4 3 2 1 6 9
g. Tours and activities 5 4 3 2 1 6 9
h. Wildlife viewing 5 4 3 2 1 6 9
i. Transportation within Alaska 5 4 3 2 1 6 9
j. Friendliness of residents 5 4 3 2 1 6 9
k. Value for the money 5 4 3 2 1 6 9
25. How likely are you to recommend Alaska as a vacation destination to others? (Read 1-4)
4 Very likely 2 Unlikely 8 Don’t know
3 Likely 1 Very unlikely 9 Refused
26. How likely are you to return to Alaska in the next five years? (Read 1-4)
4 Very likely 2 Unlikely 8 Don’t know
3 Likely 1 Very unlikely 9 Refused
27. How far in advance did you decide to come on this trip to Alaska? # of months OR 00 < 1 month
28. How far in advance did you book your major travel arrangements? # of months OR 00 < 1 month
29. Did you use the Internet to research or book any portion of your trip?
1 No (Skip to Q30) 8 Don’t know (Skip to Q30)
2 Yes, research only (Skip to Q29b)
3 Yes, research & book 29a. Which portions of your trip did you book through the Internet?
01 Airfare 03 Tours 05 Cruise 07 Overnight packages
02 Lodging 04 Vehicle rental 06 Ferry 97 Other
29b. Did you visit the official State of Alaska travel website? (www.travelalaska.com)
1 Yes 2 No 8 Don’t know 9 Refused
30. Did you book any portion of your trip through a travel agent?
1 Yes 2 No 8 Don’t know 9 Refused
31. Did you receive the State of Alaska Official Vacation Planner?
1 Yes 2 No 8 Don’t know 9 Refused
32. What other sources did you use to get information about Alaska? (Show list)
01 AAA 07 Ferry brochure/schedule 13 Prior experience
02 Brochures 08 Friends/family 14 Television
03 Club/organization 09 Hotel/lodge 15 Travel/recreation exhibits
04 Community brochures 10 Library 16 Milepost
05 Convention & Visitor Bureau(s) 11 Magazine 17 North to Alaska Guide
06 Cruise line/tour company 12 Newspaper 18 Other travel guide/book
97 Other 00 None
97 Other 99 Don’t know/refused

AVSP V Survey 8/10/06 Page 6 McDowell Group, Inc.
33. Including yourself, how many people are traveling in your immediate party sharing expenses such as food, lodging and transportation?
34. What are the ages and gender of everyone in your traveling party? (Enter first 8 members of party only)
34a. 34b. 34a. 34b.
Male Female Age
Male Female Age
Yourself 1 2 Traveler #5 1 2
Traveler #2 1 2 Traveler #6 1 2
Traveler #3 1 2 Traveler #7 1 2
Traveler #4 1 2
Traveler #8 1 2
35. Are there children living in your household? 1 Yes 2 No 8 Don’t know 9 Refused
36. Are you retired, or semi-retired? 1 Yes 2 No 8 Don’t know 9 Refused
37. Please point to the highest level of education you had the opportunity to complete.
01 Grade 11 or less 03 Associate/technical degree 05 Graduated from college
02 High school graduate/GED 04 Some college 06 Masters/Doctorate
98 Don’t know 99 Refused
97 Other
38. Please point to the category that best describes your household. (Before-tax income, US$)
01 Less than $25,000 04 $75,000 to $100,000 07 $150,000 to $200,000
02 $25,000 to $50,000 05 $100,000 to $125,000 08 More than $200,000
03 $50,000 to $75,000 06 $125,000 to $150,000 09 Other currency:
98 Don’t know 99 Refused
39. The State of Alaska may wish to contact you in the future to find out more about your Alaska experiences. Would you be willing to provide your email address? Your information would not be shared or used for any purposes other than visitor research.
01 Yes 02 No 03 Don’t have email
Thank you!