Embed Size (px)
Citation preview
Alaska’s 2010 Air Monitoring
Network Plan
Chapter 3 - Anchorage
State of Alaska Department of Environmental Conservation
Division of Air Quality
Air Monitoring and Quality Assurance Section
619 E. Ship Creek Ave. Suite 249
Anchorage, AK 99501
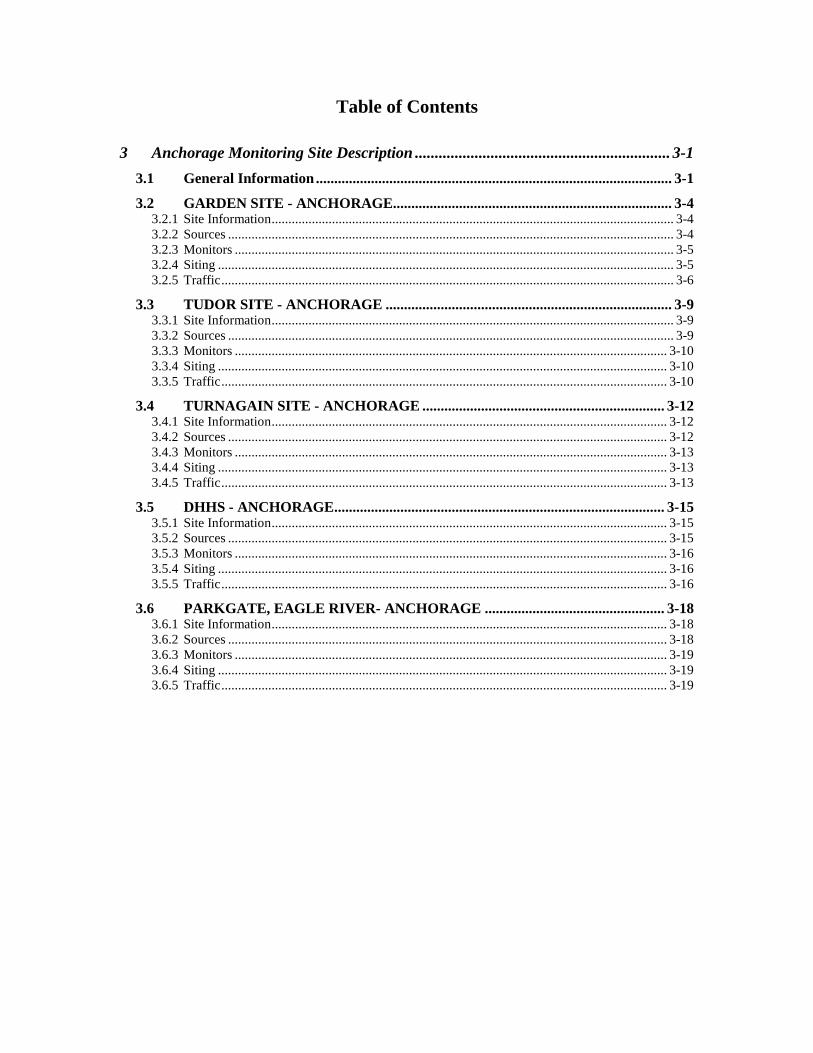
Table of Contents
3 Anchorage Monitoring Site Description ................................................................ 3-1
3.1 General Information ................................................................................................. 3-1
3.2 GARDEN SITE - ANCHORAGE............................................................................ 3-4 3.2.1 Site Information ........................................................................................................................ 3-4 3.2.2 Sources ..................................................................................................................................... 3-4 3.2.3 Monitors ................................................................................................................................... 3-5 3.2.4 Siting ........................................................................................................................................ 3-5 3.2.5 Traffic ....................................................................................................................................... 3-6
3.3 TUDOR SITE - ANCHORAGE .............................................................................. 3-9 3.3.1 Site Information ........................................................................................................................ 3-9 3.3.2 Sources ..................................................................................................................................... 3-9 3.3.3 Monitors ................................................................................................................................. 3-10 3.3.4 Siting ...................................................................................................................................... 3-10 3.3.5 Traffic ..................................................................................................................................... 3-10
3.4 TURNAGAIN SITE - ANCHORAGE .................................................................. 3-12 3.4.1 Site Information ...................................................................................................................... 3-12 3.4.2 Sources ................................................................................................................................... 3-12 3.4.3 Monitors ................................................................................................................................. 3-13 3.4.4 Siting ...................................................................................................................................... 3-13 3.4.5 Traffic ..................................................................................................................................... 3-13
3.5 DHHS - ANCHORAGE .......................................................................................... 3-15 3.5.1 Site Information ...................................................................................................................... 3-15 3.5.2 Sources ................................................................................................................................... 3-15 3.5.3 Monitors ................................................................................................................................. 3-16 3.5.4 Siting ...................................................................................................................................... 3-16 3.5.5 Traffic ..................................................................................................................................... 3-16
3.6 PARKGATE, EAGLE RIVER- ANCHORAGE ................................................. 3-18 3.6.1 Site Information ...................................................................................................................... 3-18 3.6.2 Sources ................................................................................................................................... 3-18 3.6.3 Monitors ................................................................................................................................. 3-19 3.6.4 Siting ...................................................................................................................................... 3-19 3.6.5 Traffic ..................................................................................................................................... 3-19
List of Figures Figure 3.1:1: Map of Anchorage area. Red dots indicate monitoring sites. .............................................. 3-3 Figure 3.2:1: Street map and satellite image of the Garden monitoring site. The red circles indicate the
sites location. ............................................................................................................................................... 3-4 Figure 3.2:2: Pictures of the Garden Site .................................................................................................. 3-7 Figure 3.2:3: View of CO probe at Garden Site. The red circle indicates where the probe is located. ..... 3-8 Figure 3.3:1: Street map and satellite image of the Tudor monitoring site. The red circle indicates the
sites location. ............................................................................................................................................... 3-9 Figure 3.4:1: Street map and satellite image of the Turnagain monitoring site. The red circles indicate the
sites location. ............................................................................................................................................. 3-12 Figure 3.5:1: Street map and satellite image of the DHHS monitoring site. The red circles indicate the
sites location. ............................................................................................................................................. 3-15 Figure 3.6:1: Street map and satellite image of the Eagle River monitoring site. The red circle indicates
the sites location. ....................................................................................................................................... 3-18 Figure 3.6:2: Pictures of the Parkgate Site .............................................................................................. 3-20
List of Tables
Table 3-1: SLAMS and SPM sites in the Municipality of Anchorage .......................................................... 3-2
3-1
3 ANCHORAGE MONITORING SITE DESCRIPTION
3.1 General Information
The Municipality of Anchorage (MOA) with a population1 of 275,240 is the largest city
in Alaska. Anchorage encompasses 1,697 square miles of land and 264 square miles of
water and is located between the Chugach Mountains to the east, the Knik Inlet to the
north, the Cook Inlet to the west, and the Turnagain Arm to the south. The average
temperatures range from 6 ºF to 20 ºF in the winter and from 50 ºF to 70 ºF in the
summer. Annual precipitation is 15.9 inches, with 69 inches of snowfall.
Anchorage was designated non-attainment for CO on November 15, 1990. The
community developed a rigorous Inspection and Maintenance (I&M) program to reduce
tail pipe emissions from automobiles and US Environmental Protection Agency (EPA)
has required that new automobiles emit less environmental pollution, both of which have
helped improve the air quality in Anchorage. The Municipality was re-designated from
CO, “serious non-attainment area” to “maintenance” area on July 23, 2004. Appendix A
lists the definitions of each designation.
Plagued by springtime dust and residual volcanic ash from erupting Cook Inlet volcanoes
in the late 1980s and in the early 1990s, the Municipality of Anchorage was flirting with
a PM10 problem. On December 5, 1995, the Municipality of Anchorage, the Alaska
DEC, and the EPA entered into a memorandum of agreement to reduce dust impacts and
avoid a PM10 non-attainment designation. A control strategy was developed and agreed
to by all parties with the implementation responsibility placed on the Municipality. The
control strategies were made part of a community’s long range transportation plan.
The Municipality of Anchorage’s (MOA) air quality program currently operates five air
monitoring stations in the municipality. Each station can be equipped to monitor for
multiple pollutants. The network pollutant monitors have designations for both State and
Local Air Monitoring Site (SLAMS) and Special Purpose Monitoring Sites (SPM). The
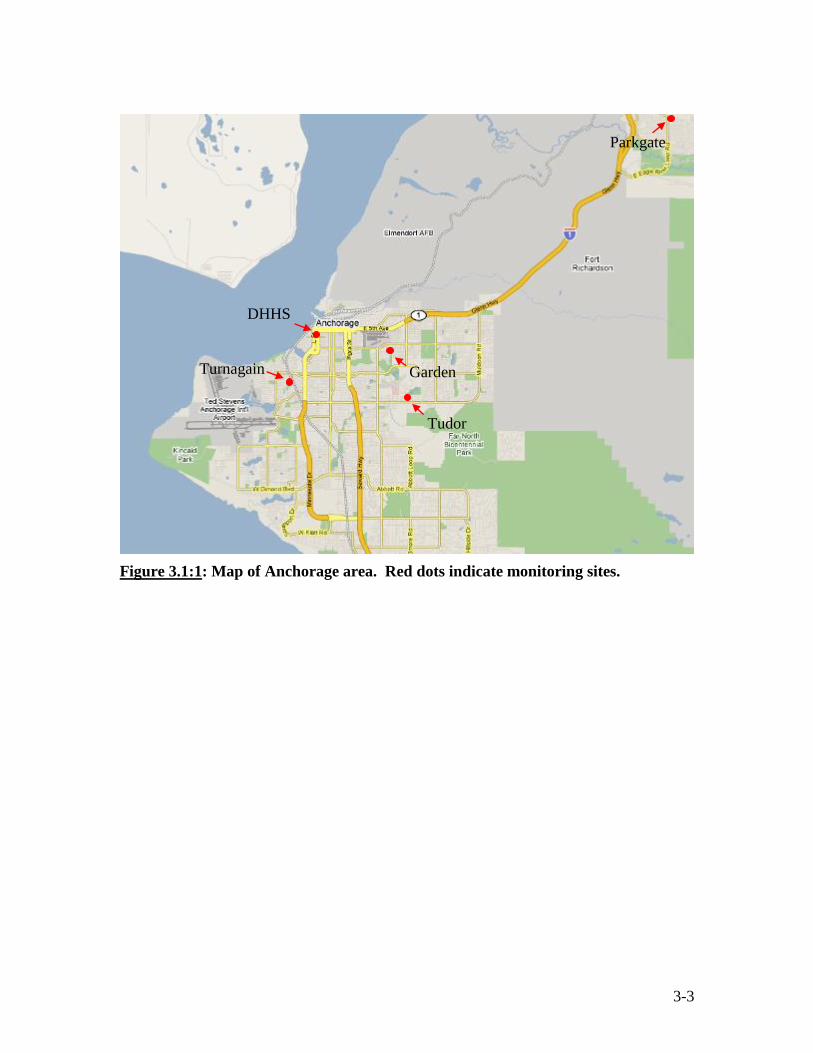
municipality’s SLAMS and SPM sites are described below in Table 3-1. Figure 3.1:1 is a
map showing the entire Anchorage monitoring network. Appendix B lists siting criteria.
Due to the lowering of the ozone standard and the population of the Upper Cook Inlet
airshed, ozone monitoring will begin with the 2010 season. The State and the
Municipality of Anchorage air quality staff are in the process of selecting the most
representative sites for ozone monitoring. Using at least two sites will likely best
represent the complexity of the airshed; one site is proposed in Eagle River and one
within the Anchorage bowl. Ozone monitors were purchased in April 2009.
1 Population data from 2005 U. S. Census.
3-2
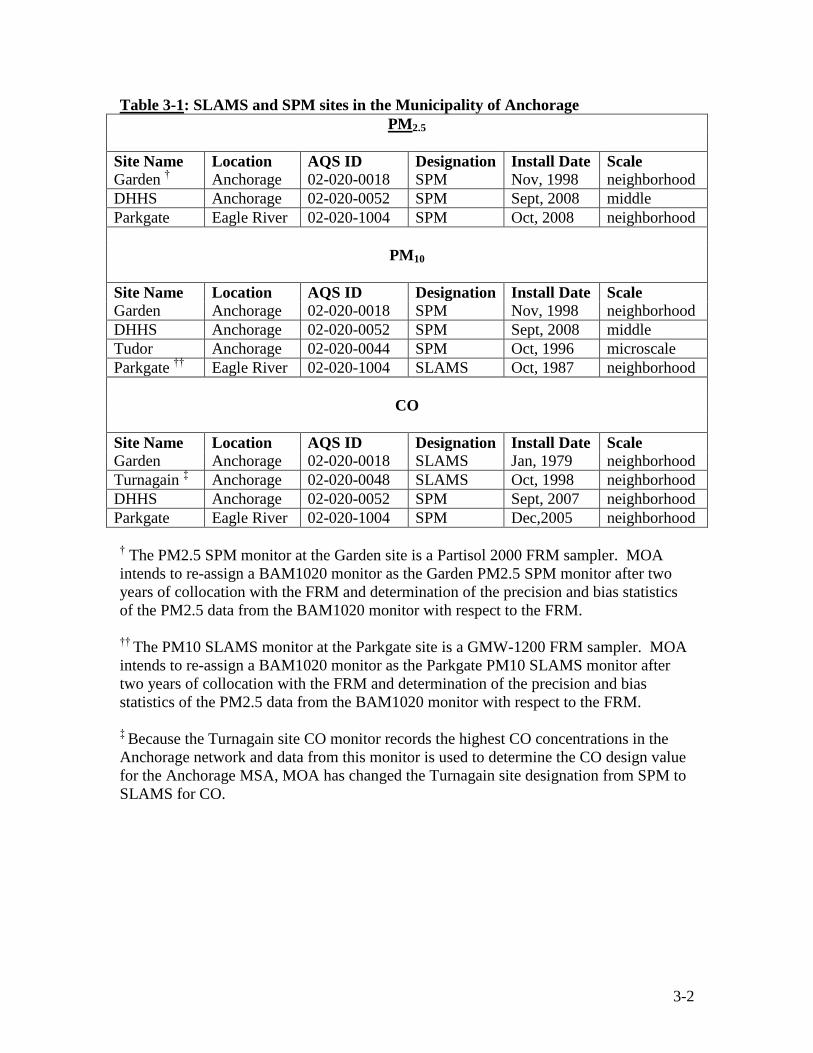
Table 3-1: SLAMS and SPM sites in the Municipality of Anchorage
PM2.5
Site Name Location AQS ID Designation Install Date Scale
Garden † Anchorage 02-020-0018 SPM Nov, 1998 neighborhood
DHHS Anchorage 02-020-0052 SPM Sept, 2008 middle
Parkgate Eagle River 02-020-1004 SPM Oct, 2008 neighborhood
PM10
Site Name Location AQS ID Designation Install Date Scale
Garden Anchorage 02-020-0018 SPM Nov, 1998 neighborhood
DHHS Anchorage 02-020-0052 SPM Sept, 2008 middle
Tudor Anchorage 02-020-0044 SPM Oct, 1996 microscale
Parkgate ††
Eagle River 02-020-1004 SLAMS Oct, 1987 neighborhood
CO
Site Name Location AQS ID Designation Install Date Scale
Garden Anchorage 02-020-0018 SLAMS Jan, 1979 neighborhood
Turnagain ‡ Anchorage 02-020-0048 SLAMS Oct, 1998 neighborhood
DHHS Anchorage 02-020-0052 SPM Sept, 2007 neighborhood
Parkgate Eagle River 02-020-1004 SPM Dec,2005 neighborhood
† The PM2.5 SPM monitor at the Garden site is a Partisol 2000 FRM sampler. MOA
intends to re-assign a BAM1020 monitor as the Garden PM2.5 SPM monitor after two
years of collocation with the FRM and determination of the precision and bias statistics
of the PM2.5 data from the BAM1020 monitor with respect to the FRM.
††
The PM10 SLAMS monitor at the Parkgate site is a GMW-1200 FRM sampler. MOA
intends to re-assign a BAM1020 monitor as the Parkgate PM10 SLAMS monitor after
two years of collocation with the FRM and determination of the precision and bias
statistics of the PM2.5 data from the BAM1020 monitor with respect to the FRM.
‡
Because the Turnagain site CO monitor records the highest CO concentrations in the
Anchorage network and data from this monitor is used to determine the CO design value
for the Anchorage MSA, MOA has changed the Turnagain site designation from SPM to
SLAMS for CO.
3-3
Figure 3.1:1: Map of Anchorage area. Red dots indicate monitoring sites.
Parkgate
Turnagain Garden
Tudor
DHHS
3-4
3.2 GARDEN SITE - ANCHORAGE
3000 East 16th Avenue AQS ID 02-020-0018
Parameters: CO, PM2.5, PM10 Established: January 1, 1979
3.2.1 Site Information
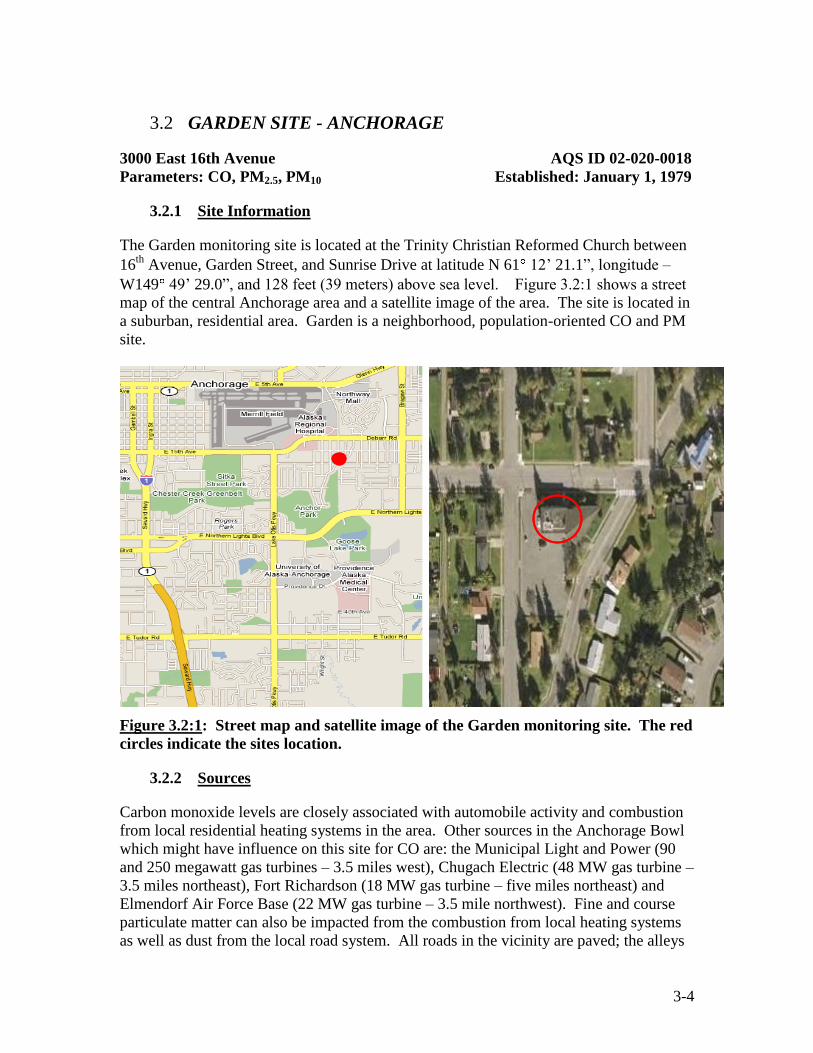
The Garden monitoring site is located at the Trinity Christian Reformed Church between
16th
Avenue, Garden Street, and Sunrise Drive at latitude N 61 12’ 21.1”, longitude –
W149 49’ 29.0”, and 128 feet (39 meters) above sea level. Figure 3.2:1 shows a street
map of the central Anchorage area and a satellite image of the area. The site is located in
a suburban, residential area. Garden is a neighborhood, population-oriented CO and PM
site.
Figure 3.2:1: Street map and satellite image of the Garden monitoring site. The red
circles indicate the sites location.
3.2.2 Sources
Carbon monoxide levels are closely associated with automobile activity and combustion
from local residential heating systems in the area. Other sources in the Anchorage Bowl
which might have influence on this site for CO are: the Municipal Light and Power (90
and 250 megawatt gas turbines – 3.5 miles west), Chugach Electric (48 MW gas turbine –
3.5 miles northeast), Fort Richardson (18 MW gas turbine – five miles northeast) and
Elmendorf Air Force Base (22 MW gas turbine – 3.5 mile northwest). Fine and course
particulate matter can also be impacted from the combustion from local heating systems
as well as dust from the local road system. All roads in the vicinity are paved; the alleys
3-5
are mostly unpaved, and roadways are sanded for traction during the winter months.
Other contributing sources for coarse and fine particulate matter are: the Merrill Field
airport (one mile north) and the Alaska Railroad (two miles northwest). Anchorage is
seasonally affected by wind-blown glacial loess, and occasionally impacted by wildfire
smoke and ash from volcanic eruptions.
3.2.3 Monitors
The Garden Site is currently equipped with:
PM2.5 (SPM) – Three Thermo Electron (formerly Rupprecht and Patashnick) Partisol
2000 samplers were operated at the site until October 2008. Two samplers ran on a
1-in-6 day alternating sampling schedule resulting in a 1-in-3 day sampling
frequency. The third sampler operated as a collocated monitor. Two samplers were
removed in October 2008. The one remaining sampler operates on a 1-in-6 day
sampling schedule.
PM10 (SPM) – One General Metal Works high-volume sampler.
PM2.5 (SPM) – A single Thermo Electron TEOM 1400a continuous monitor was
installed by ADEC in 2003 to provide real-time PM2.5 data for evaluating the Air
Quality Index. MOA operated the TEOM from 2004 -2008 and removed it in 2009.
PM2.5, PM10, PM Coarse (SPM) – Two Met One BAM 1020X continuous monitors
were installed in June 2008, and were tested for measurement of PM2.5, PM10 and PM
Coarse, and for proper integration within a DR DAS internet-based network. MOA
has begun submitting PM2.5 and PM10 data from these monitors to AQS, starting with
first quarter 2009.
CO (SLAMS) – A single Thermo Electron 48i CO monitor operates seasonally
(October – March), but will operate continuously throughout 2009 to collect data in
support of EPA’s Community Scale Air Toxics Program.
PAH (SPM) – Two Tisch Environmental, TE-1000PUF high-volume, Poly Urethane
Foam (PUF) samplers. The primary and collocate samplers were installed in October
2008. Starting in November 2008, MOA began 1-in-6 day operation of these
samplers for a planned one year measurement of Polycyclic Aromatic Hydrocarbons
(PAHs) in support of EPA’s Community Scale Air Toxics Program.
3.2.4 Siting
The particulate matter samplers are located on the roof at the south end of the Trinity
Christian Reformed Church. Access to the site is from use of a window from a split level
section of the church. This split level area is several meters from the monitoring site.
The roof height is six meters (19 feet), and there are no trees in the vicinity that
significantly exceed the height of the samplers. The airflow to these samplers is
unobstructed. The samplers are approximately 14 meters (32 feet) south of the nearest
traffic lane of 16th
Avenue.
The CO monitor is installed in the church. The inlet probe is approximately three meters
(9.5 feet) above the ground. The inlet probe is approximately 10 meters (32 feet) from

3-6
the nearest traffic lane of 16th
Avenue. Between the inlet and 16th
Avenue is one tall
spruce tree. The church itself obstructs air flow from the south.
3.2.5 Traffic
There are six other major roadways within two miles with approximate average daily
traffic ranging from 14,000 to 54,000 vehicles per day. All roads are paved; alleys are
usually dirt roads.
3-7
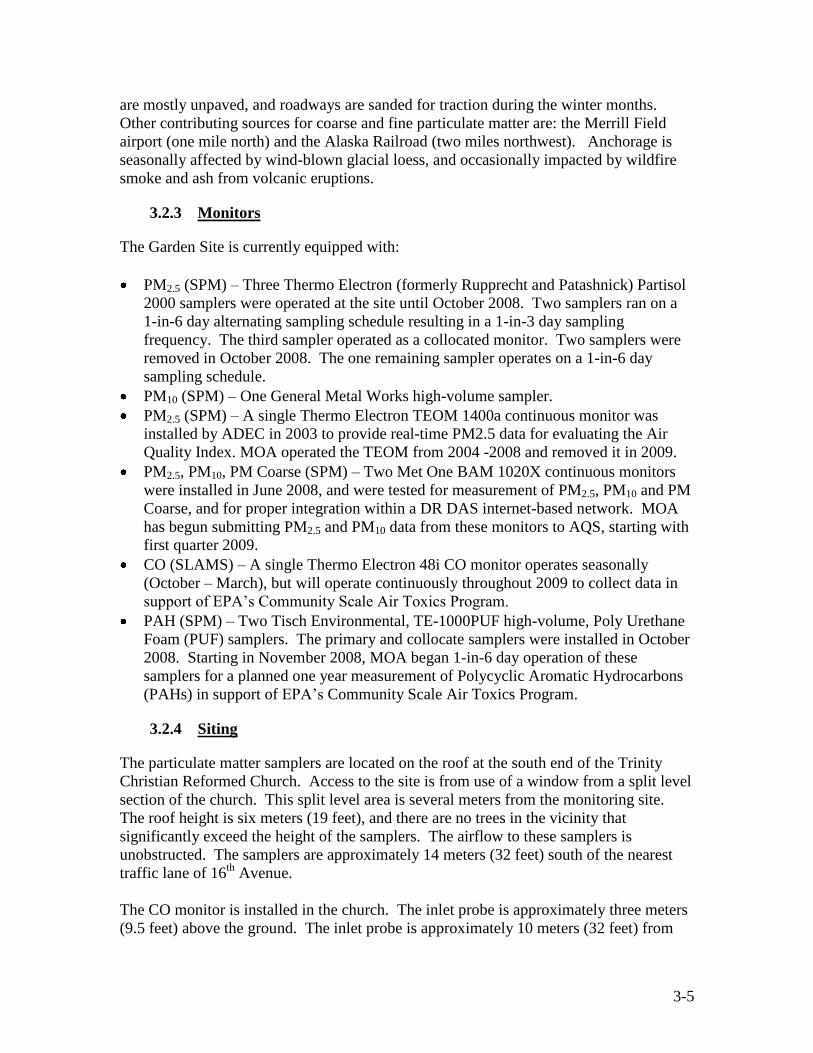
Figure 3.2:2: Pictures of the Garden Site
North East South West
Views in four directions from the Garden Site
Views in four directions towards the Garden Site
3-8
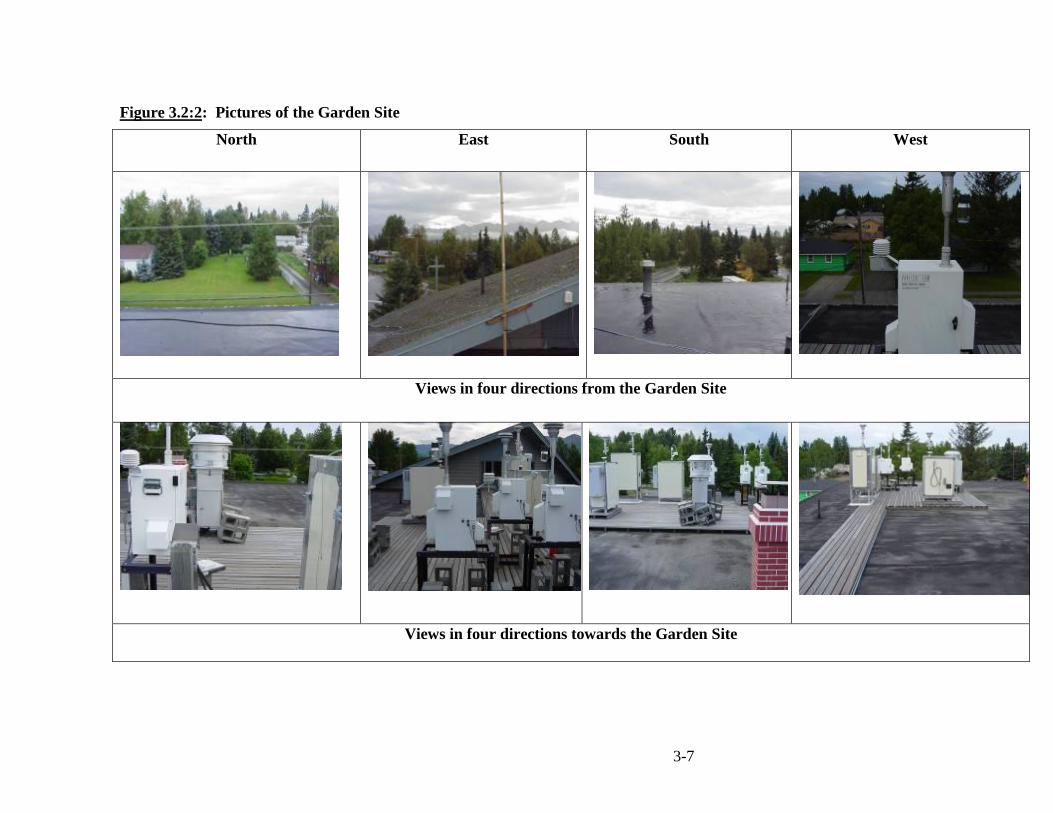
Figure 3.2:3: View of CO probe at Garden Site. The red circle indicates where the probe is
located.
3-9
3.3 TUDOR SITE - ANCHORAGE
3335 East Tudor Road AQS ID 02-020-0044
Parameters: PM10 Established: October 12, 1996
3.3.1 Site Information
The Tudor monitoring site is located at the Allstate Insurance Company building on
Tudor Road at latitude N 61 10’ 51.9”, longitude W 149 49’ 02.8”, and 164 feet (50
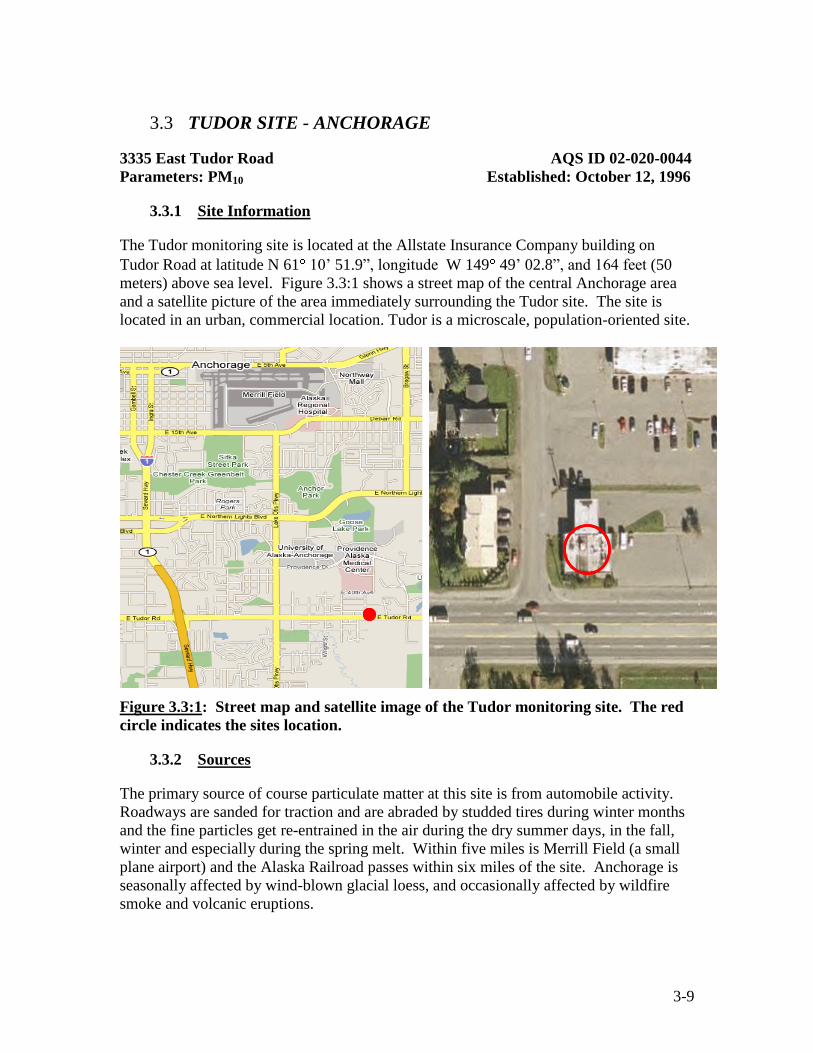
meters) above sea level. Figure 3.3:1 shows a street map of the central Anchorage area
and a satellite picture of the area immediately surrounding the Tudor site. The site is
located in an urban, commercial location. Tudor is a microscale, population-oriented site.
Figure 3.3:1: Street map and satellite image of the Tudor monitoring site. The red
circle indicates the sites location.
3.3.2 Sources
The primary source of course particulate matter at this site is from automobile activity.
Roadways are sanded for traction and are abraded by studded tires during winter months
and the fine particles get re-entrained in the air during the dry summer days, in the fall,
winter and especially during the spring melt. Within five miles is Merrill Field (a small
plane airport) and the Alaska Railroad passes within six miles of the site. Anchorage is
seasonally affected by wind-blown glacial loess, and occasionally affected by wildfire
smoke and volcanic eruptions.
3-10
3.3.3 Monitors
The Tudor Site is currently equipped with:
PM10 (SPM) – Three General Metal Works high-volume samplers. The Hi-Vol
samplers are operated on a 1-in-3 day sampling schedule. Alternating samples are
run in collocation at this site every fifteen days for precision determination.
PM10 (SPM) – A single Thermo Electron TEOM 1400a continuous monitor was
installed in April 2005 to provide information in real time for evaluating the Air
Quality Index.
PM2.5 (SPM) – samplers were removed from the site end of December 2002.
3.3.4 Siting
The particulate matter samplers are located on the roof near the southeast edge. The roof
height is 3.3 meters (10.5 feet), and there are no other structures. Twenty foot tall
mountain ash trees between the samplers and the roadway do not significantly exceed the
height of the samplers. The airflow to these samplers is unobstructed. The samplers are
approximately seven meters north of the nearest traffic lane of Tudor Road.
3.3.5 Traffic
There are three major roadways within two miles with approximate average daily traffic
ranging from 30,000 to 54,300 vehicles per day. There are typical residential and
commercial streets and alleys in the vicinity. All roads are paved; alleys are usually dirt
roads.
3-11
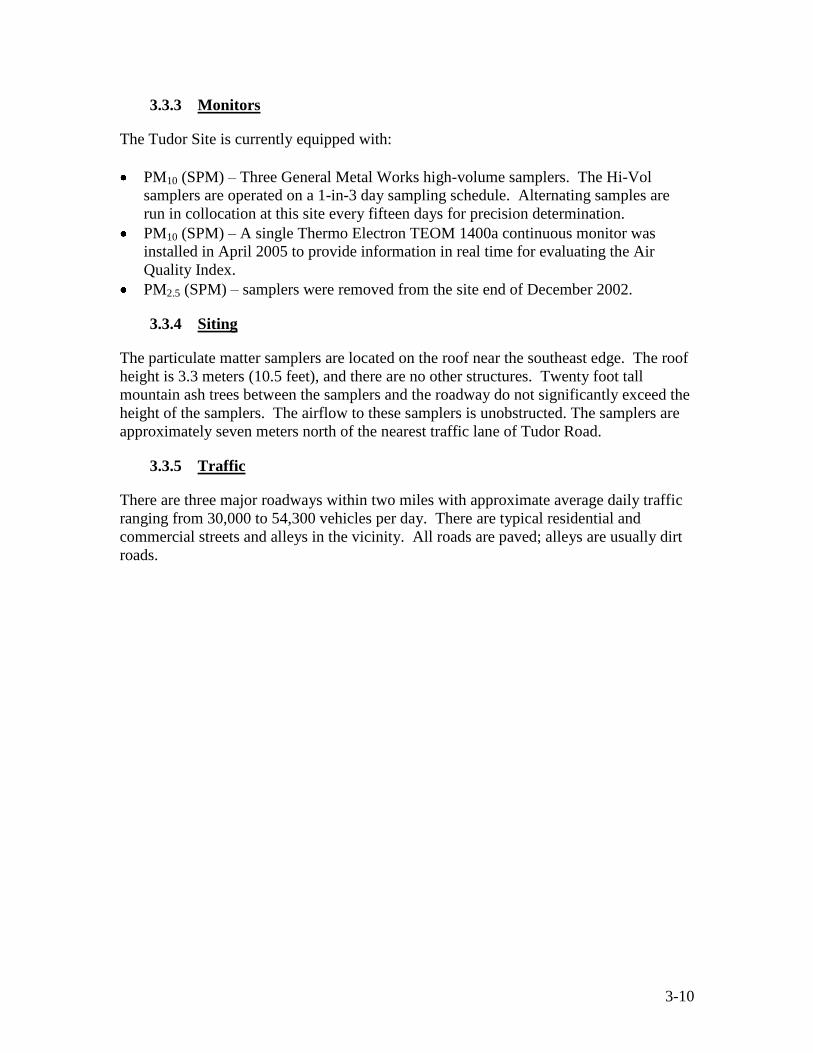
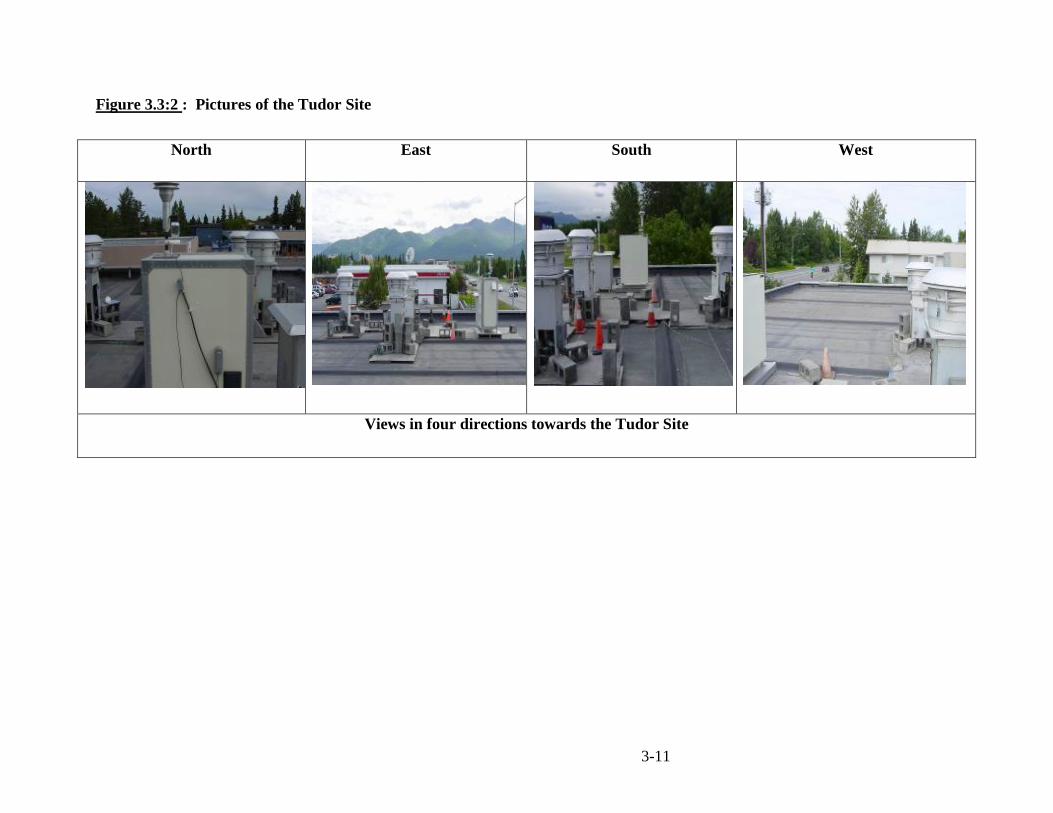
Figure 3.3:2 : Pictures of the Tudor Site
North East South West
Views in four directions towards the Tudor Site
3-12
3.4 TURNAGAIN SITE - ANCHORAGE
3201 Turnagain Street AQS ID 02-020-0048
Parameters: CO Established: October 15, 1998
3.4.1 Site Information
The Turnagain carbon monoxide monitoring site is located at the corner of Turnagain
Street and 32nd
Avenue at latitude N 61 11’ 29.4”, longitude W 149 56’ 06.9”, and 69
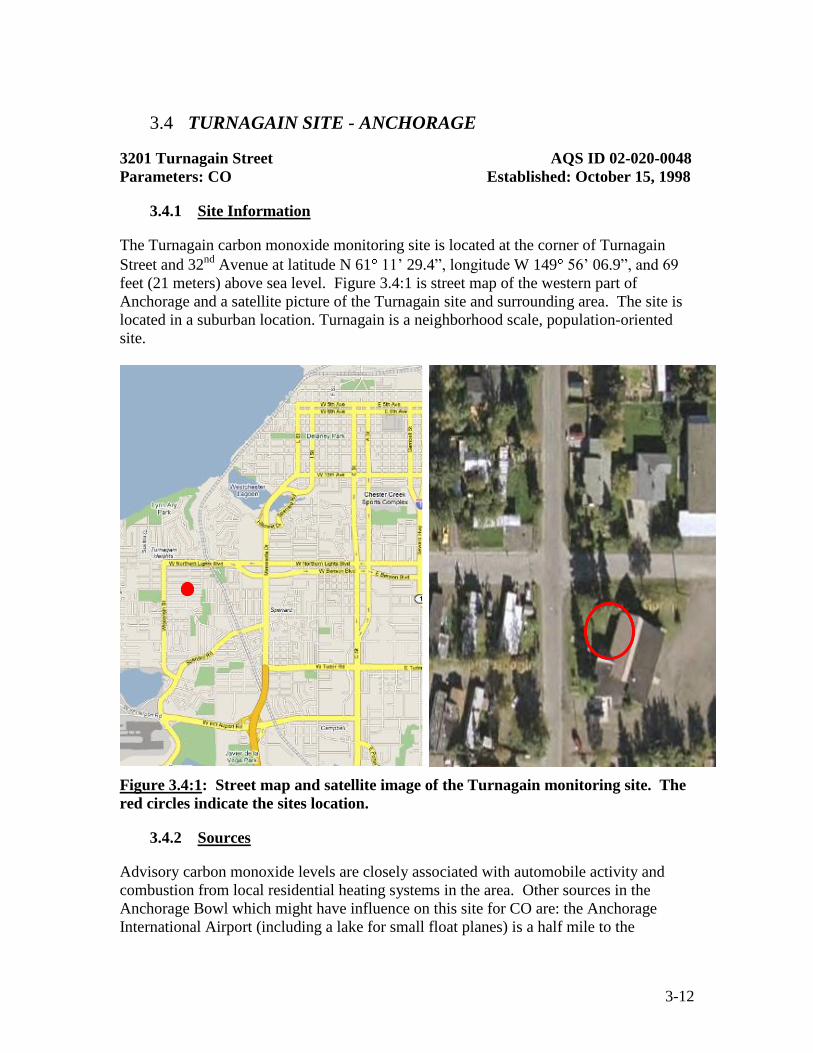
feet (21 meters) above sea level. Figure 3.4:1 is street map of the western part of
Anchorage and a satellite picture of the Turnagain site and surrounding area. The site is
located in a suburban location. Turnagain is a neighborhood scale, population-oriented
site.
Figure 3.4:1: Street map and satellite image of the Turnagain monitoring site. The
red circles indicate the sites location.
3.4.2 Sources
Advisory carbon monoxide levels are closely associated with automobile activity and
combustion from local residential heating systems in the area. Other sources in the
Anchorage Bowl which might have influence on this site for CO are: the Anchorage
International Airport (including a lake for small float planes) is a half mile to the

3-13
southwest, Municipal Light and Power (90 and 250 megawatt gas turbines), Chugach
Electric (48 MW gas turbine), and Elmendorf Air Force Base (22 MW gas turbine).
3.4.3 Monitors
The Turnagain Site is currently equipped with:
CO (SLAMS) – A single Thermo Electron 48C CO monitor operates seasonally
(October – March).
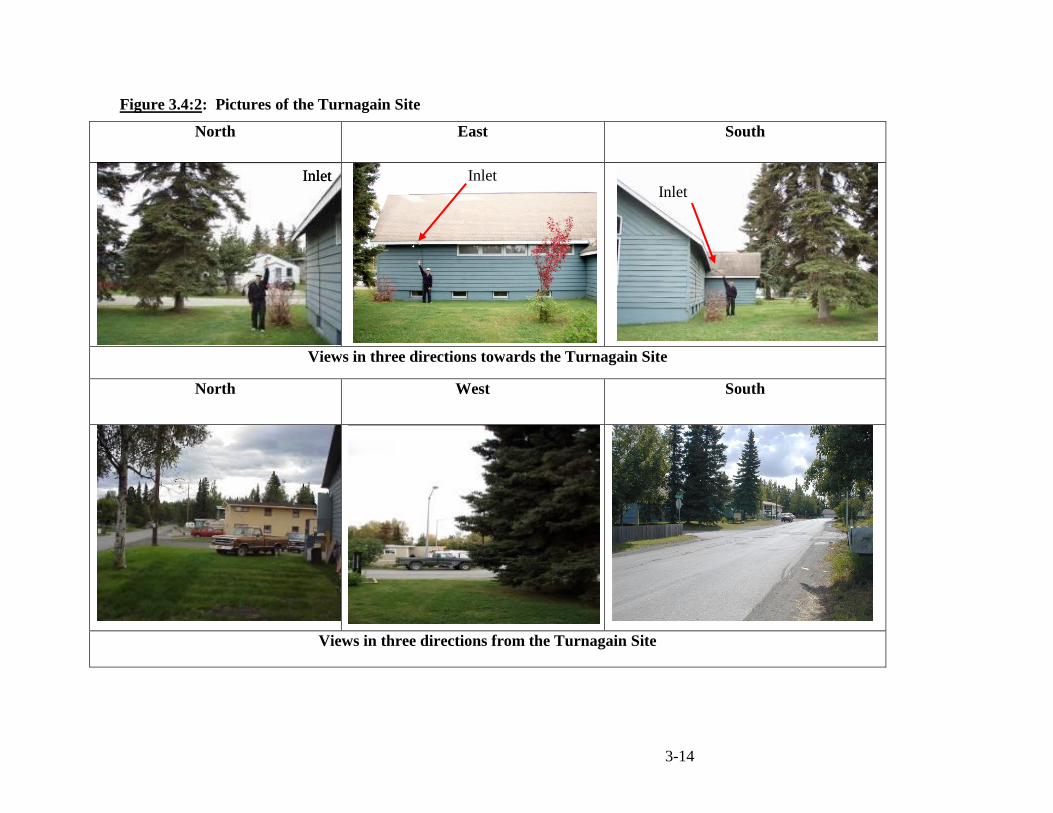
3.4.4 Siting
The monitor is installed in the Unitarian church. The inlet probe is approximately three
meters (9.5 feet) above the ground. The inlet probe is approximately 18.5 meters (58
feet) from the nearest traffic lane of Turnagain Street. Between the inlet and Turnagain
Street are several tall white spruce trees. The church itself obstructs air flow from the
south and east.
3.4.5 Traffic
There are five major roadways within 2 miles with approximate average daily traffic
ranging from 18,000 to 54,000 vehicles per day. There are residential streets and alleys in
the vicinity.
3-14
Figure 3.4:2: Pictures of the Turnagain Site
North East South
Views in three directions towards the Turnagain Site
North West South
Views in three directions from the Turnagain Site
Inlet
Probe Inlet
Probe Inlet
Probe
Inlet
Probe
3-15
3.5 DHHS - ANCHORAGE
727 L Street. AQS ID 02-020-0052
Parameters: CO Established: September 27, 2007
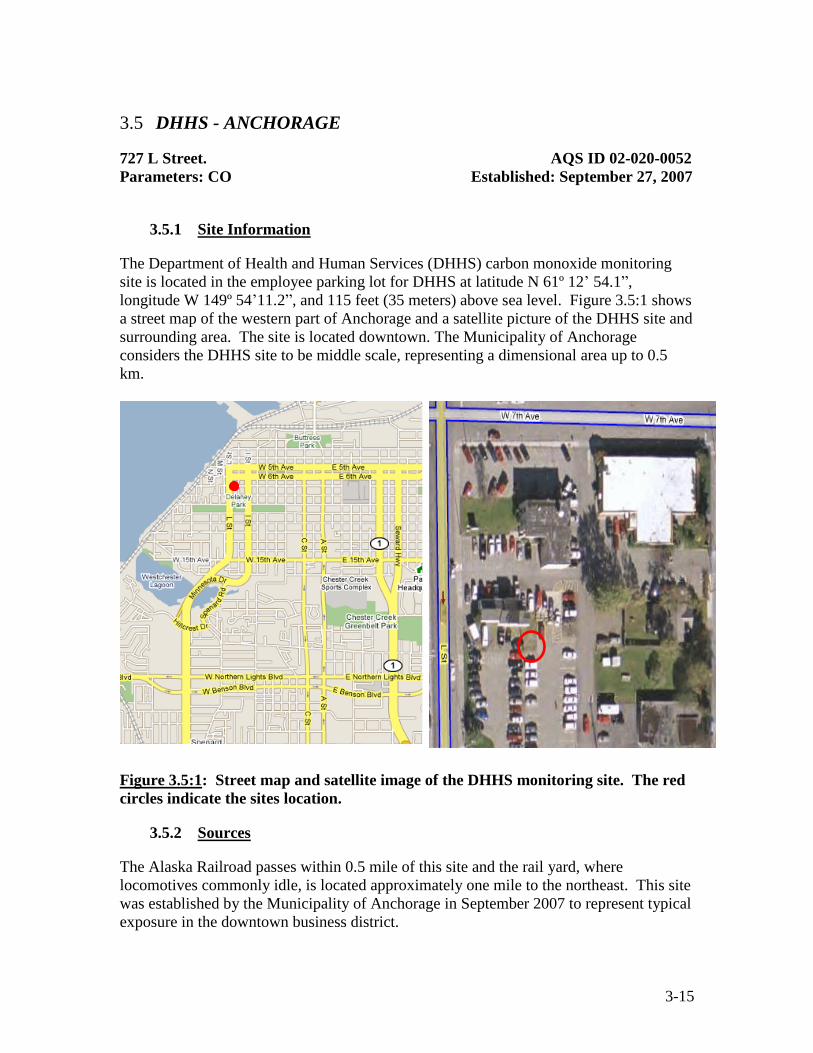
3.5.1 Site Information
The Department of Health and Human Services (DHHS) carbon monoxide monitoring
site is located in the employee parking lot for DHHS at latitude N 61º 12’ 54.1”,
longitude W 149º 54’11.2”, and 115 feet (35 meters) above sea level. Figure 3.5:1 shows
a street map of the western part of Anchorage and a satellite picture of the DHHS site and
surrounding area. The site is located downtown. The Municipality of Anchorage
considers the DHHS site to be middle scale, representing a dimensional area up to 0.5
km.
Figure 3.5:1: Street map and satellite image of the DHHS monitoring site. The red
circles indicate the sites location.
3.5.2 Sources
The Alaska Railroad passes within 0.5 mile of this site and the rail yard, where
locomotives commonly idle, is located approximately one mile to the northeast. This site
was established by the Municipality of Anchorage in September 2007 to represent typical
exposure in the downtown business district.
3-16
3.5.3 Monitors
The DHHS Site is equipped with:
CO (SPM) – A single Thermo Electron 48C CO monitor which operated seasonally
(October – March).
PM 2.5, PM10, PM Coarse (SPM) – Two Met One BAM 1020X continuous monitors
were installed in September 2008 and were integrated into the DR DAS network.
MOA commenced AQS reporting of PM10 and PM2.5 from these monitors starting
January 1, 2009.
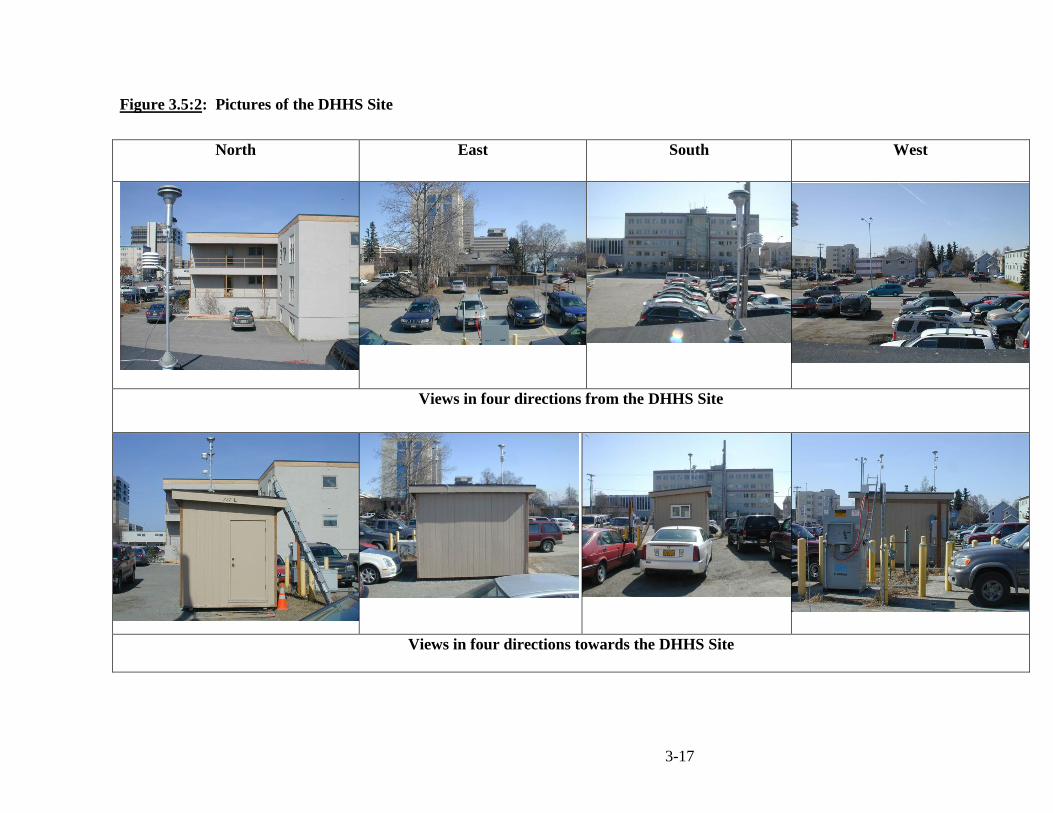
3.5.4 Siting
The monitors are installed in a small shed building located at 727 L Street.. The CO inlet
probe is approximately three meters (9.5 feet) above the ground. The inlet probe is
approximately 28 meters (85 feet) from L Street, the nearest traffic lane. The probe
extends off the northwest corner of the shed, and air flow to the probe is unobstructed for
270 degrees. The PM10 and PM2.5 inlets each extend one meter above the shed roof with
two meters of separation between them. This site has sufficient separation distance from
surrounding buildings to meet EPA siting criteria.
3.5.5 Traffic
There are four major roadways within one mile with average daily traffic counts ranging
from 11,830 to 15,120 vehicles per day.
3-17
Figure 3.5:2: Pictures of the DHHS Site
North East South West
Views in four directions from the DHHS Site
Views in four directions towards the DHHS Site
3-18
3.6 PARKGATE, EAGLE RIVER- ANCHORAGE
11723 Old Glenn Highway AQS ID 02-020-1004
Parameters: PM10 Established: January 1, 1974
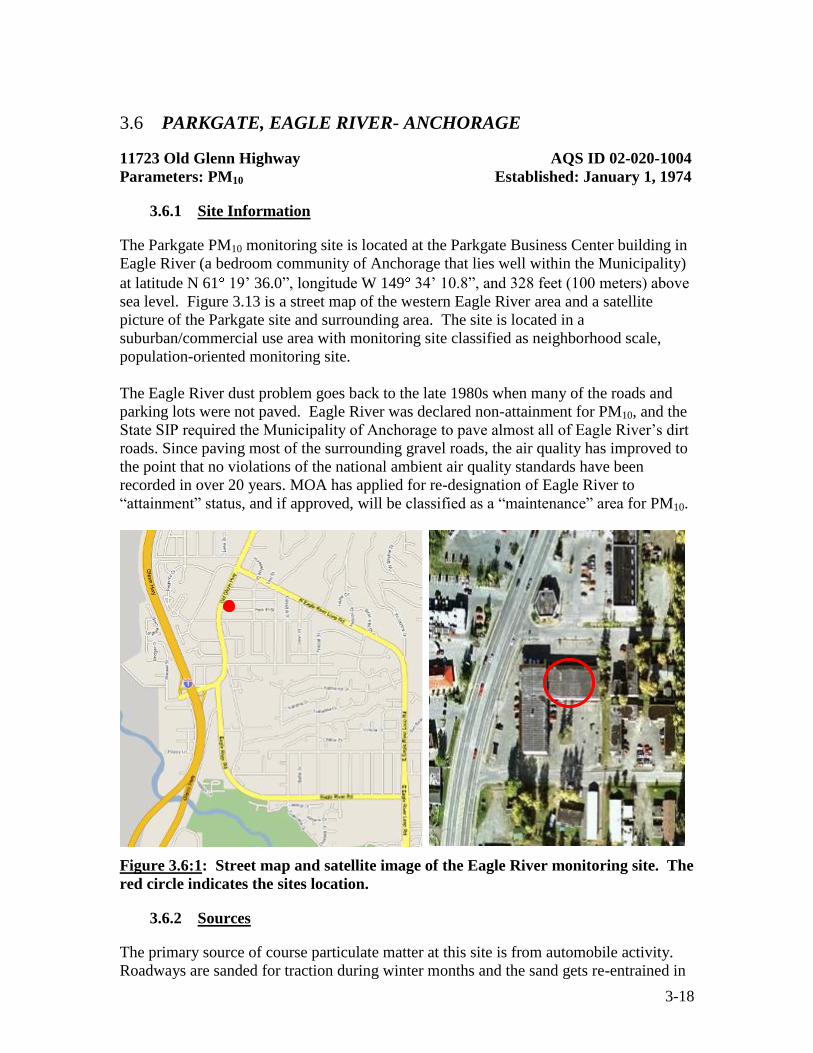
3.6.1 Site Information
The Parkgate PM10 monitoring site is located at the Parkgate Business Center building in
Eagle River (a bedroom community of Anchorage that lies well within the Municipality)
at latitude N 61 19’ 36.0”, longitude W 149 34’ 10.8”, and 328 feet (100 meters) above
sea level. Figure 3.13 is a street map of the western Eagle River area and a satellite
picture of the Parkgate site and surrounding area. The site is located in a
suburban/commercial use area with monitoring site classified as neighborhood scale,
population-oriented monitoring site.
The Eagle River dust problem goes back to the late 1980s when many of the roads and
parking lots were not paved. Eagle River was declared non-attainment for PM10, and the
State SIP required the Municipality of Anchorage to pave almost all of Eagle River’s dirt
roads. Since paving most of the surrounding gravel roads, the air quality has improved to
the point that no violations of the national ambient air quality standards have been
recorded in over 20 years. MOA has applied for re-designation of Eagle River to
“attainment” status, and if approved, will be classified as a “maintenance” area for PM10.
Figure 3.6:1: Street map and satellite image of the Eagle River monitoring site. The
red circle indicates the sites location.
3.6.2 Sources
The primary source of course particulate matter at this site is from automobile activity.
Roadways are sanded for traction during winter months and the sand gets re-entrained in
3-19
the air during dry summer days. The Alaska Railroad passes within 3 miles of the site.
Eagle River is seasonally affected by wind-blown glacial loess, and occasionally affected
by wildfire smoke and volcanic eruptions.
3.6.3 Monitors
The Eagle River Site is currently equipped with:
PM10 (SLAMS) – One General Metal Works high-volume sampler. The Hi-Vol
sampler is operated on a 1-in-6 day sampling schedule.
CO (SPM) – A single Thermo Electron 48C CO monitor operates seasonally (October
– March).
PM2.5, PM10, PM Coarse (SPM) – Two Met One BAM 1020X continuous monitors
were installed in October 2008 and were integrated into the DR DAS network. MOA
commenced AQS reporting of PM10 and PM2.5 from these monitors starting January
1, 2009.
3.6.4 Siting
The particulate matter samplers are located on the roof of the first story of the Parkgate
Business Center. The roof height is 5 meters (16 feet). There is another section of the
building 13 meters (41 feet) to the west that is two stories tall (4 meters above the first
story roof height). No trees in the vicinity significantly exceed the height of the
samplers. The airflow to these samplers is unobstructed. The samplers are approximately
44 meters east of the nearest traffic lane of the Old Glenn Highway and 23 meters (73
feet) south of Easy Street.
The CO inlet probe is approximately three meters (9.5 feet) above the ground and is
attached to the east side of the building. The CO probe inlet is approximately 42 meters
east of the nearest traffic lane of the Old Glenn Highway and 23 meters (73 feet) south of
Easy Street. Airflow to the probe inlet is unobstructed from the north, south, and east.
The Parkgate building itself obstructs air flow to the CO probe inlet from the west.
3.6.5 Traffic
There are two major roadways within 2 miles ranging from 15,500 to 29,000 vehicles per
day. There are typical residential and commercial streets and alleys in the vicinity. All
roads are paved and alleys are unpaved.
3-20
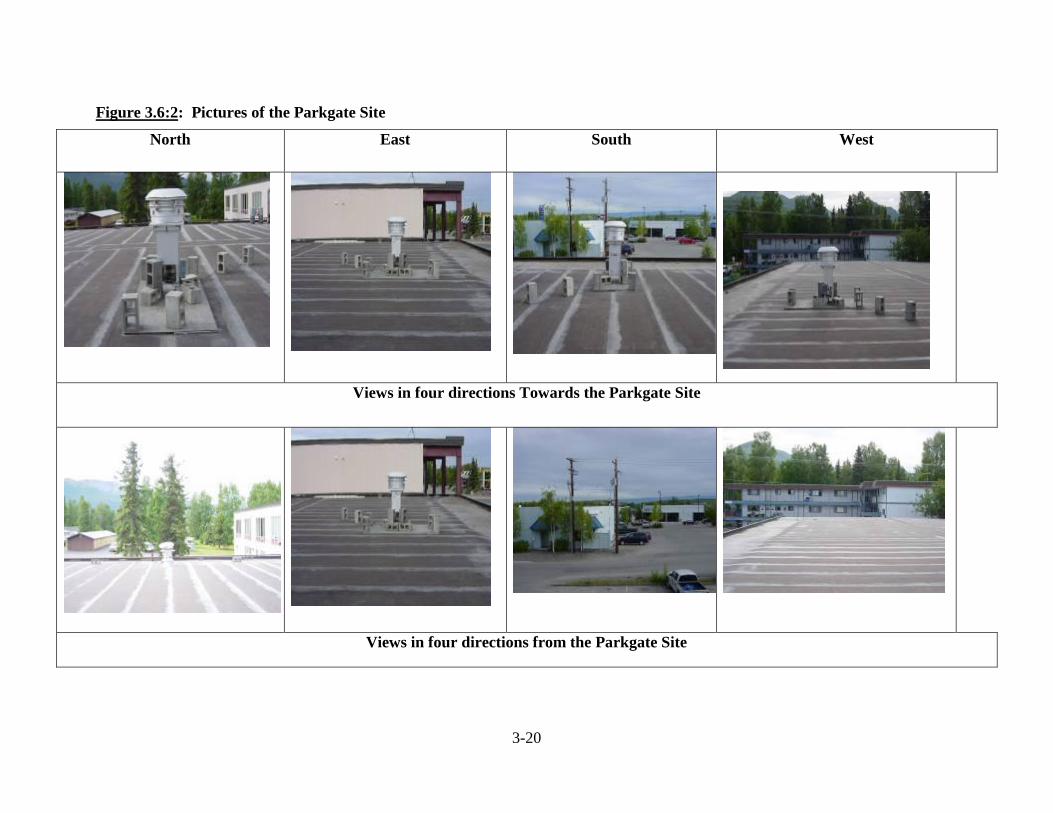
Figure 3.6:2: Pictures of the Parkgate Site
North East South West
Views in four directions Towards the Parkgate Site
Views in four directions from the Parkgate Site