Embed Size (px)
Citation preview

1

2
PublisherMinistry of Environment of Albania
PrepressErmira FIDAOdeta ZhekuMelita Leka
DesignPetrit PemaGr.Pe&Pe
Front cover pageAdmir BanajADIZAJN
Printed by:Publishing and printing house “FLESH”Tirana, Albania

3
Republic of Albania
Ministry of Environment
The First National Communication of the Republic of Albania to the United NationsFramework Convention on Climate Change (UNFCCC)
Co-ordinated by:
Ermira Fida, National Project ManagerTatjana Hema, National Project Director
Lead authors:
Besim Islami,Mirela Kamberi,
Eglantina Demiraj,Ermira Fida,
Contributing Authors:
Spiro Karadumi, Edmond Panariti, Pranvera Bekteshi, Emil Gjika, Gazmend Gjyli,Pellumb Berberi, Tatjana Mulaj, Vangjel Mustaqi, Liri Mucaj, Mirela Bicja, Agim Shehi,
Sabri Laci, Alfred Mullai, Gani Deliu,Tatjana Dishnica, Irfan Tarelli.
Review Editors
Lirim Selfo, Narin Panariti, Drita Dade,Katarina Mareckova, MilosTichy, Juan Zuak, Jan Van Drunen.

4

5
Foreword
Acknowledging the significance of the climate change problem and the necessity to take effectivesteps for its mitigation, the Government of Albania joined the UNFCCC on January 1995. Threeyears after the ratification of the Convention, Albania was provided with financial assistance fromGlobal Environment Facility for the preparation of the First National Communication.
I have the pleasure to present to you the First National Communication of Albania, as aresponse to the commitments of Albania to the UNFCCC.
The First National Communication of Albania is the first assessment of the Albania’s presentsituation with regard to climate change. At the same time, it serves as the basis for future action,research, improvement, offering opportunities for policy refinement and development.
This document goes beyond the reporting commitments of a non-Annex I Party, under the exist-ing guidelines for the preparation of National Communications from non-Annex I Parties, as Alba-nia is, to the UNFCCC. Albania, for the first time has developed the National Action Plan, whichaddresses the climate change issues as a part of the updated Environmental Action Plan, despite of itslow level of contribution in greenhouse gas emissions.
Despite to the problems and constrains of development which have affected this exercise, a consid-erable experience has been gained, a national capacity has been built and many lessons have beenlearnt. It has become a useful tool and basis for the sustainability of the preparation process of futureNational Communications.
Finally, on behalf of the Government of Albania, I avail myself of this opportunity to expressmy highest appreciation to the Global Environment Facility, to UNDP as its implementing agencyand Secretariat of the UNFCCC for their support to enable Albania to prepare its First NationalCommunication to the UNFCCC.
Prof. Lufter Xhuveli, PhD
Minister of Environment
July 2002.

6
The First National Communication of Albania represents the input of a large number of stake-holders, involved during a three and a half years period, over which it was prepared.
The participation of numerous stakeholders from various economic sectors, ministries, nongovernmental agencies, community based organizations and funding agencies, was critical tothe success of the process.The First National Communication of Albania succeeded due tothe financial contribution of the Global Environment Facility (GEF), political, technical andfinancial support provided by the Ministry of Environment of Albania, on behalf of the Govern-ment of Albania, support provided by UNDP country office on the project implementation pro-cess, technical support provided by the National Communications Support Program (NCSP)and UNFCCC Secretariat, particularly the Implementation Program, non-Annex I Sub-pro-gram.
Special thanks must be made to the national experts who led the key teams, namely:Besim Islami, PhD - Team leader of greenhouse gas inventoryMirela Kamberi, MSc - Team leader of abatement analysisProf. Assoc.Eglantina Demiraj, PhD - Team leader of vulnerability assessment and adaptation
They were amply supported by the other members of the technical teams, namely: Prof. SpiroKaradumi, PhD - land use change and forestry expert; Prof. Edmond Panariti, PhD - livestockexpert; Pranvera Bekteshi, PhD - solvents expert; Emil Gjika, PhD - industrial processes expert;Prof.Gazmend Gjyli, PhD - waste expert; Prof. Pellumb Berberi, PhD - uncertainty assessmentexpert; Prof. Assoc.Tatjana Mulaj, PhD - uncertainty assessment expert; Prof. Assoc. VangjelMustaqi, PhD - climatologist; Prof. Assoc. Liri Mucaj, PhD - climatologist; Mirela Bicja, PhD -hydrologist; Agim Shehi, PhD - health expert; Prof. Assoc. Sabri Laci, PhD - tourism and popu-lation expert; Prof. Alfred Mullai, PhD - biologist; Gani Deliu - expert for National Climate ChangeAction Plan; Prof. Assoc.Tatjana Dishnica, PhD - agriculture expert; Irfan Tarelli, PhD - agricul-ture expert; Vojo Spahiu, MSc - IT expert; Gerdi Leka - IT expert; Rezar Shehu, MSc - IT expert;Prof. Lirim Selfo, PhD - head of reviewing panel; Narin Panariti, PhD - reviewer; Drita Dade -reviewer; Katarina Mareckova - international reviewer, Slovak Republic; MilosTichy - interna-tional reviewer, Check Republic; Juan Zuak - international reviewer, Denmark; Jan Van Drunen- international reviewer, The Netherlands.
The role of the National Project Director in providing the governmental support to the project isworthy of special mentioning. Many thanks for their support to Maksim Deliana, PhD who wasthe National Project Director for the period 1998-2000 and to the Deputy Minister of Environ-ment Tatjana Hema, PhD, the National Project Director from 2000-2002 and also the UNFCCCFocal Point. Furthermore, many thanks go to the Project Steering Committee members namely:Prof. Perparim Fuga, PhD; Marjeta Mima; Margarita Caci; Gjergj Simaku, PhD; PetraqKrastafillaku, PhD; Silvana Binaj, PhD; Prof. Mithat Sanxhaku, PhD; Prof. Assoc. Marita Nake,PhD; Prof. Efigjeni Kongjika, PhD; Prof. Assoc. Vasil Marku, PhD; Prof. Arqile Berxoli, PhD.
Special credits must be given to the support provided by the Ministry of Environment of Albania,especially to Ministers namely, Prof. Ethem Ruka, PhD and Prof. Lufter Xhuveli, PhD and theheads of their cabinets, respectively to Prof. Assoc. Vaso Qano, PhD; and to Sajmir Hoxha, MSc.
Many credits to the contribution of the UNDP country office, especially to H.E. Anna Stjarnerklint,the UN Resident Coordinator and UNDP Resident Representative; H.E. Parviz Fartash, DeputyResident Representative; Vladimir Malkaj - program adviser; Irena Dule - programe specialist;
Acknowledgements

7
Etleva Vertopi - programe specialist; Guido Santini - environmental specialist; Merita Jorgo -head of project support unit; Arben Caslli, MBA - administrative specialist; Paul Brewah - opera-tions manager; Ermira Basha - operations analyst; Ilda Frangu - finance specialist and ErmiraMasha - finance specialist.
The final thanks belong to the support staff of the project namely: Melita Leka - administrativeand finance officer and Odeta Zheku - project and information assistant.
Despite the wide range of inputs into the process, the responsibility for this final output rests withthe National Project Manager and any errors and omissions thereof is not to be attributed to theother participants in the process.
Ermira FIDA, MBA
National Project Manager

8

9
TABLE OF CONTENTS
EXECUTIVE SUMMARY1. NATIONAL CIRCUMSTANCES --- 14
1.1 Geographic profile --- 141.2 Climate profile --- 141.3 Natural resources --- 14
1.3.1 Water resources --- 141.3.2 Forests ---14
1.4 Economic profile --- 141.5 Agriculture --- 151.6 Livestock --- 151.7 Mining --- 151.8 Energy --- 151.9 Transport --- 161.10 Industry --- 161.11 Tourism --- 161.12 Population --- 161.13 Public health --- 161.14 Education --- 171.15 Environment --- 17
2.. NATIONAL GHG INVENTORY --- 172.1 National GHG emissions in 1994 ---17
3. GHG EMISSIONS BASELINE SCENARIO --- 194. GHG EMISSIONS ABATEMENT SCENARIO --- 195. VULNERABILITY ASSESSMENT --- 21
5.1 Climate change scenarios --- 215.2 Water resources --- 225.3 Agriculture --- 225.4 Forests --- 225.5 Energy --- 225.6 Public health --- 235.7 Population --- 235.8 Tourism --- 24
6. ADAPTATION OPTIONS AND RECOMMENDATIONS --- 246.1 Water resources --- 246.2 Natural ecosystems --- 246.3 Agriculture --- 246.4 Forestry --- 246.5 Energy --- 256.6 Public health --- 256.7 Population, tourism --- 25
7. NATIONAL CLIMATE CHANGE ACTION PLAN --- 267.1 Abatement policies and measures --- 277.2 Adaptation policies and measures --- 27
8. PUBLIC AWARENESS, EDUCATION AND TRAINING ON CLIMATE CHANGE --- 278.1 Public awareness on climate changes --- 278.2 Education on climate change --- 288.3 Training and capacity building --- 28
9. PROBLEMS, CONSTRAINTS AND NEEDS --- 289.1 Institutional problems and constraints --- 299.2 Technical problems and constraints --- 29

10
9.3 Methodological problems and constraints --- 299.4 Availability of resources --- 29
CHAPTER INATIONAL CIRCUMSTANCES1. GEOGRAFIC PROFILE --- 332..CLIMATE PROFILE --- 33
2.1 Temperature --- 332.2 Precipitation --- 34
3. NATURAL RESOURCES --- 353.1 Water Resources --- 35
3.1.1 Surface water --- 353.1.2 Ground water --- 353.1.3 Marine water --- 35
3.2 Forestry and land use change --- 364. ECONOMIC PROFILE AND SECTORS --- 37
4.1 Agriculture --- 384.1.1 Livestock --- 39
4.2 Mining --- 404.3 Energy --- 40
4.3.1 Energy consumption --- 404.3.2 Energy supply --- 41
4.4 Transport --- 434.4.1 Road transport --- 434.4.2 Railway transport --- 444.4.3 Marine transport --- 444.4.4 Air transport --- 34
4.5 Industry --- 444.6 Tourism --- 454.7 Fisheries ---- 45
5. RESOURCES AND INFRASTRUCTURE --- 455.1 Population profile --- 455.2 Public health --- 465.3 Education --- 47
6. ENVIRONMENT --- 476.1 Environmental legislation --- 47
6.1.1 Major environmental laws of Albania --- 486.2 Institutional framework --- 486.3 Environmental situation --- 49
6.3.1 Waste --- 496.3.2 Water --- 4506.3.3 Air --- 506.3.4 Soil --- 506.3.5 Biodiversity --- 50
6.4 Public awareness --- 50
CHAPTER IINATIONAL GREENHOUSE GAS (GHG) INVENTORY1. METHODOLOGY --- 542. GHG EMISSIONS IN 1994 ---55
2.1 Direct GHG emissions --- 552.2 Indirect GHG emissions in 1994 --- 562.3 Main CO2 emissions indicators --- 56
3. GHG EMISSIONS FROM ECONOMIC SECTORS --- 573.1 Energy sector --- 573.2 Industrial processes --- 573.3 Agriculture --- 593.4 Land use change and forestry --- 603.5 Waste --- 603.6 Solvents --- 613.7 International bunkers --- 613.8 Total GHG emissions for Albania in 1994 --- 61
4. GHG EMISSIONS FROM ENERGY SECTOR FOR 1990-1994 --- 625. KEY SOURCES OF EMISSIONS --- 636. UNCERTAINTY ESTIMATION OF GHG INVENTORY IN 1994 --- 64
6.1 Data gaps --- 65

11
CHAPTER IIIGHG ABATEMENT ANALYSIS1. GHG EMISSIONS BASELINE SCENARIO --- 68
1.1 Methodology --- 681.2 General data and projections --- 681.3 Energy and transport sectors --- 69
1.3.1 CO2 non biogenic emissions --- 691.3.2 CH4 emissions --- 711.3.3 N2O emissions --- 711.3.4 CO2 biogenic emissions --- 721.3.5 Total emissions from energy and transport --- 74
1.4 Land use change and forestry sector --- 741.4.1CO2 emissions ---74
1.5 Agriculture sector --- 761.5.1 CH4 emissions --- 761.5.2 N2O emissions --- 76
1.6 Waste sector --- 771.6.1 CH4emissions --- 77
1.7 Industry sector --- 771.7.1 CO2 emissions --- 771.7.2 Other emissions --- 77
1.8 Solvents sector --- 781.8.1 NMVOC emissions --- 78
1.9 Aggregated emissions from all economic sectors --- 782. GHG EMISSIONS ABATEMENT SCENARIO --- 79
2.1 Methodology --- 792.2 Household sector --- 79
2.1.1 Thermal insulation of households --- 802.3 Service sector ---812.4 Industry sector --- 822.5 Transport sector --- 822.6 Energy transformation sector --- 832.7 Overall abatement potential for energy and transport sectors --- 832.8 Land use change and forestry secctor --- 88
2.8.1 Selected measures to reduce GHG emissions from forestry sector --- 882.8.2 GHG abatement scenario for land use change and forestry sector --- 88
2.9 Agriculture sector --- 892.10 Waste sector --- 89
2.10.1 GHG abatement options --- 892.10.1.1 Construction of new sanitary landfills --- 902.10.1.2 Construction of a new MSW incinerator with energy use -- -912.11 Industrial processes and solvents use -- -91
CHAPTER IVVULNERABILITY ASSESSMENT AND ADAPTION OPTIONS1. METHODOLOGY --- 942. EXPECTED CLIMATE CHANGE SCENARIO --- 943. THE EXPECTED IMPACTS OF CLIMATE CHANGES --- 95
3.1 Temperature --- 953.2 Precipitation --- 963.3 Water resources --- 973.4 Natural ecosystems --- 993.5 Managed ecosystems --- 100
3.5.1 Agriculture --- 1003.5.2 Forests --- 100
3.6 Energy --- 1013.6.1 Energy consumption --- 1013.6.2 Energy production --- 103
3.7 Public health --- 1043.8 Population --- 1053.9 Tourism --- 106
4. ADAPTATION OPTIONS AND RECOMMENDATIONS --- 1064.1 Water resources --- 1064.2 Natural ecosystems --- 1074.3 Managed ecosystems --- 108
4.3.1 Agriculture --- 1084.3.2 Forests --- 108

12
4.4 Energy --- 1094.5 Public health ---- 1104.6 Population, tourism --- 110
CHAPTER VCLIMATE CHANGE NATIONAL ACTION PLAN (CCNAP)1. SCOPE AND METHODOLOGY --- 1142. RELATED STRATEGIES AND MEASURES --- 1153. CLIMATE POLICY --- 116
3.1 Abatement policies and measures --- 1163.2 Adaptation policies and measures --- 119
CHAPTER VIPUBLIC AWARENESS, EDUCATION AND TRAINING ON CLIMATE CHANGE1. PUBLIC AWARENESS ON CLIMATE CHANGES --- 1222. EDUCATION ON CLIMATE CHANGE --- 1233. TRAINING AND CAPACITY BUILDING --- 1234. FOLLOW – UP ACTIVITIES --- 125
CHAPTER VIIPROBLEMS, CONSTRAINTS AND NEEDS1. NATIONAL GHG INVENTORY – PROBLEMS, CONSTRAINTS AND NEEDS --- 128
1.1 Institutional --- 1281.2 Technical --- 1281.3 Methodological --- 1291.4 Availability of resources --- 129
2. ABATEMENT ANALYSIS - PROBLEMS, CONSTRAINTS AND NEEDS --- 1302.1 Institutional --- 1302.2Technical --- 1302.3 Methodological ---1302.4 Availability of resources --- 130
3. VULNERABILITY ASSESSMENT - PROBLEMS, CONSTRAINTS AND NEEDS --- 1303.1 Institutional --- 1303.2Technical --- 1303.3 Methodological --- 1303.4 Availability of resources ---- 130
ABREVIATIONS --- 132REFERENCES --- 134

13
1. NATIONAL CIRCUMSTANCES --- 141.1 Geographic profile --- 141.2 Climate profile --- 141.3 Natural resources --- 14
1.3.1 Water resources --- 141.3.2 Forests ---14
1.4 Economic profile --- 141.5 Agriculture --- 151.6 Livestock --- 151.7 Mining --- 151.8 Energy --- 151.9 Transport --- 161.10 Industry --- 161.11 Tourism --- 161.12 Population --- 161.13 Public health --- 161.14 Education --- 171.15 Environment --- 17
2.. NATIONAL GHG INVENTORY --- 172.1 National GHG emissions in 1994 ---17
3. GHG EMISSIONS BASELINE SCENARIO --- 194. GHG EMISSIONS ABATEMENT SCENARIO --- 195. VULNERABILITY ASSESSMENT --- 21
5.1 Climate change scenarios --- 215.2 Water resources --- 225.3 Agriculture --- 225.4 Forests --- 225.5 Energy --- 225.6 Public health --- 235.7 Population --- 235.8 Tourism --- 24
6. ADAPTATION OPTIONS AND RECOMMENDATIONS --- 246.1 Water resources --- 246.2 Natural ecosystems --- 246.3 Agriculture --- 246.4 Forestry --- 246.5 Energy --- 256.6 Public health --- 256.7 Population, tourism --- 25
7. NATIONAL CLIMATE CHANGE ACTION PLAN --- 267.1 Abatement policies and measures --- 277.2 Adaptation policies and measures --- 27
8. PUBLIC AWARENESS, EDUCATION AND TRAINING ON CLIMATE CHANGE --- 278.1 Public awareness on climate changes --- 278.2 Education on climate change --- 288.3 Training and capacity building --- 28
9. PROBLEMS, CONSTRAINTS AND NEEDS --- 289.1 Institutional problems and constraints --- 299.2 Technical problems and constraints --- 299.3 Methodological problems and constraints --- 299.4 Availability of resources --- 29
EXECUTIVE SUMMARY

14
1. NATIONAL CIRCUMSTANCES
1.1 Geographic Profile
The Republic of Albania is situated in southeastern Europe, in the western part of Balkan penin-sula facing the Adriatic sea (sandy shore) and the Ionian sea (rocky shore). Albania has a surfacearea of 28,745 km2. The general length of the state border is 1,093 km.
1.2 Climate profile
Albania belongs to the subtropical Mediterranean climate. It is characterized by mild winters withabundant precipitation and hot, dry summers.The annual mean air temperature has a widevariation over the territory. All the territory is characterized by the negative trend of annual meantemperature.This negative trend of mean temperatures comes out as a result of the influence ofnegative trend of minimum temperatures.
The mean annual precipitation total over the Albania is about 1,485 mm/year. The highestprecipitation total (70%) is recorded during the cold months (October - March). The richestmonth in precipitation over the whole territory is November, while the poorest are July andAugust.
1.3 Natural resources
1.3.1 Water resources
The area surrounding Albania has relatively abundant fresh water resources. Seven main riversrun from east to west. The total volume of water flow is 39,220 x 106 m3/year. 86% of the annualwater flow is discharged during the wet period and 8% during the dry period. Ground water inAlbania is the only source for drinking water. The most important factor on which ground waterlevels depend is precipitation.
1.3.2 Forests
The Albanian forests cover 36% of the territory. Although Albania has extensive forests, 30% havebeen declared damaged by the uncontrolled cutting of the past ten years. The damages causedby burning and windstorms in forest species is another phenomenon which shows a variation.
1.4 Economic profile
Between 1944 and 1991, Albania's Government was controlled by the Communist Party, knownmost of that time as the Albanian Party of Labor, where the state controlled economic activity.Private ownership and private enterprise were absolutely forbidden. The communist regime ledAlbania into deeper isolation.
The year 1992 for Albania was considered as the start of transition from a centralized economyto a market one. Until 1996, the achievements were positive. Rapid growth rates, 9% per yearduring 1993-1996, seemed to confirm the success of the reforms. At the end of 1996, manypeople invested all their savings in the "pyramids" schemes and also sold their homes to raisefurther cash, generating a considerable collapse for Albania. After this collapse, the Governmentof Albania aimed at accelerating banking sector reform and privatization and shifting the activityof small businesses from trade to production, thereby helping to reduce the high levels of unem-ployment.Ex
ecut
ive su
mm
ary

15
1.5 Agriculture
Agriculture is the most important sector in Albania in terms of value added and employment. Itcontributes more than half of Gross Domestic Production (GDP). However this sector does stillaccount for about 35% of the exports and 40% of employment, but also has the lowest share ofservices with 22%. The main emphasis remains the production of cereals, however its structurehas shifted towards supplying of animal foodstuffs, instead of human consumption.
1.6 Livestock
Livestock constitutes more than half of the total value of the agricultural production. Althoughdevelopment of animal husbandry has not been encouraged, the number of cattle and smallruminants has increased rapidly. The anticipated continuous increase can create problems forthe environment in the future, because the density of livestock per hectare of land is already veryhigh.
1.7 Mining
Albania is rich in mineral resources, especially chromium, copper and iron - nickel. Before1990, the mining sector accounted for a substantial share of export earnings and Albania wasthe world's third largest producer of chrome ore. It is one of the major countries in Europe withsignificant chrome reserves per capita. Production collapsed during the periods of upheavals in1991-1992 and 1997.
Like the majority of Albania's industry, mining sector has been handicapped by the obsoleteequipment and technology and lack of management expertise, as well as the disruption ofproduction and supply lines caused by civil unrest.
1.8 Energy
Albania was largely self sufficient in energy resources and in most years (up to 1989) has beena net exporter of electricity and refined oil by products. Albania was rich with energy resourceslike oil, natural gas, coal, fuel wood, peat, and hydro energy, which contribute in different ways tomeet energy demands in the country.
From a historic peak of 3.3 MTOE in 1989, when all the Albanian economy operated in its fullcapacity, the primary energy supply in Albania dropped by more than 50% or to 1.5 MTOE in1992. Since then, the primary energy supply has remained relatively constant around the level of1.6 -1.7 MTOE.
The country's needs for electricity are met mainly by the hydro power plants and in a small scale,by the thermo power plants. The hydro power plants provide about 94% of the produced electric-ity, while the rest is produced by thermo power plants. Except of the thermo power plant in Fier,which actually operates, the other plants are closed down. The total production capacity is1,662 MW, where hydro power plants have a capacity of 1,444 MW.
After 1990, the domestic use of electricity received an immediate increase. The electricity waspreviously used only for lighting and communication means (radio, TV, etc.), while at present, itsuse for cooking and heating has become a concern. The increase of the demand for electricityfrom the household sector now occupies a growing share of the energy consumption: more than1/ 3 of the total energy demand and 60% of the electricity demand.
Exec
utive
sum
mar
y
16
1.9 Transport
Actually, the largest part of transport of goods and passengers is realized by road transport. A rapidexpansion in private car ownership, prohibited in the communist era, has already placed greatpressure on the road network. There are 447 km of mainline railway and 230 km of branch lines.The rail network deteriorated greatly in the 1990 particularly in the early part of the decade, whenthe track and signaling wires were plundered for scrap. Lately, the antiquated rolling stock isbeing updated with coaches donated by western countries.There are two major sea ports inDurres and Vlore, both being refurbished. The only commercial airport in Albania is ‘MotherTeresa” located in Rinas, near Tirana.
1.10 Industry
Since 1994, the industry sector has accounted for a steady 12% of GDP. Albania's historicaldependence on mineral extraction is owed to substantial commercially exploitable reserves.During the communist era, the "proletarian" policy assured each of the 26 administrative districtssome development. All of them had food processing industries, and most of them producedbuilding materials.Districts with forests also developed timber and wood products industries.However, the bulk of industrial output came from six main districts that contained large plants,some of them capable of exporting. The equipment and manufacturing plants inherited at thestart of the decade had mostly been supplied firstly by Soviet Union and then by People’s Repub-lic of China, little of which proved internationally competitive, when Albania was opened to worldmarkets. Subcontracting for abroad has given new life to food, beverage and leather goods.Aggregate growth has been positive since its falling after the disorders of 1997 and was 5% in2000.
1.11 Tourism
Tourism in Albania is only at a very early stage of development. Albania exhibits considerablepotential for the development of tourism, because of its extensive coastline, the interesting scen-ery of Albanian lakes and mountain regions and the generally perfect countryside.
1.12 Population
Actually, the Albanian population counts 3,4 million inhabitants. Over 55% of the population live inrural areas. During 1991-1998, Albania experienced demographic changes dominated by thenegative rate of population increase, migration from the villages towards the towns and from theremote areas towards the capital, the massive emigration and the decrease of births. The re-urbanization and the overpopulation are the main existing problems at local level in Albania. Theemigration of Albanians abroad is higher than the other countries of Central and Eastern Europe.The population migration has led to very disorganized and uncontrolled development, concern-ing not only the real movement level, but also the calculation of the new living areas. An outcomeof the lack of control has been the widespread abusive construction of new buildings, in most ofthe cases within the towns or in the suburbs, which of course is not supported by the respectiveinfrastructure.
1.13 Public health
The universal provision of healthcare was a state obligation under communism. However, thispolicy denied doctors access to adequate medical equipment or modern pharmaceuticals. Thehealthcare system deteriorated after the fall of communism, mainly owing to funding pressures.External assistance from the World Health Organization (WHO) and the UN Children's Fund(UNICEF) has assisted the improvement of health facilities.Ex
ecut
ive su
mm
ary
17
1.14 Education
Education is free and compulsory for 6 -14 years old and free until the age of 18. However,whereas in 1990 there was 93% enrolment of the 6 -18 age group, the rate is now little above80%. The higher non attendance and drop out rates are attributable to poor maintenance ofschool buildings and equipment, the emigration of teachers and the pressure on the two-thirdsof school age children who live in rural areas to work on the private holdings, where once thecollective farm put them into school. Private education is still rare. A high rate of literacy has beeninherited and is little below the European average, at 85% (identical for men and women).Graduates have been particularly prone to emigrate, according to a recent study that found thatabout 40% of Albanian graduates had left the country in the past 10 years.
1.15 Environment
Until 1998, the highest governmental body responsible for environmental issues in the countrywas the Committee for the Environmental Protection (CEP), as part of the Ministry of Health andEnvironment. The establishment of the National Environmental Agency (NEA), as a high statebody depending directly on the Council of Ministers, represents an important step towards to theinstitutional strengthening and the process of the consolidation of the governmental structure,responsible of the environmental administration in the Republic of Albania.This step was ac-companied by other significant steps, which shaped the structure of NEA and determined theinternal regulations of the activity of the Agency and its components. These measures gave wayto the strengthening of the authority and role of the Agency, and created the conditions for anormal development of its activity until October 2000, when the Ministry of Environment (MoE)was created.
In the light of the formidable social and economic challenges, Albania began to develop aframework for addressing the environmental problems that have emerged during the last de-cade. One of the priorities of the Environmental Strategy and National Environmental Action Plan(NEAP) has been the establishment of the respective legal framework, seeing it as an importantinstrument for the application of the environmental policies in the country.
Environmental monitoring is a weak link in Albania's environmental management chain. Themonitoring responsibility is spread across several governmental institutions.
2. NATIONAL GHG INVENTORY
2.1 National GHG emissions in 1994
The greenhouse gases (GHG) inventory for Albania is developed according to the revised 1996,Intergovenmental Panel on Climate Change (IPCC) Guidelines. The base year used is 1994. Itconsiders five main modules of the revised 1996, IPCC Guidelines: energy, industrial processes,agriculture, waste, land use change and forestry. Solvents are analyzed as well. The nationalgreenhouse gases inventory represents emission data for three gases of direct greenhouseeffect: CO2, CH4 and N2O as well as the three other gases of indirect greenhouse effect like CO,NOx and NMVOC. CO2emissions released from energy and transport, are estimated by usingtwo approaches: Top-Down and Bottom-Up. The estimations show that the difference betweentwo approaches accounts for 3.01%.
Albania’s total emissions for 1994 are 7,061.45 Gg of CO2 equivalent (Tab.1). The estimationsindicate that for 1994, CO2 was the main greenhouse gas in Albania, with a share of 65.33%.(Fig. 2). The main source of CO2 is energy sector with 62.95%. The main source of CH4 emis-sions for Albania is agriculture sector with 77.74%. Moreover, agriculture is the main source ofN2O emissions with 69.45%. Figure 1 shows the shares of CO2 equivalent emissions fromeconomic sectors. It is noticeable that energy sector is the main source of these emissions with44%, followed by agriculture sector with 27.12%.
Exec
utive
sum
mar
y

18
Fig.1 CO2 eqv., emissions from economic Fig.2 CO2 eqv., emissions from each gas sectors [7,061.45 Gg], 1994. [7,061.45 Gg], 1994.
Tab.1 Anthropogenic GHG emissions by source categories, 1994, [Gg]
Albania has a relatively low level of CO2 emissions per capita (Fig. 3) and high CO2 emissionsper GDP (Fig.4)
Source: IAE Fig.3 CO2 emissions per capita for selected countries Fig.4 CO2 emissions per GDP for selected countries 1994, [ton CO2 / capita] 1994, [ton / Million.USD]
CO2 emissions per capita in Albania are about 4 - 5 times lower than the total average, because:energy consumption per capita in Albania is the lowest between the selected countries; electric-ity generation is based almost on hydro energy sources (more than 94% of electricity is gener-ated by hydro power plants); different energy services in residential sector like space heating,domestic hot water, and cooking are based almost totally in electricity (residential sector con-sumes 60% of total electricity); and industry sector went down in 1994 starting from 1990, interms of energy consumption.
CO2 emissions per GDP in Albania are about 10 -12 times higher than the average value forindustrialized countries because: Albanian technology is very old; productivity of Albania’s soci-ety is very low compared to industrialized countries; and a big share of energy sources is con-sumed in residential and service sectors and not in industry sector for producing higher value ofGDP.
Exec
utive
sum
mar
yLUCF
19
3. GHG EMISSIONS BASELINE SCENARIO
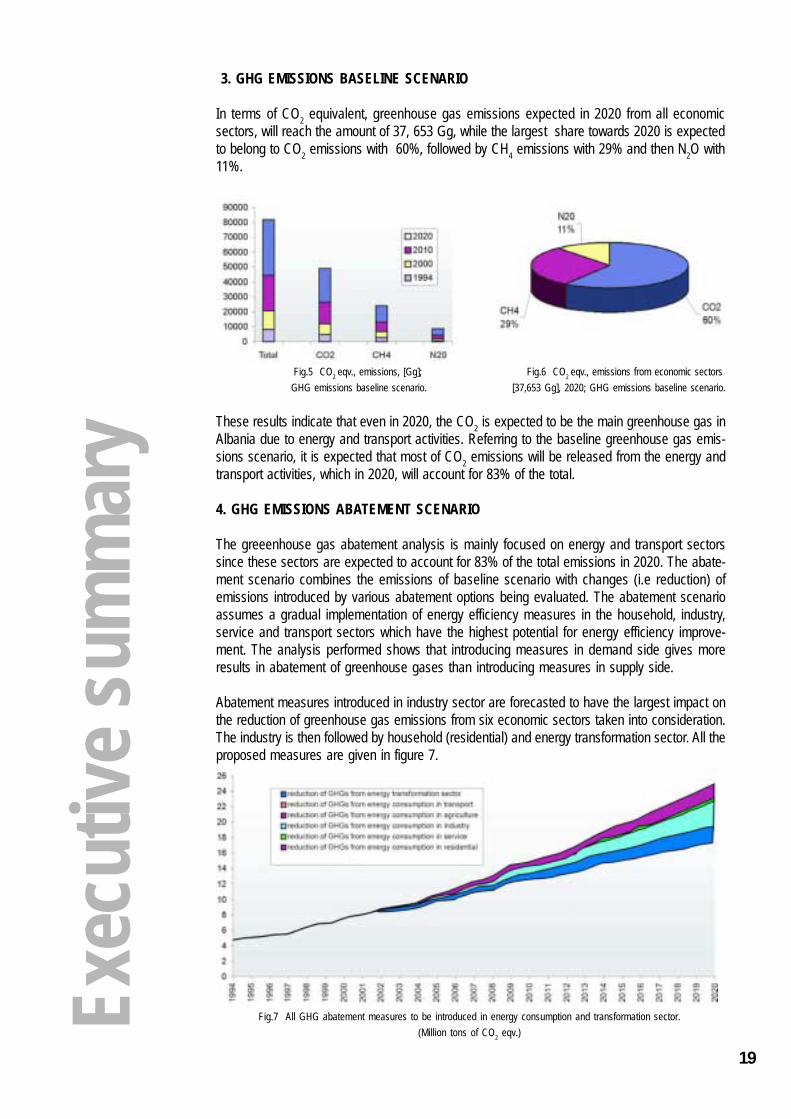
In terms of CO2 equivalent, greenhouse gas emissions expected in 2020 from all economicsectors, will reach the amount of 37, 653 Gg, while the largest share towards 2020 is expectedto belong to CO2 emissions with 60%, followed by CH4 emissions with 29% and then N2O with11%.
Fig.7 All GHG abatement measures to be introduced in energy consumption and transformation sector.(Million tons of CO2 eqv.)Ex
ecut
ive su
mm
ary
Fig.5 CO2 eqv., emissions, [Gg]; Fig.6 CO2 eqv., emissions from economic sectors GHG emissions baseline scenario. [37,653 Gg], 2020; GHG emissions baseline scenario.
These results indicate that even in 2020, the CO2 is expected to be the main greenhouse gas inAlbania due to energy and transport activities. Referring to the baseline greenhouse gas emis-sions scenario, it is expected that most of CO2 emissions will be released from the energy andtransport activities, which in 2020, will account for 83% of the total.
4. GHG EMISSIONS ABATEMENT SCENARIO
The greeenhouse gas abatement analysis is mainly focused on energy and transport sectorssince these sectors are expected to account for 83% of the total emissions in 2020. The abate-ment scenario combines the emissions of baseline scenario with changes (i.e reduction) ofemissions introduced by various abatement options being evaluated. The abatement scenarioassumes a gradual implementation of energy efficiency measures in the household, industry,service and transport sectors which have the highest potential for energy efficiency improve-ment. The analysis performed shows that introducing measures in demand side gives moreresults in abatement of greenhouse gases than introducing measures in supply side.
Abatement measures introduced in industry sector are forecasted to have the largest impact onthe reduction of greenhouse gas emissions from six economic sectors taken into consideration.The industry is then followed by household (residential) and energy transformation sector. All theproposed measures are given in figure 7.

20
The proposed greenhouse gas abatement measures for energy sector, ranked in a decreasingorder, as per their reduction potential, are presented in the figure 8.
Fig.8 All GHG abatement measures to be introduced in energy and transport sector ranked in decreasing order, 2020,[Million tons of CO2 eqv.]
The following figure represents the final analysis of comparing the abatement measures basedon their cost per unit reduction of CO2 equivalent.
Fig.9 Comparison of selected GHG emissions abatement measures based on their cost of reduction [USD/CO2 eqv.]
The most effective abatement measures, based on their cost of reduction of CO2 equivalent , inthe decreasing order, are as follows:
♦ Introduction of thermo insulation of households which use fuel wood as energy source formeeting space heating demand;
♦ Introduction of thermo insulation of households which use liquefied petroleum gas (LPG)as energy source for meeting space heating demand;
♦ Improvement of power factor in industrial and service consumers;♦ Introduction of thermo insulation of households which use electricity to meet space heat
ing demand;♦ Introduction of thermo insulation of households which use kerosene to meet space heat ing demand;♦ Introduction of gas-taxies versus gasoline taxies;Ex
ecut
ive su
mm
ary

21
♦ Introduction of efficient lighting (incandescent lamps) versus fluorescent ones in house holds / service/ industry sector;♦ Improvement of efficient boilers which use heavy fuel oil / diesel as fuel;♦ Improvement of efficient boilers which use coal as fuel;♦ Introduction of thermas time switches in electric boilers in household sector;♦ Introduction of prepayment meters in household sector;♦ Introduction of wind turbines versus diesel generators;♦ Introduction of hydro power pants versus heavy fuel oil power plants;♦ Introduction of thermo insulation of households which use heat generated from district
heating plants as energy source for meeting space heating demand;♦ Introduction of efficient electric motors in industry / service sectors;♦ Introduction of efficient refrigerators in household / service sectors;♦ Introduction of solar water heaters versus electric boilers;♦ Introduction of mini hydro power plants versus diesel generators;♦ Introduction of landfill gas plants of 70% recovery;♦ Introduction of gas power plants versus heavy fuel oil power plants;♦ Introduction of PV electricity versus diesel generators; and♦ Introduction of solar PV water pumps versus diesel pumps.
5. VULNERABILITY ASSESSMENT
5.1 Climate change scenarios
The assessment of vulnerabilities is focused on the assessment of the expected climate im-pacts in hydrosphere, natural and managed ecosystems, energy, tourism, public health, popula-tion. The study area has covered the whole Albanian territory. Three time horizons are consid-ered: years 2025, 2050 and 2100. The expected Climate Change Scenario for Albania (CCSA),including seasonal and annual changes, results to be as indicated in table.2
Tab. 2 Climate change scenarios for Albania
The climate change scenarios for Albania leads to an annual increase in temperature up to 1°C,1.8°C, 3.6°C respectively by 2025, 2050 and 2100 and a decrease in precipitation up to - 3.8%,-6.1%, -12.5% by the same time horizons. Cloudiness would decrease from -2.6% up to -4.6%Ex
ecut
ive su
mm
ary

22
related to the 1990 year by 2050 and 2100 respectively. Wind speed is expected to increase upto 1.3 to 2.3% by 2050 and 2100 respectively related to the period 1961-1990, especially duringsummer, because of the increase in the land-sea temperature contrast. An increase in theglobal radiation and the sunshine hours might be expected due to the cloudiness decrease.Evapotranspiration is expected to intensify due to the temperature and wind speed increases. Adecrease in the rainy days almost at the same range as the precipitation is expected. The totalnumber of hailstorm days is expected to decrease, although an increase in such days duringsummer might be expected, owing to the temperature rise.
5.2 Water resources
The outputs of upheal models forecast a small decrease in the long term mean annual runoff,respectively from -9.8% to -13.6% and from -6.3% to -9.1%, for 2025. It would affect the surfacewater flow, reducing its amount. Under reduced surface water flow and increased evaporation,the storage of reservoirs will decrease.
The ground water supply will be affected by decreased percolation of water, due to decrease inthe amount of precipitation, stream flow and losses of soil moisture from increased evapotrans-piration. Reduction in ground water supply in combination with the increase of salinity of theground water supply will bring shortage of adequate quality of drinking water.
A sea level rise of 48-61 cm for 2100 would result in direct flooding of coastal area. Due to theincreasing of the sea level, flooding will be intensified both directly by the sea and indirectly bychanges in water tables. In non protected lagoons, accretion is expected to occur, followingdestruction of the low strands separating them from the sea.
5.3 Agriculture
Agriculture will also be affected by expected climate changes. These changes will modify rainfall,evaporation and soil moisture storage leading to an increase of the irrigation requirements anda more decrease of the capacity of reservoirs and irrigation distribution systems. Available waterresources will be sufficient for irrigation by 2025. Thus, no considerable impact to the yields ofcrops like wheat, maize, potato, vegetables, forages (alfalfa etc.) fruit trees etc., may be expectedby 2025.
Referring to the other time horizons, 2050 and 2100, the impacts to be expected on agriculturesector are: the reduction of the extent of arable land due to soil erosion and alteration; thechanges in the growth cycles, harvest time and the quality of the agricultural production, espe-cially along the coastal area owing to an increase in salinity, due to the sea level rise andintrusion of salt water into the soil; the cultivation of early agricultural products in the open air orin greenhouses owing to an increase in winter temperatures.
5.4 Forests
As regards the forest sector, extensions of vegetation flats are expected by 2025, 2050, 2100.The species that resist high temperatures and severe long dry seasons would be able to overlive. For those that need moisture (silver fir, etc.), the danger of being limited in distribution ordisappearing does exist. The species that produce many small seeds and have a high distribu-tion potential (pinus etc.) would be able to survive and to spread at sea level, whereas oakspecies which produce big seeds, would occupy new areas only very slowly.
5.5 Energy
Climate change is expected to have significant impacts on the energy sector. The predictedraised temperatures, changes in the amount of precipitation, variation in humidity, wind patternsEx
ecut
ive su
mm
ary

23
and the number of sunny days per year could affect both consumption and production of energy.Climate change is likely to affect the major end uses such as space heating, space cooling,water heating and refrigeration. It is expected an increased energy demand for air conditioningin residential and service sector.
Changes in energy consumption as result of predicted climate changes, will lead also to changesto energy production. Climate changes may be seen primarily in power generation, includinghydro power plants, thermo power plants, solar heater systems and wind power plants.
Albania is heavily reliant on electricity production by hydro sources. If a severe drought willhappen, it will result in less electricity produced by the hydro power plants. Thus, a heavy reli-ance of hydro sources may be good for reducing greenhouse gas emissions and improving airquality in Albania, but can increase vulnerability to climate change.
It is expected that the share between hydro power plants and thermo power plants will lead tosignificant changes. So, in 1990, 94% of the electricity was generated from hydro power plantsand only 6% from thermo power plants, while in 2025 hydro power plants are expected tocontribute with 47.68% and thermo power plants with 52.32 % of the total.
Climate change may also affect the supply of energy from solar and wind power. A likely increasein the global solar radiation and the hours of sunshine will lead to an increase of solar energyusage for different energy services, especially for preparation of domestic hot water.
Since we are expecting an increasing of the wind speed up to 1.3 to 2.3 %, respectively by 2050and 2100, compared to the period 1961-1990, it might be of interest to think about introducingwind power plants in the energy schemes in the future.
5.6 Public health
Referring to the likely changes of climate system, a series of impacts on public health areexpected. Shortage of drinking water of and inadequate quality could be critical especiallyduring summer. As a consequence, an increase in cases of contagious, digestive system dis-eases, etc., is expected.
The liquid and solid wastes, if discharged directly into the sea, would destroy or strongly modifythe sea flora and fauna. If these problems are not solved, the impact of climate change wouldlead to the deterioration of the health of the Albanian population, living especially in the coastalzone.
The increase in temperature would affect the physiological and compensatory system of people.Thus, age groups like infants, children and elders where the decrease in compensatory systemis common, will have changes in their health conditions. These changes would cause higherincidence of some diseases, influenced by the atmospheric changes. The infections in therespiratory system will be the most visible.
5.7 Population
The population living in coastal area, particularly in beach areas, is seriously threatened by theexpected increase in the sea level. The entire dwelling places, hotels, roads and agriculturalareas etc., situated in the lower zones of the Adriatic coastal line (excluding the territories underthe effect of raising movements) will be flooded. The same lot is expected to affect the agriculturalland (in the former swamps of Durrës, Myzeqe, Narta, Vrug etc.) as well as dwelling centers andrural infrastructure, which reach up to 50 cm above the sea level.Ex
ecut
ive su
mm
ary

24
5.8 Tourism
Coastal tourism is expected to suffer the vulnerabilities caused by sea level rise. Considering theincrease in temperature from 2.8 to 4.1°C during summer, a general inclination of tourismtowards the mountains or the lakes, instead of the beaches is expected. The coastal tourismwould be more preferable by the end of spring and beginning of fall.
6. ADAPTATION OPTIONS AND RECOMMENDATIONS
A set of adaptation options for each sector has been identified. The adaptation options are iden-tified taking into consideration the principles such as prevention of loss, tolerating loss, sharingloss, changing use or activity, changing locations, research and restoration.
6.1 Water resources
The adaptation measures for water resources and marine waters include the following:
♦ Modification of existing physical infrastructure;♦ Construction of new infrastructure;♦ Water pollution control;♦ Improvement of the monitoring and forecasting system for flood and drought;♦ Drafting and approval of new legislation for water use;♦ Setting a real water consumption fee;♦ Implementation of the Integrated Coastal Zone Management Plan;
6.2 Natural ecosystems
Various adaptation measures are available to aid efforts to support the conservation of biodiversityin the face of climate change, including:
♦ The establishment and maintenance of protected areas (in-situ conservation);♦ The active management of wild populations outside of protected areas (inter-situ manage
ment);♦ The maintenance of captive populations (ex-situ methods);♦ Monitoring of species;
6.3 Agriculture
To adapt the likely impacts of climate change on agriculture sector the following actions arerecommended:
♦ Afforestation and the setting up of the barriers to protect the arable land threatened by soilerosion and alteration;
♦ Planning of agricultural production toward xerophilic crops to allow adaptation to the highertemperatures and to the scarcity of water in summer. Agricultural development should beadjusted towards species that would better adapt to the expected soil and atmosphericconditions;
♦ A significant improvement of irrigation sector;
6.4 Forestry
To adapt the forests against the predicted impacts of climate change the following measuresare proposed:♦ Preparation of the Strategy on Sustainable Development of Forests;Ex
ecut
ive su
mm
ary

25
♦ Preparation and implementation of the study research programs for forest management;♦ Evaluation of the actual situation of each forest in relationship to the expected climate
change;♦ Increase of the protected forest areas;♦ Reduction of the illegal cuttings of forest trees;♦ Increase of the investments to implement more actions in existing forests;♦ Implementation of the actions to increase the existing forest productivity;♦ Increase of the forest area through reforestation;♦ Monitoring of the forest health;♦ Studying and monitoring of the fire situation in forests;♦ Reduction of the wood consumption for energy;
6.5 Energy
The list of the most important adaptation options, especially related to the reduction of water flowon hydro power plants is as follows:
♦ Consider expected change in runoff / water flow rate in integrated resource planning;♦ Account for the expected change in runoff / water flow rate in the design of thermo power
facilities;♦ Account for the expected change in runoff / water flow rate in the design of hydro power
plants;♦ Invest in energy conservation (Demand Site Management) measures for space cooling;♦ Reduce energy subsidies;
6.6 Public health
To adapt to the impact of the expected changes, it is very important to take the necessary mea-sures like:
♦ Permanent monitoring of the drinking water quality;♦ Permanent monitoring of water supply and sewerage systems affected by salted water
corrosion and intrusion in coastal areas;♦ Permanent monitoring and drafting of a new law on air quality;♦ Improvement of the solid waste collection and treatment technology;♦ Compilation of long term plans for the urban development;♦ Elaboration of a reliable medical and statistical program that will help in finding the cause
consequence (climate changes - health) correlations.
6.7 Population, tourism
As expected by 2025, about 60% of population would be settled in the capital and the coastalarea. The major economic sector which is expected to employ 40-50% of the active populationin this region will be that of services.To have a good functioning of the services sector, thefollowing measures need to be taken:
♦ The provision of new potable water supply resources and the construction of new watersupply, filtration and distribution systems;
♦ The provision of new power supply resources and the rearrangement of the appropriatedistribution system.
♦ The construction of new sewage systems for both households and industry, as well as ofnew processing units for all the urban solid wasteEx
ecut
ive su
mm
ary

26
7. NATIONAL CLIMATE CHANGE ACTION PLAN (NCCAP)
Although Albania as a non-Annex I Party has no emission reduction targets under the UNFCCC,attempts to address the climate change issues are made. In Albania, no comprehensivenational policy to address climate changes has been adopted to date. During the period ofpolitical, economic transformation and the development of a new state, a range of acts, regula-tions and measures, indirectly related to greenhouse gas emission reduction, are developedand even adopted like: the revised NEAP, Amended Law on "Environmental Protection", EnergyStrategy, Strategy of Forestry Development, Urban Waste Management Plan, Strategy of Agricul-ture, National Action Plan for Health and Environment, Growth and Poverty Reduction Strategy,Biodiversity Strategy, Water Strategy.
Although climate change is not a priority for Albania, the effective implementation of the climatechange measures may require the development of response measures that are primarily de-signed to achieve other development objectives. Fortunately, many mitigation and adaptationmeasures have multiple benefits and will contribute to the achievement of sustainable develop-ment goals.
Albania is addressing mitigation and adaptation measures through NCCAP, which consists on aset of priority actions to integrate the climate change concerns into other economic develop-ment plans, which seems to be one of be the most major challenges of this process, aiming atthe reduction of the growth rates of greenhouse gas emissions and adaptation to expectedclimate changes.
The NCCAP is primarily focused on two directions and addresses:
♦ Measures to abate greenhouse gas emissions;♦ Measures for adaptation to the expected climate changes;
Expected outcomes from this NCCAP are the following:
♦ Reduction of greenhouse gas emissions;♦ Reduction of the vulnerability;♦ Adaptation to expected climate changes;♦ Promotion of sustainable development;♦ Reduction of poverty;♦ Protection of the environment;♦ Institutional strengthening;♦ Capacity building on climate change;♦ Establishment of the legal framework to address climate change;♦ Public awareness on climate change;
The NCCAP is designed in a sectoral approach where adaptation and abatement measures areaddressed. A broad range of possible sectoral and cross sectoral issues are addressed andthen the most appropriate ones for our circumstances are selected.
The selection of abatement and adaptation options is made on the bases of:
♦ Cost effectiveness (i.e. low or negative cost per ton of emission reduction);♦ Emissions reduction potential (estimated total tons of emission reduction);♦ Contribution to other national development goals;♦ Technological benefit (potential to gain an early lead in new technologies);♦ Level of barriers;Ex
ecut
ive su
mm
ary

27
♦ Potential for GEF or other UNFCCC mechanisms support;♦ Contribution to risk minimization;♦ Contribution to minimization of economic losses;
The findings of the greenhouse gases inventory, abatement analysis and vulnerability assess-ment are the basic materials used for the compilation of this plan.
The implementation of the abatement and adaptation measures requires a coordinated actionbetween the Ministry of Environment and other relevant ministries and governmental agencies,non governmental organizations and the public.
The main responsibility in the implementation process of the NCCAP belongs to the Ministry ofEnvironment as the governmental body responsible for environmental administration in theRepublic of Albania.
The establishment of Interministerial Climate Change Committee is the main step towards theimplementation process of the NCCAP. This action plan is a long term one (up to 2020) andshould be reviewed on regular basis, taking into account and monitoring such indicators as:new development plans for the economic sectors, changes in legal framework, state-of-the-artdata on climate change, environmental strategy, future developments of the UNFCCC and ne-gotiating process, eligibility of funds from UNFCCC financial mechanisms and other interna-tional sources, amount of the funds allocated for the implementation of the plan, level of publicawareness on climate change.
7.1 Abatement policies and measures
The objectives of the abatement policy are focused primarily on the energy sector, as the mainsource category of emissions, which also possesses large abatement potential.
As concluded by the abatement analysis, the measures to be introduced in the energy sectorconsist in the increase of energy efficiency, increase and improvement of energy savings, use ofeconomic, regulatory and legal instruments for energy efficiency and saving.
The development of a sustainable transport is the focus of the measures to be introduced in thetransport sector.
With regard to the forest sector, the main policy goal is the preservation of forests and develop-ment of new management options.
In agriculture sector, the main tasks consist in the increase of production efficiency from theimprovement of genetic parameters. The reduction of fertilizer amounts and development ofecologically - economically sustainable agriculture are the other main goals.
7.2 Adaptation policies and measures
The aim of the adaptation policy is to develop a climate change policy that is specifically gearedtowards more vulnerable sectors in the country, to establish a public policy which encouragesand supports adaptation at local or community level and in the private sector.
8. PUBLIC AWARENESS, EDUCATION AND TRAINING ON CLIMATE CHANGE
8.1 Public awareness on climate changes
Despite the increasing public awareness regarding environmental issues in general, the issueof climate change in Albania is still relatively dormant, even the level of policy makers do not haveEx
ecut
ive su
mm
ary

28
a very good understanding of the climate changes and related issues like, the implications ofexpected climate changes, potential benefits of the response measures for mitigation and ad-aptation to climate change and, the importance of meeting the commitments under the UNFCCCand achieving its ultimate objective.
Prior to the start up of the GEF funded project on National Communication, no public awarenessactivities have been organized in Albania. The preparation process of the First National Com-munication has also contributed to the enhancement of general awareness and knowledge onclimate change related issues in Albania, strengthening of the dialogue, information exchangeand cooperation among all relevant stakeholders including governmental, non governmental,academic and private sectors, and building national capacities.
The Project Steering Committee (PSC) meetings and joint efforts of ensuring the support fromthe governmental institutions for the project, have served as a way of raising awareness amongpolicy makers, who represent different climate change institutions. These policy makers areexpected to also provide support for the adoption and implementation of the National ClimateChange Action Plan (NCCAP)
The workshops, organized in the frame of the GEF funded project on National Communication,have contributed to the same purpose of awareness raising.
The publication of the main results and findings of the Albania's First National Communicationin the recent Status of Environment (SoE) Report and inclusion of the NCCAP into the revisedNEAP, are indicators of a higher level of awareness among the environmental policy makers.The establishment of the National Climate Change web page and the publication of the projectnewsletter have played an effective role in awareness raising about climate change.
8.2 Education on climate change
A similar situation relates to education on climate changes. The level of education is low evenfor environmental education in general. The recent tendencies aim at including the environ-mental education into school curricula. Some progress has been achieved, but to a very lowextent. Although there is no explicit reference to climate changes, main concepts have beenintroduced in some curricula of high education.
8.3 Training and capacity building
The project on the preparation of the First National Communication has also contributed to build-ing of national capacities, through the compilation of the national greenhouse gas inventory,greenhouse gas abatement analysis, assessment of vulnerability and adaptation, and compila-tion of the NCCAP, as well as through the integration of these issues into other sectoral develop-ment plans.
The national capacities for the compilation of National Communications are built not only throughthe learning by doing process, but even through workshops (technical, national, regional, inter-regional), training and hands-on training sessions, and technical and consultative meetings,held during project phase-I cycle life.
9. PROBLEMS, CONSTRAINTS AND NEEDS
Albania as most of non-Annex I Parties is faced with a number of problems and constraintsduring the process of preparation of the First National Communication. Despite the fact thatAlbania has developed the First National Communication and the national capacities are beingbuilt, it is still overwhelmed by a number of problems and constraints. These problems andconstraints are of institutional, technical, methodological and financial nature and remain con-siderable concerns, threatening the sustainability of this exercise.
Exec
utive
sum
mar
y

29
9.1 Institutional problems and constraints
The following problems identified represent the institutional problems and constraints not onlyfor inventory preparation process but for all components of the National Communication, whichneeds to be overcome and improved. Specifically, the problems identified are: lack of institution-alization and reporting obligations to enforce relevant state and especially private sector forprovision data; lack of an appropriate support from the PSC; lack of awareness on climatechange issues among different stakeholders; inflexibility of National Execution (NEX) modali-ties.
9.2 Technical problems and constraints
The technical problems and constraints, identified during the inventory exercise relate to theavailability reliability and variability of activity data and emission factors. In some cases the lackof disaggregated activity data and inconsistency with IPCC format was identified. Also, most ofthe emission factors do not reflect the Albanian situation.
Regarding the abatement exercise, the problems and constraints identified were the lack ofappropriate data to perform a quantitative analysis for the following measures (in residential andservice sectors) like introduction of central heating (CH) plants, introduction of district heating(DH) plants, introduction of small scale combined heat and power (CHP) and DH plants, in newurban areas. Also the lack of adopted strategies for some relevant sectors and lack of predictions(scenarios) for future development of different sectors were another constraints.
With regard to the vulnerability assessment, the lack of sufficient data because of poor monitor-ing and the impossibility to develop baseline scenarios for sectors like agriculture, tourism,public health etc., due to the fact that their development before 1990 was dictated by politicalfactors, was also identified.
9.3 Methodological problems and constraints
The methodological problems and constraints identified during inventory exercise relate to thediscrepancy on local classification of forests to that of IPCC methodology. IPCC does not reflectthe case of burning waste or open dump. Also the lack of a methodology for solvents is anotherconstraint.
Regarding the abatement exercise were identified problems and constraints like: lack of explicitguidelines for abatement analysis; lack of models / software for scenario development for sec-tors other than energy and transport; lack of training on available models.
Regarding the vulnerability assessment there were identified problems and constraints like: lackof explicit guidelines for vulnerability assessment and adaptation; lack of a finer resolution forMAGGIC / SCENGEN software; lack of methods for simulation of extreme weather events; lackof models to perform a cost / benefit analysis.
9.4 Availability of resources
The lack of previous experience on the preparation of greenhouse gas inventories and abate-ment and the lack of a trained national team, are some of the constraints identified during theprocess of preparation of National Communication.
Regarding the vulnerability assessment, lack of experience for such a complex study and lack ofappropriate financial resources for development of vulnerability assessment were identified.Ex
ecut
ive su
mm
ary

30

31
CHAPTER I
NATIONAL CIRCUMSTANCES
1. GEOGRAFIC PROFILE --- 332..CLIMATE PROFILE --- 33
2.1 Temperature --- 332.2 Precipitation --- 34
3. NATURAL RESOURCES --- 353.1 Water Resources --- 35
3.1.1 Surface water --- 353.1.2 Ground water --- 353.1.3 Marine water --- 35
3.2 Forestry and land use change --- 364. ECONOMIC PROFILE AND SECTORS --- 37
4.1 Agriculture --- 384.1.1 Livestock --- 39
4.2 Mining --- 404.3 Energy --- 40
4.3.1 Energy consumption --- 404.3.2 Energy supply --- 41
4.4 Transport --- 434.4.1 Road transport --- 434.4.2 Railway transport --- 444.4.3 Marine transport --- 444.4.4 Air transport --- 34
4.5 Industry --- 444.6 Tourism --- 454.7 Fisheries ---- 45
5. RESOURCES AND INFRASTRUCTURE --- 455.1 Population profile --- 455.2 Public health --- 465.3 Education --- 47
6. ENVIRONMENT --- 476.1 Environmental legislation --- 47
6.1.1 Major environmental laws of Albania --- 486.2 Institutional framework --- 486.3 Environmental situation --- 49
6.3.1 Waste --- 496.3.2 Water --- 4506.3.3 Air --- 506.3.4 Soil --- 506.3.5 Biodiversity --- 50
6.4 Public awareness --- 50
I

32
Source: INSTAT

33
1. GEOGRAFIC PROFILE
Fig.I.1 Map of Albania
The Republic of Albania is situated in southeastern Europe, in the western part of Balkan penin-sula facing the Adriatic sea (sandy shore) and the Ionian sea (rocky shore). Its coordinates are39º 38' (Konispol) and 42º 39' (Vermosh) and 19º 16' (Sazan island) and 21º 40' (Vermik village,Korça).
Albania has a surface area of 28,745 km2. Its terrain is mountainous, where hilly and mountain-ous areas make up for 77% of the country's territory and the average altitude of 708 meters isdouble the European one. It is administratively divided in 12 prefectures, 36 districts, 315 com-munes and 2,900 villages.
The general length of the state border is 1,093 km, out of which 657 km land border, 316 km seaborder, 48 km river border and 72 km lake border. North and northeast, Albania borders withRepublic of Yugoslavia, east with Former Yugoslavia Republic of Macedonia, while south andsoutheast with Greece
Owing to the rugged relief of the land, rivers are torrential with high erosive power. A number ofrivers flow into the sea such as Buna, Drini, Mati, Ishmi, Erzen, Shkumbin, Seman, Vjosa andBistrica. Except Bistrica, which flows into the Ionian sea, the rest of the rivers flow into the Adriaticsea, forming a number of coastal lagoons and swamps. The rivers of Albania constitute animportant source of hydro power.
The lakes are of varying origin: glacial lakes in the highlands, carstic lakes in the hills, and tec-tonic lakes (Shkodra, Ohri and Prespa). The lakes in hills and highlands are important, in termsof tourist ecosystems. They are used for irrigation purposes. Moreover, they are very importantregarding fisheries, especially those of the wetland type, which are large fishing reserves.
2. CLIMATE PROFILE 1
2.1 Temperature
Albania belongs to the subtropical Mediterranean climate. It is characterized by mild winterswith abundant precipitation and hot, dry summers. The annual mean air temperature has a wideNa
tiona
l circ
umst
ance
s
1 An assessment of climate situation for a 30 years period (1960-1990) is made.

34
variation over the territory. These values vary from 7°C over the highest zones up to 15°C on thecoastal zone, even in the southwest the temperatures reach up to 16°C (Fig.I.2). Along thelowland, almost a stable distribution of annual mean temperature (12-14°C) is observed.
All the territory is characterized by the negative trend of annual mean temperature. It indicates anegative trend of about 0.6°C for Vlora station, of 0.4°C for Shkodra and of 0.3°C for Korça,during 30 years (Fig.I.2). By analyzing the influence of maximum and minimum temperatures inthe variance of mean temperatures, it is found out that the minimum temperature has a verydistinguished influence than the maximum one. Thus, this negative trend of mean temperaturescomes out as a result of the influence of negative trend of minimum temperatures.
2.2 Precipitation
The mean annual precipitation total over the Albania is about 1,485 mm/year. The highestprecipitation total (70%) is recorded during the cold months (October - March). The richestmonth in precipitation over the whole territory is November, while the poorest are July andAugust. The number of rainy days (>1.0 mm) per year varies from 80-120 days/year. The south-east part of country receives the smaller amount of precipitation (annual value reach up to 600mm/year), followed by the Myzeqeja field, that receives about 1,000 mm/year. The highest pre-cipitation total is recorded in the Albanian Alps, whereas the values reach up to 2,800-3,000mm/year. Another center with abundant rainfall is also the mountainous southwest zone, with aprecipitation total up to 2,200 mm/year (Fig.I.3). Generally, the annual precipitation total showsa slight decreasing trend (Fig.I.3). It is the consequence of the decrease in precipitation, mainlyduring winter and spring.
Fig.I.2 Annual temperatures (1960-1990) Fig.I.3 Annual precipitation (1960-1990)
An exception from this general trend makes autumn, where coastal stations (Shkodra and Vlora)indicates positive trend of precipitation. While Tirana, Korça and Kukesi stations display a verylight decreasing trend.
Natio
nal c
ircum
stan
ces

35
3. NATURAL RESOURCES
3.1 Water resources
3.1.1 Surface water
The area surrounding Albania has relatively abundant fresh water resources. Seven main riversrun from east to west in Albania. The contribution of rivers discharge into the Adriatic sea is verylarge (95%), compared to the discharge into Ionian sea (5%). The total volume of water flow is39,220 x 106 m3/year. There are two characteristic periods in the year, in terms of the water flow:the wet period, (October - May) and the dry one (June - September). 86% of the annual water flowis discharged during the wet period and 8% during the dry one. June is the transition period,accounting for 6% of the annual water flow. The following table represents long term runoffvalues for all the rivers discharge into the seas.
Source: Institute of Hydrometeorology
Tab. I.1 Long term runoff for all rivers discharged into seas
3.1.2 Ground water
Ground water in Albania is present in different sorts of rocks of different ages, from Palaezonic toQuarternary age. It is a very important resource because it is the only source for drinking water.Ground water is subject to climatic, morphological, hydrological, geographical factors and theinfluence of human activity. The most important factor, on which groundwater levels depend, isprecipitation.
The drinking water supply is provided by using underground resources extracted by forced flow.The networks of drinking water provide water not only for domestic use but also for industrialactivities.
3.1.3 Marine water
Albanian coast is faced by the Adriatic and Ionain seas. Monthly variation in sea level is causedby non uniform influences on the hydrometeorological factors.The highest levels are observedduring November - December because strong southern winds present at this time bring aboutelevation of the seal level. The lowest levels are observed during July - August which is thequietest period of the year.
Of great impact to sea level, are the extremes caused by strong winds blowing from sea to landand vice versa, especially when the strong southern winds are active. They have great speedand long duration. The wave altitude varies from the minimum value of - 60 cm to the maximumone of +175 cm.
The temperatures of the seawater are mainly determined by the solar radiation, but it is alsosubject to the influence of fresh water, winds, marine currents, waves etc. The highest tempera-tures are observed during July - August, when the solar radiation is at its maximum, whileminimal temperatures are observed in February.Na
tiona
l circ
umst
ance
s
36
3.2 Forestry and land use change
The forests in Albania have always been harvested for wood and non wood products as well asto profit from their functions and without thinking up to nowadays on their role towards CO2emissions balance in our earth. Forest harvesting in Albania has begun in ancient times (byIllyrians, Romans and Greeks). Due to over cutting and deforestation, too many forests havealready disappeared. The names of some places, such as Shkozet (hornbeam forest), Terpan(forest place), Frasher (ash tree forest) or Orikum (port of wood), give evidence that forests hadcovered those places.
Mainly the Italian companies conducted the harvesting in the first half of this century. Deforesta-tion and planting of the considerable areas with oranges, olives, fruit tree, agricultural crops, etc.,in all districts, was established during the second half of this century.
The Albanian forests covers 36% of the territory. They consist of the high stem forests (45.7%)and coppice (54.3%).The single species forests occupy 72.3 % and the mixed species forests27.7 %. According to their functions forests may be classified as production forests (86.0 %) andprotection forests (14.0 %). Also, one may distinguish 91.2% natural forests and 8.8% man madeforests or plantations.
About 83% of forest area is covered by semi natural forests originating from natural regenera-tion, conserving the main species composition. Also there are around 8.2% or 84,841 ha of virgin/primeval forests, mainly located in the northern part of Albania. The rest (8.8 %) is covered byman made forests, an area that has been increasing up to 1990 and after that it was suspendeddue to lack of investments.
The forests in Albania play the production and protection role, to meet the needs of consumersfor logs (wood industry, construction, etc.), and firewood and to perform other functions (erosioncontrol, biodiversity conservation, relax, tourism, hunting, sports, etc.). The coastal forests per-form even a protective function, preventing the salty sea winds from penetrating inland.
In the late of 50’s, the plantations with Mediterranean pines (halepp pine, stone pine, seasidepine), and the man made forest massifes like those of Krasta and Mengel of Elbasani, the"Partizani" mountain of Berati, Krasta of Kruja and Miloti, ”Large” mountain and Libohova hills ofGjirokastra, moutain of Saranda, the hills of Lezha, mountain of Taraboshi and Lodertunda hillsof Shkodra, etc., were planted on lime stone, sandy and clay terns. Also, along the coastal zonea long shelterbelt was established, to prevent the salty sea winds. While, on the ultrabazic limestone and clay terns, starting from the year 1955, the man made forests massive plantations ofblack pine are established as the hills of Puka and Fushe-Arrez, the hills of Morava-Korce, etc..
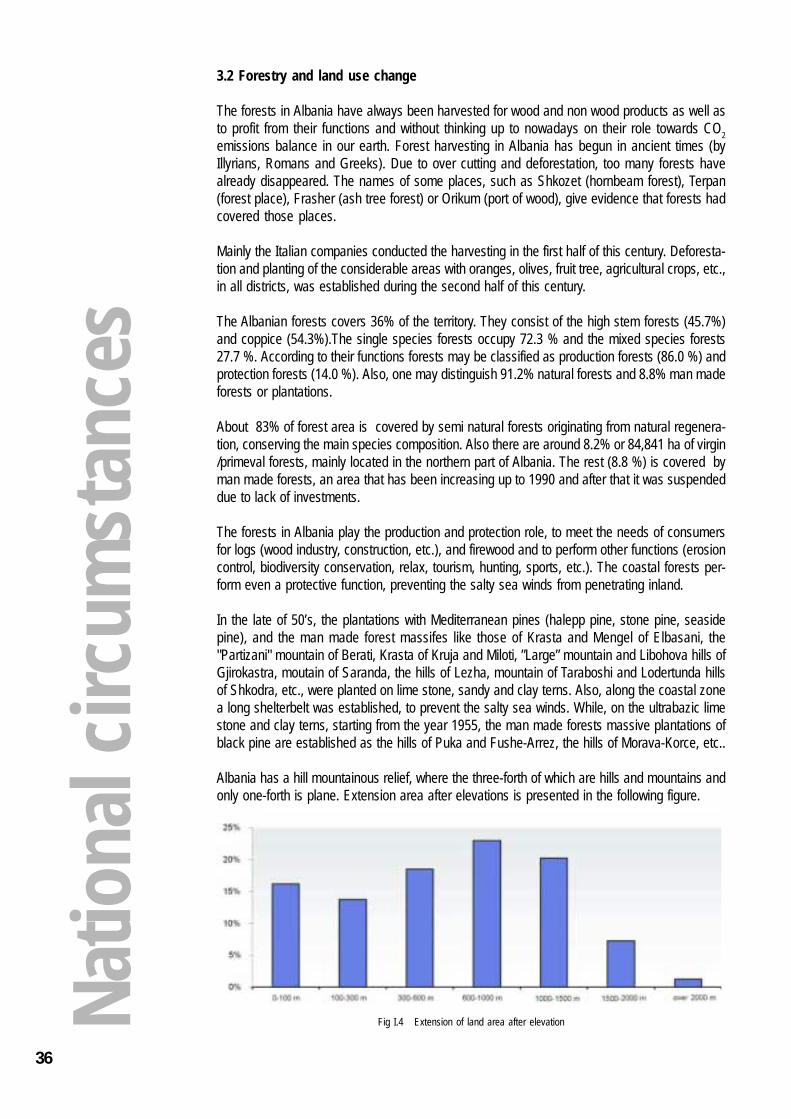
Albania has a hill mountainous relief, where the three-forth of which are hills and mountains andonly one-forth is plane. Extension area after elevations is presented in the following figure.
Fig I.4 Extension of land area after elevationNatio
nal c
ircum
stan
ces

37
The shares of the land covers in the country for more than 40 years period, are as follows:
Source: Ministry of Agriculture and FoodTab. I.2 Structure of land cover [‘000 ha]
During the last 50 years the following phenomena are noticed :
♦ The arable land up to 1990, has increased and after that decreased, reaching an areaof approximately 120,000 ha abandoned arable land. Farmers have refused the abandonedarable land as unappropriate land to be cultivated with crops;
♦ The share of forests has decreased in the past 50 years due to the deforestation processaiming at having more arable land, much less reforestation and due to changes on forestdefinition (much more forest area is included in pastures);
♦ The pasture area has decreased up to 1990 and after this year it has increased;♦ The other area has decreasied until 1990 by drainage of the inland water area and on
the other hand it has increased by construction of artificial lakes used for irrigation orfor energy generation purposes. The drying of a considerable inland water area hasincreased organic soils with considerable CO2 reserves.
The forest and pasture areas compose over 50% of the total area of country. At present, theaverage productivity of forests is about 81 m3 / ha (compared to 82 m3 / ha that has been in 1982,with a 10 years deficit of 1,830,000 m3). The high stem forests have a productivity of 139 m3/ ha,coppice 35 m3/ ha and shrubs 29 m3/ ha, broadleaves high stem forests 158 m3 / ha and conifer-ous 108 m3 / ha.
Although Albania has extensive forests, in the mountainous northeast, where they cover nearlyhalf the territory, 30% have been declared damaged by illegal cuttings during the past ten years.The damages caused by burning and windstorms in forest species is another phenomenonwhich shows a variation. There is an increase in 1994 referring to 1980, followed by a decreasein 1995 and an increase in 1996. The average damaged surface during 1990 -1996 accountsfor 136.7 thousand ha / year. The damage caused by burning and windstorms is different. So, thevolume of wood harvested from burning is increased while that from windstorm fluctuates.
4. ECONOMIC PROFILE AND SECTORS
Between 1944 and 1991, Albania's Government was controlled by the Communist Party, knownmostly known as Albanian Party of Labor. During this period, the state controlled the economicactivity. The private ownership and private enterprise were absolutely forbidden. The communistregime led Albania into deeper isolation.
Towards the end of 80’s political upheavals swept across Central and Eastern Europe. Facingmounting political pressure, the Albania’s Government restored religious and travel freedomand legalized opposition parties. The year 1992 for Albania was considered the start of transitionfrom a centralized economy to a market one. The economic development programs had a veryclear stabilizing nature and were imposed due to the deep crisis that was inherited by theprevious system. Until 1996, the achievements were positive and this experience was consid-ered as positive even by the international financial institutions. Guided by the International Mon-etary Fund and the World Bank, Albania became a model in the Balkan for progress in economicNa
tiona
l circ
umst
ance
s
38
reform. Privatization including vouchers for the population to buy a share in the assets beingdisposed of the growth of small business and a recession for state enterprises, resulted by 1996in 75% of GDP being generated by the private sector. Rapid growth rates (9% per year during1993-1996) seemed to confirm the success of the reforms.
However, apart from the growth of farm output following privatization, the achievements wereretrospectively superficial. The financial sector remained undeveloped, and the apparent rise inliving standards largely depended on remittances from foreign workers, large-scale smugglingand money laundering, as well as illusory, short-term profits from "pyramid" investment schemes.Many people invested all their savings in the schemes and also sold their homes to raise furthercash, generating a collapse which began at the end of 1996.
After the collapse the Government aimed at acceleration of banking sector reform and privatizationand shifting to the activity of small businesses from trade to production, thereby helping to reducethe high levels of unemployment. The initial impetus for economic growth came first fromagriculture and then from services, stimulated partly by domestic demand financed by remit-tances from abroad. Manufacturing is being sustained by processing for abroad, but industrygenerally is lagging behind due to the obsolete legacy of communist period. A recovery in miningis being achieved by granting concessions to foreign firms for non ferrous metal ores and oil,exporting products for which world markets are likely to remain strong.
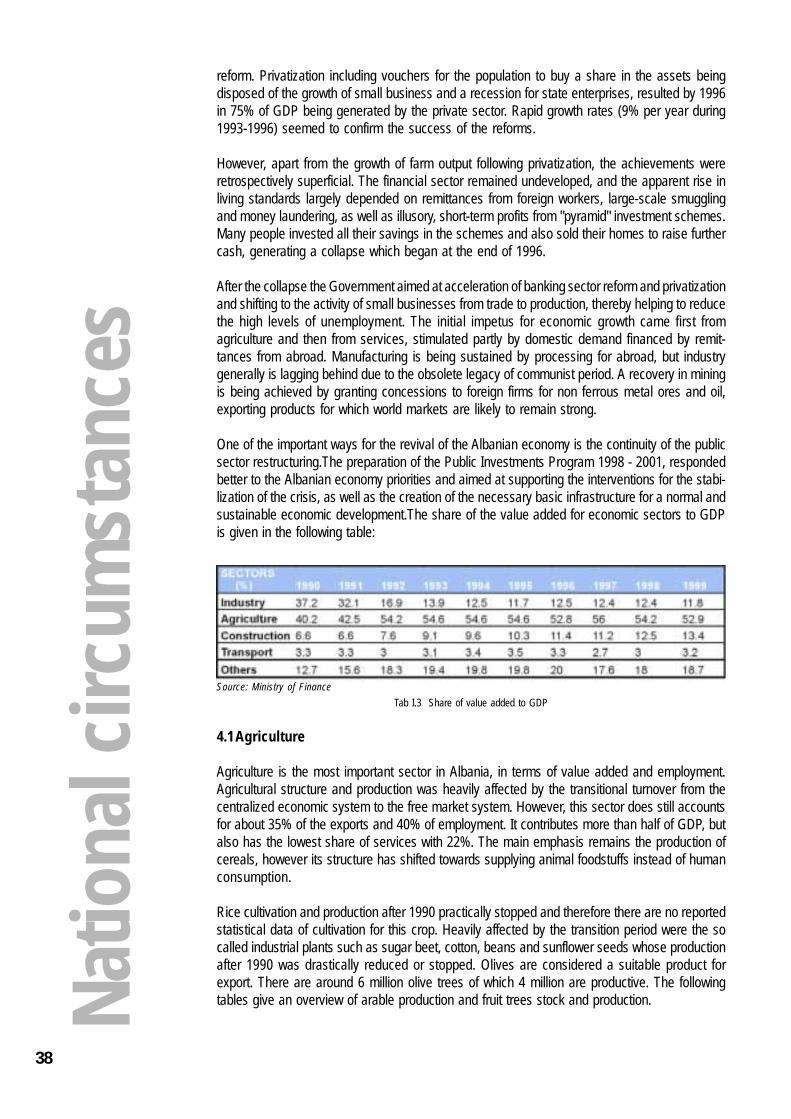
One of the important ways for the revival of the Albanian economy is the continuity of the publicsector restructuring.The preparation of the Public Investments Program 1998 - 2001, respondedbetter to the Albanian economy priorities and aimed at supporting the interventions for the stabi-lization of the crisis, as well as the creation of the necessary basic infrastructure for a normal andsustainable economic development.The share of the value added for economic sectors to GDPis given in the following table:
Source: Ministry of FinanceTab I.3 Share of value added to GDP
4.1 Agriculture
Agriculture is the most important sector in Albania, in terms of value added and employment.Agricultural structure and production was heavily affected by the transitional turnover from thecentralized economic system to the free market system. However, this sector does still accountsfor about 35% of the exports and 40% of employment. It contributes more than half of GDP, butalso has the lowest share of services with 22%. The main emphasis remains the production ofcereals, however its structure has shifted towards supplying animal foodstuffs instead of humanconsumption.
Rice cultivation and production after 1990 practically stopped and therefore there are no reportedstatistical data of cultivation for this crop. Heavily affected by the transition period were the socalled industrial plants such as sugar beet, cotton, beans and sunflower seeds whose productionafter 1990 was drastically reduced or stopped. Olives are considered a suitable product forexport. There are around 6 million olive trees of which 4 million are productive. The followingtables give an overview of arable production and fruit trees stock and production.Na
tiona
l circ
umst
ance
s

39
Source: INSTATTab.I.5 Fruit tree stock and production
Particularly after 1992, the agricultural sector was heavily affected by input and foreign ex-change shortages, social upheavals linked to the privatization of cooperative land and assetsthroughout the country and disruptions caused by the absence of an alternative mechanism toreplace the collapsing centralized planning system. Social and economic chaos led to rapidlyfalling standards of living for the vast majority of the population, but especially in poor rural areas.
4.1.1 Livestock
Livestock constitutes more than half of the total value of agricultural production. Although devel-opment of animal husbandry has not been encouraged, the number of cattle and of small rumi-nants has increased rapidly. The anticipated continuous increase can create problems for theenvironment in the future, because the density of livestock per hectare of land is already veryhigh. The high density of small ruminants in pastures and forests causes similar problems. Anoverview of the state of the livestock, their number and production are given in the followingtables:
SOURCE: INSTATTab. I.4 Arable production
Source: INSTATTab.I.6 Number of livestock [ '000 heads]Na
tiona
l circ
umst
ance
s ‘

40
Source: INSTATTab I.7 Production ('000 tones, live yield unless otherwise indicated)
4.2 Mining
Albania is rich in mineral resources, especially chromium, copper and iron-nickel. Before 1990,the mining sector accounted for a substantial share of export earnings, and Albania was theworld's third largest producer of chrome ore. Albania is the one of countries in Europe withsignificant chrome reserves per capita. Production collapsed during the periods of insurgencyin 1991-1992 and 1997.
The mining industry's workforce was halved to around 10,000 following the earlier outbreak, andthe neglecting of mines that were already in poor conditions has resulted in further damages.Chrome mining and semi processing is based in the Dibra and Mat districts, copper in Mirditeand Puke, iron-nickel in Pogradec, nickel - silicate and coal in Korce, and phosphorite inTepelene.
Like most of Albania's industry, the mining sector has been handicapped by obsolete equipmentand technology and a lack of management expertise, as well as the disruption of production andsupply lines caused by civil unrest. Production methods are labor intensive and referring to EUstandards, often dangerous. Since the mid 90's, successive governments have laid their hopeson foreign assistance to help turning around the mines. Oil extraction is located in Fier, Lushnjeand Kucove districts. The largest refinery is located in Ballsh district. Albpetrol, the former stateoil company is undertaking a loan of USD million 250 investment program to rehabilitate exist-ing oil wells and to explore new offshore wells. The following table provides data on mineralsoutputs:
Source: INSTATTab. I.8 Minerals production, state sector ('000 tons unless otherwise indicated)
4.3 Energy
4.3.1 Energy consumption
From a historical peak of 3.3 MTOE in 1989, when all the Albania’s economy operated in its fullcapacity, the primary energy supply dropped by more than 50% or to 1.5 MTOE in 1992. Sincethen, the primary energy supply has remained relatively constant around the level of 1.6 -1.7MTOE. The most drastic effects are however, the structural changes that have taken place asregards the shares of energy sources on the supply side and the final energy consumption bysectors and fuels. The following figure shows the change in the structure and level of energyconsumption for all sectors of the country economy during the period 1990 - 1999.Na
tiona
l circ
umst
ance
s

41
Source: National Agency of Energy, 2000
Fig. I.5 Final energy consumption 1990-1999. [‘ 000 kTOE]
When focusing on the changes as regards the household’s use of energy, the findings of ahousehold energy survey2 are striking. The structure of the consumption has changed especiallyin the urban areas where electricity now accounts for 60% of total consumtion or twice as muchas fuel wood. In rural areas, the historic strong position of fuel wood is still prevailing, sincealmost 60% of total consumption is met by fuel wood and 30% only by electricity. The remainingconsumption is mainly met by LPG and kerosene.
Lack of other beneficiary energy alternatives and other supportive frameworks has led to a boomin the use of electricity for space heating. The governmental decisions for fiscal facilities of theliquefied gas are a right step to well orient the policy of energy resources prices. The traditionalway of heating only one room (typically by means of a stove) is rapidly changing into a completelynew situation, where more or less all rooms are being heated by means of electric radiators,heat pumps, fans, etc., most of which have a minimal economic effectiveness.
4.3.2 Energy supply
The energy sector has historically played an important role in the Albanian economy. Albaniawas largely self sufficient in energy resources and most by 1989 has been a net exporter ofelectricity and refinery oil by products. Albania was rich in energy resources like oil, gas, coal,fuel wood, peat, and hydro, which contribute in different ways to meet energy demands in thecountry. Inadequate technology, over used equipment and poor operating performance haveresulted in increasing costs and declining yields in coal, oil and gas production and led tofrequent disruptions of electricity supply.
The figure I.6 presents the primary energy sources shares for the period 1975 - 1995. It resultsthat the share of fuel wood has been relatively constant (approximately 2.95%), that of coal hasbeen increasing from 12.23% in 1975 to 32.4% in 1989, while afterwards it started to drasticallydecline to 10% in 1993. The share of natural and associated gas has been increasing from9.4% in 1975 up to 26.9% in 1982, before the dramatic blowout of Krahas (Ballsh district) well inthe subsequent year, which practically destroyed this industry and interrelated industries. As forthe oil and its derivatives, their contribution has been decreasing from 72% in 1975 to 40.53% in1982. Afterwards, during 1982 - 1990, their contribution has been stable with 47% with a ten-dency for increasing in the subsequent years. As for the hydro power, its contribution has beencontinuously increasing from 3.27% in 1975 to 14% in 1990.2 All figures and estimates are provided by a Household Energy Survey undertaken by the National Committee of Energyduring October - November 1997. The survey comprised visiting and interviewing more than 1,600 families in three cities,(Tirana, Shkoder, Korca) and three villages (Gosa, Maqellara and Borshi)Na
tiona
l circ
umst
ance
s

42
Fig.I.6 Primary energy sources share, [%]
Ultimate recoverable oil resources are estimated to be as great as 450 Mt, out of which 340 Mtin sandstone deposits and 110 Mt in limestone deposits. Proven oil reserves are estimated asabout 29 Mt. The total capacity of the oil refineries is 2.5 Mt per year, which is spread out amongfour refineries placed in the traditional places of the crude oil production (Cerriku, Fieri, KucovaBallshi). Cerriku and Kucova refineries are closed after 1990, while Fieri refinery is working withthe 20% of its capacity.
By the beginning of 1991, not with standing the slowdown in economic activity, Albania becamea net importer of light distillates and this trend seems likely to be reinforced in the future with theforeseen vigorous growth of the transport sector.
Coal is one of Albania's most important energy resources. Total proven reserves based ongeological data have been variously estimated between 350 and 720 Mt.
The total hydro power capacity surveyed in detail to date, amounts to about 2,850 MW with anannual generation potential of about 11.5 TWh.
Renewable energy sources in the form of hydro power and forest biomass already account for avery large share of Albania's total domestic primary energy production: 36% in 1989, a year whenthe economy was at its full operation capacity.
The country's needs for electricity are met mainly by the hydro power plants and in a small scale,by the thermo power plants. The hydro power plants provides about 94% of the produced elec-tricity, while the rest is produced by thermo power plants that use residual fuel oil as fuel and inspecial cases use steam coal. Except of the thermo power plant in Fier, which actually operatesthe others are closed down. The electricity produced by these thermo power plants reached10,1% of the overall production in 1990, 6% in 1996, 3% in 1997, while in 1998 the productionwas only 1,6%. The total production capacity is 1,662 MW, where hydro power plants have acapacity of 1,444 MW.
Drought in the last years reduced water levels for power generation (the Drini river, supplying95% of hydro power, was at its lowest level for the last 30 years) to the point of severe and frequentpower cuts last years.
A clear vision on the electricity supply and consumption in Albania is given in table I.9.Natio
nal c
ircum
stan
ces Source: National Agency of Energy, 2000

43
Source: Ministry of Industry & Energy
Tab.I.9 Data on the electricity supply and consumption; [GWh]
4.4 Transport
4.4.1 Road transport
Actually, the largest part of transport of goods and passengers is realized by the road transport.The country's 18,000 km of roads (only 6,000 km of which are paved) were constructed accord-ing to the engineering standards of the 1930 or earlier and some sections, such as the road fromDurres to Kukes were damaged during the Kosovo conflict, due to heavy usage by NATO forces.
A rapid expansion in private car ownership, which had been prohibited in the communist era,had already placed great pressure on the road network. A direct consequence of the ratherimpetuous development of this sector is the large amount of various kinds of wastes (metallicskeletons, batteries, used car oil, etc.) generated every year and the increase on national scaleof the number of accidents caused by vehicles.
On the other hand, a negative consequence that should not be neglected is the engine power ofthe vehicles imported recently. There is a preference that among various types of imported cars,the first place regarding the quantity is occupied by the vehicles of high engine power (from1,500 to 2,500 cm3), which means that they are vehicles, which consume a relatively largeamount of fuels, and consequently they emit in the air larger amounts of pollutants.
Since the end of the war in Kosovo, NATO has rebuilt the roads that it used to supply its operationin the province, and western governments have offered funding for several other road construc-tion projects.
Natio
nal c
ircum
stan
ces
Source : INSTATFig.I.7 Road transport stock development

44
4.4.2 Railway transport
There are 447 km of mainline railway and 230 km of branch line in Albania. The rail networkdeteriorated greatly in the 1990, particularly in the early part of the decade, when the track andsignaling wires were plundered for scrap.
Although the antiquated rolling stock is being updated with coaches donated by Italy and Austria,the poor quality of the track has restricted speeds to 40 km/h for passenger trains and 25 km/hfor freight trains. However, following an assessment of the commercial viability of the railwaynetwork in 1998, the Government of Albania rejected the idea of closing it down and decidedinstead to rehabilitate and extend it. Albania's rail link with the European network, via Montenegro,has reopened.
4.4.3 Marine transport
There are two major sea ports, both being refurbished. The largest of these ports is at Durres,which has roll-on / roll-off ferry facilities. The smallest one, in Vlore, is a ferry and naval port. Theport of Saranda in the far south (passenger and light-freight services to Greece and Italy) is beingconstructed with UN and Italian funds. The port of Shengjin in the north, has not yet beenimproved.
4.4.4 Air transport
Until the Kosovo air strikes, the only commercial airport was “Mother Teresa”, located in Rinas,near Tirana. It was partly rebuilt by funding provided from NATO, SIEMENS, and is being com-pleted with US funding. Its access roads have also been improved according to internationalparameters.
4.5 Industry
Since 1994, the industry has accounted for a steady 12% of GDP. Albanian's historical depen-dence on mineral extraction is owed to substantial commercially exploitable reserves. Chrome,copper, and nickel deposits have long been opened up, but equipment and mining methods arenow antiquated and many workings have fallen into desuetude.
During the communist era, the "proletarian" policy assured each of the 26 administrative districtssome development. All of them had food processing industries and most of them producedbuilding materials. Districts with forests also developed timber and wood products industries.However, the bulk of industrial output came from six main districts that contained large plants,some of them capable of exporting. Tirana, which contributed one-third of Albania's industrialoutput, had spare parts (notably for tractors), textiles and the country's sole pharmaceuticalplant. Elbasan had a large chemical-metallurgical complex. Durres had mechanical and elec-trical engineering, small shipbuilding and chemical industries. Shkoder had copper wire andcables industry. Vlore produced electric light bulbs and chemicals while Korce was a centre fortextiles and garment making. Among smaller locations currently in production, Kruje has ce-ment and fertilizer production, Pogradec knitwear, Berat textiles and Gjirokaster footwear. Theproduct mix greatly altered during the 90’s.
The equipment and manufacturing plants inherited at the start of the decade had mostly beensupplied firstly by Soviet Union and then by People’s Republic of China, little of which provedinternationally competitive, when Albania was opened to world markets.
Subcontracting for abroad has given new life to food, beverage and leather goods. Aggregategrowth has been positive since its falling after the disorders of 1997, and was 5% in 2000.Na
tiona
l circ
umst
ance
s

45
4.6 Tourism
Tourism in Albania is only at a very early stage of development. However, Albania exhibits consid-erable potential for the development of tourism, because of its extensive coastline, the interest-ing scenery of Albanian lakes and mountain regions and the generally perfect countryside.
Tourism offers significant, although as yet largely unexploited opportunities for development. Itsattractions include the largely unspoiled coastline, parts of which would be suitable for beachtourism, the rugged mountains and many antiquities, in Butrint, Apollonia and Durres. All buthardies, tourists have been deterred so far by the poor tourism infrastructure.
Tirana has many modern hotels, which have been refurbished with business travelers in mind.There are hotels of different standards there in Durres and along the Adriatic coast. During thelast years substantial investment schemes for tourist facilities are launched at all tourist areas.
4.7 Fisheries
Fishing, as one significant activity in the coastal and inland waters, constitutes an importantsource of income and food for the inhabitants of the area and the population in general.
According to the data sources we can not speak about over fishing in our country, since there isno sufficient information on this issue, but there is uncontrolled fishing, which greatly damagesthe fish reserves.
Fishing is mainly organized in the continental shelf, which in the Adriatic sea extends to 25 milesand in Ionian sea to 2-3 miles. In the north of the country the shelf that is more suitable for trawlfishing to the isobar 300-400 m, prevails an important area for fishing. In the south, the depth of200 m starts very close to the coast and has a lot of rocks along it, which makes the trawl fishingdifficult.
The main species for fishing are sardines, anchovy, mullet, wrasse and some species of crusta-ceans. The fishing fleet comprises approximately of 155 boats, that are concentrated in fourmain ports: Durrës, Shëngjin, Vlora and Saranda.
5. RESOURCES AND INFRASTRUCTURE
5.1 Population profile
Actually the Albanian population counts 3,4 million inhabitants (without those who lives or areseeking job abroad). The Albanian population is largely ethnically homogenous. The largestminority are Greeks with around 40,000. There are also populations of Vlachs, as well as signifi-cant numbers of Roma (gypsies) and Slav Macedonians.
Although Albania remains a largely agrarian economy (over 55% of the population still live inrural areas and more than half of GDP is generated by agriculture), in the last half century itsdemography has been transformed.
During 1991-1998, Albania experienced demographic changes dominated by the negative rateof population increase, migration from the villages towards the towns and from the remote areastowards the capital, the massive emigration and the decrease of births.
The reurbanization and the overpopulation are the main existing problems at local level inAlbania. The emigration of Albanians abroad is higher than the other countries of the Centraland Eastern Europe. A clear vision on the share of population is given in the following table:Na
tiona
l circ
umst
ance
s

46
Source: INSTATTab. I.10 Annual average population [‘000]
The immediate change of the political structure in Albania in the beginning of the 90’s, broughtabout a great change of the social-economic structure of the country. Many people startedleaving the village, aiming at finding work in the city. The free and uncontrolled movement of thepopulation has had an impact on the change of the proportion between the urban and ruralpopulation.
The phenomenon of the urbanization growth, though it is a natural tendency, is presented verycontradictory by Albania. Under the conditions of a democratic society, people have the right andfreedom of movement, but on the other hand, there is also impossibility for facing these move-ments economically and socially. Thus, the phenomenon of reurbanization or overpopulation isthe main problem faced by the local authorities today in Albania.
The massive migration and the redistribution of the population changed the structure of thepopulation at working age, changing the balance in the job market, often by increasing theunemployment. But at the same time, the internal migration brought an urbanization or over-population of several regions of the country, which caused big social, economic and environ-mental changes of these areas. The population migration has resulted to be very disorganizedand uncontrolled, concerning not only the real movement level but also the calculation of thenew living areas. An outcome of the lack of control has been the widespread of abusive con-struction of new buildings, in most of the cases within the towns or in the suburbs, increasingtheir surface, which of course is not supported by respective infrastructure.
5.2 Public health
The universal provision of healthcare was a state obligation under communism. In 80’s, therewere about two doctors or dentists and four hospital beds for every 1,000 inhabitants. However,this policy denied doctors access to adequate medical equipment or modern pharmaceuticals.
The healthcare system deteriorated after the fall of communism, mainly owing to funding pres-sures. The number of functioning healthcare facilities fell from 129 per 10,000 inhabitants in1990 to a low of 85 per 1,000 in 1994, and the number of hospital beds declined from 58 to 30per 10,000 inhabitants. External assistance from the WHO and the UNICEF has improvedhealth facilities and thus it is reflected in infant mortality decrease to 26 per 1,000 live births byNa
tiona
l circ
umst
ance
s

47 3 A revised National Action Plan is adopted by the Government of Albania in early 2002.
1999, after rising from 31 in 1985 to 43 in 1994. Life expectancy estimated by the United Nations,has raised from 71.6 years in 1990 to 73.7 in 2000, still some way below the average for southernEurope (77.0).
Nearly all the population has access to a reduced water supply, accompanied with sanitationproblems.The drainage of the marshes has eliminated malaria. Tuberculosis and endemicsyphilis have also been eradicated. Deaths from cancer and AIDS are the lowest in Europe.Deaths from road accidents are high, because cars are poorly maintained, driving standards arelow, and the roads are in a bad condition.
There is also a tendency for people to travel abroad for diagnosis and treatment, including forailments that could be treated here given the professional level of Albanian doctors.
Health service is structured in all levels: primary (which mainly belongs to ambulatory healthservice), secondary (with hospital in each city), and thirdly (University Hospital Center "MotherTeresa" of Tirana).
Source: Ministry of HealthTab.I.11 Patient health care indicators
5.3 Education
Education is free and compulsory for 6 -14 years old and free until the age of 18. However,whereas in 1990 there was 93% enrolment of the 6-18 age group, the rate is now little above 80%for both, girls and boys. High rates of non attendance and drop out are attributable to poormaintenance of school buildings and equipment, the emigration of teachers and the pressureon the two thirds of school age children, who live in rural areas to work on private holdings, whereonce the collective farm put them into school. Schools located in urban areas are over crowdedand work double shifts.
Private education is still rare. Schools teaching in Greek or Macedonian have been opened. Ahigh rate of literacy has been inherited and Albania is very close to the European average, at 85%(identically the same for men and women).
Tirana University and Polytechnic University are the largest high education institutions in Tirana.Also in other districts of Albania there are about 10 more high education institutions. Graduateshave been particularly prone to emigrate, according to a recent study that found that about 40%of Albanian graduates have left the country in the past 10 years.
6. ENVIRONMENT
6.1 Environmental legislation
In the face of the formidable social and economic challenges, Albania has begun to develop aframework for addressing the environmental problems that have arisen during last decade.
One of the priorities of the Environmental Strategy and NEAP3 has been the establishment of therespective legal framework, it as an important instrument for the application of the environmentalNa
tiona
l circ
umst
ance
s

48
policies in the country. From this viewpoint, this issue has had the serious commitment of theGovernment and the Assembly of the Republic of Albania. In the period 1997-1998, major legaldocuments such as the Constitution and the amendments of the law on "Environmental Protec-tion" were developed.
The adoption of the Constitution of the Republic of Albania in November 1998, represents themost important legislative step in the realization of an environmental legal framework. Specificarticles of the Constitution, sanction the aims of the state for a "...healthy and ecologically suit-able environment for the present and future generations...", for the "...rational exploitation offorests, waters, pastures as well as other natural resources, based on the sustainable develop-ment principle...", as well as the right of everyone "...to be informed on the environmental situationand its protection..."
The law No. 8364, dated 02.07.1998, amended the basic law on the "Environmental Protection"of 1993. This law addresses the full spectrum of the environmental policy issues. It also requiresthe publication of the State of the Environment Report (SoE). The first official SoE report waspublished in 1992. Up to 2002, five SoE reports have been published.
During 1998-1999, other laws and by-laws were adopted to assist in a more qualified work for theenvironmental protection and administration. Worth mentioning is the law on "Urban Planning"(No. 8249, dated. 7.10.1997, which amended the law of 1993) and the respective regulation toenforce this law. Other important decisions, approved by the Council of Ministers, cover specificissues such as "The obligatory collection and the depositing of abandoned vehicles (No. 776,dated. 08.12.1998); decision on "The approval of the Waste Management Plan" that creates realpremises for the treatment of urban waste, according to the contemporary technologies in 6main cities of Albania, etc.
6.1.1 Major environmental laws of Albania
♦ Law on land and its distribution (1991);♦ Law on forests (1992);♦ Law on city planning (1993, amended in 1998);♦ Law on environmental protection (1993, amended in 1998);♦ Law on forest revenue (1993);♦ Law on plant protection (1993);♦ Law on the development of areas of tourism priority (1993);♦ Law on the protection of medicinal and taniferous plants (1993);♦ Law on construction, administration, maintenance, and operation of water and drainage
systems (1994);♦ Law on hunting and wildlife protection (1994);♦ Law on mining (1994);♦ Law on fishing and aquaculture (1995);♦ Law on pastures and meadows (1995);♦ Law on protection by radioactive radiation (1995);♦ Law on the protection of fruit trees (1995);♦ Law on public waste removal (1996);♦ Law on water resources (1996);♦ Law on water supply and sanitation regulation (1996);
6.2 Institutional framework
Until 1998, the highest governmental body responsible for the environmental policy in the coun-try was the Committee of Environmental Protection (CEP), as part of the Ministry of Health andNa
tiona
l circ
umst
ance
s

49
Environment. The inclusion of CEP within the structure of the Ministry of Health was not inconformity with the interministerial nature of its fundamental functions.
The establishment of the National Environmental Agency (NEA) in 1998, as a high state bodydepending directly on the Council of Ministers, represents an important step in the institutionalstrengthening and process and consolidation of the governmental structure, responsible of theenvironmental administration as well. This step was accompanied by other essential steps,which shaped the structure of NEA and determined the internal regulations of the activity of theAgency and its components. These measures gave way to the strengthening of the authority androle of the Agency, and created the conditions for a normal development of its activity, untilOctober 2001, when the Ministry of Environment (MoE) was created.
The MoE's principal functions are to:
♦ Define the nation's environmental strategy;♦ Develop and implement nationwide environmental protection efforts, including steps to pro
tect environmental media (e.g., land, air, water, biodiversity);♦ Approve admissible limits for gaseous, solid and radioactive pollutants discharged into
water, air and soil as well as harmful and toxic substances; and♦ Coordinate activities with other governmental institutions responsible for environmental
protection;
Today, despite the MoE's efforts, the pace of environmental protection and improvement re-mains slow. Revenues from fines and licensing fees are inadequate to fund important environ-mental investments. Plans to develop "eco-tax" were considered but not enacted.
Several other governmental entities have significant environmental policy roles: Ministry of Agri-culture and Food, Ministry of Transport and Telecommunications, Ministry of Industry and En-ergy, Ministry of Health, National Water Council, Public Health Institute, Institute of Hydrometeo-rology Institute, Council on Territorial Adjustment and Institute of Soil Research.
Environmental monitoring is a weak link in Albania's environmental management chain. Re-sponsibility of monitoring is spread across several governmental institutions. A result of thisdispersion of responsibility is that data collection is often redundant and lacking in standardmethodology.
6.3 Environmental situation
6.3.1 Waste
The absence of waste management is quite evident and extremely serious problem in Albania.After 90's, the country's production of solid waste grew significantly. A variety of imported productsentered the Albanian market, rapid population growth, urbanization and a boom in constructionput new significant stress on an already weak waste management system.
There are no properly managed dump sites or incinerators, no waste reduction targets and nomonitoring programs to date.
Actually in Albania the urban solid wastes are disposed in open dumps only. The industrial andhazardous waste management is a serious problem as well. In many cases these wastes arestored without adequate safeguards and monitoring systems. Industrial and urban waste watersare discharged directly into surface waters, without any treatment.Na
tiona
l circ
umst
ance
s
50
6.3.2 Water
Albania's urban water supply system is plagued by problems. In addition, infiltration from parallelsewer lines causes periodic cross contaminations of the waste supply. Monitoring is conductedfor some fifteen physical and chemical parameters. A National Water Strategy is drafted in 1996but not yet adopted by the Government.
6.3.3 Air
Historically, the major sources of air pollution have been industries involved with chromiumsmelting, copper, cast-iron, cement and steel metallurgy and thermo power plants. Since 1992,many of these industries were closed.
Today the major sources of air pollution are oil extraction and refining, mobile sources, districtheating plants, domestic heating, cement production and unregulated garbage burning.
The mobile sources are increasing their contribution to air pollution. In 1989, there was a totalnumber of 2,000 cars, in Albania. In 2000, there is a total of 120,000 cars nationwide. The fleetis generally old and uses leaded gas or diesel fuel. This rapid increase has lea to higherquantities of CO2, N2O, CH4, NOX, SO2, CO, and particulate matters. There is not any air monitor-ing system within the country.
6.3.4 Soil
Soil erosion is a serious concern in Albania. The country's mountainous topography and weatherpatterns are natural causes of erosion. Human activity (e.g dredging of rivers for constructionmaterials wood cutting, mismanagement of terraces, overgrazing,) is accelerating the problemand producing severe consequences. River dynamics are altered with negative impacts onwater quality and flow regime.
6.3.5 Biodiversity
The mountainous relief, the different geological straits and tips of soil, overlapping of CentralEurope with Mediterranean climate are the main factors for having such an ecosystem diversityand biodiversity (around 3,250 plant species live in Albania). Some of the 30% of the Europeanplant species, and 42% of the European mammals can be found in the country. Albania's varietyof wetlands, lagoons and large lakes also provide critical winter habitat for migratory birds.
Today Albania has one of the highest rates of biodiversity loss in Europe. Deforestation, soilserosion, uncontrolled land use, and pollution. All of these activities are rapidly destroying pre-cious resources. Unsustainable levels of hunting, fishing and grazing are also threatening diver-sity. 36% of the country 's vertebrate species are endangered or threatened. Efforts are made toestablish protected areas. 6% of the country is set aside for this purpose. Unfortunately, even thebiological integrity of these areas is compromised several times by illegal activities. Also, moni-toring of these zones is inadequate and management plans do not yet exist.
In 1999, a National Strategy on Biodiversity and a respective Action Plan was developed, underthe GEF financial assistance. The Government has adopted the plan and started the implemen-tation process.
6.4 Public awareness
There is a great need for improvement of environmental awareness in Albania. Given the country'seconomic hardships and civil disruptions, the attention has been focused on other concerns.The result today, however, is that Albanian citizens generally are not enough informed about theNa
tiona
l circ
umst
ance
s

51
risk of pollution, the relationship between the environment and public health, and the benefits ofa clean environment to the economy and society, as a whole.
An information center for environmental issues is created within MoE. The publication of theSoE reports and other informational tools has helped build understanding of the country's envi-ronmental challenges. Environmental education in the country today is poorly funded and is onlyreaching a limited number of young Albanians.
The growth of the Albanian's environmental NGO community is a promising development. Atpresent, however, the NGOs intend to be concentrated in Tirana. In several cases, they servemore as professional associations than as activist organizations. Environmental advocacy is nota firmly established approach.
Natio
nal c
ircum
stan
ces

52
53
1. METHODOLOGY --- 542. GHG EMISSIONS IN 1994 ---55
2.1 Direct GHG emissions --- 552.2 Indirect GHG emissions in 1994 --- 562.3 Main CO2 emissions indicators --- 56
3. GHG EMISSIONS FROM ECONOMIC SECTORS --- 573.1 Energy sector --- 573.2 Industrial processes --- 573.3 Agriculture --- 593.4 Land use change and forestry --- 603.5 Waste --- 603.6 Solvents --- 613.7 International bunkers --- 613.8 Total GHG emissions for Albania in 1994 --- 61
4. GHG EMISSIONS FROM ENERGY SECTOR FOR 1990-1994 --- 625. KEY SOURCES OF EMISSIONS --- 636. UNCERTAINTY ESTIMATION OF GHG INVENTORY IN 1994 --- 64
6.1 Data gaps --- 65
CHAPTER II
NATIONAL GREENHOUSE GASES (GHG)INVENTORY
II

54
In accordance with Article 4 of the United Nations Framework Convention on Climate Change,"...all Parties, taking into account their common but differentiated responsibilities and their spe-cific national and regional development priorities, objectives and circumstances, shall…develop,periodically update, publish and make available to the Conference of the Parties...national in-ventories of anthropogenic emissions by sources and removals by sinks of all greenhouse gasesnot controlled by the Montreal Protocol, using comparable methodologies to be agreed upon bythe Conference of the Parties."
The following chapter provides an inventory of greenhouse gases emissions and removals bysinks for Albania, developed for the base year -1994. With the purpose of revealing the dynam-ics of greenhouse gas emissions and removals by sinks, the calculations for period (1990-1994),are performed for energy sector only. The following greenhouse gases inventory is the first onefor Albania, developed in the framework of the GEF funded project titled: "Enabling Albania toprepare its First National Communication in response to its commitments to UNFCCC".
1. METHODOLOGY
The greenhouse gases inventory for Albania is developed according to the 1996 revised IPCCGuidelines. The national greenhouse gases inventory for Albania considers five main modulesof the 1996 revised IPCC Guidelines as energy, industrial processes, agriculture, waste, landuse change and forestry. Since IPCC does not provide a methodology for solvents, the estima-tions are based on CORINAIR methodology and other countries experiences. The basic equa-tion, used for the calculation of the emissions is:
Emissions = Σ (Activity data X Emission factor)
In general, the IPCC default emission factors for all economic sectors are used. In some cases,the original methodologies or methodologies slightly different from that of the IPCC, are applied(e.g., for the estimation of the CO2 absorption by fruit trees1, CO2 emissions from small industrialboilers2 and emissions from burning of fuel wood in household stoves3.
The national greenhouse gases inventory represents emission data for three gases of directgreenhouse effect such as CO2 (carbon dioxide), CH4 (methane) and N2O (nitrous oxide) aswell as for three other gases of indirect greenhouse effect such as CO (carbon monoxide), NOX(nitrogen oxides) and NMVOC (non methane volatile organic compounds). The last ones arenot greenhouse gases but indirectly contribute to the Global Warming Potental.
CO2 emissions released from energy and transport, are estimated by using of two approaches:Top-Down and Bottom-Up. According to the first approach, CO2 emissions are estimated foreach fuel type, based on the total national consumption4, and then the values are summarized(Top-Down). According to the second approach, emissions for each subsector and sourcecategory are estimated, and then emissions are also summarized (Bottom-Up).
The use of both approaches allowed us to judge on the fuel spectrum of the carbon dioxideemissions (Top-Down), and the distribution, according to the economic sectors (Bottom-Up).Since in both approaches, the default IPCC emission factors for each fuel type are used, we hadthe possibility of comparison between them. The final estimation shows that the differencebetween two approaches accounts for 3.01%. Also a very detailed analysis is performed forestimation of CO2 emissions released from other economic sectors like industry, land use changeand forestry.
1 Activity data are developed in this case.2 Emission factor is developed3 Emission factor is developed4Activity data on national consumption are taken from the national energy balance
Nat
iona
l GHG
inve
ntor
y

55
CH4 emissions are estimated for sources like energy and transport, industry, waste, land usechange and forestry and for agriculture.
N2O emissions are estimated for sources like fossil fuel combustion (coal, oil products andnatural gas).
Also, emissions of indirect greenhouse gases such as CO and NOx are calculated according tothe IPCC Methodology. NMVOC emissions are estimated not only for internal combustion en-gines but also for solvents, agriculture, land use change and forestry.
2. GHG EMISSIONS IN 1994
2.1 Direct GHG emissions
Albania’s anthropogenic total emissions for the base year 1994, account for 7,061.45 Gg of CO2equivalent. Figures II.1, II. 2,and II. 3 show total emissions respectively for each greenhouse gaslike CO2, CH4, N2O and figure II.4, shows total greenhouse gas emissions expressed in CO2equivalent.
The main source of CO2 emissions (Fig. II. 1) is energy sector with 62.95%, followed by land usechange and forestry with 32.73% and industrial processes with 4.30%. The main source of CH4emissions (Fig.II.2) is agriculture sector with 77.74%. Agriculture (Fig. II. 3) remains as the mainsource of N2O emissions as well, with 69.45%. Regarding the CO2 equivalent emissions,(Fig. II.4) the shares of sources are energy with 44.00%, agriculture with 27.12%, and land usechange and forestry with 21.60%.
Fig.II.1 CO2 emissions from economic Fig.II.2 CH4 emissions from economic sectors sectors [4611.33 Gg], 1994 [102.52 Gg], 1994
Fig.II.3 N2O emissions from economic sectors Fig.II.4 CO2 eqv., emissions from economic [0.9581 Gg], 1994 sectors [7061.45 Gg], 1994
The presented data indicate that for the base year - 1994, CO2 was the main greenhouse gas inAlbania, with a share of 65.33%. The shares of CH4 and N2O are respectively 30.49 % and4.18 %. The shares of each gas are shown in the figure II.5 and table II.1. N
atio
nal G
HG in
vent
ory
LUCF
LUCF
LUCFLUCF

56
Fig.II.5 CO2 eqv., emissions from each GHG. [7,061.45 Gg], 1994
Tab.II.1 The anthropogenic GHG emissions in Albania,1994; [Gg]
National greenhouse gas emissions, per source categories (economic sectors) for the baseyear -1994 are presented also in table II. 2 as follows:
Tab.II.2 Anthropogenic GHG emissions from source categories, 1994, [Gg]
2.2 Indirect greenhouse gas emissions in 1994
The national greenhouse gases inventory includes also the emissions of indirect greenhousegase: CO, NOX and NMVOC. It is evident from the following figures that energy sector is the mainsource of three indirect greenhouse gas emissions, NOX(18.01 Gg), CO (36.40 Gg) and NMVOC(30.265Gg).
Fig.II.6 NOS emissions from all economic Fig.II.7 CO emissions from all economic sectors [18.01 Gg], 1994 sectors [136.40 Gg], 1994
Nat
iona
l GHG
inve
ntor
y
Fig.II.8 NMVOC emissions from all economic sectors [30.265 Gg], 1994

57
2.3 Main CO2 emissions indicators
CO2 emission indicators are of primary importance in the debate of Global Warming Potential(GWP) and may signal a significant change in the efforts, of all countries despite their economicdevelopment. Figures II.9 and II.10 show respectively the position of Albania among a number ofdifferent countries in terms of CO2 emissions per capita and CO2 emissions per GDP for thebase year-1994
Source: IAE
Fig.II. 9 CO2 emissions per capita for selected Fig.II.10 CO2 emissions per GDP for selected countries [ton CO2/ capita], 1994 countries [ton / Mil.USD], 1994
CO2 emissions per capita in Albania are around 4-5 times lower than the total average, due tothe following explanations:
♦ Energy consumption per capita in Albania is the lowest between the selected countries;♦ Electricity generation is based almost on hydro sources (94% of electricity is generated by
hydro power plants);♦ Different energy services in residential sector like space heating, domestic hot water, and
cooking are based almost in electricity (residential sector consumes 60% of total electricity);♦ Industry sector went down in 1994, starting from 1990 in terms of energy consumption;
CO2 emissions per GDP in Albania are around 10-12 times higher than the average value forindustrialized countries, due to the following reasons :
♦ Albanian technology is very old;♦ Productivity of Albanian society is very low compared with industrialized countries;♦ A large share of energy sources is consumed in residential and service sectors for people
comfort and not in industry sector, for producing higher value of GDP.
3. GHG EMISSIONS FROM ECONOMIC SECTORS
3.1 Energy sector
The energy sector has a share of 62.95% of total CO2 emissions (Fig. II.1), 7.99% of total CH4emissions, due to fugitive emissions from fuel extractions (Fig. II.2) and around 10.79% of totalN2O emissions (Fig. II.3).
Although CO2 emissions from fuel wood are reported under the land use change and forestry, asthe IPCC methodology recommends, they are also reported under energy sector only for dem-onstration purpose, since fuel wood is still an important energy source in Albania and harvestingof fuel wood is not done properly. Albania has more cutting of wood than yearly yield intake from N
atio
nal G
HG in
vent
ory

58
forestry. So, if fuel wood emissions are reported under the energy sector, the contribution of thelast one in GWP (CO2 equivalent) will reach 65.39%.
The results show (Fig.II.4) that a share of 44.00% of the overall national greenhouse gas emis-sions, expressed in CO2 equivalent, comes from the energy sector and the rest (56.00%) comesfrom other remaining sectors.
Figure II.11 shows the shares of CO2 emissions from energy subsectors (end-users) due to fuelcombustion activities. It is evident that the largest share comes from industry (manufacturing andconstruction) followed by transport sector (road, rail, marine, other). Figure II.12 shows thecontribution of each fuel type in the CO2 emissions, released due to fuel combustion activities.The main source is oil with 87.3% followed by coal with 11% and the last one is natural gas with1.7%.
Fig.II.11 Shares of CO2 emissions from energy subsectors due Fig.II.12 CO2 emissions from each fuel type to fuel combustion activities [2,902.94 Gg], 1994 [2,902.94 Gg], 1994
According to the CO2 emissions from transport subsectors, the largest share belongs to roadtransportation with 88.8% (Fig.II.13). The CO2 equivalent emissions released from transportsector are shown in figure II.14.
Fig.II.13 CO2 emissions from transport subsectors Fig.II.14 CO2 eqv., emissions from transport due to fuel combustion activities,1994 sector, [798.06 Gg],1994
According to the IPCC methodology, the fugitive emissions from fuels are estimated by takinginto account the releases of gases from anthropogenic activities. This group includes solidfuels, oil natural gas, venting and flaring. The results show that the largest share of CH4 fugitiveemissions by activity types, versus the total CH emissions, belongs to coal underground miningand post mining activities with 99.956%, followed by natural gas with 0.038%, oil with 0.003%and venting and flaring activities with 0.003%. N
atio
nal G
HG in
vent
ory

59
3.2 Industrial processes
The main source of CO2 emissions released from industry is cement production. CO2 emissionsreleased from cement production process are 118.8 Gg or about 60% of total CO2 emissionsreleased from industry sector. Aggregated greenhouse gas emissions, expressed in CO2eqvuivalent, released from industrial processes are 205.28 Gg in 1994.
Fig.II.15 CO2 eqv., emissions from industrial processes, [205.28 Gg]; 1994
3.3 Agriculture
The contribution of agriculture sector in GWP is 27.12% of total CO2 equivalent for the year 1994(Fig.II.4). The main contributor is CH4 with a total value of 79.71 Gg. Source categories of CH4emissions are mainly enteric fermentation with 94.83% and manure management with 5.12%,as shown in the figure II.16. Cattle are the main source of CH4 emissions from enteric fermenta-tion with 72.26% (Fig. II.17), followed by sheep with 16.27%. N2O emissions are mainly releasedbecause of application of nitric fertilizers (84.81%).
Fig. II.16 CH4 emissions from agriculture sector Fig.II.17 CH4 emissions from enteric [79.711 Gg], 1994 fermentation [54.619 Gg], 1994
3.4 Land use change and forestry
Albania’s forest area is composed mainly of the broad leaf species, that are more capable toserve as sinks of CO2 emissions.The total carbon uptake increment resulted in 615.36 carbonKt.
The main source on biomass production and quantity of CO2 emissions in 1994 are commer-cial forests and deciduous broad leaf species. The protection forest and fruit tree species arealso considered in estimations. The total biomass consumption, annual carbon content andannual CO2 emissions resulted to be respectively 2,054.76 dm Kt, 1,027.38 Kt of carbon and -1,510.73 Gg of CO2. The last negative value demonstrates very clearly that wood cutting process N
atio
nal G
HG in
vent
ory

60
in Albania is higher (over three times) than annual increment of our forests. This is also demon-strated in figure II.18. The largest contribution comes from non registered cuttings (illegal cut-tings). Anyway, a high uncertainty concerning the activity data for this category exists.
Fig.II.18 CO2 emissions and sinks from forestry,1994; [Gg]
The results show (Fig.II.19) that the total carbon uptake from abandoned lands is 78.00 Ktcarbon, while the total carbon dioxide uptake is 286 Gg. The changes in soil carbon for mineralsoils are also calculated. As a result, the net change in soil carbon of mineral soils resulted to be-12.82 Tg/20 years. The negative value is explained by the reduced areas of the broadleafforests, improved pasture, grain with reduced tillage, non-grain crops with full tillage, fruit treeplantations, wetland and inland water.
Fig. II.19 Total CO2 emissions from land use change and forestry,1994; [Gg]
The annual emissions released from organic soils are calculated by using data on land areaand annual loss rate. Net carbon loss from organic soils is 3,9780.00 Mg/yr. The total annualcarbon emissions are 500.94 Gg. The total annual CO2 emissions are 2,496.72 Gg (this is acumulative value for 20 years).
3.5 Wastes
Albania has a unique system for waste water handling. Since the system is aerobic, the methaneconversion factor (MCF) is equal to zero.
As for the waste sector, the net annual CH4 emissions released by unmanaged landfills, are13.18 Gg per year. This value constitutes about 4.81% of total CO2 equivalent emitted for 1994,as shown in figure II.4.
N2O emissions from human sewage account for 0.15 Gg per year. As shown in figure II.20, theshare of N2O emissions versus the total CO2 equivalent emissions emitted from waste sector is13.84%.
Nat
iona
l GHG
inve
ntor
y

61
Fig.II.20 Shares of CO2 eqv., emissions from waste Fig.II.21 NMVOC emissions from solvents,1994; [Gg] sector 1994, [Gg]
3.6 Solvents
For the purpose of classification of the activity data for solvents sector, the CORINAR nomina-tions are used. The estimations for the solvents sector are based on other countries experi-ences. All NMVOC emissions from different categories of solvents are estimated and the resultsshow that the largest share belongs to butane with 4.458 Gg, followed by ethylene with 2.993 Gg.
3.7 International bunkers
Since Albania has access to air and marine transport, estimation of emissions released frombunker fuels used on international air and marine transportation, are also performed. Accordingto the 1996 revised IPCC Guidelines, emissions from bunker fuels are not included in thebalance of the inventory.
In 1994, CO2 emissions from international transportation via air and marine are respectively61.50 Gg and 18.19 Gg. Other emissions like CH4 expressed in CO2 equivalent for internationalair and marine transport are respectively 0.0091 Gg, 0.5387 Gg.
The following figure shows the contribution of each gas in the total emissions released frominternational bunkers.
Fig.II.22 GHG emission from international bunkers,1994; [Gg]
3.8 Total GHG emissions for Albania, in 1994
Table II. 3 presents all greenhouse gas emissions in Albania by source categories in Gg, for theyear 1994, while table II. 4 presents CO2 emissions from fuel combustion for 1994. N
atio
nal G
HG in
vent
ory

62
Tab.II.3 GHG emissions in Albania by source categories, 1994; [Gg]
Tab.II.4 Anthropogenic CO2 emissions from fuel combustion in Albania,1994; [Gg]
4. GHG EMISSIONS FROM ENERGY SECTOR FOR 1990-1994
In order to identify the dynamics of anthropogenic greenhouse gas emissions and their com-parative changes, the CO2 emissions from energy sector are estimated for the period 1990 -1994. They are estimated according to the source categories, as presented in table II. 5 andfigure II. 23. The Top-Down approach is used.
Tab.II.5 Anthropogenic CO2 emissions from fuel source,1990-1994; [Gg]
From the results it is obvious that the anthropogenic emissions, released by oil sources inAlbania in 1994 have decreased by 28.8% compared to 1990. In 1994, we have a sharp de-crease by 80.78% of emissions released from coal, compared to 1990. In 1994, we have a sharpdecrease by 74.53%, compared to 1990 for emissions released from natural gas sources. The N
atio
nal G
HG in
vent
ory

63
CO2 emissions released by fuel combustion are shown in figures II.23 and II.24.
As mentioned above, emissions from energy sector have been reduced from 1990 to 1994, butfrom the other side, emissions from international marine and international air transport havebeen increased with a very high growth rate. So, for 1994 international bunkers have emitted79.7 Gg CO2 or 5.04 times higher than 1990. Figure II.24, shows the trends of total CO2 emis-sions from energy sector and from international bunkers for the period 1990-1994.
The most important greenhouse gas emissions indicators such as CO2 emissions per GDP andCO2 emissions per capita, are both shown on the yearly basis in figure II. 25. Both indicators havedecreased for the same reasons, already mentioned in section 2.3 of this chapter.
Fig.II.23 CO2 emissions from fuel combustion, 1990-1994; [Gg]
Fig.II.24 CO2 emissions from international marine, air Fig.II.25 CO2 emission per capita and GDP transport and from energy sector. for the period 1990-1994
5. KEY SOURCES OF EMISSIONS
Based on the total emissions, the key source identification for GHG emissions for Albania isdeveloped. Key sources represent the main sub categories which, in cumulative order make upto 95% of total CO2 equivalent emissions. These key sources are presented in the followingtable:
Nat
iona
l GHG
inve
ntor
y

64
Tab.II.6 Key source categories for GHG emissions, 1994; [%].
Referring to the above table, we found out 11sub categories identified as key ones which actuallyrepresents 94.48 % of the total emissions, expressed in CO2 equivalent.
The following trend also shows the key source categories graphically. On the x-axis are placedall key source categories, according to the list of above mentioned table.
Fig.II 26. Key source categories for 1994
As a conclusion from the above analysis, the main key sources results the follows:
♦ CH4 emissions from enteric fermentation (22.49%);♦ CO2 emissions from biomass burned for energy purposes (21.40%);♦ CO2 emissions from fuel combustion in industry (11.24%);♦ CO2
emissions from fuel combustion in energy and transformation industries (8.15%);♦ The rest belongs to other categories.
6. UNCERTAINTY ESTIMATION OF GHG INVENTORY
The use of Top - Down approach and the statistical data on fuel energy balance enabled us toestimate the summarized values of emissions of gases of direct greenhouse effect (CO2, CH4and N2O). The application of Bottom - Up approach enabled us to make the clarification of thevalues of the main greenhose gas emissions, based on more detailed information.
The comparison of results, received by the above mentioned methods testifies their rather highdegree of comparability. The application of the Top-Down and Bottom-Up approaches hasenabled us to estimate rather fully and precisely the values of both emissions of CO2 and CH4 and N
atio
nal G
HG in
vent
ory
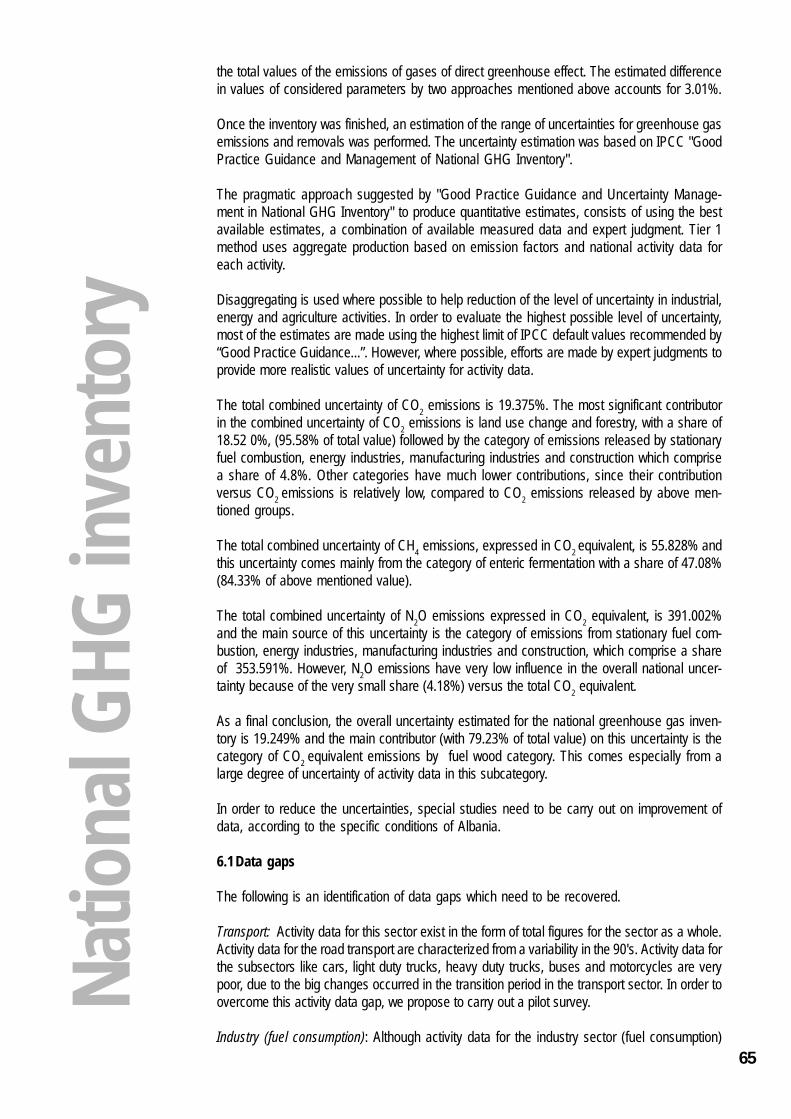
65
the total values of the emissions of gases of direct greenhouse effect. The estimated differencein values of considered parameters by two approaches mentioned above accounts for 3.01%.
Once the inventory was finished, an estimation of the range of uncertainties for greenhouse gasemissions and removals was performed. The uncertainty estimation was based on IPCC "GoodPractice Guidance and Management of National GHG Inventory".
The pragmatic approach suggested by "Good Practice Guidance and Uncertainty Manage-ment in National GHG Inventory" to produce quantitative estimates, consists of using the bestavailable estimates, a combination of available measured data and expert judgment. Tier 1method uses aggregate production based on emission factors and national activity data foreach activity.
Disaggregating is used where possible to help reduction of the level of uncertainty in industrial,energy and agriculture activities. In order to evaluate the highest possible level of uncertainty,most of the estimates are made using the highest limit of IPCC default values recommended by“Good Practice Guidance...”. However, where possible, efforts are made by expert judgments toprovide more realistic values of uncertainty for activity data.
The total combined uncertainty of CO2 emissions is 19.375%. The most significant contributorin the combined uncertainty of CO2 emissions is land use change and forestry, with a share of18.52 0%, (95.58% of total value) followed by the category of emissions released by stationaryfuel combustion, energy industries, manufacturing industries and construction which comprisea share of 4.8%. Other categories have much lower contributions, since their contributionversus CO2 emissions is relatively low, compared to CO2 emissions released by above men-tioned groups.
The total combined uncertainty of CH4 emissions, expressed in CO2 equivalent, is 55.828% andthis uncertainty comes mainly from the category of enteric fermentation with a share of 47.08%(84.33% of above mentioned value).
The total combined uncertainty of N2O emissions expressed in CO2 equivalent, is 391.002%and the main source of this uncertainty is the category of emissions from stationary fuel com-bustion, energy industries, manufacturing industries and construction, which comprise a shareof 353.591%. However, N2O emissions have very low influence in the overall national uncer-tainty because of the very small share (4.18%) versus the total CO2 equivalent.
As a final conclusion, the overall uncertainty estimated for the national greenhouse gas inven-tory is 19.249% and the main contributor (with 79.23% of total value) on this uncertainty is thecategory of CO2 equivalent emissions by fuel wood category. This comes especially from alarge degree of uncertainty of activity data in this subcategory.
In order to reduce the uncertainties, special studies need to be carry out on improvement ofdata, according to the specific conditions of Albania.
6.1 Data gaps
The following is an identification of data gaps which need to be recovered.
Transport: Activity data for this sector exist in the form of total figures for the sector as a whole.Activity data for the road transport are characterized from a variability in the 90's. Activity data forthe subsectors like cars, light duty trucks, heavy duty trucks, buses and motorcycles are verypoor, due to the big changes occurred in the transition period in the transport sector. In order toovercome this activity data gap, we propose to carry out a pilot survey.
Industry (fuel consumption): Although activity data for the industry sector (fuel consumption)
Nat
iona
l GHG
inve
ntor
y

66
exist for 1994, as reported in greenhouse gases inventory for Albania, there is a need for activitydata on this category for years other than 1994, becasue the activity data for 1994 do not reflectthe drastic structural changes among industrail subsectors. With regard to activity data for theindustry sector (fuel consumption), for years other than 1994, only the total figures for the sectoras a whole exist, but no divisions as per subsectors. As for getting the shares of fuels consump-tion among subsectors, we propose to carry out a pilot survey on a number of preselectedindustrial enterprises.
Traditional biomass burned for energy purposes: This category includes all greenhouse gasemissions released from the burning of fuel wood, charcoal, and vegetal wastes. The categoryof CO2 emissions released from consumption of fuel wood comprise a share of 79.23 % versusthe overall uncertainty estimated for the greenhouse gases inventory (the total value of uncer-tainty is estimated to be 17,03%). As mentioned in section 6 of this chapter, this happens due toa high degree of uncertainty of activity data for this subcategory, mainly data which belong to ruralareas. There are no official data on fuel wood consumption for years other than 1994. What isalready known is that the historic strong position of fuel wood is still prevailing, especially in ruralareas where a large source of fuel wood is provided by illegal cuttings, not yet reported officially.So it is very important to have a clear situation concerning fuel wood consumption in differenteconomic sectors especially in households and service. In order to reduce the uncertaintyfactors, a special survey need to be undertaken.
Agriculture: In early 90's, following the destruction of the state livestock farms, the agriculturecooperatives and the finalization of the privatization practices, the livestock breeding shifted fromintensive to extensive. The data are very fragmentized and the establishment of a data base onmanure management is needed, in order to have a clear picture of this category, which remainsthe first key source of emissions.
Nat
iona
l GHG
inve
ntor
y

67
CHAPTER III
GHG ABATEMENT ANALYSIS
III1. GHG EMISSIONS BASELINE SCENARIO --- 68
1.1 Methodology --- 681.2 General data and projections --- 681.3 Energy and transport sectors --- 69
1.3.1 CO2 non biogenic emissions --- 691.3.2 CH4 emissions --- 711.3.3 N2O emissions --- 711.3.4 CO2 biogenic emissions --- 721.3.5 Total emissions from energy and transport --- 74
1.4 Land use change and forestry sector --- 741.4.1CO2 emissions ---74
1.5 Agriculture sector --- 761.5.1 CH4 emissions --- 761.5.2 N2O emissions --- 76
1.6 Waste sector --- 771.6.1 CH4emissions --- 77
1.7 Industry sector --- 771.7.1 CO2 emissions --- 771.7.2 Other emissions --- 77
1.8 Solvents sector --- 781.8.1 NMVOC emissions --- 78
1.9 Aggregated emissions from all economic sectors --- 782. GHG EMISSIONS ABATEMENT SCENARIO --- 79
2.1 Methodology --- 792.2 Household sector --- 79
2.1.1 Thermal insulation of households --- 802.3 Service sector ---812.4 Industry sector --- 822.5 Transport sector --- 822.6 Energy transformation sector --- 832.7 Overall abatement potential for energy and transport sectors --- 832.8 Land use change and forestry secctor --- 88
2.8.1 Selected measures to reduce GHG emissions from forestry sector --- 882.8.2 GHG abatement scenario for land use change and forestry sector --- 88
2.9 Agriculture sector --- 892.10 Waste sector --- 89
2.10.1 GHG abatement options --- 892.10.1.1 Construction of new sanitary landfills --- 902.10.1.2 Construction of a new MSW incinerator with energy use -- -912.11 Industrial processes and solvents use -- -91

68
Projections of greenhouse gas emissions for Albania are mainly based on energy and nonenergy sectors. An abatement assessment normally includes two scenarios: baseline and abate-ment scenario. All greenhouse gas source categories such as energy and transport, land usechange and forestry, agriculture, waste, industrial processes and solvents are considered. Thegreenhouse gas emissions baseline scenario is a description of a plausible future in which nospecific policy measures are taken to encourage actions that reduce greenhouse gas emissions.The greenhouse gas emissions abatement scenario assumes a gradual implementation of mea-sures for reduction of greenhouse gas emissions.
1. GHG EMISSION BASELINE SCENARIO
1.1 Methodology
The software used for development of greenhouse gas emissions baseline scenario for energyand transport is Long-range Energy Alternatives Planning1 (LEAP) system, version 95.0, which isa computer based accounting and simulation tool, designed to assist policy makers in evaluat-ing energy policies and developing sound, sustainable energy plans.
LEAP, as an integrated planning tool, can help in the developement of more rational and environ-mentally beneficial energy policies, since it expands the boundaries of analysis in two importantways. First, demand-side measures for improving efficiency are placed on an equal footing withenergy supply options. Second, environmental effects are explicitly considered in the evaluationof alternative energy plans.
Traditionally, the future energy requirements in Albania are projected within each economicsector (households, industry, agriculture, services, transport, etc.) based on the level of eco-nomic activities and elasticities. Often this approach is referred to as aTop-Down approach.However, the developed long-term scenario, uses a Bottom-Up approach, comprising a de-tailed layout of energy demand by sectors, end-uses and technologies.
Concerning the non energy sectors2, the 1996 revised IPCC methodology is used for develop-ment of baseline emission scenarios.
1.2 General data and projections
The base year data used for the development of the greenhouse gas emissions baseline sce-nario are identic to those of inventory. The greenhouse gas emissions baseline scenarioincludes sufficient details about the energy consumption trend in the future, energy sourcesproduction systems, the technologies used, the production of main industrial products, thepopulation number and how it is distributed in the cities and in the countryside, the number oftransport vehicles, the demand for agriculture and animal products, and data concerning forestsand land use, the forecasts on wastes produced and the way of their disposals, etc.
The development of the baseline scenario is based even on a number of assumptions foreconomic and demographic parameters, legal framework and the prices policy, assumptionswhich on the other hand are based on the macro economic projections of the country as awhole, as well as on the development plans of the economic sectors, taken in particular.
The greenhouse gas emissions are expressed in physical units and in percentage for each yearup to the end of the year 2020, selected as time horizon.
The following tables represent general data and projections on GDP, value added, populationgrowth rates, cost parameters and exchange rates, as important driving components for devel-opment of baseline GHG emissions scenario.1 Developed by the Stockholm Environment Institute - Boston (SEI-B) with support from the UNEP and other agencies 2Exception is made for solvent use sector. The prediction of NMVOC emissions up to 2020, is based on CORINAR meth-odology
GHG
abat
emen
t ana
lysis

69
Source: INSTAT
Source: INSTATTab.III.3 Cost parameters
Tab.III.1 Total GDP and value added by economic sectors and projections
Source: INSTATTab.III.2 Growth rate and its projections
Source: Ministry of FinanceTab.III.4 Exchange rate
1.3 Energy and transport sectors
The CO2 non biogenic emissions (emissions from fuel combustion activities), CH4 and N2O,released due to energy activities are estimated for such sectors as residential, agriculture, ser-vices, industry, transport, non energy use, and transformation industry. While CO2 biogenic emis-sions released from traditional biomass burned for energy purposes, are also calculated fordemonstration purposes only. They are reported under the land use change and forestry sector.
1.3.1 CO2 non biogenic emissions
Figure III.1 shows the CO2 non biogenic emissions released from energy sector during 1994 -2020.
Fig. III.1 CO2 non biogenic from energysector, 1994 - 2020; [Gg];GHG emissions baseline scenario G
HG ab
atem
ent a
nalys
is

70
Table III. 5 shows the growth rates of CO2 non biogenic emissions (in percentage) released fromdifferent sectors, respectively in the years 2000, 2010 and 2020, with reference to the base year,1994.
Tab.III 5 Growth rates of CO2 non biogenic emissions released from all energy subsectors in 2000, 2010, 2020,compared to 1994; [%]
It is evident that in 2020 the largest share of CO2 non biogenic emissions is expected to belongto the industry sector. Estimations show a value of 6,630 Gg or 35% of the total CO2 non biogenicemissions, expected to be released from energy sector (Fig.III. 2). This will happen due to thefact that the value added from industry sector is expected to be increased by almost 9% per year.
The second contributor is expected to be the transformation sector (electricity and heat produc-tion, petroleum refining, solid fuel transformation and other energy industries) which shows avalue of 3,420 Gg of CO2 non biogenic or 29% of the total.
According to the table III.5, the CO2 non biogenic emissions expected to be released from thissubsector, will also have the largest growth rates (around 2,029 %), compared to 1994, due tothe contribution of the thermo power plants of a capacity 700 - 850 MW, foreseen to be installedup to 2020. The aim is to meet the ever growing demand for electricity and to change at thesame time, the existing share between the electricity generated by hydro power plants andthermo power plants, in order to enhance the security of the supply. In 1994, the above men-tioned share has been 94% with 6% in favor of hydro power plants, while in 2020, the share ofthermo power plants is expected to grow up to 37 - 40%. On the other hand, this will be accom-panied by the negative effects of CO2 non biogenic emissions, released by fuel combustion. Amuch less share belongs to transport sector with 19% of the total, followed by non energy usewith 10%, residential sector with 5%, agriculture with 2% and services with 0.3 %.
Fig.III.2 Shares of CO2 non biogenic emissions as per energy subsectors; 2020;Baseline GHG emission scenario
The total CO2 non biogenic emissions expected to be released from energy and transportsectors, according to baseline emission scenario in 2020 will reach the amount of 18,439 Ggcompared to 2,851Gg in 1994, knowing a growth of 546%, compared to1994. G
HG ab
atem
ent a
nalys
is

71
1.3.2 CH4 emissions
Figure III.3 shows the CH4 emissions released from all energy subsectors according to thebaseline scenario, developed for the period 1994 - 2020.
Fig.III.3 CH4 from energy sector, 1994-2020; [Gg]; GHG emissions baseline scenario.
Table III.6 shows the growth rates of CH4 emissions in percentage, released from energysubsectors in 2000, 2010 and 2020, with reference to the base year - 1994, according to thebaseline scenario.
Tab.III.6 Growth rates of CH4 emissions from energy activites; [%]
It is evident that the largest share of CH4 emissions towards 2020, is expected to belong to theenergy transformation activities. Estimations show a value of 250 Gg or a share of 95 % (FigIII.4).The energy transformation activities include electricity and heat production, petroleumrefining, solid fuels transformation and other energy industries.The largest share of CH4emissionsis dedicated to fugitive emissions released from the following activities:
♦ Coal underground mining and post mining activities;♦ Oil and natural gas exploration, production / processing, transmission / distribution, refining,
other leakage;♦ Oil and natural gas venting and flaring;
Fig.III.4 Shares of CH4 emissions as per energy subsectorss; 2020; GHG emissions baseline scenario. GHG
abat
emen
t ana
lysis

72
Figure III.4 shows the shares between energy subsectors.The total CH4 emissions from energysector according to the baseline emission scenario in 2020, are expected to reach the amountof 263 Gg, compared to 35 Gg in 1994, having an increase of 653%.
1.3.3 N2O emissions
Figure III.5 shows the N2O emissions released from energy sector according to the baselinescenario, for the period 1994 - 2020, while table lII. 7 shows the growth rates of N2O emissionsin percentage released from all energy subsectors in 2000, 2010 and 2020 with reference to thebase year - 1994.
Fig.III.5 N2O emissions from energy sector, 1994 - 2020; [Gg];GHG emissions baseline scenario
Tab.III.7 Growth rates of N2O emissions released from energysubsectors in 2000, 2010, 2020, compared to 1994; [%]
As shown in figure.III.5 and III.6, it is evident that the largest share of N2O emissions towards2020, is expected to belong to the residential sector. Estimations show a value of 55 Mg or 57%of the total, followed by industry sector with 27 Mg or 28% of the total N2O emissions from energysector. A much less share belongs to service sector with 14 Mg or 15% (Fig III.6).
Fig.III. 6 Shares of CH4 emissions as per energy subsectors; 2020GHG emissions baseline scenario.
1.3.4 CO2 biogenic emissions
Figure III.7 shows the CO2 biogenic emissions released from all energy subsectors, accordingto the baseline emission scenario, developed for the period 1994 - 2020, while table III. 8 below G
HG ab
atem
ent a
nalys
is
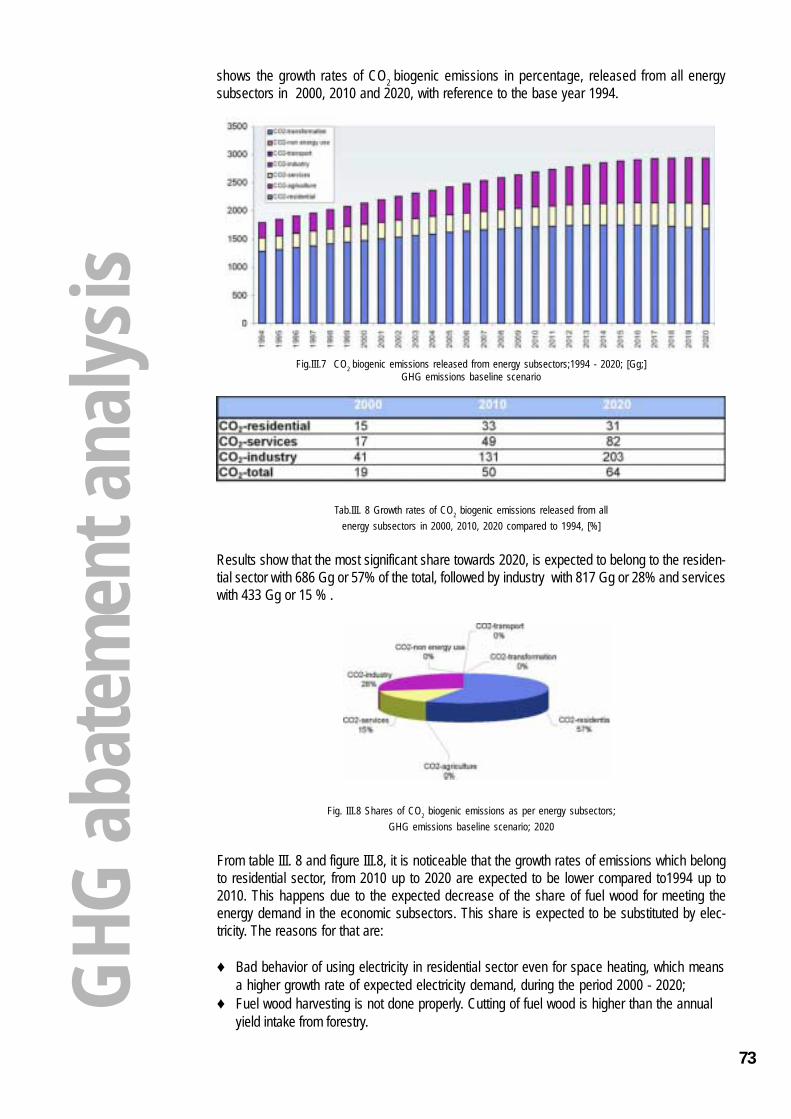
73
shows the growth rates of CO2 biogenic emissions in percentage, released from all energysubsectors in 2000, 2010 and 2020, with reference to the base year 1994.
Fig.III.7 CO2 biogenic emissions released from energy subsectors;1994 - 2020; [Gg;]GHG emissions baseline scenario
Tab.III. 8 Growth rates of CO2 biogenic emissions released from allenergy subsectors in 2000, 2010, 2020 compared to 1994, [%]
Results show that the most significant share towards 2020, is expected to belong to the residen-tial sector with 686 Gg or 57% of the total, followed by industry with 817 Gg or 28% and serviceswith 433 Gg or 15 % .
Fig. III.8 Shares of CO2 biogenic emissions as per energy subsectors;GHG emissions baseline scenario; 2020
From table III. 8 and figure III.8, it is noticeable that the growth rates of emissions which belongto residential sector, from 2010 up to 2020 are expected to be lower compared to1994 up to2010. This happens due to the expected decrease of the share of fuel wood for meeting theenergy demand in the economic subsectors. This share is expected to be substituted by elec-tricity. The reasons for that are:
♦ Bad behavior of using electricity in residential sector even for space heating, which meansa higher growth rate of expected electricity demand, during the period 2000 - 2020;
♦ Fuel wood harvesting is not done properly. Cutting of fuel wood is higher than the annualyield intake from forestry. G
HG ab
atem
ent a
nalys
is
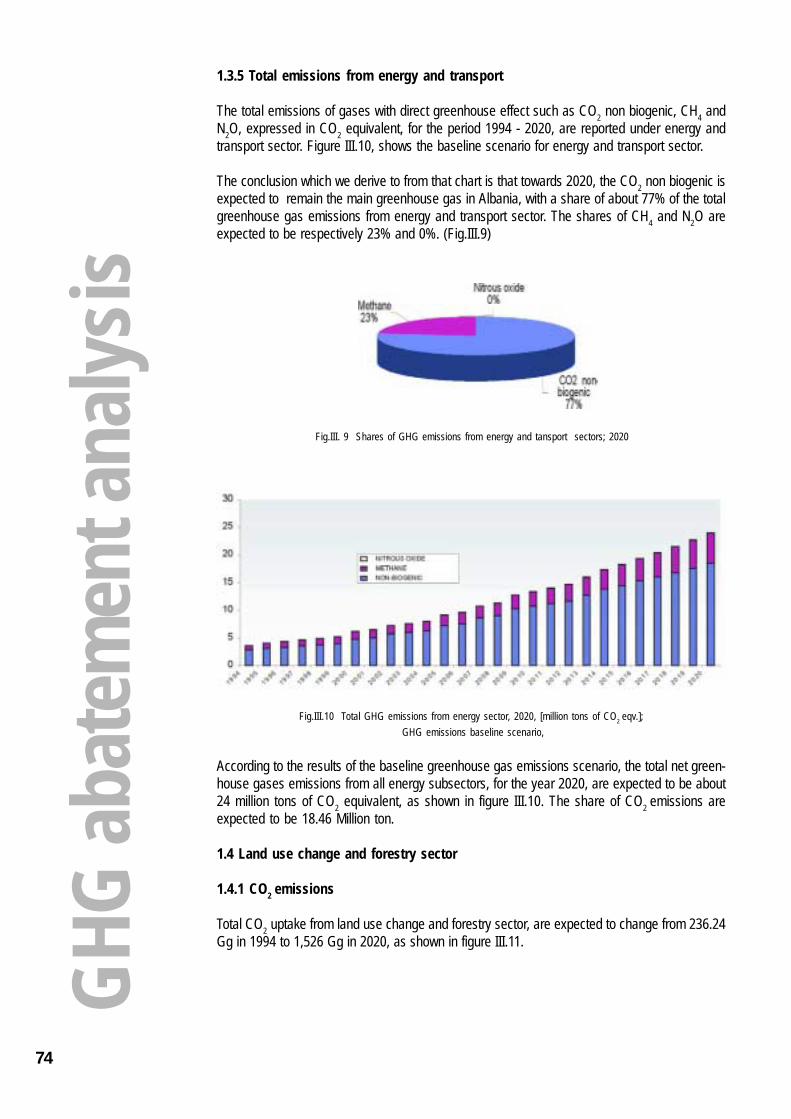
74
1.3.5 Total emissions from energy and transport
The total emissions of gases with direct greenhouse effect such as CO2 non biogenic, CH4 andN2O, expressed in CO2 equivalent, for the period 1994 - 2020, are reported under energy andtransport sector. Figure III.10, shows the baseline scenario for energy and transport sector.
The conclusion which we derive to from that chart is that towards 2020, the CO2 non biogenic isexpected to remain the main greenhouse gas in Albania, with a share of about 77% of the totalgreenhouse gas emissions from energy and transport sector. The shares of CH4 and N2O areexpected to be respectively 23% and 0%. (Fig.III.9)
Fig.III. 9 Shares of GHG emissions from energy and tansport sectors; 2020
Fig.III.10 Total GHG emissions from energy sector, 2020, [million tons of CO2 eqv.]; GHG emissions baseline scenario,
According to the results of the baseline greenhouse gas emissions scenario, the total net green-house gases emissions from all energy subsectors, for the year 2020, are expected to be about24 million tons of CO2 equivalent, as shown in figure III.10. The share of CO2 emissions areexpected to be 18.46 Million ton.
1.4 Land use change and forestry sector
1.4.1 CO2 emissions
Total CO2 uptake from land use change and forestry sector, are expected to change from 236.24Gg in 1994 to 1,526 Gg in 2020, as shown in figure III.11.
GHG
abat
emen
t ana
lysis

75
Fig.III.11 Total CO2uptake from land use and forestry sector, [Gg];GHG emissions baseline scenario
In 2020, the total CO2emissions from fuel wood burning are expected to reach the amount of2,940 Gg compared to 1,871 Gg in 1994, as shown in figure III.12.
Fig.III. 12 Total CO2 emissions from fuel wood burning, [Gg];GHG emissions baseline scenario
The total CH4 emissions from land use change and forestry are expected to reach the amount of0.29 Gg in 2020 compared to 0.01 Gg. in 1994, as shown in figure III.13.
Fig. III. 13 CH4 emissions, [Gg]; 2020; GHG emissions baseline scenario
GHG
abat
emen
t ana
lysis

76
The total NOX emissions from land use change and forestry will continue to have a very negli-gible effect even in 2020. (Fig. III.14).
Fig. III.14 NOX emissions, 2020; [Gg]; GHG emissions baseline scenario.
1.5 Agriculture sector3
1.5.1 CH4 emissions
Table III.9 and table III.10 present the baseline emissions scenario, developed for agriculturesector.
Tab.III.9 Expected CH4 emissions from the livestock sector in 2020, compared to 1994; [Gg]
Tab.III.10 Expected CH4 emissions from the MMS, in 2020, compared to 1994; [Gg]
1.5.2 N2O emissions
The following figure shows expected N2O emissions released from Manure Management Sys-tems (MMS), application of nitric fertilizers and agricultural soils, compared to 1994.
3 Emissions are estimated for 2010 and 2020, according to the 1996 revised IPCC Methodology
Fig.III.15 Expected N2O emissions from agriculture [Gg]; GHG emissions baseline scenario
GHG
abat
emen
t ana
lysis

77
1.6 Waste sector
1.6.1 CH4 emissions
The results of the baseline greenhouse gas emission scenario for waste sector are given in thefollowing figure.
Fig.III.16. CH4 emissions from waste sector, [Gg];GHG emissions baseline scenario
In 2020, the annual CH4 emissions from waste sector (landfills) are expected to increase to66.97 Gg or around five times more, compared to the base year 1994.
Also, the N2O emissions from waste sector (human sewage) are foreseen to reach an amount of0.267 Gg for the year 2020 compared to 0.15 Gg in 1994. Their contribution in terms of CO2equivalent is expected to be around 6% of the total greenhouse gas emissions expected fromwaste sector in 2020.
1.7 Industry sector
1.7.1 CO2 emissions
The cement industry will continue to be the largest contributor with around 817 Gg in 2020,while the total CO2 emissions coming from industry sector are expected to reach the amount of992 Gg. This is evident in figure III.17.
Fig.III.17 CO2 emissions from industry sector; [Gg]; GHG emissions baseline scenario
1.7.2 Other emissions
The estimated amounts of SO2 and NMVOC emissions, foreseen to be released in 2020 fromindustry sector are relatively small, respectively only 0.6 Gg and 1.19 Gg.
GHG
abat
emen
t ana
lysis

78
1.8 Solvents sector
1.8.1 NMVOC emissions
The forecasted amount of NMVOC emissions from solvents sector compared to the year 1994(4.5 Gg) will be 6 Gg. This is evident in the trend shown in figure III.18.
Fig.III.18 NMVOC emissions from solvents towards 2020, [Gg]; GHG emissions baseline scenario
1.9 Aggregated emissions from all economic sectors
The following table shows the total emissions of gases of direct greenhouse effect like CO2, CH4and N2O and their values in CO2 equivalent for the year 2020, according to the baseline sce-nario.
Tab.III.11 The total anthropogenic GHG emissions, 2020; [Gg]
In terms of CO2 equivalent, the greenhouse gas emissions expected in 2020 from all economicsectors will reach the amount of 37, 653 Gg. The largest share towards 2020, is expected tobelong to CO2 emissions with about 60 %, followed by CH4 emissions with about 29% and thenby N2O with about 11 %.
Fig. III. 19 CO2 eqv. emissions; 2020; [37653 Gg], Fig. III.20 CO2 eqv. emissions from economic GHG emissions emissions scenario sectors; GHG emissions baseline scenario
These data indicate that even in 2020, the CO2 released due to energy and transport activities isexpected to be the main greenhouse gas in Albania. G
HG ab
atem
ent a
nalys
is

79
2 GHG EMISSIONS ABATEMENT SCENARIO
Referring to the greenhouse gas emissions baseline scenario, it is expected that most of CO2emissions will be released from the energy and transport activities, which in 2020 will accountfor 83% of the total.This is the reason why we decided to analyze in detail and in a quantitativeway the energy and transport sectors, during the development of the abatement analysis. As forthe other sectors, they are analyzed qualitatively.
2.1 Methodology
With regard to the energy and transport sectors, the development of GHG abatement analysis isbased on GACMO software, which is a greenhouse gas costing model, developed by the UNEPCenter for Energy and Environment. The greenhouse gas emissions abatement scenario com-bines the emissions in the baseline scenario with the changes (i.e., reductions) of emissionsintroduced by various abatement options being evaluated. For each abatement option, thetechnologies that deliver energy services in the reference option are changed.
An abatement unit of emissions from these new technologies offsets a unit of energy consumedin the baseline scenario. A very important assumption made is that the level of energy servicedelivered by the baseline option and the abatement option does not affect the demand for theenergy service. For each abatement option, a "unit" measure for the new technology has to bedefined. Furthermore the penetration of the abatement option in the country is measured.
At the end, the model enables the calculation of the greenhouse gas emissions reductionassociated with different options, as well as the average abatement cost in USD per ton of CO2equivalent emissions reduced, for all kinds of abatement options.
The greenhouse gas emissions abatement scenario assumes a gradual implementation ofenergy efficiency measures in the household, industry, service and transport sectors.
Selection of measures for energy and transport sectors is made taking into account the actualsituation of energy sector in Albania, key sources of greenhouse gas emissions (refer to thenational greenhouse gases inventory) and greenhouse gas emissions baseline scenario forenergy and transport sectors.
2.2 Household sector
The following sections describe all abatement measures and their penetration into Albanianenergy market. The main feature in the greenhouse gas emissions baseline scenario for energyand transport is that space heating demand in households will be developed in an irregularmanner, because no efforts will be made to curb the energy demand growth.
According to the greenhouse gas emissions abatement scenario, by implementing a set ofenergy efficiency measures in Albanian households through a proper norm of penetration esti-mated for each measure, the energy demand will be reduced, bringing about at the same timethe abatement of greenhouse gases released from this sector. The proposed measures are:
♦ Thermo insulation of households, in case when the main energy sources are electricity,fuel wood, LPG, kerosene and, when a district heating system is applied;
♦ Introduction of efficient refrigerators in household consumers;♦ Introduction of efficient lighting in household consumers;♦ Introduction of thermas time switches for electric boilers in household consumers;♦ Introduction of prepaid metres in household consumers;♦ Introduction of solar water heating system versus electric boilers in households. G
HG ab
atem
ent a
nalys
is

80
2.1.1 Thermo insulation of households
The analysis on energy consumption from the household sector is based on the extent thatbasic energy end uses differ from which other. The basic energy end uses are: space heating,air conditioning, water heating, cooking, lighting, and electric appliances.
Up to 1990, the supply and demand for space heating, cooking, domestic hot water and fuelsbalance (mainly wood) were more or less in balance. After 1990, there was a large reduction offuel wood supplied by the state enterprises to the urban area. As a result, there was an overcutting of trees (much of which is illegal), overloading the electricity distribution system and toomany environmental problems.
Starting with the period after the Second World War, Albania had a very large housing problem.An extreme demand for modern dwelling existed. The requirements for a short constructiontime, unrealistic low energy prices and lack of appropriate building materials has resulted inbuildings with low levels of thermo insulation, little or no means of regulating the heating levelsand individual metering or billing of energy consumption. This led to a high level of energyconsumption especially for pre-fabricated buildings.
The increase of the level of insulation and reducing the losses from both natural and mechanicventilation can significantly reduce the energy consumption at a building. If a building will berenovated due to deterioration (replacement of old windows, improvements to the roofs, etc.), itis reasonable to combine these measures with an energy efficient renovation, since the de-crease in energy consumption can reduce the payback period significantly.
As it is described in the baseline scenario, the Albania’s household consumers use different kindof energy comodities, in order to meet their energy needs for space heating. Due to the collapseof industries and the increasing energy consumption by households, the electricity demandfrom the household / service sector now occupies a significant share: more than 60% of the totalenergy demand and 62% of the electricity demand.
The following paragraphs describe in detail the effects of reduction of greenhouse gas emis-sions, by introducing thermo insulation in existing and new stock of buildings, when differentenergy sources meet space heating demand.
In Albania’s households which use electric radiators for space heating (the largest consumersof electricity), the electricity consumed is estimated to be about 4,265 kWh/year, compared toonly 2,973 kWh/year (average moderated value for Albania) expected to be consumed from athermo insulated one. Based on the average number of the heating degree days for Albania, theutilization time considered in our estimations is 3,100 hours.
Box 1 shows an example of the greenhouse gas abatement analysis for improving energyefficiency by introduction of thermo insulation in household sector, which use electricity asenergy source for space heating. This is a demonstrative example of calculation of reductionpotential for above case. This methodology is used for each measure quantitatively analysed.Besides these measures, there is a set of other measures which are qualitatively analysed, dueto lack of necessary data. They are subject of a quantitative analysis in the future.
From the analysis shown in the Box 1, it is evident that this measure will reduce CO2 equivalentby 0.94557 Gg / (year, household), while it has a negative cost of -110.30 USD/(tons of CO2 eqv.).The negative cost means that this measure is a cost - effective one. In order to estimate allgreenhouse gas emissions reduction resulted from the implementing of this measure, its rate ofpenetration in 2010 and 2020 is also calculated (number of households, which will be insu-lated). The rates of penetration are shown in the Box 2. G
HG ab
atem
ent a
nalys
is

81
2.3 Service sector
The main feature of the greenhouse gas emissions baseline scenario for energy and transportis that energy demand in service subsectors will be developed in an unregulated manner be-cause no efforts will be made to curb the energy demand growth. According to the abatementgreenhouse gas emissions scenario, a set of energy efficiency measures in service sector isexpected to be introduced through a proper norm of penetration. The energy demand is ex-pected to be reduced bringing at the same time abatement of greenhouse gases from thissector. The measures proposed are as following:
♦ Introduction of efficient refrigerators in service consumers;♦ Introduction of efficient lighting in service consumers;♦ Introduction of efficient electrical motors in service consumers;
However, the measures towards reduction of greenhouse gas emissions in service sector arenot limited to the above selected ones only. The following measures may also produce a greatreduction of greenhouse gas emissions, but to analyze them in detail, more information isneeded. For that reason, they remain as a subject of future analysis. G
HG ab
atem
ent a
nalys
is

82
♦ Introduction of solar water heater systems versus electric boilers in service consumers (hotels, restaurants, hospitals);
♦ Thermo insulation of stock of buildings which use (electricity, firewood, LPG, kerosene) formeeting space heating energy demand;
♦ Establishment of a scenario aiming at a 20% reduction of energy intensities in the servicesector, due to a better management of the energy sector which will gradually start to operatein 2002;
♦ Introduction of central heating plants versus individual ones;♦ Introduction of district heating plants in service sector;♦ Introduction of total energy supply schemes (hydro / solar energy and small scale combined
heat and power, basedon diesel generators) for meeting electricity and heat demand intourist villages;
♦ Introduction of combined heat and power and district heating plants in service sector.
2.4 Industry sector
Historically, Albania's energy intensity in industrial subsectors has been very high. This meansthat the macro economic output normally denounced by the GDP (especially from industrysector), has been low compared to the overall energy consumption. The reasons are the sameas for the other Central and Eastern European Countries (CEEC), which have been orientedtowards energy intensive industries such as mining and metallurgy, and where low energy priceshave been prevailing. The following measures are selected for introduction in industrial sector,in order to reduce the greenhouse gas emissions:
♦ Introduction of efficient heavy fuel oil fired boilers in industrial consumers;♦ Introduction of efficient coal fired boilers in industrial consumers;♦ Introduction of efficient electrical motors in industrial consumers;♦ Improvement of power factor for the industrial consumers;♦ Introduction of efficient lighting in industrial consumers.
Finally, such interventions including direct financial support by means of international and gov-ernmental funds will be necessary, even to curb more the growing demand in the coming years.The following measures are also expected to have a reduction potential of greenhouse gasemissions. However, to analyse them in detail, more information is needed.
♦ Improvement of energy consumption through of a better management;♦ Introduction of new industrial technology, which consumes less energy sources (lower en
ergy intensity);♦ Introduction of district heating plants in industrial zones;♦ Introduction of combined heat and power and district heating plants in industrial zones.
2.5 Transport sector
Both greenhouse gas emissions baseline scenario and projections of the sector itself, assumethat the energy demand for the transport sector will continue to develop with the same trends thathave been prevailing since 1994. The qualitative measures proposed for this sector, aiming atenergy efficiency and the reduction of fuel consumption, within the normal standards, are thefollowing:
♦ Improvement of the difficult situation of the existing roads and construction of new ones;♦ Increasing the share of public transport for passengers and goods;♦ Introduction of non-motorized modes of transport;♦ Introduction of carbon tax system;♦ Increasing the taxes for second hand category cars; etc.
GHG
abat
emen
t ana
lysis

83
These measures will regulate the amount of pollution from cars associated with a considerablyreduction of fuel consumption.
2.6 Energy transformation sector
Up to now, we described and analyzed the abatement measures for reduction of greenhousegas emissions in energy demand side as per all economic sectors. Besides them, the proposedgreenhouse gas abatement measures related with energy transformation sector are also veryimportant. Main efforts in this category of abatement measures will be focused on power sectorand utilization of renewable energy sources. The following measures will be introduced andanalyzed in details in the following section:
♦ Introduction of hydro power plant versus heavy fuel oil plant in Albania’s power sector;♦ Introduction of hydro power plant versus natural gas plant in Albania’s power sector;♦ Introduction of gas power plant versus heavy fuel oil power plant in Albania’s power sector;♦ Introduction of mini hydro power plants versus diesel generator in Albania’s power sector;♦ Introduction of wind turbines versus diesel generators in Albania’s power sector;♦ Introduction of wind turbines versus natural gas power plant in Albania’s power sector;♦ Introduction of solar PV versus diesel generator in Albania’s power sector;
2.7 Overall abatement potential for energy and transport sectors
The development pattern that Albania has followed under the conditions of centrally plannedeconomy was highly energy intensive. The energy intensity of GDP was more than twice highercompared to the west European countries due to the prevailing share of industry in the GDPstructure, while the energy intensity of the industrial output was 68% higher.
The performed analysis shows that energy intensity of Albanian economy as a whole is expectedto decrease driven by structural changes among economic sectors and within sectors, high pricesof energy and penetration of new state-of-art technologies. According to the recent projections,the share of industry within GDP structure is expected to decrease from 39% in 1990 to 14% in2000. However, the industry and transport sectors are wxpected to have the highest potential forenergy efficiency improvement. For that reason, different abatement measures and specificprojects are directed towards these important energy consumption sectors.
Concerning the energy supply side, the share of renewable sources in Albania is about 18-22%in primary energy balance. This is very high compared to many other countries, because elec-tricity generation in Albania is based in hydro sources. According to the abatement greenhousegas emissions scenario, more hydro power plants will be introduced, compared to the green-house gas emissions baseline scenario.
Different parts of the country are suitable for implementing different types of renewable technolo-gies. For example, most of high mountainous regions along with the Ionian coastline are appro-priate to install wind mills and small hydro power plants. Solar energy may be utilized in southernand central part of the country, while biomass resources related to agricultural production aremost widely spread in the central and northeastern part of the country.
Expert estimates indicate that a significant drop in renewable technology investments, for a unitof installed capacity is expected due to the increase of their market share. This tendency,together with an expected increase of GDP, will speed up the penetration of renewable energysources in Albania.
Referring to figure III. 21, the abatement measures introduced in industry are predicted to havethe most significant impact on the reduction of greenhouse gas emissions from six economicsectors taken into consideration. The industry is then followed by household and energy trans- G
HG ab
atem
ent a
nalys
is

84
formation sector. This conclusion shows once more that introducing measures in demand sidemanagement gives more results in the abatement of greenhouse gas emissions than introduc-ing measures in energy transformation sector.
Fig.III. 21 All GHG abatement measures to be introduced in energy consumption and transformation sector.(Million tons of CO2 eqv.)
Figure III. 22 shows the reduction potential of greenhouse gas emissions from energy demandside and energy transformation sectors as well. Also two scenarios, baseline and abatementone are shown in this figure
Fig.III.22 Baseline scenario, abatement scenario and amount of reduction of GHG emissions, from energy and transportsector; [Million tons of CO2 eqv.]
Based on the analysis of each economic sector, all measures already mentioned in this sectionare disaggregated according to the list of measures mentioned in the section 3.1.1. The follow-ing figure shows each of these measures, disaggregated according to each economic sector.It is worth to be mentioned that the total reduction potentail of these measures is the samecompared to those shown in the figure III.21.
GHG
abat
emen
t ana
lysis

85
Fig. III. 23 All energy and transport abatement measures, 2001-2020; [Milion tons of CO2 eqv.]
The proposed energy abatement measures ranked in a decreasing order, as for the emissionreduction potential are presented in the figure III.24, while table III.12 shows all key abatementmeasures of greenhouse gas emissions which, in cumulative order comprise around 95% oftotal reduction for the year 2020. The same approach, as for the identification of the key sourcecategories of emissions is used for the identification of the key abatement measures as well.
Fig. III. 24 All energy and transport abatement measuresfor ranked in the decreasing order; up to 2020;[Million tons of CO2 eqv.]
GHG
abat
emen
t ana
lysis

86
Tab.III.12 All key GHG abatement measures that in cumulative order comprise 95% of total reduction; up to 2020.
GHG
abat
emen
t ana
lysis

87
The following figure represents the final analysis of comparing the abatement measures basedon their cost per unit reduction of CO2 equivalent. The selected abatement measures of green-house gas emissions are those ranked firstly in figure III.24 in a decreasing order.
Fig. III. 25 Comparison of selected GHG abatement measures, based on their cost of reduction [USD/CO2 eqv.]
The most effective abatement measures, based on their cost of CO2 equivalent reduction, in thedecrease order, are as follows:
♦ Introduction of thermo insulation of households which use fuel wood as energy source formeeting space heating demand;
♦ Introduction of thermo insulation of households which use LPG as energy source for meeting space heating demand;
♦ Improvement of power factor in industrial and service consumers;♦ Introduction of thermo insulation of households which use electricity to meet space heating
demand;♦ Introduction of thermo insulation of households which use kerosene to meet space heating
demand;♦ Introduction of gas-taxies versus gasoline taxies;♦ Introducing of efficient lighting (incandescent lamps versus fluorescent ones) in house
holds / service / industry;♦ Improvement of efficient boilers which use heavy fuel oil / diesel as fuel;♦ Improvement of efficient boilers which use coal as fuel;♦ Introduction of thermas time switches in electric boilers in household sector;♦ Introduction of prepaid metres in household sector;♦ Introduction of wind turbines versus diesel generators;♦ Introduction of hydro power plants versus heavy fuel oil power plants;♦ Introduction of thermo insulation of households which use heat (from DHP) as energy
source for meeting space heating demand;♦ Introduction of efficient electric motors in industry / service sectors;♦ Introduction of efficient refrigerators in household / service sectors;♦ Introduction of solar water heaters versus of electric boilers;♦ Introduction of mini hydro power plants versus diesel generators;♦ Introduction of landfill gas plants with 70% recovery;♦ Introduction of gas power plants versus heavy fuel oil power plants;♦ Introduction of PV electricity versus diesel generators;♦ Introduction of solar PV water pumps versus diesel pumps.
GHG
abat
emen
t ana
lysis
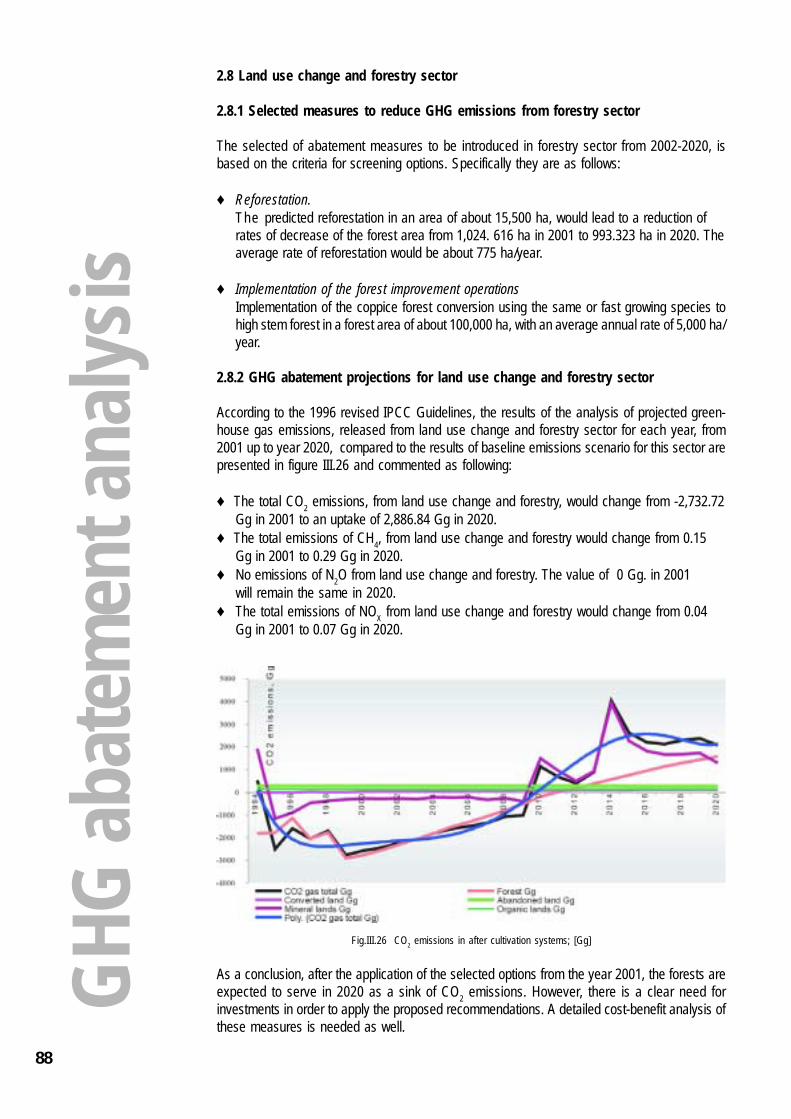
88
2.8 Land use change and forestry sector
2.8.1 Selected measures to reduce GHG emissions from forestry sector
The selected of abatement measures to be introduced in forestry sector from 2002-2020, isbased on the criteria for screening options. Specifically they are as follows:
♦ Reforestation.The predicted reforestation in an area of about 15,500 ha, would lead to a reduction ofrates of decrease of the forest area from 1,024. 616 ha in 2001 to 993.323 ha in 2020. Theaverage rate of reforestation would be about 775 ha/year.
♦ Implementation of the forest improvement operationsImplementation of the coppice forest conversion using the same or fast growing species tohigh stem forest in a forest area of about 100,000 ha, with an average annual rate of 5,000 ha/year.
2.8.2 GHG abatement projections for land use change and forestry sector
According to the 1996 revised IPCC Guidelines, the results of the analysis of projected green-house gas emissions, released from land use change and forestry sector for each year, from2001 up to year 2020, compared to the results of baseline emissions scenario for this sector arepresented in figure III.26 and commented as following:
♦ The total CO2 emissions, from land use change and forestry, would change from -2,732.72Gg in 2001 to an uptake of 2,886.84 Gg in 2020.
♦ The total emissions of CH4, from land use change and forestry would change from 0.15Gg in 2001 to 0.29 Gg in 2020.
♦ No emissions of N2O from land use change and forestry. The value of 0 Gg. in 2001will remain the same in 2020.
♦ The total emissions of NOX from land use change and forestry would change from 0.04Gg in 2001 to 0.07 Gg in 2020.
Fig.III.26 CO2 emissions in after cultivation systems; [Gg]
As a conclusion, after the application of the selected options from the year 2001, the forests areexpected to serve in 2020 as a sink of CO2 emissions. However, there is a clear need forinvestments in order to apply the proposed recommendations. A detailed cost-benefit analysis ofthese measures is needed as well. G
HG ab
atem
ent a
nalys
is
89
2.9 Agriculture sector
It is difficult to evaluate the costs of implementing policies to control greenhouse gas emissionsreleased from the agriculture sector in Albania, since costs depend on the type of policy instru-ment used and the extent of changes desired. On the other hand, the damage costs of green-house gas emissions are unknown, likewise are the abatement costs of introduction of policiesthat reduce greenhouse gas emissions. This means that it is very difficult to choose a policyoption that will have the lowest net cost to society or the largest net benefit.
However, several greenhouse gas abatement options are considered for possible implementa-tion in the Albania’s agriculture sector for the time period 2000-2020. The following are thoughtto have a likely impact on the reduction of greenhouse gases:
♦ Better management of pastures and the adjustment of the stocking rates.This measure will principally affect the population of small ruminants (sheep and goats),which extensively use the pastures for grazing with a potential reduction of 20% in CH4emissions. This could be achieved with little or no loss of productivity by improving pasturemanagement and adjusting the stocking rate. That implies a potential reduction of 1.88 Ggfrom the envisaged increase of 9.5 Gg in CH4 emissions from this category, by the endof 2020 as compared to 1994;
♦ The improvement of digestibility by ruminantsThis measure can be reached by promoting the use of food additives, which are consideredattractive by many animal’s breeders for increasing profitability. Using of molasses-urea asfeed supplement and especially using of straw treated urea, has been largely promoted andused by the former state owned bovine breeding farms during the period 1980-1988. It hasbeen interrupted ever since due to the radical changes affecting agriculture sector, whichresulted in the dissolving of the state owned breeding units.
The establishment of private bovine breeding enterprises appears to be a trend for the futuredevelopment of the livestock sector in Albania. A large scale resumption of the use of molasses-urea fed to bovines as well as the use of the urea treated straw for the same purposed isexpected. These measures comprise a potential of 30% of CH4 emissions reduction, by the endof 2020.
Regarding the cattle category, this implies an overall CH4 reduction of 6.614 Gg from theexpected amount of 22.16 Gg of CH4 emissions, compared to the reference year 1994.
2.10 Waste sector
2.10.1 GHG abatement options
The problems to which wastes give rise to, are both specific and relatively complex. Wastesector is not only a potential source of pollution, but it can also constitute secondary raw mate-rials. Waste management and wastewater treatment represent subsectors where measures toabate CH4 emissions have sense. The main objectives concerned are the reduction of thewaste production quantity, recycling and the minimization of the environmental impact of wastedisposal and waste treatment.
In order to make abatement projections for the period 2001-2020, for the waste sector, thefollowing abatement options are considered:
♦ Construction of new sanitary landfills: the gas generated from the landfill will be utilized;♦ Construction of a new Municipal Solid Waste (MSW) incinerator with energy utilization; G
HG ab
atem
ent a
nalys
is

90
♦ Extending the collection and utilization of secondary resources through the application ofseparated collection to reduce the amount of MSW;
♦ Reduction of organic substances stored in landfills;♦ Construction of new sewerage systems with waste water treatment plants.
The problem of defining which options are the most effective is relatively complex. Based on thecriteria for screening the options, the following are selected as more optimal:
1. Construction of new sanitarys landfills: the gas generated from the landfill will be utilized forenergy generation purposes.
2. Construction of a new MSW incinerator with energy utilization.
2.10.1.1 Construction of new sanitary landfills
The construction of sanitary landfills is necessary for the principal districts of the country, likeShkodra, Elbasani, Fieri, Vlora and Korca.
This option has a high potential for CO2 equivalent emissions reduction and is a sustainablelong term option, in consistency with national development goals. Also, the above mentionedoption will have its positive impact on environment. However, the cost of its implementation israther high.
Up to 2010, only two new sanitary landfills in the watershed of Elbasan and Vlore are foreseen tobe constructed. In 2010, the population of the Elbasani and Vlora districts is expected to beabout 17% of the urban population of the country.
The change of situation compared to the baseline scenario is reflected on the calculation ofMCF, based on 1996 revised IPCC Guidelines. The gas generated from these two landfills isforeseen to be utilized for energy purposes (electricity generation). Estimations show that in2010 (baseline scenario) will be emitted 38.15 Gg of CH4, while in the same year consideringthe 1-rst option, from waste sector will be emitted 6.59 Gg of CO2 and 31.57Gg of CH4 (669.24 GgCO2equivalent).
Concerning the projections for 2020, three other new sanitary landfills in the basins of Shkodra,Fieri and Korca are foreseen to be put in place. The five sanitary landfills are considered in theestimations, presented in table III.13. In 2020 (baseline scenario) 66.917 Gg of CH4 will beemitted, while in the same year considering 1-rst option, 23.6 Gg of CO2 and 43.3 Gg CH4 will beemitted from the waste sector.
2.10.1.2 Construction of a new MSW incinerator with energy use
The second abatement option considers the construction of a new incinerator in Tirana area.This zone covers Tirana, Durresi, Shijak and Kavaja. The 2-nd option has also a significantpotential of reduction of CO2 emissions on the air compared to the 1-rst option proposed, beingat the same time a long term sustainable option in consistency with national development goals.On the other side, the implementation cost of this option is higher compared with the first one.
According to the estimations, in 2020, the implementation of the 2-nd option will bring an amountof 41.02 Gg of CH4 emitted and 25.88 Gg of CO2 emitted versus 66.917 Gg of CH4, as foreseenin the baseline scenario.
The implemenation of both abatement options in 2020, will bring an amount of 17.14 Gg of CH4and 49.48 Gg of CO2 or 414.7 Gg of CO2 equivalent, versus 66.917 Gg of CH4 (or 1,405.7 Gg ofCO2 equivalent) emitted in emissions baseline scenario. G
HG ab
atem
ent a
nalys
is

91
Tab. III.13 Expected GHG emissions after implementation of proposed abatement options in waste sector.
2.11 Industrial processes and solvents use
The options for reduction of greenhouse gas emissions, released from industrial processes andsolvents sectors, even though analyzed in a qualitative way are more theoretical ones. Since thecontribution of such sectors in the national greenhouse gases inventories towards 2020 is notsignificant, and the lack of more precise data to analyze them in detail, enforced us to judgethem as inappropriate to be included in the list of measures for abatement of greenhouse gasemissions.
GHG
abat
emen
t ana
lysis

92

93
CHAPTER IV
VULNERABILITY AND ADAPTION
IV1. METHODOLOGY --- 942. EXPECTED CLIMATE CHANGE SCENARIO --- 943. THE EXPECTED IMPACTS OF CLIMATE CHANGES --- 95
3.1 Temperature --- 953.2 Precipitation --- 963.3 Water resources --- 973.4 Natural ecosystems --- 993.5 Managed ecosystems --- 100
3.5.1 Agriculture --- 1003.5.2 Forests --- 100
3.6 Energy --- 1013.6.1 Energy consumption --- 1013.6.2 Energy production --- 103
3.7 Public health --- 1043.8 Population --- 1053.9 Tourism --- 106
4. ADAPTATION OPTIONS AND RECOMMENDATIONS --- 1064.1 Water resources --- 1064.2 Natural ecosystems --- 1074.3 Managed ecosystems --- 108
4.3.1 Agriculture --- 1084.3.2 Forests --- 108
4.4 Energy --- 1094.5 Public health ---- 1104.6 Population, tourism --- 110

94
The UNFCCC calls on all Parties to "…formulate, implement, publish and regularly updatenational and, where appropriate, regional programs containing measures to … facilitate ad-equate adaptation to climate change."
This chapter examines vulnerability to meet this commitment under the UNFCCC. The mainobjectives of the assessment are: identification and evaluation in a scientific manner of theimplication of expected climate changes in hydrosphere, natural and managed ecosystems,population and other human activities; determination of areas or systems which appear to bemost vulnerable to expected climate change; provision of a mode of analysis that will enablepolicy makers and decision makers to chose among a set of adaptation options; and the devel-opment of a set of alternative suggestions / recommendations that must be taken into consider-ation during the process of preparing the national strategies for each sector.
1. METHODOLOGY
The assessment of vulnerabilities and adaptation options is carried out in accordance with theIPCC guidelines (IPCC, 1994). The study is focused on the assessment of the expected climateimpacts on hydrosphere, natural and managed ecosystems, energy, tourism, health and popu-lation. The study area has covered the whole Albanian territory.
Three time horizons are considered: years 2025, 2050 and 2100. Although the year 2100 is fixedas upper horizon, in some cases such as in socio economic assessments, projections are notreliable for more than a few years ahead. For cases like energy, population, etc., the team hasconsidered the year 2025 as the upper level. For others like natural ecosystems, forestry, etc.,that have longer response, the vulnerability assessment is extended up to 2050 and 2100 hori-zons.
A variety of analytical methods in climate impact assessment (CIA) is selected. Among othersworth mentioning are: experimentation, impact projections, empirical analogue studies andexpert judgment.
MAGGIC/SCENGEN package is used to prepare the climate change scenarios for the men-tioned time horizons. The LEAP model is used to evaluate the likely impact of climate change inenergy sector. For the other sectors, statistical models are developed or empirical analoguesare used (regional analogies of present climate and regional analogies of future climate).
Before the evaluation of the climate change impacts, the present situation of all sectors isanalyzed1.Three types of "baseline" conditions are specified (climate, environmental, socio-economic), for a comparison with future projections. As the climatologic baseline, a 30 yearsperiod (1961-1990) defined by WMO as 'normal period', is accepted. Environmental baselinerefers to the present state of non climatic environmental factors, that affect the area under study.The socio - economic baseline refers to the present state of non environmental factors, thataffect the area under study.
After the evaluation of climate change impacts, a set of adaptation options for each relevantsector is identified.The most important measures are further selected, by using screening,effectiveness and multicriteria analysis.
2. EXPECTED CLIMATE CHANGE SCENARIO
The expected Climate Change Scenario for Albania, (CCSA) including seasonal and annualchanges, is indicated in table.IV.1.
1 The present situation of all climate change relevant sectors is developed under the National Circum-stances - Chapter I of National Communication.
Vuln
erab
ility a
nd ad
apta
tion

95
Tab.IV. 1 Climate change scenarios for Albania
The climate change scenarios for Albania leads to an annual increase in temperature up to1°C, 1.8°C, 3.6°C respectively by 2025, 2050 and 2100 and a decrease in precipitation up to-3.8%, -6.1%, -12.5%, by the same time horizons.
3. THE EXPECTED IMPACTS OF CLIMATE CHANGES
3.1 Temperature
An annual temperature around 15 - 17°C will be expected along the coastal zone, by the year2050, pursuing by values between 14 - 16°C over the low and hilly areas. Moving toward moun-tainous zones, the expected temperature will be up to 11 - 13°C. The highest mountainouszones are expected to have a mean annual temperature, up to 9°C. Expected seasonal changesof temperatures and annual temperatures along three time horizons are given respectively infigure IV.1 and figure IV.2.
Fig.IV.1 Expected seasonal temperature changes
Vuln
erab
ility a
nd ad
apta
tion

96
3.2 Precipitation
By 2050, the lowest value of annual precipitation total (about 570 mm) is expected to be regis-tered in the southeast of the country, followed by Myzeqeja zone located in the west, with 950mm, the southwest area with 2,100 mm. The highest value, about 2,650-2,850 mm, is expectedto be registered again over the Alpine zones.The same distribution is likely expected by 2100(the expected change is -12.5 ÷ - 6%, related to baseline). So, these values will be 55 mm, 900mm, 2,000 mm and 2,500-2,700 mm respectively for Myzeqeja, southwest and Alps zone. Theexpected seasonal and annual changes are represented respectively in figure IV.3 and figure
Fig.IV.2 Expected annual temperature changes
Fig.IV.3. Expected seasonal change of precipitation Vuln
erab
ility a
nd ad
apta
tion

97
By analyzing the seasonal temperature and precipitation changes proposed by scenarios wemay expect milder winter, warmer spring, drier autumn, drier and hotter summer. The expectedsevere summer with high temperatures, up to 4.1°C and low precipitation, up to -27% over all theterritory, followed by the increase in drought duration, intensity and frequency may affect nega-tively many sectors.
It is important to emphasize that the outputs of the scenarios should be considered as indicatorsof changes that might occur. By using different relationship for the existing period and physicalarguments, the expected changes in other relevant climatic elements or extreme events arepredicted as follows:
♦ Cloudiness is expected to decrease from -2.6% up to - 4.6% by 2050 related to the year 1990and 2100 respectively;
♦ Wind speed is expected to increase up to 1.3 to 2.3% by 2050 and 2100 respectively inrelation to the period 1961-1990, especially during summer because of the increase in theland-sea temperature contrast;
♦ An increase in the global radiation and the sunshine hours might be expected, due to thecloudiness decrease;
♦ Evapotranspiration is expected to intensify due to the temperature and wind speed increases;
♦ A decrease in the rainy days is expected almost at the same range as the precipitation;
♦ The total number of hailstorm days is expected to decrease, although an increase in suchdays during summer might be expected, owing to the temperature rise.
3.3 Water resources
From the analysis of the seasonal and yearly runoff anomalies, it results that almost all theprofiles show an decreasing trend, which might be explained by the same tendency that precipi-tation shows (Fig IV.4). Comparing the results of the changes in river runoff obtained for theCCSA, which expect an increase of the long term mean annual and seasonal air temperatureand a decrease of mean annual and seasonal precipitation, it can be stated that a decrease inthe long term mean annual and seasonal runoff has to be expected for the whole territory and for
Fig.IV.4. Expected annuall change of precipitation
Vuln
erab
ility a
nd ad
apta
tion

98
all three time horizons (Fig.IV.5).The outputs of models used2 forecast a small decrease in thelong term mean annual runoff, respectively from -9.8% to -13.6% and from -6.3% to -9.1%, for2025. The degree of decrease varies according to the time horizons considered, but both exhibitacceleration in the decrease towards 2100.
2 For assessment of the impact of climate change on the mean annual runoff, two models that relate runoff forming factors(annual sum of precipitation and mean annual evapotranspiration) to the long term mean annual runoff are considered. Thesemodels are predictive ones and are based on statistical relationships.
Fig.IV.5 The average change in mean runoff according to CCSA for three timehorizons: 2025, 2050, 2100.
It would affect the surface water flow, by reducing its amount. Under the reduced surface waterflow and increased evaporation, the storage of reservoirs will decrease, and that would effect theenergy production by hydro power stations.
Because of the reduction of stream flows in the wetlands, the western part of Albania wouldexperience both increasing demands for water and reduced supply of water, which woulddecrease wetland area.
The increase of the extreme events may lead an under designed reservoir or spillway withpotential flood risk.
Other consequences of expected warming include not only changes in total water amount andlevels, but also erosion of riverbeds, and modification of turbidity and sediment load.
The likely reduction of water resources would lead to less dilution flow in the stream. It mightlead to degraded water quality or increased investments in waste water treatment, especially forthe third horizon 2100, where the reduction of the river flow would be very high. Water quality isexpected to degrade in Albania, not only due to the expected climate changes, but also due tonew industrial and agricultural development. The main hot spots for this problem are the dis-tricts of Tirana, Fier, Korçë, Kavajë, Durres, Vlorë, Elbasan and Berat.
The ground water supply will be affected by decreased percolation of water, due to decrease inthe amount of precipitation and stream flow and as well as losses of soil moisture from in-creased evapotranspiration. This can lead to the increase of pumping costs. The predicted sealevel rise of 20-24 cm by 2050 is not expected to have significant impact on ground water,whereas the sea level rise of 48-61 cm expected by 2100 will cause the increase in the salinityof aquifers especially for the coastal area. This effect will be more significant in Fushe Kuqe andDurresi plain. Fushe Kuqe has very important aquifers, because it supplies drinking water to the
Vuln
erab
ility a
nd ad
apta
tion
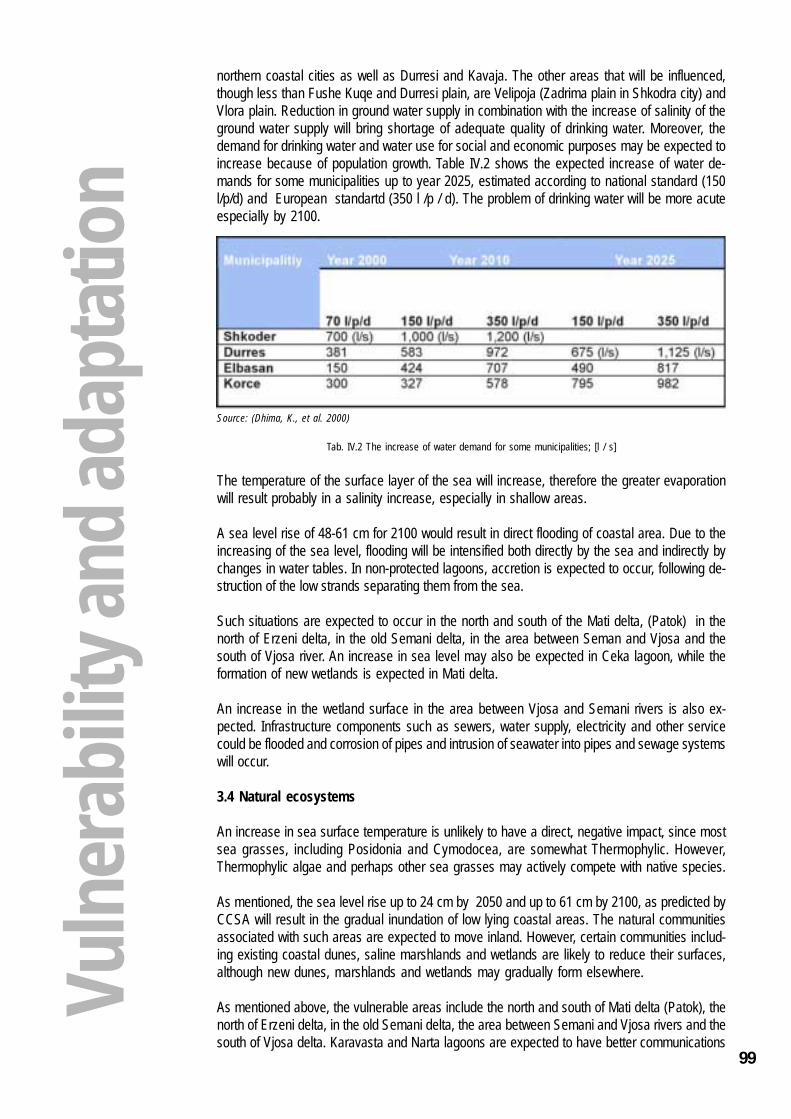
99
northern coastal cities as well as Durresi and Kavaja. The other areas that will be influenced,though less than Fushe Kuqe and Durresi plain, are Velipoja (Zadrima plain in Shkodra city) andVlora plain. Reduction in ground water supply in combination with the increase of salinity of theground water supply will bring shortage of adequate quality of drinking water. Moreover, thedemand for drinking water and water use for social and economic purposes may be expected toincrease because of population growth. Table IV.2 shows the expected increase of water de-mands for some municipalities up to year 2025, estimated according to national standard (150l/p/d) and European standartd (350 l /p / d). The problem of drinking water will be more acuteespecially by 2100.
Source: (Dhima, K., et al. 2000)
Tab. IV.2 The increase of water demand for some municipalities; [l / s]
The temperature of the surface layer of the sea will increase, therefore the greater evaporationwill result probably in a salinity increase, especially in shallow areas.
A sea level rise of 48-61 cm for 2100 would result in direct flooding of coastal area. Due to theincreasing of the sea level, flooding will be intensified both directly by the sea and indirectly bychanges in water tables. In non-protected lagoons, accretion is expected to occur, following de-struction of the low strands separating them from the sea.
Such situations are expected to occur in the north and south of the Mati delta, (Patok) in thenorth of Erzeni delta, in the old Semani delta, in the area between Seman and Vjosa and thesouth of Vjosa river. An increase in sea level may also be expected in Ceka lagoon, while theformation of new wetlands is expected in Mati delta.
An increase in the wetland surface in the area between Vjosa and Semani rivers is also ex-pected. Infrastructure components such as sewers, water supply, electricity and other servicecould be flooded and corrosion of pipes and intrusion of seawater into pipes and sewage systemswill occur.
3.4 Natural ecosystems
An increase in sea surface temperature is unlikely to have a direct, negative impact, since mostsea grasses, including Posidonia and Cymodocea, are somewhat Thermophylic. However,Thermophylic algae and perhaps other sea grasses may actively compete with native species.
As mentioned, the sea level rise up to 24 cm by 2050 and up to 61 cm by 2100, as predicted byCCSA will result in the gradual inundation of low lying coastal areas. The natural communitiesassociated with such areas are expected to move inland. However, certain communities includ-ing existing coastal dunes, saline marshlands and wetlands are likely to reduce their surfaces,although new dunes, marshlands and wetlands may gradually form elsewhere.
As mentioned above, the vulnerable areas include the north and south of Mati delta (Patok), thenorth of Erzeni delta, in the old Semani delta, the area between Semani and Vjosa rivers and thesouth of Vjosa delta. Karavasta and Narta lagoons are expected to have better communications
Vuln
erab
ility a
nd ad
apta
tion
100
with the sea in the future. This will change the present ecosystems, gradually to a completesaline ecosystem. Changes in these wetland areas, besides favoring the halophylic vegetation,will also affect many bird species through loss of nesting, breeding, staging and wintering habitat
The sea level rise will impair estuarine water quality in other subtle ways, contributing to thedegradation of in situ conditions for aquatic biota (e.g. increased temperature results in lowerdissolved oxygen) and the increase of the health risks of the population, dependent on withdraw-als of fresh water from the rivers.
3.5 Managed ecosystems
3.5.1 Agriculture
Agriculture will also be affected by expected climate changes. These changes will modifyrainfall, evaporation and soil moisture storage, leading to the increase of the irrigation require-ments and a more decrease of the capacity of reservoirs and irrigation distribution systems
The available water resources will be sufficient for irrigation by 2025. Thus, no considerableimpact on the yields of crops like wheat, maize, potato, vegetables, forages (alfalfa etc.) fruit treesetc. may be expected by 2025.
But, if appropriate measures will not be taken for the rehabilitation, the maintenance and improve-ment of the conveyance and distribution systems, the insufficient irrigation would be again a moreimportant restrictive factor to the yield crops, for the other time horizons (the period 2050, 2100).
Referring to the other time horizons, 2050 and 2100, the expected impacts on agriculture to beexpected are: the reduction of the extent of arable land, due to soil erosion and alteration; thechanges in the growth cycles, harvest time and the quality of the agricultural production, espe-cially along the coastal area, owing to an increase in salinity because of the sea level rise andintrusion of salt water into the soil; the cultivation of early agricultural products in the open air orin greenhouses, owing to an increase in winter temperatures.
Using the time horizon 1990 as a reference by 2025, the impacts3 to be expected are: thepotential citrus growing area would be adapted to the conditions (temperature and precipitation)in higher elevations about 150 m; the potential olive growing area would be adapted to theconditions (temperature and precipitation) in higher elevations about 150 m ; the potential citrusarea would enlarge from about 13,6285 ha (in 1990) to 36,2527 ha; the potential olive area, inwhich the year 1990 was about 474,993 ha, would be 598,090 ha.
3.5.2 Forests
As regards the forest sector, referring to the CCSA, a summary of the expected extensions ofvegetation flats by, 2025, 2050, 2100 related to 1975, is provided in figure IV.6.
By 2100, the area of Eu-Mediterranean evergreen forests of Lauretum in generally, would beincreased from 42,9 % to 62,6 %. Mainly, the area of Eu-Mediterranean evergreen forests ofwarm Lauretum would be increased from 9,0 % to 44,0 %. The area of Eu-Mediterraneanevergreen forest mixed with deciduous tree of Lauretum flat (Lm- middle Lauretum) would bereduced from 22,5 % to 7,0 % by 2100. That of deciduous forest of Lauretum flat (Lc-coldLauretum) would be reduced from 11,4 % to 7,8 % by 2050, followed by the increase to 11,6 %by 2100. The area of deciduous forests of Castanetum flat in general, would be increased from
3 In both cases surface of the potential citrus and olive areas are calculated based only in temperature and precipitation indi-ces; respective calculations and findings presented in Chapter 3.5.4 (Forestry) have been used.
Vuln
erab
ility a
nd ad
apta
tion

101
16,6 % to 23,2 % by 2050 and later would be reduced to 21,5 %. The area of Cw-warm Castanetumwill change from 10,8 % to 17,9 % and later 17,2 %, while, that of Cc-cold Castanetum would bereduced from 5,8% to 4,3%, by 2100.
The species that resist high temperatures and severe long dry seasons would be able to overlive. For those that need moisture (silver fir, etc.), the danger of being limited in distribution ordisappearing does exist. The species that produce many small seeds and have a high distribu-tion potential (Pinus etc.) would be able to survive and to spread at sealevel, whereas oakspecies, which produce big seeds, would occupy new areas but very slowly.
Fig.IV.6 Expected expansion area of vegetation flats [%]
Sea level rise, by directly influencing the increase of the ground water levels and composition,would limit the growing of some species that do not like moisture and salt along the Adriaticcoast.
3.6 Energy
Climate change is expected to have significant impacts on the energy sector. Predicted raisedtemperatures, changes in the amount of precipitation, variation in humidity, wind patterns, andthe number of sunny days per year, could affect both energy consumption and production.
3.6.1 Energy consumption
Climate change is likely to affect the major electric end-uses such as space heating, spacecooling, water heating and refrigeration. The frequent increases of extreme events might resultin some regional changes in the energy consumption, if such events will bring about populationshifts. Referring to the CCSA, an expected decrease in heating degree days is foreseen. Threezones are selected for the estimation of the expected rate of decrease of heating degree daysup to 2025, related to 1990.(Tab. IV. 3.)
Vuln
erab
ility a
nd ad
apta
tion

102
Tab.lV.3 The expected rate of decrease of heating degree days, related to 1990
By comparing the energy scenarios (demand side) up to the year 2025, developed by consider-ing or not considering the expected climate change impacts in residential sector, it results thatenergy demand for three zones (I. II.and III) is expected to be respectively reduced from 318.99kTOE, 301.04 kTOE and 156.26 kTOE to 266.93 kTOE, 253.96 kTOE and 138.15 kTOE.
In order to reflect more clearly how the climate changes (decrease in heating degree days)affect the energy demand for space heating in particular and energy demand in residentialsector in general, we have estimated this difference and presented it in figures IV.7, IV.8, and IV.9as follows:
Fig. IV.7. Projected changes in energy demand for space heating for 1-rst zone reflected to the changes in heating degree days.
Fig.IV.8. Projected changes in energy demand for space heating for 2-nd zone reflected to the changes in heating degree days.
Vuln
erab
ility a
nd ad
apta
tion

103
Fig. IV.9. Projected changes in energy demand for space heating for 3-rd zone reflected to the changes in heating degree days.
From figures IV.7, IV.8, and VI.9, it is evident that energy demand for space heating in the alterna-tive scenario will decrease in each zone, compared to baseline scenario, due to the projecteddecrease in heating degree days.
It would be interesting to know the impacts of climate changes in energy demand for spacecooling in residential sector, since this energy service will play an increasing role in the future.Thesame can be said for service sector, concerning the energy demand for air conditioning. Anyway,the lack of forecasted changes in cooling degree days was an important factor, for not providingtheir impact quantitatively. Based on the scenario of the temperature changes, we can say in aqualitative way, that the expected cooling degree days will mark an increase. The energyintensity for space cooling will be increased as well. This will be an issue to be tackled in thefuture.
3.6.2 Energy production
Changes in energy consumption as result of predicted climate changes, will also lead to changesin energy production. Climate changes impacts may be primarily analysed in power generationsector, including hydro power plants, thermo power plants, solar heaters systems and windpower plants.
A reduction of 20% in natural water runoff was projected to cause a reduction of 60% in hydropower generation, whereas a 20% increase was projected to cause an increase in generation of40%. In areas where it becomes hotter and drier, the hydro power generation could be virtuallyreduced year round. A reduction in hydro power generation is expeced.
Albania is heavily reliant on hydro power electricity production. If a severe drought will happen, itwill result in less electricity produced by the hydro power plants.The heavy reliance on hydropower sources may be appropriate for reducing greenhouse gas emissions and improving airquality in Albania, but can increase vulnerability to climate change. Taking into account themean annual change in river's water flow, a new Energy Scenario, which considers climatechange impacts 1990 - 2025 (supply side) is developed. Figure IV.10 and IV 11 represents theelectricity generation up to the year 2025, and the share between hydro power plants and thermopower plants. According to the above figures, we can conclude that the electricity generation isexpected to increase from 1,795 GWh in 1990 up to 23,816 GWh in 2025. The share betweenhydro power plants and thermo power plants is expected to go in favor of the latter. So in 1990,94% of the electricity was generated from hydro power plants and only 6% from thermo powerplants, while in 2025 hydro power plants is expected to contribute by 11,353 GWh or 47.68% andthermo power plants with 12,460 GWh or 52.32 % of the total. Vu
lner
abilit
y and
adap
tatio
n

104
Fig. IV.10 Electricity generation according to the alternative scenario. [GWh]
Fig.IV.11 Shares of electricity generation by HPPs and TPPs according to the alternative scenario; [GWh]
Thermo power plants are expected to cover the largest share of electricity generation in 2025,compensation even for the part of electricity not produced by hydro power plants, due to theexpected climate change impacts. This is a very important conclusion to be considered bypolicy / decision makers, while preparing strategic plans for development of the energy sectorin the future.
Climate change may also affect the supply of energy from solar and wind power. A likely in-crease in the global solar radiation and the hours of sunshine duration will lead to an increasein the use of solar energy for different energy services, especially for the preparation of domestichot water.
Since, we are expecting an increase in the wind speed up to 1.3 to 2.3 %, by 2050 and 2100respectively, compared to the period 1961-1990, it might be interesting to think about introduc-ing wind power plants in the energy schemes in the future.
3.7 Public health
Referring to the likely changes of climate a series of impacts on public health are expected.Shortage of drinking water of adequate quality could be especially critical during summer time.Consequently, an increase of contagious diseases cases, digestive system diseases, etc., isexpected. Vu
lner
abilit
y and
adap
tatio
n

105
The liquid and solid wastes, if discharged directly into the sea, are expected to destroy orstrongly modify the sea flora and fauna. If these problems would not solved, the impact of climatechange would lead to the deterioration in the health of the population, living especially in thecoastal area.
The increase in temperature would affect the physiological and compensatory system of healthypeople. Thus, age groups like: infants, children and elders where the decrease in compensa-tory system is common, will have changes in their health conditions, which would cause higherincidence of some diseases influenced by atmospheric changes. The infections in the respira-tory system will be the most visible.
3.8 Population
The population living in coastal area, particularly in beach areas, is seriously threatened by theexpected increase, in the sea level. The entire dwelling places, hotels, roads and agriculturalareas etc., situated in the lower zones of the Adriatic coastal line (excluding the territories underthe effect of raising movements) will be flooded.
The beaches in the areas affected by land subsidence (those of Shëngjin, Kune-Vain, Tale,Patok, Ishëm), and a substantial number of fields (drained in the late 50’s and early 60’s.) will beswept over by floods. Likewise, these floods will find their way into important segments of thelocal and national roads (including a part of the new road Fushë Krujë-Lezhë running throughthe former Lac swamp land), potable water supply sources (located in Lezha and Lac plains), aswell as many lodging and tourism structures which have been, and continue to be built alongthese beaches.
Also, the floods will partially affect the beaches situated in the territories undergoing elevation(those of Durrës, Golem, Divjakë, Himarë, Borsh etc.), in addition to the tourism infrastructure.The same lot is expected to affect the agricultural land (in the former swamps of Durrës, Myzeqe,Narta, Vrug etc.) as well as dwelling centers and rural infrastructure, which reach up to 50 cmabove the sea level. Figure IV.12 illustrates the expected shift of coastline by 2100 for thethree areas (Patok, Durrës, Karavasta-Ndërnenas) along the Adriatic coast.
Patok Karavasta Fig.IV.12. Some areas threatened by sea-level rise by 2100
Vuln
erab
ility a
nd ad
apta
tion

106
3.9 Tourism
Coastal tourism is expected to suffer the vulnerabilities caused by sea level rise. The possibilityof creation of new beaches (in a natural way) does exist, but building a new tourism infrastruc-ture would require huge investments. On the other hand, considering the increase in tempera-ture from 2.8 to 4.1°C during summer time a general inclination of tourism, towards the moun-tains or the lakes, instead of the beaches is expected. The coastal tourism would be morepreferable by the end of spring and beginning of fall. However, like other Mediterranean coun-tries, the services sector, especially tourism in Albania will occupy the first place, during the nexthalf of this century, in the whole coastal area, involving employment, as well as income genera-tion.
4. ADAPTATION OPTIONS AND RECOMMENDATIONS
A set of adaptation options for each sector has been identified. The adaptation options areidentified, taking into consideration such principles like prevention of loss, tolerating loss, shar-ing loss, changing use or activity, changing locations, research and restoration.
4.1 Water resources
This paragraph identifies adoption measures for water resources and marine waters and in-cludes:
♦ Modification of existing physical infrastructure.Possible adaptations to address changed flows as a result of climate change include:
-Modification of existing reservoirs;-Removal of sediments from reservoirs for more storage;-Modification of existing irrigation systems;-Modification of the coastal infrastructure.
♦ Construction of new infrastructure.In river basins, where full development is not occurring yet, new projects could be developed toadopt the change runoff and water demand conditions like:
-Construction of new reservoirs;-Construction of the new hydro power plants;-Construction of new thermo power plants;-Construction of waste water treatment plants;-Construction of coastal infrastructure such as dams to protect wetland ecosystems;-Construction and maintenance of tide gauges network.
♦ Water pollution control.Reduced runoff from climate change will most likely increase concentrations of pollutants in thewater column which must be monitored.
♦ Improvement of the monitoring and forecasting system for flood and drought.Climate change is likely to affect the frequency of floods and droughts. Monitoring systems willhelp in coping with these changes.
♦ Drafting and approval of new legislation for water use.Reduction of the demand can increase excess supply, creating a greater margin of safety forfuture droughts. Demand for water may be reduced through legal restrictions on water use.
♦ Setting a real water consumption fee.In Albania, the water supply enterprises charge the consumer with a modest fee, which however Vu
lner
abilit
y and
adap
tatio
n

107
do not fully cover the cost. Thus, in the circumstances of reducing drinking water due to climatechanges, the real price for water consumption is an adoption measure, which should be takeninto consideration.
♦ Implementation of the Integrated Coastal Zone Management Plan.Short-term and long-term measures could help the development of the coastal zone, taking intoconsideration climate changes.
4.2 Natural ecosystems
As a response to climate change, the species and ecosystems will adapt autonomously. In thatsense, impact assessment is the task of identifying those species and / or ecosystems that areleast likely to adjust to a changing climate. However, in the absence of significant evolutionarychange, species are dependent on their inbuilt phenotypic plasticity and capabilities in order torespond to climate change. Thus, their ability to autonomously respond to climate change isinherently limited. If suitable habitat conditions disappear entirely, or shift in a position faster thana population can react, extinction will occur and the outcome will be the ecosystem simplifica-tion.
The primary goal of adaptation in the biodiversity sector is to ensure that natural ecosystems areable to respond to climate change to the limits of their capabilities. An effective strategy forachieving this, is to reduce or remove existing pressures.
It is possible to adopt policies and practices which assist species in adjusting to climate change,for example by designating and protecting migration corridors. In a changing climate, one mustexpect the unexpected and keep open as many response options as possible. Various adapta-tion measures are available to aid efforts of supporting the conservation of biodiversity in the faceof climate change, including:
♦ The establishment and maintenance of protected areas (in-situ conservation).It is important that the required steps are taken to enlarge the system of protected area inAlbania, as proposed by the Albanian Biodiversity Strategy. The enlarged protected areas, ifappropriately protected and managed will maintain the productivity, vitality and health of naturalecosystems they comprise, which in response may increase their carrying capacity, availabilityof food and shelter for emarginated living organisms.
♦ The active management of wild populations outside of protected areas (inter-situ management).It is obvious that most of the territories fall outside the protected areas system. Thus, the mainte-nance of vital populations of wild animal and plant species is very much dependent on the wayhow we manage territories outside protected areas. Special attention should be paid to plantand animal species, that are more vulnerable and sensitive to climate change, whose survival isnot ensured unless if no active management measures are taken outside the protected areas.
♦ The maintenance of captive populations (ex-situ methods).For a number of animals and plant species neither in-situ nor inter-situ conservation measuresmight be applicable or viable and their survival in the wild is not any longer ensured. Theirextinction in the wild is not reverse. The only measures to be taken are those of ex- situ conser-vation. Hence, the support of the Botanical Garden in Tirana to realize ex-situ preservation ofendemic and endangered species is an important action, which should be complemented withthe future development of such practices for animal species in the long-term. At the same time,the strengthening of the genetic banks within the National Seed Institute, and a laboratory ofdeep freezing should include preservation of the genetic material of wildlife species Vu
lner
abilit
y and
adap
tatio
n

108
♦ Monitoring.This is an important research priority, both for biodiversity conservation and because plant andanimal populations serve as barometres of ecosystem integrity. As a first step, a map of the mostsensitive biotopes should be prepared, beginning with those of protected areas (within first 5years), and later for the rest of the country (5-20 years). Within this activity, the mapping of seameadows with Posidonia oceanica and Cymadocea nodosa, and those environments with reedcoral (Coralum rubrum) and (Lipthophaga lipthophaga), collected by fishermen and divers(within 1-3 years), has been proposed.
4.3 Managed ecosystems
4.3.1 Agriculture
To adapt the likely impacts of climate change on agriculture the following actions are recom-mended:
♦ Afforestation and the setting up of the barriers to protect the arable land threatened by soilerosion and alteration
♦ Planning of agricultural production toward xerophilic crops to allow adaptation to the higherwinter and summer temperatures and to the scarcity of water in summer.Agricultural development should be adjusted towards species that would adapt best to theexpected soil and atmospheric conditions.
♦ A significant improvement in irrigation sector.The improvement will be done through application of the following measures:
-Rehabilitation of irrigation schemes;-Improvements of the conveyance systems;-Construction of new public schemes;-Completion of ongoing works;-Modernization of on-farm distribution systems;-Development of private pumping schemes;-Private groundwater development;-Participation of farmers through Water User Associations;-Consolidation of extension organizations for irrigated crops;-Introduction of new irrigation techniques.
♦ In plant protection from different pests and diseases.This measure will be carried out through application of the following measures:
-Study and monitoring of more important pests and diseases;-Control of the pests and their diseases on the basis of Good Plant Protection Practices and Integrated Pest Management approaches;-Introduction and breeding of new species and hybrids which are resistant to particular pests or diseases;-Limitation of chemical control in order to decrease the pesticide residues in plant and animal organisms;-Consolidation of research and extension organizations which provide technical assistance to the farmers on plant protection issues.
4.3.2 Forestry
To adapt the forests against the predicted impact by climate change, the following measuresare proposed: Vu
lner
abilit
y and
adap
tatio
n

109
♦ Preparation of the Strategy of Sustainable Development of Forest.This strategy must consider the implications of climate change and carbon balance, to favormore adapted species against expected climate change and sea level rise, and also speciesthat do not have the capability to occupy the same flats in new conditions.
♦ Preparation and implementation of the research programs.These programs will aim at the management of forest unit on genetically resources, adapting ofthe forest species and provenance, production of hybrid, better adapted to climate change andsea level rise and, identification of better adapted cultivation systems.
♦ Evaluation of the actual situation for each forest type, in relation with climate change and sealevel rise.
♦ Increasing of the protected forest area.
♦ Reduction of the illegal cuttings at the maximum extent and studying of the real need forfuelwood.Reduction of the wood consumption for energy by replacing fuel wood with other non-pollutant fuels.
♦ Increasing of the investments to implement more actions in existing forests and environmental protection areas.Increasing of the investments would reduce and unemployment and emigration, as well.
♦ Implementation of actions to increase the existing forest productivity (rehabilitation of thedegraded forests, conversion of the coppice and shrub forests to high stem forests or plantingthe fast-growing species or more capable species to sink CO2 emissions). It is important to havemix forests in an area over half of total forest area and, to manage better the prund forest area(mainly oak and beech forests) for fodder in conditions of small livestock husbandry increasing(mainly goats).
♦ Increasing of the forest area through the new reforestation.This measure will be implemented by using species that could adapt the expected changes ofclimate and, more capable species to sink the CO2 emissions especially on the eroded landsand refused agriculture lands (an area of about 120,000 ha).
♦ Study and monitoring of the forest health situation as well as effects of applied measures inforests.Monitoring is important because the undistinguished factors could reduce the chlorophyll pho-tosynthesis activity leading looses of bioms. Also monitoring of the fire situation in forests isimportant.
4.4 Energy
The list of adaptation options, dealing more with reduction of water flow on hydro power plants,must be effectively considered in a careful and detailed analysis. These options are as follows:
♦ Consider expected change of runoff / water flow rate in integrated resource planning.The integrated resource plans for power providers must be adjusted by accounting the uncer-tainty in future water flow rates that is generated by uncertainty in future water flow rates which iscaused by uncertainty in climate change. For some power providers, the consideration of poten-tial impacts could lead to less investment today in hydro power, (as described in alternativescenario) relative to non hydro power plants, while other may conclude that reactive adaptation.is more efficient than anticipatory adaptation. Vu
lner
abilit
y and
adap
tatio
n

110
♦ Account for the expected change in runoff / water flow rate in the design of hydropower plants.Hydro power facilities can be designed to accommodate lower and/or variable flow rates by:
-Building hydropower intakes at the lowest possible level;-Making hydropower plants intakes adjustable; and-Using variable blade turbines, which are adjustable to more variable conditions.
♦ Invest in energy conservation (Demand site Management) measures for space cooling.Power providers could make investments today in assisting consumers with the installation ofDSM measures for space cooling, e.g., building shell improvements, advanced, energy efficientand advanced space cooling technologies.
♦ Reduce energy subsidies.In Albania, as in many other ex-socialist countries, energy prices, particularly electricity, aresubsidized. Thus consumers pay less than the marginal costs of producing energy. Subsidiescan result in a wasteful consumption of energy and can distort the market signals regardingchanges in supply and demand ,caused by climate change (price will not increase sufficientlyto reflect changes in supply and demand).
♦ Account for the expected change in runoff/water flow rate in the design of thermal powerfacilities.Thermal power plants, drought and/or more variable flow conditions adversely affect the supplyof cooling water. This suggests that the anticipatory measures should be taken in constructingcooling water intakes for new power plants, low enough to accommodate changes in flowlevels.
4.5 Public health
To adapt to the impact of the expected changes, it is very important to take the necessarymeasures to:
♦ Permanent control monitoring of the drinking water quality;
♦ Permanent control over water supply and sewerage systems affected by salt-water corrosionand intrusion in coastal areas;
♦ Permanent monitoring and drafting of a new law on air quality;
♦ Improvement of the solid wastes collection and treatment technology;
♦ Compilation of long term plans for the urban development;
♦ Elaboration of an reliable medical and statistical program that will help in finding the causeconsequence (climate changes - health ) correlations.
4. 6 Population, tourism
As expected by 2025, about 60 % of the population would be settled in the capital and the coastalarea. The major economic sector will be that of services, which is expected to employ 40-50%of the active population in this region. To have a good functioning of the services sector, thefollowing measures need to be taken:
♦ The provision of new potable water supply resources and the construction of new watersupply, filtration and distribution systems. Vu
lner
abilit
y and
adap
tatio
n

111
This measure is feasible to be implemented due to availability of water resources and low costsinvolved.♦ The provision of new power supply resources and the rearrangement of the appropriatedistribution system.The use of renewable energies can be one of the alternative sources.
♦ The construction of new sewage systems for both households and industry, as well as newprocessing units for all the urban waste.Although it is a high cost measure, it is still indispensable for environmental rehabilitation in bothresidential and tourist areas.
♦ The rehabilitation of several road segments, and the construction of new roads, compatiblewith international quality standards, with high embankments so as to handle the rise of the sealevel.This is the primary condition to be met. It will facilitate the development in general and touristactivities in particular and will also have a positive impact on the minimization of personal losses,evacuation etc.
Vuln
erab
ility a
nd ad
apta
tion

112

113
CHAPTER V
NATIONAL CLIMATE CHANGE ACTIONPLAN (NCCAP)
V1. SCOPE AND METHODOLOGY --- 1142. RELATED STRATEGIES AND MEASURES --- 1153. CLIMATE POLICY --- 116
3.1 Abatement policies and measures --- 1163.2 Adaptation policies and measures --- 119

114
Although Albania has no emission reduction targets under the UNFCCC as a non-Annex I Party,attempts to address the climate change issues are made. In Albania, no comprehensive nationalpolicy to address climate changes has been adopted to date. During the period of political andeconomic transformation of the society and the development of a new state, a range of acts,regulations and measures, indirectly related to greenhouse gasemission reduction are devel-oped and even adopted.
Although climate change is not a priority for Albania, the effective implementation of the climatechange measures may require the development of response measures that are primarily de-signed to achieve other development objectives. Fortunately, many mitigation and adaptationmeasures have multiple benefits and will contribute to the achievement of sustainable develop-ment goals.
Albania is addressing mitigation and adaptation measures through NCCAP (National ClimateChange Action Plan), which consists of a set of priorities for action to integrate the climate changeconcerns into other economic development plans. This seems to be one of the most majorchallenges of this process, aiming the reduction of the growth rates of greenhouse gas emissionsand adaptation to expected climate changes.
1. SCOPE AND METODOLOGY
The NCCAP is primarly focused on two directions and addresses:♦ Measures to abate greenhouse gases emissions;♦ Measures for adaptation to the expected climate changes;
Expected outcomes from this NCCAP are as following:♦ Reduction of greenhouse emissions;♦ Reduction of the vulnerability;♦ Adaptation to expected climate changes;♦ Promotion of sustainable development;♦ Reduction of poverty;♦ Protection of the environment;♦ Institutional strengthening;♦ Capacity building on climate change;♦ Establishment of the legal framework to address climate change;♦ Public awareness on climate change.
The NCCAP is designed in a sectoral approach where adaptation and abatement measures areaddressed. A broad range of possible sectorial and cross-sectoral issues are addressed andthen the most appropriate ones for our circumastances are selected.
The selection of abatement and adaptation options is made on the bases of:♦ Cost-effectiveness (i.e. low or negative cost per ton of emission reduction);♦ Emissions reduction potential (estimated total tons of emission reduction);♦ Contribution to other national development goals ;♦ Technological benefits (potential to gain an early lead in new technologies);♦ Level of barriers;♦ Potential for GEF or other Convention mechanisms support;♦ Contribution to minimization of risk;♦ Contribution to minimization of economic losses.
The findings of the greenhouse gaes inventory, abatement analysis and vulnerability assess-ment are the basic inputs used for the compilation of this plan. N
CCAP

115
During the development of the NCCAP the lessons learned from past climate change andenvironmental planning efforts, are considered. These include:
♦ Integration with other development plans and programs and measures that have multiplebenefits
♦ Involvement of key governmental and non-governmental stakeholders.♦ Practical orientation♦ Flexibility of the plan in order to be regularly updated, to reflect changing circumstances.♦ A high level of awareness among policymakers and stakeholders on climate change issues
2. RELATED STRATEGIES AND MEASURES
Strategies and developed measures indirectly related to greenhouse gases emission reductionare as follows:
♦ The revised National Environmental Action Plan.This is a five year revised plan the and is recently adopted by Albanian Government and a d -dresses explecitely, for the first time, the climate policy as one of the components of the envi-ronmental protection policy.
♦ Amended Law on "Environmental Protection" No.8364, date 02.07.1998.This law addresses the full spectrum of environmental policy issues in Albania.
♦ Energy Strategy.This is a draft strategy for energy sector up to the year 2010, which aims at the efficient use ofenergy, creation of a legal and institutional framework in compliance to the national and inter-national legislation on environmental protection.
♦ Strategy on Forestry Development.The basic strategic goal of the adopted Stategy of Forests is the conservation of forests inAlbania.
♦ Urban Waste Management Plan.The adoption of this plan has created the premises for the treatment of urban waste in sixmain cities of Albania, by applying a contemporary technologies.
♦ Strategy of Agriculture.The adopted policy is focused on the development of a sustainable and ecological agriculturein Albania.
♦ National Action Plan for Health and Environment.This plan was adopted by the Albanian Government in 1999. The basic goals of this plan arerelated to the ecological sustainable development and prevention and control of health andenvironmental risks.
♦ Growth and Poverty Reduction Strategy.This is a mid-term economic development plan of the Albanian Government, which highlightsthe environmental poverty linkages, emphasizes the need to reverse environmental degradation,rehabilitate heavily polluted areas that jeopartize human health, and to ensure the sustainableuse of natural resources.
♦ Biodiversity Strategy.The aim of this strategy is the protection and improvement of the biological diversity andNC
CAP

116
landscape of the country, and providing a sustainable environment for future generations throughthe application of sustainable development policies,
♦ Water strategy.This draft strategy aims at the protection and efficient use of water resources in Albania.
3. CLIMATE POLICY
The implementation of the recomended abatement and adaptation measures requires coordi-nated actions between the Ministry of Environment and other relevant ministries and govern-mental agencies, non governmental organizations and the public.
The main responsibility in the implementation process of the climate change action plan be-longs to the Ministry of Environment as the governmental body responsible for environmentalpolicy in the Republic of Albania.
The establishment of Interministerial Climate Change Committee is the main step towards theimplementation process of the climate change action plan. The climate change action plan asa long term plan (up to 2020) and must be reviewed on regular basis, taking into account andmonitoring the following indicators:
♦ new development plans for the relevant sectors;♦ changes in legal framework;♦ the state-of-art data on climate change;♦ national environmental strategy;♦ future developments of the UNFCCC and negotiating process;♦ eligibility of funds from convention financial mechanisms and other international sources;♦ amount of the funds allocated for the implementation of the action plan;♦ level of public awareness on environmental policy.
3.1 Abatement policies and measures
The objectives of the abatement policy are primarly focused on the energy sector, as the mainsource category of emissions, which also has large abatement potentials. As concluded by theabatement analysis, the measures to be introduced in the energy sector consist in the increaseof energy efficiency, increase and improvement of energy savings, use of economic, regulatoryand legal instruments for energy efficiency and saving.
Development of sustainable transport is the focus of the measures to be introduced in thetransport sector.
With regard to the forest sector, the main policy goal is the preservation of forests and develop-ment of new management options.
In agriculture sector, the main tasks consists in the increase of production efficiency by improve-ment of genetic parameters. The reduction of fertilizer amounts and development of ecologi-cally-economically sustainable agriculture are other main goals.
The recomanded policies and measures aimed at reducing greenhouse gas emissions bysectors are summarized in the following box.
NCC
AP

117
Box V.1 Abatement policies and measures
NCC
AP

118
NCC
AP

119
3.2 Adaptation policies and measures
The aim of the adaptation policy is to develop a climate change policy that is specifically gearedtowards more vulnerable sectors in the country and to establish a public policy, which encour-ages and supports adaptation at local or community level and in the private sector.
Another goal is the development of sustainable economic growth, which, in return, allows for agreater allocation of resources to the development of adaptive technologies and innovations.
The following box summarizes the adaptation policies and measures, regarded as the mostimportant for adaptation to the expected climate changes in Albania
NCC
AP

120
Box. VI.2 Adaptation policies and measures
NCC
AP

121
CHAPTER VI
PUBLIC AWARENESS, EDUCATION ANDTRAINING ON CLIMATE CHANGE
VI1. PUBLIC AWARENESS ON CLIMATE CHANGES --- 1222. EDUCATION ON CLIMATE CHANGE --- 1233. TRAINING AND CAPACITY BUILDING --- 1234. FOLLOW – UP ACTIVITIES --- 125

122
Capacity building in the area of climate change, including awareness, education and training, isa crucial pre-requisite for any serious effort in that regard. Building of national capacities throughdevelopment and promotion of education, public awareness, training programs on climate changesand related issues, is a general obligation to UNFCCC and an important component of theimplementation process of the UNFCCC.
1. PUBLIC AWARENESS ON CLIMATE CHANGES
Despite the increasing public awareness regarding environmental issues in general, the issueof climate change in Albania is still relatively dormant, even the policy makers do not have a verygood understanding of the climate changes, of the implications of expected climate changes, ofthe potential benefits of the response measures for mitigation and adaptation to climate change,and the importance of meeting the commitments under the UNFCCC and achieving its ultimateobjective.
The preparation of the Albanian’s First National Communication, to the COP of UNFCCC is thefirst step in the fulfillment of the country’s commitments under the UN Framework Convention onClimate Change. These comprehensive results of the conducted work, under the frame of thisdocument, show that raising awareness and the level of education and training on that issue isvery important, in order to expect effective implementation of the National Climate ChangeAction Plan and meeting obligations to the Convention.
Prior the start of the GEF funded project on National Communication no public awarenessactivities have been organized in Albania. Although raising of public awareness is not the imme-diate objective of this GEF funded project. The process for the preparation of the First NationalCommunication has positively contributed to awareness raising, among all stakeholders.
The preparation process of the first National Communication has also contributed to the enhance-ment of general awareness and knowledge on climate change related issues in Albania; strength-ening of the dialogue, information exchange and cooperation among all relevant stakeholdersincluding governmental, non-governmental, academic and private sectors; and building nationalcapacities.
The Project Steering Committee meetings and joint efforts of ensuring the support from thegovernmental institutions for the project, have served as a way of raising awareness amongpolicy makers who represent different climate change institutions. These policy makers areexpected to also provide support for the adoption and implementation of the National ClimateChange Action Plan.
The workshops organized in the frame of the GEF funded project on National Communicationhave contributed to the same purpose of awareness raising, namely: the project initiation work-shop held in March 1999 in Tirana, Albania and the workshop for finalization of the First NationalCommunication, held in April 2002.The aim of the project initiation workshop was to launch theproject on National Communication and to raise awareness on climate change. This workshopbrought together participants from relevant project sectors. During this workshop, the projectobjectives and activities were presented. It also took stock of and clarified the links with otherongoing or already finalized activities relevant to the project, identified existing national capaci-ties relevant to the project, reviewed the draft-working plan and clarified the institutional andother practical arrangements. Since it was the first workshop on awareness building for climatechanges in Albania, the workshop participants were informed about the greenhouse effect,climate change and its impacts, and other related issues. The CC: TRAIN materials were usedand the film titled “ What is greenhouse effect”, produced by Information Center of UNEP, was puton show during this workshop.
The finalization workshop of the First National Communication was organized as a joint event Pub
lic aw
aren
ess .
...

123
with ECAT(Environmental Center for Administration of Technology) of Tirana, which recentlyhas managed the regional project: Building capacities on climate change in Balkan region,funded by the Ministry of Environment and Physical Planning of Greece. During this workshop,the key findings of the First National Communication were presented. Also, the status of theimplementation of the climate convention was presented along with the international, regionaland sub-regional cooperation. Two posters addressing the climate change issue, in Albanianlanguage were designed in the frame of this workshop. In addition to that many electronic mediaand press representatives addressed this workshop and specifically mentioned the key findingsof the First National Communication of Albania.
The publication of the main results and findings of the Albania’s First National Communication inthe recent Status of Environment Report and inclusion of the Climate Change Action Plan into therevised National Environmental Action Plan are indicators of a higher level of awareness amongthe environmental policy makers. The establishment of the National Climate Change web pageand the publication of the project newsletter have played an effective role in awareness raisingabout climate change.
2. EDUCATION ON CLIMATE CHANGE
A similar situation relates to education on climate changes. The level of education is low even forenvironmental education in general. The recent tendencies aim at including the environmentaleducation into school curricula. Some progress has been achieved, but to a very low extent andnothing is explicitly referred to climate changes.
The first attempt to establish an environmental branch in the high level education in Albaniasucceeded in 1994, when the Environmental Engineering branch was opened within the Poly-technic University. This was enabled through EU assistance, PHARE program. Students whoattend this branch are free to chose two majors: water or energy. The curricula of energy majorincludes topics on atmospheric pollution, where the climate change is somehow addresses.Moreover some lectures on emissions from energy sources are delivered in other subjects.
In addition to the above, some other attempts have been made by the Natural Sciences Facultyof Tirana University to introduce environmental physics into the curricula of the physics branch.
3. TRAINING AND CAPACITY BUILDING
The project on the preparation of the First National Communication has also contributed tobuilding of national capacities through the compilation of the national greenhouse gas inventory,analysis of greenhouse gas abatement, assessment of vulnerability and adaptation, and compi-lation of the climate change action plan, as well as through the integration of these issues intoother sectoral development plans.
The establishment of the Climate Change Program Unit from the National Environmental Agency(actually the Ministry of Environment) is a step forward in the process of building the institutionalcapacity for climate change issues. The mission of this Unit is to implement the climate changeenabling activities and other climate change related activities and also to assist the Ministry ofEnvironment in the smooth implementation process of the UNFCCC.
The national capacities for the compilation of National Communications are built not only throughthe learning by doing process, but even through workshops (technical, national, regional, inter-regional), training and hands-on training sessions, and technical and consultative meetingsheld during project phase-I cycle life as follows:
Training workshop on IPCC methodology, organized by project office and held on March 2000,in Tirana, Albania. This one week workshop provided a hands-on training for the national team P
ublic
awar
enes
s ....

124
on greenhouse gas inventories. Samir Amous, PhD from Tunisia, assisted the Albanian teamduring the training. Other interested experts from different national institutions and ministriesparticipated in this workshop. This training provided a very good basis for conducting the na-tional greenhouse gases inventory.
Training workshop on vulnerability and adaptation organized by the project office was held onAugust 2000.This workshop provided training for a national team on vulnerability and adaptationmethods and models for development of climate scenarios and scenarios of other vulnerablesectors.This training was provided by the national team leader who was experienced in leadingstudies on expected impacts of climate changes.
Hands-on training workshop on abatement analysis, organized by the project office and held inSeptember 2000, in Tirana, Albania. Samir Amous, PhD from Tunisia assisted the Albanianteam during the training. This one week workshop aimed at providing a hands-on training for thenational team on abatement analysis. Relevant national institutions and ministries were invitedto participate in this training workshop.
Regional thematic - training workshop on abatement analysis, organized by UNDP-GEFNational Communications Support Program (NCSP), and held in Tbilisi, Georgia, on October1999. This one week workshop provided an overview of abatement analysis of greenhousegases for preparing the National Communication, helping identify priority sectors and issues atnational and regional level, facilitating exchange of national experiences on the process ofconducting abatement analysis, and identifying follow-up activities for technical support andcapacity building.
Regional thematic training workshop on vulnerability and adaptation assessment, organized bythe UNDP-GEF NCSP and held in Chisinau, Moldova on January 2000. The main objectives ofthe workshop were to discuss national priorities, to exchange experience on methodological andorganizational - issues of vulnerability and adaptation, to provide training on preparation of cli-mate change scenarios and to discuss funding possibilities for adaptation measures.
Regional exchange workshop on national communications for Europe and CIS organized byUNDP-GEF NCSP, held in Yerevan, Armenia on October 2000. This workshop provided anopportunity to discuss national and regional priorities for National Communications. The mainobjective of the workshop was to identify options for improving the technical studies for nationalcommunication through identification of project activities to incorporate into project proposal ininventory, abatement and vulnerability and adaptation; assessment of existing in country infra-structure and identification of priorities for technical assistance needs.
Inter-regional workshop of CGE (Consultative Group of Experts) on national communicationsfrom non Annex I Parties, organized by CGE on National Communications from non-Annex IParties as mandated by decision 8/CP.5 of the Conference of the Parties, in close collaborationwith the UNFCCC secretariat, held in Panama City, Panama on March 2001. The main objec-tives of the workshop were: to facilitate the exchange of experiences, problems encountered,and lessons learnt from the preparation of national communications, to make recommenda-tions for enhancing the preparation of national communications from non-Annex I Parties (deci-sion 8 / CP.5), and to make recommendations on the elements for consideration by the Subsid-iary Body for Implementation in the revision of the UNFCCC guidelines for the national commu-nication from non-Annex I Parties.
Regional workshop for development of the project on “ Building capacities for improvement ofthe quality of Inventories for Europe and CIS” organized by UNDP-GEF NCSP, held in Bratislavaon July 2001. This workshop provided an opportunity to review and discuss the draft proposal ofthe full project : “Building capacities for improvement the quality of greenhouse gas inventoriesfor Europe and CIS”. P
ublic
awar
enes
s ....

125
Regional Workshop for finalizing the project document: “Building Capacities for improvementthe quality of inventories for Europe and CIS”, organized by UNDP-GEF NCSP, held in Zagreb,Croatia, on March 2002. The aim of this workshop was to finalize the project document beforeits submission for final comments to GEF.
Workshop of CGE (Consultative Group of Experts) on National Communications from non-Annex I Panties, organized by CGE on National Communications from non-Annex I Parties asmandated by decision 8 / CP.5 of the Conference of the Parties (COP), in close collaborationwith the UNFCCC Secretariat, held in Bonn, on July 2002. The aim of this workshop was tofacilitate the exchange of experiences, problems encountered, and lessons learnt from thepreparation of national communications, giving particular attention to the identification andassessment of technical problems and constraints that have affected the preparation of initialnational communications by non-Annex I Parties that have yet to complete them, and makerecommendations for consideration by the subsidiary bodies, and provide input to the draftimproved guidelines for the preparation of national communications of non-Annex I Partiesreferred to in paragraph 1(b) of decision 32/CP.7.
UNFCCC / UNDP Expert meeting on methodologies for technology needs assessments, orga-nized jointly by the UNFCCC and UNDP-GEF NCSP, held in Seoul, Republic of Korea, on April2002. The aim of the meeting was to facilitate detailed discussions among Parties and partici-pants to identify and elaborate on methodologies needed to undertake technology needs assess-ments. In addition, attention was given to the identification of financial and technical assistanceneeded by Parties, particularly the developing country Parties in undertaking technology needsassessments.
Technical / Consultative meetingsSince 1998 when the project began, a series of fifteen technical and consultative meetings ofexpert vulnerability and adptation from the four national teams (inventory, abatement analysisand vulnerability and adptation and CCNAP) have been held. Joint meetings (expert and PSCmeetings) have been organized to review the final reports prepared by the national teams.
Project Steering Committee meetingsSince March 1999, when the PSC was established, six PSC meetings have been held. Thesemeetings focused on the problems / sconstraints, raised during the implementation of the projectand the PSC was asked to intervene as mandated by the terms of reference of the PSC. Theprogress reports on the status of project implementation have been submitted to each of thesemeetings.
Other prior or ongoing related activities on climate changes have/will contribute to the enhance-ment of capacities on that issue, like:
♦ ”Assessment of implications of expected impacts of climate changes for the Albanian coast”financed by UNEP/MAP, finalized on 1995;
♦ “Capacity building on climate change issues for Balkan region” financed by Ministry ofEnvironment and Physical Planning of Greece, finalized recently;
♦ A series of demonstration small projects financed from GEF/Small Grants Program for community based organizations on reforestation and renewable energy sources.
♦ PHARE project for enabling Albania to prepare the draft Energy Strategy, finalized on 1997.
4. FOLLOW – UP ACTIVITIES
Additional funds are requested and already received from the Government of Albania under theOperational Guidelines for Expedited Financing of Climate Change Enabling Activities (EA) -Phase II, to maintain and enhance national capacities to prepare National Communications, to P
ublic
awar
enes
s ....

126
ensure a continuity and improvement of this process. Raising public awareness regarding cli-mate change issues is another objective of the phase II. Additional activities will be undertakento meet the country’s needs to build capacities for identification and assessment of technologyneeds.
Also, Albania is expected to participate in the GEF funded project “Capacity building for improv-ing the quality of greenhouse gas inventories (Europe/CIS region)”. The project will initiate aregional programmatic approach to build capacity for improving the quality of data inputs tonational greenhouse gas inventories, using the good practice guidance of the IPCC for costeffectiveness.
The project will build upon the expertise gained during the preparation of the initial National Com-munications. By strengthening the institutional capacity to prepare inventories and establishing atrained, sustainable inventory team, the project will help the participating countries to reduceuncertainties and improve the quality of inventories for Second National Communications. This,on the other hand, will allow participating countries to improve their national strategies for reduc-ing greenhouse gas emissions. The approach has been built on the concept of key sources ofemissions.
Pub
lic aw
aren
ess .
...
127
CHAPTER VII
PROBLEMS, CONSTRAINTS ANDNEEDS1. NATIONAL GHG INVENTORY – PROBLEMS, CONSTRAINTS AND NEEDS --- 128
1.1 Institutional --- 1281.2 Technical --- 1281.3 Methodological --- 1291.4 Availability of resources --- 129
2. ABATEMENT ANALYSIS - PROBLEMS, CONSTRAINTS AND NEEDS --- 1302.1 Institutional --- 1302.2Technical --- 1302.3 Methodological ---1302.4 Availability of resources --- 130
3. VULNERABILITY ASSESSMENT - PROBLEMS, CONSTRAINTS AND NEEDS --- 1303.1 Institutional --- 1303.2Technical --- 1303.3 Methodological --- 1303.4 Availability of resources ---- 130
VII

128
Albania as many non-Anex I Parties is faced with a number of problems and constraints duringthe process of preparation of the First National Communication. Despite the fact that Albania hasdeveloped the First National Communication, and national capacities are being built, it is stilloverwhelmed by a number of problems and constraints. These problems and constraints are ofinstitutional, technical, methodological and financial nature and remain considerable concerns,threatening the sustainability of this exercise. The following is an analysis of the problems andconstraints identified, according to each component of the National Communication.
1. NATIONAL GHG INVENTORY – PROBLEMS, CONSTRAINTS AND NEEDS
1.1 Institutional
The institutional problems and constraints identified during the preparation of the First NationalCommunication are related to the lack of institutional and legal framework which might facilitatethe process of preparation of National Communication as a whole. The following problems iden-tified represent the institutional problems and constraints not only for Inventory preparation pro-cess, but also all components of the National Communication, which need to be overcome andto be improved. Specifically, the identified problems are as follows:
♦ Lack of institutionalization and reporting obligations to enforce relevant state and especiallyprivate sector for data provision.Some branches of economy in Albania have been privatized since 1992. Multiplex forms ofownership of economy, the reduction of state intervention to inner life of enterprises, braking intosmall pieces of biggest enterprises to be ready for privatization process, made impossible thedata collection by the old way (exhaustive). The transition period was accompanied with adecline of centralized statistical information received from public sector, as well as with thedistortion of some centralized structures of the statistical system and the missing of data fromprivate sector. As described above it, is very important to have a legislative framework in order toforce private entities to regularly report data on their activities. Due to the lack of institutionaliza-tion of this process, a weak cooperation with national institutions for getting the necessary datais identified. Sometimes it was difficult to get the necessary data, free of charge from relevantinstitutions.
♦ Lack of an appropriate support from the Project Steering Committee.The Project Steering Committee members represent different relevant Institutions, ministriesand NGOs.The aim of this Steering Committee is to provide substantial support from the Gov-ernmental side to the project. However several times the support has not been sufficient.
♦ Lack of awareness on climate change issues among different stakeholders.It is identified that there is a lack of awareness among all categories of stakeholders regardingclimate change issues.
♦ Execution of the project according to NEX (National Execution) modalities.According to the NEX modalities, despite of the responsibility that the National Project Managerhas for the daily management of the project, he/she has no right of signature. This responsibilitylies with the National Project Director, a high-level / political person, not paid from the projectbudget, who is presumed to ensure and provide the governmental support to the project. Sincethe National Project Director is a political person, he / she changes with the political changes,which were very frequent in the last years.
1.2 Technical
The technical problems and constraints identified relate to the availability, reliability and variabil-ity of activity data and emission factors. Specifically, they are as follows:♦ Lack of disaggregated activity data or inconsistecy with IPCC format P
robl
ems,c
onst
rain
ts &
nee
ds

129
In many cases, activity data reported for different sectors / sub sectors are very aggregated orinconsistent with the IPCC format, which makes the estimation of the emissions very difficult.Thefollowing cases are the most specific ones and they remain as problems for further improvement(for more information see the chapter II, section 6.1 - data gaps):
There is a lack of activity data for transport sector according to the modes of road transportation. Also a high variability of activity data among 90’s is identified.
There is a lack of activity data for fuel consumption in Industrial sector for years other than thebase year – 1994. This is relevant to the high variability of activity data during 90’s, due to the fastchanges of this sector in these years.
There is a lack of activity data in land use change and forestry sector. There are reliable activ-ity data regarding to fuel wood consumption for energy purposes. This subcategory is identifiedas one of the key sources with a high degree of uncertainty 79,23% (the total uncertainty esti-mated is 17,03%).
Also, there is a lack of activity data in agriculture / livestock regarding the enteric fermentationsubcategory. Activity data for this subcategory are very fragmentized or discrete. Referring to thekey sources, this subcategory is identified as key source as well.
♦ Most of emission factors do not reflect Albanian situationThere is a growing consensus among Albanian experts that default emission factors used foremission estimation do not represent the Albanian actual situation. Except of two cases whencountry specific emission factors are used, in all other cases the default factors are utilized.There is a need to generate at least regional emission factors.
1.3 Methodological
♦ A discrepancy on local classification of forests to that of IPCC methodology.A local classification of fruit trees is made by national experts.
♦ IPCC do not reflect the case of burning waste or open dump.This case is typical for Albania. The urban wastes are only deposited in open dumps or burned.They are not landfilled.
♦ Lack of a methodology for solventsThe CORINAR classification is used for solvents.
1.4 Availability of resources
♦ Lack of previous experience on preparation of greenhouse gases inventories and lack of atrained national team.This is another constraint identified during the process of preparation of First National Commu-nication.
♦ Lack of appropriate financial resources for development of greenhouse gases inventory.There was a need for financial resources for conducting surveys and studies in cases when datawere not available or when they existed but were aggregate.
Pro
blem
s,con
stra
ints
& n
eeds

130
2. ABATEMENT ANALYSIS - PROBLEMS, CONSTRAINTS AND NEEDS
2.1 Institutional
As indicated for the inventory, the institutional problems, constraints and needs that have affectedthe process, remain the same for the abatement analysis.
2.2 Technical
♦ Lack of appropriate data to perform a quantitative analysis for the following measures (inresidential and service sector):
-Introduction of central heating plants;-Introduction of district heating plants;-Introduction of small scale combined heat and power and district heating plants in newurban areas;-Lack of adopted strategies for some relevant sectors;-Lack of predictions (scenarios) for future development of different sectors;
2.3 Methodological
♦ Lack of explicit guidelines for abatement analysis;♦ Lack of models / software for scenario development for sectors other than energy and transport;♦ Lack of training on available models;
2.4 Availability of resources
♦ Lack of previous experience on preparation of abatement analysis;♦ Lack of a trained national team to perform an abatement analysis;♦ Lack of appropriate financial resources for quantitative analysis of other abatement measures;
3. VULNERABILITY ASSESSMENT - PROBLEMS, CONSTRAINTS AND NEEDS
3.1 Institutional
As indicated about the inventory and abatement analysis, the institutional problems, constraintsand needs remain the same for vulnerability assessment and adaptation.
3.2 Technical
♦ Lack of sufficient data becasue of lack of monitoring process;
♦ Impossibility to develop baseline scenarios for sectors like Agriculture, Tourism, Health etc,due to the fact that their development before 90’s was dictated by political factors
3.3 Methodological
♦ Lack of explicit guidelines from UNFCC for vulnerability assessment and adaptation♦ Lack of a finer resolution for MAGIC / SCENGEN software♦ Lack of methods for simulation of extreme weather events♦ Lack of models for cost / benefit analysis P
robl
ems,c
onst
rain
ts &
nee
ds
131
3.4 Availability of resources
♦ Lack of experience for such a complex study.♦ Lack of appropriate financial resources for the development of vulnerability assessment.There was a need for financial resources for conducting surveys and studies, in cases whendata were not available.
Pro
blem
s,con
stra
ints
& n
eeds

132
ABBREVIATIONS
CC Climate ChangeCCSA Climate Change Scenario for AlbaniaCEEC Central and Eastern European CountriesCEP Committee for Environmental ProtectionCHP Combined Heat and PowerCHS Central Heating SystemsCIA Climate Impact AssessmentDHS District Heating SystemsGACMO Greenhouse Gas Costing ModelGDP Gross Domestic ProductGEF Global Environmental FacilityGHG Greenhouse GasesGWP Global Warming PotentialIAE International Agency for EnergyIPCC Intergovernmental Panel on Climate ChangeLEAP Long-range Energy Alterantive PlanningLPG Liquified Petroleum GasLUCF Land Use Change and ForestryMAGGIC/SCENGEN Model for Assessment of GHG Induced CC / Scenario GeneratorMCF Methane Conversion FactorMMS Manure Management SystemMoE Ministry of EnvironmentMSW Municipal Solid WasteNCCAP National Climate Change Action PlanNCSP National Communication Support ProgramNEA National Environmental AgencyNEAP NationalEnvironmental Action PlanNEX National ExecutionNGO Non Governmental OrganizationPV Photo VoltaicPSC Project Steering CommitteeSoE State of EnvironmentUN United NationsUNDP United Nations Development ProgramUNFCCC United Nations Framework Convention on Climate ChangeUNICEF United Nations International Children’s FundWHO World Health OrganizationWMO World Meteorological Organization
Chemical SymbolsCO Carbon monoxideCO2 Carbon dioxideCO2 eqv. Carbon dioxide equivalentCH4 MethaneN2O Nitrous oxideNOx Nitrogen oxidesNMVOC Non Methane Volatile Organic Compound

133
ABR
EVIA
TION
SUnits
g gramkg kilogramG gigaGg gigagramm metrem m millimetrec m centimetrem2 square metrem3 cubic metrekm kilometrekm² square kilometrekm³ cubic kilometrekTOE kilo ton oil equivalentMTOE million tons oli equivalentha hectarekt kilotonM megaMt megatonW watth hourWh watt hourMW megawattkWh kilowatt hourGWh gigawatt hourTWh terawatt hourppm parts per millionUSD american dollar0 C degree celciusyr year

134
• Achenkirch altitude profils, PHYTON, Annales Rei Botanicae. Vol. 34 (Fasc.3), SpecialEdition; Horn (Austria) Apud Ferdinandum Berger & Fil., 1995 - Gil, D. & Guttenberger, H.
• Activity of states sanitary inspectorate; Ministry of Health, 2000;• Agriculture and food statistics of Albania; Ministry of Agriculture and Food; Directorate of
statistics & information,1998;• Agricultural production in Albania, Ministry of Agriculture and Food, 1990-1994;• Agricultural production in Albania, Ministry of Agriculture and Food, 1990-1999;• Albanian human development report - UNDP, 1998;• Albanian human development report - UNDP, 2000;• Albania in figures; INSTAT, 1999;• Albania in figures; INSTAT, 2000;• Annual statistics book of Albania for 1990 - 1994; INSTAT;• Annual statistical book of Albania for 1990-1999; INSTAT;• Annual statistical book of Albania for 1964; INSTAT;• Annual statistical book of Albania for 1961-1991;INSTAT;• Annual statistics related to GDP sectors contribution; 1990-1994; Ministry of Finance• Annual statistics related with GDP sectors contribution; 1990-1999; Ministry of Finance• Archives of Hydrometeorological Institute; 1995;• Archives of statistics sector; Ministry of Health and Environmental Protection - MHEP, 1990• Aspekte te studimit te rregullimit te rrjedhjes ujore ne lumenjte Drini i Zi dhe Vjosa; Studime
Hidrometeorologjike, Nr.10 - Selenica, A., 1984;• Biodiversity strategy and action plan; National Report; Albania. November 1999;• Biodiversity and carbon sequestration; Proceedings of the XI World Forestry Congress;
13-22 October 1997 Antalya; Volume 1; Shand, E.A; 1997;• Botime periodike tremujore; INSTAT; 1991-1998, Tirane;• Caring for the forest; Research in a changing world; Congress Report, Volume II.IUFRO XX
World Congress, 6-12 August 1995 Tampere, Finland - Skelly, J.M. 1997;• Climate change and forestry;Proceedings of the XI World Forestry Congress 13-22 October
1997 Antalya. Volume 1 - Reis,I;• Climate change effects on forests;Caring for the forest; Research in a changing world;
Congress Report, Volume II.IUFRO XX World Congress 6-12 August 1995, Tampere, Fin-land - Krauchi, N. Xu, D., 1995
• Climate change mitigation analysis; GUIDE; CC:TRAIN; Training Package;• Climate change;The IPPC Response Strategies; Karimanzira, R;• Climate change and the Mediterranean; Environmental and Social Impacts of climate
change and sea-level rise in the Mediterranean. Eduard Arnold; A division of Hodder &Stoughton; London, New York, Melburne; Auckland - Emmer,I.M;
• Climate change and the Mediterranean; Environmental and social impacts of climate changeand sea-level rise in the Mediterranean; Edward Arnold. A division of Hodder & Stoughton.London, New York, Melburne, Auckland - Sestini, G.;
• Climate change and the Mediterranean; Volume 2; Jeftic, L. et al., 1996;• Climate change and the role of forest as carbon sinks in Indonesia. Proceedings of the XI
World Forestry Congress 13-22 October 1997 Antalya; Volume 1. - Retnowati, E, 1997;• Conservation and sustainable management of forests in Central and Eastern European
contries; Multi-country and national reports. European Commission, Phare Programme1999; ISBN: 92-828-84163-Catalog N0:GU-23-99-435-EN-C. - Driessche,G.Van, etcc
REFERENCES R
EFER
ENCE
S

135
• Data on infection diseases; Dep. of Epi- Biostatistics; IPH 1998;• Data on infection diseases (Sector of hygiene & epidemiology); Ministry of Health, 2000;• Disa veçori te renies ne toke te pluhrave te atmospheres se Tiranes. Instituti i
Hidrometeorologjise - Dautaj, H., Xhelili, L.1987;• Draft national strategy of energy (up to 2010);National Agency of Energy; Albania;• Druret dhe shkurret e shqiperise; Mitrushi,I; Tirane, 1953;• Dynamics of deep jets in the Polymode region.; J. Phys. Oceanogr; 17(8): 1163-1188 -
Pinardi, N; 1988;• Eastside forest ecosystem health assessment; Volume I; Executive Summary; USA Depart-
ment of agriculture; General technical report; PNW-GTR-317; Everett,R; Hessburg,P;Jensen,M; Bormann, B; February 1994;
• Eastside forest ecosystem health assessment; Volume II. Ecosystem management; Prin-ciples and applications; USA departament of agriculture; April; Jensen, M.E.; Bourgeron,P.S; 1993;
• Eastside forest ecosystem health assessment; Everett,R; Hessburg,P;• Eastern europe and global change; European Commission; Kassandra, Halkidiki, Greece-
1997; Ghazi, A; Mathy, P.; Zerefos, C;• Executive Summary; USA Departament of Agriculture; General technical report. PNW-GTR-
317. February. - Jensen, M.; Bormann, B. 1994. Volume I;• Evaluation of desertification on Eu- mediterranean Countries; The pilot zone of Karaburun
- Qeparo, Ionian Coast (third report); Karadumi, S.; Minga, Sh.; Samimi, G.; Papandile,A .;1996. Medimont PECO Project;Tirana;
• ”Evolucioni i peizazhit gjeografik gjate shekullit te XX ne zonen fushore midis rrjedhjeve teposhtme te Matit dhe Ishmit”; Konferenca kombetare: ”Gjeografia dhe ekonomia”; QiriaziP.; Laçi S.; Nikolli P., Shkoder 1995;
• Flora of Albania; Vol.1,2,3; Paparisto, K.; et al.,1988-1996;• Flore forestiere Francaise; Tome 3: Monsion.j. Montagnes Institute for climate change and
forestry; Proceedings of the XI World Forestry Congress; 13-22 October 1997; Antalya;Volume 1; Rameau, I.; C. Reis, I.; 1997;
• Focus: Aspects of yield sustainability through suitable production systems. Plant researchand development. Volume 41 / 42;Tubingen,1995 - Institute for scientific Co-operation;
• Focus: Forest management and sustainibility. Plant research and development; Volume 47/48.Tubingen,1998; Institute for scientific Co-operation;
• Forestry and other human activities climate change.The IPPC response strategies - Kupfer,D. Karimanzira; R. Agriculture;
• Forest and climate change; role of forestlands as carbon sinks. Proceedings of the XI WorldForestry Congress 13-22 October - Brown, S, October 1997.Antalya.Volume I;
• Foresting of deserted and degraded land. Proceedings of the XI World Forestry Congress13-22 October 1997 Antalya. Volume 1; Serafimovic, B. 1997;
• Forecast of energy and electricity demand and financial evaluation of power sector expantionin Albania - Islami, B.; PhD Thesis;
• Fuel production & consumption of the Republic of Albania (Statistical directory); State sta-tistical department of the RA; 1992; INSTAT;
• Fuel production & consumption of the Republic of Albania (Statistical directory); State sta-tistical department of the RA.- 1994; Ministry of Energy & Mineral Resources;
• Global climate change mitigation and sustainable forest management – The Challenge ofMonitoring and Verification; Makundi,W, R;
• Greenhouse gas mitigation assessment; A guide book - U.S. Country Studies Program• Good practice guidance and uncertainty management in national GHG inventories; 2000.
(IPCC/NGGIP);• Health statistics (Data of the sector; Health statistics); MoH 1999;• Hidrologjia e Shqipërisë; Instituti i Hidrometeorologjise,1984, Tiranë; R
EFER
ENCE
S
136
• IPCC guidelines for national GHG inventories; Revised 1996; (IPCC/UNEP/OECD/IEA);• Implication of climate change for the Albanian coast; MAP technical reports; No. 98, UNEP
Athens; 1996;• Implications of climate change on land degradation in the Mediterranean; Climate change
and the Mediterranean; Environmental and Social; Imeson, A.C;• Industrial production in Albania; 1990-1994; Ministry of Energy and Mineral Resources;• Industrial production in Albania; 1990-1999; Ministry of Public Economy and Privatization;• Inventory of natural & semi-natural forests in Central & Eastern Europe; Albania; Tirana, July
1998; Karadumi, S.;• IPCC guidelines on greenhouse gas Inventory; 1995;1996 (revised); Volume 1, 2, 3;• IPCC special report on LU LUCF; IPCC Methodology, 24 June 1999;• IUFRO Task Force; Climate change and air pollution; final report of the period 1991-1995
IUFRO Occasional Paper Nr.4; Krauchi, N;• Klima e Shqipërisë; Instituti i Hidrometeorologjise; 1975 Tiranë;• Late quaternary vegetation history of northwestern Greece; Groningen, 1974; Botema, S.• L’Albanie, une agriculture en transition; Option méditerranéennes; Nr.15, CIHEAM,
Montpellier;1997;• Livestock in Albania; 1990;1991; 1992; 1993; 1994; Scientific Research Institute of Veteri-
nary;• Livestock in Albania; 1990 - 1999; Scientific Research; Institute of Veterinary Research;• Livestock census versus outbreaks of diseases in various species. Draft report 2000; Insti-
tute of Veterinary Research Tirana, Albania;• Livestock and pastures in Albania. Current situation and prospective development; Int. Heifer
Project; December 1999;• Long-term implications of climate change and air pollution on forests ecosystems. Progress
Report of the IUFRO; Forest, climate change and air pollution. IUFRO World Series Vol.4.Vienna - Schlaepfer, R. 1993;
• Manual of states sanitary inspectorate; MoH 1999;• Mbi percaktimin e zonave fito-klimatike te Rep. se Shqiperise; BuletinShkencor; Bujqesor
Nr.2,1969. Botim i Institutit te Larte Shteteror te Bujqesise, Tirane 1969; Nako,I.;• Mbi percaktimin e shtreses mesatare te rreshjeve ne Shqiperi. Instituti Hidrometeorologjise;
Sanxhaku, M. and Themelko, B.; 1982;• Medimont PECO Project evaluation of desertification on Eu-Mediterranean countries. The
pilot zone of Karaburun, Qeparo, Ionian Coast; (the third report); Karadumi, S.; Minga, Sh.;Samimi, G.; Papandile, A., Tirana, May 1996.;
• Mountainous areas in Albani; Source of Rural Exode, International Conference;EUROMONTANA, Selanik ; Civici A.; Laçi S; 1996;
• National waste management plan for albania; CEP, 1993;• National Water Strategy for Albania, BCEOM, 1997• National Environmental Health Action Plan in Albania, Ministry of Health, 1998;• Oil by products consumed on transport sector, 1994 - 1999; Ministry of Transport;• Pasojat potenciale nga ndryshimet klimatike te parashikuara ne pyjet, kullotat dhe lagunat e
Bregdetit Shqiptare; Referat mbajtur ne takimin nderkombetar mbi lagunen e Kune-Vainit,Lezhe; Karadumi, S.; Tirane, Mars 1999;
• Perhapja e bimesise pyjore sipas lartesise nga niveli i detit per rrethin e Beratit. Tirane, Papublikuar; Karadumi, S.;1998 ;
• Përvoja, strategjia dhe politika urbane; Buletini: Studimet e Popullsisë; Nr. 5; Stringa O. ;Dumani B.;1996;
• Position paper on policy and strategies for the Albanian health sector, MoH• Pyjet, shpendet dhe kafshet e egra te bregdetit shqiptar dhe vlerat peisazhiere e turistike,
Karadumi, S.;Tirane, 1997; REF
EREN
CES

137
• Report on forest cadastra; Forest and Pasture Research Institute;The situation of the stand-ing wood stock of Albania, for the year 1994,1995,1996; FPRI.
• Report on situation and development of established reforestation with black pine, seasidepine, aleppo pine, stone pine and poplars hybrids; Karadumi, S.; Tirana, December 1985;
• Reports prepared for systemic and prospective analyses, development / environment sce-narios for Albania (in the framework of CAMP); Blue Plan, 1995 ;
• Resurset hidrogjeologjike ne Shqiperi, administrimi i tyre dhe gjendja aktuale, Dhami, K.;Kalaja, F.;Saraci, M., 2000;
• Solvents imported into Albania,1994; INSTAT and Customer Offices of Albania.• Situata social-ekonomike e zonave malore dhe shkaqet e eksodit të popullsisë; Studime
Albanologjike ll, Tiranë ; Laçi, S.;1996;• Silvikultura. Instituti i Larte Shteteror i Bujqesise;Tirane; Treska, Ll.;1963;• Shkaqet dhe pasojat e levizjes hapesinore te popullsise ne rrethet Shkoder dhe Malesi e
Madhe, gjate periudhes 1990-1994; Konferenca Kombetare “Shkodra ne shekuj”, ShkoderLaçi, S.; Shem, S.; 1995;
• State of the environment report; Ministry of Environment 1995 - 1996; 1997 - 1998;• Studim per gjendjen e ekonomise pyjore te vendit tone dhe masat qe duhen marre per ritjen
e prodhimtarise se saje;Tirane, Shtator 1985; Grup autoresh• Sul clima e sul distribuzione altimetrica della vegetazione forestale in Calabria.Annali del’Istituto
Sperimentale per la Silvicoltura Arezzo.Estratto dal Vol.II.; Ciancio, O.;• Studies of ecosystems in the lime-stone alps-Gil,D. & Guttenberger, H. “Achenkirch Altitude
Profils”;PHYTON, Annales Rei Botanicae; Vol.36 (Fasc.4); Special Edition; Horn (Austria)Apud Ferdinandum Berger & Fil - Smidt, S.; Herman, F. 1996;
• TBFRA - 2000; The UN-ECE/FAO; Temperate and boreal forest resources assessment;2000; Volume I. Main Report. ECE/TIM/NONE/99/4.GE.99-21010; United Nations
• Technical guidelines for assessing climate change impacts and adaptations; IPCC,1994CGER-I015-1994;
• The green strategy; Booklet issued by the Ministry of Agriculture and Food; Tirana Albania1999; Ministry of Agriculture and Food.
• The Harvard open ocean model; App. Numer. Math., 3 (1-2): 89-131 - Robinson, A., 1987• The region of Durresi–Vlora, coastal profile; Document CAMP/1993/AL/CAM-CP - UNEP,
1994• The UN-ECE/FAO; Temperate and boreal forest resources assessment; 2000; Volume I.
Main report. ECE/TIM/NONE/99/4.GE.99-21010 - UN TBFRA-2000• Threatened and rare plant species of Albania; Vangjeli, J.; et al., 1995-Red Book;• Urban waste in Albania, 1990-1994; Institute of Technological Chemistry Research;• Urban Waste in Albania, 1990-1999 - Institute of Technological Chemistry Research;• Vegetation and land use in the Mediterranean basin by the year 2050; Le Houerou, H.N;• Vecoritë klimatike edhe hidrologjike të ultësirës perëndimore. Instituti i Hidrometrologjise
1985 Tiranë;• Vecorite kryesore te rrjedhjes ujore dhe te rrjedhjes se ngurte te pellgut ujembledhes te
rrjetit hidrografik te Shqiperise; Studime Hidrometeorologjike; No. 10 - Pano, N., 1984;• What is changing in the global environment? Caring for the forests; Research in a changing
world; Congress report; Volume II; IUFRO XX World Congress; Tampere, Finland. 6-12August 1995, Kauppi, P.; 1995.
REF
EREN
CES

138