Embed Size (px)
Citation preview

7/23/2019 Alcoa Report Chemical vs. Non-chemical Evaluation
http://slidepdf.com/reader/full/alcoa-report-chemical-vs-non-chemical-evaluation 1/17
1
Chemical vs. Non-chemical Cooling Water
Treatments – a Side-by-Side ComparisonKEVIN A. KITZMAN, Alcoa, Alcoa Center, PA and EDWARD F. MAZIARZ, Alcoa, Pittsburgh, PA and BOBBYPADGETT, Alcoa, Goose Creek, SC
CHARLES D. BLUMENSCHEIN, USFilter, Pittsburgh, PA ALAN SMITH, Consultant, Pittsburgh, PA
IWC - 03 - 22
KEYWORDS: cooling towers, non-chemical treatment technologies, chemical treatment, scale control, monitoring, micro- biological control, corrosion control
ABSTRACT: Two non-chemical cooling water treatment technologies, a pulsed power system, and a hydrodynamiccavitation device, were evaluated against conventional chemical treatment in a detailed six-month study. The comparisonwas conducted at Alcoa’s Mt. Holly Works in Goose Creek, SC. Three identical, non-contact, evaporative coolers used tocool air compressor systems were used as the test sites. The three technologies were installed on the external 600-gpm spraywater loop in these towers. The towers were operated at a range of setpoints representing between 4 – 20 cycles of
concentration. Water quality parameters, corrosion, scaling indices, microbiological (aerobic and anaerobic planktonic andsessile, Legionella), and aquatic toxicity data/results will be presented for the different operating conditions. Operating costcomparisons will also be shared. Conclusions and Recommendations will be presented.
BACKGROUND
With the rising cost of chemical treatmentadditives for cooling water systems, and Alcoa’sannounced goal of reducing water usage and wastewaterdischarges by 60% by 2008, locations were eager toexplore alternatives for reducing their water treatmentcosts and achieving the Company’s conservation goals.Spurred by the perceived successes of two non-chemical,
mechanical/electrical cooling water treatment devices atthe Alcoa Corporate Center, and an extrusion plant inLouisiana, other locations were anxious to install theirown systems. These devices were reported tosuccessfully control scaling, corrosion, andmicrobiological growth in recirculating cooling watersystems. Ten more units were installed in 2001, andapproximately the same number installed in 2002.
These non-chemical devices were being installed atsuch a rapid pace, that there was little opportunity togather historical performance data beyond the claims andtestimonials provided by the manufacturers. Because ofthe great interest in these technologies corporate-wide and
the potential for significant cost savings andenvironmental benefits, it was decided to perform a side- by-side evaluation of two technologies. These were anelectromagnetic pulsed power system (herein after calledPP), and a hydrodynamic cavitation unit (herein aftercalled HDC). Both were compared to conventionalchemical treatment.
Mt. Holly Works was selected for the test site because they had three identical, but segregated (i.e.separate influent and effluent water lines with nointerconnection between the basins) cooling towers
serving their air compressor systems, and they wereinterested in evaluating these non-chemical technologies.
PROJECT OBJECTIVE(S)
The objectives of this study were to evaluate theeffectiveness of commercially availablemechanical/electrical treatment devices for controllingcorrosion, scale formation, and microbiological growth inrecirculating cooling water systems, and to substantiate
the following performance claims made by both non-chemical treatment suppliers:
• Eliminates essentially all chemical additives with theassociated cost savings
• Eliminates most of the employee health, safety, andenvironmental issues typically associated with thestorage and use of chemicals
• Reduces water consumption through operation athigher cycles of concentration. Blowdown reduced80% and Makeup by 40% when cycles increase from2 to 6
• Reduces or eliminates the toxicity of blowdown toaquatic life in receiving streams
• Degrades and removes old scale encrustations and bio-film from wetted pipes and tower surfaces
• Overall lower operating costs including savings inwater and sewer charges, maintenance, chemicals,and labor .

7/23/2019 Alcoa Report Chemical vs. Non-chemical Evaluation
http://slidepdf.com/reader/full/alcoa-report-chemical-vs-non-chemical-evaluation 2/17
2
PROJECT APPROACH
A. MT. HOLLY’S COOLING TOWERS.Mt. Holly has three, Baltimore Aircoil (BAC)
Model F1463 – PR evaporative coolers serving their aircompressor system (see Figure 1). A closed internal loopcools the main air compressors and air dryers. Theinternal loop is comprised of 10 pass cooling coils. Each
coil is a 1.05 in. external diameter tube with 2 in. spacing between the coils. Hot internal loop water from thecombined compressor system is returned and distributedacross the three segregated, independently functioning,BAC towers.
Figure 1. BAC Towers (back)
Water in each 1,200 gallon basin is recirculated tothe top of the tower at 610 gpm, distributed through a piping manifold, and then sprayed through a series ofnozzles over the closed loop coils. Fans (3) at the base of
each tower, blow air upwards against the falling spraywater. Drift eliminators placed above the pipe manifoldtrap water droplets and return them to the tower basin.This comprises the outer loop cooling circuit, and thechemical characteristics and microbiological content ofthis spray water was the subject of this six-month study.
The towers were installed in 1996, with designspecifications to cool 343 gpm of internal loop water from116 0F to 90 0F at an 80 0F wet bulb. Each tower has adesign heat load of 4.45 MM BTU/hr. or approximately297 Tons of cooling. At design conditions of a 26-degreechange in temperature, and 343 gpm flow rate theestimated evaporation rate of the recirculated water is
approximately 12,800 gpd. Design drift loss is 0.001% or0.006 gpm (~9.0 gpd). The basins of all three towerswere flushed and thoroughly cleaned before the test program began.B. TREATMENT ALTERNATIVES.Chemical Treatment. Chemical treatment is presentlyused in the external loop spray water in all three towers.The following control ranges for the chemical treatment program are maintained:
pH = 6.5 – 9.0Conductivity = 400 – 1,000 umhos
Molybdate = 2.0 – 5.0 mg/lA corrosion/scale inhibitor is continuously fed to
maintain molybdate levels in the desired control range. Inaddition to sodium molybdate and a phosphate compoundfor mild steel corrosion control, the corrosion inhibitorcontains a triazole for copper corrosion protection, and anacrylic polymer for scale control. Chemical treatmentalso includes two non-oxidizing biocides, isothiazolin and
glutaraldehyde, on an alternating, batch dosage basis tomaintain microbiological control in the three towers.Under this control program the towers normally operate at3 to 5 cycles of concentration with a typical discharge(blowdown) rate of 3,200 – 6,400 gallons per day.
As part of this investigation the middle tower wasleft on the chemical treatment program while the Westand East towers were converted to themechanical/electrical treatment approaches. The performance of the two non-chemically treated towerswas measured against that of the conventional, chemicallytreated middle tower.
Pulsed Power. The pulsed power (PP) system was
installed on the West tower (see Figure 2). The PPimparts a pulsed, high frequency (100,000 hz)electromagnetic energy into the circulating water byinducing varying magnetic fields 60 times per second.The system is normally sized according to the pipediameter of the recirculating cooling water. The coilsoperate at a low voltage of less than 45 volts rms1.
Figure 2. 3” PP with Insulated Cyclonic Separator
The PP supplier prefers to size their units to turnover the system volume once every 15 minutes for goodmicrobiological control. The initial 110 gpm flow ratethrough the 3 in. unit created a 10-minute turnoverfrequency. When a larger 6-inch unit was installed, theturnover frequency increased to once every 2 minutes.
A centrifugal pump draws water from a 3 in. drainconnection on the bottom of the tower, and directs itthrough the 3 inch PP unit, and then to a cyclonicseparator for solids removal before returning the treated

7/23/2019 Alcoa Report Chemical vs. Non-chemical Evaluation
http://slidepdf.com/reader/full/alcoa-report-chemical-vs-non-chemical-evaluation 3/17
3
water back to the tower basin. The reason for installingthe separator was to achieve results that could becompared to the hydrodynamic cavitation system(discussed next). The hydrodynamic cavitation systemtypically is installed with a solids separation device.
Hydrodynamic Cavitation. The hydro-dynamiccavitation (HDC) system was installed on the East tower.The HDC unit is based on the principle of controlled
hydrodynamic cavitation. Cavitation is the dynamic process of the formation, growth, and collapse of micro-sized bubbles in a fluid. Studies have shown that when aliquid moves fast enough, gas bubbles will form andcollapse creating a process called cavitation. In turbulentliquid flows, and notably at high velocity, hydrodynamiccavitation will occur 2.
Figure 3. HDC System with Bag Filters andCyclonic Separator
A 20 gpm unit was sized and selected by the
supplier for Mt. Holly. HDC units are sized to treat theentire system volume seven times a day plus an allowancefor makeup water. Based on the size of this tower andexpected heat load this would have calculated to a 15 gpmunit, but the HDC supplier elected to increase to the nextlarger size in their product line, a 20 gpm unit, rather thanuse their smallest 10 gpm model.
The HDC unit was installed with 2 process loops.One circuit draws water from the tower basin through a 3in. strainer, and pumps it through a cyclonic separator andthen through duplex bag filters before returning it througha piping manifold into the bottom of the tower basin. Thesecond process water loop draws water from the tower
basin through a 2-in. strainer before entering the HDCunit.C. SAMPLING AND MONITORING.
The following parameters were monitored:
• Water meter readings were recorded at least 5 times per week and included make-up and blowdown.
• Water temperatures were monitored continuouslyfrom various points in each tower.
• pH and conductivity were measured from makeupsupply, and outer loop spray water from all threetowers on a daily basis.
• Corrosion was measured using a rack that containedslots for five (0.5 in. x 3.0 in.) coupons. A mild steelcoupon occupied one slot, an aluminum couponanother, and a steel electrode used in conjunction
with a Corrater ®3 meter a third. Corrater ® readingswere taken once per week.
• Microbiological analysis included a variety oftechniques to measure planktonic and sessile
organisms, both aerobic and anaerobic. Two perforated steel coupons were used to provide agrowth substrate for sessile organisms.
• Aquatic Toxicity of the tower blowdowns was alsomeasured during the study.
D. OPERATING SET POINTSBefore the trial, the three towers were operating
between 3-5 cycles of concentration as determined bycomparing the conductivities of the water in therecirculating spray loop with that of the makeup water.
The intent of the trial was to operate the threetowers at increasingly higher cycles of concentration tosee how the different treatment technologies would
perform under increasing scale-forming potentials.Corrosion rates and microbiological control for both planktonic and sessile organisms were also measuredduring these different operating periods. The differentoperating settings were controlled by adjusting theconductivity setpoint on the continuous conductivitymonitor in each tower. When the conductivity of therecirculating spray water reached the setpoint, theconductivity controlled blowdown valve wouldautomatically open and some high conductivity waterwould be purged from the tower, and sent to drain. Sincethe blowdown setpoint (based on conductivity) was setthe same for all three towers, it was considered an
independent variable of this test.Conductivity controllers were initially set at 1,000umhos to approximate 5.0 cycles of concentration. Thefollowing table lists the dates and setpoints for theoperating periods used during this study.
Table 1. Conductivity Setpoints
Dates2002
ConductivitySetpoint (umhos)
Intended Cyclesof Concentration
6/24 – 8/4 1,000 5.0
8/5 – 8/26 1,250 6.0
8/27 – 9/12 1,650 8.0
9/13 – 9/23 2,150 8.0
9/24 – 12/5 2,7501 10.0
12/6 – 12/20 4,0002 16.012/21 2,150 Test over
Notes:1. The Chemical tower was set back to 2,150 umhos on
November 1, due to excessive buildup of suspendedsolids in the recirculating spray water loop.
2. Only the PP and HDC non-chemical towers wereoperated at 4,000 umhos

7/23/2019 Alcoa Report Chemical vs. Non-chemical Evaluation
http://slidepdf.com/reader/full/alcoa-report-chemical-vs-non-chemical-evaluation 4/17
4
Figure 4. History of Makeup Conductivity
In early September, the conductivity of the makeup waterincreased dramatically as shown in Figure 4 necessitatingan increase in the conductivity setpoints of the threetowers on September 13, in order to maintain 8.0 cyclesof concentration. The 2,750 umhos operating periodlasted the longest - 73 days – as a variety of tests andobservations were made during that time frame. The lastoperating period was used to try to “stress” the non-Chemical towers to see how they would perform underhigh scaling conditions.
TECHNICAL RESULTS OR FINDINGS
A. CYCLES OF CONCENTRATION.Cycles initially based on water meter readings were
calculated by dividing the makeup water by the blowdown + solids separator purge + drift losses. Onlythe PP and HDC towers had solids separators, whichcontributed small daily purges of 26 and 73 gpdrespectively. Drift losses were calculated as 9 gpd for alltowers, which was the designed drift loss specified by themanufacturer. While it was initially thought that cycles based on water meter readings would be the mostaccurate, unmeasured leakage and observed drift lossesthat appeared higher than calculated likely contributed tohigher values using this method.
When the conductivity settings were moved to1,250 umhos during the next operating period, cycles based on magnesium, sodium, sulfate, and potassiumconcentrations were also calculated and compared againstcycles based on conductivity for each of the operating periods. These are plotted in Figure 5. The similarityamongst towers of cycles based on salts verified that thiswas the best way to measure true cycles during this test.
Note that potassium values from the Chemical tower werenot used in the calculation on Figure 5 since potassiumwas a component of the chemical additives used in thistower.
The quick and easy method of using the ratio ofconductivities was not appropriate for calculating cycles, particularly as the test program moved into potentiallyhigher scaling regimes. It was determined that for all ofthe operating periods starting with 1,250 umhos thatcycles based on magnesium, potassium (not including
Chemical tower), sodium, and sulfate were the mostrepresentative of the true operating concentration factorsin the towers.
Note that as the conductivity settings are increasedin later operating periods, the cycles determined from theconstituent values increase progressively higher than theconductivity values. This was taken as an indication thatcalcium carbonate and other compounds were precipitating at higher chemical saturation levels, therebylowering conductivity values, and yielding lower thanactual cycles of concentration determinations. This precipitation might have been via nucleation in therecirculating water as the non-chemical vendors claim, or
simply scaling on the heat exchangers. Additionaldiscussion on scale is provided later in this text. Twovalues are plotted for the Chemical Tower during the2,150 umhos operating period. As was mentioned previously, the Chemical Tower was only operated at the2,750 umhos setpoint for a limited time, and was dropped back to 2,150 umhos on November 1.B. WATER METER READINGS.
Figure 6 shows the average daily blowdowns foreach of the three towers during the various operating periods. This blowdown includes discharge from the
Makeup Conductiv ity History
190
210
230
250
270
290
310
330
7/3 8/2 9/1 10/1 10/31 11/30 12/30
u m
h o s
Startup 1250 1650 4000
Operating Periods (umhos)
2150 2750

7/23/2019 Alcoa Report Chemical vs. Non-chemical Evaluation
http://slidepdf.com/reader/full/alcoa-report-chemical-vs-non-chemical-evaluation 5/17
5
solids separator devices from the non-chemical units. Theonly statistical difference (95% confidence) was betweenthe PP and HDC tower during the startup period. It is notclear why this might have occurred, however it can beassumed that the three towers were not completely in
control during this time period so some anomaly duringstartup caused the difference. Similarly there was nostatistical difference in make-up water usage between thethree towers.
Figure 5. Cycles of Concentration History
Figure 6. Average Daily Blowdowns
1 , 5
0 0
1 , 3
5 9
1 , 3
1 8
1 , 1
4 1
1 , 0
0 9
1 , 0
6 6
9 4 3
8 8 5
8 8 3
7 4 5
6 9 2
7 1 6
3 4 6 4
2 6
3 3 9
1 7 3
1 8 1
0
200
400
600
800
1,000
1,200
1,400
1,600
A v e r a g e
B l o w
d o w n
( g p
d )
Startup 1250 1650 2150 2750 4000
Conductivity Periods (umhos )
Av erage Daily B lowdown fo r Three Towers
PP Chem HDC
Cycles of Concentration Average of Na, SO4, Mg, K
vs Conductivity
6
. 9
6 . 7
8
1 4 . 9
2 3 . 7
6 . 7
5 . 8
8 . 7
1 4 . 2
6
. 8
6 . 2
8
1 5 . 4
2 2 . 8
1 1 . 1
8
5 . 7 6 .
3 7
. 1
1 0 . 0
1 6 . 0
0
5
10
15
20
25
1250 1650 2150 2750 4000
Operating Periods (umhos)
A v e r a g e C
y c l e s o f C o n c e n t r a t i o n
PP Chem I HDC Chem II Hand Conductivity
Note: Potassium Cycles were not used for Chem Tower

7/23/2019 Alcoa Report Chemical vs. Non-chemical Evaluation
http://slidepdf.com/reader/full/alcoa-report-chemical-vs-non-chemical-evaluation 6/17
6
C. WATER QUALITY DATA.In a further attempt to identify any performance
differences between the three towers, water samples weretaken an average of twice per week from the makeupsource as well as the three towers and the following parameters were measured: alkalinity, total dissolvedsolids (TDS), total hardness, calcium hardness, andturbidity.
The average values for all parameters showed asteady increase across the operating periods as the cyclesof concentration were raised. TDS, total alkalinity, totalhardness, calcium hardness and conductivity werescrutinized statistically and generally showed nodifference between all three towers for each operating period respectively. A few exceptions are as follows.First, during the 2,750 umhos time frame the alkalinity forthe Chemical tower was higher than that of either non-chemical tower. The reason for this is likely due to thescale inhibitors keeping scale forming elements insolution for the Chemical tower, while scale or other precipitates were forming in the non-chemical towers.
Second, while the turbidity levels track fairlyclosely across the towers at average values below 10 NTUover the first two periods, the Chemical tower began toshow some elevated spikes during the 1,650 umhos period. As the conductivity controlled blowdownvolumes continued to decrease with increasing cycles, theadverse affect of not having a sidestream solids separator became more pronounced in the Chemical tower. Finallyat the 2,750 umhos control point while both non-chemicaltowers were still operating below 10 NTU, the Chemicaltower recorded spikes above 120 NTU with an average
over 70 NTU. After five weeks of operation at theseelevated cycles (~14), the chemical supplierrecommended reducing the setpoint back to 2,150 umhosso that their chemical treatment program would not becompromised. Within days of returning to this lowersetpoint, the affect of larger volume blowdownssuccessfully reduced turbidity levels below 20 NTUwhere they stayed for the remainder of the study. The
ambient air scrubbing affect of the cooling towers, and theclose proximity of the three towers to a carbon silo mayhave exaggerated the high turbidity levels observed in theChemical tower due to lack of side stream filtration onthis unit.D. CORROSION CONTROL.
Weekly Corrater ® readings were used tosupplement the corrosion results determined by weightloss of the mild steel coupons. The mild steel couponswere removed and replaced three times at variousintervals during the study period. The aluminum couponswere only removed once, after 77 days in the rack.Unfortunately, the last set of coupons, steel and
aluminum, were lost in transit and never recovered.Figure 7 is a graphical presentation of all of thecorrosion rate data obtained during the study. TheChemical tower exhibited excellent control averaging< 1.3 mils/year over the entire study period based on
Corrater ® readings. The rate exhibited a gradual declinefrom approximately 1.3 mils/year at the start of the studyto < 0.8 mils/year during the final month. Thisextraordinary rate was partly attributable to the fact thatthe chemical supplier did not adjust the feed rate of their
Figure 7. Corrater Corrosion History

7/23/2019 Alcoa Report Chemical vs. Non-chemical Evaluation
http://slidepdf.com/reader/full/alcoa-report-chemical-vs-non-chemical-evaluation 7/17
7
corrosion inhibitor for most of the study. Thus as blowdown volumes decreased, the concentration ofcorrosion inhibitor increased. While the stated controlrange was 3-5 mg/l of molybdate, they ranged from 3.0 –18.5 mg/l concentration with an average of 8.5 mg/l.
Corrater ® readings for the two non-chemicaltowers also exhibited an overall decrease over the study period, although the decline was not as consistent. Initial
readings were at the 3.7 to 3.6 mils/year for the PP andHDC towers respectively, and they dropped to 1.4 and 1.9mils/year respectively at the conclusion of the study.However, the HDC tower spiked to almost 5.0 mils/yearfor two weeks midway through the study. The overalldecrease in corrosion rates could be attributed to either or both of two mechanisms: 1) further passivation fromoperation in moderate to severe calcium carbonate scalingregimes over the course of the study, and 2) cycling up ofthe ortho-phosphate levels in the makeup water whichacted as a passivating anodic inhibitor and providedanother measure of corrosion protection. Corrosion rates between 1 - 3.0 mils/year for mild steel are considered
very good control. Excellent control is < 1.0 mils/year.Corrosion coupon results are also shown on the Figure 7.These results are summarized below on Table 2.
Table 2 – Corrosion Coupon Results
PP Chem HDC
Mild steel@ 28 days
1.84 0.72 0.83
Mild steel@ 72 days
1.50 0.22 1.71
Note: All results in mils/year
E. SCALE CONTROL.Precipitated solids form both soft and hard scale
deposits on the heat transfer surfaces, which increases theresistance to heat transfer, thereby decreasing the thermalefficiency of the equipment. One of the claims of thenon-chemical water treatment manufacturers is that theirdevices prevent the formation of scale on heat transfersurfaces, allowing the dissolved solids (calcium
carbonate) to be precipitated in the bulk water, and then purged from the systems via blowdown or in sidestreamsolids removal devices. To be effective from thestandpoint of corrosion control, and in some casesmicrobiological control too, non-chemical cooling watertreatment systems must operate in an alkaline pH range,which encourages scale formation.
A convenient place to start when evaluating scaleis a scaling index. For purposes of this paper, only thePractical Scaling Index (PSI4) will be discussed, although both the Langelier and Ryznar indices were alsocalculated and produced similar results as the PSI.
The PSI showed steady movement into
increasingly severe scaling regimes until about the thirdweek in October or approximately midway through the2,750 umhos operating period. At this time a change indirection toward lower scaling conditions is noted (seeFigure 8). This shift could be somewhat explainable forthe Chemical tower, because that operating setpoint wasreduced back to 2,150 umhos on November 1st due tohigh turbidity resulting from reduced blowdown rates asdescribed above. Lower operating cycles of concentrationcreated by this shift, should translate into lower scalingindices, but it initially was puzzling why the two non-chemical towers followed the same pattern.
Figure 8. Practical Scaling Index

7/23/2019 Alcoa Report Chemical vs. Non-chemical Evaluation
http://slidepdf.com/reader/full/alcoa-report-chemical-vs-non-chemical-evaluation 8/17
8
A possible explanation may be found by looking atthe alkalinity and calcium hardness levels, which bothtook a dramatic downward turn at the same time. Thesevariables are believed to have precipitated the changes inthe PSI. Figures 9 and 10 plot the history of alkalinityand calcium hardness levels in the three towers over thestudy period.
Alkalinity levels in the makeup water remain fairly
steady at 60 mg/l from the middle of September untildropping to 50 mg/l after December 5th. Makeup calciumhardness peaks on October 24, at 73 mg/l and then beginsa steady drop to 44 mg/l by the end of the study. Thesechanges in the make-up water, particularly for calciumhardness, could partially account for the observed drop intheir respective concentrations in the tower spray water.Another possible explanation for the drop in these valuesfor the spray water in the two non-chemical towers wasthe fact that the treatment devices were turned OFF from November 6 – 21 to determine what, if any, influencethey were having on the water chemistry in those twotowers. Without any “treatment” from the non-chemical
devices, and with the recirculating spray water atsaturation levels for calcium carbonate as determined bythe scaling indices, its possible that calcium carbonatemay have precipitated from the bulk water onto heattransfer surfaces. This is evidenced by a reduction incarbonate and alkalinity as shown in Figures 9 and 10during the period when the non-chemical devices wereshut OFF. When the non-chemical devices were turned back ON, their respective “treatments” kept the calciumcarbonate in solution and the levels of alkalinity andcalcium hardness began to increase slightly again for thePP and HDC towers. However when the towers wereincreased to the 4,000 umhos operating mode, the calciumlevels increased substantially while the alkalinity levelsremained steady (Figure 9). This indicates that calcium
carbonate was being formed and remained in therecirculating water where it would be measured by thetest for calcium, but not measured in the standard titrationtest for alkalinity. The alkalinity test most likely did notdissolve all of the calcium carbonate in the recirculatingwater, thus resulting in a lower alkalinity measurement.
The significance of this finding is that it has beenhypothesized that certain non-chemical treatment devices
accelerate the coagulation-flocculation of solid particlessuspended in water, and increase the crystal formation inthe bulk solution instead of deposition as scale on heat-transfer surfaces. 5 F. TEMPERATURE OBSERVATIONS.
Cooling efficiency is presented in Figure 11, which plots the Return (to tower) minus the Supply (to process)water temperatures for the study period. This differentialis a good measure of the cooling efficiency of each tower.All three towers delivered 17-21 degrees of cooling untillate in October when the PP tower started to have a drop-off in efficiency. Water supplied back to the compressorsfrom the PP tower was 3 to 9 degrees warmer compared
to the HDC tower, while the Chemical tower remained inthe middle of the pack at 2 to 4 degrees warmer than theHDC tower. In an attempt to correct what we interpretedas an indication of scale formation on the heat exchangetubing in the PP tower, a larger (6 inch) PP unit wasinstalled on the Spray Water loop on November 26. Nothing else was done to clean the tubes at that time. Thetemperature differential for the PP tower began toimprove, even when the operating setpoint was increasedto 4,000 umhos. Water temperature monitoring wascontinued after the test program was concluded, and anoticeable although somewhat erratic improvement forthe PP tower continued. This could be construed that thelarger, greater powered PP unit removed some of the previously formed scale on the heat exchange surfaces.
Figure 9. Alkalinity History

7/23/2019 Alcoa Report Chemical vs. Non-chemical Evaluation
http://slidepdf.com/reader/full/alcoa-report-chemical-vs-non-chemical-evaluation 9/17
9
Figure 10. Calcium Hardness History
Figure 11. Return – Supply Water Temperature Differential

7/23/2019 Alcoa Report Chemical vs. Non-chemical Evaluation
http://slidepdf.com/reader/full/alcoa-report-chemical-vs-non-chemical-evaluation 10/17
10
The HDC tower consistently had the best cooling performance across the entire study, and their differentialincreased to 20 – 22 degrees during the last six weeks.G. SCALE OBSERVATIONS.
After the test program was completed, the towerswere opened to observe the presence of any scaleaccumulation. Both the PP and HDC towers appear tohave more tube scale than the Chemical tower, perhaps an
indication that the scale inhibitor in the chemicaltreatment program was performing as intended.Alternatively this could be due to the fact that the non-chemical towers were operated in severe scaling regimesfor longer time periods. However, close scrutiny of thesidewall scale shows distinctive differences between thethree towers. The sidewall scale in both the PP and HDCtowers had a sparkling, crystalline appearance comparedto the dull, flat white scale in the Chemical tower. Seefigures 12, 13, and 14.
Figure 12. PP Tower – Scale in Sidewall.
Figure 13. HDC Tower – Scale on Sidewall
Figure 14. Chemical Tower – Scale on Sidewall
Mt. Holly Maintenance cleaned the towers shortlyafter the test, and an effort was made to qualify thecleaning procedures required to remove the scale in thethree towers. The entire top layer and some of the bottomlayer of “sparkling – crystalline” scale in the PP and HDCtowers were removable by water under “garden hose” pressure. However, there were some spots of tenaciousscale that required “water blast” pressure for removal andnot all scale was accessible for removal. The Chemicaltower didn’t have as much scale, but it was more difficultto remove and required water blasting. The smalleramount of scale in this tower was expected, due to boththe scale inhibitor included in the chemical treatmentadditive, and the fact that this tower did not operate at thelength and severity of the scaling regimes selected for thePP and HDC towers. No acid cleaning was done on anyof the towers, and according to plant maintenance staff,
some scale had been present on the heat exchanger tubesand sidewalls of all three towers before the study began(although all three towers where cleaned and flushed priorto the study).
Samples of scale were obtained from both of thenon-chemical towers and analyzed by X-ray diffraction(XRD) at the Alcoa Technical Center. The results showthat the majority of scale was calcite, which is a typicalform of calcium carbonate in cooling water. Calcite ischaracterized by its crystal formation rather than chemicalcomposition. There was a significant amount of carbon inthe sample, which was confirmed visually by its blackish-gray color. It’s possible that carbon was part of the
particulate that was “trapped” in the scale matrix.H. MICROBIOLOGICAL CONTROL.
Cooling water systems, particularly openrecirculating systems, provide a favorable environmentfor the growth of microorganisms. Microbial growth onwetted surfaces leads to the formation of biofilms. Ifuncontrolled, such films cause biofouling, which canadversely affect equipment performance (i.e. increased pump pressures, heat transfer problems, etc.), promotemetal corrosion (i.e. microbial induced corrosion or MIC),accelerate wood deterioration, and cause pathogen
7/23/2019 Alcoa Report Chemical vs. Non-chemical Evaluation
http://slidepdf.com/reader/full/alcoa-report-chemical-vs-non-chemical-evaluation 11/17
11
concerns (e.g. Legionella). There have also beenincreasing federal and state regulatory restrictionsregarding chemical use in cooling towers, aimed atreducing the aquatic toxicity of effluent discharges toreceiving waters. This has made microbiological controlin cooling towers more difficult, and encouraged searchesfor alternatives to current treatment methods.
As was mentioned earlier, the PP and HDC
technologies claim different mechanisms for controllingmicrobiological growth. Both technologies werecompared against a conventional chemical approachinvolving alternating two non-oxidizing biocides -isothiazolin and glutaraldehyde.
Analytical Methods. There are a variety oftechniques available for measuring microbiologicalactivity in cooling towers. For this investigation the bulkrecirculating spray water was analyzed for aerobic freefloating or planktonic organisms by an FDA approved procedure (FDA Bacteriological Analytical Manual, 8thEd. Chapter 3) which utilizes "Standard Plate CountAgar," with a 48 hr. incubation period @ 35C. Anaerobic
planktonic bacteria were also measured using Standard Methods “Standard Plate Count Agar” with a 48 hr.incubation period in an anaerobic environment, @ 35C. All results were reported in colony forming units permilliliter (CFU/ ml). Planktonic samples were generallytaken every two weeks.
Attached, slime forming, or sessile organismscolonize wetted surfaces and are primarily responsible for biofouling. While some information was available on theeffectiveness of non-chemical treatment devices against planktonic organisms, very little information had beencollected on their ability to control sessile organisms.Perforated steel coupons were included in the couponracks and one additional coupon was hung inside the
cooling loop coil pack to encourage sessile growth. Thecoupons were routinely removed, after approximatelyfour weeks of exposure to the flowing spray water andshipped to an independent laboratory. Upon receipt bythe laboratory, both sides of the coupon were swabbedand the swabs returned to the buffer solution used forshipment. A vortex mixer was used to remove theorganisms from the swabs. This “inoculated” solution was
then tested using Standard Methods procedure forHeterotrophic Plate Count. The results were expressed asCFU/cm2. The sessile samples were also analyzed forsulfate-reducing bacteria with their presence reported as asimple Positive or Negative result.
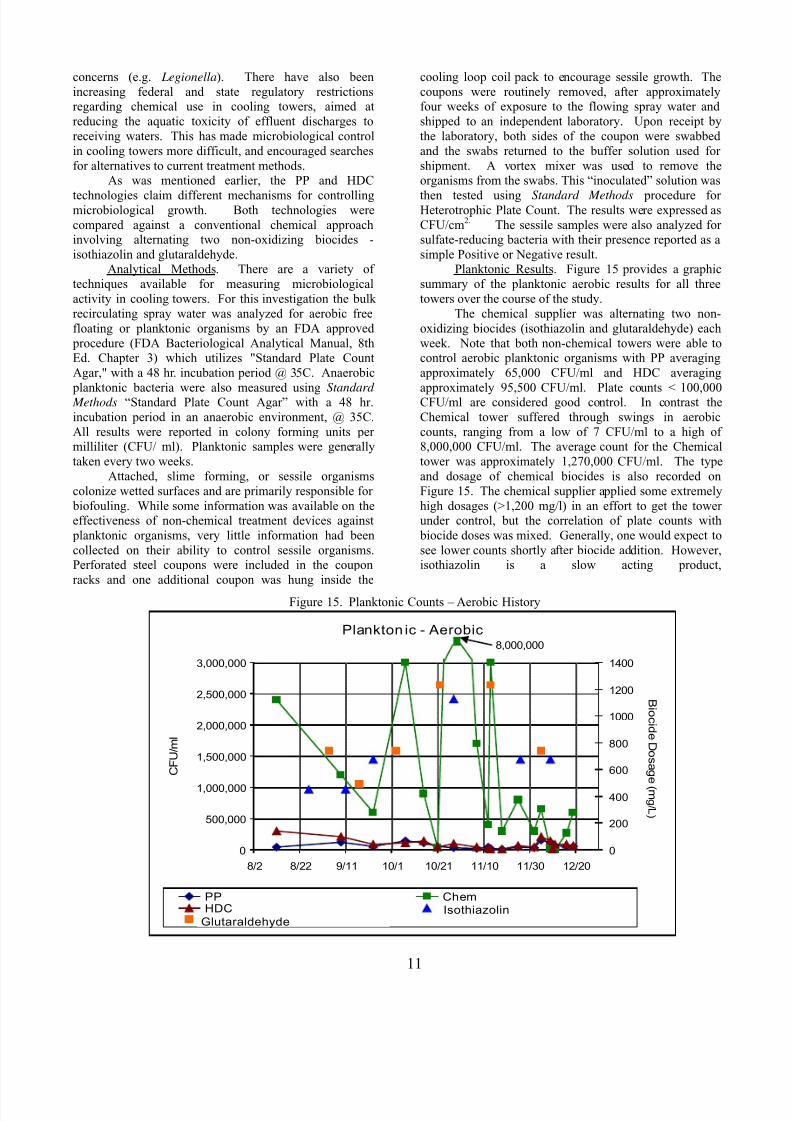
Planktonic Results. Figure 15 provides a graphicsummary of the planktonic aerobic results for all threetowers over the course of the study.
The chemical supplier was alternating two non-oxidizing biocides (isothiazolin and glutaraldehyde) eachweek. Note that both non-chemical towers were able tocontrol aerobic planktonic organisms with PP averagingapproximately 65,000 CFU/ml and HDC averaging
approximately 95,500 CFU/ml. Plate counts < 100,000CFU/ml are considered good control. In contrast theChemical tower suffered through swings in aerobiccounts, ranging from a low of 7 CFU/ml to a high of8,000,000 CFU/ml. The average count for the Chemicaltower was approximately 1,270,000 CFU/ml. The typeand dosage of chemical biocides is also recorded onFigure 15. The chemical supplier applied some extremelyhigh dosages (>1,200 mg/l) in an effort to get the towerunder control, but the correlation of plate counts with biocide doses was mixed. Generally, one would expect tosee lower counts shortly after biocide addition. However,isothiazolin is a slow acting product,
Figure 15. Planktonic Counts – Aerobic History
Plankton ic - Aerobic
0
500,000
1,000,000
1,500,000
2,000,000
2,500,000
3,000,000
8/2 8/22 9/11 10/1 10/21 11/10 11/30 12/20
C F U / m l
0
200
400
600
800
1000
1200
1400
PP ChemHDC Biosperse 250 - IsothiazolinBiosperse 254 - Glutaraldehyde
8,000,000
B i o c i d eD o s a g
e ( m g / L )
GlutaraldehydeIsothiazolin

7/23/2019 Alcoa Report Chemical vs. Non-chemical Evaluation
http://slidepdf.com/reader/full/alcoa-report-chemical-vs-non-chemical-evaluation 12/17
12
and a significant bacterium kill usually required 16-20hours of contact. Glutaraldehyde is a faster acting product, and will provide a significant reduction in the bacteria population within 2-6 hours. So sampling timerelative to specific microbiocide addition has a significantimpact on the measured results. It is important toalternate non-oxidizing biocides as the organisms candevelop immunity to a single product over time.
Note that all of these results were cultured fromunfiltered samples, which put the Chemical tower atsomewhat of a disadvantage, because their higherturbidity levels due to lack of a sidestream solids removaldevice. These particulates gave bacteria a place to “hide-out” as neither of the biocides are considered to beeffective to penetrate the interstices of the particles. Thiscertainly became more evident as cycles of concentrationwere increased with a concurrent reduction in blowdownrates. Shortly after the operating set point was increasedto 2,750 umhos on September 24, equivalent toapproximately 14 cycles in the Chemical tower, turbiditylevels steadily increased to over 100 NTU while
planktonic counts soared reaching a peak of 8,000,000CFU/ml on October 28. The following table comparesthe average turbidity levels with average planktoniccounts during the 2,750 umhos operating period for thethree towers.
Table 3 - Average Turbidity and Planktonic Values@ 2,750 umhos Operating Setpoint
Tower Turbidity(NTU)
PlanktonicAerobes(CFU/ml)
PP 10.7 70,000
Chemical 71.1 2,600,000
HDC 14.7 80,000
With conditions in the Chemical tower steadilyworsening, the decision was made to drop the control point back to 2,150 umhos to increase the blowdown ratesand help purge the tower. Conditions showed a steadyimprovement from that point to the end of the study, butthis experience served to emphasize the importance of asidestream solids removal device for maintaining towercleanliness.
Figure 16 shows a similar history for planktonicanaerobic results. Once again the non-chemical towers provided more consistent control averaging 85 and 87
CFU/ml respectively for the PP and HDC towers. TheChemical tower exhibited wide swings for anaerobesranging from <1 to 1,200 CFU/ml with an average of 290CFU/ml for the study period.
Figure 16. Planktonic Counts – Anaerobic History

7/23/2019 Alcoa Report Chemical vs. Non-chemical Evaluation
http://slidepdf.com/reader/full/alcoa-report-chemical-vs-non-chemical-evaluation 13/17
13
Sessile Results. The following table summarizesthe sessile aerobic results for all three towers over thecourse of the study. All results are presented as colonyforming units per square centimeter (CFU/cm2). The areaof the 0.5” x 3.0” perforated, mild steel coupon used toattract sessile growth was 21.8 cm2 (including both sidesand edges minus perforations). The coupons designatedas “cold” were located in the coupon racks with the
corrosion coupons through which a sidestream ofrecirculating spray water (~ 5.0 gpm) was sent. The “hot”coupons were suspended approximately mid-way in thecooling coil pack at the top of the tower. These couponswere difficult to locate, and toward the end of the study,they were subjected to alternating “wet” and “dry”conditions as the spray water pumps and fans turned“OFF” and “ON” based on temperature settings duringcold mornings to minimize potential icing problems.These set points were eventually lowered to permit morecontinuous water flow, but the “hot” coupons were notanalyzed during this period.
The results indicate that with only a few
exceptions, the non-chemical devices provided effective biofilm control. The HDC system delivered the bestresults of all three technologies with all of their couponsmeasuring less than 1x 10⁶ CFU/cm2 (Average = 1.9 x10⁵ CFU/cm2) which is an accepted industry standard forcontrol of slime forming organisms6. The PP system performed almost as well with only two couponsmeasuring over 106 organisms / cm2. However, the lastsample is difficult to explain, as it is two orders ofmagnitude higher than another coupon removed from thesame rack after an identical four-week exposure period.The average results for the PP tower with and without thelast sample were 2.7 x 10⁶ and 5.9 x 10⁵ CFU/cm2 respectively. By contrast the majority (62%) of thecoupons from the Chemical tower were above the target1x 106 CFU/cm2 control point with a calculated average =2.5 x 10⁶ CFU/cm2.
All coupons were tested for sulfate reducing bacteria (SRBs). The presence of SRBs is an indicationof anaerobic conditions, which can promote corrosion offouled metal surfaces. As shown in the above table, seven
coupons tested positive for SRBs, no indications of MICwere observed. Four of the seven coupons were from theChemical tower.
Analyses conducted by Ecole Polytechnique for planktonic, heterotrophic organisms indicated that only amoderate level of disinfection was occurring across all ofthe towers with a significant proportion of the populationremaining viable/active. This is consistent with PP claims
that their process is more bacteriostatic than bactericidal.However, HDC claim of destroying microbial populations by high temperature, pressure, and vacuum is not asevident 7,8
Seven samples taken from each of the three towerstested for Legionella. None tested positive (> 1.0 CFU/50ml.). However, the study protocols were not specificallydesigned to determine the efficacy of these chemical andnon-chemical technologies toward controlling Legionella organisms9.
Algae Control. Although these Baltimore AircoilTowers were closed on four sides, the exposed moist drifteliminators on the top of the tower afforded a perfect
haven for algae growth. The non-oxidizing biocidesadded to the Chemical tower and carried in the drift wereeffective algaecides as indicated by the stark black colorof the drift eliminators on top of the Chemical tower. ThePP and HDC towers on the other hand showed patches ofgreen algae, with the PP showing the most extensivecoverage. Although neither non-chemical supplier claimsefficacy for algae control, algae growth will requireadditional maintenance (e.g. physical cleaning or periodic use of an algaecide).I. WHOLE EFFLUENT TOXICITY (WET) TESTS.
As effluent discharge limits become morestringent, and facilities strive toward greater waterconservation on the way to “zero liquid discharge” thequality of our cooling tower blowdown waters will play amore significant role in attaining “zero non-compliance.”One of the anticipated advantages of using non-chemicalcooling water treatments is the elimination of aquatictoxicity concerns, and a test program was developed tovalidate this premise.
Table 4 – Summary of Sessile Results
Date PP Chemical HDC
Removed Cold Hot Cold Hot Cold Hot
7/9 9.5x10⁴ 1x10³ 8x10⁴ 8/5 2.6x10⁵ 4.1x10⁵ 1.8x10⁵
9/5 8x10⁴ 2x10⁵** 1.6x10⁴ 9/23 6.8x10⁵ 1.2x10⁵ 1x10⁶ 9x10⁵ 1.6x10⁵ 1.5x10⁵
10/21 2x10⁶ 1.1x10⁶ 7.5x10⁵** 10/28 4.5x10⁵ 1.3x10⁴ 2.1x10⁶** 1.6x10⁵ 1.3x10⁵ 7x10⁴ 11/25 4.5x10⁵** 8.1x10⁶** 1.4x10⁵ 11/25 1.7x10
7 6.8x10⁶** 8.6x10⁴**
Concentration < 1x106 = Biofilm Control - EFFECTIVE1x106 < Conc.< 1x107 = Biofilm Control - CONSIDER MODIFICATION for IMPROVEMENTConcentration > 1x107 = Biofilm Control - IMPROVEMENT REQUIRED
** Sulfate Reducing Bacteria tested positive in these samples

7/23/2019 Alcoa Report Chemical vs. Non-chemical Evaluation
http://slidepdf.com/reader/full/alcoa-report-chemical-vs-non-chemical-evaluation 14/17
14
Whole effluent toxicity (WET) procedures wererun using static acute definitive toxicity tests (96 hours forPimephales promelas, and 48 hours for Ceriodaphniadubia) at the following concentrations of blowdown:6.25%, 12.5%, 25%, 50%, and 100%. With the Chemicaltower the time of sampling relative to the time of biocideapplication has a great impact on blowdown toxicity.Three samples were sent for testing. Two were taken on
the same day after biocide addition (isothiazolin), and thelast one six days after biocide addition (glutaraldehyde).The first sampling event was corrupted for the PP tower.The results of the last two tests are summarized in Table 5 below.
Note that both non-chemical treatment systemswere shut down during the last sample taken on November 19, and had been off since November 6. Thisis not expected to impact the results of blowdowntoxicity. Blowdowns from all three towers exhibitedtoxicity to Ceriodaphnia in all three samples. This can beexplained by the effect of salinity on freshwaterorganisms. The improved survival of Pimephales
Promelas (i.e. fathead minnow) from the Chemical toweris evident on the last test. This is due to taking the sample6-days after biocide addition, compared to taking thesample right after addition on October 28th. A value of>100.0 means that all organisms survived at all blowdownconcentrations.J. OPERATING AND MAINTENANCE COSTCOMPARISONS.
Another important aspect of this study, in additionto a performance evaluation of the three technologies, wasto determine the costs to install, operate, and maintainthem. A number of cost categories were established to provide a basis for comparison. These included:depreciation, supplies, makeup water, blowdown water(assuming treatment / surcharge costs), powerconsumption, R&M materials, labor charges (i.e. O/M,
supervisory, contracted services, and administrativeoversight), and costs to address toxic blowdown. Table 6 below summarizes the results of the net costs (+) orsavings (-) to operate the two non-chemical devicescompared to conventional chemical treatment, all at 4cycles of concentration.
A few notes on the tables. Recall that this studyinvolved a 1,600-gallon system. At this size, in thislocation, neither non-chemical device is competitive withchemical treatment, because the capital costs for thechemical system were fully depreciated. For theextrapolations starting at a 2,500-gallon system, capitalcosts for all three systems are included and depreciated
over a 10-year period. All costs for the extrapolationwere based on this study except that capital costs were based on vendor input. Installation costs wereextrapolated from the cost of the Mt. Holly system basedon six-tenths rule applied to the ratio of model sizes (e.g.square of diameters for PP and flow rates for HDC).Comparison was made for oxidizing and non-oxidizing biocides in order to capture costs or savings based on this
Table 5 – Summary of Toxicity Test
% of blowdown corresponding to 50% mortality (LC50)
October 28, 2002 November 19, 2002
2,750 umhos 2,750umhos
2,150umhos
2,750umhos
PP Chemical HDC PP Chemical HDC
Pimephales Promelas(96 hour LC 50)
>100.0 70.8 >100.0 >100.0 >100.0 >100.0
CeriodaphniaDubia(48 hour LC50)
36.6 11.3 35.4 29.0 9.5 21.0
Table 6 – Cost Comparison at 4 Cycles of Concentration
Size System(gallons)
ChemicalSystem
ComparisonPulsed Power HDC
AnnualCost (+) or Savings (-)
Simple Payback(yrs)
AnnualCost (+)
2,500 gal Oxidizing $161 NA $3,049
2,500 gal Non-Oxidizing -$114 295 $2,774
10,000 gal Oxidizing -$1,749 24 $2,754
10,000 gal Non-Oxidizing -$2,851 15 $1,652
50,000 gal. Oxidizing -$5,432 12 $10,904
50,000 gal. Non-Oxidizing -$10,931 6 $14,567
100,000 gal. Oxidizing -$10,884 7 $21,541
100,000 gal. Non-Oxidizing -$21,899 4 $10,525

7/23/2019 Alcoa Report Chemical vs. Non-chemical Evaluation
http://slidepdf.com/reader/full/alcoa-report-chemical-vs-non-chemical-evaluation 15/17
15
variable. It must be noted however that althoughoxidizing biocides (such as bleach) are generally cheaper,they require much more containment, ventilation andcontrols. The costs for this infrastructure were includedin the comparison. Finally maintenance labor andmaterials costs for the HDC unit for this test were highdue to the presence of the carbon particles and their effecton the pumps and the HDC hardware. Subsequent to our
field trial, the HDC manufacturer made improvements totheir design, which eliminated the need for one of theirhigh maintenance filtration devices. For the cost analysisabove, essentially similar maintenance costs were used for both non-chemical systems. A significant portion of themaintenance expenses for the chemical system wasassumed to be included in the unit cost of the chemicals.
Non-chemical suppliers claim they can run at 6 to 8cycles of concentration, which this study shows isfeasible. The chemical systems typically run at 3 to 5cycles, which was where the chemically treated towerswhere running prior to this test. Cost comparison at 8cycles for non-chemical and 4 cycles for chemical treated
systems is shown in Table 7. Recall from Figure 6 thatgoing from 8 to 4 cycles for these towers resulted in anapproximate 50% blowdown reduction.
As shown on the tables, the HDC does not seem tohave the economies of scale that the PP unit does. This isdue to the significant capital cost increases required bythe HDC suppliers to move into the larger systems. Inaddition to capital cost, the power costs are also higher forthe HDC units to run the extra pumps required. Both non-chemical systems would compare even more favorably ifconsideration was given to potential fines levied forviolations of WET test standards associated with toxic blowdowns discharged from chemically treated coolingtowers. Another potential benefit of non-chemicaltreatment is a reduction in amount of reportable chemicalsinto the environment as reported in the annual ToxicRelease Inventory (TRI) report (e.g.chlorine from bleach).Lastly, the better heat transfer results exhibited by the
HDC system during this trial, while difficult to quantify,could also favorably impact their overall operating costs.
SUMMARY AND CONCLUSIONS
Based upon the results and findings of this twenty-six week study we offer the following conclusions:
A general observation was that fugitive dusts
emanating from a nearby carbon silo were readily drawninto the three cooling towers by the air scrubbing actionof the tower fans. While the abrasive carbon fines causedsome operating difficulties for pumps associated with thePP and HDC systems, the lack of a sidestream solidsremoval device severely compromised operation of theChemical tower at elevated cycles creating unacceptable(>120 NTU) turbidity levels.
The make-up (MU) and blowdown (BD) volumesacross all three towers were statistically the same (95%CI) at all setpoints. This is expected, as conductivitysetpoints were the same across all three towers.
Conductivity is not reflective of true cycles ofconcentration in higher cycles (greater than 7 cycles atthis site). Additionally, make-up and blowdown in thisstudy proved to be an inaccurate measure of cycles ofconcentration due to possible unquantified leaks and driftloss. The best way to track cycles of concentration athigher cycles is by comparing salt (Mg, Na, K, SO4, etc)contents of the make-up and blowdown.
TDS, total alkalinity, total hardness, calciumhardness and conductivity were scrutinized statistically,and showed no difference between all three towers foreach operating period respectively, with a coupleexceptions. During the 2,750 umhos time frame thealkalinity for the Chemical tower was higher than that ofeither non-chemical tower. The reason for this is likely
due to the scale inhibitors keeping scale forming elementsin solution for the Chemical tower, while scale or other precipitates were forming in the non-chemical towers.Turbidity was higher in the Chemical tower at highercycles due to the lack of a solids separation device.
Table 7 – Cost Comparison at 8 Cycles for Non-Chemical and 4 Cycles for Chemical Treated Systems
Size System(gallons)
ChemicalSystem
Comparison
Pulsed Power HDC
AnnualCost (+) or Savings (-)
Simple Payback(yrs)
AnnualCost (+) or Savings (-)
Simple Payback(yrs)
2,500 gal Oxidizing -$8,168 4 -$5,280 9
2,500 gal Non-Oxidizing -$8,443 4 -$5,556 810,000 gal Oxidizing -$22,253 2 -$17,750 4
10,000 gal Non-Oxidizing -$23,354 2 -$18,851 4
50,000 gal. Oxidizing -$34,897 2 -$18,570 9
50,000 gal. Non-Oxidizing -$40,404 2 -$24,078 7
100,000 gal. Oxidizing -$49,328 2 -$16,903 17
100,000 gal. Non-Oxidizing -$60,343 1 -$27,919 10

7/23/2019 Alcoa Report Chemical vs. Non-chemical Evaluation
http://slidepdf.com/reader/full/alcoa-report-chemical-vs-non-chemical-evaluation 16/17
16
The Chemical tower provided the best corrosioncontrol with rates averaging 1.1 mils/year over the entirestudy period. Corrosion rates for the non-chemicaldevices were higher, but still within industry standards.This may have been due to the action of the non-chemicaldevices in operating in moderate to severe calciumcarbonate scaling regimes, or simply cycling up of theortho-phosphate levels in the makeup water, which acted
as an anodic inhibitor.Both the PP and HDC towers showed a greater
potential for scale formation when these non-chemicaldevices were turned OFF from November 6-21. This isinferred from the reduction in both alkalinity and calciumhardness during that time (i.e.presumably scale wasforming on the surfaces when the devices were OFF).However when the devices were turned back on andmoved up to 4,000 umhos calcium hardness increased,while alkalinity stayed low. A reasonable explanation ofthis result is that calcium carbonate was forming in thewater column (very small particulate) as suppliers hadclaimed. Additional evidence for scale control could be
inferred by the effect a larger PP unit had on improvingheat transfer of its respective tower.The sidewall scale in both the PP and HDC towers
had a sparkling, crystalline appearance compared to thedull white scale of the Chemical tower. The buildup inthe PP scale may have been an example of the “ripening”affect whereby the crystal size of the precipitate increases.The entire top layer and some of the bottom layer of“sparkling – crystalline” scale in the PP and HDC towerswas removable by water under “garden hose” pressure.However, there were some spots of tenacious scale thatrequired “water blast” pressure to remove. The Chemicaltower had less scale accumulation, probably as a result ofoperating at lower cycles of concentration for extended periods, and the affects of the scale inhibitor additive.However, this scale was difficult to remove and requiredwater blasting.
Both of the non-chemical towers delivered betterand more consistent microbiological control for bothaerobic and anaerobic planktonic organisms compared tothe Chemical tower. There was no statistical difference inthe microbiological control performance between the PPand HDC technologies. Despite alternating two non-oxidizing biocides, microbiological control performancein the Chemical tower suffered due to higher turbiditylevels created by lack of a sidestream solids removaldevice. While there was some correlation between these
high turbidity levels and high microbiological counts, thisdoes not appear to fully explain all the biologicalvariability in the Chemical tower.
Microbiological control for slime forming, sessileorganisms was better and more consistent for the non-chemical systems. There were only a few instances wherethe non-chemical treatment systems did not provideeffective control, and both instances occurred in the PPtower. The HDC technology delivered the best resultswith all of their test coupons measuring < 1x10⁶
CFU/cm2, which is considered the standard for effective biofilm control.
Seven of thirty (23%) sessile coupons tested positive for sulfate reducing bacteria (SRB), which is anindicator of anaerobic conditions that can promotecorrosion of fouled metal surfaces. Of these seven positive coupons, four were from the Chemical tower, twowere from the HDC and one was from the PP.
The non-oxidizing biocides added to the Chemicaltower appeared to also serve as effective algaecides asevidenced by the stark, black surface of the drifteliminators on this tower. The top of the drift eliminatorson the PP and HDC towers exhibited scattered patches ofgreen algae with the largest coverage on the PP tower.
The results showed a clear cost savings advantagefor the PP systems against the other two technologiesacross all system sizes.
RECOMMENDATIONS
As locations implement water conservationmeasures by operating their cooling towers at highercycles of concentration, they should strongly considerinstalling side stream solids removal devices to improvesystem cleanliness at reduced blowdown levels.
Locations considering new applications of thesenon-chemical approaches as a water conservation measureshould carefully evaluate their source of makeup waterand the overall system economics. Makeup water withreasonable levels of hardness (40 – 50 mg/l) and ortho- phosphate (0.5-1.0 mg/l) will result in better corrosioncontrol than soft water without any additives. Addition ofa sidestream solids removal device is also highlyrecommended. In very abrasive environments (i.e. lots ofdust/sand in the air) the standard sidestream removal may
not be enough to protect mechanical non-chemicaltreatment devices. Locations currently experiencing algalcontrol problems should be aware that these non-chemicaltechnologies may not provide effective algal control.

7/23/2019 Alcoa Report Chemical vs. Non-chemical Evaluation
http://slidepdf.com/reader/full/alcoa-report-chemical-vs-non-chemical-evaluation 17/17
17
REFERENCES
1. Condenser Water Treatment Results Under Pulsed-
Power Technology by J. Lane (PP Systems), and D.F.Peck (Hatch Mott MacDonald). Presented at the
Cooling Tower Institute Conference 20022. An Innovative and Alternative Method for Cooling
Water Treatment by R. Kelsey, D. Koontz, and W.Wang (HDC Technologies). Presented at theInternational Water Conference, October 2001
3. Rohrback Aquamate Corrater User Manual, Corrater
is a registered trademark ™ of Rohrback Cosasco4. Cooling Water Scale & Scaling Indices: What They
Mean – How to Use Them Effectively – How They
Can Cut Treatment Costs by P. R. Puckorius and G.R. Loretitsch (Puckorius and Associates, Inc).Presented at the International Water Conference,October 1999
5. Physical Water Treatment for the Mitigation of
Mineral Fouling in Cooling-Tower Water
Applications, by Y.I. Cho Ph.D, S. Lee, and W. Kim
presented at ASHRAE Conference January 20036. Dr. Benoit Barbeau, Personal Communication, Date
Feb 17, 20037. Alternative Methods of Microbiological Control –
Review of Major Rapid Techniques by Petat etal,STP Pharma Pratiques 6:6, pp. 449-464 1996
8. BacLight: Application of a New Rapid Staining
Method for Direct Enumeration of Viable and Total
Bacteria in Drinking Water by B. Barbeau etal,Journal of Microbiological Methods, Vol. 37, pp 77-86, 1999
9. Guideline: Best Practices for Control of Legionella by Cooling Tower Institute, February 2000.