Embed Size (px)
Citation preview

alcohol and drug
Treatment Services Hawai‘i, 5-Year Trends (2010 – 2014)

2
E X E C U T I V ES U M M A RY
This is a five-year trend report presenting information from Hawai‘i agencies that provided
alcohol and drug treatment services during state fiscal years 2010 to 2014, with a focus on
the latest reporting year, 2014, as the year of primary interest. Some comparisons across the
reporting years are made to highlight trends in treatment services, clients, and outcomes. The
report contains information on the socio-demographic characteristics of the adolescents and
adults who were admitted to treatment programs. The use of different modalities of services,
funds expended on services, and data relating to treatment service outcomes and status of
follow-up are also presented. This report is limited to data from agencies that are funded by the
Alcohol and Drug Abuse Division (ADAD) of the Hawai‘i Department of Health.
In 2014, ADAD funded 24 agencies that offered services to adults at 52 sites and 10 agencies
that provided services to adolescents at 107 sites. From 2010 to 2014, the number of sites
increased 26% for adolescents and 16% for adults. The overall trends show that the numbers
of admissions for treatment services were relatively stable across the five reporting years with a
slight decline in 2011. Similarly, the numbers of clients receiving services and the amount of
funds expended on services were relatively stable during the same time period with a slight
increase from 2011 to 2012.
In all five reporting years (2010 to 2014), the most common source of referral was self-referral,
followed by the criminal justice system. Marijuana was the primary substance for the majority of
adolescents during the same reporting period (60% - 62%), followed by alcohol (28% - 32%).
For adults 18 to 49 years, methamphetamine was the most frequently reported primary
substance at the time of admission (42% - 50%), followed by alcohol (21% - 31%).
Compared to previous years, in 2014, the highest percentage of adults reported the use of
methamphetamine as primary substance (50%). In contrast, the lowest percentage reported
the use of alcohol as primary substance (21%). Across the five reporting years, adults 50 years
and older reported alcohol the most frequently (44% - 58%), followed by methamphetamine
(23% - 41%). In particular, the percentage of adults 50 years and older that reported
methamphetamine as the primary substance had increased each year without a decline in any
given year (23% in 2010, to 28% in 2012, to 41% in 2014).
The percentage of clients utilizing each type of treatment modality varied by age group in 2014.
All adolescents were admitted to outpatient programs (i.e., Outpatient Treatment and Intensive
Outpatient Treatment programs), whereas more than half of adults (63% of adults and 56% of
older adults) received outpatient treatment from various outpatient services (i.e., Intensive
Outpatient Treatment, Outpatient Treatment, and Methadone Maintenance programs). The
remaining clients (37% of adults and 44% of older adults) were admitted to residential services
(i.e., Residential Treatment, Therapeutic Living, and Residential Social Detoxification programs).

3
More than 17 million dollars in state and federal funds were spent on substance
treatment services during 2014, a 7% increase from funding in 2010. Of the total
funds, a bit less than half (45%) were expended on Native Hawaiians and around
10% were used on services for pregnant and parenting women with children.
More than three-fourths (78%) of the total funds were allocated to two treatment
programs, Outpatient Treatment and Residential Treatment.
In 2014, a total of 3,929 clients were served. More than half of the clients (53%)
receiving treatment services were adolescents. The largest group of clients came
from the City and County of Honolulu (67%), followed by Hawai‘i (15%), Maui
(13%), and Kaua‘i (5%) Counties. There were more male than female clients
statewide (60% male vs. 40% female), and about two-fifths of those receiving
services identified themselves as Native Hawaiians including mixed Hawaiians
(42%). A similar trend was observed across all five reporting years.
A total of 5,109 cases were either discharged from treatment services (3,754
cases) or transferred to a different program (1,355 cases) in 2014. Among all
3,754 discharged cases, 43% completed treatment with no drug use, 18%
completed treatment with some drug use, 25% left the facility before completing
treatment, and the remainder were discharged for other reasons.
The rate of completing treatment with no drug use varied greatly across
treatment modalities. In 2014, the vast majority of clients from the Residential
Social Detoxification modality (88%) completed treatment with no drug use. The
second highest percentage of this group was from Therapeutic Living, in which
37% of clients completed treatment with no drug use, followed by Outpatient
Treatment (32%).
At six-month follow-up in 2014, almost all adolescents (99%) were attending
school and 69% of adults were employed. The majority of adolescents (61%)
and adults (72%) reported not using any substances in the past 30 days prior to
follow-up. The vast majority of adolescents and adults continued to have no
arrests, no hospitalizations, and no emergency room visits since discharge, across
all reporting years.
This is a five-year trend
report presenting
information from
Hawai‘i agencies that
provided alcohol and
drug treatment services
during state fiscal years
2010 to 2014, with a
focus on the latest
reporting year, 2014,
as the year of primary
interest.

4
This is the fifth report on substance abuse treatment services, clients who receive treatment, and outcomes of treatment in Hawai‘i, developed by the Alcohol and Drug Abuse Division
(ADAD) of the Hawai‘i Department of Health (DOH) and the University of Hawai‘i’s Center on the Family1. The report focuses on data collected from agencies receiving state and federal funds from ADAD in the state fiscal year 2014. It does not include data relating to treatment services that are not funded by ADAD. Comparisons across five reporting years, i.e., fiscal years 2010, 2011, 2012, 2013, and 2014, are made to highlight trends in treatment services, clients, and outcomes. The aim of the current report is to increase the knowledge and understanding of substance abuse treatment in our state, which is an important step in improving services for those who require assistance in overcoming their addiction to alcohol and drugs.
TREATMENT SERVICES IN HAWAI‘ISubstance abuse treatment and prevention services are authorized by Hawai‘i Revised Statutes (HRS) §321-193 and HRS §334, which delineate a comprehensive system of care, including certification of substance abuse counselors and administrators, accreditation of programs, and coordination of treatment and prevention activities. ADAD is the primary source of public funds for substance abuse treatment and prevention services in Hawai‘i. Some treatment services are publicly funded through the Hawai‘i Medicaid 1115 waiver program called QUEST, which is administered by the Department of Human Services. Each QUEST managed care plan decides with which substance abuse treatment providers it will contract. Treatment services are provided to QUEST clients within the limits of the benefits in the plan. Private health insurance companies and health maintenance organizations provide certain minimum substance abuse benefits as required by HRS §431M.
The ADAD treatment funds consist of both the Substance Abuse Prevention and Treatment (SAPT) Block Grant and state general funds. The state fiscal year 2014 is from July 1, 2013, to June 30, 2014.
1 Earlier reports are available from http://uhfamily.hawaii.edu/publications/list.aspx.
R E P O R TOV E RV I E W

5
Adult substance abuse treatment services
Motivational enhancement services, residential, outpatient, intensive outpatient, non-medical residential detoxification, case management services, Native Hawaiian cultural practices, therapeutic living programs, clean and sober housing, continuing care services, and cultural activity expenditures.
Adolescent substance abuse treatment services
School-based and community-based outpatient treatment services. School-based treatment occurred at the middle or high school campus and included outpatient services as well as cultural and recreational service activities. The community-based services for the adolescent population consisted of intensive outpatient, outpatient, and cultural activities.
Dual diagnosis substance abuse treatment services
Motivational enhancement services, residential, outpatient, intensive outpatient, therapeutic living programs, clean and sober housing, and continuing care services.
Services for injection drug users (IDUs)
Methadone intensive outpatient and outpatient treatment, medication administration and health status monitoring, and interim and outreach services.
Specialized programs for pregnant substance abusing women and women with dependent children
Residential, intensive outpatient, outpatient (which allows for child care cost), therapeutic living programs, clean and sober housing, the availability of interim services, and cultural activity reimbursement. ADAD also contracted with the Family Drug Court to implement a family drug court for pregnant and parenting women. Services included intensive family case management services and motivational enhancement services, as well as the typical services provided for pregnant and parenting substance abusing women.
Substance abuse treatment services for offenders
Integrated case management and adult substance abuse treatment services for adults who are under the supervision of the Department of Public Safety’s Intake Service Center, the Judiciary’s Adult Client Services Branch, the Department of Public Safety’s Corrections Division, or the Hawai‘i Paroling Authority.
Services for Group Recovery Homes
The management of a network of recovery group homes and the administration of the revolving loan fund.
Early Intervention Services for Human Immunodeficiency Virus (HIV)
Medical, nursing, counseling, and supportive services provided on-site at ADAD-funded substance abuse treatment programs. This included pre-test and post-test counseling done in accordance with the Department of Health’s HIV Counseling and Testing guidelines.
ADAD funded treatment services included the following:

6
SERVICE MODALITY
ADAD’s treatment efforts are designed to promote a statewide, culturally appropriate, comprehensive system of services to meet the treatment and recovery needs of individuals and families. ADAD’s target population includes adults or adolescents who meet the DSM IV criteria2 for substance abuse or dependence. The income of clients eligible for treatment cannot exceed 300% of the poverty level for Hawai‘i as defined by Federal Poverty Level Standards, and clients must have no other form of insurance coverage for substance abuse treatment. Priority admissions are given to pregnant and parenting women with children (PPWC) and injection drug users (IDUs).
2 American Psychiatric Association (1994). Diagnostic and Statistical Manual of Mental Disorders, 4th edition. Washington, D.C.: American Psychiatric Association.
Residential Treatment Programs
24-hour, non-medical, non-acute care in a licensed residential treatment facility that provides support, typically for more than 30 days, for persons with substance abuse problems. These programs consist of 25 hours per week of face-to-face activities, including individual and group counseling, education, skill building, recreational therapy, and family services.
Intensive Outpatient Treatment Programs
Outpatient alcohol and/or other drug treatment services provided for at least three or more hours per day for three or more days per week, including individual and group counseling, education, skill building, and family services.
Outpatient Treatment Programs
Non-residential, comprehensive services for individuals, groups, and families, provided from one to eight hours per week for adults and adolescents with substance abuse problems.
Therapeutic Living Programs
Structured, licensed, therapeutic living programs for individuals who desire clean and sober housing and are currently enrolled in, are transitioning to, or during the past six months have been clinically discharged from a substance abuse treatment program.
Special Services
Residential Social Detoxification Programs
Short-term, licensed, residential, non-medical detoxification treatment services for individuals with substance use disorders.
Methadone Maintenance Outpatient Programs
Ongoing administration of methadone, an oral substitute for opiates, in conjunction with social and medical services.
The treatment services fall along a continuum of care that includes the following:

2010 2011 2012 2013 2014 2010 2011 2012 2013 2014
COUNTY
C&C of Honolulu 42 44 45 52 53 21 21 22 22 28
Hawai‘i County 24 24 24 24 33 11 11 11 11 11
Maui County 13 13 13 13 15 11 11 11 10 10
Maui (10) (10) (10) (10) (12) (7) (7) (7) (6) (6)
Lana‘i (1) (1) (1) (1) (1) (2) (2) (2) (2) (2)
Moloka‘i (2) (2) (2) (2) (2) (2) (2) (2) (2) (2)
Kaua‘i County 6 6 6 6 6 2 2 2 2 3
TOTAL 85 87 88 95 107 45 45 46 45 52
No. of Treatment Sites for Adolescents
No. of Treatment Sites for Adults
7
TABLE 1. Number and Location of ADAD-Funded Treatment Sites, 2010-2014
AGENCIES AND TREATMENT SITES
ADAD-funded treatment services are available in all of the state’s four counties (see Table 1). In 2014, ADAD provided funds to 24 agencies that offered services to adults at 52 sites and to 10 agencies that provided services to adolescents at 107 sites (see back cover for the list of agencies). These latter sites were primarily located on middle and high school campuses. The number of agencies serving adults in the state increased from 19 in 2010 to 24 in 2014. The number of agencies serving adolescents was relatively stable with a slight increase from nine in 2010 to 10 in 2014. Compared to earlier reporting years, the number of sites for adolescents and adults increased in more recent years, with one exception: The number of sites for adults in Maui County decreased by one (from 11 to 10) from 2012 to 2013. Compared to 2010, in 2014, the number of sites increased 25.9% for adolescents and 15.6% for adults. The most significant increase in the number of sites for adolescents was observed in Hawai‘i County with a 37.5% increase from 2013 to 2014, followed by City & County of Honolulu with a 15.6% increase from 2012 to 2013. The numbers of sites for adults were relatively stable with the most significant increase observed from 2013 to 2014 in the City & County of Honolulu (27.3% increase).

8
THE DATA AND THEIR LIMITATIONS
The alcohol and drug treatment services data in this report are presented in the following three sections:
Section A—Services offered and funds expended
Section B—Client characteristics
Section C—Treatment service outcomes and follow-up
Unless otherwise indicated, data are presented for the state fiscal year, which runs from July 1 of the preceding calendar year to June 30 of the calendar year, e.g., July 1, 2013, to June 30, 2014, for fiscal year 2014.
Data were drawn from the Web-based Infrastructure for Treatment Services (WITS) system input by each treatment service provider. With all data systems, there is a possibility of data entry and/or data collection errors. To reduce the occurrence of such errors, ADAD and University of Hawai‘i Center on the Family provide training to service providers each year. Note that data can vary depending on when data are drawn from the WITS system, as data entry may not occur in a timely manner. In addition, an individual being admitted to a treatment service program does not always mean that the person receives an actual service. The person may be transferred to another program or leave the program due to various reasons before receiving services.
Note that for admission data, every admission is considered as a separate count, and there is no differentiation between clients admitted once or more during a specified period. For this reason, the total number of admissions is a duplicated count of individuals served. However, client data represent individuals, and the total number of clients is an unduplicated count of individuals served in a given year.
The number and client mix of ADAD-funded treatment service admissions do not represent the total demand for substance abuse treatment or the prevalence of substance abuse in the general population. The levels and characteristics of treatment service admissions depend to some extent on the availability of state and federal funds. As funding levels rise, the percentage of the substance-abusing population admitted to treatment services generally increases. Moreover, funding criteria, which may change over time, affect the service modality (e.g., residential, outpatient, or other type of treatment services) utilized and client eligibility for services.
The classification of each category may not be the same as previous reports. See footnotes for each definition when comparing with previous reports.
Data on the primary substance used at the time of admission represent the substances that led to the treatment episodes, but are not necessarily a complete depiction of all substances used at the time of admission.

9
The aim of the current
report is to increase
the knowledge and
understanding of
substance abuse
treatment in our state,
which is an important
step in improving
services for those who
require assistance
in overcoming their
addiction to alcohol
and drugs.
Treatment service discharges by modality of service are not strictly comparable because the modality of service offered upon admission varies depending on individual client needs.
Starting in 2010, Day Treatment programs were no longer funded by ADAD. Thus, there should be no admission or discharge records related to Day Treatment during the current reporting years. However, a small number of admissions and discharges have been reported in the WITS system. In this report, the admission data (Section A) for fiscal years 2013 and 2014 omitted these admissions in Day Treatment. For fiscal years 2010, 2011, and 2012, admissions in Day Treatment were included. This was done to avoid any confusion related to the numbers found in previous reports that include data from 2010, 2011, and 2012, where the issue was handled differently. Discharge data (Section C) focused on year 2014 only and discharge cases from Day Treatment were omitted from tables and figures. The 2010 treatment report presented those cases as they were (i.e., as Day Treatment) with a caution indicating a possible error. In the 10-year trend report, those were reclassified as Intensive Outpatient Treatment (IOT), as services provided by IOT were the closest to those by Day Treatment. Starting with data from fiscal year 2013, the decision was made to exclude Day Treatment cases from the report since the report is intended to focus only on services funded by ADAD and ADAD does not fund Day Treatment under any circumstances.
Percentages are rounded up to the first decimal in this report, resulting in total percentages ranging from 99.9 to 100.1 percent.
Finally, caution should be used in interpreting statistics for which large amounts of data lack information (e.g., clients’ psychiatric status and follow-up at six months after discharge).

2010 2011 2012 2013 2014
No.(%)
No.(%)
No.(%)
No.(%)
No.(%)
AGE GROUP
Adolescents, 17 years and younger
Adults, 18 to 49 years
Older adults, 50 years and older
TOTAL 5,548 4,890 5,552 5,512 5,655
COUNTY OF RESIDENCE
C&C of Honolulu
Hawai‘i County
Maui County
Kaua‘i County
TOTAL a 5,536 4,849 5,509 5,429 5,601
2,699 2,281 2,865 2,812 2,634 (48.6) (46.6) (51.6) (51.0) (46.6)
396 387 473 403 474 (7.1) (7.9) (8.5) (7.3) (8.4)
2,453 2,222 2,214 2,297 2,547 (44.2) (45.4) (39.9) (41.7) (45.0)
3,344 2,906 3,557 3,367 3,665 (60.4) (59.9) (64.6) (62.0) (65.4)
1,036 1,068 981 1,086 960 (18.7) (22.0) (17.8) (20.0) (17.1)
829 641 749 727 735 (15.0) (13.2) (13.6) (13.4) (13.1)
327 234 222 249 241 (5.9) (4.8) (4.0) (4.6) (4.3)
10
TABLE A-1. Number (and Percentage) of Admissions by Age Group and County of Residence, 2010-2014
S E C T I O N A
This section presents the latest data and trends on the total number of treatment admissions3. It also presents information on the admissions relating to age, county of residence, referral
source, primary substance used at the time of admission, and service modality. In addition, there is summary information on the funds expended by different modalities of services and for special client groups.
a Admissions of individuals from out-of-state were excluded from the County of Residence calculations: 12 non-residents in 2010, 41 in 2011, 43 in 2012, 83 in 2013, and 54 in 2014.
3 In this section, every admission is counted separately and no distinction is drawn between clients served once or more than once during a specified period. For this reason, the total number of admissions (duplicated count) should be equal to or greater than the total number of clients (unduplicated count) served during a particular year.
S E RV I C E S O F F E R E D A N D F U N D S E X P E N D E D

11
In 2014, there were 5,655 admissions statewide for treatment services. The numbers of admissions were relatively stable over the reporting years, with the exception of a decline in 2011.
Across all reporting years, adults ages 18 to 49 received the largest share of services, followed by adolescents, then by older adults age 50 and older.
In 2014, the largest percentage of admissions was observed in the City & County of Honolulu (65.4%), with the highest proportion of the state’s residents, followed by Hawai‘i (17.1%), Maui (13.1%), and Kaua‘i (4.3%) Counties. This same trend was observed across all reporting years.
Jamie was facing a series of challenges including untreated chronic illness, lost relationships with family due to drug use, legal problems, and unemployment.
With support from a treatment service provider, she was able to obtain her clinical discharge from treatment. Her illness was treated and managed. She started rebuilding relationships with her family members and parenting sober to her child. She is employed and participating in a group meeting every week.

12
The most common source of referral across all reporting years was self-referral, ranging from 46.3% to 52.5% of admissions.
Consistent with previous years, in 2014, close to one-fourth (23.3%) of admissions were referred by the criminal justice system. In 2014, the remaining quarter of referrals were completed by schools (9.2%), health care providers (3.4%), child protective services (2.0%), and “Other” (9.6%).
FIGURE A-1. Admissions by Sources of Referral, 2010-2014a,b,c
a The sum of percentages ranges from 99.9% to 100.1% due to round up to the first decimal in each category.b “Criminal Justice” includes the Intake Service Center of the Department of Public Safety.c The “Other” category includes referrals from employers, parents/family, friends/peers, other community referrals, and refer-
rals from unknown sources.
Other
School (Educational)
Health CareProvider
Child ProtectiveService
Criminal Justice
Individual (Self)
2010 2011 2012 2013 20140
10
20
30
40
50
60
70
80
90
100
52.5
23.3
2.03.4
9.2
9.6
46.3
26.7
1.93.6
11.0
10.6
47.4
27.5
2.6
4.1
9.5
9.0
48.4
23.2
1.73.6
14.5
8.5
48.6
23.6
5.7
2.5
13.3
6.3
Perc
ent

13
In 2014, marijuana was the primary substance for the majority of adolescents (61.2%), followed by alcohol (28.1%). Across all reporting years, the same trend was observed (59.5% - 62.4% and 28.1% - 32.1% for marijuana and alcohol, respectively).
FIGURE A-2. Primary Substance Used at Admission for Adolescents 17 Years and Younger, 2010-2014a,b
Lana was kicked out of her school due to her drug use.
After reaching out to a counselor at an adolescent treatment program for support, she volunteered to attend both individual and group sessions weekly. The agency, along with another non-profit organization, helped her to complete the required community services. She has successfully been clean and sober for three months.
a The sum of percentages ranges from 99.9% to 100.1% due to round up to the first decimal in each category.b The “Other” category includes cocaine/crack, heroin, and other drugs.
0.50.3 0.70.90.9
Other
Methamphetamine
Alcohol
Marijuana
2010 2011 2012 2013 20140
10
20
30
40
50
60
70
80
90
100
59.5
32.1
7.5
62.0
29.5
7.6
62.4
30.0
7.3
62.0
29.3
8.1
61.2
28.1
10.1
Perc
ent

14
FIGURE A-3. Primary Substance Used at Admission for Adults 18 to 49 Years, 2010-2014a,b
In 2014, methamphetamine, also known as “ice,” was the most frequently reported primary substance at the time of admission (49.9%), followed by alcohol (21.4%). The same trend was held for the 5-year period (42.4% - 49.9% and 21.4% - 30.7%).
The percentage of adults 18 to 49 years reporting methamphetamine as the primary substance increased from 44.3% in 2010 to 49.9% in 2014. In contrast, the percentage of adults reporting alcohol as primary substance declined from 30.0% in 2010 to 21.4% in 2014.
a The sum of percentages ranges from 99.9% to 100.1% due to round up to the first decimal in each category.b The “Other” category includes cocaine/crack, heroin, and other drugs.
Other
Methamphetamine
Alcohol
Marijuana
2010 2011 2012 2013 20140
10
20
30
40
50
60
70
80
90
100
16.6
30.0
44.3
9.2
18.7
30.7
42.4
8.2
18.6
25.5
45.5
10.3
17.9
23.9
47.7
10.5
16.8
21.4
49.9
11.9
Perc
ent

15
For adults 50 years and older, alcohol was the most frequently used primary substance at the time of admission (43.7% - 58.1%), followed by methamphetamine (22.5% - 41.4%) across the five reporting years.
Although this trend held across all reporting years, unlike previous years, in 2014, the differences between percentages of adults using methamphetamine and alcohol was minimal (43.7% reporting alcohol vs. 41.1% reporting methamphetamine). The percentage of older adults using methamphetamine as the primary substance has significantly increased from 22.5% in 2010 to 41.1% in 2014. In contrast, those using alcohol as the primary substance declined from 58.1% in 2010 to 43.7% in 2014.
FIGURE A-4. Primary Substance Used at Admission for Adults 50 Years and Older, 2010-2014a,b
a The sum of percentages ranges from 99.9% to 100.1% round up to the first decimal in each category.b The “Other” category includes cocaine/crack, heroin, and other drugs.
Other
Methamphetamine
Alcohol
Marijuana
2010 2011 2012 2013 20140
10
20
30
40
50
60
70
80
90
100
22.5
14.4
58.1
5.1
55.8
25.1
13.2
5.9
52.2
27.9
13.7
6.1
52.1
30.3
10.7
6.9
43.7
41.1
10.1
5.1
Perc
ent

16
FIGURE A-5. Primary Substance Used at Admission for Individuals 18 to 49 Years by Gender, 2014
The most frequently used substance at admission was methamphetamine for both males and females (48.7% and 52.7% of males and females, respectively), followed by alcohol (22.2% and 19.7% of males and females, respectively).
Higher percentages of males reported alcohol and marijuana as the primary substance used at the time of admission compared to those of females (22.2% and 17.3% of males vs. 19.7% and 15.6% of females for alcohol and marijuana, respectively). In contrast, a higher percentage of females reported methamphetamine as the primary substance compared to that of males (52.7% of females vs. 48.7% of males).
Other0
10
20
30
40
50
60
70
MethamphetamineAlcoholMarijuana
17.315.6
22.219.7
11.8 12.1
48.7
52.7
Perc
ent
Male Female

17
The relative share of different modalities of service differed by age group. Among adult admissions, more than half (63.0% and 55.9% of adults and older adults, respectively) received outpatient treatment from various outpatient modalities (i.e., Intensive Outpatient Treatment, Outpatient Treatment, and Methadone Maintenance programs). The remaining clients (37.0% and 44.1% of adults and older adults, respectively) were admitted to residential services (i.e., Residential Treatment, Therapeutic Living, and Residential Social Detoxification programs).
In contrast, all adolescents were admitted to two types of outpatient programs (i.e., Outpatient Treatment and Intensive Outpatient Treatment programs).
FIGURE A-6. Admissions by Modality of Services, 2014
Methadone Maintenance
Therapeutic Living
Residential Social Detoxification
Residential Treatment
Intensive Outpatient Treatment
Outpatient Treatment
50 years & older18 to 49 years17 years & younger0
10
20
30
40
50
60
70
80
90
100
96.0
4.0
29.7
31.1
18.0
11.6
7.4
2.2 3.4
23.6
28.9
12.4
30.2
1.5
Perc
ent

18
2010 2011 2012 2013 2014
$(%)
$(%)
$(%)
$(%)
$(%)
SERVICE MODALITY
Residential Treatment
Intensive Outpatient Treatment
Outpatient Treatment
Therapeutic Living
Methadone Maintenance
Residential Social Detoxification
TOTAL 16,230,241 16,966,279 17,987,526 17,761,437 17,375,319
SPECIAL GROUPSb
Native Hawaiians
Residential PPWC
Therapeutic Living PPWC
1,617,649 1,461,147 1,763,274 1,703,282 1,585,656 (10.0) (8.6) (9.8) (9.6) (9.1)
7,089,460 7,515,789 7,871,307 7,591,967 7,803,838 (43.7) (44.3) (43.8) (42.7) (44.9)
5,283,879 5,410,972 5,886,718 6,089,330 5,737,672 (32.6) (31.9) (32.7) (34.3) (33.0)
1,410,840 1,656,304 1,571,215 1,492,921 1,317,357 (8.7) (9.8) (8.7) (8.4) (7.6)
7,812,076 7,561,293 8,308,541 7,757,781 7,853,227 (48.1) (44.6) (46.2) (43.7) (45.2)
436,329 498,189 459,668 463,335 529,122 (2.7) (2.9) (2.6) (2.6) (3.0)
1,325,420 1,267,310 1,358,537 1,417,027 1,011,036 (8.2) (7.5) (7.6) (8.0) (5.8)
392,084 423,878 435,344 420,602 401,674 (2.4) (2.5) (2.4) (2.4) (2.3)
697,283 877,891 825,045 751,150 768,279 (4.3) (5.2) (4.6) (4.2) (4.4)
TABLE A-2. Funds Expended by Service Modality and Special Groups, 2010-2014a
a Numbers were rounded to the nearest whole dollar.b The groups of Native Hawaiians and pregnant and parenting women with children (PPWC) are not mutually exclusive.

19
More than 17 million dollars in state and federal funds were expended for treatment services in 2014. Funds expended were relatively stable over five years, with the largest amount recorded in 2012. The funds increased from $16,230,241 in 2010 to $17,987,526 in 2012 and then slightly declined to $17,375,319 in 2014.
Across all five reporting years, the highest percentage of funds was expended on Outpatient Treatment (42.7% - 44.9%), followed by Residential Treatment (31.9% - 34.3%).
Consistent across five years, about half of the total funds were spent on services for Native Hawaiians (43.7% - 48.1%). The amount of funds used for services to pregnant and parenting women with children (PPWC) were relatively stable from 2010 to 2013 ($2,022,703 - $2,183,582). In 2014, a lesser amount ($1,779,315) was expended for services to PPWC.
Maila returned to thank the treatment service provider staff for their help and support. She was homeless and also on probation while in treatment, and experienced multiple diagnoses including substance abuse and depression.
Now she is working in customer service and living independently. She has sustained sobriety for several years and is off probation.
Participating in treatment sessions provided Kai with an opportunity to talk about the issues that would challenge his sobriety.
He felt he was not able to discuss those issues with other people, especially his parents, but that treatment was a safe environment.
In 2014, ADAD provided
funds to 24 agencies
that offered services
to adults at 52 sites
and to 10 agencies
that provided services
to adolescents at 107
sites. More than 17
million dollars in state
and federal funds were
expended for treatment
services in 2014. A total
of 3,929 clients were
served in 2014.

20
2010 2011 2012 2013 2014
No.(%)
No.(%)
No.(%)
No.(%)
No.(%)
AGE GROUP
Adolescents, 17 years and younger
Adults, 18 to 49 years
Older adults, 50 years and older
TOTAL 3,622 3,694 3,988 3,982 3,929
COUNTY OF RESIDENCEa
C&C of Honolulu
Hawai‘i County
Maui County
Kaua‘i County
TOTAL 3,615 3,670 3,961 3,941 3,902
1,446 1,444 1,744 1,677 1,568 (39.9) (39.1) (43.7) (42.1) (39.9)
208 236 294 254 296 (5.7) (6.4) (7.4) (6.4) (7.5)
1,968 2,014 1,950 2,051 2,065 (54.3) (54.5) (48.9) (51.5) (52.6)
2,223 2,236 2,553 2,452 2,596 (61.5) (60.9) (64.5) (62.2) (66.5)
638 728 650 730 577 (17.6) (19.8) (16.4) (18.5) (14.8)
509 516 562 539 519 (14.1) (14.1) (14.2) (13.7) (13.3)
245 190 196 220 210 (6.8) (5.2) (4.9) (5.6) (5.4)
TABLE B-1. Number (and Percentage) of Clients by Age Group and County of Residence, 2010-2014
This section presents five-year trends for the total number of clients that ADAD-funded treatment agencies served4. The section also includes the characteristics of clients such as age, county of
residence, gender, ethnicity, employment status, and special conditions when admitted to services.
a Individuals from out-of-state were excluded: 7 in 2010, 24 in 2011, 27 in 2012, 41 in 2013 and 27 in 2014.
4 Unlike the number of admissions that represents a duplicated count of services received, these data are based on clients and represent an unduplicated count of clients receiving services in a given year.
A total of 3,929 clients were served in 2014. The number of total clients served was relatively stable from year to year, with a slight increase (8.0%) in number from 2011 to 2012.
In 2014, the largest group of clients receiving services was adolescents (52.6%), followed by adults ages 18 to 49 (39.9%). The same trend was observed across all five reporting years.
In 2014, the majority of clients came from the City & County of Honolulu (66.5%), followed by Hawai‘i (14.8%), Maui (13.3%), and Kaua‘i (5.4%) Counties. The same trend was observed across all reporting years.
S E C T I O N BC L I E N T C H A R AC T E R I S T I C S

21
2010 2011 2012 2013 2014
No.(%)
No.(%)
No.(%)
No.(%)
No.(%)
GENDER
Male
Female
TOTAL 3,622 3,694 3,988 3,982 3,929
ETHNICITYa
Hispanicb
Hawaiian
Caucasian
Filipino
Japanesec
Samoan
Black
Portuguese
Mixed, Not Hawaiian
Other Pacific Islander
Otherd
TOTALe 3,622 3,687f 3,987f 3,982 3,927f
1,455 1,443 1,529 1,500 1,557 (40.2) (39.1) (38.3) (37.7) (39.6)
27 44 27 35 44 (0.7) (1.2) (0.7) (0.9) (1.1)
279 286 280 340 326 (7.7) (7.8) (7.0) (8.5) (8.3)
2,167 2,251 2,459 2,482 2,372 (59.8) (60.9) (61.7) (62.3) (60.4)
688 693 759 686 642 (19.0) (18.8) (19.0) (17.2) (16.3)
1,623 1,575 1,719 1,645 1,636 (44.8) (42.7) (43.1) (41.3) (41.7)
467 520 520 529 511 (12.9) (14.1) (13.1) (13.3) (13.0)
87 94 113 121 101 (2.4) (2.5) (2.8) (3.0) (2.6)
214 260 286 348 378 (5.9) (7.1) (7.2) (8.7) (9.6)
379 369 405 408 408 (10.5) (10.0) (10.2) (10.2) (10.4)
135 140 156 154 147 (3.7) (3.8) (3.9) (3.9) (3.7)
115 143 138 138 156 (3.2) (3.9) (3.5) (3.5) (4.0)
75 83 104 107 89 (2.1) (2.3) (2.6) (2.7) (2.3)
TABLE B-2. Socio-Demographic Characteristics of Clients at Admission to Services, 2010-2014

22
2010 2011 2012 2013 2014
No.(%)
No.(%)
No.(%)
No.(%)
No.(%)
EMPLOYMENT STATUS
Employed
Unemployed/looking for work in the past 30 days/laid off
Student
Otherg
Unknown
TOTAL 3,622 3,694 3,988 3,982 3,929
Table B-2. (continued)
a Ethnicity information was collected in two separate ways: first by asking clients to identify if they were Hispanic or not, and then clients were asked to select an ethnic group from a list of ethnicities that did not include Hispanic. As a result, the number of Hispanic clients was a duplicated count of ethnicity, and not further interpreted.
b There were missing cases in the Hispanic category for 6, 3, 7, 4, and 13 individuals in 2010, 2011, 2012, 2013, and 2014, respectively. As a result, the total numbers in the Hispanic category are different from the total numbers presented in this table. The total numbers for the Hispanic category are 3,616; 3,691; 3,981; 3,978; and 3,916 in 2010, 2011, 2012, 2013, and 2014, respectively. The percentages of Hispanic were calculated based on the Hispanic-specific total numbers presented in this footnote.
c Japanese includes Okinawan.d There were 56, 50, 52, 69, and 39 cases classified as unknown in 2010, 2011, 2012, 2013, and 2014, respectively. These
cases were included in the “Other” ethnicity category. “Other” includes American Indian, Aleutian/Eskimo, Asian (other than Filipino and Japanese), other, and unknown.
e Because of the duplicated count of Hispanic, the count was excluded from the total.f There were missing cases in the Ethnicity category for 7, 1, and 2 individuals in 2011, 2012, and 2014, respectively.g The “Other” category includes homemakers, retirees, disabled individuals, inmates in institutions, and others not in
the labor force.
In 2014, there was a higher percentage of males among clients receiving treatment services (60.4% male vs. 39.6% female). The same trend was observed in 2010 to 2013.
From 2010 to 2014, the largest group of clients who received treatment services each year was Hawaiians (41.3% - 44.8%), followed by Caucasians (16.3% - 19.0%), together making up around three-fifths of all clients (58.0% - 63.8%). Filipinos were the third largest group that received services (10.0% - 10.5%).
Among those who received services in 2014, approximately one-fourth (24.0%) were in the labor force: employed (5.8%) and unemployed/looking for work (18.2%). This was a slightly lower percentage than in previous years (25.6% - 27.3%). The majority of clients (75.1%) were not in the labor force: students (56.8%) and other (18.3%).
701 721 851 815 714 (19.4) (19.5) (21.3) (20.5) (18.2)
2,084 2,180 2,157 2,220 2,233 (57.5) (59.0) (54.1) (55.8) (56.8)
583 559 730 650 719 (16.1) (15.1) (18.3) (16.3) (18.3)
238 223 234 272 228 (6.6) (6.0) (5.9) (6.8) (5.8)
16 11 16 25 35 (0.4) (0.3) (0.4) (0.6) (0.9)

23
2010 2011 2012 2013 2014
No.(%)
No.(%)
No.(%)
No.(%)
No.(%)
SPECIAL CONDITIONa
Homelessb
Pregnant
Methadone cases
Clients with five or more prior treatment episodes
Psychiatric problem in addition to alcohol/drug problemc
41 39 29 28 42 (1.1) (1.1) (0.7) (0.7) (1.1)
12 8 19 9 44 (0.3) (0.2) (0.5) (0.2) (1.1)
24 34 35 34 41 (0.7) (0.9) (0.9) (0.9) (1.0)
287 318 439 417 444 (7.9) (8.6) (11.0) (10.5) (11.3)
366 394 441 411 380 (10.1) (10.7) (11.1) (10.3) (9.7)
TABLE B-3. Clients with Special Conditions at Admission to Services, 2010-2014
a A client can be admitted with one or more of the special conditions.b “Homeless” includes individuals who are single and those with partners or parents. c Information is unknown for 26.4% to 31.8% of clients across the five reporting years.
In 2014, the two most prevalent special conditions among clients who received treatment services were 1) psychiatric problem in addition to alcohol/drug problem (11.3%), and/or 2) homelessness (9.7%). These were the two most prevalent special conditions across all five reporting years.
About 1% or less of the clients were pregnant (0.7% - 1.1%), methadone cases (0.2% - 1.1%) and/or had five or more prior treatment episodes (0.7% - 1.0%) across the five reporting years.
Ben is an addict who was suffering from multiple issues including substance abuse, depression, and other mental disorders.
After following through with therapy and medication management, he has sustained over five years sobriety and regularly attended 12 step meetings. He is working and plans to live with his child.

24
This section presents information on the types of discharges following treatment services and on the status of clients six months after discharge5,6.
FIGURE C-1. Types of Treatment Service Discharge, 2014
In 2014, a total of 5,109 cases were either discharged from treatment services (3,754 cases) or transferred to a different level of care for continued treatment in the same or another agency (1,355 cases).
Among the 3,754 total discharged cases, about three-fifths of discharged clients (61.4%) completed treatment with no drug use (43.0%) or with some drug use (18.4%). About one-fourth (25.2%) left treatment before completion and 11.9% of clients were discharged due to non-compliance with program rules. A very small percentage of clients (1.5%) were in the “Other” category; they were incarcerated, died while receiving treatment, or were discharged for medical reasons.
5 Note that the number of admissions reported earlier in this report does not match the number of discharges for the specified year. This is because clients admitted in a particular year may be discharged in the same or the following year.
6 There were 58 discharge cases reported under Day Treatment. Because Day Treatment programs were no longer funded by ADAD, they were excluded from this report. About 85% of those Day Treatment cases were classified as being transferred within/outside the treatment facility, and the remainder were classified as being discharged.
S E C T I O N CT R E AT M E N T S E RV I C E O U T C O M E S A N D F O L L OW- U P
Treatment Completed, No Drug Use
Treatment Completed, Some Drug Use
Non-compliance with Program Rules
Left Before Completing Treatment
Other
43.0%
18.4%
11.9%
25.2%
1.5%
25
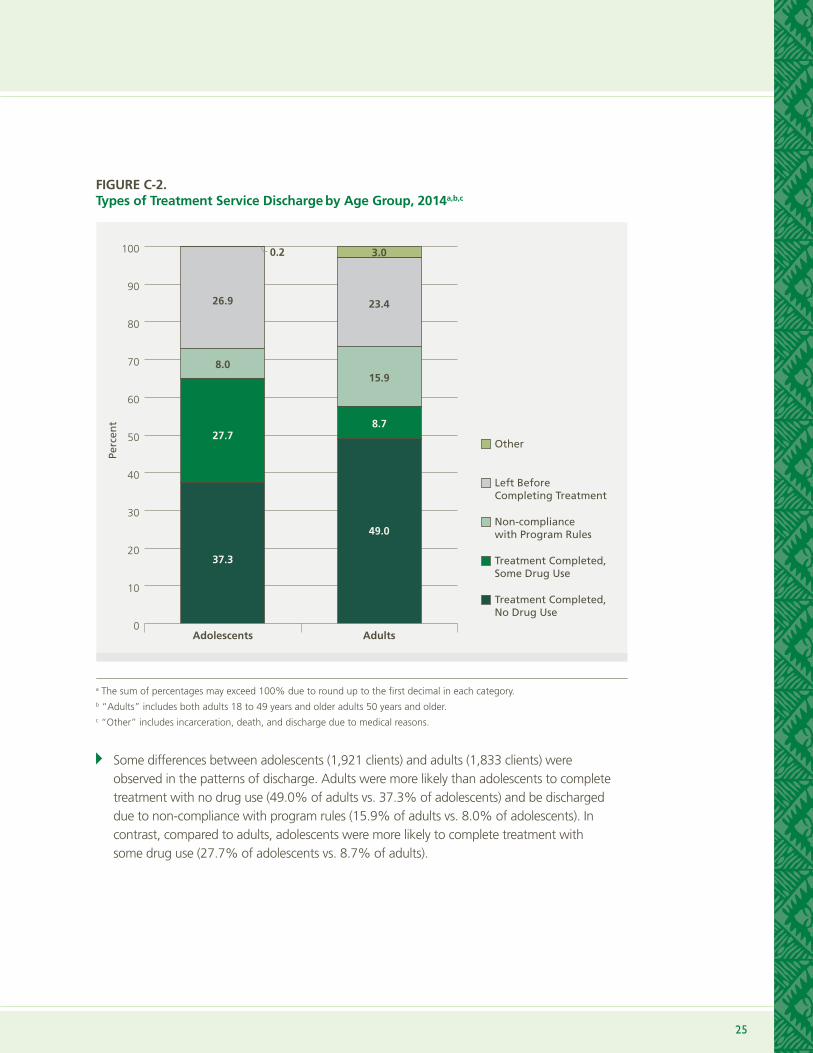
Some differences between adolescents (1,921 clients) and adults (1,833 clients) were observed in the patterns of discharge. Adults were more likely than adolescents to complete treatment with no drug use (49.0% of adults vs. 37.3% of adolescents) and be discharged due to non-compliance with program rules (15.9% of adults vs. 8.0% of adolescents). In contrast, compared to adults, adolescents were more likely to complete treatment with some drug use (27.7% of adolescents vs. 8.7% of adults).
a The sum of percentages may exceed 100% due to round up to the first decimal in each category.b “Adults” includes both adults 18 to 49 years and older adults 50 years and older.c “Other” includes incarceration, death, and discharge due to medical reasons.
FIGURE C-2. Types of Treatment Service Discharge by Age Group, 2014a,b,c
Adolescents
Other
Left Before Completing Treatment
Non-compliance with Program Rules
Treatment Completed, Some Drug Use
Treatment Completed, No Drug Use
0
10
20
30
40
50
60
70
80
90
100
37.3
27.78.7
15.9
23.4
3.0
8.0
26.9
0.2
49.0
Adults
Perc
ent

26
Trea
tmen
t
Com
plet
ed, N
o
Dru
g U
se
Trea
tmen
t
Com
plet
ed,
Som
e D
rug
Use
Tran
sfer
red
W
ithi
n/O
utsi
de
Faci
litya
Non
-com
plia
nce
wit
h Pr
ogra
m
Rule
s
Left
Bef
ore
Com
plet
eing
Tr
eatm
ent
Oth
erb
Tota
lc
No
.(%
)N
o.
(%)
No
.(%
)N
o.
(%)
No
.(%
)N
o.
(%)
No
.(%
)
SER
VIC
E M
OD
ALI
TY
Resi
dent
ial T
reat
men
t9
017
.10
0.0
326
62.1
377.
066
12.6
61.
152
510
0.0
Inte
nsiv
e O
utpa
tient
Tr
eatm
ent
9710
.513
1.4
466
50.4
155
16.8
167
18.1
262.
892
410
0.0
Out
patie
nt T
reat
men
t95
031
.967
322
.64
84
16.2
218
7.3
631
21.2
230.
82,
979
100.
0
Ther
apeu
tic L
ivin
g74
36.5
31.
566
32.5
2713
.333
16.3
00.
020
310
0.0
Met
hado
ne
Mai
nten
ance
15.
61
5.6
84
4.4
15.
64
22.2
316
.718
100.
0
Resi
dent
ial S
ocia
l D
etox
ifica
tion
403
87.6
10.
25
1.1
71.
54
49.
60
0.0
460
100.
0
TOTA
L1,
615
31.6
691
13.5
1,35
526
.544
58.
794
518
.558
1.1
5,10
910
0.0
TAB
LE C
-1.
Typ
es o
f Tr
eatm
ent
Serv
ice
Dis
char
ge
or
Tran
sfer
by
Serv
ice
Mo
dal
ity,
201
4
a “Tr
ansf
er”
incl
udes
clie
nts
tran
sfer
red
to o
ther
pro
gram
s of
the
sam
e ag
ency
and
cas
es r
efer
red
to o
utsi
de a
genc
ies
for
cont
inue
d tr
eatm
ent.
b
“Oth
er”
incl
udes
tho
se c
lient
s th
at w
ere
inca
rcer
ated
, die
d, o
r di
scha
rged
due
to
med
ical
rea
sons
.c P
erce
ntag
es m
ay n
ot a
dd t
o 10
0 du
e to
rou
nd u
p to
the
firs
t de
cim
al in
eac
h ca
tego
ry.
A
mon
g th
e to
tal d
ischa
rged
and
tran
sfer
red
case
s in
201
4, th
e pe
rcen
tage
of c
lient
s w
ho c
ompl
eted
trea
tmen
t with
no
drug
use
was
hig
hest
am
ong
the
Resid
entia
l Soc
ial D
etox
ifica
tion
prog
ram
s (8
7.6%
), fo
llow
ed b
y th
e Th
erap
eutic
Liv
ing
prog
ram
s (3
6.5%
), an
d th
e O
utpa
tient
Tre
atm
ent p
rogr
ams
(31.
9%).
Furt
her,
the
Out
patie
nt T
reat
men
t pro
gram
s ha
d th
e hi
ghes
t per
cent
age
of c
lient
s w
ho c
ompl
eted
trea
tmen
t with
som
e dr
ug u
se (2
2.6%
).
M
ore
than
hal
f of c
lient
s in
Res
iden
tial T
reat
men
t and
Inte
nsiv
e O
utpa
tient
Tre
atm
ent p
rogr
ams
wer
e tr
ansf
erre
d (6
2.1%
and
50.
4%, r
espe
ctiv
ely)
.
A
mon
g th
e m
odal
ities
of t
reat
men
t, th
e In
tens
ive
Out
patie
nt T
reat
men
t pro
gram
s ha
d th
e hi
ghes
t per
cent
age
of c
lient
s w
ho w
ere
disc
harg
ed
due
to n
on-c
ompl
ianc
e w
ith p
rogr
am ru
les
(16.
8%),
follo
wed
by
Ther
apeu
tic L
ivin
g pr
ogra
ms
(13.
3%).
Typ
es o
f Tr
eatm
ent
Serv
ice
Dis
char
ge
or
Tran
sfer

27
2010
2011
2012
2013
2014
2010
2011
2012
2013
2014
No
.(%
)N
o.
(%)
No
.(%
)N
o.
(%)
No
.(%
)N
o.
(%)
No
.(%
)N
o.
(%)
No
.(%
)N
o.
(%)
STA
TUS
AT
FOLL
OW
UPa
Att
endi
ng s
choo
l 1,
259
(97.
8)
1,24
1 (9
8.6
)1,
174
(98.
4)
1,15
1 (9
7.7)
1,05
1 (9
8.6
)N
AN
AN
AN
AN
A
Empl
oyed
par
t tim
e/fu
ll tim
eN
AN
AN
AN
AN
A4
84
(64.
6)
377
(66.
8)
368
(66.
5)39
4 (6
5.1)
327
(68.
7)
No
arre
sts
sinc
e di
scha
rge
1,19
1 (9
2.5)
1,14
6 (9
1.1)
1,0
81
(90.
6)
1,07
6 (9
1.3
)98
9 (9
2.8
)69
4 (9
2.7)
516
(91.
5)4
64
(83.
9)
515
(85.
1)42
2 (8
8.7)
No
subs
tanc
e us
e in
30
days
pr
ior
to f
ollo
w-u
p 69
6 (5
4.1)
707
(56.
2)65
6 (5
5.0
)67
8 (5
7.6
)6
47
(60.
7)52
2 (6
9.7)
373
(66.
1)39
3 (7
1.1)
401
(6
6.3
)34
1 (7
1.6
)
No
new
sub
stan
ce a
buse
tre
atm
ent
1,09
2 (8
4.8
)1,
037
(82.
4)
994
(83.
3)
1,01
5 (8
6.2)
899
(84.
3)
598
(79.
8)
412
(73.
0)
431
(77.
9)
469
(7
7.5)
390
(81.
9)
No
hosp
italiz
atio
n1,
245
(96.
7)1,
204
(95.
7)1,
138
(95.
4)
1,13
8 (9
6.6
)1,
029
(96.
5)71
2 (9
5.1)
523
(92.
7)51
8 (9
3.7)
547
(90.
4)
44
8 (9
4.1)
No
emer
genc
y ro
om v
isits
1,
216
(94.
5)1,
181
(93.
9)
1,11
0 (9
3.0
)1,
099
(93.
3)
1,0
06
(94.
4)
693
(92.
5)51
3 (9
1.0
)50
7 (9
1.7)
530
(87.
6)
430
(90.
3)
No
psyc
holo
gica
l dis
tres
s si
nce
disc
harg
e1,
002
(7
7.9
)1,
026
(81.
6)
1,02
1 (8
5.6
)98
5 (8
3.6
)91
2 (8
5.6
)63
5 (8
4.8
)45
5 (8
0.7)
438
(79.
2)47
7 (7
8.8
)39
7 (8
3.4
)
Stab
le li
ving
arr
ange
men
ts1,
261
(98.
0)
1,23
7 (9
8.3
)1,
170
(98.
1)1,
153
(97.
9)
1,05
0 (9
8.5)
669
(89.
3)
481
(8
5.3
)4
63
(83.
7)51
9 (8
5.8
)41
2 (8
6.6
)
TOTA
Lb1,
287
1,25
81,
193
1,17
81,
066
749
564
553
605
476
In
201
4, a
mon
g th
e di
scha
rged
ado
lesc
ents
with
follo
w-u
p da
ta, n
early
all
wer
e in
sta
ble
livin
g ar
rang
emen
ts (9
8.5%
), at
tend
ed s
choo
l (98
.6%
), an
d ha
d no
t bee
n ho
spita
lized
(96.
5%).
At t
he ti
me
of fo
llow
-up,
mos
t had
had
no
emer
genc
y ro
om v
isits
(94.
4%),
had
not b
een
arre
sted
(92.
8%),
and
had
not r
ecei
ved
new
sub
stan
ce tr
eatm
ent (
84.3
%) s
ince
disc
harg
e. T
he la
rge
maj
ority
of d
ischa
rged
ado
lesc
ents
(85.
6%) h
ad n
ot s
uffe
red
psyc
holo
gica
l dist
ress
. In
addi
tion,
abo
ut th
ree-
fifth
s (6
0.7%
) of a
dole
scen
ts h
ad n
ot u
sed
any
subs
tanc
es in
the
30 d
ays
prio
r to
follo
w-u
p.
A
mon
g th
e ad
ults
who
wer
e su
cces
sful
ly fo
llow
ed u
p in
201
4, a
lmos
t all
(94.
1%) h
ad n
o ho
spita
lizat
ions
sin
ce d
ischa
rge.
A g
reat
maj
ority
had
also
ha
d st
able
livi
ng a
rran
gem
ents
, and
had
no
emer
genc
y ro
om v
isits
and
no
arre
sts
since
disc
harg
e (8
6.6%
, 90.
3%, a
nd 8
8.7%
, res
pect
ivel
y).
Add
ition
ally,
the
larg
e m
ajor
ity re
port
ed n
o ps
ycho
logi
cal d
istre
ss (8
3.4%
) and
had
not
rece
ived
new
sub
stan
ce a
buse
trea
tmen
t (81
.9%
) at t
he ti
me
of fo
llow
-up.
Mor
e th
an tw
o-th
irds
of a
dult
clie
nts
had
not u
sed
any
subs
tanc
es in
the
last
30
days
(71.
6%) a
nd w
ere
empl
oyed
(68.
7%).
TAB
LE C
-2.
Clie
nt
Stat
us
Six
Mo
nth
s af
ter
Dis
char
ge
by
Ag
e G
rou
p, 2
010-
2014
Ad
ole
scen
ts, 1
7 Ye
ars
and
Yo
un
ger
Ad
ult
s, 1
8 Ye
ars
and
Old
er
a Inf
orm
atio
n is
pres
ente
d on
ly fo
r clie
nts
with
com
plet
ed fo
llow
-up
data
. The
refo
re, t
he d
ischa
rge
data
repo
rted
her
ein
may
not
repr
esen
t all
of th
e cl
ient
s w
ho w
ere
disc
harg
ed fr
om tr
eatm
ent s
ervi
ces.
b Tot
al n
umbe
r of c
lient
s fr
om w
hom
com
plet
e fo
llow
-up
data
are
ava
ilabl
e. W
ithin
eac
h ye
ar, t
his
is th
e de
nom
inat
or fo
r cal
cula
ting
the
perc
enta
ge v
alue
s fo
r eac
h fo
llow
-up
stat
us.
NA
= n
ot a
pplic
able
. The
iden
tified
sta
tus
was
not
app
licab
le to
clie
nts
of th
e sp
ecifi
ed a
ge g
roup
.

For more information, please contact:
Alcohol and Drug Abuse Division Department of Health 601 Kamokila Boulevard, Room 360 Kapolei, Hawai‘i 96707 (808) 692-7506
Center on the Family University of Hawai‘i at Ma–noa 2515 Campus Road, Miller Hall 103 Honolulu, Hawai‘i 96822 (808) 956-4132
Agencies Offering Services to Adults
Action with Aloha
Alcoholic Rehabilitation Services of Hawai‘i, Inc. (ARSH) dba Hina Mauka
Aloha House, Inc.
Big Island Substance Abuse Council (BISAC)
Bridge House, Inc.
Care Hawaii, Inc.
Child and Family Service
Family Court – First Circuit
Ho’omau Ke Ola
Ka Hale Pomaika‘i
Kline-Welsh Behavioral Health Foundation dba Sand Island Treatment Center
Ku Aloha Ola Mau (formerly DASH)
Malama Na Makua A Keiki
Mental Health Kokua
Ohana Makamae, Inc.
Oxford House, Inc.
Po‘ailani, Inc.
The Institute for Human Services
The Queen’s Medical Center
The Salvation Army dba The Salvation Army – Addiction Treatment Services (ATS)
The Salvation Army dba The Salvation Army – Family Treatment Services (FTS)
Waianae Coast Community Mental Health Center
Waikiki Health Center
Women in Need
Agencies Offering Services to Adolescents
Alcoholic Rehabilitation Services of Hawai‘i, Inc. (ARSH) dba Hina Mauka
Aloha House, Inc.
Big Island Substance Abuse Council (BISAC)
Care Hawaii, Inc.
Coalition for a Drug Free Hawaii
Hale Ho‘okupa‘a
Maui Youth and Family Services, Inc
Ohana Makamae, Inc.
The Institute for Family Enrichment
Young Men’s Christian Association (YMCA)
Photo Credit
The photographs in this report are courtesy of Scott Jun and Orasi Design.
Suggested Citation
Kim, J., Sabino, E., Zhang, J., & Okano, S.Y. (2015). Alcohol and Drug Treatment Services: Hawai‘i, 5-Year Trends (2010 - 2014). Honolulu: University of Hawai‘i, Center on the Family.
ADAD-FUNDED TREATMENT AGENCIES, 2014
This publication was made possible by the Substance Abuse Prevention and Treatment Block Grant 3B08TI010015-14S1 from the U.S. Department of Health and Human Services (HHS), Substance Abuse and Mental Health Services Administration (SAMHSA), Center for Substance Abuse Treat-ment and by the U.S. Department of Agriculture (USDA), National Institute of Food and Agriculture (NIFA), Hatch Project HAW03022-H (managed by the University of Hawaii, College of Tropical Agriculture and Human Resources).