Embed Size (px)
Citation preview
Alcohol and Drug Use by Drivers in British Columbia:
Findings from the 2018 Roadside Survey
Douglas J. Beirness, Ph.D. Canadian Drug & Alcohol Research Team Beirness & Associates, Inc. Ottawa, Ontario
CanDART
2018 British Columbia Drug and Alcohol Survey Page ii
ACKNOWLEDGEMENTS
The authors wish to acknowledge Transport Canada for the use of the breath testing equipment
and MADD Canada for supplying the gas cards that were provided to drivers.
This project was made possible through the cooperation and assistance of the:
• Abbotsford Police Department
• Royal Canadian Mounted Police (Kelowna Detachment)
• Royal Canadian Mounted Police (Prince George Detachment)
• Saanich Police Department
• Vancouver Police Department
The authors also wish to thank the following people for their contributions to this project:
• Jan Staples and Casey Baker of the Ministry of Public Safety and Solicitor General for
their efforts in engaging the various police departments in this project and arranging for
their assistance; and,
• Paul Boase of Transport Canada for his assistance and support throughout all phases of
the project.

2018 British Columbia Drug and Alcohol Survey Page iii
TABLE OF CONTENTS
Page
Table of Contents ACKNOWLEDGEMENTS ..................................................................................................... II TABLE OF CONTENTS ...................................................................................................... III EXECUTIVE SUMMARY ..................................................................................................... V INTRODUCTION .................................................................................................................. 1 METHODS ............................................................................................................................ 1
SELECTION OF COMMUNITIES ............................................................................................... 2
SAMPLE SIZE ...................................................................................................................... 2
SITE SELECTION .................................................................................................................. 2
SURVEY PROCEDURES ........................................................................................................ 2
BREATH SAMPLES ............................................................................................................... 3
ORAL FLUID SAMPLES .......................................................................................................... 3
ALTERNATIVE TRANSPORTATION.......................................................................................... 4
RESULTS ............................................................................................................................. 5 RESPONSE RATES ............................................................................................................... 5
CHARACTERISTICS OF THE SAMPLE ...................................................................................... 7
Driver sex ..................................................................................................................................... 7 Driver age ..................................................................................................................................... 7 Vehicle types ............................................................................................................................... 8 Occupant configuration ........................................................................................................... 8 Graduated Licensing ................................................................................................................ 9 Licence Class.............................................................................................................................. 9 Seat Belt Use ............................................................................................................................... 9 Origin and Destination ............................................................................................................. 9
DRIVING AFTER DRINKING .................................................................................................. 10
Cities ............................................................................................................................................. 11 CHARACTERISTICS OF DRINKING DRIVERS .......................................................................... 12
Driver sex ................................................................................................................................... 12 Driver age ................................................................................................................................... 12
GRADUATED LICENSING .................................................................................................... 12
CHARACTERISTICS OF DRINKING AND DRIVING .................................................................... 13
Survey night .............................................................................................................................. 13 Survey time................................................................................................................................ 14 Vehicle type ............................................................................................................................... 15 Occupant configuration ......................................................................................................... 15 Trip Origin .................................................................................................................................. 15
DRUGS AND DRIVING ......................................................................................................... 15
CHARACTERISTICS OF DRUG-DRIVERS ................................................................................ 16
Driver sex ................................................................................................................................... 16 Driver Age .................................................................................................................................. 17
CHARACTERISTICS OF DRUG-DRIVING ................................................................................ 17
2018 British Columbia Drug and Alcohol Survey Page iv
Survey night .............................................................................................................................. 17 Survey time................................................................................................................................ 18 Vehicle Type .............................................................................................................................. 19 Occupant Configuration......................................................................................................... 19 Trip Origin and Destination ................................................................................................... 19
EXPERIENCES AND AWARENESS ........................................................................................ 19
Alcohol and Cannabis Use .......................................................................................................... 21 DISCUSSION...................................................................................................................... 21 REFERENCES ................................................................................................................... 25 APPENDIX A ...................................................................................................................... 27 APPENDIX B ...................................................................................................................... 28 APPENDIX C ...................................................................................................................... 29 APPENDIX D ...................................................................................................................... 31
2018 British Columbia Drug and Alcohol Survey Page v
EXECUTIVE SUMMARY
A roadside survey of drivers was conducted in the province of British Columbia to obtain an
objective, valid estimate of the prevalence of driving after drinking and driving after drug use.
This survey was a follow-up to the roadside surveys conducted in 2008, 2010, and 2012 and
served to provide a baseline of cannabis use by drivers prior to the pending legalization of the
drug in Canada. The use of the same methods facilitates comparisons between the surveys.
Drivers were randomly sampled from the traffic stream at pre-selected locations between the
hours of 21:00 and 03:00 on Wednesday through Saturday nights and invited to participate in a
voluntary study of alcohol and drug use. Participants were asked to provide a breath sample to
measure their alcohol use and an oral fluid sample to be tested subsequently in a toxicology
laboratory for the presence of drugs. Of drivers selected for the survey, 74.8% (n=1,878) agreed
to participate. Of these drivers, 94.1% (n=1,767) provided a breath sample and 89.0% (n=1,671)
provided an oral fluid sample.
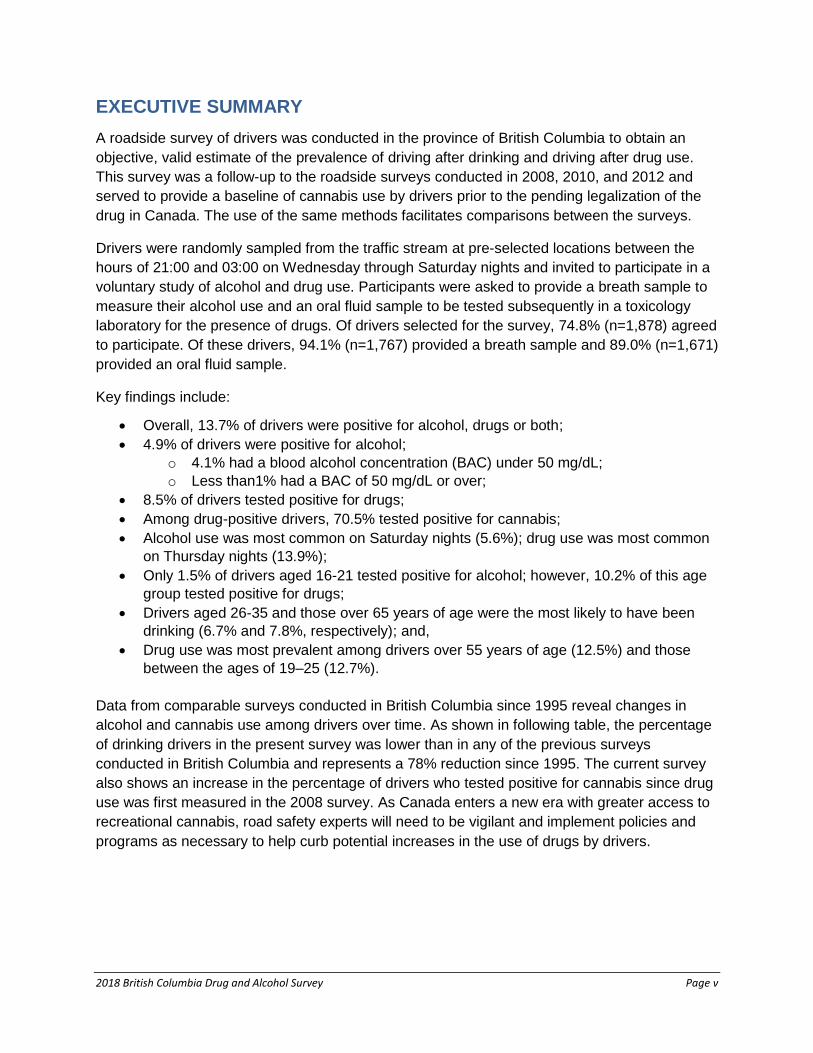
Key findings include:
• Overall, 13.7% of drivers were positive for alcohol, drugs or both;
• 4.9% of drivers were positive for alcohol;
o 4.1% had a blood alcohol concentration (BAC) under 50 mg/dL;
o Less than1% had a BAC of 50 mg/dL or over;
• 8.5% of drivers tested positive for drugs;
• Among drug-positive drivers, 70.5% tested positive for cannabis;
• Alcohol use was most common on Saturday nights (5.6%); drug use was most common
on Thursday nights (13.9%);
• Only 1.5% of drivers aged 16-21 tested positive for alcohol; however, 10.2% of this age
group tested positive for drugs;
• Drivers aged 26-35 and those over 65 years of age were the most likely to have been
drinking (6.7% and 7.8%, respectively); and,
• Drug use was most prevalent among drivers over 55 years of age (12.5%) and those
between the ages of 19–25 (12.7%).
Data from comparable surveys conducted in British Columbia since 1995 reveal changes in
alcohol and cannabis use among drivers over time. As shown in following table, the percentage
of drinking drivers in the present survey was lower than in any of the previous surveys
conducted in British Columbia and represents a 78% reduction since 1995. The current survey
also shows an increase in the percentage of drivers who tested positive for cannabis since drug
use was first measured in the 2008 survey. As Canada enters a new era with greater access to
recreational cannabis, road safety experts will need to be vigilant and implement policies and
programs as necessary to help curb potential increases in the use of drugs by drivers.

2018 British Columbia Drug and Alcohol Survey Page vi
Percentage of Drivers Positive for Alcohol and Cannabis in Roadside Surveys in British Columbia
Year of Survey
Alcohol (% Positive)*
Cannabis (% Positive)+
1995 18.7 --
1998 13.8 --
2003 12.3 --
2006 11.7 --
2008 7.8 4.6#
2010 10.7 4.5
2012 5.8 3.7
2018 4.0 5.3
* Includes data from Vancouver and Saanich only
+ Drug use was first included in the 2008 survey
# Kelowna and Prince George were not included as
part of the 2008 survey

2018 British Columbia Drug and Alcohol Survey Page 1
INTRODUCTION
Among the concerns surrounding the pending legalization of the possession and sale of
cannabis for recreational purposes is a possible increase in the number of drivers who choose
to drive after using cannabis. Recognizing the negative impact of an increase in cannabis use
by drivers, legislation was also introduced adding measures to deal with drivers adversely
affected by drugs. Among other things, the legislation (Bill C-46) includes oral fluid drug
screening, establishes a per se limit for cannabis, and facilitates the collection of blood samples
from suspected impaired drivers.
Efforts to deal effectively with cannabis-impaired driving are hampered by the extent of
knowledge on drugs and driving, which pales in comparison to that available on alcohol-
impaired driving. For example, whereas research has clearly demonstrated impairing effects of
alcohol on driving and has documented exponential increases in crash risk associated with
increasing concentrations of alcohol in the blood (Blomberg et al., 2009; Borkenstein et al.,
1974), there remain many questions about the effects of drugs and the risk of crash involvement
(Asbridge, Hayden & Cartwright, 2013; Bédard, Dubois & Weaver, 2007; Beirness, Logan &
Swann, 2010; Lacey et al., 2016; Dubois, Bédard & Weaver, 2010).
Roadside surveys have been used for many years to gather information about the use of
alcohol by nighttime drivers and these data have played an important role in our understanding
of the drinking driving problem. In recent years, the adaptation of the approach to gather data on
drug use among drivers has begun to provide a wealth of information about the nature and
extent of drugs and driving behaviour. In 2008, British Columbia was the first jurisdiction in
Canada to include oral fluid sample collection as the primary means to gather information about
drug use by drivers in a roadside survey (Beirness & Beasley, 2009; 2010). Subsequent
roadside surveys conducted in British Columbia in 2010 and 2012 (Beirness & Beasley, 2011;
Beasley & Beirness, 2012) and in Ontario in 2014 (Beirness et al., 2015) and 2017 (Beirness et
al., 2018) also collected information on drug use by drivers. These studies provided objective
evidence that drugs use was as commonplace as alcohol use among nighttime drivers and
constituted an issue deserving immediate attention.
Repeated roadside surveys over time provide a means to monitor trends in prevalence, as well
as changes in the temporal patterns of the behaviour, the types of substances used, and the
characteristics of drivers who engage in the behaviour. In addition, repeated surveys provide the
ability to assess the impact of specific countermeasure programs and policies on alcohol and
drug use among drivers. The present survey is a continuation of efforts to understand drug use
by drivers and provides a baseline against which to assess the effects of the legalization of
cannabis on driving.
METHODS
The survey was conducted using the same data collection procedures employed in previous
surveys conducted in British Columbia and Ontario, which were based on methods originally
outlined by Transport Canada and updated with a few minor modifications to improve the
efficiency of the operation (e.g., improved breath test technology) and to provide for the
collection of oral fluid samples (Boase, 2012).

2018 British Columbia Drug and Alcohol Survey Page 2
Selection of Communities
The survey was conducted in the same five communities as in several previous surveys
conducted in British Columbia. The communities and the dates on which data were collected
are listed in Table 1.
Table 1: Communities and Survey Dates
Communities Survey Dates
Vancouver May 30 - June 2
Abbotsford May 30 - June 2
Prince George June 6-9
Kelowna June 6-9
Saanich June 13-16
Sample Size
The target was to interview approximately 400 drivers in each of the five areas. A simple
random sample of 2,000 drivers would provide an overall estimate of the prevalence of drug or
alcohol use among drivers with a 95% confidence interval of ± 1.2%. The clustering of sites
within communities introduces a complexity in the design that serves to inflate the estimates of
sampling error. Tests of significance should be viewed with caution.
Site Selection
To the extent possible, the survey site locations used in the 2012 survey were used again in
2018. In cases where the initial site was unavailable, every effort was made to find a
replacement site in the same area of the community. Initial site selection in each community
involved creating a grid on a map and numbering each section. Major roadway segments within
each section were identified and numbered. Sections and roadway segments within those
sections were then selected randomly. The designated roadways in selected sections were
searched for suitable locations to serve as survey sites. A suitable site was a parking lot or open
area off the travelled portion of the roadway with a separate entrance and exit. There had to be
sufficient space for at least four survey “lanes” or “bays” to accommodate up to four vehicles at
a time. Ideally, the approach to the survey site was free of curves in the roadway, major
intersections, obstructions to visibility, other potential safety hazards, and was free of other
traffic or parked vehicles during survey hours.
Permission to use each site was obtained from property owners and/or managers. In most
cases, this required a phone call to explain the nature of our request. In some cases, a letter
and/or personal visit from the project staff was required.
A total of 80 sites were confirmed for use by the survey crews – 16 in each community.
Survey Procedures
Drivers were randomly selected from the traffic flow at pre-selected locations in four time
periods (21:00-22:30; 22:30-00:00; 00:00-01:30; and 01:30-03:00) on Wednesday, Thursday,
Friday, and Saturday nights. Two crews were used to conduct the survey in each community. A
survey crew consisted of a crew chief, four interviewers, and one traffic controller. A police
officer was assigned to each crew to direct traffic safely off the roadway into the survey site. An

2018 British Columbia Drug and Alcohol Survey Page 3
experienced supervisor was also on site to oversee field operations and assist the crew chief
when required.
Each crew conducted interviews at two sites each night. One crew conducted interviews for 90
minutes at one site beginning at 21:00. At 22:30, this crew moved to another site and conducted
interviews from midnight to 01:30. The second crew followed a similar schedule at different sites
from 22:30 to midnight, and again from 01:30 to 03:00. This allowed for six hours of continuous
data collection each night.
The primary role of the police officer was to direct vehicles into the survey site as requested by
the survey crew. The officer did not speak with drivers unless requested by a driver or a
member of the survey crew. When signalled by a member of the crew, the officer selected the
next available vehicle approaching the survey site and directed it into the survey site.
Commercial vehicles were not included in the survey. The officer was also provided with a
counter and asked to record the number of eligible vehicles passing the survey site in the
direction from which vehicles were selected during the survey period. These traffic counts were
used in data weighting.
The interview process consisted of four parts: introduction and consent, an interview with the
driver, a breath test, and the collection of an oral fluid sample. Once a vehicle was safety
stopped in the survey site, interviewers introduced themselves to the driver, briefly described
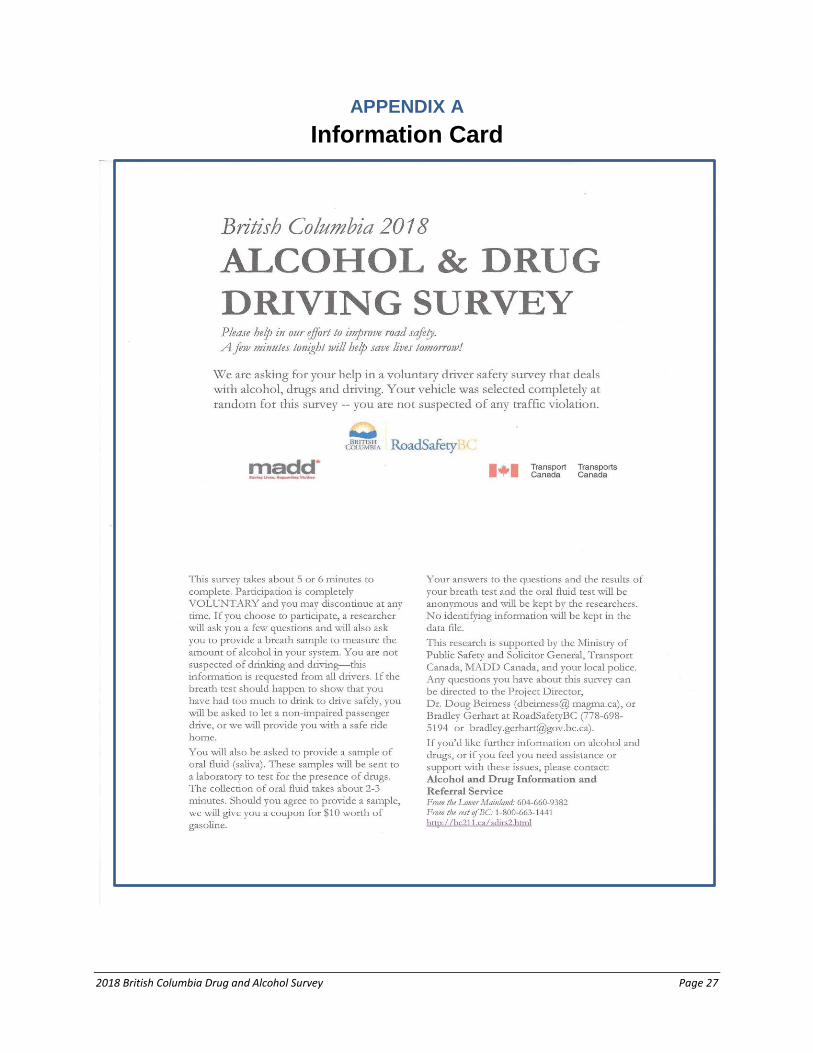
the survey, and handed the driver a card explaining the survey and requesting their cooperation.
(A copy of the information card is included in Appendix A). While drivers were reading the card,
interviewers recorded observable information about the driver (e.g., sex), the vehicle (e.g.,
type), seat belt use, and the mix of occupants in the vehicle. No personal identifiers were
recorded at any point during the survey.
Interviewer ensured that drivers understood that the survey was voluntary and confidential. If
the driver agreed to participate, the interview with the driver began. A copy of the questions that
comprised the roadside interview is included in Appendix B.
Breath samples
The third part of the survey involved asking the driver to provide a breath sample to measure
alcohol content. Breath samples were analyzed for blood alcohol concentration (BAC) using the
ALERT J5. This breath alcohol screening device is accurate to within ±5 mg/dL. Readings below
5 mg/dL were considered to be zero. The instruments were calibrated at
the factory prior to use in the field.
To collect a breath sample, the interviewer first placed a new
mouthpiece on the instrument. The driver was then instructed to blow
firmly and steadily into the mouthpiece until told to stop. The device
provides an auditory signal to indicate whether or not an adequate
sample of breath has been collected. Within a few seconds, the device
provides a digital display of the driver’s BAC.
Oral fluid samples
The final step involved collecting a sample of oral fluid using the Quantisal® oral fluid oral
collection kit. The device consists of a cellulose pad on a plastic stick. It collects a 1 mL sample

2018 British Columbia Drug and Alcohol Survey Page 4
of oral fluid. When a sufficient volume of fluid has been collected, a blue indicator appears on
the plastic stick. Completed samples are sealed in separate vials containing a small amount of
buffer fluid.
Drivers were informed that this part of the survey required a few minutes and that if they agreed
to participate they would be given a gift card for $10 worth of gasoline. The interviewer
explained the procedure and opened a sealed package
containing the oral fluid collection device. Drivers were
instructed to place the cellulose pad under their tongue
for two to three minutes. During this time, drivers were
asked to complete a pencil-and-paper questionnaire
about alcohol and drug use (Appendix C).
The oral fluid samples were sent by courier to Immunalysis Corporation for analysis. Samples
were initially screened for cannabis, cocaine, opioids, amphetamines, methamphetamine and
benzodiazepines using enzyme immunoassay (ELISA) technology. Samples with a positive
screen were confirmed by liquid chromatography/tandem mass spectrometry (LC-MS/MS). The
list of drugs and detection thresholds for each substance are listed in Table 2.
Table 2: Included Drugs and Detection Thresholds1
Alternative Transportation
Drivers with a BAC of less than 50 mg/dL were thanked for their cooperation and reminded to
drive safely as they left the survey site. Drivers with BACs of 50 mg/dL or over, those who
appeared to be adversely affected by alcohol or drugs, drivers who indicated they had a class
“L” or “N” licence with any positive BAC were asked to speak with the crew chief. The crew chief
explained to the driver that they had either consumed too much alcohol or appeared to be
affected by a drug and that it was unsafe (and possibly illegal) for them to drive and that they
would be provided with safe transportation home at no cost to them. If alcohol was involved, a
second breath test was then administered to ensure the initial positive test was not the result of
1 The detection threshold is the concentration below which a substance cannot be detected reliably.
Drug
Elisa
(ng/mL)
LC-MS/MS
(ng/mL)THC 4 2
Cocaine: benzoylecgonine, cocaethylene 20 8
Amphetamine: MDA, MDEA, phentermine 20 10
Methamphetamine: MDMA (ecstasy) 20 10
Benzodiazepines: diazepam, nordiazepam,
oxazepam, temazepam, clonazepam, alprazolam,
lorazepam, tiazolam, chorldiazepoxide, nitrzepam,
estaxolam, fluazepam, midazolam, phenazepam,
bromazepam
5 1
Opioids: morphine, codeine, 6-AM, hydrocordone,
hydromorphone20 10
Oxycodone: oxymorphone, 20 10
Fentanyl: norfentanyl 1 0.5
Zolpidem 10 10

2018 British Columbia Drug and Alcohol Survey Page 5
mouth alcohol2 and to assure the driver that the initial reading was not in error. Whenever
possible, a passenger with a BAC under 50 mg/dL or not obviously affected by drugs was
recruited to drive their companion(s) home. When a passenger with a BAC below 50 mg/dL was
not available, a taxi or designated driver service3 was provided. If necessary, the driver’s car
was parked in an area adjacent to the survey site.
After each night of data collection, the questionnaire forms were reviewed and matched with the
corresponding oral fluid samples. The number of interviews, breath tests, oral fluid samples, and
drivers who required a safe ride home were counted for daily reports. The refusal rates for the
breath test and oral fluid samples were tracked closely as a means to identify issues that could
be addressed. Any issues or apparent errors in the data forms were noted and brought to the
attention of all interviewers the next night. Crew chiefs and supervisors met daily to discuss
operations and take issues and reminders back to their teams of interviewers.
RESULTS
Response Rates
A total of 2,510 vehicles were randomly sampled from the traffic flow for participation in the
survey. The number of vehicles that entered each of the survey sites ranged from 13 to 56 and
depended on the volume and pattern of traffic, the time of night, day of the week, the number of
refusals, the numbers of drivers who required transportation home, and the capacity of the
survey crew to process drivers.
Table 3 shows participation rates for each community. Among the 2,510 vehicles selected,
1,878 drivers (74.8%) agreed to participate; 25.2% refused to provide any information. Of the
drivers who agreed to participate, 1,767 (94.1%) provided a breath sample and 1,672 (89.0%)
provided an oral fluid sample. Participation rates varied by community. The highest rate of
participation was in Prince George (88.1%); the lowest was in Kelowna (61.2%) (χ2(4,
N=2510)=113.1, p<.001). Overall, 94.1% of all drivers who agreed to participate provided a
breath test and 89.0% provided an oral fluid sample. The rate of compliance with the breath test
and oral fluid sample varied by community (χ2(4, N=1878)=30.0, p<.001; χ2(4, N=1878)=31.3,
p<.001, respectively).
2 Alcohol in the mouth can result from very recent drinking, regurgitation, the consumption of foods containing
alcohol, or the recent use of mouthwash. Mouth alcohol inflates breath alcohol readings and is not a true indicator of BAC. 3 Designated driver services provide a vehicle and a second driver to transport the impaired person and his or her
vehicle home.

2018 British Columbia Drug and Alcohol Survey Page 6
Despite the relatively high participation rates, concern remains that drinking drivers and those
using drugs might be more likely to refuse to participate, thereby introducing a conservative bias
into the estimates of alcohol and drug use. To assess the impact of refusal bias, the 2007 U.S.
National Roadside survey used two techniques. One involved the use of passive alcohol
sensors4 to provide an initial estimate of driver BAC (Lacey et al., 2009b). The passive sensor
reading was combined with other variables (e.g., driver sex, time of night) to impute BACs for
those who refused. The distribution of imputed BACs was virtually identical to that of drivers
who provided a breath test. Second, drivers who refused were offered an incentive of up to
$100 to participate. Of those who accepted the incentive, the percentage of alcohol positive
cases (13%) was just marginally higher than among those who initially agreed (12.4%). There
was a slightly higher percentage of drug positive cases among those who supplied an oral fluid
sample in response to the additional incentive (17% vs 14.4%) but the difference was not
statistically significant. These findings provide confidence that drivers who refuse are not
necessarily doing so because they had been drinking or using drugs.
Drivers who refused to participate in the survey were asked to indicate a reason for not
participating. The most common reasons cited were “in a hurry” and “not interested”. “Civil
rights” was mentioned by a small number of drivers as a reason not to participate. Some did not
want to “provide their DNA”5 while others simply felt the collection of oral fluid was too invasive
and made them uncomfortable.
4 A passive alcohol sensor measures the alcohol in the ambient air in the vicinity of the driver’s face and
does not require the driver to provide a breath sample. 5 Oral fluid samples were not used for DNA analysis.
Table 3: Sample Size and Participation Rates by Community
Community Vehicles Selected
N (% of total)
Agreed to Participate
N (% of selected)
Provided Breath Sample
N (% of agreed)
Provided Oral Fluid
N (% of agreed)
Vancouver 502 (20.0)
421 (83.9)
394 (93.6)
347 (82.4)
Saanich 681 (27.1)
473 (69.5)
457 (96.6)
441 (93.2)
Abbotsford 491 (19.6)
368 (74.9)
327 (88.9)
328 (89.1)
Prince George 388 (15.5)
342 (88.1)
335 (97.9)
301 (88.0)
Kelowna 448 (17.8)
274 (61.2)
254 (92.7)
255 (93.1)
Total 2510 (100)
1878 (74.8)
1767 (94.1)
1672 (89.0)

2018 British Columbia Drug and Alcohol Survey Page 7
Male and female drivers were equally likely to provide a breath sample
(χ2(1, N=1854)=0.30, p>.2) but female drivers were more likely than males (92.4%; 87.2%,
respectively) to provide an oral fluid sample (χ2(1, N=1854)=11.6, p<.001).
The rate of compliance with the request for a breath sample did not differ among age groups
(χ2(6, N=1804)=8.39, p>.2). Over 90% of all age groups agreed to provide a breath sample.
There was also no difference in the rate of compliance with the request for an oral fluid sample
according to driver age (χ2(6, N=1804)=9.68, p>.13).
Compliance with the request for a breath test did not differ according to the night on which the
survey was conducted (χ2(3, N=1878)=5.44, p>.1) or the time of night6;
χ 2(3,N=1878)= 1.56, p>.6).
Rates of compliance with the request for a an oral fluid sample differed by survey night (χ2(3,
N=1878)=10.1, p<.02) but did not vary according to the time of night (χ2(3,N=2022)=1.9, p>.5).
Participation was highest on Thursday night (93.0%) and lowest on Wednesday night (86.9%).
Characteristics of the Sample
This section describes the characteristics of the sample. Unweighted data were used for these
analyses so as to provide a picture of the sample of drivers who were randomly selected from
the traffic stream to participate in the survey.
Driver sex
Males comprised 65.5% of drivers who completed the interview, outnumbering women by
almost 2 to 1. The distribution of driver sex did not differ by region (χ2(4, N=2006)=5.22, p>
0.25).
The distribution of male and female drivers did not vary according to night of the week (χ2(3,
N=2231)=0.5.15, p>.15). There was, however, a significant difference in the proportion of male
and female drivers according to the time of night (χ2(3, N=2231)=34.8, p<.001). Females were
less likely to be behind the wheel at the late night site (01:30 to 03:00) (23.3%) compared to the
earliest site (21:00 to 22:30) (39.4%).
Driver age
Driver age was determined from reported year of birth7. Participants ranged from 17 to 94 years
of age with a mean of 37.8 years (SD =16.1). Figure 1 displays the distribution of driver age in
the roadside sample compared to the age distribution of the general population of drivers in
British Columbia (ICBC Quick Statistics, 2017). The roadside sample was comprised of a
greater proportion of drivers under 35 years of age than in the general driver population,
indicating that younger drivers are more likely than older drivers to be out driving at night.
6 Time of night was divided into four time periods corresponding to the four 90-minute periods during with the survey was conducted – i.e., 21:00-22:30, 22:30-00:00, 00:00-01:30, and 01:30-03:00. 7 Age was calculated as of the end of 2018. Although this does not necessarily provide an exact age, it was deemed adequate for purposes of the survey.

2018 British Columbia Drug and Alcohol Survey Page 8
The mean age of drivers was similar among men (37.9) and women (37.4) (t(1793)=0.63, p>.8).
The distribution of driver age did not differ according to day of the week (χ2(18, N=1815)=23.27,
p>.1). Driver age did, however, differ according to time of night (χ2(18, N=1815)=90.8, p<.001).
The percentage of younger (age 16-18) and older (age 46+) drivers decreased during late night
hours whereas the percentage of those aged 19-25 and 26-35 increased throughout the night.
Vehicle types
The majority of vehicles selected for the survey were passenger cars (53.2%). Sport utility
vehicles (SUVs) accounted for 22.6% of vehicles selected followed by pickup trucks (12.9%),
vans (3.8%) and minivans (2.3%).
The distribution of vehicle types differed according to community (χ2(24,N=2491)=158.0,
p<.001). Pickup trucks were most common in Prince George (24.5%) and Kelowna (18.8%).
Sport utility vehicles (SUVs) were most prevalent in Vancouver (27.9%) and Prince George
(25.3%).
Occupant configuration
Over half of all drivers interviewed (57.1%) were the sole occupant of the vehicle. Drivers with
one passenger of either the opposite sex (19.2%) or same sex (10.8%) were the next most
common occupant configurations. Vehicles containing a family, same-sex group or mixed-sex
group represented 3.1%, 2.0%, and 5.7%, respectively.
The distribution of occupant configurations varied by day of the week (χ2(15, N=2422)=65.3,
p<.001). The percentage of vehicles with only the driver accounted for two-thirds of vehicles on
Wednesday and Thursday nights but decreased to 55.1% on Fridays and 51% on Saturdays.
Vehicles with a driver and an opposite sex passenger increased from 13.8% on Wednesday
night to 23.1% on Saturday night. Vehicles with either same sex or opposite sex groups also
increased on weekend nights.
Figure 1: Age Distribution of Drivers in the Roadside Survey and the Population of Licenced Drivers in BC*
4.7
26.1
21.5
14.915.7
11.0
6.26.75.8
16.9 16.4
18.417.8 17.6
0
5
10
15
20
25
30
16-21 22-25 26-35 36-45 46-55 56-65 66+
Pe
rce
nt
Age Group
Survey Population
*ICBC (2017) Quick Statistics. Retrieved from: www.icbc.com/about-icbc/newroom/documents/quick-statistics.pdf.

2018 British Columbia Drug and Alcohol Survey Page 9
Graduated Licensing
Graduated Licensing was introduced to help reduce the risk of collisions for new (i.e. “novice”)
drivers regardless of age, by requiring them to progress through a two-step (“L” and “N”)
licensing system before obtaining a full driver’s licence. The system requires novice drivers to
adhere to a comprehensive set of driving restrictions designed to reduce their exposure to high-
risk driving situations. One notable restriction is that all novice drivers must be free of alcohol
and drugs when operating a vehicle.
A total of 409 (22.1%) of the drivers interviewed indicated that they had an “L” or “N” license.
Although there is a tendency to consider all new drivers as young, in fact, 31.2% of drivers who
indicated they had an “L” or “N” license were over 25 years of age.
Licence Class
Drivers were asked to indicate their class of licence as part of the self-report questionnaire that
was completed while the oral fluid sample was being collected. Hence, these data are only
available for participants who consented to provide an oral fluid sample. The majority of drivers
(66.1%) indicated they had a class 5 licence. Most other licence classes were reported as well
as a small number from another province or state.
Seat Belt Use
Rates of seat belt use were high among both drivers and front seat passengers. Among drivers,
99.0% were wearing their seat belt; among front seat passengers, 98.6% were belted.
Origin and Destination
Drivers were asked during the interview where they were coming from, how long ago they left
that location, and the nature of their destination. The mean travel time from the point of origin
was 19.7 minutes (SD =40.1; Mdn=10) and ranged from 1 to 300 minutes. The majority of
participants (74%) had been driving for 15 minutes or less.
Table 4 displays the distribution of reported trip origin and destination. The “services/errands”
category refers to locations such as a gas station, grocery store, convenience store.
“Sports/recreation” encompasses a wide range of leisure activities including the movies,
concerts and sporting events – either watching or participating. The most common point of
origin reported by participants was work (24.2%), followed by the home of a friend or relative
(22.2%). The majority of participants (67.5%) were on their way home.
Table 5 presents trip origin according to the day of the survey (χ2(21, N=1877)=55.3, p<.001).
The percentage of drivers on Friday and Saturday nights who reported coming from work was
lower than on Wednesdays and Thursdays. Coming from the house of a friend or relative and a
bar/pub/nightclub increased from Wednesday to Saturday.

2018 British Columbia Drug and Alcohol Survey Page 10
Table 5: Percentage of Reported Trip Origin According to Survey Night
Origin Wed Thurs Fri Sat
Work 26.7 25.5 21.1 15.0
Home 15.8 21.2 16.8 19.1
Friend/Relative 19.4 21.0 22.4 26.5
Restaurant 7.0 5.9 8.8 10.1
Bar/Pub/Club 1.7 2.3 2.7 4.3
Sport/Recreation 8.3 6.8 9.7 6.7
Services/errands 4.9 3.2 6.8 5.0
Other 16.3 14.2 11.7 13.3
Trip origin varied by survey time (χ2(21, N=1877)=125.0 p<.001). The percentage of driver
coming from work increased from 13.8% at the early site (21:00 – 22:30) to 29.0% at the late site (01:30 – 03:00). There was also an increase in the percentage of drivers who reported coming from a bar, pub or tavern at later sites (1.0% to 6.7%).
The reported destination of drivers also differed according to survey time (χ2(21, N=1874)=44.2
p<.002). Over two-thirds of all drivers were on their way home regardless of survey time but the
percentage of drivers going to work increased from 2.4% to 9.2% from the early to the late site.
Driving after Drinking
The unweighted data show that 4.0% of drivers (71/1,767) who provided a breath sample had a
positive BAC (i.e., ≥ 5 mg/dL). Of these 71 drivers with a positive BAC, 56 (3.2% of 1,767) had a
BAC below 50 mg/dL; 6 (0.3%) had BACs between 50 and 80 mg/dL; and 9 (0.5%) had a BAC
over 80 mg/dL. Among this latter group, 2 drivers had a BAC of 150 mg/dL or greater.
The raw data were weighted to adjust for differences in the traffic volume at the various sites.
This weighting procedure places greater emphasis on interviews from sites with higher traffic
volumes. The data were also adjusted for population in each community and combined into a
weighted total. This weighting procedure provides an estimate of the results of the survey
across all five regions.
Table 4: Participants’ Trip Origin and Destination
Location Trip Origin (%)
Trip Destination (%)
Work/School 21.5 5.0
Home 18.2 68.9
Home of friend/relative 22.5 11.6
Restaurant 8.1 3.1
Bar/Pub/Nightclub 2.8 0.6
Sports/Recreation 7.8 1.6
Services/errands 5.0 0.4
Other 13.7 8.4

2018 British Columbia Drug and Alcohol Survey Page 11
Figure 2 presents the weighted percentage of drivers who tested positive for alcohol and the
distribution of positive BACs. For comparison, the distribution of BAC is also presented for the
2012 survey. Overall, 4.9% of drivers tested in 2018 were positive for alcohol, a decrease of
24.6% from the 6.5% who had been drinking in the 2012 survey. Most drivers who had been
drinking had a BAC below 50 mg/dL (i.e., 4.1%), 0.3% had a BAC between 50 and 80 mg/dL
and 0.5% had a BAC over 80 mg/dL. The BAC distribution of drivers in 2018 differed
significantly from that in 2012 (χ2(3, N=4220)=9.05,p<.05).
Cities
Figure 3 presents the percentage of drivers with positive BACs in each of the five cities in 2018
and 2012. The percentage of drinking drivers was smaller in 2018 relative to that in 2012 in
every city except Vancouver. The actual numbers, however, are small and changes from 2012
to 2018 should be viewed with caution. It is of interest that in both Saanich and Prince George
no drivers were found with BACs greater than 50 mg/dL.
Figure 2: BAC Distribution of Drivers in 2012 and 2018
6.5
4.5
1.1 0.9
4.9
4.1
0.3 0.5
0
1
2
3
4
5
6
7
Positive <50 50-80 >80
Pe
rce
nt
BAC mg/dL
2012
2018

2018 British Columbia Drug and Alcohol Survey Page 12
Characteristics of Drinking Drivers
Driver sex
Males were overrepresented among drinking drivers. They comprised two-thirds of all drivers
who provided a breath sample but 78% of drivers who had been drinking. The percentage of
male drivers who had been drinking (5.8%) was significantly higher than females (3.2%) (χ2(1,
N=1859)=6.21, p<.05). Men and women were equally likely to have a BAC of at least 50 mg/dL.
The numbers, however, are small and should be interpreted with caution.
Driver age
The percentage of drivers with positive BACs in 2018 varied according to age group (χ2(6,
N=1811)=13.4, p<.05). There was one driver in the 16 to 18 age group that had a positive BAC.
Drivers age 66 and over were most likely to have been drinking (7.8%). Among the small group
of drivers with BACs of at least 50 mg/dL, the largest number was found in the 56 to 65 year-old
age group.
Figure 4 displays the percentage of drivers with positive BACs according to age group in 2012
and 2018. There was a reduction in drinking and driving in every age group but these
differences were not statistically significant (χ2(4, N=232)=1.74, p>.05)
Graduated Licensing
As part of the Graduated Driver Licensing program, drivers who hold an “L” or “N” licence are
restricted to a zero BAC when driving. Among the group of 313 drivers who reported they had
an “L” or “N” licence, 2.2% had a positive BAC. All but one of these alcohol positive drivers was
at least 24 years of age. Of those with a positive BAC, half had a BAC over 50 mg/dL.
Figure 3: Percentage of Drivers with Positive BACsAccording to City (2012 and 2018)
5.6
7.7
5.4
9.6 9.6
5.9
2.3
3.5
2.2
3.6
0
1
2
3
4
5
6
7
8
9
10
Vancouver Saanich Abbotsford Prince George Kelowna
Pe
rce
nt
City
2012
2018

2018 British Columbia Drug and Alcohol Survey Page 13
Characteristics of Drinking and Driving
This section examines the temporal and environmental circumstances surrounding drinking and
driving behaviour -- e.g., day of the week, time of day, type of vehicle, and trip origin. These
characteristics can help identify situations under which drinking and driving is most likely to
occur and can assist in prevention and enforcement efforts.
Survey night
Figure 5 presents the distribution of drivers with a positive BAC according to survey night as
well as the comparable distribution from 2012. Although the highest proportion of drinking
drivers was found on Saturday night, the differences between nights were small and not
statistically significant (χ2(3, N=1876)=1.33, p>.7).
Figure 4: Percentage of Drivers with Positive BACsAccording to Age (2012 and 2018)
2.9
7.0
10.1
4.3
7.8
1.5
5.8 5.9
3.1
6.7
0
2
4
6
8
10
12
16-21 22-35 36-45 46-55 55+
Pe
rce
nt
Age Group
2012
2018

2018 British Columbia Drug and Alcohol Survey Page 14
Survey time
The percentage of alcohol-positive drivers in each of the four time periods of the survey is
presented in Figure 6. Comparable data from the 2012 survey are also presented. The
percentage of drinking drivers differed significantly across the time periods (χ2(3, N=1875)=12.1,
p<.01) with the highest proportion of drinking drivers being between 01:30 and 03:00.

2018 British Columbia Drug and Alcohol Survey Page 15
Vehicle type
The percentage of drivers who had been drinking did not differ according to the type of vehicle
driven (χ2(4, N=1790)=8.039, p>.05). No drivers of vans or minivans were found to have been
drinking.
Occupant configuration
The configuration of vehicle occupants was related to driver alcohol use (χ2(5, N=1825)=14.8,
p<.02). Drivers with one different-sex passenger were most likely to have been drinking (7.9%)
whereas no drivers with a same-sex group of passengers were found to have been drinking.
Trip Origin
Figure 7 displays the percentage of drivers with positive BACs according to the reported origin
of the trip with positive BACs.8 Although the actual number was small, drivers who reported
coming from a bar, pub, club, or tavern were most likely to have been drinking (9.8%).
Among all drinking drivers, the largest number reported coming from the home of a friend or
relative; work was the second most common point of origin of drinking drivers.
Drugs and Driving
An examination of the raw (unweighted) data reveals that 166 (9.9%) of drivers who provided an
oral fluid sample tested positive for drugs. Of the drug-positive cases, 86.1% involved a single
drug and 13.9% tested positive for more than one drug. Of those who tested positive for drugs,
12 drivers (7.4%) also tested positive for alcohol.
8 Small numbers in some categories precluded an analysis of these data.

2018 British Columbia Drug and Alcohol Survey Page 16
Cannabis was the most frequently found substance – 70.5% of drug-positive drivers tested
positive for tetrahydrocannabinol (THC), the substance primarily responsible for the
psychoactive effects of cannabis. Stimulants (e.g., cocaine, amphetamine) were detected in
36.1% drug-positive drivers and opioids (e.g., fentanyl, oxycodone) were detected in 6.0%.
Benzodiazepines were detected in only two drivers.9
As was done with the alcohol data, the raw data were weighted to adjust for differences in the
traffic volume at the various sites and the population of the community. The weighted data show
that 8.5% of drivers who provided an oral fluid sample tested positive for at least one potentially
impairing substance other than alcohol.
Figure 8 shows the weighted drug test results in each community. The results from the 2012
survey are also presented for comparison. The percentage of drug-positive cases did not differ
significantly among the communities (χ2(4, N=1739)=4.21, p>.3).
Characteristics of Drug-drivers
Driver sex
Male drivers were more than twice as likely as females drivers (10.7% and 4.5%, respectively)
to test positive for drugs (χ2(1, N=1727)=19.2, p<.001). Males represented 65.4% of all drivers
but accounted for 81.8% of drivers who tested positive for drugs.
Male drivers were also significantly more likely than female drivers to test positive for cannabis
(7.0% and 2.0%, respectively) (χ2(1, N=1726)=19.5, p<.001).
9 Percentages add to more than 100% due to more than one drug being detected in some drivers.
Figure 8: Drivers Positive for Drugs According to City (2012 & 2018)
5.3
7.9
10.6 10.7
12.3
8.7
7.2
6.1
12.2
8.4
0.0
2.0
4.0
6.0
8.0
10.0
12.0
14.0
Vancouver Saanich Abbotsford Prince George Kelowna
Pe
rce
nt
2012
2018

2018 British Columbia Drug and Alcohol Survey Page 17
Driver Age
Figure 9 presents the percentage of each age group of drivers that tested positive for drugs.
Data from the 2012 survey are presented for comparison. Drug use varied significantly
according to driver age (χ2(6, N=1690)=22.3, p<.001). Drivers 16 to 18 years of age were least
likely to test positive for drugs (4.1%) and drivers between 56 and 65 years of age were most
likely to test positive for drugs (13.3%).
The distribution of drug use among age groups of drivers varied significantly between 2012 and
2018 (χ2(6, N=254)=23.0, p<.01). Most notable is the increase in drug use among those over 55
years of age, especially those over 65 years of age. Among this oldest age group of drivers,
12.1% were drug positive. Although people in this age group might be expected to be more
likely to test positive for prescription pharmaceuticals (e.g., opioids, benzodiazepines), all cases
were positive for cannabis alone.
It was previously noted that 2.2% of drivers with an ”L” or “N” licence had been drinking.
However, among drivers with an ”L” or “N” licence who provided an oral fluid sample, 12.2%
tested positive for drugs. Among this latter group of drivers, 93.6% were over 18 years of age.
Characteristics of Drug-driving
This section examines the temporal and environmental circumstances surrounding drug use
and driving behaviour—e.g., day of the week, time of day, type of vehicle and trip origin. These
characteristics can help identify situations under which drug use and driving is most likely to
occur and can assist in prevention and enforcement efforts.
Survey night
Figure 10 presents the percentage of drivers who tested positive for drugs according to survey
night. The data from the 2012 survey are presented for comparison. Drug use by drivers differed
significantly according to day of the week (χ2(3, N=1740)=18.7, p<.001). Drivers on Thursday
Figure 9: Drivers Positive for Drugs According to Age Group (2012 & 2018)
4.8
9.0
5.1
11.5
8.77.9
0.9
4.1
12.7
7.76.8
4.7
13.3
12.1
0
2
4
6
8
10
12
14
16-18 19-25 26-35 36-45 46-55 56-65 66+
Pe
rce
nt
Age Group
2012
2018

2018 British Columbia Drug and Alcohol Survey Page 18
night were the most likely to test positive for drugs in 2012 (12.9%) and 2018 (13.9%). In both
years, drug use by drivers was lower on weekend nights than weekday nights.
Survey time
Figure 11 displays the percentage of drivers who tested positive for drugs according to the time
of the survey. The percentage of drug-positive drivers varied according to site time, reaching the
highest level between 01:30 and 03:00 (19.7%) (χ2(3,N=1740)=35.8, p<.001).
Figure 10: Drivers Positive for DrugsAccording to Survey Night (2012 & 2018)
5.8
12.1
4.6
6.6
8.3
13.9
7.5
6.1
-1.0
1.0
3.0
5.0
7.0
9.0
11.0
13.0
15.0
Wednesday Thursday Friday Saturday
Pe
rce
nt
Survey Night
2012
2018

2018 British Columbia Drug and Alcohol Survey Page 19
Vehicle Type
The percentage of drivers testing positive for drugs varied according to vehicle type (χ2(5,
N=1667)=35.8, p<.001). Drivers of pickup trucks were most likely to test positive for drugs
(11.7%) followed by drivers of cars (10.6%). No drivers of minivans tested positive for drugs.
Occupant Configuration
The percentage of drug positive drivers did not vary significantly according to occupant
configuration (χ2(5, N=1698)=8.2, p>.1). Drivers who had one same-sex passenger were most
likely to test positive for drugs (13.8%). Among drivers with a family in the vehicle, 9.2% tested
positive for drug use. Drivers who were the only vehicle occupant comprised 54.7% of all drivers
who were positive for drugs,
Trip Origin and Destination
The most common places of origin of drivers who tested positive for drugs was home (24.5%) or
the home of a friend or relative (24.5%). A sport or recreation event was the origin of 10.2% of
all drug-positive drivers.
Home was the reported destination of 60.1% of all drivers who tested positive for drugs followed
by the home of a friend or relative (17.6%). Among drivers who indicated they were on their way
to work, 9.6% were positive for drugs.
Experiences and Awareness
As part of the interview, drivers were asked about the likelihood of a person being stopped by
the police if the person drove after drinking too much or after using drugs. Drivers were asked to
respond using a scale from 1 to 7, where 1 represented ‘not at all likely’ and 7 represented
‘extremely likely’. Drivers thought it somewhat more likely that a driver would be stopped by the
police after drinking too much (M=4.28, SD=1.91) than driving after using drugs (M=3.86,
SD=2.06). Drivers who had been drinking thought a person was more likely to be stopped after
drinking too much than drivers who had not been drinking (t(1869)=3.34, p<.01). The perceived
likelihood of being stopped after using drugs did not differ according to whether or not the driver
was positive for drugs (t(1732)=1.59, p>.11).
Drivers who agreed to provide an oral fluid sample were asked to complete a self-report
questionnaire (Appendix C) during the 2-3 minutes while the sample was being collected. The
questions asked about awareness of impaired driving laws and alcohol and drug use.
Overall, 88.5% of respondents indicated that they knew of the immediate suspension for driving
with a BAC of 50 mg/dL or greater and 82.5% were aware of the suspension for poor sobriety
test performance. There were no differences in responses between those who had been
drinking or tested positive for drugs.
The majority of participants were aware that drivers face an immediate short-term licence
suspension for driving with a BAC over 50 mg/dL (80.8%). Most drivers (73.8%) were aware of
similar suspensions for poor performance on a Standardized Field Sobriety Test (SFST).
As part of this questionnaire, drivers were asked about the maximum allowable level of alcohol
for drivers who had an “L” or “N” licence. Overall, 72.0% of drivers were aware that novice
drivers were restricted to a zero BAC. However, 13.7% of participants who indicated they had

2018 British Columbia Drug and Alcohol Survey Page 20
an “L” or “N” licence novice drivers were unaware of the zero alcohol policy; 28.4% of novice
drivers who were 19 years of age or older did not know that they were not allowed to drive with
any alcohol in their system.
When asked how many drinks it takes them to reach an alcohol level of 50 mg/dL, 32.9% of
respondents selected the answer “I’m not sure”. Just over half of all respondents (57.0%)
indicated one or two drinks; 7.6% indicated 3 drinks; and 1.9% indicated 4 or more drinks.
Drivers were asked what being a Designated Driver meant to them, with three options from
which they were to select one. Overall, most respondents (94.8%) indicated that it meant
“drinking no alcohol or using not drugs at all”, while 4.5% selected “drinking some alcohol or
a few hits on a joint but not enough to be impaired”, and less than 1% indicated that it meant
“drinking less alcohol or drugs than my passengers”.
Drivers were asked to indicate the reasons why it was hard for people to avoid drinking and
driving and driving after using cannabis. Respondents were provided with nine possible
answers and were allowed to check as many as they thought were applicable. Table 6
represents the number and percentage of participants who checked each item. The three
most common reasons selected for it being hard to avoid driving after drinking and driving
after using cannabis were: “people don’t think they are impaired”, “people don’t think they
will get caught by the police”, and “people don’t want to leave their car somewhere”.
Table 6: Reasons it is hard for people to avoid drinking and driving and driving after using cannabis
Reason Driving after
drinking n (%)
Driving after using cannabis
n (%)
People don’t think they are impaired
961
(61.1)
893
(56.9)
People don’t think they will get caught by the police
759
(48.3)
790
(50.3)
People don't want to leave their car somewhere
750
(47.7)
515
(32.8)
Taxis/ride share services cost too much
571
(36.3)
374
(23.8)
Staying overnight is inconvenient
559
(35.6)
363
(23.1)
Public transit service is poor or inconvenient
559
(35.6)
364
(23.2)
Taxis/ride share services are not available
548
(34.8)
347
(22.1)
There is no public transit 519
(33.0)
339
(21.6)
The wait for a taxi/ride share service is too long
516
(32.8)
341
(21.7)

2018 British Columbia Drug and Alcohol Survey Page 21
Alcohol and Cannabis Use
By far the majority of drivers indicated that they had not used cannabis in the past twelve
months (78.0%). Of those who had used cannabis, 1.7% reported daily use and a further
4.1% used at least weekly. Smoked cannabis was the most common form of cannabis used
on the last occasion of use (71.5%) followed by concentrates (13.3%).
Among drivers who tested positive for cannabis, 21.4% reported daily use of cannabis; an
additional 21.5% reported using cannabis at least weekly. Interestingly, 7.1% of drivers who
tested positive for cannabis indicated that they had never used cannabis.
The reported use of alcohol was common; 73.0% of drivers who completed the
questionnaire reported consuming alcohol in past 12 months. Among drinkers, 27.2%
reported consuming five or more drinks on an occasion at least monthly.
The use of both alcohol and cannabis on the same occasion was reported by 17.4% of
drivers. Among this group, 7.7% indicated that they combined alcohol and cannabis use on
the same occasion every day; a further 14.8% did so at least once per week.
DISCUSSION Roadside surveys provide a means to obtain an objective, scientifically valid estimate of the
prevalence of alcohol and drug use by drivers within specified geographic and temporal
parameters. Using a well-developed, standard technique, the roadside survey is a valuable tool
for determining the magnitude and characteristics of the prevalence of drinking and driving as
well as driving after drug use. In addition, roadside surveys provide a means to monitor changes
in these behaviours and can be a powerful tool to help evaluate the impact of countermeasure
programs and policies.
The roadside survey described in this report was undertaken as a means to gather objective
information about the extent and circumstances of the use of alcohol and drugs by drivers as
well as to describe the characteristics of British Columbia drivers who drive after using drugs
and/or alcohol. The present survey also provides the opportunity for comparison with the
previous survey conducted in 2012 and contribute to the establishment of a baseline of
cannabis use by drivers prior to the legalization of cannabis in Canada in October 2018.
The proportion of drivers in the present survey who tested positive for alcohol (4.9%) was 50.5%
lower than that in the 2010 roadside survey conducted in the same communities (9.9%).
Compared to older surveys dating back to 1995, in which only Vancouver and Saanich were
included, the present results in these two communities show a 78% reduction in the proportion
of drivers who had been drinking (Figure 13). Among other factors, this result speaks to the
success of the comprehensive range of programs, policies, legislation, and public education
campaigns directed at drinking and driving behaviour in British Columbia. Drivers appear to
have adopted a general intolerance of drinking and driving and have, to a large extent, changed
their behaviour.

2018 British Columbia Drug and Alcohol Survey Page 22
In addition to the overall reduction in the percentage of drivers who had been drinking, the
alcohol concentrations of drivers who had consumed alcohol were relatively low, most being
below the level at which administrative suspensions could be imposed (i.e., 50 mg/dL).
Nevertheless, there remains a small minority of drivers who consume sufficient quantities of
alcohol to place themselves and other road users at risk. The search for innovative strategies
and messages that impact this select group of drivers needs to continue.
It is noteworthy that in both the 2012 and 2018 surveys, there were very few drivers between 16
and 21 years of age who were found to have a positive BAC. This finding may well be a
reflection of the success of the “zero alcohol” restriction for drivers with an “L” or “N” licence.
This finding also supports anecdotal reports that young people have embraced the anti-drinking-
driving message and are taking positive steps to avoid this risky behaviour. However, the fact
that 14% of novice drivers were unaware of the zero alcohol restriction indicates the need to
repeatedly reinforce the message, particularly among the 28% of novice drivers who are of legal
age to drink.
Overall, 8.5% of drivers were found to have recently ingested one or more impairing substances
other than alcohol, 15% more than in the 2012 survey (7.4%). As was the case in 2012,
cannabis was the most frequently found substance in drivers, with 70.5% of drug-positive
drivers testing positive for cannabis. Stimulants were detected in 36% of all drug-positive
drivers; opioids were found in 6%. The use of more than one drug was detected in 13.9% of all
drug positive cases; 7.4% of all drug-positive cases had also been drinking.
Drinking and driving continues to be most prevalent between 01:30 and 03:00, a period that
coincides with the cessation of service at licensed drinking establishments. Bars, taverns, clubs,
and restaurants are the source of a large number of drinking drivers. The home of a friend or
relative was also a common point of origin for drinking drivers, which suggests an ongoing need
for programs offering social hosts strategies and tactics for preventing their guests from driving.
Figure 13: Percentage of Drivers with Positive BACsin BC Roadside Surveys (1995 – 2018)*
18.7
13.812.3 11.7
7.8
10.7
5.8
4.0
0.0
2.0
4.0
6.0
8.0
10.0
12.0
14.0
16.0
18.0
20.0
1995 1998 2003 2006 2008 2010 2012 2018
Pe
rce
nt
* Vancouver and Saanich only

2018 British Columbia Drug and Alcohol Survey Page 23
Drug use among drivers was also most commonly found between 01:30 and 03:00. However,
licensed drinking premises were not the most common point of origin for drivers who tested
positive for drug use. Drug-drivers were most prevalent among those coming from home or the
home of a friend or relative, or a sport or recreation event. This would suggest that prevention
and enforcement efforts directed towards drug-drivers should target locations than those
directed at drinking drivers.
Drivers aged 16-21 were considerably more likely to drive after drug use (4.1%) than after
alcohol use (1.5%). There would appear to be a discrepancy between young drivers’ thoughts
and perceptions about the safety of operating a vehicle after alcohol versus after using
cannabis. In addition, other recent research has reported that there is a common notion among
youth that cannabis doesn’t impair driving and the police can’t do anything about it anyway
(Porath-Waller et al., 2013). The challenge for any future educational and awareness efforts will
be to overcome a growing normative environment that is tolerant of cannabis use that has been
created by the ongoing discussion, and pending legalization, of cannabis along with the
widespread perception of cannabis as a safe, natural, medicinal product.
Drug use was prevalent among drivers aged 19 to 24. Cannabis was the substance detected
most frequently. Once again, there would appear to be a discrepancy between drivers’ thoughts
and perceptions about operating a vehicle after drinking versus after using drugs. It is also
possible that drugs are being substituted for alcohol in some situations, possibly as a
(misguided) means to avoid impairment and detection by the police. Efforts to improve the level
of knowledge, awareness and perceptions about drugs and driving among young drivers would
be of value in efforts to change this behaviour.
The increase in drug use by drivers over 55 years of age is an observation worthy of further
investigation. Traditionally, this age group has been the highest users of prescription
medications and these drugs are occasionally detected among drivers. It is likely that many of
these drivers were using the drugs for legitimate medical reasons. The substantial increase in
the prevalence of cannabis among this age group might reflect a substitution for prescription
medications combined with a perception of cannabis as being less impairing. Further research
is necessary to better understand the use of cannabis by older drivers.
Limitations
As valuable as the data from the present study are, it is important to understand the limitations
of the study. First, it must be recognized that drug presence does not necessarily indicate
impairment. Whereas research has established the concentration of alcohol at which
performance is impaired in the majority of drivers, such levels have yet to be agreed upon for
the wide variety of drugs of interest.
Drivers were interviewed in five distinct regions selected to represent the vast geography of the
province. The specific communities were not selected randomly. Practical and logistical
considerations limited the ability to select communities at random and, hence, the estimates of
alcohol and drug use by drivers should not be interpreted as provincial estimates.
The survey included the same five regions of the province as were used in both the 2010 and
2012 surveys. Although a standard, documented procedure was used to identify potential sites,
practical considerations often restricted the ability to select sites completely at random. The

2018 British Columbia Drug and Alcohol Survey Page 24
criteria for a survey site were very strict so as to ensure the safety of the public, the police
officers and the survey crew. It was also necessary to obtain the permission of property owners
(or their designate) to use the property. In a few cases where permission was not granted, an
alternative site had to be selected.
Despite the high rate of participation in the survey, response rates were lower than in previous
surveys. Initially, it was thought that the high level of media attention afforded the issue of
driving under the influence of cannabis might facilitate participation rates. This was not the case.
Drivers were actually more likely to refuse all participation in the present survey. However, if
drivers agreed to the interview, there was a high degree of cooperation with the request for both
a breath and oral fluid sample.

2018 British Columbia Drug and Alcohol Survey Page 25
REFERENCES
Asbridge, M., Hayden, J.A. and Cartwright, J.L. (2012). Acute cannabis consumption and motor vehicle collision risk: Systematic review of observational studies and meta-analysis. British Medical Journal, 344, e536.
Beasley, E.E. & Beirness, D.J. (2012). Alcohol and Drug Use Among Drivers. British Columbia Roadside Survey 2012. Victoria BC: Office of the Superintendent of Motor Vehicles.
Bédard M, Dubois S, & Weaver B. (2007). The impact of cannabis on driving. Canadian Journal of Public Health, 98, 6-11.
Beirness, D.J., & Beasley, E.E. (2018). Alcohol and Drug Use Among Drivers in Ontario. Findings from the 2017 Roadside Survey. Toronto, ON: Ontario Ministry of Transportation, 2018.
Beirness, D.J. & Beasley, E.E. (2011). Alcohol and Drug Use Among Drivers. British Columbia Roadside Survey 2010. Ottawa ON: Canadian Centre on Substance Abuse.
Beirness, D.J. & Beasley, E.E. (2010). A roadside survey of alcohol and drug use among drivers in British Columbia. Traffic Injury Prevention, 11, 215-221.
Beirness, D.J. & Beasley, E.E. (2009). Alcohol and Drug Use Among Drivers. British Columbia Roadside survey 2008. Ottawa: Canadian Centre on Substance Abuse.
Blomberg, R.D., Peck, R.C., Moskowitz, H., Burns, M. & Fiorentino, D. (2009). The Long Beach/Fort Lauderdale relative risk study. Journal of Safety Research, 40, 285-292.
Beirness, D.J., Beasley, E.E. & McClafferty, K. (2015). Alcohol and Drug Use Among Drivers in Ontario. Findings from the 2014 Roadside Survey. Toronto, ON: Ontario Ministry of Transportation, 2015.
Beirness, D.J., Logan, B., & Swann, P. (2010). Drugs and driving: Detection and deterrence. Paris: Organisation for Economic Cooperation and Development.
Boase, P. (2012) A Roadside Survey Protocol for Determining the Prevalence of Alcohol and Drug Use by Drivers. Ottawa, ON: Canadian Council of Motor Transport Administrators.
Borkenstein, R. F., R. Crowther, R. Shumate, W. B. Ziel, and R. Zylman. (1974). The role of the drinking driver in traffic accidents (the Grand Rapids Study). Blutalkohol 11(Suppl):1–131.
Dubois S, Bédard M, & Weaver B. (2010). The association between opioid analgesics and unsafe driving actions preceding fatal crashes. Accident Analysis & Prevention, 42, 30-37.
Interministerial Committee on Drinking and Driving (1988). The 1986 Ontario Survey of Nighttime Drivers – Summary Report. Toronto: Ontario Ministry of Transportation.

2018 British Columbia Drug and Alcohol Survey Page 26
Lacey, J. H., Kelley-Baker, T., Berning, A., Romano, E., Ramirez, A., Yao, J., & Compton, R. (2016). Drug and alcohol crash risk: A case-control study (Report No. DOT HS 812 355). Washington, DC: National Highway Traffic Safety Administration.
Lacey, J.H., Kelly-Baker, T., Furr-Holden, D., Voas, R.B., Romano, E., Ramirez, A., Brainard, K., Moore, C., Torres, P. & Berning, A. (2009a). 2007 National Roadside Survey of Alcohol and Drug Use by Drivers. Drug Results. (Report No. DOT HS 811 249). Washington DC: National Highway Traffic Safety Administration.
Porath-Waller, A.J., Brown, J.E., Frigon, A.P. & Clark, H. (2013). What Canadian Youth Think About Cannabis. Technical Report. Ottawa, ON: Canadian Centre on Substance Abuse.
2018 British Columbia Drug and Alcohol Survey Page 27
APPENDIX A
Information Card

2018 British Columbia Drug and Alcohol Survey Page 28
APPENDIX B
Roadside Interview

2018 British Columbia Drug and Alcohol Survey Page 29
APPENDIX C
Alcohol and Drug Questionnaire

2018 British Columbia Drug and Alcohol Survey Page 30

2018 British Columbia Drug and Alcohol Survey Page 31
APPENDIX D
Frequency of Specific Drugs Detected
Drug Category Drug N
(unweighted)
Cannabis THC 117
Stimulants Cocaine 41
Benzoylecognine 39
Cocaethylene 5
AMP 18
METH 21
MDA 0
MDMA 1
MDEA 0
Phentermine 0
Benzodiazepines Diazepam 1
Nordiazepam 1
Oxazepam 1
Temazepam 0
Clonazepam 0
Alprazolam 1
Lorazepam 0
Triazolam 0
Chlordiazepoxide 0
Nitrazepam 0
Estazolam 0
Flurazepam 0
Midazolam 0
Phenazepam 0
Bromazepam 0
Opioids Morphine 1
Codeine 14
6-AM 1
Hydrocodone 0
Hydromorphone 0
Oxycodone 2
Oxymorphone 0
Fentanyl 8
Norfentanyl 1
Zolpidem Zolpidem 0