Embed Size (px)
Citation preview
Alemu Tizazu Bayileyegn
Spectrum Availability Assessment Toolfor TV White Space
School of Electrical Engineering
Thesis submitted for examination for the degree of Master ofScience in Technology
Espoo 21082012
Thesis supervisor
Prof Riku Jantti
Thesis instructors
MSc Jussi Kerttula
MSc Konstantinos Koufos
A Aalto UniversitySchool of ElectricalEngineering
aalto universityschool of electrical engineering
abstract of themasterrsquos thesis
Author Alemu Tizazu Bayileyegn
Title Spectrum Availability Assessment Tool for TV White Space
Date 21082012 Language English Number of pages8+62
School of Electrical EngineeringDepartment of Communications and Networking TechnologiesProfessorship Communication Engineering Code S-72
Supervisor Prof Riku Jantti
Instructors MSc Jussi Kerttula MSc Konstantinos Koufos
The growth of wireless communication relies on the availability of radio frequencyfor new services More efficient spectrum allocations are required to serve theincreasing data per user The major regulatory bodies are formulating new spec-trum management techniques to forge the growing spectrum scarcity Exclusiveuse of spectrum is proved to be inefficient in many spectrum occupancy mea-surement campaigns As a result spectrum sharing methods are being considered
TV broadcasting is not using the allocated frequency in some geographicareas creating coverage holes known as TV white spaces Both the industry andthe regulators are investigating the capability of TVWS as a potential sourceof spectrum for emerging wireless services The FCC in the US has alreadyreleased the requirements for opportunistic access to the TV whites paces In asimilar fashion ECC the pan-European regulator is finalizing the work on thetechnical and operational requirements for the possible use of cognitive radio inthis spectrum
In this thesis work an integrated web-based spectrum availability assess-ment tool is developed for Finland The tool is a front-end visualization of atime intensive computational process to answer key technical questions related toTVWS - what secondary data rate can be supported in the available white spacespectrum The assessment involves estimation of the available TVWS and itscapacity for cellular-type secondary systems The relative effects of the secondarysystem parameters on the TV system is compared using appropriate signal tonoise and interference ratio plots The tool uses dynamic web technologies for aseamless and user-friendly visualization of the assessment
Keywords spectrum regulation TV white space cognitive radio geolocationdatabase dynamic opportunistic access unlicensed white space de-vice
iii
Acknowledgment
This thesis work was done at the Department of Communications and NetworkingAalto University under the QUASAR - FP7 targeted research project(STREP)
I would like to express my sincerest thanks to my supervisor Professor Riku Janttifor his excellent guidance and valuable comments I also like to extend my deepestgratitude to my thesis instructors Jussi Kerttula (MSc) and Konstantinos Koufos(MSc) and my mentor Kalle Ruttik (DSc) - without their support this workwouldnrsquot have been materialized to the full It was a very uplifting experience andenjoyable time to work with them
It is my great pleasure to thank Viktor Nassi and other members of the supportteam for their timely and enthusiastic help who made my stay in Comnet veryenriching It was also a great fortune to have Jenni Tulensalo who eased my inte-gration into the vibrant Aalto community I also acknowledge the support and cheerfrom my friends Yihenew Tedy Ali and others in Comnet
I am very blessed to have my mother by my side and is always committed to help-ing me And finally I must give my profound respect to Kessu Siranesh and theirchildren for their unwavering encouragement
Finally it would make it incomplete not to mention God here All this is possi-ble due to the invisible grace of the Lord who blesses every steps of our journey
Otaniemi 21082012
AlemuTizazu Bayileyegn
iv
Contents
Abstract ii
Acknowledgment iii
Contents iv
List of Abbreviations vi
List of Symbols viii
1 Introduction 111 Overview 112 Thesis Structure 2
2 Spectrum Regulation and Television White Spaces 421 Background 422 Spectrum Regulation 6
221 Spectrum Regulatory Frameworks 7222 General Trends in Telecommunications Regulation 9223 Regulatory Measures for Opportunistic Spectrum Access 10
23 Television White Spaces 1124 Introduction to Cognitive Radios 1225 Cognitive Techniques to Access White Spaces 13
251 Geo-location Databases 13252 Spectrum Sensing 14253 Beacons 15
26 The Problem of Aggregate Interference 16
3 TV Whitespace Regulation 1731 FCC 1832 ECC 2033 Protection of other systems in the TV spectrum 22
4 Spectrum Availability Assessment in the TV White Space 2441 Introduction 2442 Radio Environment Channel Models 25
i Path Loss 25ii Shadow Fading 25iii Multipath Fading 26421 Statistical Models 26a Okumura Hata Model 27b Point to Area Propagation Models 27
43 DVB-T System Basics 2844 Assessment Methodology 3045 Implementation of Assessment Methodology 31
v
451 System modeling and coverage area computation 31452 Secondary power computation 32453 Secondary system scenarios 34454 Spectrum availability and secondary system scenario assess-
ments 35
5 Front-End Visualization 3951 Introduction 3952 Graphical User Interface Design Guidelines 4053 Requirements Analysis 42
531 Web-based Visualization Technologies 4354 Spectrum Availability Assessment Tool Architecture 4555 Implementation of Assessment Tool 45
6 Spectrum Availability Assessment Tool Finland Case Study 4761 Introduction 4762 GUI Controls 4863 Terminology and definitions 4964 Introducing the tool - brief demonstration 50
641 Visualization on the map 50642 SINR Comparison and Plotting Utilities 51
7 Conclusion 57
References 58
vi
List of Abbreviations
AM Amplitude ModulationAMPS Advanced Mobile Phone SystemADC Analog-to- Digital ConverterARNS Aeronautical Radio-NavigationASK Amplitude-Shift KeyingAPI Application Package InterfaceCDMA Code Division Multiple AccessCEPT European Conference of Postal and Telecommunications AdministrationCOFDM Coded Orthogonal Frequency Division MultiplexingCR Cognitive RadioCRS Cognitive Radio SystemCSS Cascading Style SheetsDAC Digital-to-Analog ConverterDDC Digital Down ConversionDHTL Dynamic Hypertext Markup LanguageDOM Document Object ModelDSP Digital Signal ProcessingDTT Digital Terrestrial TelevisionDSO Digital SwitchoverDUC Digital Up ConversionDVB-T Digital Video Broadcasting - TerrestrialECC Electronic Communications Committee(of Europe)EIRP Effective Isotropic Radiated PowerETSI European Telecommunication Standards InstituteFCC Federal Comminications Commission(of US)FM Frequency ModulationFICORA Finnish Communications Regulatory AuthorityGSM Global System for Mobile CommunicationsGUI Graphical User InterfacesHTML HyperText Markup LanguageHTTP Hypertext Transfer ProtocolIMT International Mobile TelecommunicationsISM Industrial Scientific and MedicalITU-R Radiocommunication Sector in International Telecommunications UnionJVM Java Virtual MachineLTE Long Term EvolutionMINTC Ministry of Transport and CommunicationsMPEG-TS Moving Picture Experts Group - Transport StreamNRA National Regulatory AuthorityNMT Nordic Mobile TelephonePMSE Program Making and Special EventPSK Phase-Shift Keying
vii
QAM Quadrature Amplitude ModulationQPSK Quadrature Phase Shift KeyingRAS Radio AstronomyRF Radio FrequencySDR software-defined radiosSINR Signal to Interference and Noise RatioSRTM The Shuttle Radar Topography MissionTACS Total Access Communication SystemsTDMA Time Division Multiple AccessTVBD TV band devicesTVWS Television White SpacesUHF Ultra High FrequencyURL Universal Resource LocatorVHF Very High FrequencyWLAN Wireless Local Area NetworkWSD White Space DevicesWRC World Radiocommunication ConferencesWWW World Wide WebW3C World Wide Web Consortium3GPP 3rd Generation Partnership Project
viii
List of Symbols
Prz Probability of event zγt Target SINR level for reception without errorsPtv TV signal power at the receiverPsu The allowed power emission level from secondary white space deviceshc Radio channel impulse responseL(r) The path loss experienced by a signal at a distance r from its sourceα Path loss exponentE The electric field strength in (microVm)TU The duration of the useful part of the OFDM symbols of a DVB-T signal4 The guard interval duration of the OFDM symbols for a DVB-T signalPWSDIB The in-band transmit power of the white space devices
1
1 Introduction
11 Overview
Following the roll out of commercial mobile communication networks in many partsof the world the radio frequency is becoming more valuable than ever Individualsbusinesses and governments rely on this natural resource for communication Thegrowth of Internet as a standard communication platform fueled the emergence ofnew services like wireless Internet access As more devices are competing for wirelessaccess the the available radio spectrum is becoming congested The reserve radioresource pool is also depleting Hence in the future new allocations will inevitablybecome impossible risking the growth of the whole wireless ecosystem come to ahalt On the contrary studies (from various measurement campaigns) have shownthat the current spectrum shortage is created by the tight regulatory schemes in-troduced long ago to protect exclusive spectrum users[1][2][3]
Recently regulators at various levels are starting to devise new spectrum man-agement methods to resolve the forthcoming spectrum crisis From sponsoringfree radio channels as spectrum commons to allowing opportunistic access for un-licensed devices the regulators are showing their willingness to change the sta-tus quo The Industrial Scientific and Medical (ISM) radio bands in the 24GHzfrequency are allocated freely for public use as spectrum commons These bandsshowed tremendous success for short-range low power communication in wirelesslocal area netowrks(WLANs) Another spectrum sharing technique named oppor-tunistic access enables the unlicensed use of the idle portions of a licensed radiospectrum without harming the primary licensee Regulators have been giving per-mission for wireless microphones to work in the occupied TV channels in interleavebasis After the digital switchover new spectrum allocations are expected to com-plete in the coming years Studies have revealed that the TV broadcasting is notusing the spectrum efficiently ie the TV channels are not being used in somegeographical locations[28][33] These TV coverage-free areas named as TV WhiteSpaces(TVWS) are considered to be the next potential immediate solutions forspectrum scarcity
Many countries are evaluating the technical alternatives to employ the underutilizedTV band spectrum Cognitive radios first introduced by Mitola [7] are proposedto be the possible enabler technologies Cognitive radios are radios aware of theirlocation and the radio environment to change their transmitter parameters accord-ingly Cognitive techniques like geo-location database andor sensing methods areidentified as optimal candidate technologies for dynamic opportunistic access to theTV band frequencies[12][26]
Commercializing spectrum in the TV bands for opportunistic secondary accessmust be preceded by refined quantitative availability assessment There was a pre-vailing lsquochicken and eggrsquo problem on the successful use of this valuable resource
2
regulators are not willing to draft new spectrum policies without working demon-strations from the industry The industry on the other hand is lacking confidenceto invest in new technology without regulatory insurance The QUASAR - FP7 tar-geted research project(STREP) under which this thesis is done tries to resolve thisdilemma from the technical end of the problem assessing the available secondaryspectrum that could be used for opportunistic secondary access
This quantitative assessment research work uses multiple parameters and models toestimate the amount and capacity of the available TVWS From a techno-economicsperspective however the basic key questions are
bull How much white space is available Where is it located
bull How much data rate can it support
bull What performance metrics are suitable to utilize the spectrum
To address these crucial technical questions the need for a visualization tool is indis-pensable A user-friendly visualization interface is required to eliminate the barriersfor seamless understanding of the outputs of the research
This thesis work develops an integrated web-based Spectrum Availability AssessmentTool for TV White Space The tool is front-end visualization for a time-intensivecomputational assessment - the white space spectrum availability and secondary ca-pacity estimation made for Finland on the digital TV(DTT) coverage The assess-ment methodology for the whole process involves considering the radio environmentmodels the DTT coverage and appropriate secondary system models The tool alsoincludes visualization for primary system performance that are subjected to sec-ondary system scenarios This helps to compare the impacts of different parameterson the existing primary system The graphical user interface of the tool is developedusing standard user-friendly and dynamic features to shorten the learning time fornew users
12 Thesis Structure
The remainder of this thesis is organized as followsChapter 2 gives overview of spectrum regulation This section discusses the evolu-tion of the radio communication through ages the regulatory frameworks at differ-ent levels (national regional and international) and the changing regulatory trendsfollowing spectrum needs The proposed cognitive techniques for opportunistic spec-trum access are also explained briefly in this chapter
Chapter 3 discusses specifically the regulatory landscape about the TV Whitespaceregulation The Federal Communications Commission (FCC) and the ElectronicCommunications Committee(ECC) are the two major regional regulators in North
America and Europe respectively formally endorsing the the wireless industryrsquosappeal to access TVWS on unlicensed basis This chapter highlights the detail re-quirements set by FCC and ECC
In Chapter 4 the TVWS spectrum availability assessment is throughly explainedThe discussion of availability metrics the analysis of the primary system and thesecondary system models the channel models for estimating the radio propagationcharacteristics are described This section defines the overall spectrum availabilityassessment methodology and its implementation in detail
Chapter 5 focuses on identifying the standard principles behind the design of auser-friendly graphical user interface The enabler technologies for making the toolbrowser accessible the architecture of Spectrum Availability Assessment Tool andits implementation are explained in more detail
Chapter 6 is a case study section The Spectrum Availability Assessment Tool forFinland case is demonstrated While in Chapter 7 the conclusion of the thesis workis briefly summarized and the possible future dimensions of this work are recom-mended
4
2 Spectrum Regulation and Television White Spaces
21 Background
Communication technologies are transforming our society by connecting multiplecommunities governments businesses etc from different backgrounds Wired com-munication technologies which had high market share before wireless systems be-came economically feasible did not penetrate well into many communities acrossthe globe The huge investment needed by costly copper connections was the mainreason Consequently in many developing nations communication remained a lux-ury commodity until recent availability of wireless technologies for mass market
The radio communication systems before World War II were mainly amplitude mod-ulated (AM) and frequency modulated (FM) broadcasting stations The main prob-lem at that time was improving the quality of reception In the 1950s the fields ofcommunication theory and information theory gave a wider perspective to analyzethe system performance Eventually advances in electronics and circuit technol-ogy helped the achievement of highly miniaturized and easily portable devices thatwould otherwise need much space and wiring installation efforts The invention oftransistors was also a remarkable breakthrough for creating very efficient integratedcircuits thateventually revolutionized the mass production of cheap electronic de-vices
In the past three decades we have seen tremendous success in field of informationcommunication technologies The liberalization of spectrum for commercial use hasbrought the success of mobile communication technologies As the technology wasgetting broad market acceptance the exclusive assignment of frequency to large ge-ographic area proved to be uneconomical and inefficient use of the rather limitedradio resource mdashthe concept of breaking-down the whole geographic area into smallhexagonal cells that could enable reusing the same frequency was developed
The first generation (1G) of mobile technologies were analogue There were multipleincompatible parallel developments in different parts of the world for instance inthe US - the Advanced Mobile Phone System (AMPS) in the Scandinavia - theNordic Mobile Telephone (NMT) and UK - the Total Access Communications Sys-tem (TACS) While transferring to the second generation (2G) all networks adoptdigital technology offering a significant improvement in spectral efficiency TheGlobal System for Mobile Communications (GSM) the Code Division Multiple Ac-cess (CDMA) and other Time Division Multiple Access (TDMA) technologies weredeveloped The International Telecommunications Union (ITU) tried to convergethe different 2G technology paths for interoperability to third generation (3G) sys-tem under the auspices of its International Mobile Telecommunication (IMT-2000)A collaboration of telecommunication standards bodies combined to create the 3rdGeneration Partnership Project (3GPP) 3GPP has been working to standardizeradio access core network and service architectures[8] 3GPP has developed the
5
specifications for Long Term Evolution (LTE) All these developments in mobilecommunications systems have given economically viable solutions to developing na-tions which resulted in an exploding growth of cellular networks worldwide In factthe number of mobile subscribers reached 46 billion subscriptions by the end of2010[9]
The ever-increasing data volume associated with mobile broadband and the de-mand for seamless network connection are adding pressure for further spectrum as-signment Until recently most cellular mobile technologies tried to maximize theirnetwork capacity by increasing the number of serving stations mdashby shrinking (orsectoring) the coverage area for each base station However as more traffic is inun-dating the networks in the future it seems the Shannon limit is inevitably reachedwhere no more capacity improvement is made unless a new spectrum is acquiredThe Shannon capacity formula relates the capacity C with the bandwidth W as[6]
C = W log2
(1 +
S
N
) (21)
where W is the bandwidth S - average received signal power and N - average noisepower It is impossible to increase the signal power indefinitely hence capacity canonly be increased via bandwidth adjustment
FCC Report on Trends in Wireless Devices showed that in 2010 alone the num-ber of wireless transmitters(devices) which received license was close to 12000mdashnearlyfourfold the amount of a decade ago The report also identified that new wirelessdevices tend to integrate more transmitters such as Wi-Fi Bluetooth etc and withadded technical capability as compared to the traditional phones[10]
These developments urged the whole wireless industry stakeholders to search forextra radio spectrum The widely discussed spectrum white spaces were targeted aspromising sources of spectrum The spectrum white spaces are the unused frequen-cies in a certain geographical area for a reasonable amount of timeThe EuropeanCommunications Commission (ECC) defined a white space asldquoA label indicating a part of the spectrum which is available for a radio communi-cation application (service system) at a given time in a given geographical area ona non-interfering non-protected basis with regard to other services with a higherpriority on a national basisrdquo [12]
Contrary to the conventional static spectrum allocations these frequencies are stillneeded by the Primary Users (PU) and they cannot be leased for full time The newSecondary Users(SU) can use the spectrum only at times when there is no primarytransmission This dynamic access scheme needs new enabler technologies such asCognitive Radio (CR) mdasha radio that changes its transmitter parameters based onthe environment
In more broad termsldquoCognitive radio system (CRS) A radio system employing technology that allowsthe system to obtain knowledge of its operational and geographical environment es-
6
tablished policies and its internal state to dynamically and autonomously adjust itsoperational parameters and protocols according to its obtained knowledge in order toachieve predefined objectives and to learn from the results obtainedrdquo [12]
So far the spectrum white spaces are identified in Television(TV) Fixed SatelliteStations(FSS) and many radar systems The implementation of CRS involves newtechnical challenges and decisive approval of the regulatory bodies
22 Spectrum Regulation
With current trends of growth in wireless data radio spectrum is becoming a morevaluable natural resource that is worth regulating Radio spectrum accounts foronly a small portion (3kHz to 300GHz) of the available electromagnetic spectrumThe range of spectrum values below and above the radio frequency(RF) can not beused for radio communication purposes Frequencies below 3kHz need uneconomi-cally large antennas while frequencies higher than 300GHz are highly affected byattenuation In fact currently only the radio frequencies between 9kHz and 275GHz are allocated for terrestrial or space radio communication services
Spectrum regulation has a profound socio-economic impact Due to the pervasivenature of radio signals governments have to make mutual decisions for optimal useof the available spectrum Many sensitive applications like satellite radio communi-cations need these international agreements Telecom equipment manufacturers willbe advantaged from the economy of scale only if there is a harmonized spectrum use- this has significant implications in narrowing the Digital Divide between advancedand under-developed economies
The digitalization of formerly analogue services freed a substantial amount of highquality radio spectrummdashknown as the digital dividend The upper part of the Ul-tra High Frequency (UHF) band in the digital dividend (790-862MHz) is alreadyallocated to mobile services in many parts of the world [13][14] For increasing har-monization of the digital dividend towards mobile services worldwide the WorldRadiocommunication Conference 2012 (WRC-12) has decided to allocate the 700MHz band for mobile services with date of entry into force from the end of 2015[15]
Studies have shown even in other existing licensed bands for instance televisionbroadcasting band(470-790 MHz) aeronautical band for DME(960-1215 MHz) radarband (2700-3100 MHz 5250-5850MHz) and IMT band(790-960 MHz 1710-2025MHz)there is significant possibility of using them for opportunistic access[16][19] Al-though this ambitious demand needs a more matured technology the regulatorydecisions matter when it comes to its realization
On top of the complexity of the direct and indirect socio-economic effects resultingfrom spectrum use there are international regional and national players - each with
7
its own agenda The decision making process often takes many years to establishrules accepted by all levels There are multiple drivers however that force thesluggish chain of regulatory procedures to move ahead Firstly the fast pace oftechnological development is bringing more efficient devices having special technicalcapabilities such as intelligent radio cognition which require a totally different set ofregulatory rules Secondly the unquenchable user requirements are becoming moredemanding from ubiquitous mobility to high data access from desiring to access allbelongings online to connecting to many people the whole day etc There is also amore significant trend of digital convergence towards connecting everything to theInternet As more and more devices are connected to the Internet in the future itis inevitable that there will be one giant global network of things All these devel-opments have a strong impact on the current regulatory landscape and all of themnecessitate that there must be change on the status quo
221 Spectrum Regulatory Frameworks
There are many international and regional governing bodies for radio spectrum man-agement and each country has its own spectrum regulators The main role of theinternational and regional regulators is standardizing the most optimal spectrummanagement techniques A worldwide harmonized radio spectrum regulation easestechnological challenges wireless devices manufacturing gets market confidence fromthe economy of scale by mass production Apart from mutual responsibilities by allparties standardization eases global market access - good to make the whole sectorhighly competitive and more innovative As the global economy is becoming moreand more dependent on one another there is an increasing trend of centralizing stan-dardization efforts in the telecom sector as well The international regulators arebecoming more involved in drafting a more acceptable spectrum allocation schemeseach time The national regulators however have a reasonable freedom to identifythe models that suit their national interests given they are under their responsibil-ities
International and Regional Regulators
The International Telecommunications Union(ITU) a specialized agency of theUnited Nations(UN) has the regulatory mandate at the international level TheITU through its World Radiocommunication Conferences(WRC) deals with theallocation of the available frequency(9kHz to 275GHz) to different applicationsTheRadiocommunication Sector of the International Telecommunication Union(ITU-R)plays in a vital role in the harmonization of spectrum management worldwide
The primary goals of the agency is to make sure that there is interference-freeradio communication systems at the local regional and international scale It worksto bring an all-benefiting agreement in a time when there is a growing impor-tance of radio frequency in fixed mobile broadcasting global positioning systems
8
space research emergency telecommunication meteorology environmental monitor-ing etc To keep the pace of technological evolution on track the ITU investigatesthe possibilities to ensure a more flexible regulatory structure for the future suchas conserving spectrum and spectrum-sharing based on geographical location Tofoster future innovation the ITU encourages spectrum allocations to maintain neu-trality on any technology
At the European level the Electronic Communications Committee(ECC) of the Eu-ropean Conference of Postal and Telecommunications Administration(CEPT) playsthe regional regulatory role which in many ways reflect European interests in theITU and other international organizations The ECC also works to formulate mu-tually optimal spectrum policies and regulatory procedures across Europe TheECC works in partnership with the European Telecommunication Standards In-stitute(ETSI)mdashan industry-led organization involved in developing European stan-dardization of telecommunications services and devices and the European Commis-sion(EC) With its goal of maintaining the single EU market for wireless servicesand equipment the ECC is one of the influential telecom policy makers at the in-ternational level
ECC provides four relevant deliverables to the member states The ECC Deci-sions give regulatory texts that outline optimal procedures to harmonization is-suesmdashalthough they are not mandatory prescriptions most CEPT member admin-istrations are highly encouraged to follow them For national authorities ECCdevelops Recommendations as a guidance to deal with harmonization matters Re-ports of the harmonization measures are compiled by ECC based on studies as ECCReports Finally CEPT Reports reveal the final results of studies which show re-sponses to the EU authorities helpful for future EC Decisions All these CEPTdeliverables are non-binding to give the national authorities a reasonable flexibilitybased on their national interests [19]
National Regulatory Authorities
The European member states have their own National Regulatory Authorities(NRA)To ensure effective liberalization of the telecommunication sector each member stateshould have a structurally independent and impartial NRA not involved in any formof telecom business Article 3 of the Common Regulatory Framework Directive[20]explains thatrdquoMember States shall guarantee the independence of national regulatory authoritiesby ensuring that they are legally distinct from and functionally independent of all or-ganizations providing electronic communications networks equipment or servicesrdquo
The NRAs can exercise power at the national level based on the recommenda-tions and guidelines from the EC Normally the EC identifies relevant marketsand provides market definition recommendations to the NRAs Based on those rec-ommendations the NRAs will analyze them at the national levelto check if there
9
is a monopolistic practice on the recommended markets for regulatory intervention
In the UK the Office of Communications(Ofcom) regulates the broadcasting telecom-munications and postal industries Particularly Ofcom oversees the TV and radiosectors fixed line telecoms postal services and airwaves over which the wireless de-vices operate
In Finland there are two institutions responsible for spectrum management theMinistry of Transport and Communications (MINTC) and the Finnish Commu-nications Regulatory Authority (FICORA) MINTC is responsible to prepare thetelecommunication acts and policies suitable for Finland It also issues policy andregulation implementation guidelines and directions Where as FICORA imple-ments the policies and decisions made by MINTC mdashit takes direct responsibility tomanage issue and control the use of frequencies based on the policies Its licensingconsiders the current and future trends of radio communication systems Togetherwith the Finnish Competition Authority FICORA handles competition issues inthe telecommunications sector
222 General Trends in Telecommunications Regulation
The main goals of regulation are to achieve non-interfering systems and a purelycompetitive telecommunication services market The early practices of regulationfocused on avoiding interference among the different broadcasting stations In itsfounding legislation the Federal Communications Commission(FCC) the UnitedStates regulator of non-governmental spectrum use it was given the power to actbased on the public interests This command and rule type philosophy of spectrumregulation based on public interest had at times prohibitive implications on theproliferation of new technologies Studies have shown that even the most premiumand congested traffic areas are not using the allocated spectrum mainly because ofthe artificial spectrum shortages created by tight regulatory rules[6][2]
A report by United States General Accounting Office(GAO)[25] showed that thecurrent structure of spectrum management do not promote the arrival of spectrumefficient technologies The categorization of spectrum by service types(such as aero-nautical radio navigation) and users(federalnonfederal and shared) affects spectrumflexibility for emerging technologies The regime excludes dynamic spectrum acqui-sition techniques by technologies like software-defined radios(SDR) - radios thatadapt to the real-time spectrum environment and configure themselves accordinglyThe spectrum white spaces - unused frequencies in the licensed spectrum - can notbe utilized efficiently unless new regulatory measures are taken With new spec-trum usage rules gray spaces - frequencies where emissions exist but could supportadditional traffic without affecting the incumbent users - may be used with SDRtechnologies
In recent years however there is a growing trend to make spectrum regulation
10
to be decided by the market This has been done in the form of government auc-tioning When unassigned spectrum is discovered bidders are allowed to contestmdashthe spectrum will be leased for the bidder who brings more money The spec-trum might have been obtained for instance from a retired application such aswhen analogue television broadcasting is changing its technology to digital systemsThe Finnish regulator FICORA made one of such auctions for the 2500-2690 MHzspectrum blocks in November 2009[21] This market-based approach is also offeringthe possibility to allow the secondary-marketing (reselling) of the spectrum Thespectrum-ownership will be transferred in long-term or temporal basis to those en-tities who value it most[6]
Regulators are now convinced how strict regulatory policy impairs innovation Thecommercial success of the wireless devices and services in the license-exempt radiofrequency commonly referred to as ISM-band(Industrial Scientific and Medicine)substantiates this fact These radio frequencies are not licensed to any entity mdashavail-able as spectrum commons for public use These bands are found very valuable formany wireless devices such as WiFi Bluetooth radio tagging(RFID) and a varietyof uses from remote garage openers to control of toys and baby alarm monitors Thepower emissions from the multiple devices can create strong electromagnetic inter-ference and disrupt communications using the same frequencies To minimize suchpossibility there are certain allowed power levels and the technologies allowed arespread spectrum ones The most widely used of the ISM radio bands is the 24GHzbut large new chunks of spectrum from 5GHz to 6GHz are now available worldwidefor similar applications
223 Regulatory Measures for Opportunistic Spectrum Access
Based on the various studies on the existing spectrum occupancy only less than20 of the the spectral capacity is being used effectively even in the busiest radioenvironments like New York and Chicago[6] Another study in downtown BerkeleyUS identified similar problem (see Table 3 below) This one revealed typical uti-lization of roughly 30 below 30GHz and 05 in the 3 to 6GHz frequency bandDue to these significant inefficiency all stakeholders are urging the old regulatoryregime to address the growing spectrum demand
Freq (GHz) 0 sim 1 1 sim 2 2 sim 3 3 sim 4 4 sim 5 5 sim 6Utilization () 544 351 76 025 0128 46
Table 3 Measurement of spectrum utilization (0-6 GHz) in downtown Berkeley[3]
Recently many regulators are showing their willingness to allow secondary oppor-tunistic access to the licensed bands The dynamic spectrum access scheme targetsthe unused spectrum holes white spaces for temporary(license-exempt) spectrumsharing both in the spatial and temporal dimensions The FCC has made one of
11
the most significant regulatory amendments in nearly 20 years - allowing a license-exempt access in licensed bands FCC has given the details on using the licensedTV channels for unlicensed use[26] The details are mainly guidelines how to accessspectrum opportunistically while avoiding any interference to the primary users -without adding any more technology enhancements to the primary system
Other regulators are following similar steps In Europe the ECC has already devel-oped requirements for protecting the licensed users in the 470-790MHz in an effortto foster future cognitive radio access [12] The new upcoming technologies benefit-ing from the spectrum white spaces in the 470-790MHz bands should consider theprotection criteria for the following incumbent services
bull Broadcasting services including Digital Video Broadcasting - Terrestrial (DVB T)
bull Program Making and Special Event (PMSE) systems like radio microphonesin particular
bull Radio Astronomy (RAS) services in the 608-614MHz bands
bull Aeronautical Radio-Navigation(ARNS) in the 645-790MHz bands
bull mobilefixed services in the bands adjacent to 470-790MHz
The White Space Devices (WSD) must guarantee critical attention to these protectedprimary services from harmful interferences For the implementation phase manyparties are undergoing studies for optimal enabler technologies
23 Television White Spaces
Television broadcasting services operate in the Very High Frequency (VHF) andUltra High Frequency (UHF) portions of the radio frequency on a licensed basisRegulators prohibit the use of these bands for unlicensed devices Most regulatorshowever are necessitating the adoption of digital transmission by all TV stationsthat were using analogue transmission The US has already completed this DigitalSwitchover(DSO) by June 2009 while UK is planning to complete by 2012 In Fin-land over-the-air analog television transmissions were shut off in September of 2007while the cable television networks analog transmissions were allowed to continueuntil February 2008 [27] Similar steps are in progress (or already finished) in theremaining Europe This transition has freed up a significant amount of spectrumfor other services
The other major benefit of the DSO is the opportunity to use the licensed TV bandsfor unlicensed wireless devices when licensed users are not needing them There aresuitable geographical locations which could not be accessed by some channels with-out interfering with their adjacentco-channels but still these channels could be
12
used by low power devices without disturbing similar primary users These sec-ondary devices also known as White Space Devices(WSDs) should be equippedwith state-of-the-art cognitive capabilities to avoid any harmful interference to theprotected incumbent services The name Television White Space(TVWS) came fromthe broadcast coverage color map where different colors indicating different signallevels while geographical areas without TV signals are left white Thus TVWS canbe defined asGeographical locations where there is no TV signal and the broadcasting frequencycan be used for secondary purposes without causing any interference to the perfor-mance of the TV broadcasting in the remaining areas and other incumbent servicesanywhere
In Europe the TVWS is located in the 470-790MHz bands - which is tradition-ally stronger signal far better than the 3G and WiFi bands for its capability totravel long distances and penetrate shadowing walls It is also very promising formany potential services such as last mile wireless broadband access in rural areas
24 Introduction to Cognitive Radios
Conventional digital transceivers as depicted in Figure 1 includes the analog RFfront-end module responsible for transmittingreceiving the Radio Frequency(RF)signal from the antenna and down-converting the signal from RF to IntermediateFrequency(IF) on receive path (or up-conversion of the IF signal into RF signal incase of transmit path) The middle section includes the Analog-to-DigitalDigital-to-Analog Converter (ADC and DAC) block the demodulating Digital Down Con-version(DDC) and modulating Digital Up Conversion(DUC) blocks The basebandsection performs baseband operations such as (connection setup equalization fre-quency hopping codingdecoding and correlation) and implements link layer pro-tocols
The continuous evolution of wireless access schemes is demanding new hardware up-dates each time Mobile users on the other hand need technology-neutral roamingcapabilities This technical requirement is bringing a new variant of radio systemswhich rely on software-reconfigurability running on generic hardware with Digi-tal Signal Processors(DSPs) and general purpose microprocessors Software-DefinedRadios(SDRs) are radios whose functional modules such as modulationdemodulationsignal generation coding and link-layer functions can be implemented in softwareIn other words the coding modulation type and frequency band can be modifiedsolely by changing software This capability of SDR devices enables upgrading themodules and hence the devices mainly by software updates whenever the wirelessaccess protocol is changing
SDR can be a key enabler of other important types of radios which are more adaptiveand reconfigurable Cognitive Radios(CRs) are radios more flexible and adaptableto any radio environment by cognitive learning Although there are multiple defini-
13
Figure 1 Generic digital transceiver
tions the CR concept was first explained by Mitola and Maguire asldquotransforming radio nodes from blind executors of predefined protocols to radio-domain-aware intelligent agents that search out ways to deliver the services thatthe user wants even if that user does not know how to obtain themrdquo[28]
CRs must have dynamic spectrum access support for wide range of frequenciesspecial intelligence for sensing and decision-making capabilities based on the radioenvironment as well as other functionalities like contacting database servers withoutthe knowledge of the user Ideal CRs change their internal operational behaviorby learning from sensory inputs and recognizing patterns in a heterogeneous radioenvironment
25 Cognitive Techniques to Access White Spaces
Cognitive secondary access to TVWS involves detection of the available spectrumholes in the TV-bands and to use the spectrum based on the regulatory requirementswhich basically protect incumbent services from harmful interferences Three cogni-tive techniques have been proposed by ECC to help WSDs find empty channels[12]
1 Geo-location with databases
2 Spectrum sensing
3 Beacons
Currently the geo-location assisted by database seems to be a more promising short-term solution for incumbent detection and interference avoidance
251 Geo-location Databases
In this approach the WSDs are required to consult a centralized (or regional mirror)geo-location database to determine if there are any TVWS (free channels) they can
14
use without causing interference to other services ECC needs that the WSDs haveto recognize and indicate their current location before sending the query There arefew essential parameters yet to be decided in the future the location precision howoften the devices should contact the database and the quality of the database it-self Too precise location requirement imposes unnecessary complexity to the WSDswhile contacting the server at short time intervals dries up the battery life of thedevices
With this scheme WSDs are not allowed to transmit before they receive notifi-cations from the database about the available white spaces if any in their positionThis requires that the WSDs make initial connectivity to the database by some otherway than the white space frequencies Currently the master-slave communicationarchitecture is proposed to alleviate this problem A master device most likely anaccess point or a base station having access to the location information will connectto the database via Internet Then it in turn serves the inquiries of the slave WSDsat its vicinity
The database scheme might work well for protecting services whose coverage plan
Figure 2 Possible geolocation database proposed by Ofcom[11]
is more or less fixed and deterministic the protection of mobile incumbent servicessuch as wireless-microphone however may need more sophisticated approaches
252 Spectrum Sensing
Spectrum Sensing enables unlicensed devices detect the presence of any protectedincumbent services in licensed channels which appear to be white spaces Spec-
15
trum sensing involves measuring the signal levels of the potential channel basedon the regulatory requirements FCC for instance requires the ldquoTV bands de-vices [unlicensed WSDs] be capable of sensing analog TV signals digital TV signalsand wireless microphone signals at a level of -114dBm within defined receiver band-widthsrdquo While this level is referenced to an omni-directional receive antenna of 0dBigain other approaches for sensing antenna are allowed as far as they maintain thesame performance with respect to the sensing threshold
Up on finding a vacant channel the WSDs may also be required to sense the adja-cent channels to find out if any transmission power constraints Certain serviceslike radio astronomy in the band 608-614MHz which are technically difficult to de-tect might need special protection (or even exclusion) from these sensing procedures
Spectrum sensing if it is standalone has very important advantage that it doesnrsquotneed connection to a centralized database server This eliminates the need for extracommunication infrastructures like the Internet The down-side of this scheme how-ever is that sensing signals may be vulnerable to what is called the hidden terminalproblem shown in Figure 3
Figure 3 Hidden-terminal problem of sensing-based cognitive radio[28]
While the unlicensed cognitive device is trying to sense the signal from the pri-mary transmitter which is located on the other side of the shadowing building itmay conclude that there is no primary transmitter nearby and may start trans-mitting on the same channel In this scenario the licensed users which are stillreceiving from the transmitter and located at the vicinity of the WSD will sufferfrom chronic interference
253 Beacons
A third proposal for spectrum white space detection is using beacons Unlicenseddevices transmit only when they receive the beacons that carry information whether
16
the channel is vacant or not The beacons can be broadcasted by the TV stationsor a different unlicensed fixed transmitter using TV bands Using beacons increasesthe probability of detection at lower threshold values that would otherwise needmore complex sensing systems
This approach needs a dedicated infrastructure that broadcasts beacons and itshould be operated depending on statistics from the licensed incumbent servicesWhen beacons are lost probably due to shadow-fading the hidden-terminal prob-lem explained above may happen
Regulators such as FCC have already decided to use geo-location database as a solecognitive technique sensing and the use of beacons to be optional ones The reasonbehind such decisions is the less viability of these methods to detect white spacespectrum However FCC encourages the use of sensing with secondary devices fordetermining quality of channels and for the promotion of spectrum sharing amongsecondary devices[26]
26 The Problem of Aggregate Interference
Cognitive techniques such as spectrum sensing and beacon methods have technicaldownsides related to secondary interference When the number of secondary poweremitters is increasing their aggregate interference tends to increase beyond the tol-erance level for the TV systems[16] This demands the use of monitoring methodswhich in effect help to control the density of secondary transmitters Geo-locationdatabases may well serve to solve such problems by controlling the density of WSDs
17
3 TV Whitespace Regulation
In the United States there are two spectrum regulators National Telecommunica-tions and Information Administration(NTIA) regulates all federal government spec-trum use while FCC regulates all non-federal government spectrum use All com-mercial broadcasting including television spectrum is regulated by FCC
In June 2002 FCC established a Spectrum Policy Task Force to keep its pace withthe current spectrum demands and revise its policies based on comments from allstakeholders including wireless equipment manufacturers wireless service providersacademics radio and TV service providers etc The Task Force held numerousmeetings and workshops open for the public After such efforts the Task Forcehighlighted the need for more flexible spectrum policy for the following reasons[29]
bull As technology is advancing interference mitigation is becoming easier andwireless systems are becoming more tolerant to interference
bull In many cases the real problem is associated with the prevailing spectrum ac-cess policies than the physical scarcity of spectrum which hampered potentialspectrum users
bull More flexible and market-oriented regulatory models are imperative for theinnovation of spectrum-efficient and more economical technologies
bull Fair spectrum regulation should have variety of models such as the grant-ing of exclusive rights via market-based approach increasing the ldquospectrumcommonsrdquo and other means
In recent years the Commission has made significant improvement in its spectrumpolicies In 2004 FCC proposed to allow opportunistic access to TV bands Afteraccepting petitions from all stakeholders and discussing the relevant topics FCCreleased detail requirements for using the TVWS for unlicensed devices in 2008[26]
The pan-European ECC has also pursued similar steps to respond to the grow-ing spectrum scarcity In July 2008 ECC (in its CEPT Report 24)[33] starteddiscussing the potentials of opportunistic access on TV white spaces and the asso-ciated risks for the existing radio systems In January 2011 ECC released a detailtechnical and operational requirements for accessing the TVWS for unlicensed use[12]
The two institutions FCC and ECC used different approaches to protect the exist-ing services while harvesting the available spectrum in TV white spaces FCC re-quires protection based on distance while ECC focuses on secondary power controlHowever both of them are using similar secondary spectrum access technologiesmdashgeo-location with databases andor sensing The following two sections summarize themajor decisions by FCC[26] and ECC[12] for realizing cognitive access to TV whitespaces
18
31 FCC
TV broadcasting in the US operates on 6 MHz channels designated from 2 to 51in four bands of frequencies in the VHF and UHF regions of the electromagneticspectrum (54-72MHz 76-88MHz 174-216MHz and 470-698MHz)[26]
In the US TV service contours are used to estimate signal strength in the cov-erage area around the broadcasting station Service contours are calculated usingaverage terrain elevation from topographic data in eight specific directions and theprincipal community if none of the eight directions point to it The height of theelectrical center of the antenna above this average terrain determines the effectiveheight This height and the effective radiated power are used to find out the distanceto any specific field strength such as the service contours For instance Grade A andGrade B service contours are the most commonly used for FCC administrative pur-poses The stations also use them for promotional and marketing purposes GradeA contour covers all distances with field strength 68 dBu while Grade B refers to47 dBu In addition to these specific field strength values for these two contoursa minimum field intensity named as city grade contour is specified which must beprovided for the entire principal community it is 6-dB higher than the Grade Acontour [18]
Besides the TV broadcasting the channels are used for unlicensed services likemedical telemetry (on any vacant TV channel from 7 - 46) remote controls(abovechannel 4 except for 37) and radio astronomy(in channel 37) The Commission re-quires these services must sense TV broadcasting and other devices to avoid harmfulinterference To ensure this capability the devices must be certified at FCC Labo-ratory
FCC adopted protection criteria for the existing TV broadcasting systems basedon the nature of their coverage To avoid severe interference techniques like usingprotection distance gap between the intended service range and the interferencerange are used Wireless devices must be located outside the coverage area by thisprotection distance which depends on the height of their antenna and operatingfrequency (co-channel or adjacent channel)
Unlicensed devices must be located outside the inner contour signals of co-channeland adjacent stations by at least the minimum distances specified in Table 31Portable WSDs or TV band devices (TVBDs) in FCC terminology with geo-location and databases access capability must respect the separation distances spec-ified for unlicensed device with an antenna height of less than 3 meters
After verifying with its own engineers and analyzing the responses from vari-ous stakeholders FCC considered spectrum sensing as a less viable tool for whitespace detection Consequently devices with capability of locating themselves andaccess to database server are exempted from the spectrum sensing For instance
19
Figure 4 FCC protection distance for a typical WSD antenna heightle 3m Theposition of the unlicensed device determines the frequency it is allowed to operate(adjacent or co-channel to the TV station)
Antenna Height of Required Separation (km) From Digital orUnlicensed Device Analog TV (Full Service or Low Power)
Protected Contour
Co-channel Adjacent Channelless than 3 meters 60 km 01 km3 mdashless than 10 meters 80 km 01 km10 mdash30 meters 144 km 074 km
Table 4 FCC protection areas [26]
FCC admitted the inappropriateness of spectrum sensing to protect wireless micro-phones which may be licensed or unlicensed while it is possible to give protectionto licensed ones via geo-location and database Unlicensed wireless microphones onthe other hand must tolerate significant level of interference by design Howeverthe Commission recommends the wireless device makers to include spectrum sensingto help them determine the relative channel quality and enhance spectrum sharingamong unlicensed TV bands devices
20
FCC put a limit on the EIRP power levels for personalportable unlicensed devicesto a maximum of 100mW When the same device is operating closer to an occupiedadjacent channel the maximum EIRP should be limited to 40mW Sensing-only de-vices are allowed to emit up to 50mW EIRP Fixed devices however are permittedto operate to a maximum 4W EIRP but the Commission is quite strict for theiroperation adjacent to occupied channels To reduce the out of band emissions FCCrequires that TVBDs power emission must be attenuated at least 7285dB belowthe highest average power in the adjacent 6MHz bandwidth Fixed TVBDs shouldlocate their geographic coordinates to an accuracy of +-50 meters The same ruleapplies to portable unlicensed devices on the condition that they check their loca-tion every 60 seconds
32 ECC
In Europe the TV white spaces are located in the 470-790MHz contiguous frequencybands and unlike in the USA each TV channel occupies 8MHz band The presenceof multiple autonomous national regulators becomes a challenge to impose verystringent white space usage rules
ECC uses more detail signal propagation models to avoid secondary interferenceto different incumbent services (broadcasting TV stations PMSE systems radioastronomy aeronautical radionavigation systems and border services at both endsof the 470-790MHz frequency) ECC proposed optimal secondary power emissionequations and primary protection procedures by assessing the most common pri-mary system settings Unlike the FCC approach the ECC document contains loosetechnical recommendationsmdashthat seem to offer a significant level of flexibility uponimplementation in different member nations ECC recommendation considers thegeo-location database as a crucial tool to identify the TV white spaces while sens-ing is left as an optional method In fact ECC concluded autonomous sensing-onlyWSDs can not reliably detect the presence of primary systems even with more strin-gent sensing thresholds (for instance -91dBm to -155dBm to detect TV signals)Moreover ECC highly recommends geo-location databases to protect ARNS andportable PMSE services
The ECC approach is targeted at maintaining a reasonable location probability theprobability with which a DTT receiver would operate correctly at a specific pixel mdashareceiver is considered to work correctly if the median of the wanted signal is greaterthan the minimum required value Each pixel has 100m X 100m dimension DTTnetworks use location probability to quantify the quality of their coverage A typicalcoverage plan calculates the location probability for each pixel across the countryWhen a secondary wireless device is introduced the interference naturally causesreduction in the DTT location probability This reduction is used as a metric forimposing the regulatory in-block and out-of-block power emission limits for WSDsworking in the DTT frequencies
21
ECC suggests short-range WSDs to emit power levels of 10mW to 50mW and long-range ones between 1W and 10W The autonomous operation of a WSD can be madesafe by using a location specific maximum output power equations For instancethe maximum permitted in-block power (EIRP) of a single WSD that can guaran-tee protection of the co- and adjacent channel TV channel reception is derived asfollows[12][16]
The received TV signal quality is described by the signal to interference and noiseratio (SINR) ECC considers the TV outage due to slow fading is complementary tothe location probability The SINR distribution is related to the outage probabilitytarget(On)
On le PrSINR le γt (31)
where γt is the target SINR level
The SINR is the ratio of the received useful signal Ptvgtv and the noise addedwith interference
SINR =Ptvgtv
Itv + Isu + Pn=
PtvgtvIsu + PN
(32)
where Isu is the interference from secondary users Itv is the interference from otherTV stations Pn is the noise power PN = Itv +Pn and gtv is the TV signal attenua-tionThe interference from other TV stations can be modeled as an increase of the noisefloor In slow fading channel the interference can be modeled with lognormal distri-bution
Isu + PN asymp 10micro+z10 (33)
where micro(in dB) is the mean secondary interference added with the noise power andz is the zero mean Gaussian random variable with standard deviation σsu whichwould be the slow fading standard deviation of the secondary signalBy tuning the first two moments of the both sides of equation (33) to be equal andusing (33) in (31) it is possible to derive the secondary power level that guaranteesthe outage limit
Psu = microtv minus microg minus γr + qradicσ2tv + σ2
su minusMI minus SM minusM (34)
where microtv σtv are the mean and standard deviation respectively of the TV signalmicrog is the mean secondary pathloss γr is the protection ratio in dB due to frequencyoffset between the TV receiver and the secondary device q = Qminus1(1 minus On) is theGaussian confidence factor and the Qminus1 is the inverse Q-function MI accounts themargin for multiple secondary interference SM is the safety margin and the marginM contains all the remaining parameters such as antenna gain antenna directivity
22
and polarization discrimination feeder loss of the TV system etc
However this approach requires the knowledge of a number of priori parameterssuch as the possible distance between the TV receiver and WSD(included in the cal-culation of M) The approach may not guarantee the protection of primary systemsif for instance TV coverage has convolutions due to terrain irregularities ECCconcluded that the autonomous operation of WSDs should be compensated by tak-ing a more conservative propagation characteristics This has a direct impact onthe utility of WSDs which decreases when the detection requirements are very low
The precise spatial separation between the WSD and a victim DTT receiver withinthe given pixel can not be known merely by geo-location database To complementthe SE43 methodology in determining the WSD transmission power limits the con-cept of Reference Geometry is used Reference Geometry refers to the minimumseparation distance to be maintained between the WSD and the TV receiver inadjacent channel Figure 5 shows the relevant reference geometry This geometryhelps for the calculation of optimal emission limits for mobilefixed communicationnetwork terminal stations
Figure 5 Reference geometry for adjacent channel options assuming a portableWSD
33 Protection of other systems in the TV spectrum
Wireless microphones are non-data devices which do not include geo-location tech-nologymdashhence they are not required to be added to the database servers FCCgranted two channel reservations (in the range 14-51) for wireless microphones tosafeguard them from potential interferences Although there is no special protectionscheme (as in contour mapping) applied for wireless microphones most gathering
23
venues and sites for major events will be registered to the geo-location database tolimit the intrusion of unlicensed TVBDs in the area If in any case the number ofwireless microphones is beyond the capacity the reserved channels could serve theevent organizer can register the details of the site beforehand for ensuring protectionfrom unlicensed TV bands devices
The ECC approach to protect program making and special event(PMSE) systemsdemands that WSDs should monitor their power emission This requires the in-terference level from WSDs to remain well below -115dBm at the PMSE receiversIn some worst-case scenarios the detection thresholds may drop from -120dBm to-155dBm Generally ECC recommends the need for a further study on combatingtemporal fading caused by multipath propagation or using a geo-location databasesand safe harbor channels dedicated for this specific service Similarly for the pro-tection of radio astronomy(RAS) in channel 38 the ECC requirement suggests thatthis channel and its adjacent channels (37 and 39) be totally exempted for usageto autonomous WSDs unless there is a centralized database at the European levelor a multilaterally agreed management system that could secure the safety of thischannel
24
4 Spectrum Availability Assessment in the TV
White Space
41 Introduction
Based on the QUASAR project definition[39]
ldquoSpectrum is available for a certain set of secondary transmissions when it wouldnot violate the regulatory rules if it were to be executedrdquo
A number of possible metrics can be suggested for estimating the amount of theavailable spectrum for instance the number of unused TV channels per pixel1canbe located for a geographic area A channel is considered available for secondaryusage at a pixel if the pixel doesnrsquot fall within the coverage or the protection areaof any transmitter using the same channel (see Figure 6)
Figure 6 Channel availability for a two transmitter scenario
Spectrum availability assessment is done as a back-end computation for SpectrumAvailability Assessment Tool In simulation environments the process of estimatingthe amount of spectrum involves modeling the radio environment considering theprimary system network coverage and radio characteristics devising measurementmetrics and using appropriate secondary system scenarios for studying the feasibilityof the assessment This chapter discusses the propagation models the measurementmetrics and assessment methodology used in the spectrum availability assessment
1A pixel may cover different area size depending on precision of the assessment The locationprobability which is used in DTT network planning is typically calculated for every 100mx100mpixel across the country[12] However for this assessment we used a wider pixel size of 250mx250mFor the purpose of uniformity in this document a pixel size refers to the 250mx250m dimensionunless it is related to location probability
25
42 Radio Environment Channel Models
In wireless communication the transmission medium(channel) is shared by manyradio systems The characteristics of the radio signal changes as it travels fromthe transmitter to receiver antennas The signal is affected mainly by the lengthof the path(s) taken by the signal and the transmission environment(trees build-ingsmountainsmachineriesetc) In general the received signalr(t) can be ob-tained by the following equation where the transmitted signal x(t) and the chan-nelrsquos impulse responsehc
r(t) = hcx(t) + n(t) (41)
where n(t) is noise signalThe channel response has three main components path loss shadow and multipathfading
i Path Loss
A signal emitted by transmitter antennas is spread spherically The signal getsweaker the more it moves radially away from the transmitter This attenuation dueto the distance traveled by a signal is named as path loss A most direct and easyapproach for measuring the path loss is a line-of-sight propagation where there areno objects between (and around) the transmitter and the receiver In free spacethe received power can be described by the following equation
PR = PTGTGR
[λ
4πr
]2(42)
where PR and PT are the received and transmitted powers GT and GR -antennagains r - path traveled and λ - wavelength of the carrier frequency
In general the path loss can be derived from the following empirical formula withP0 power at a distance r0 and α the path loss exponent
PR = PTP0(r0r
)α (43)
And the path loss is written as
L(r) = L0 + 10 middot α middot log10(rr0) (44)
L0 is the average path loss at reference distance r0
ii Shadow Fading
Shadow fading occurs when there are big structures like buildings mountains treesetc between the transmitter and the receiver Shadowing happens when the trans-mitted signal is lost through absorptionreflection scattering and diffraction mdashsee
26
in Figure 7 The net path loss can be approximated by the equation
L(r) = L0 + 10 middot α middot log10(rr0) +Xσ (45)
Here Xσ in dB is a normally distributed(Gaussian) random variable with standarddeviation σ
iii Multipath Fading
In a radio environment with multiple scatterers the radio signal arrives at the re-ceiver from different directionsmdashwith varying delays (phase) and signal strength(amplitude) Depending on their phase the multiple signals may add or subtracteach other upon arrival yielding increased or decreased received power There maybe a line-of-sight between the transmitter and the receiver units giving rise to oneor more dominant signal components (if any) Figure 7 illustrates how the multi-path effect works from signal reflections and the line-of-sight components Moreovermultipath(fast) fading is characterized by its rapid fluctuation over small areas
The relative effects of the three components the channel response can be com-
Figure 7 Multipath and shadow fading
pared in Figure 8 It is clearly shown that shadowing weakens the signal next topath loss while multipath fading varies rapidly in the range of the transmissionpath
421 Statistical Models
To help better estimation of the signal strength in simulation environments the radiochannel is modeled based on the signal properties and the nature of its propagationenvironment Empirical models that are developed based on measurements takenin various radio environments or statistical distributions that could approximatethe real world scenarios are used to model the channel properties and the signalpropagation characteristics
27
Figure 8 Comparing path loss shadowing and multipath fading [38]
a Okumura Hata Model
One of the famous statistical models of signal propagation in a multipath radioenvironment is Okumura Hata Model The simplified mathematical path loss equa-tions are derived from measurement results for limited set of parameters(antennaheights frequency and distance) The model works well for medium range coverageareas but may not be suitable propagation model for distances beyond 100km Theoperating frequency falls in the range of 30MHz - 3GHz [39]
E = 6982minus 616 log10(f) + 1382ht + a(hm f)minus (449minus 655 log10(ht)(log10(d))b
(46)
where E is the field strength in dB(microVm) f is the frequency in MHz ht (in meters)is the transmitter effective antenna height above ground in the range 30-200m hmis the mobile station antenna height above ground in the range 1 minus 10m d is thedistance in km The value of the function a(hmf) is
a(hm f) =
(11 log10(f)minus 07)hm minus (152 log10(f)minus 08)
Where as the parameter b can be computed as
b =
1 d le 20km1 +(014 + 0000187f + 000107hlowast)(log10(005d))08 d gt 20km
where hlowast = htradic1+0000007h2t
b Point to Area Propagation Models
There are differences between point-to-point and point-to-area radio link model-ing They are distinguished by the amount of data required point-to-point modemust provide details of the terrain profile of the link that the area prediction mode
28
will estimate by using empirical medians TV broadcasting needs a model thatcan predict the point to area propagation characteristics The ITU-R P1546-3recommendation predicts terrestrial point-to-area radio propagations for frequencyvalues 30MHz - 3GHz The model is aimed at tropospheric radio propagation cover-ing long-range distances (1-1000km) and traveling over land sea or mixed land-seapaths for effective transmitting antenna heights less than 3km The ITU recom-mendation is an extrapolation of the measurement data under different geograph-ical and climatic conditions Field strength propagation curves for 1 kW effectiveradiated power at nominal frequencies of 100 600 and 2000MHz are used to ex-trapolate(or interpolate) other propagation characteristics The curves are based onmeasurement data mainly relating to mean climatic conditions in temperate regionscontaining land cold and warm seas Although propagation conditions may varyaccording to the weather conditions the methods for interpolation and extrapo-lation between families of field-strength curves are general Therefore if familiesof curves exist for regions with different climate accurate characterization of radiopropagation in different regions may be attained using the methods found in theITU recommendation[30]
Another model Irregular Terrain Model(ITM) also called Longley-Rice model isused to estimate the propagation pattern of the TV broadcasting for both coveragearea and point-to-point link predictions The model predicts the median attenuationof the radio signal as a function of distance antenna heights and extra losses dueto refractions caused by the intermediate (terrain) obstructions It involves dozensof functions that implement numerical approximations to theory[31]
These models are used by many propagation prediction softwares for generatingelectric field strength coverage maps Appropriate terrain models must be used toestimate the electric field propagation patterns The Shuttle Radar TopographyMission(SRTM) terrain model is the most commonly used terrain model SRTMis high-resolution global digital topographic database created by specially modifiedradar system[32]
43 DVB-T System Basics
DVB-T Digital Video Broadcasting - Terrestrial is a European-based digital ter-restrial television DTT broadcasting technology It enables the transmission ofcompressed digital video audio and other data using an MPEG transport stream(MPEG-TS)DVB-T standard offers various modes of network planning giving riseto many flexible reception options from rooftop aerials to indoor receivers in busesand cars To reduce the effect of multipath propagation conditions DVB-T loads thedata stream into large number of orthogonal narrow-band frequency carriers Thistechnique is known as Coded Orthogonal Frequency Division Multiplexing(COFDM)
The transmitted signal is organized into frames and four frames constitute a super-frame Each frame consists of 68 OFDM symbols while each symbol is constructed
29
either by 6817 carriers socalled 8K mode or 1705 carriers in 2K mode A sym-bol consists a useful part with duration TU and a guard interval with duration 4(see the tables below) The guard interval is used at the start of each symbol tofight multipath situation at the receiver Guard interval may have durations of 1418116 or 132 as compared to the useful part For instance a guard interval of14 means that each COFDM symbol is preceded by a guard symbol one-fourth ofthe useful symbol Besides the guard bands increasing the redundancy of bits isemployed for correction of bit errors DVB-T uses code rates of 12 23 34 56and 78For instance a code rate of 23 refers to a transmission where 2 units ofdata are non-redundant and useful while the remaining 1 unit is inserted for errorcorrection
Parameter Value
Channel bandwidth 8 MHzFFT size 8192 (8K)Number of subcarriers 6817Modulation 64-QAMCode rate 23Carrier spacing 1116 HzUseful symbol duration 896 microsGuard interval 18
Table 5 DVB-T parameters Finland [40]
Figure 9 shows the power spectral density of DVB-T signal The overall spectraldensity of the modulated data cell carriers is the sum of the power spectral densitiesof individual carriers For comparison of the 8K and 2K modes see Table 6
Parameter 8K mode 2K mode
Number of carriers K 6817 1705Duration TU 896 micros 224 microsDuration for guard interval of 18 (4) 112 micros 28 microsSymbol duration for guard interval of 18 (4+ TU) 1008 micros 252 micros
Table 6 Comparison of 8K and 2K modes using 8MHz channels [37]
DVB-T can use any of the three modulation schemes such as QPSK(QuadraturePhase Shift Keying )16QAM(Quadrature Amplitude Modulation) or 64QAM 64-QAM for instance is a modulation scheme that conveys data by changing boththe phase of a reference signal(phase-shift keying PSK) andor the amplitude ofthe carrier wave(amplitude-shift keying ASK) which carries log2 (64) = 6 bits persymbol It can also use hierarchical modulation where two separate data streams aremodulated onto a single DVB-T streammdasha high priority stream embedded withina low priority one to allow a more flexible reception based on receiver quality Thetwo independent data streams can be transmitted in the same signal using different
30
Figure 9 Theoretical DVB transmission signal spectrum for guard interval4 = 14(for 8MHz channels)[37]
modulation techniques for instance QPSK for one (high priority) stream and 16-QAM for the low priority one The high priority stream can be received in the case ofrelatively poor carrier-to-noise ratios but with low data rates while the low priorityones can carry high data rate with high carrier-to-noise ratio but need good receiverquality Moreover it can operate in 6 7 or 8MHz channel bandwidths which givesa great deal of spectral flexibilityThe set of DVB-T parameters employed in Finland is shown in Table 5
44 Assessment Methodology
Spectrum availability assessment for TVWS involves the following steps
bull DVB-T system setup analysis mdashThis includes collecting the primary sys-tem transmitters across Finland and the neighboring countries which will havedirect impact(or may be victimized) to secondary system scenarios This stepidentifies the location transmit power and transmission patterns of primarytransmitters
bull Primary coverage area computation mdashUsing appropriate propagationand terrain models the approximate coverage areas for DVB-T transmitterscan be estimated The coverage is calculated for each pixel(the smallest unitof geographical coverage for the assessment) across the whole country
bull Computation of permitted secondary powermdashBased on a specific regu-latory requirementfor instance ECC requirements for working in TVWS[12]the permitted secondary power can be calculated for specific secondary sys-
31
tem scenario The secondary power emission level for a single secondary useris stated in equation (34)
bull Secondary system scenariomdashThe type of secondary system scenarios af-fect the computation in our case we used cellular type secondary scenariosfor analyzing the TVWS capacity Both homogeneous cells having similarsize throughout the country and variable cells which are dependent on thepopulation are used
bull Spectrum availability estimation and assessments related to sec-ondary system scenario mdashSpectrum availability can be quantified basedon the availability metrics Using the secondary system scenarios the sec-ondary spectrum capacity can be analyzed and the relative impacts of usingdifferent secondary parameters on the primary system can be compared usingperformance curves
Figure 10 Assessment methodology flowchart
45 Implementation of Assessment Methodology
451 System modeling and coverage area computation
The assessment includes all 620 DVB-T inside Finland and 1240 TV transmitters inthe neighboring countries Unlike cellular mobile networks like GSM TV cells arerelatively large They have long co-channel reuse distanceThe propagation modelfor the primary system is ITU-R P1546 Assuming fixed reception over Ricean
32
channel the minimum field strength for 500MHz frequency is 525 dBuVm Thisminimum requirement is assumed to ensure successful reception for worst-case re-ceivers at the edge of the coverage area
The initial step for identifying the amount of available TVWS is to determine thearea that is covered by each TV transmitter using the above models This processdefines the TV channel protected contour at areas where the location probability is95 Location probability assumes the received signal from a TV transmitter in agiven area (eg a pixel) varies with lognormal distribution when changing positionin the area A pixel has a location probability of P if the (1 minus P )th percentile ofthe lognormal shadowing distribution is equal to or larger than the required signallevel
Mathematically the location probability including TV self-interference in the ab-sence of WSDs is given by
q1 = Pr
Ps ge Psmin +
Ksumi=1
rukPuk
(47)
where Prx is the probability of event x Ps is the received wanted signal powerat the TV receiverrsquos antenna connector at the considered location Psmin is theminimum TV receiver RF sensitivity in the presence of ambient noise ruk is the TVprotection ratio for the kth unwanted TV signal and Puk is the received signal powerfrom the kth interfering TV tower The presence of WSD decreases the locationprobability Regulators need to limit the maximum amount of interference fromWSD such that the maximum probability degradation is limited to 4q The newequation denoted by q2 = q1 minus4q becomes
q2 = Pr
Ps ge Psmin +
Ksumi=1
rukPuk + r(4f)GPWSDIB
(48)
with r(4f) being the TV-WSD protection ratio for frequency offset 4f G is thepath gain between the WSD location and the interfered TV receiverrsquos location andPWSDIB the in-band transmit power(EIRP) of the WSDs All the power values are in
linear domain(in Watts)
452 Secondary power computation
Using different regulatory requirements FCC or ECC rules primary protectionareas and the operating secondary power levels can be calculated
i FCCThe FCC rule sets maximum fixed allowed maximum transmit power for WSDsmdashfixed WSDs with antenna height less than 30m maximum permitted EIRPof 36dBm (which corresponds to 4 watts) while mobile ones are limited to
33
20dBm(01W) Around each TV transmitter there is a radial distance limitwhere no WSD is allowed to operate in the same channel The WSDs are alsonot allowed to operate in the first adjacent channel to occupied DTV channelonly this time the protection distance is smaller For instance a WSD havingantenna height 10m to 30m the adjacent channel protection zone is 074kmand the co-channel protection is 144km
ii ECCThe SE43 working group under CEPT allows secondary transmitters to trans-mit at different power levels based on their distance to the coverage area Thescheme calculates the maximum permitted power for a WSD at a given loca-tionmdashthe calculation is based on permitted degradation of location probabilityfor TV reception
Recalling equation (48)
q2 = Pr
Ps ge Psmin +
Ksumi=1
rukPuk + r(4f)GPWSDIB
Assuming Z = Ps minus Psmin minusKsumi=1
rukPuk in the above location probability
equation it becomes
q2 = Prr(4f)GPWSD
IB le Z
(49)
= Pr
PWSDIB le 1
r(4f)GZ
(410)
The two possible conditions are Z ge 0 in which case the signal can be easilydetected and Z lt 0 signal is weaker than the receiver sensitivity level Con-sidering these two cases the new location probability equation is derived as[34]
q2 =Prr(4f)GPWSD
IB le Z
=Pr Z lt 0PrPWSDIB le Z | Z lt 0
+ Pr
Z ge 0PrPWSD
IB le Z | Z ge 0
(411)
But according to the original assumption in equation(47)
Pr Z lt 0 = 1minus q1
P r
Ps le Psmin +
Ksumi=1
rukPuk
= 1minus q1 (412)
34
This occurs during TV outage conditions due to shadow fading or self-interferencefrom other TV stationsPWSDIB must be non-negative Therefore when Z is negative it follows thatPrPWSDIB le Z | Z lt 0
= Pr
PWSDIB lt 0
= 0
Therefore equation (411) becomes
q2 = 0 + q1PrPWSDIB le Z | Z ge 0
(413)
Lets define Z = Z forZ ge 0 and 0 for negative values of Z The new expres-sion for the q2 in logarithmic domain
q2 = q1PrPWSDIB le Z minusGminus r(4f)
(414)
where Z is in dBm G and r(4f) are in dB Finally assuming G and Z arelognormally distributed random variables the permitted WSD transmit powerthat safeguards the location probability of TV reception is[34]
PWSDIB le mZ minusmG minus r(4f)minus
radic2erfminus1(2(1minus q2
q1))radicσ2Z + σ2
G minus IM (415)
where mZ σZ mG σG denote median and standard deviation of Z and Grespectively erfminus1 is the inverse complementary error function IM - is inter-ference margin that can be set by regulators for premium safety like aggregateinterference protection2
The simplified illustration for FCC and ECC power allocation schemes acrossthe radial distance from a TV broadcast station is shown in Figure 11 In thediagram the TV coverage is intended to reach protected receivers at RTV WithFCC ruling additional radial protection distance rp must be added to allowunlicensed device ECC rule however allows unlicensed WSDs even closer toRTV but with tighter power control the more it gets nearer
453 Secondary system scenarios
The secondary system may assume any of the possible configurations like cellularpoint-to-point links etc We used square-shaped cellular secondary system designfor instance to compare the number of available channels using the FCC and ECCrulings The cells can have either fixed radius of 2km 5km and 10km that is ho-mogeneous regardless of the population gradient or a custom radius that is based
2The above equation (415) is a modified version of the original power equation suggested inECC 159 report by SE43 working group A close analysis in [34] revealed that the previous oneoverestimates the allowed secondary power for failing to account for the TV outage
35
Figure 11 Power gradient of TV signal and comparison of WSD signal power usingFCC and ECC rules
on population-density Okumura-Hata propagation model is used for estimating thesecondary system signal propagation characteristics Secondary antenna height isfixed at 30mIn the second case when the secondary cell radius is based on population density
a hierarchical three-level cellular radius was used to accommodate only 10000 usersper cell ie first the whole country is covered by a 32km radius cell Then if acell has more than 10000 users it is divided into medium-sized cells If any of themedium-sized cells contain more than 10000 users they are divided into small-sizedcells Using cellular-type analysis it is possible to account for the effect of the pri-mary system on the usability TV spectrum in a pixel When interference from theprimary system is sufficiently high able to cause secondary outage the same channelcan be assumed non-available in that pixel
Name Size Coverage [km2] Number of cells
small 1x1km 1 1744medium 4x4km 16 5459large 32x32km 1024 327
Table 7 Secondary cell sizes based on population density
454 Spectrum availability and secondary system scenario assessments
The spectrum availability assessment can be summarized in three main outputsAvailability assessment estimates the amount of TV spectrum free to use for sec-ondary access By using cellular-type secondary system model it is possible toevaluate the secondary system performance on the available spectrum Finally theassessment must evaluate the amount of interference the secondary system is caus-ing to the primary system The primary performance curves are used to show the
36
Figure 12 Cellular-type coverage layout for secondary system 10km homogeneousradius(left) and radius based on user density(right)
relative impacts of the various secondary parameters to the TV system
a Availability assessment
Using the definitions for spectrum availability (see Introduction subsection 41)the amount of harvestable spectrum can be estimatedThe spectrum availabilitymaps can be presented as color-coded illustrations (see Figure 13) to visualizethe geographical presence of the TVWS spectrum
b Secondary system performance
The outputs of this research give guidance to how cellular-type secondary sys-tems could give different parameter-specific outputs The parameters are pop-ulation density regulatory ruling(FCC or ECC) the primary system param-
37
Figure 13 Color-coded availability map (number of free TV channels)
eters(reference geometry and allowed outage probability) secondary cell sizes(homogeneous or user-density based) and parameters that affect the signal prop-agation characteristics (antenna height and interference margin) These param-eters are introduced to measure the capacity of the TVWS for a cellular-typesecondary system model - secondary capacity Figure (14) shows a color-codingmethod used to illustrate the secondary capacity of the TVWS for differentareas
c Primary system performance
Signal to noise and interference ratio curves are used to know the approximaterelative aggregate impacts of the secondary system on the TV coverage If TVreceivers at the border of the coverage area are receiving the minimum targetsignal to noise and interference ratio the remaining users are assumed to be safeHencethe estimation of aggregate secondary interference on the primary systemwas tested on selected sample points along the TV coverage area cell bordersThe plots in Figure 15 gives relative impacts of the different secondary systemon the primary for different settings for instance reference geometry homoge-neous or population density-based cellular radius and interference margin Thesecondary antenna height is set to 30m
38
Figure 14 Color-coded map for secondary capacity (average capacity per cell whensecondary cell-size varies based on population density)
Figure 15 SINR distribution at the TV cell borders at the presence of aggregatesecondary interference
39
5 Front-End Visualization
51 Introduction
Data mdashwhich may be a byproduct of research gathering discovery or even creationis a raw material for communication but less adequate for a meaningful communica-tion Data must be organized and presented in some order to acquire informationalvalue[44]
It is worthwhile to explain the famous DIKW(Digital Information Knowledgeand Wisdom) hierarchy shown in Figure 16 mostly used in the Knowledge Man-agement and Information Science domains Data is turned into information bypresenting it in understandable arrangement whether it is a visual or auditory oneUnless data is translated into information the user finds it difficult to comprehendthe meaning of the data at hand Knowledge however is related to experience
Figure 16 The Continuum of Understanding[46]
acquired from static information and it depends on the perspectives of the learnerKnowledge is obtained by interacting with others or with tools to acquire the pat-terns and the meanings included in their information Variations of experiences givea learner different types of knowledge which eventually affect the personrsquos point ofview or thought Local knowledge can be acquired by a few people having similarexperiences of the same thing but general knowledge depends on high level sharedexperiences by many people of a certain discipline The ultimate understanding ofpatterns or experiences created by organized data finally becomes wisdom We canshare those experiences that are the knowledge units to create wisdom mdashin other
40
words wisdom can be communicated with more contextual perspective and deepunderstanding[44][46]
When it comes to human-machine interaction we have accumulated a set of commonexperiences with the conventional Graphical User Interfaces(GUIs) GUIs enablepresentation of data by exposing the user to interact with graphic art forms andobjects Effective GUI delivers organized data (information) to users It invites theusers to new interactions with forms and structures that eventually will pile up ontheir existing experiences and become a new knowledge to edify their wisdom In-teractive GUI design is a narration design that is intended to replace the mechanicalmodel with our linguistic model[44]
Computers are being used in most of our daily activities including communicationWith the increasing connectivity of devices and services to the Internet they arebecoming more valuable than ever The Internet is making information access moreubiquitous more fast and cheaper The creation and development of the WorldWide Web (WWW) in the last three decades increased the pace of data sharingamong users regardless of the devices involved The peripheral devices to accessmany services whether it is in a remote server or a local machine involve interactionwith GUIs To ensure that a GUI is full of meaningful and informative experienceit is highly recommended to comply with certain design standards
52 Graphical User Interface Design Guidelines
The design of GUI involves the consideration of the perceptual and cognitive psy-chology of the users of a system A user interface design should consider at leasthow people perceive learn remember and convert patterns into action Most ofthese topics are in fact associated with human psychology[47]
When it is our first time to perform an activity we do it in very controlled andconscious way but with training it becomes more and more automatic Activi-ties like riding a bicycle typing with keyboard writingetc are started as a moreconscious and non-automatic and become less conscious and automatic ones whenwe are trained over time The progression time from controlled to automatic hasa significant implication for GUI designs mdashhow can we design a user interface sothat it takes less time to train users to become less-conscious automatic users Thegoals of efficient user interface design is to enable faster understanding of the systemfunctionalities by the users to the point of becoming automatic without taxing muchcognitive energy
When we are accustomed to a visual interface we become less strained and more ofcontext-free Context-free recognition is a cognitive technique by our brain trying toidentify visual graphics from simple to complex patterns It may be line segments
41
buttons graphic images or forms that can be combined to form a whole visual mean-ing On the contrary unskilled users prefer using context-based top-down approacha recognition which involves understanding based on context The reader may startfrom whole paragraph down to objects words and characters This kind of visualsystem starts recognition from complex patterns or by knowing the meaning of thetext (that may be the sequence of events in a user interface) in advance it then usesthat knowledge to identify or guess the contents of those patterns[47]
Poor information design impedes experienced usersrsquo automatic context-free recogni-tion compelling them to resort to a conscious and context-based usage ie increasedburden limited speed and comprehension There are many rule of thumb tips fordesigning a user interface to make it more context-free recognizable It is highly rec-ommended to avoid using unfamiliar vocabulary and script typefaces mdashnot commonin the computer world small fonts noisy background less organized text-alignmenttoo much unnecessary text or any additional features that may disrupt the auto-matic perception of a user interface [47] If the user interface is web-based it shouldalso consider the loading time the background color of the page and accessibilityissuesmdashtoo much background script codes may sometimes freeze browsers
A user-centric interface design considers data organization and classification to makeit easily understandable by its users The information arrangement could be donebased on data sources relationships between each data position and time Theorganization of information affects the way it is understood[44] This organizationhowever should not challenge the users memory requirements Most people donrsquotkeep detail information in memory other than those their goals made them pay at-tention In fact many people prefer seeing and recognizing things to recalling them[47] A User Interface should avoid requiring too much information memorizationmdashit could provide some guidance to users for instance by adding some modeslisting alternatives in drop-down auto-fill methods and other means
Another method might be making the visualization tool task-focused simple andconsistent It is good the designer perform task analysis and design task-focused con-ceptual model before actually designing the user interface and strictly follow thosetargets set in the conceptual model The following issues may be very important toconsider
bull What is the tool intended for
bull What goals may users expect
bull Who are the target users
bull Any guidance to main tasks without causing an error
bull Steps to do a task comprehensible terminology associated risks etc
This helps designers to eliminate the gap between the user goals and the actualfeatures on the visual interface If users perceive the visual tools are not directly
42
Figure 17 Visualization tools for assisting users to memorize(drop-down list autocomplete pop ups and radio buttons)
related their goals they will pay less attention to them The gap between the needsof the user and the functionalities of the tool determines the learning time Whenthe tool works their intended tasks easily without expending too much cognitiveeffort automatic use can be achieved quickly
In summary a user interface design is recommended to be consistent and its ter-minology usage to comply with that of the day to day softwares User-centric UIschallenge our recognition rather than our recalling capacity ie minimizing short-term memory load The visual interface can use an online documentation and helpfor assisting users
53 Requirements Analysis
There are many undergoing researches including EU FP7 QUASAR project [19]doing quantitative assessment of the available white space for opportunistic sec-ondary access Oftentimes the academic community is required to provide directanswers to questions such as
bull How much TV white space is there
bull How much of it is harvestable
bull How much cumulative and average secondary data rate can be supported inthe TV white space across different geographical locations
bull What is the relative impact of the secondary usage on the primary systemunder various parameters
By using the ECC and FCC guidelines we have analyzed the availability ofTVWS in the existing DVB-T system in the whole Finland The outputs of ourresearch are arrays of quantitative capacity maps(Figure 18) and signal to noise and
43
interference ratio (SINR) values obtained by varying multiple parameters mdashhelpfulfor comparative analysis It is required to make the capacity maps and SINR plotsbrowser accessible Technically we need three fundamental features map servicesbrowser-based plotting technologies and the capability of comparative visualization
Figure 18 Examples of quantitative capacity maps(available channels user densitybased capacity per cell capacity per area of 2km and 5km radius respectively)
531 Web-based Visualization Technologies
HyperText Markup Language(HTML) is markup language for creating content forinformation provided on the World Wide Web (the Web) Markup languages usetheir own syntax to differentiate content from annotation HTML has limited capa-bility to influence the appearance of the document on the browser instead CascadingStyle Sheets(CSS) can be used as a method for modifying presentation semantics(the look and feel) of HTML documents CSS works by separating content fromweb page structure It is used as a stylistic guideline to modify the format of thepresentation
There are various free map service providers to visualize the capacity plots GoogleMaps Bing Maps OpenStreetMap WikiMapia Nokia Maps and others We choseGoogle Maps for its customizable web-based visualization experience Google Mapsprovides its own Google Maps API(Application Package Interface) that can be usedto embed the mapping service on non-commercial third party websites
Google Maps API uses Javascript technology which is a scripting language (lightweightprogramming language) very well compatible for most browsers Apart from be-coming a scripting language of choice in Google Maps environment Javascript is
44
very popular tool in dynamic web-based applications The World Wide Web Con-sortium(W3C) standard known as Document Object Model (DOM) is a language-neutral interface that allows scripting languages like Javascript to dynamically accessand update the content structure and style of HTML documents Javascript usesan API for browsers called XMLHttpRequest to submit request to web-servers andto load server-side files to the browser For the SINR plotting functionality we canmake use of XMLHttpRequest protocol and any of the Javascript plotting librariesspecifically we used a library named as flot Moreover Javascript is executed inthe browsers without preliminary compilation this has greatly eased its portabilityacross different systems
The combination of HTML CSS and Javascript allows a very flexible web-based GUIvisualization An HTML document presented by the three technologies is namedas Dynamic HTML (DHTML) DHTML enables faster content fetching from serverwithout the need of refreshing the page It is the main tool in dynamic web format-ting and visualization
One other alternative to DHTML is Java applet which can offer a more dy-
Figure 19 Client-server communication
namic client-side GUI They have an advantage of giving the programmer morecontrol of the UI and with capability of handling computation intensive visualiza-tions Java applets run in a web browser using Java Virtual Machine(JVM) aplatform-independent code execution component for Java codes However appletsare with many limitations Firstly the user must have JVM enabled browser Sec-ondly they are restricted by many security issues in the face of malicious intents
45
using applets they work under security sandbox model Besides these applets lackthe flexibility of dealing with on-line map services
54 Spectrum Availability Assessment Tool Architecture
As discussed in the above sectionthe main goal of the Spectrum Availability As-sessment Tool is to visualize the findings of the undergoing research in TVWS forFinland The architecture shown in Figure 20 represents the theoretical model forrealizing our technical requirements The back-end computation takes populationand TV broadcast data as inputs By using the appropriate propagation modelsand relevant parameters the computational outputs are stored in a web server Theweb server can be accessed by any of the latest browsers Mozilla Firefox Rcopy InternetExplorer Rcopy Google Chrome Rcopy and others
Figure 20 Theoretical model of spectrum assessment visualization tool architecture
55 Implementation of Assessment Tool
There are few practical problems to implement the theoretical model The majorone being the time requirement it takes too much time to generate any of the re-quired outputs (roughly 05 - 3hrs) so that real time interaction is almost impossibleNormally this is also a big hurdle to stand-alone applications Secondly it needstougher bandwidth requirement that is able to transport many gigabytes of DVB-Tbroadcast and population data in only few minutes The direct implication is thatwe can not make a timely browser-side computation These limitations ultimately
46
demand the computation to be server-side and can not be real-time one
Consequently a new model have to be implemented mdashshown in Figure 21 Thenew approach uses ready outputs that are pre-calculated and stored in a databaseserver Practically the need of the database can be compromised based on the datasize(number of generated values) and the features needed at the front end - browserbased access In this scheme everything is calculated ahead This gives a greatlevel of flexibility to use either a server-side or browser-side mechanism to access thedata The model in Figure 21 uses browser-side scripting languages to fetch datafrom the web-server
Figure 21 Spectrum assessment visualization tool architecture practical model
47
6 Spectrum Availability Assessment Tool Fin-
land Case Study
61 Introduction
Finland is located in 64N latitude and 26E longitude Finland is a sparsely popu-lated country with average population density of 177 per square km and a total areaof 338145 square km out of which more than 10 is covered with water Finlandhas population exceeding 526 million (estimate for 2012) Most of the populationlives in the southern part of the country (more than 1 million residents live in theHelsinki Metropolitan Area alone)[49]
Figure 22 Population density of Finland
As discussed in the previous two chapters Spectrum Availability Assessment Tool isa web-based visualization tool for a time-intensive back-end computational processThe outputs of the computation are spectrum availability maps capacity maps for
48
cellular-type secondary system and TV SINR plots that show the relative impact ofthe different secondary system parameters on the primary system
The tool can be accessed on the web by using a universal resource locater (URL)address URL is a specific character string (in our case httpquasarnetlabhutfi)that constitutes a reference to web server The content is hosted in Apache HTTPServer Apache is an open source(allows access to the source code modificationand free redistribution) web server Web servers are softwares that serve requestsfrom browsers by organizing content residing in themmdashthey only serve requests andhence they remain in listening mode until they receive them The requests are sentfrom browsers to web servers using the URL addresses
Figure 23 Graphical User Interface of Spectrum Availability Assessment Tool
62 GUI Controls
The GUI controls are the tools to customize the visualization of Spectrum AvailabilityAssessment Tool The map zooming and panning (part of the Google maps module)
49
are used to pinpoint into places with better resolution The Opacity control enablesidentification of geographic places on the Google maps by adjusting the transparencyof the capacityavailability maps on the Google maps
Figure 24 GUI controls
63 Terminology and definitions
The definition of terms used in the GUI
bull Protection Distance - the minimum radial distance between a secondary trans-mitter and an intended TV receiver operating on the same channel
bull Adjacent Channel refers to the minimum separation between the primary re-ceiver and the secondary transmitter working in adjacent channel it is alsoknown as Reference Geometry
bull TV outage - target outage probability at the TV coverage area border in thepresence of secondary transmitter
bull Fixed Radius refers to the homogeneity of cellular radius of the secondarysystem across the country It can have constant values of 2km 5km or 10km
bull Based on user density - the cellular radius of the secondary system is dependenton population density The secondary cells can have radius of 05km for denselypopulated urban areas 2km for suburban areas having medium populationdensity and 16km for sparsely populated rural areas
50
bull Protection Margin - the extra power margin added in the calculation of poweremission level for a secondary device for protecting the primary system fromharmful interference It includes the safety margin SM and the aggregatesecondary system interference MI Refer equation (34)
bull Antenna Height - the height of secondary device above average terrain level
bull Available Channels - the number of free TV channels in a specific geographiclocation (on a map)
bull Capacity per Area - the secondary capacity (data rate) on the available chan-nels when homogeneous cellular size is used across the country
bull Capacity per Cell - the average capacity in the TVWS available to the wholesecondary cell when the cell-size is based on population density
bull Capacity per User - the average capacity of the TVWS available to each user ina cell It is obtained by dividing the Capacity per Cell to the average numberof users in a cell
64 Introducing the tool - brief demonstration
When the user requests the URL address httpquasarnetlabhutfi the web-basedgraphical interface shown in Figure 23 appears The graphical user interface con-tains mainly three areas(panels) The left-most panel includes the main menu(ECCRules and FCC Rules) for selecting the analysis scheme The middle area housesthe Google mapsupon which the capacity and availability maps are overlying Theright panel includes the legend (color bars for referencing the capacity and availabil-ity maps)
In the ECC Rules sub-menu the user can set TV parameters like Protection Dis-tance Adjacent Channel and TV Outage Since ECC ruling is based on power-levelcontrol the Protection Distance is 0kmIn the Secondary Parameters panel the user can set the Secondary Cell Sizesmdashtwooptions are the homogeneous Fixed radius scheme of 2km 5km or 10km and theBased on user density which relies on population density to resize the radius of thesecondary cell The Protection Margin and secondary Antenna Height are used toset the Transmission Parameters
641 Visualization on the map
The Plots field contains the collection of buttons that are used to display the avail-ability and capacity maps on the Google maps
1 Plotting available channelsTo plot the available channels the user should select the Protection Distanceoptions and click the Available Channels button See Figure (29)
51
2 Capacity per areaThe necessary settings for plotting the capacity per area are the AdjacentChannel option the secondary cell size scheme should be set to be Fixed andthe Protection Margin As a result of the combinations of these parameters(Figure 25) the user can get many plots
Figure 25 Plotting available channels and capacity per area
3 Capacity per Cell and Capacity per UserThe Capacity per cell and Capacity per user are calculated for Based on userdensity option When the Based on user density radio button is selected theCapacity per Cell and Capacity per User buttons are highlighted Thereforethe user is automatically prompted about the button groups that refer to Fixedand the Based on user density secondary cell-size options
642 SINR Comparison and Plotting Utilities
Spectrum Availability Assessment Tool gives comparative insight into the secondaryparameters affecting the TV system The user can select the secondary parametersfor comparing the impact of the secondary system on selected boundary test pointson the primary coverage particularly the SINR of the primary curves is plotted forcomparison
52
To plot multiple SINR parameters
bull Select the plotting parameters(Adjacent Channel Secondary Cell Size andProtection Margin) shown in Figure 26
bull Click Add to SINR Plot to add the parameter combination to plotting list
bull Check the parameters combinations from the plotting list and click Plot Se-lections Clear All Selections clears the plotting list The plot appears in newwindow as shown in Figure 28
53
Figure 26 SINR plotting parameters
54
Figure 27 Comparison of primary performance under different parameters
Figure 28 Secondary capacity under different parameters
55
Figure 29 Available channels in Finland using ECC rules
56
Figure 30 Capacity per cell for 100m reference geometry
57
7 Conclusion
The increasing immensity of the data volume created everyday and the convergingtrend towards more ubiquitous network connectivity is posing new challenges to thewireless industry Regulators are already introducing flexible methods of spectrumaccess to promote investment in new technologies that are spectrally efficient
In this thesis an integrated spectrum availability assessment tool for TVWS isdeveloped for Finland The tool visualizes the outputs of the TVWS quantitativeassessment research which works for identifying the amount of spectrum that isusable for opportunistic secondary access The Spectrum Availability AssessmentTool is browser-accessible interface for a back-end computational process The toolis developed based on the philosophy of giving prompt and interactive reply to im-mediate questions related to TVWS such as the amount and the spatial distributionof available spectrum and its capacity to support secondary services
The pre-calculated dataset and graphic-contents are used to compare the availabilityof the TVWS for variety of parameters The parameters include TVWS regulatoryrules protection margin secondary antenna height and cell radius for cellular-typesecondary system model By introducing these parameters the relative impact ofthe secondary network on the primary system is estimated
Spectrum Availability Assessment Tool has a graphical user interface designed tominimize the learning-time for technical users The tool enables selection of dif-ferent technical parameters and it has user interface controls for customizing thevisualization of capacity and availability maps for TVWS The tool has plottingutilities for comparing the impacts of secondary parameters on primary system
On account of the intensive time requirements of the back-end computation thistool is developed using pre-calculated dataset This made the tool more flexibleweb-friendly as compared to the real-time processing
Currently Spectrum Availability Assessment Tool uses many single-tile capacityand availability maps In the future the tool can be extended to use multiple tilesper map each having different geographic precision and displayable based on thezoom-level When zoom-level is increasing different set of map-tiles computed withmore precise geographic information can be loaded This method makes it easy tovisualize cities and localities having special significance with respect to spectrummanagement Although the assessment may require detail geographic and popu-lation data it is possible to produce even more reliable TVWS spectrum analyzerusing this method
58
References
[1] D Cabric ldquoCognitive radios System design perspectiverdquo PhD dissertationUniversity of California Berkeley 2007
[2] Staple Gregory and Kevin Werbach rdquoThe End of Spectrum Scarcity -IEEE Spectrumrdquo IEEE Spectrum Technology Engineering and ScienceNews Web 23 Dec 2011 lthttpspectrumieeeorgtelecomwirelessthe-end-of-spectrum-scarcitygt
[3] J Yang ldquoSpatial channel characterization for cognitive radiosrdquo Masters thesisUniversity of California Berkeley 2004
[4] Mischa SchwartzHISTORY OF COMMUNICATIONS IMPROVING THENOISE PERFORMANCE OF COMMUNICATION SYSTEMS RADIO ANDTELEPHONY DEVELOPMENTS OF THE 1920S IEEE CommunicationsMagazine December 2009
[5] C Santivanez R Ramanathan C PartridgeR Krishnan M Condell SPolit ldquoOpportunistic Spectrum Access Challenges Architecture ProtocolsrdquoProceedings of the 2nd Annual International Wireless Internet Conference(WICON) August 2006 Boston MA lthttpwwwirbbncom~ramanathpdfosa-wicon06pdfgt
[6] Alexander M Wyglinski Maziar Nekovee and Y Thomas Hou CognitiveRadio Communications and Networks Principles and Practice BurlingtonMA Academic 2010
[7] I Mitola J and J Maguire GQ ldquoCognitive radio making software radiosmore personalrdquo IEEE Commun Mag vol 6 no 4 pp 13-18 1999
[8] 3GPP ldquo3GPP - About 3GPPrdquo Web 10 July 2012 lthttpwww3gpporgAbout-3GPPgt
[9] ldquoRobust Demand for Mobile Phone Services Will Continue UN Agency Pre-dictsrdquo Welcome to the United Nations Itrsquos Your World 10 Feb 2010 Web28 Nov 2011lthttpwwwunorgappsnewsstoryaspNewsID=33770gt
[10] FCC rdquoFrom the FCC LabReport On Trends in Wireless DevicesrdquoJanuary2011lthttptransitionfccgovoetinfodocumentsreportswirelessdevicespdfgt
[11] Ofcom ldquoImplementing geolocation rdquo November 2009 lthttpstakeholdersofcomorgukbinariesconsultationsgeolocation
summarygeolocationpdfgt
[12] ECC rdquoReport 159 Technical and Operational Requirements for the PossibleOperation of Cognitive Radio Systems in the rsquoWhite Spacesrsquo of the FrequencyBand 470-790 MHzrdquoSeptember 2010
59
[13] ITU The Digital Dividend Web 12 July 2012 lthttpwwwituintnetitunewsissues20100127aspxgt
[14] Australian Communications and Media Authority Register of Radiocommuni-cation Licences Web 12 July 2012 lthttpwebacmagovauplsradcomspectrum_auctionresultspCAT=520gt
[15] Cristian Gomezspectrum and mobile broadband the progress of global harmon-isation May 2012 Web 12 July 2012 lthttpwwwituintITU-Dtechevents2012Broadcasting_CTU_CBU_Barbados_May12Presentations15_
BroadbandMobileServicesAdd_FRancypdfgt
[16] RJantti J Kerttula K Koufos K Ruttik Aggregate interference with FCCand ECC white space usage rules case study in Finland IEEE InternationalSymposium on New Frontiers in Dynamic Spectrum Access Networks DySPAN2011 April 2010
[17] Joseph W Mwangoka Paulo MarquesJonathan Rodriguez Exploiting TVWhite Spaces in Europe The COGEU Approach IEEE International Sym-posium on Dynamic Spectrum Access Networks DySPAN 2011 May 2011
[18] OrsquoConnor RA ldquoUnderstanding televisionrsquos grade A and grade B servicecontoursrdquo Broadcasting IEEE Transactions on vol47 no3 pp309-314 Sep2001
[19] QUASAR ICT-248303 Regulatory Feasibility AssessmentDecember 2010Web 26 Dec 2011 lthttpwwwquasarspectrumeuimagesstoriesDocumentsdeliverablesQUASAR-D12pdfgt
[20] European Commission ldquoDIRECTIVE OF THE EUROPEAN PARLIA-MENT AND OF THE COUNCIL on a common regulatory frame-work for electronic communications networks and servicerdquo August2000 lthttpeceuropaeuarchivesISPOinfosoctelecompolicyreview99com2000-393enpdfgt
[21] FICORAldquoEXPLANATORY MEMORANDUM REGULATION ON 2500-2690MHZ SPECTRUM AUCTIONrdquo September 2009 lthttpwwwficorafiattachmentsenglantiav5jXIir75tMPS60englishpdfgt
[22] Nekovee M ldquoCurrent Trends in Regulation of Secondary Access to TV WhiteSpaces Using Cognitive Radiordquo Global Telecommunications Conference Dec2011
[23] Harrison K Mishra SM and Sahai A ldquoHow Much White-Space CapacityIs Thererdquo New Frontiers in Dynamic Spectrum 2010 IEEE Symposium on(DySPAN 2010) April 2010
[24] J G Proakis Digital Communications 3rd ed New York McGrawHill 199
60
[25] United States General Accounting Office Report to Congressional RequesterSPECTRUM MANAGEMENT Better Knowledge Needed to Take Advantage ofTechnologies That May Improve Spectrum Efficiency May 2004 Web 20 Dec2011 lthttpwwwgaogovnewitemsd04666pdfgt
[26] FCC-10-174 In the Matter of Unlicensed Operation in the TV Broad-cast BandsSECOND MEMORANDUM OPINION AND ORDER Septem-ber 2010lthttptransitionfccgovDaily_ReleasesDaily_Business2010db0923FCC-10-174A1pdf gt
[27] Finnish Ministry of Transport and Communications Switchover to All-Digital Television Final Report of Monitoring Group Helsinki 2008lthttpeceuropaeuinformation_societypolicyecommdoccurrentbroadcastingswitchoverfi_fin_rep_monit_grppdf gt
[28] Maziar NekoveeA Survey of Cognitive Radio Access to TV WhiteSpaces International Journal of Digital Multimedia Broadcasting Vol-ume 2010 lthttpwwwquasarspectrumeuimagesstoriesDocumentspublicationsNekovee_journal2010pdfgt
[29] FCCSpectrum Policy Task Force - ReportNovember 2002 lthttphraunfossfccgovedocs_publicattachmatchDOC-228542A1pdfgt
[30] ITU RECOMMENDATION ITU-R P1546-3 Method for point-to-area pre-dictions for terrestrial services in the frequency range 30 MHz to 3000MHz2001-2007
[31] NTIA The ITS Irregular Terrain Model Version 122 The Algorithm lthttpflattopitsbldrdocgovitmitm_algpdfgt
[32] Shuttle radar topograph mission (SRTM) lthttpwww2jplnasagovsrtmgt
[33] CEPT Report 24 Technical considerations regarding harmonisation optionsfor the Digital Dividend A preliminary assessment of the feasibility of fittingnewfuture applicationsservices into non-harmonised spectrum of the digitaldividend (namely the so-called rdquowhite spacesrdquo between allotments) lthttpwwwerodocdbdkdocsdoc98officialpdfCEPTRep024pdfgt
[34] Lei Shi Ki Won Sung and Jens ZanderOn the Permissible Transmit Power forSecondary User in TV White Spaces in Proc IEEE CrownCom 2012
[35] Uwe Ladebusche Claudia A LissTerrestrial DVB (DVB-T) A BroadcastTechnology for Stationary Portable and Mobile Use Proceedings of the IEEEVol94 NO1 Jan 2006 lthttpwwwerodocdbdkdocsdoc98officialpdfCEPTRep024pdfgt
61
[36] H A Harms L M Davis and J Palmer Understanding the signal structurein DVB-T signals for passive radar detection in Proc of 2010 IEEE RadarConference Washington DC USA May 2010 lthttpwwwprincetonedu
~hharmspassive_radar_harmspdfgt
[37] ETSI Digital Video Broadcasting (DVB) Framing structure chan-nel coding and modulation for digital terrestrial television 2009lthttpwwwetsiorgdeliveretsi_en300700_300799300744010601_60en_300744v010601ppdfgt
[38] Andrea Goldsmith Wireless Communication (p25) Cambridge Uni-versity Press 2005 Web 1 Mar 2012 lthttpfacultiessbuacir~m_hosseinifilesWIRELESS20COMMUNICATIONS[2]pdfgtlthttpwwwetsiorgdeliveretsi_en300700_300799300744010601_60en_300744v010601ppdfgt
[39] QUASAR ICT-248303 Methodology for assessing secondary spectrumusage opportunities - final report December 2010 Web 1 Mar 2012lthttpquasarspectrumeuimagesstoriesDocumentsdeliverablesQUASAR_D22pdfgt
[40] QUASAR ICT-248303 Initial report on the tolerance of legacy systemsto transmissions of secondary users based on legacy specifications Decem-ber 2010 Web 1 Mar 2012 lthttpquasarspectrumeuimagesstoriesDocumentsdeliverablesQUASAR_D31pdfgt
[41] Kate Harrison Cognitive radios in the TV whitespaces challengesand opportunities EECS Department University of California Berke-ley Dec 16 2011 lthttpwwweecsberkeleyeduPubsTechRpts2011EECS-2011-151pdfgt
[42] Hamid Reza KarimiGeolocation databases for white space devices in the UHFTV bands Specification of maximum permitted emission levels IEEE Inter-national Symposium on Dynamic Spectrum Access Networks (DySPAN) 2011
[43] QUASAR ICT-248303 Model integration and spectrum assessment methodol-ogy March 2011 Web 1 Mar 2012 lthttpquasarspectrumeuimagesstoriesDocumentsdeliverablesQUASAR_D51pdfgt
[44] Fei Hu Lixia JildquoGUI design From information architecture to interactiveexperiencerdquo Computer-Aided Industrial Design and Conceptual Design 2008CAIDCD 2008 9th International Conference pp913-917 Nov 2008
[45] Jonathan Hey The Data Information Knowledge Wisdom Chain TheMetaphorical link December 2004
[46] Clark DrdquoUnderstanding and Performancerdquo Talent amp Performance 2004Web 06 Feb 2012 lthttpwwwnwlinkcom~donclarkperformanceunderstandinghtmlgt
62
[47] Jeff Johnson Designing with the Mind in Mind Simple Guide to UnderstandingUser Interface Design Rules Burlington Morgan Kaufmann Publishers 2010
[48] Apache Software Foundation Apache HTTP Server Documentation Ver-sion 22 October 2009 lthttpwwwapacheorgdisthttpddocshttpd-docs-2214enpdfgt
[49] CIA - The World Factbook Feb 2012 Web 07 Mar 2012lthttpswwwciagovlibrarypublicationsthe-world-factbookgeosfihtmlgt
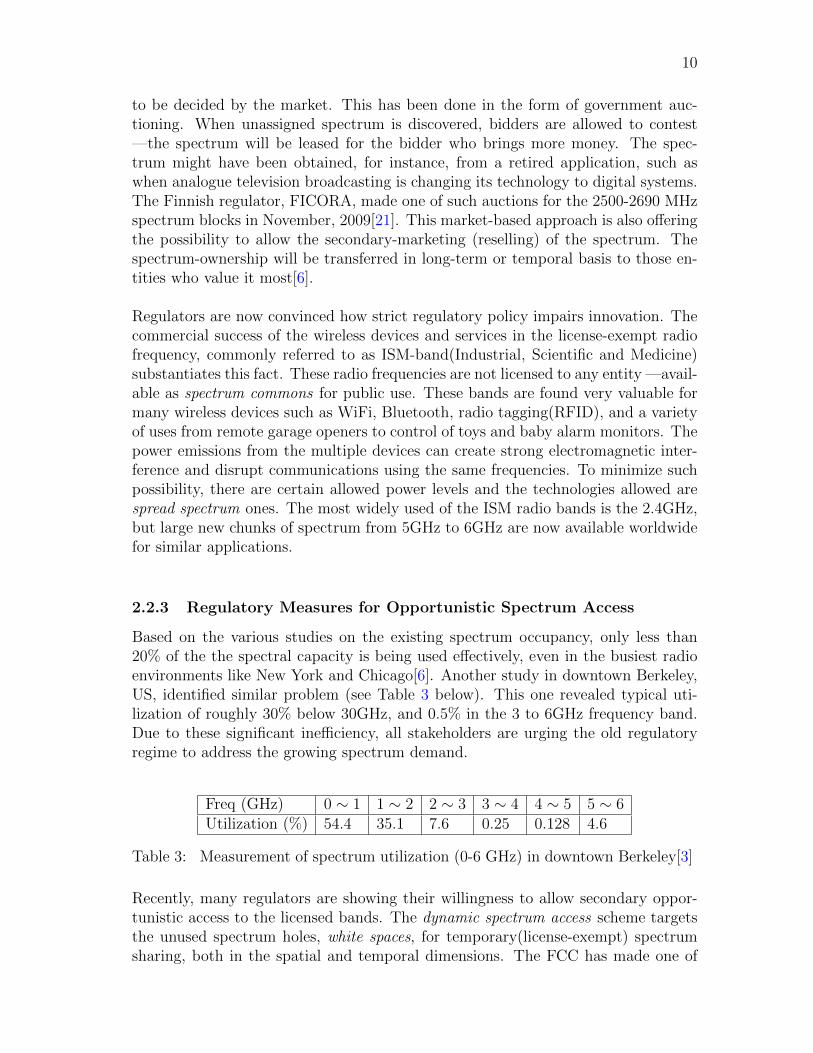
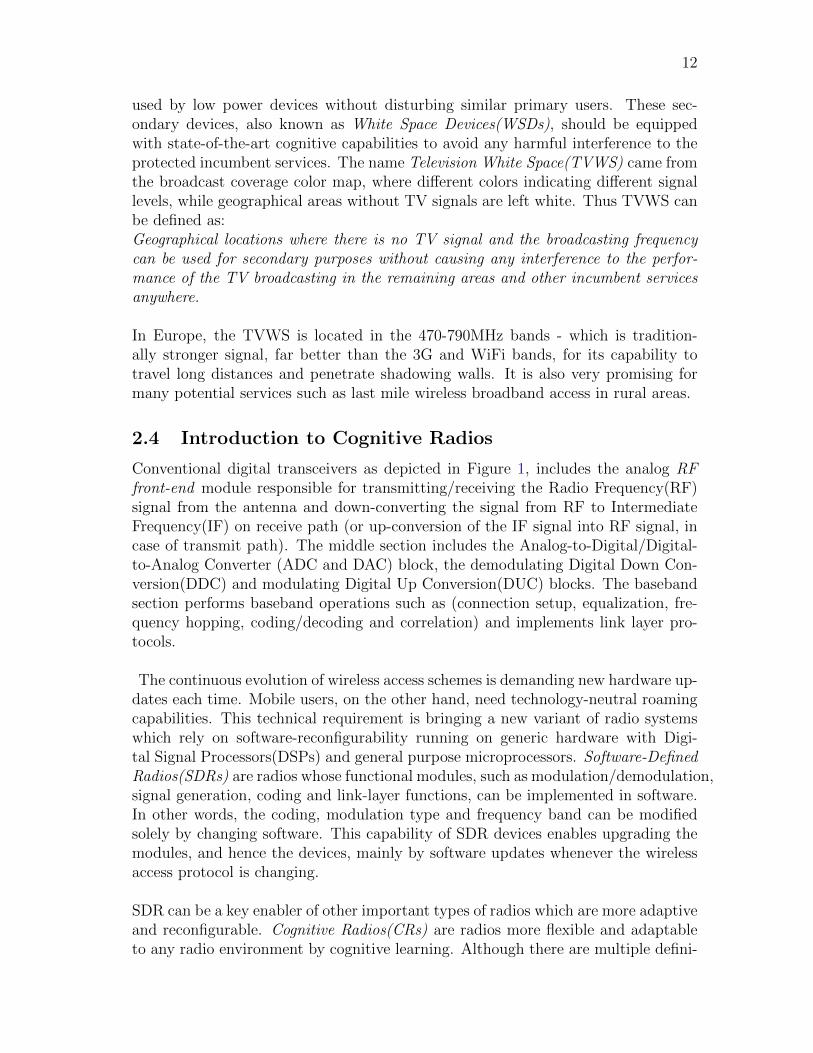
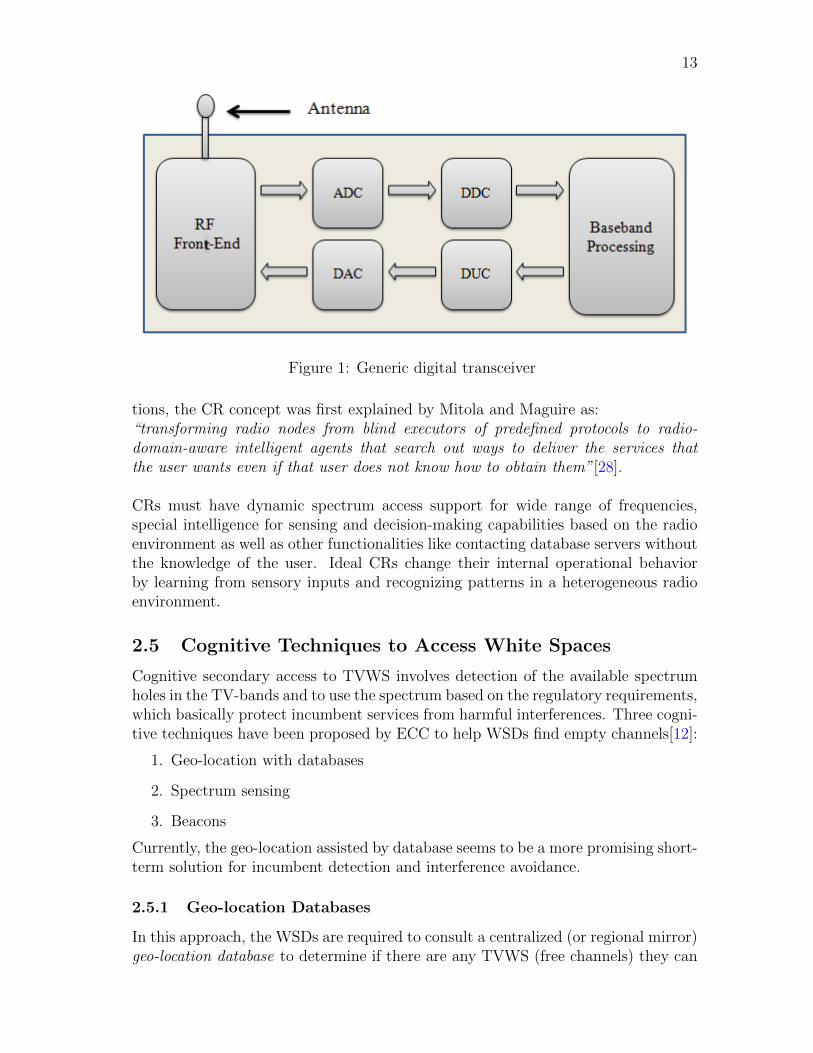
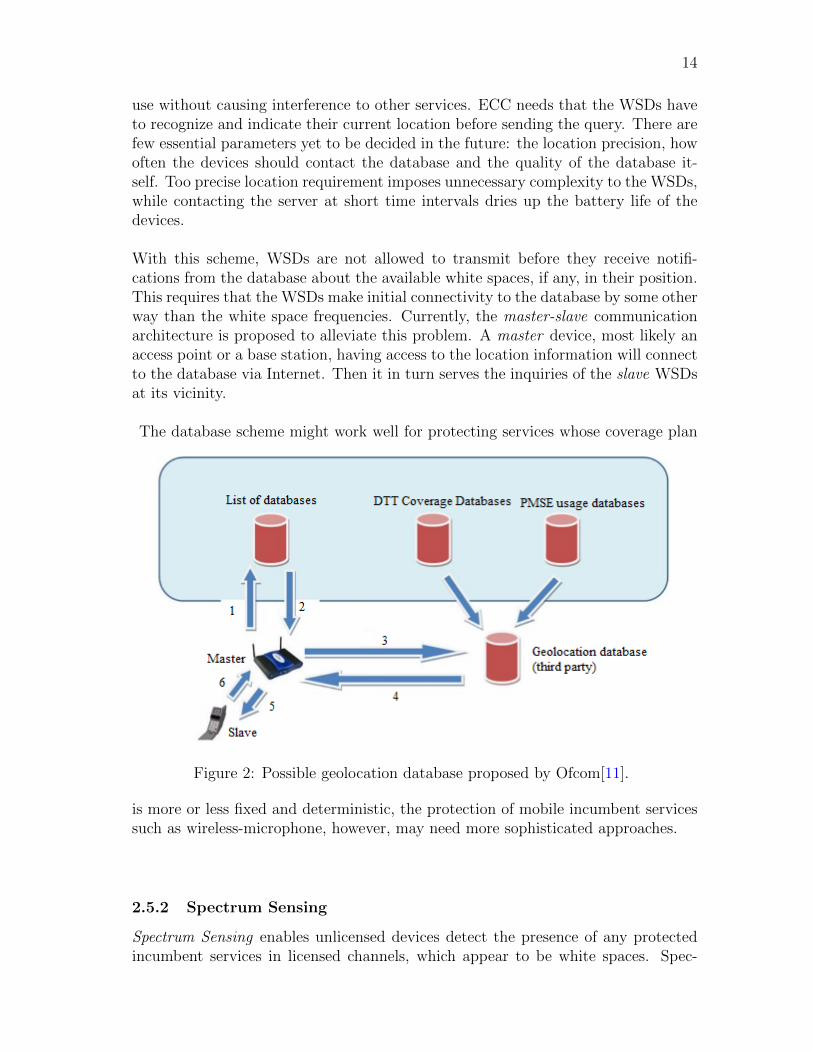
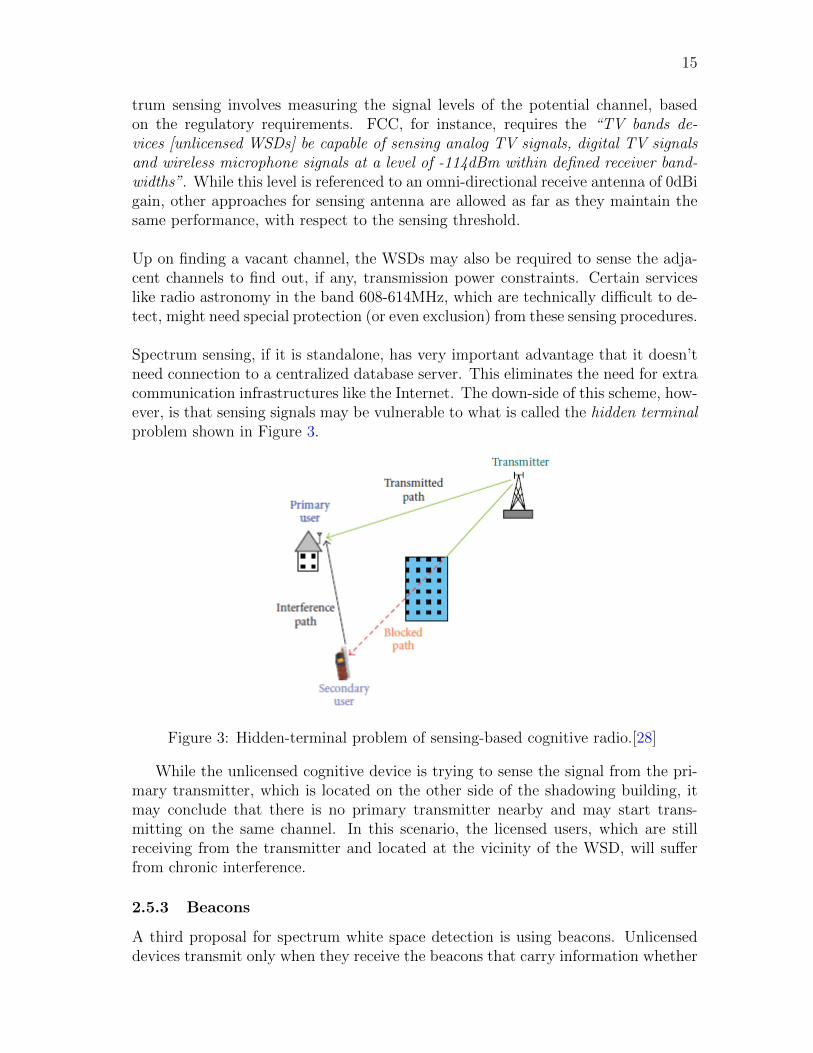
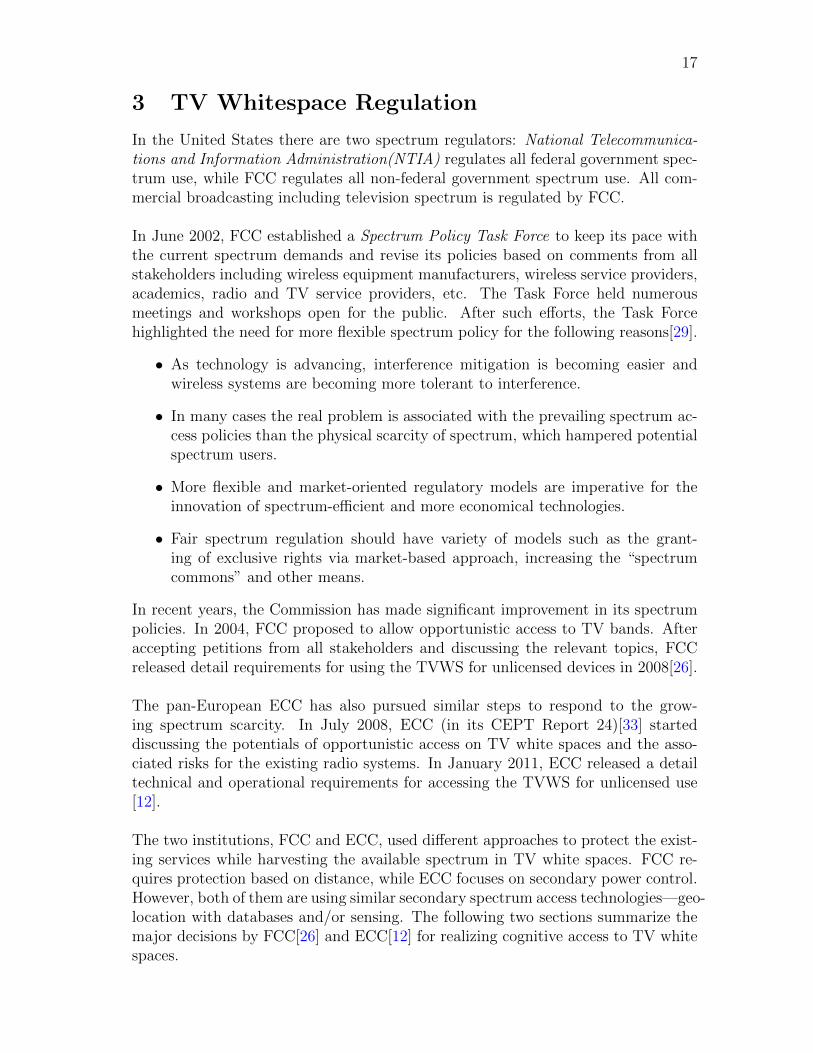
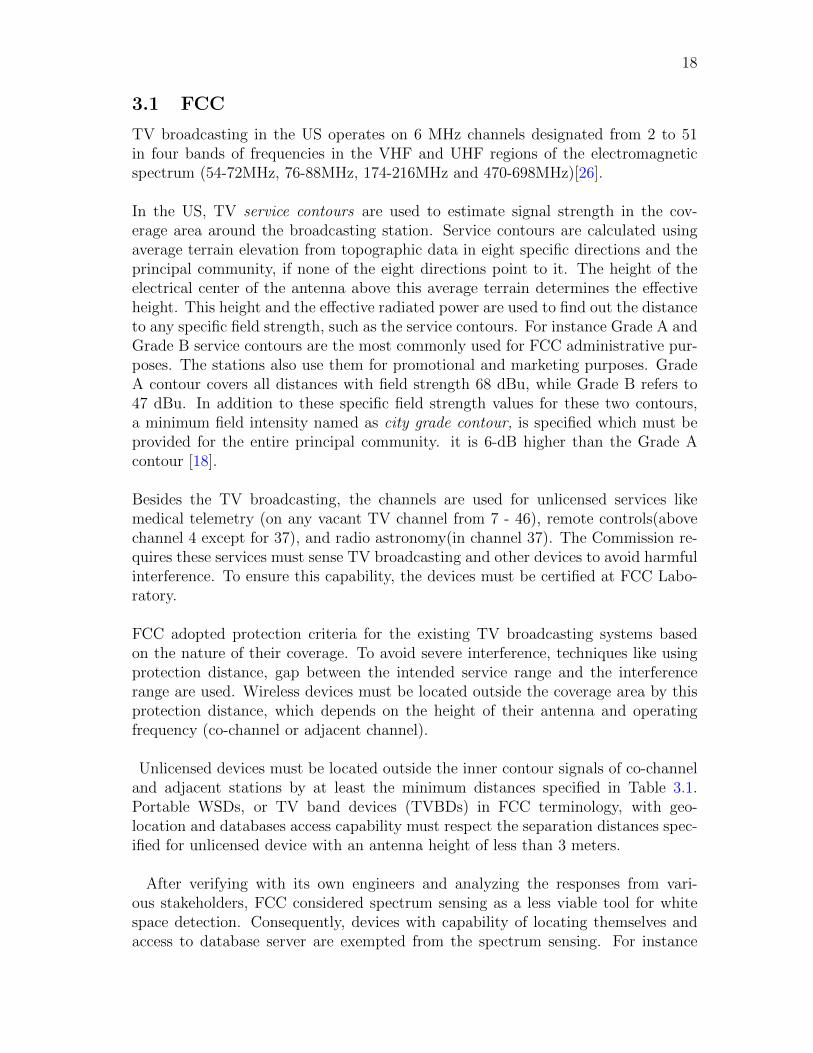
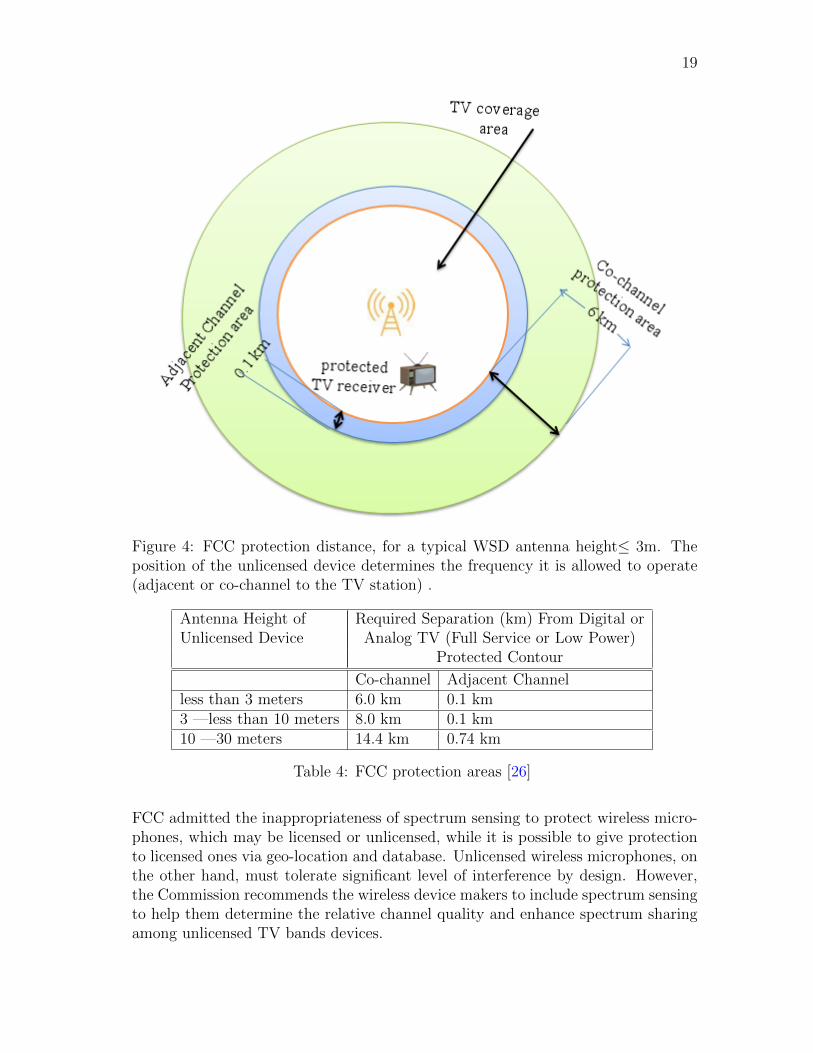
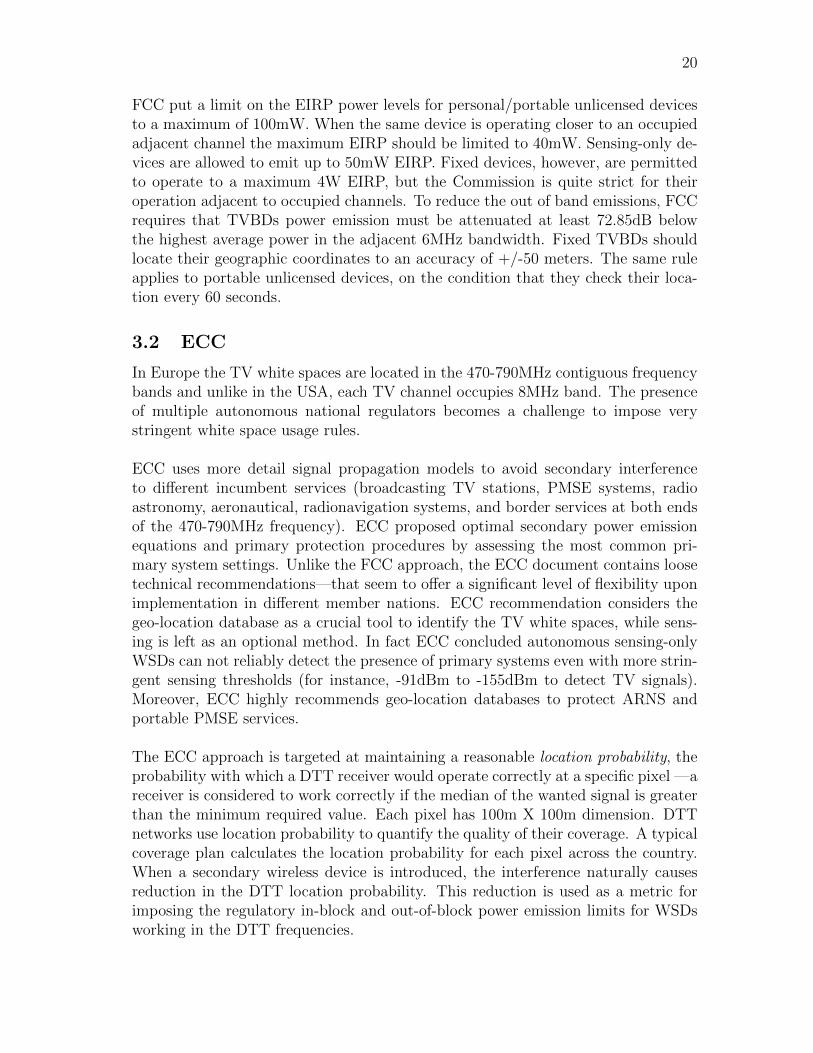
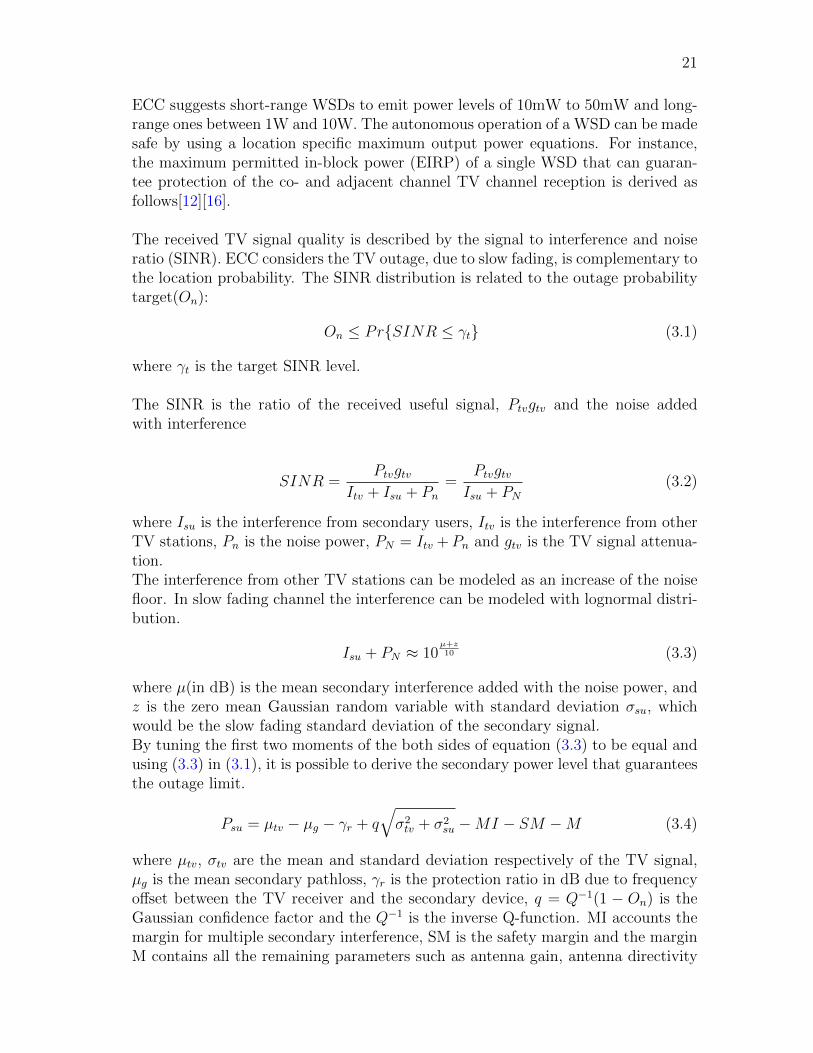
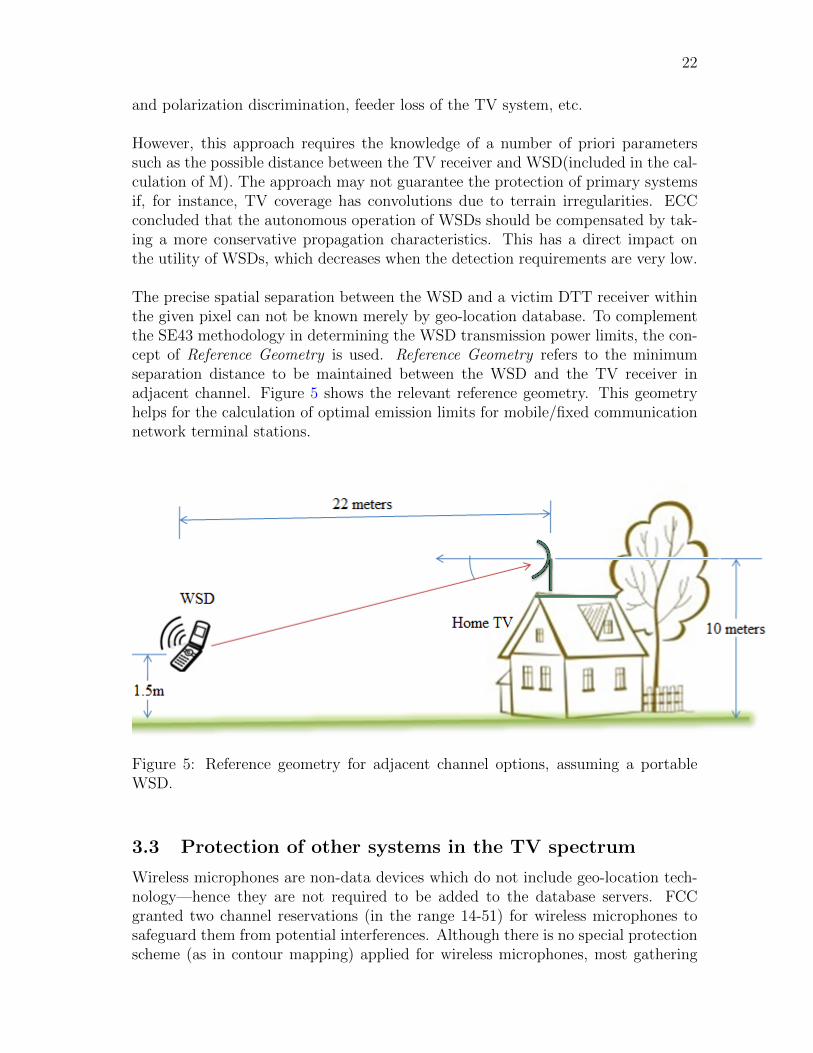
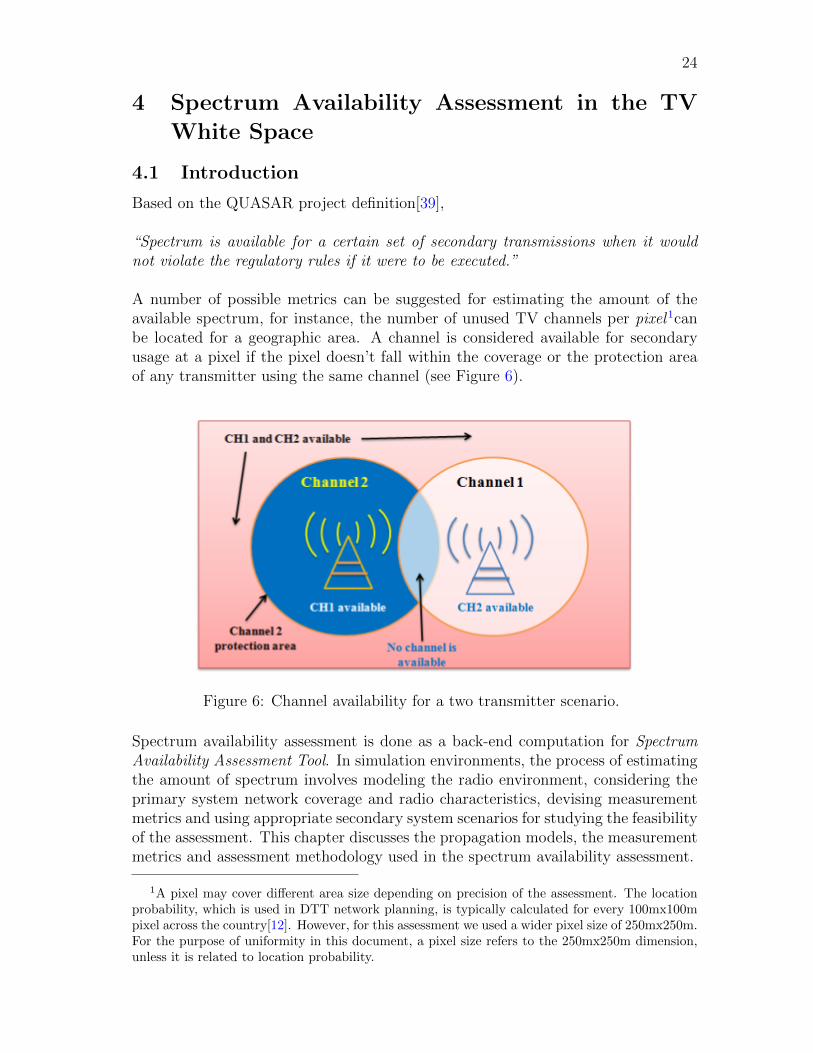
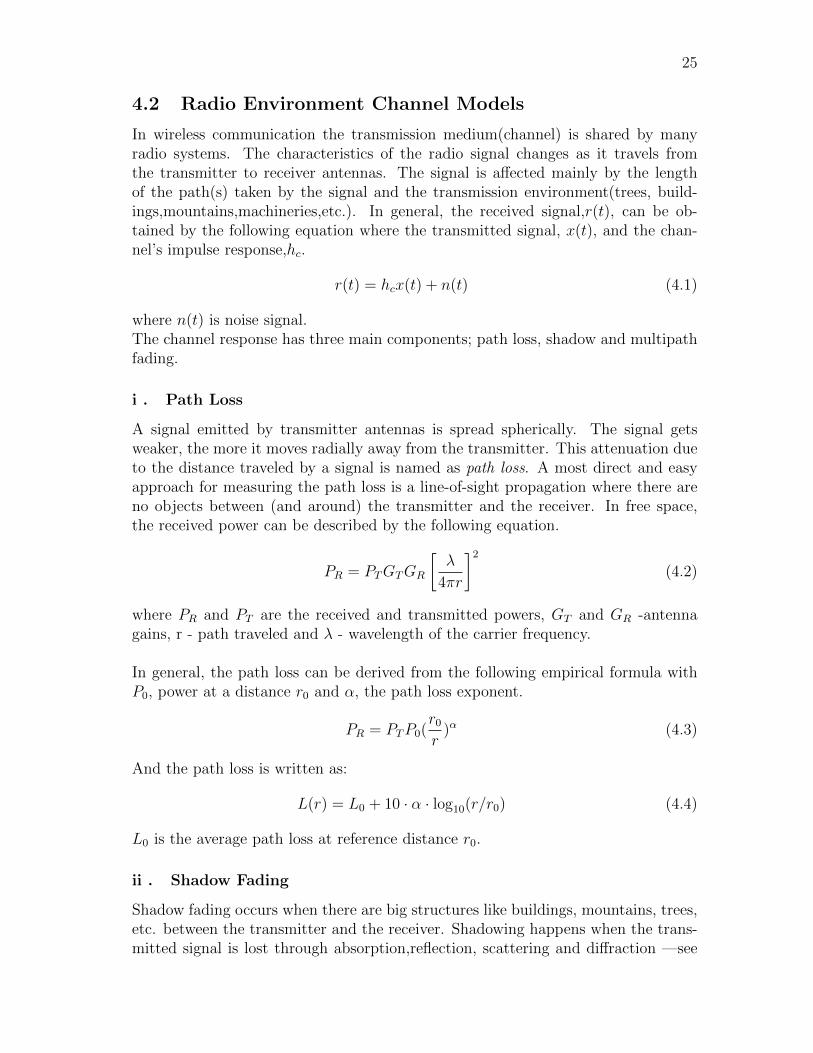
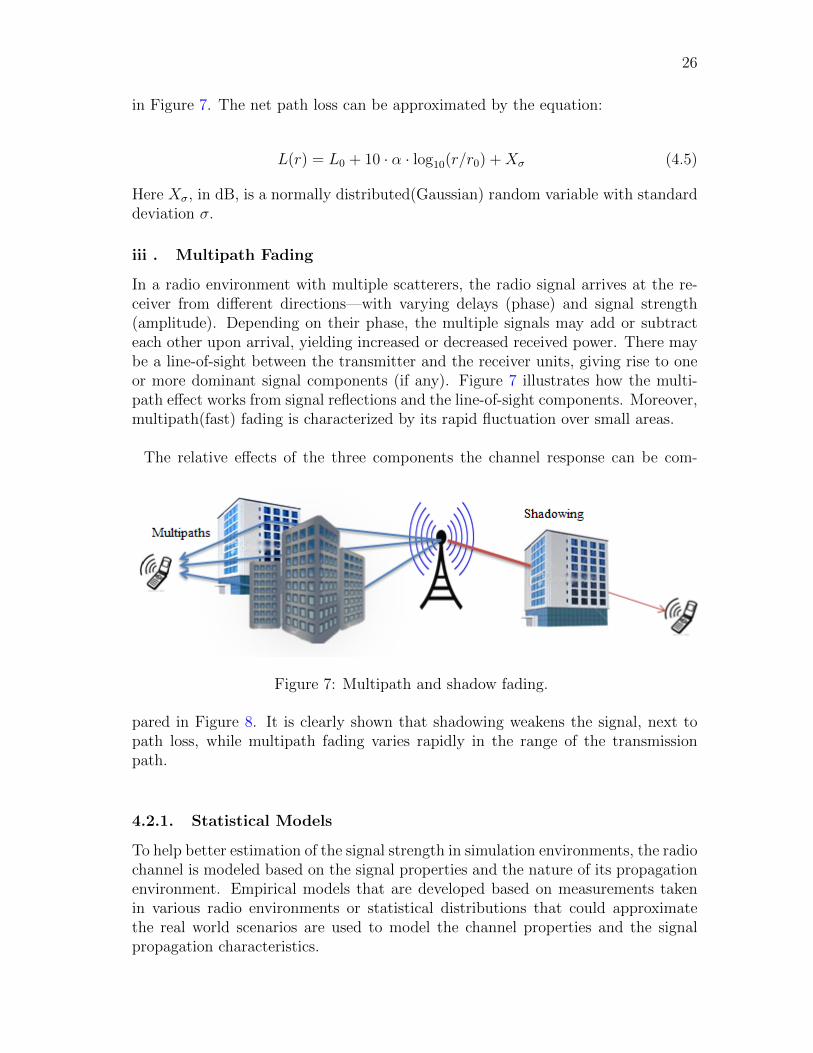
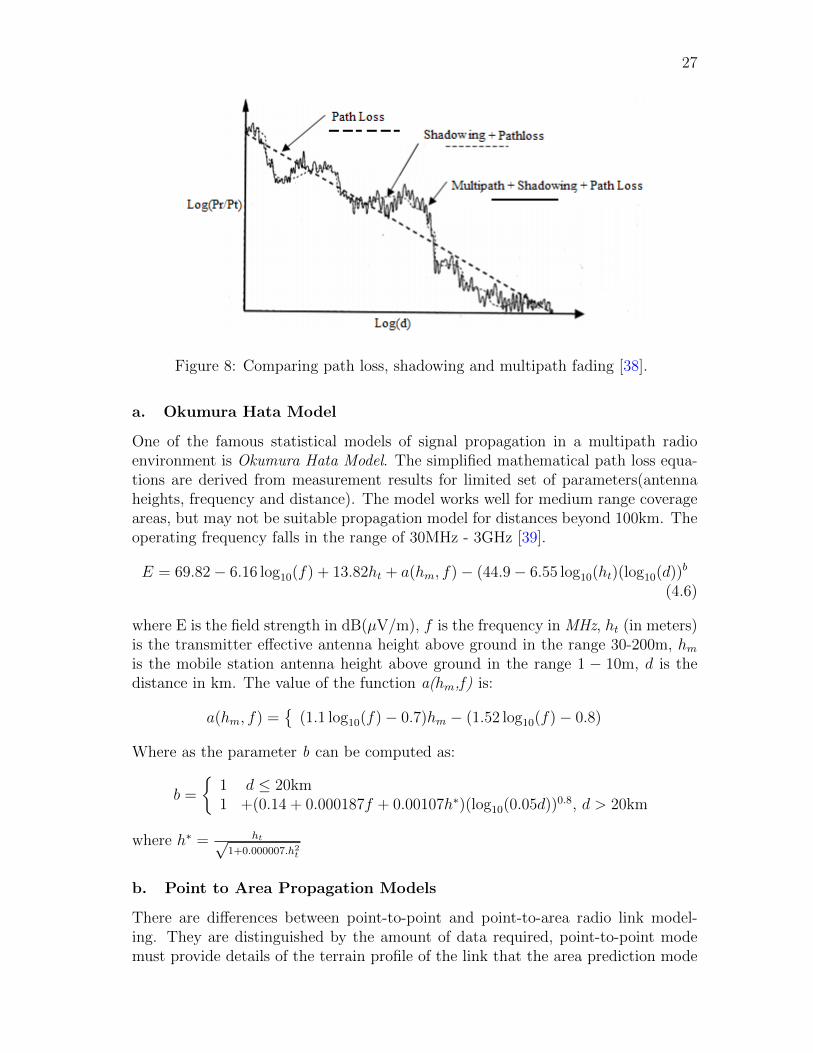
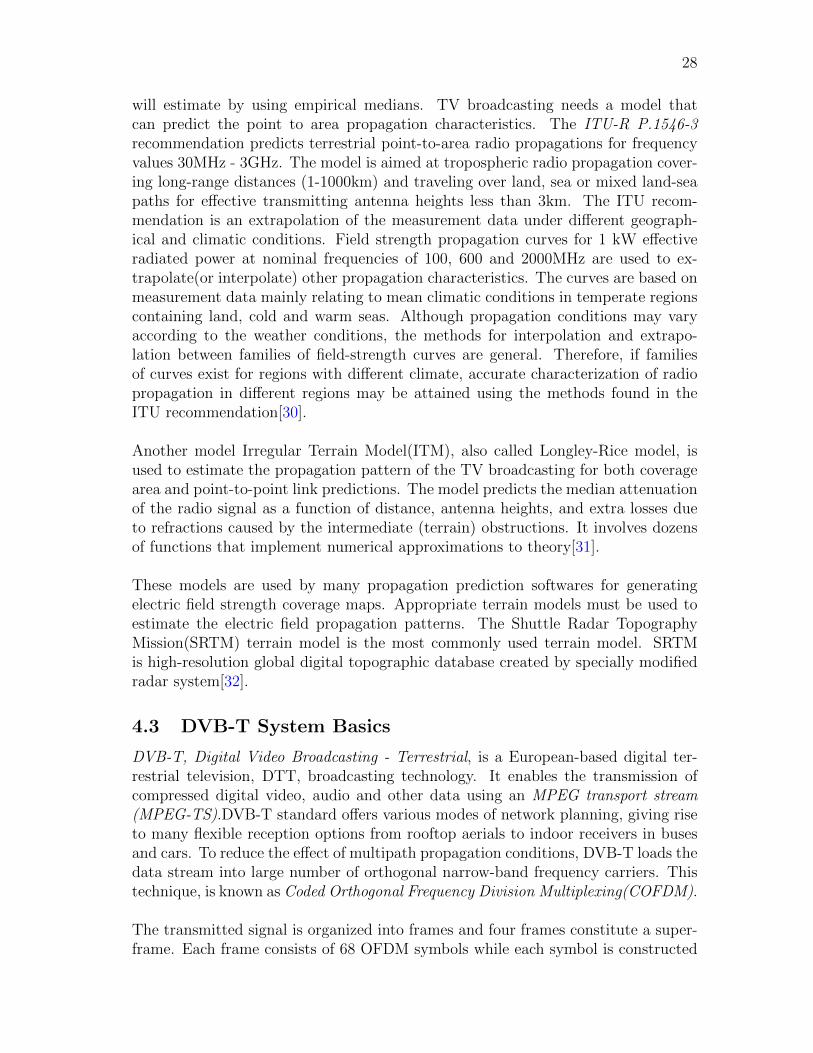
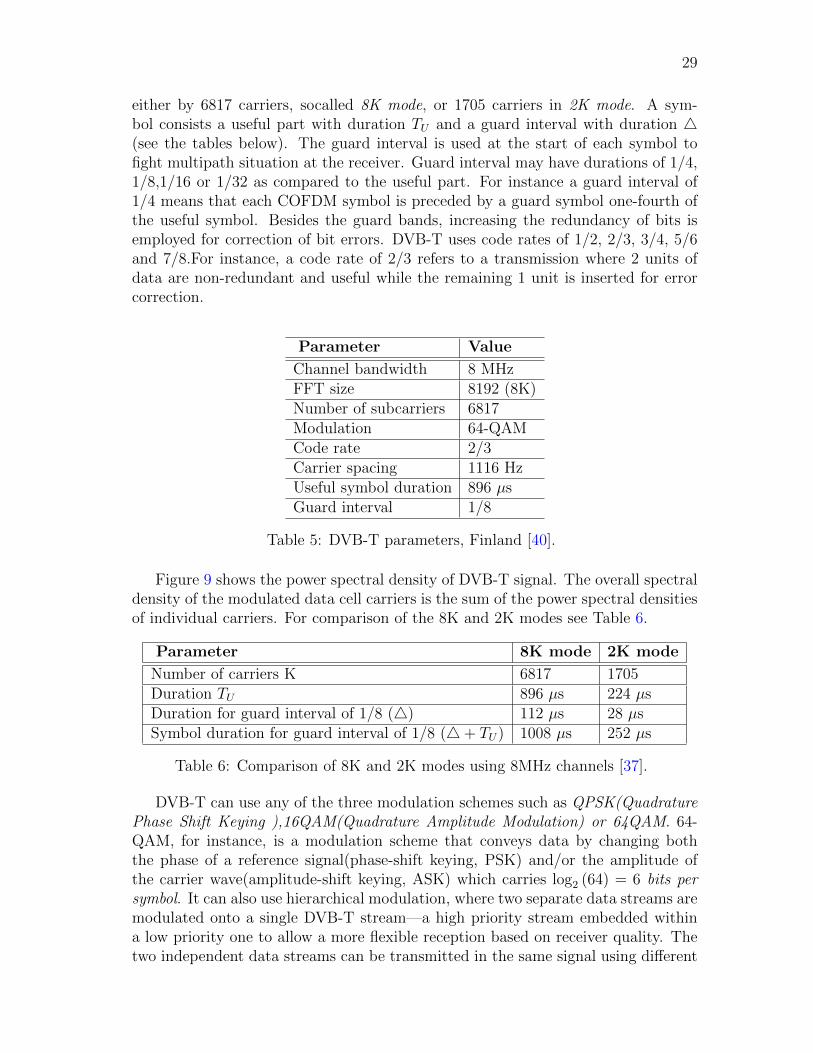
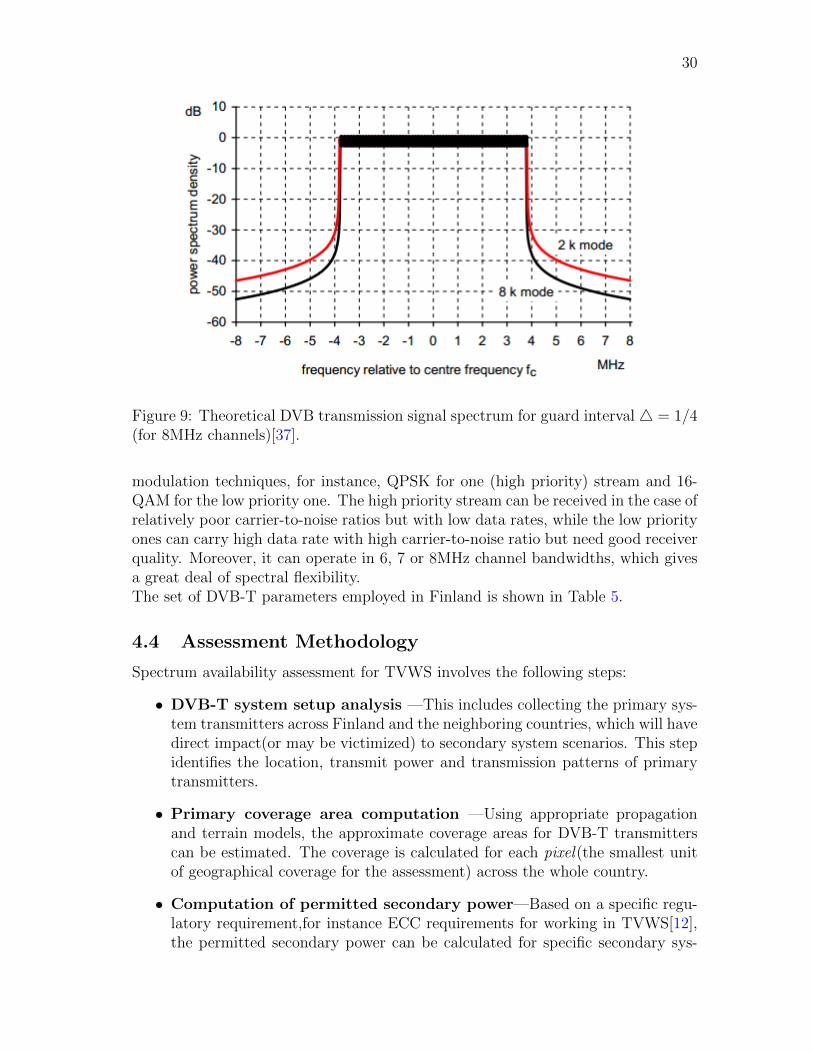
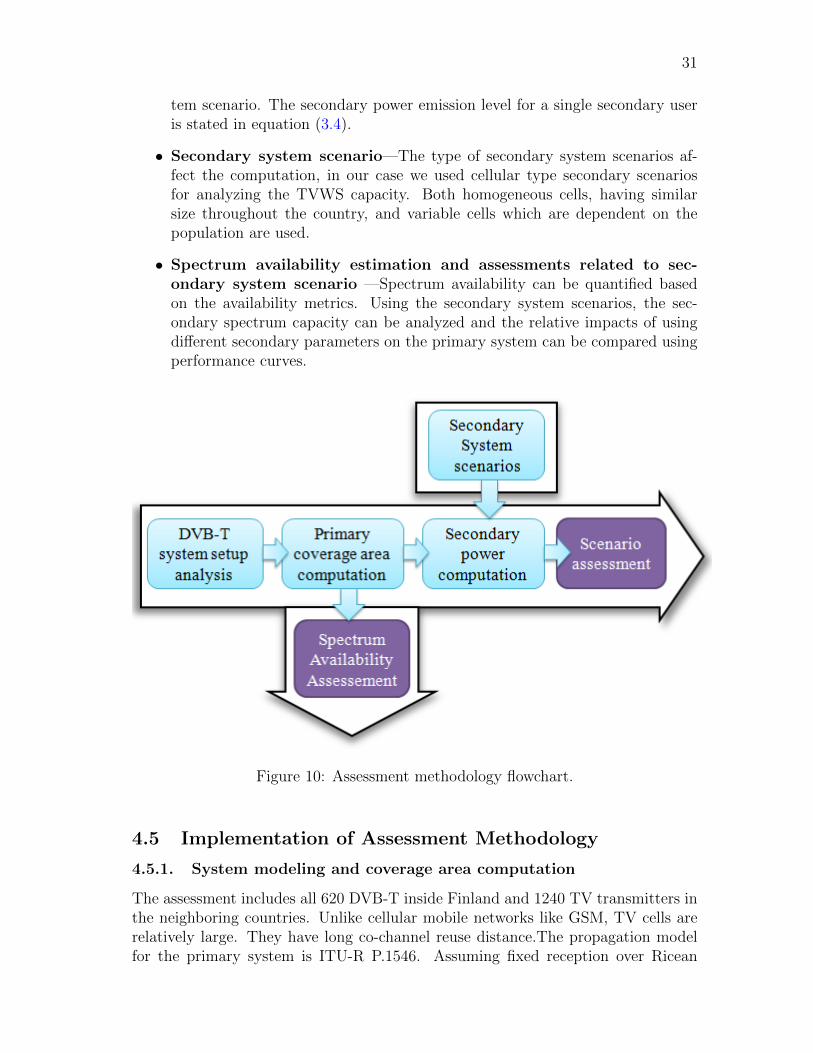
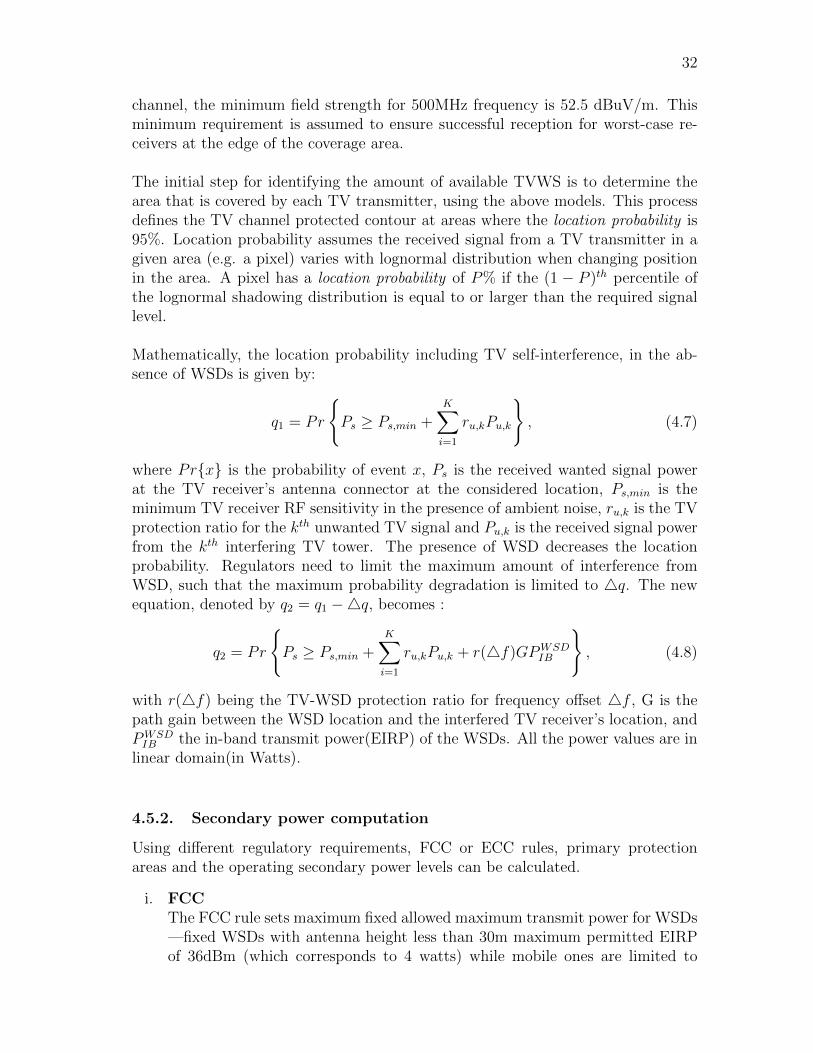
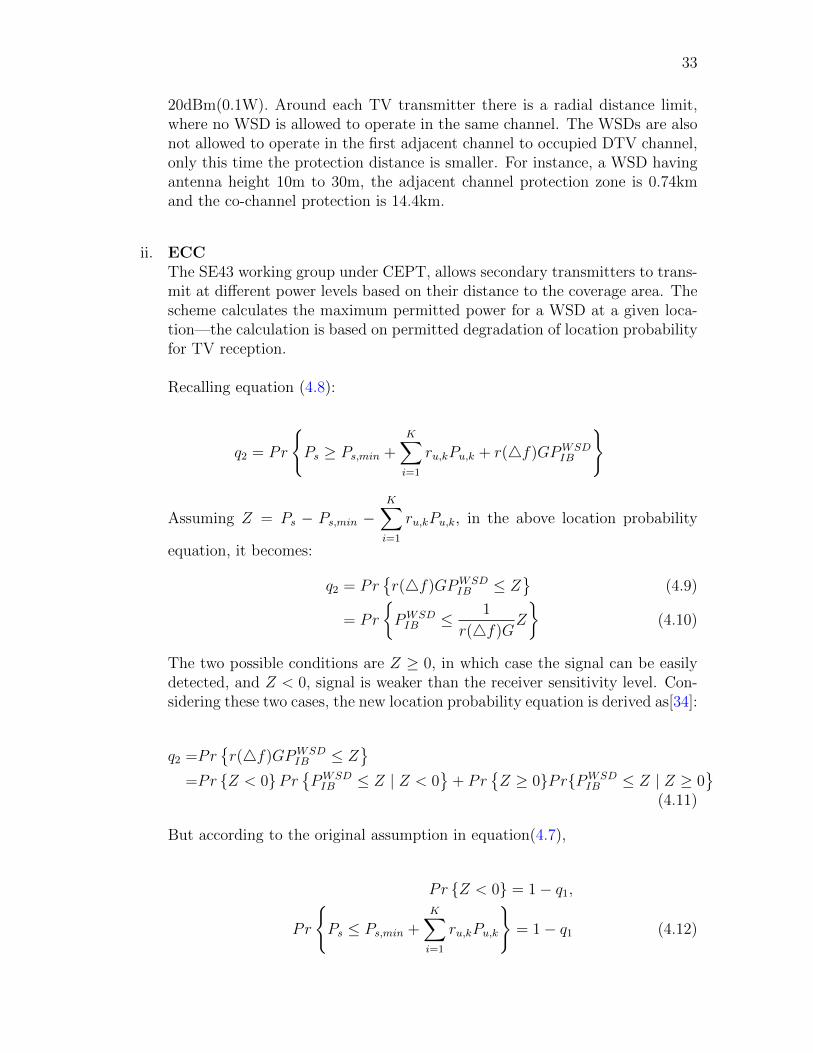
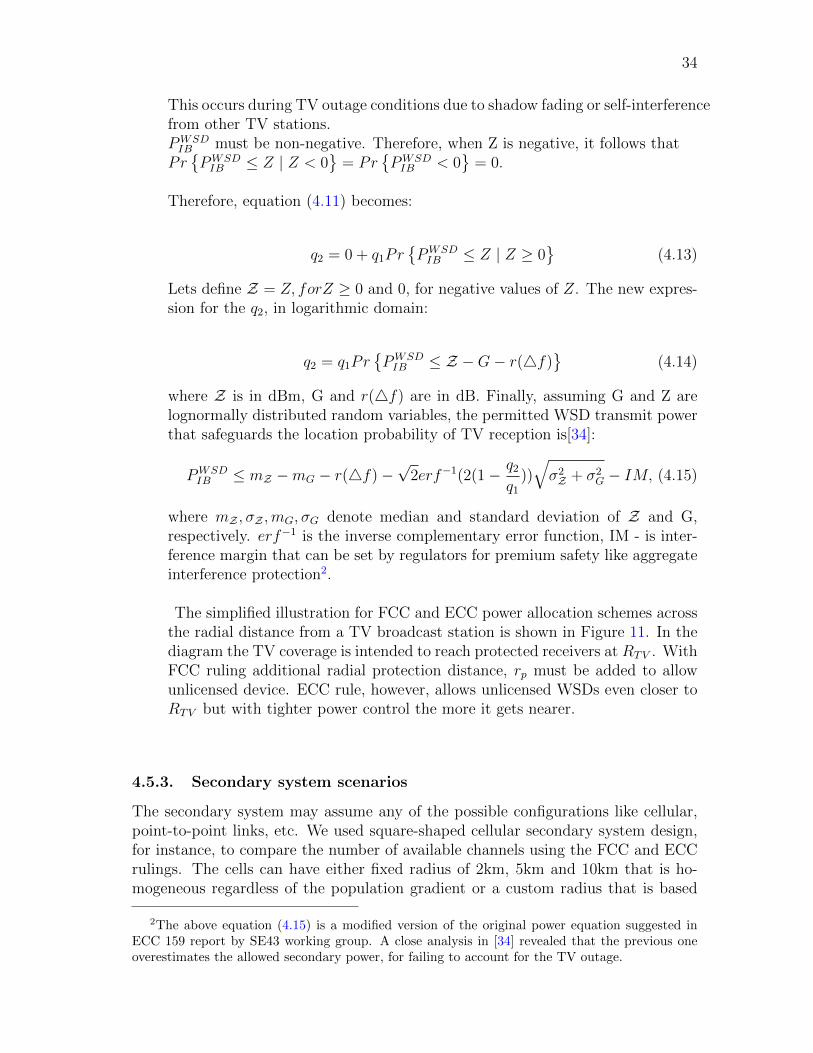
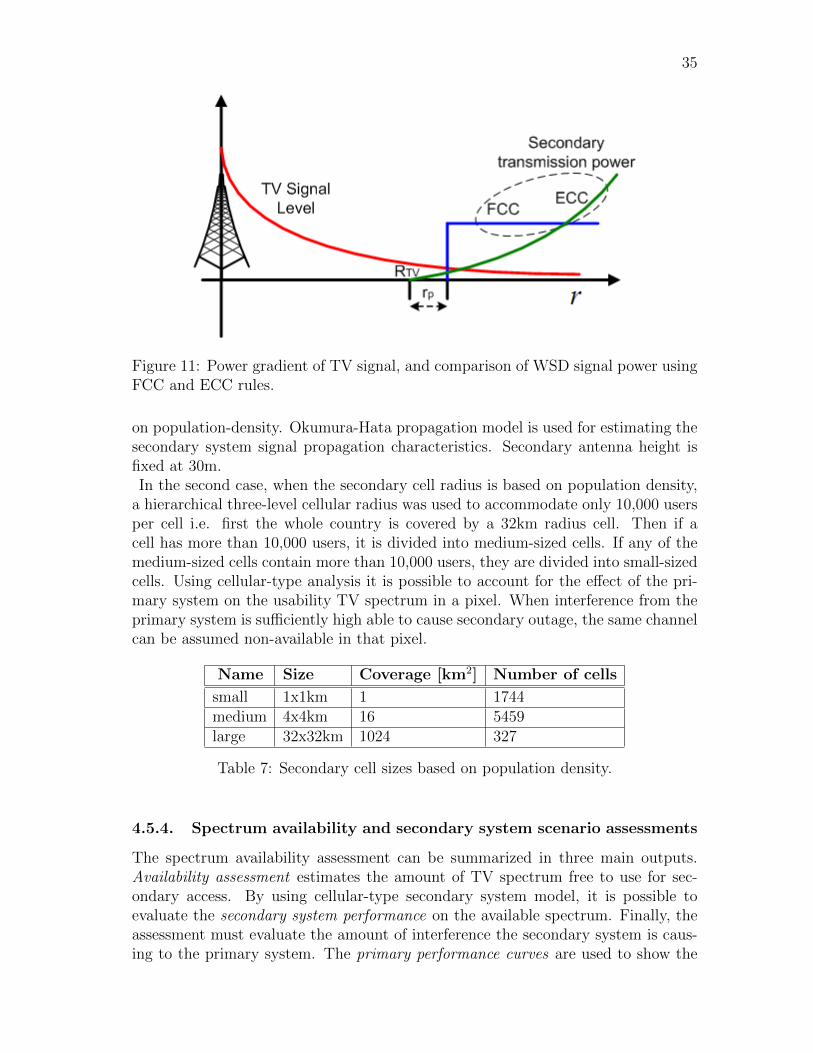
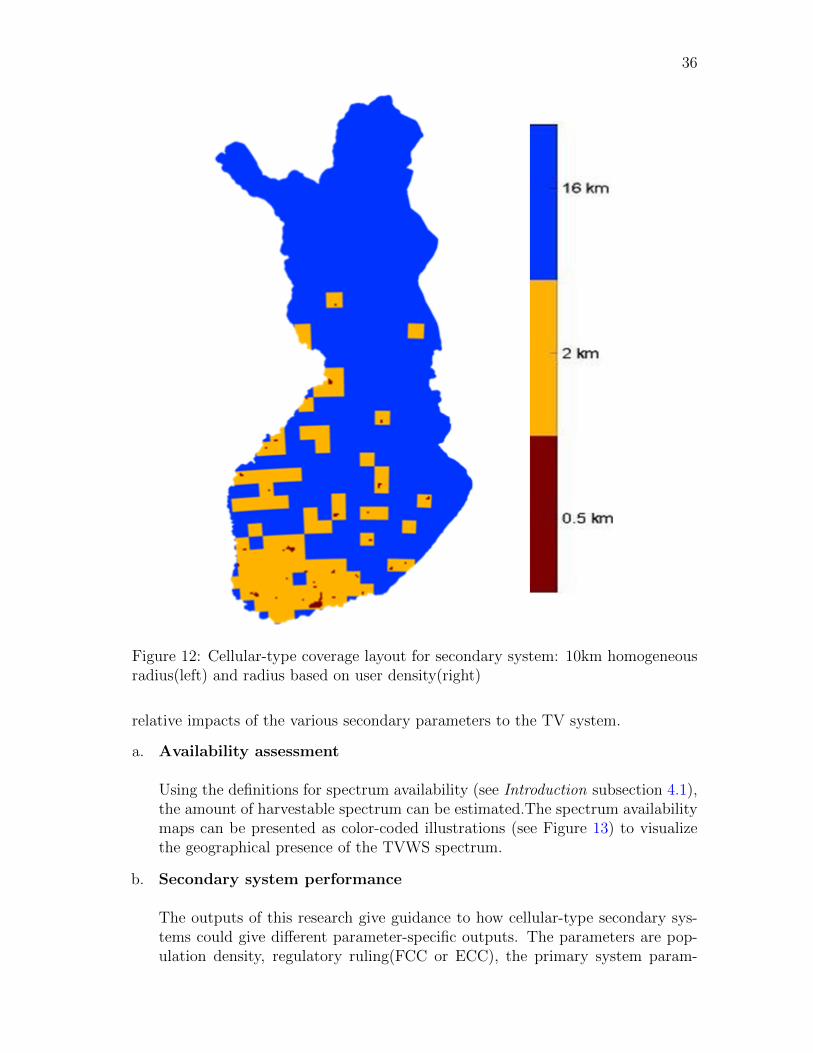
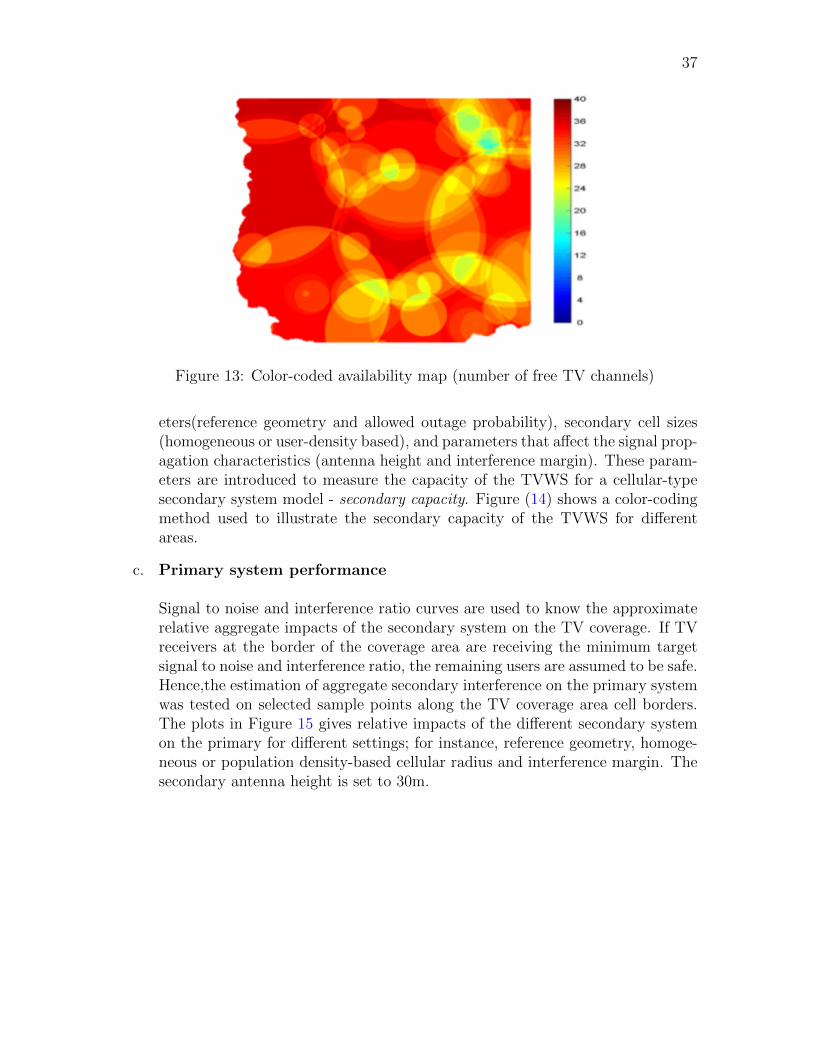
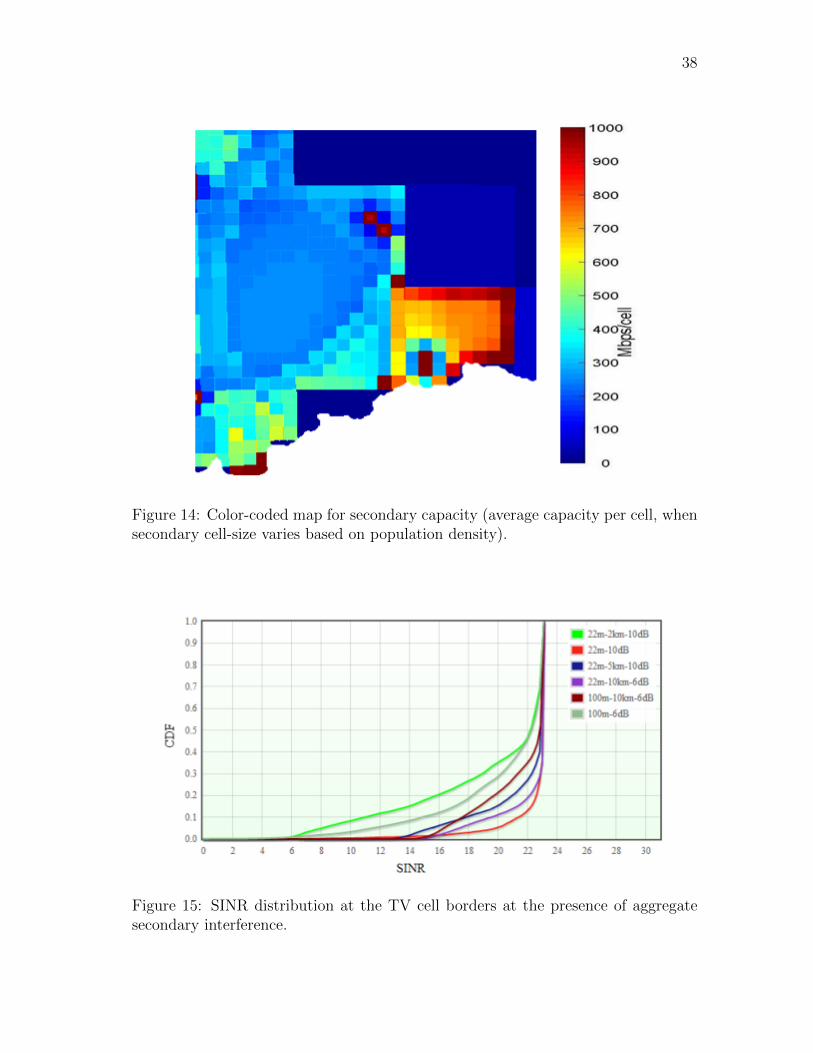
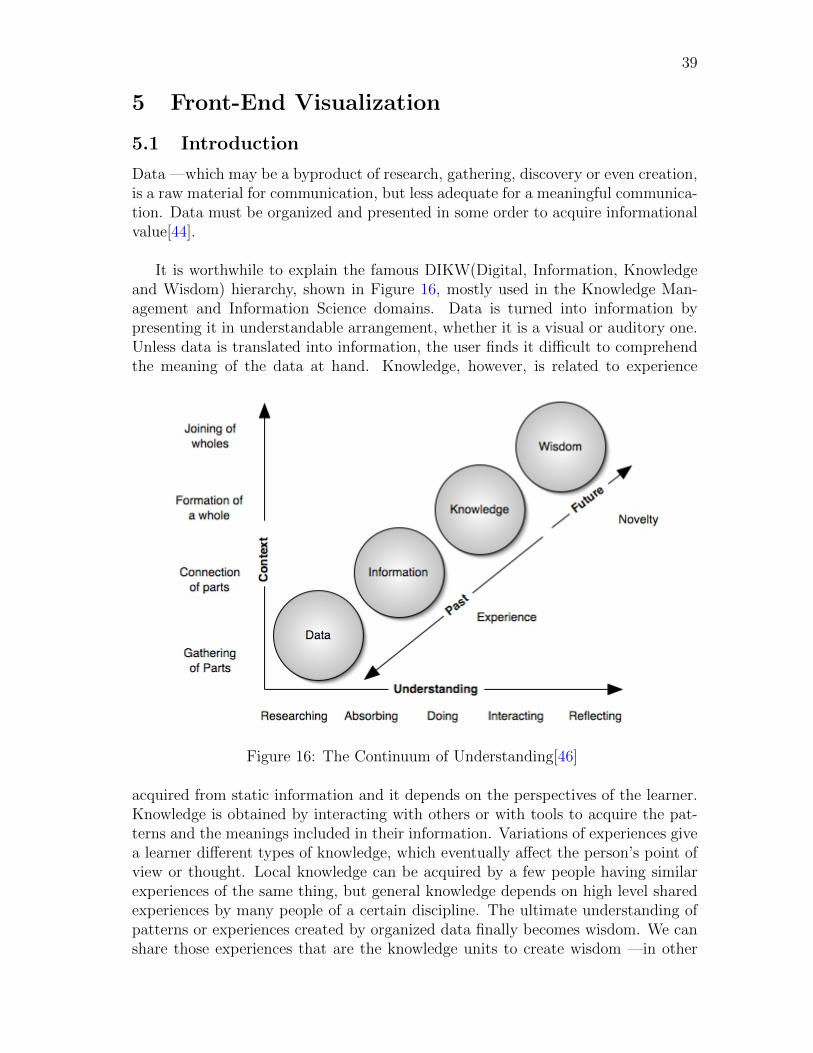
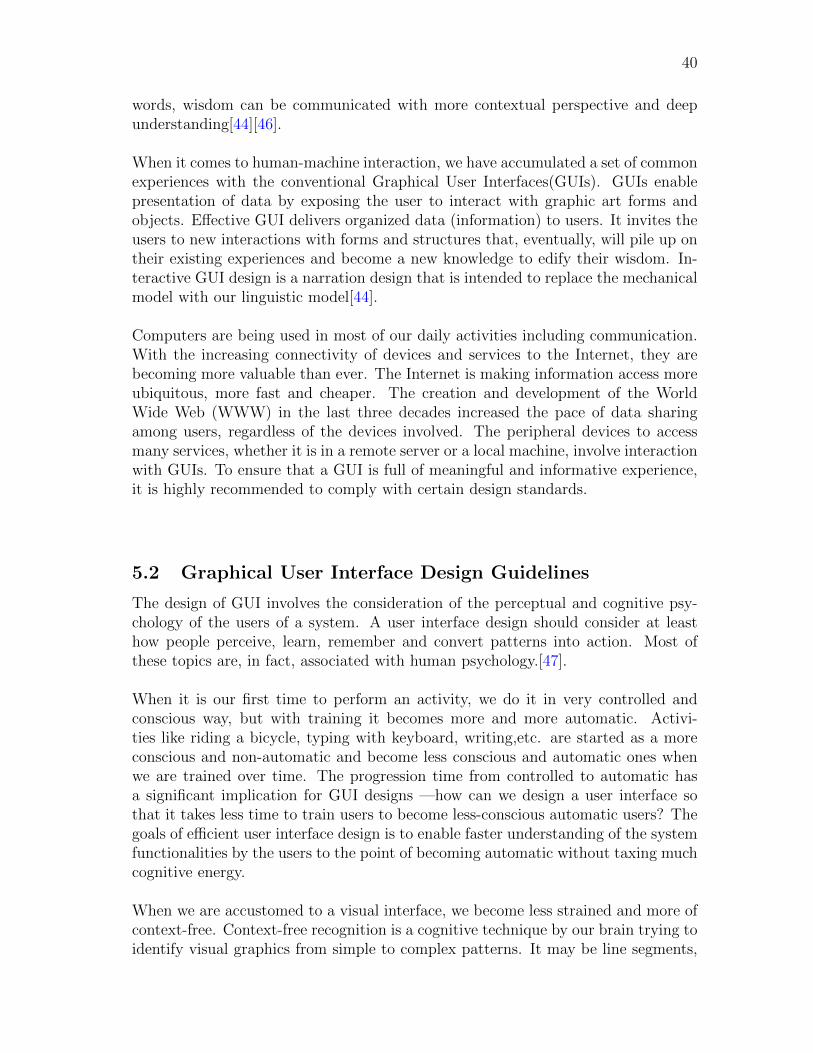
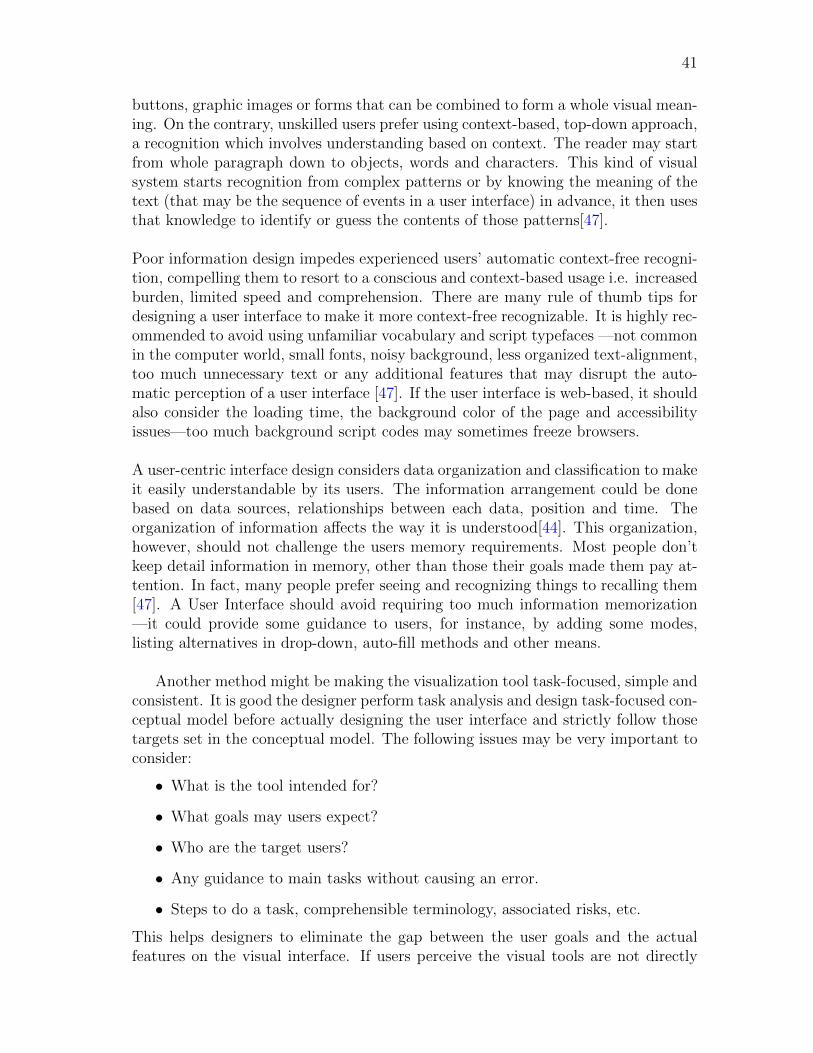
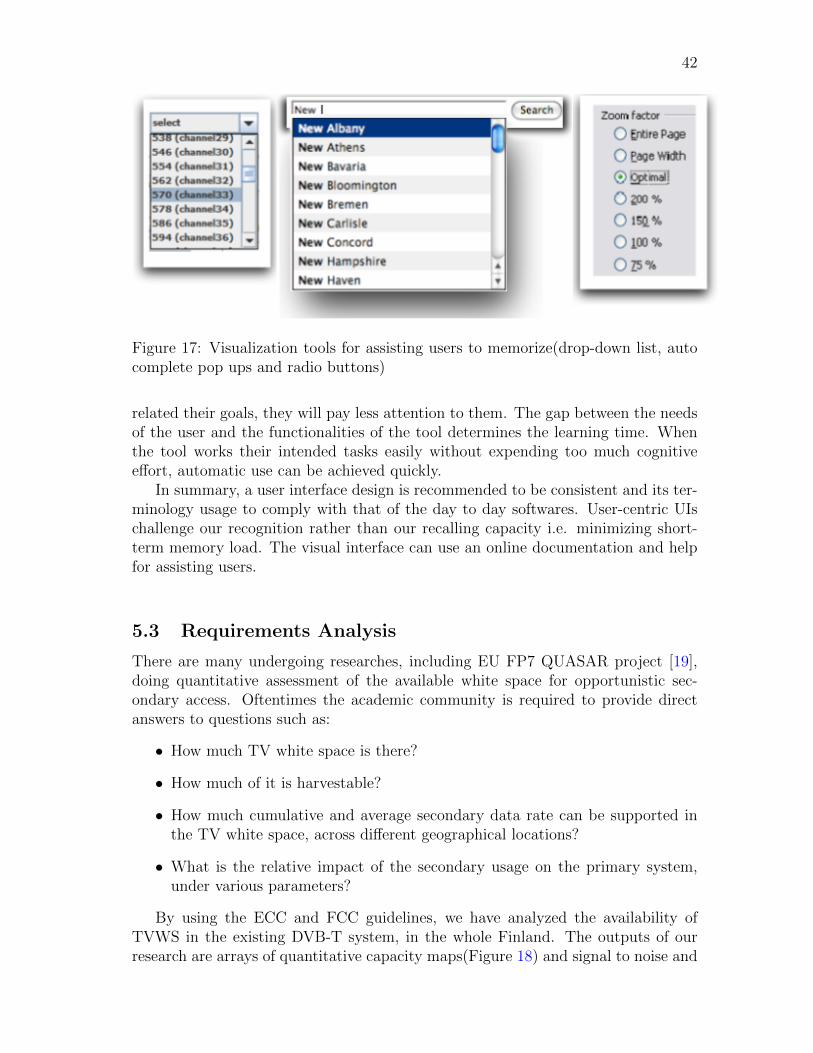
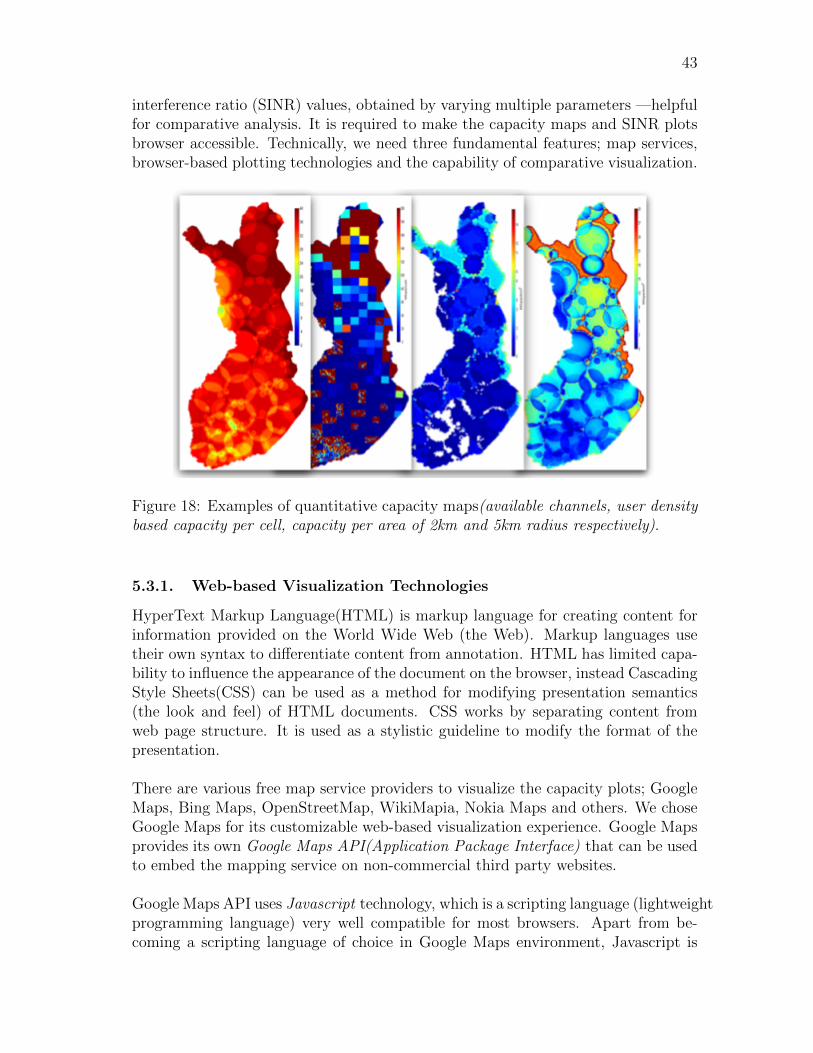
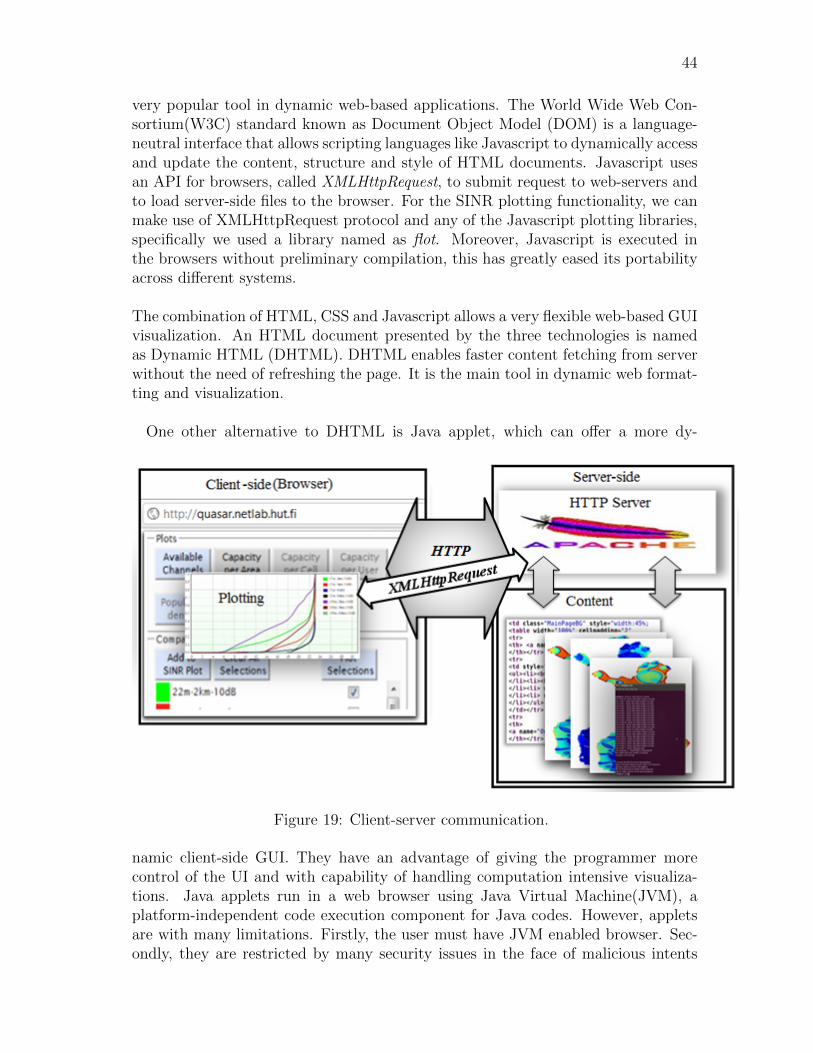
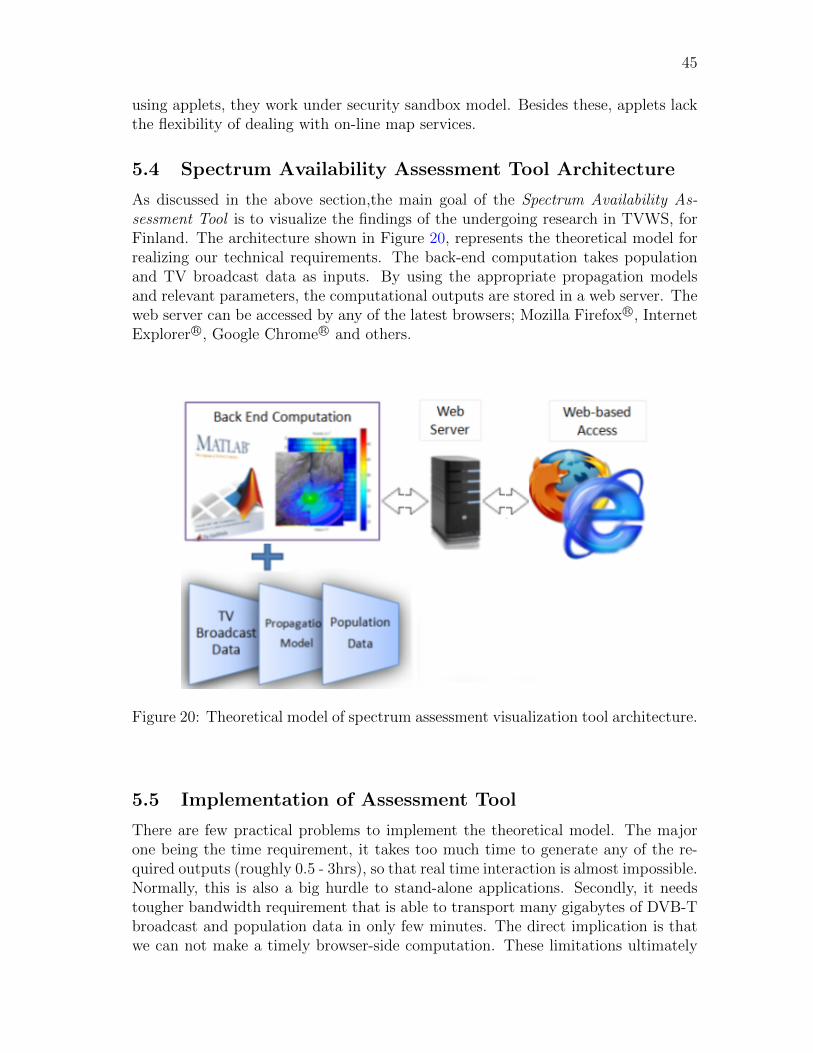
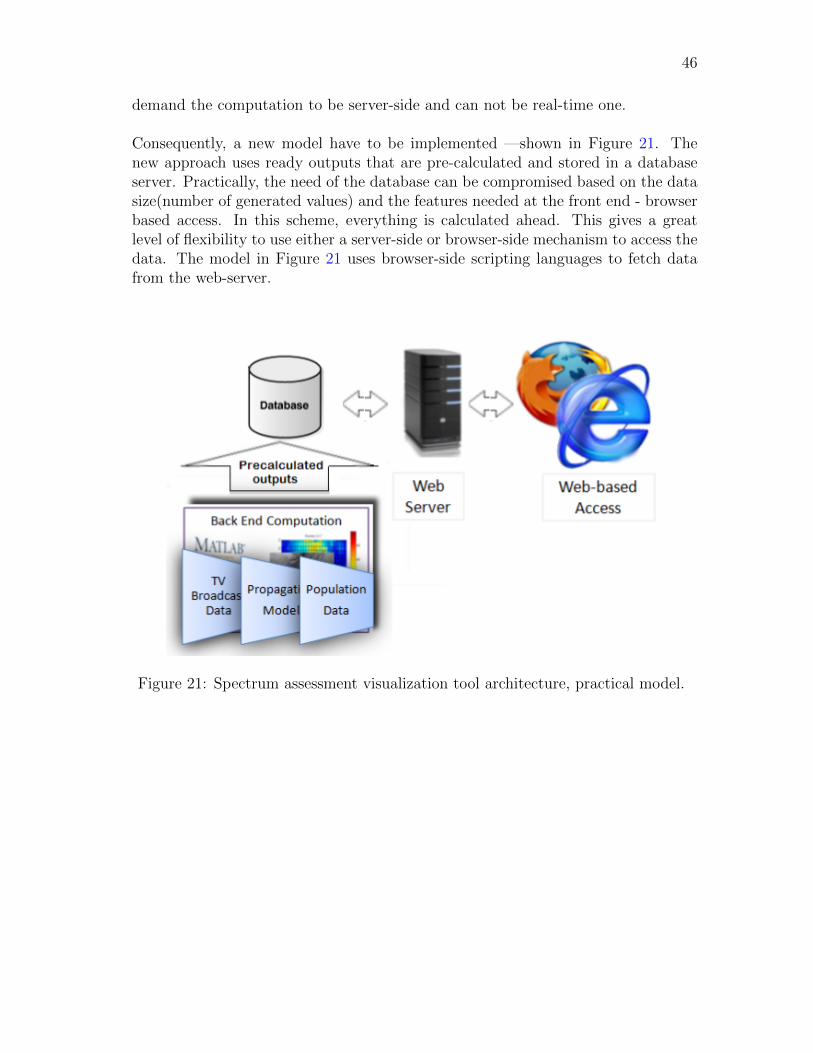
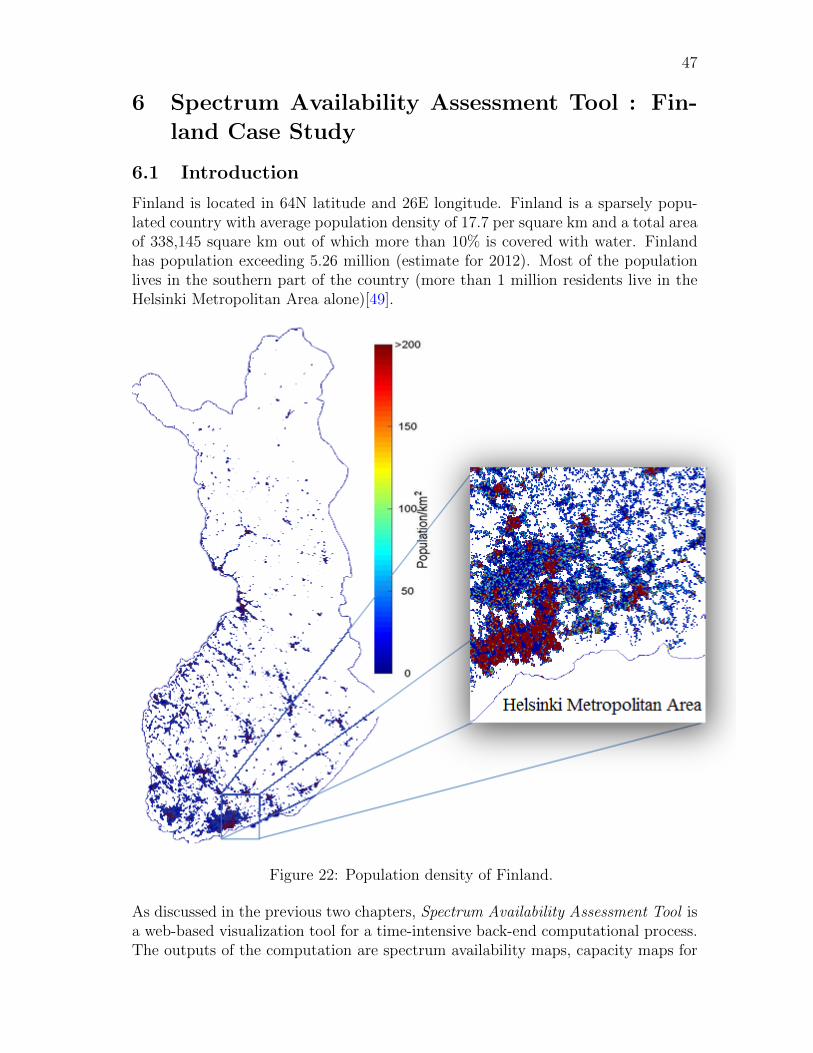
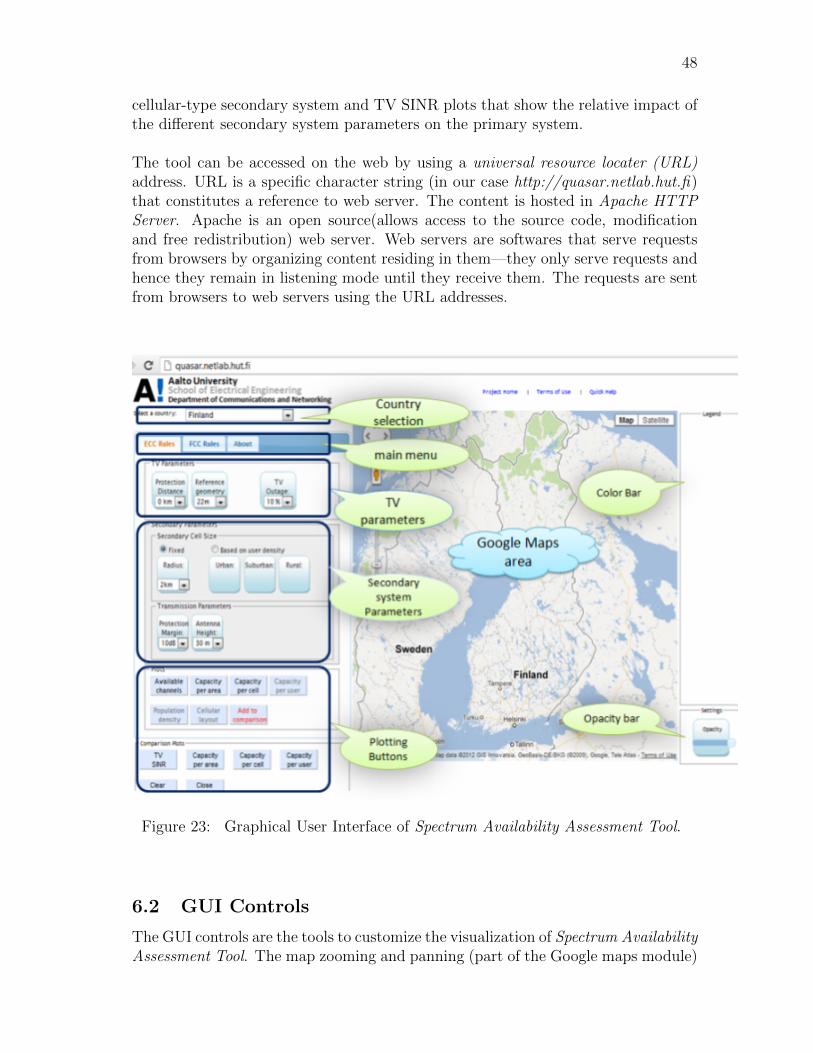
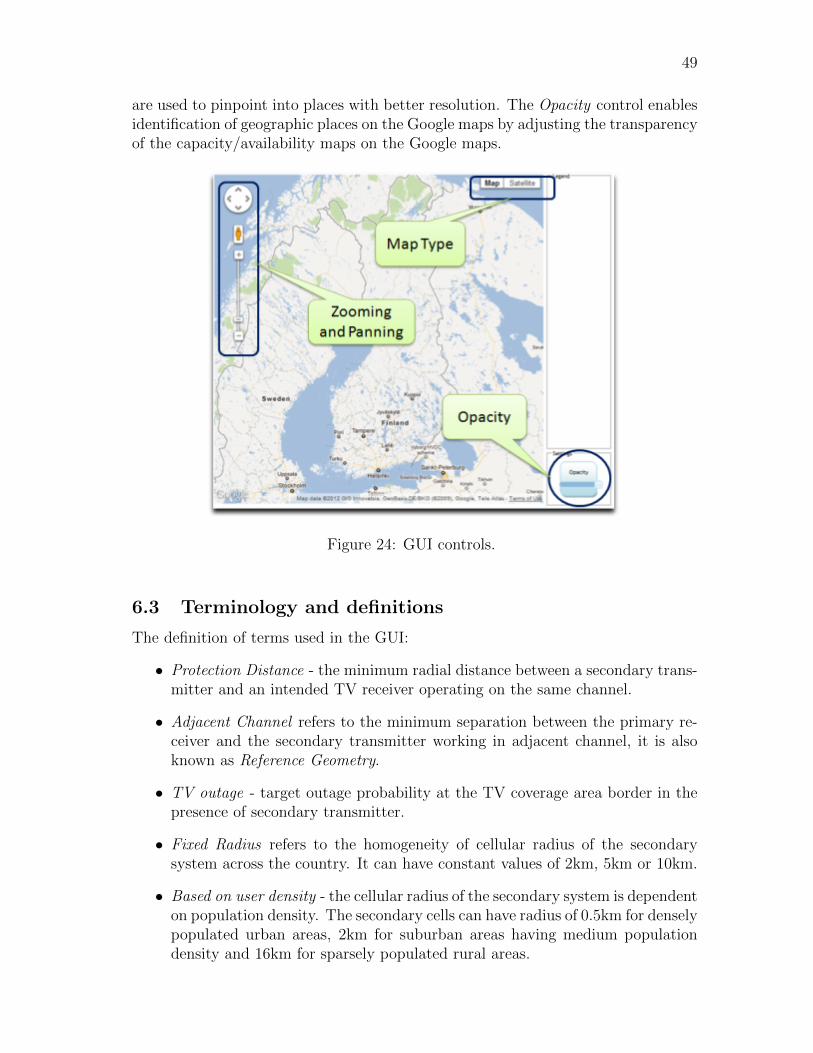
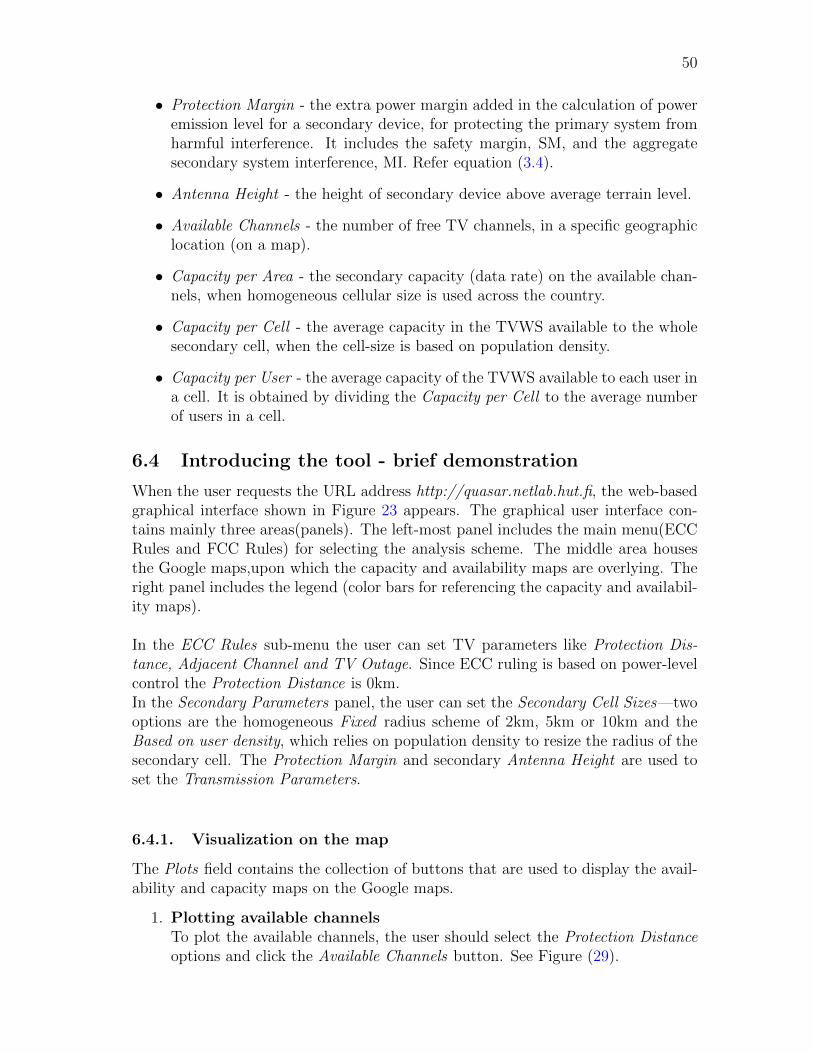
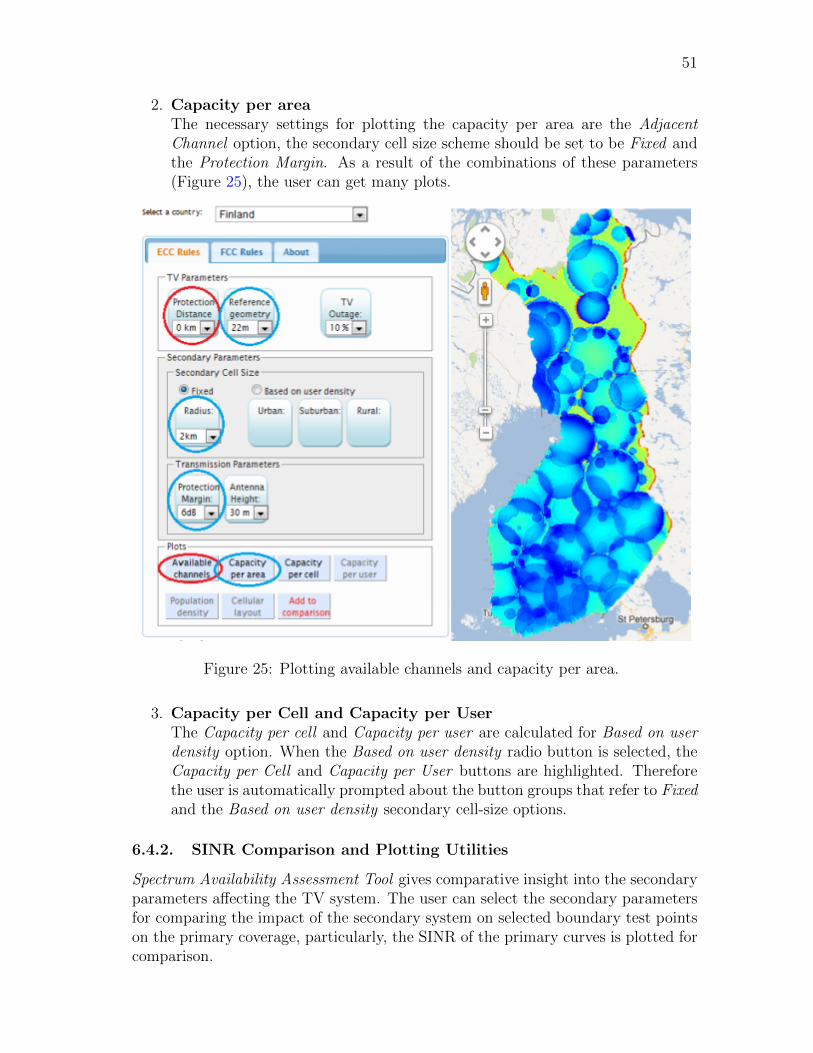
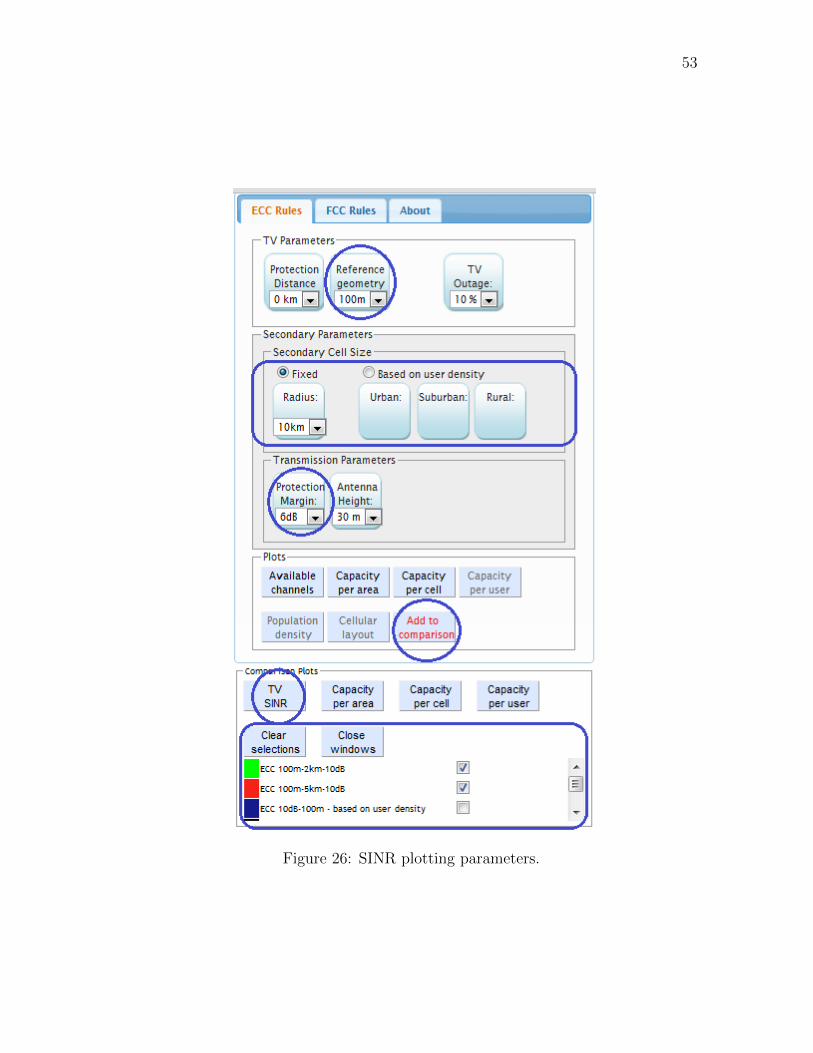
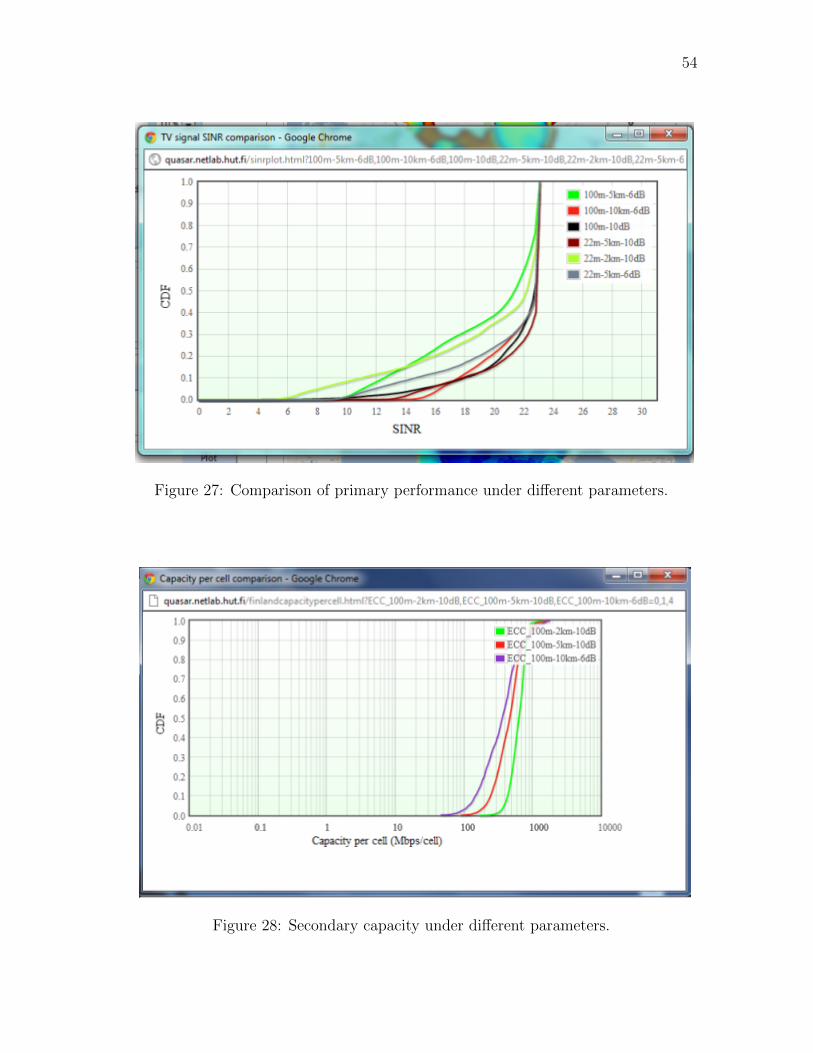
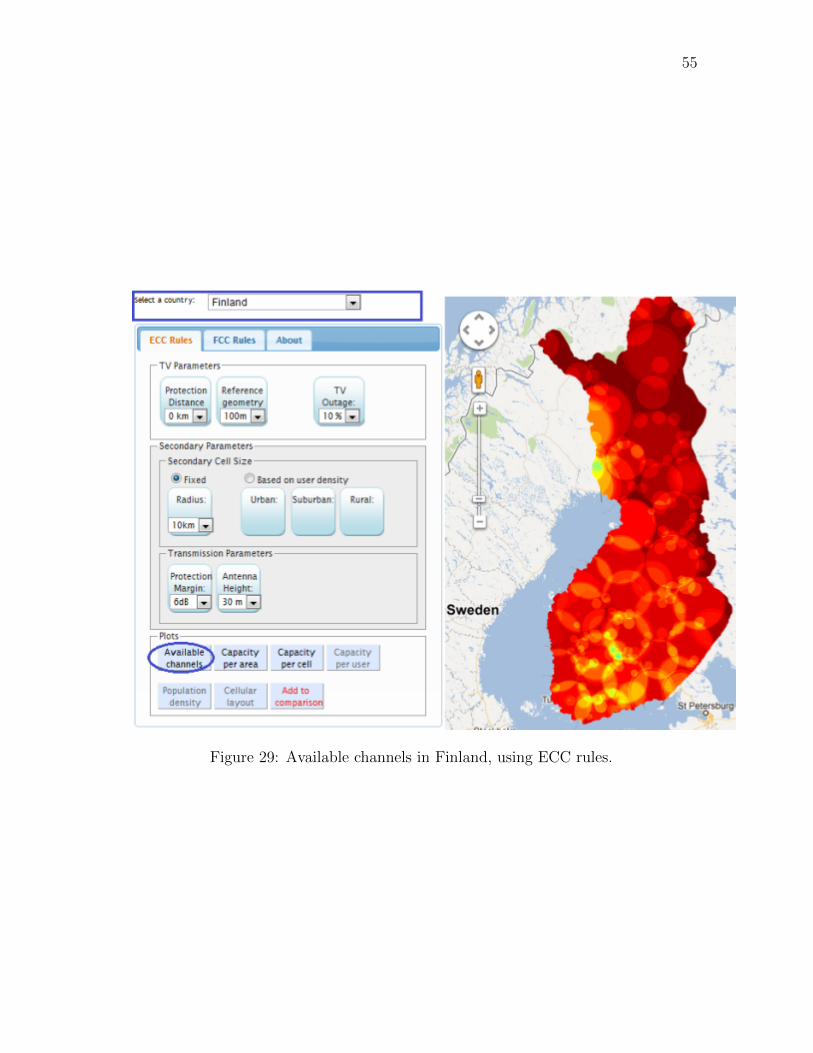
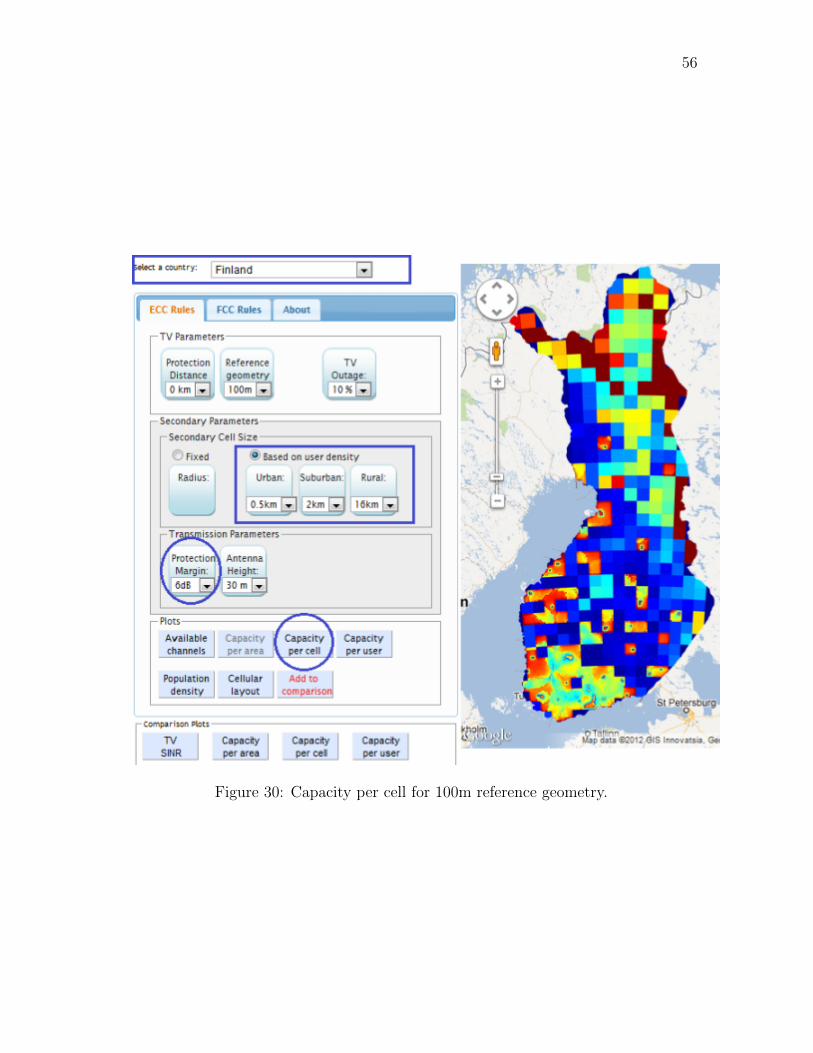


![Klaus Kytt a - Universitylib.tkk.fi/Dipl/2007/urn007645.pdf · In 1952 Alan Turing [1] proposed that a system of chemical substances, or morphogens (awordcoined by Turing), capable](https://img.pdfslide.net/doc/110x75/5e18666859cda335f722fff2/klaus-kytt-a-in-1952-alan-turing-1-proposed-that-a-system-of-chemical-substances.jpg)