Embed Size (px)
Citation preview

Int. J. Mol. Sci. 2011, 12, 5098-5134; doi:10.3390/ijms12085098
International Journal of Molecular Sciences
ISSN 1422-0067 www.mdpi.com/journal/ijms
Article
Alert-QSAR. Implications for Electrophilic Theory of Chemical Carcinogenesis
Mihai V. Putz 1,2,*, Cosmin Ionaşcu 2, Ana-Maria Putz 2,3,* and Vasile Ostafe 1,2
1 Laboratory of Computational and Structural Physical Chemistry, Chemistry Department, West University of Timişoara, Pestalozzi Street No.16, Timişoara, RO-300115, Romania; E-Mail: [email protected] (V.O.)
2 “Nicolas Georgescu-Roegen” Forming and Research Center of West University of Timişoara, 4th, Oituz Street, Timişoara, RO-300086, Romania; E-Mail: [email protected] (C.I.)
3 Institute of Chemistry Timişoara of the Romanian Academy, 24 Mihai Viteazul Bld., Timişoara, RO-300223, Romania
* Authors to whom correspondence should be addressed; E-Mails: [email protected], or [email protected] (M.V.P.); [email protected] (A.-M.P.).
Received: 1 June 2011; in revised form: 30 June 2011 / Accepted: 3 August 2011 / Published: 11 August 2011
Abstract: Given the modeling and predictive abilities of quantitative structure activity relationships (QSARs) for genotoxic carcinogens or mutagens that directly affect DNA, the present research investigates structural alert (SA) intermediate-predicted correlations SAA of electrophilic molecular structures with observed carcinogenic potencies in rats (observed activity, A = Log[1/TD50], i.e., ( ),..., 21
SASASA XXfA = ). The present method includes
calculation of the recently developed residual correlation of the structural alert models, i.e., ( ),...,, 21
SASASASA XXAAfARA −= . We propose a specific electrophilic ligand-receptor
mechanism that combines electronegativity with chemical hardness-associated frontier principles, equality of ligand-reagent electronegativities and ligand maximum chemical hardness for highly diverse toxic molecules against specific receptors in rats. The observed carcinogenic activity is influenced by the induced SA-mutagenic intermediate effect, alongside Hansch indices such as hydrophobicity (LogP), polarizability (POL) and total energy (Etot), which account for molecular membrane diffusion, ionic deformation, and stericity, respectively. A possible QSAR mechanistic interpretation of mutagenicity as the first step in genotoxic carcinogenesis development is discussed using the structural alert
OPEN ACCESS

Int. J. Mol. Sci. 2011, 12
5099
chemoinformation and in full accordance with the Organization for Economic Co-operation and Development QSAR guidance principles.
Keywords: genotoxic carcinogenesis; structural alerts; OECD principles; residual-QSAR; electronegativity and chemical hardness reactivity principles
1. Introduction
Chemical carcinogenesis became an experimental science in 1918, when Yamagiwa and Lchihawa reproduced coal tar carcinogenicity in rabbit skin [1]. In 1930, Yoshida reported hepato-carcinogenicity of a pure aminoazo dye in rats [2], while in 1938, Hueper et al. induced urinary bladder cancer in dogs using 2-naphthylamine [3]. In the following decades, the carcinogenicity of a number of polycyclic hydrocarbons, and the strong dependence of their activities on structural features, was demonstrated [4].
Thereafter, Miller and Miller suggested that chemical carcinogens are converted in vivo to reactive electrophilic derivates that combine with nucleophilic groups such as nucleic acids and proteins. These conclusions were based on observations that changes in genetic information were caused by reaction with alkylating electrophiles and were the initial event in chemical carcinogenesis. In this framework, then, chemical carcinogens are simply strong electrophilic reactants [5,6].
The benchmark in vitro model of chemical carcinogenicity is a series of genetically-engineered Salmonella typhimurium bacterial strains created by Bruce Ames [7]. John Ashby contributed to the identification and compilation of a list of structural alerts (SAs), which are chemically reactive functional groups that induce mutations and cancer [8]. All of the four basic sets of SAs (generically identified as Ashby SAs, Bailey SAs, Kazius SAs and the Ames test) give similar results for Salmonella mutagenicity and rodent carcinogenicity [9].
Ames (1984) showed that a high percentage of known human carcinogens can be detected as mutagens (around 83%) [7]. Oxygen radicals are the most important class of mutagens contributing to aging and cancer, but they are not detected as mutagens by the standard Salmonella strains used in such assays. Hydroperoxides generated by lipid peroxidation may damage DNA through the generation of hydroxyl radicals, which are also the main agents in radiation damage to DNA.
“Mutagenicity” refers to a substance’s capacity to cause genetic mutations; it is of great public concern because it is closely related to carcinogenicity and, potentially, reproductive toxicity. Mutagenicity can be assessed experimentally with the Ames Salmonella test, which has an estimated reproducibility of 85%. This intrinsic limitation of the in vitro test, along with the need for faster and less expensive predictive alternatives, has led to interest in other assessment methods, such as in silico structure-activity (toxicity) relationship [QSA(T)R] models [10].
In one example, because nitro compounds were observed to induce mutations in the S. typhimurium TA98 strain, QSTR techniques were employed to develop models of nitroarene mutagenicity using a set of 197 nitro-aromatic and heteroaromatic molecules. These models employed QSAR techniques with 2D and 3D descriptors such as electron distribution, spatial disposition, molecular volume, hydrophobicity, steric features, solubility and ionization constants [11].

Int. J. Mol. Sci. 2011, 12
5100
A recent study by Perez-Garrido et al. (2010) investigating the relationships between various bond types and mutagenicity suggested a correlation between mutagenicity and hydrophobicity and molecular volume. This led to a series of proposed structural alerts for mutagenicity. The reactivity of carbonyl groups in electrophilic addition processes was found to be influenced by the size and electronic effects of the substituents; molecular size was found to increase with the number of hydrogens attached to sp3 carbons, leading to a reduction in mutagenicity; and the presence of a terminal double bond was also correlated with mutagenicity. The models created have a concordance of 86% and correctly classify 95% of mutagenic substances [12].
Investigation of the biological property of carcinogenicity using computational and network interaction studies may help to explain the increasing incidence of cancer. A successful predictive model must be generally valid for compounds with diverse molecular structures, obtain similar results for substances with similar physico-chemical properties and correctly model the relationship between sensitivity and specificity [13].
Recently, CAESAR, a project developing models of chemical properties that affect human health, included prediction of carcinogenicity in its set of goals [14,15]. Recent logical-chemoinformatics studies, using methods such as Counter Propagation Artificial Neural Networks (CP ANN), found that high levels of sensitivity (75%) and specificity (69%) were related to electrotopological states and molecular connectivity [16].
These models provide predictions of biological activity and information about the structures, toxicities and solubilities of all compounds analyzed. Since the European Parliament adopted a legislative proposal for the REACH (registration, evaluation and authorization of chemicals) chemical management system in 2006, in vivo testing has diminished in importance because the similar information can be obtained in silico through quantitative structure-activity relationships (QSARs) [17]. Carcinogens can be separated into two classes based on their mechanisms of action: genotoxic carcinogens directly damage DNA (thus producing mutagenesis as the first step of chemical carcinogenesis) [9,13], while epigenetic carcinogens do not bind covalently to DNA.
A (Q)SAR model, according to Organization of Economic Cooperation and Development (OECD) guidelines, has the following characteristics: a defined endpoint, an unambiguous algorithm, a defined domain of applicability, statistical performance and predictive power, and a mechanistic interpretation [18,19]. In this sense, a valid model will be the simplest and most mechanistically transparent. Good statistical performance is not sufficient for selection of a model; it should be compatible with existing knowledge in the fields of QSAR, chemistry and biology [9]. In construction of the model, if the compounds considered are not sufficiently similar in chemical-biological space or do not have a predefined activity ordering (e.g., a Gaussian distribution), the model will have poor predictive value for smaller datasets. Construction of a QSAR requires experimental data, molecular representation and fitting algorithms. Different QSAR implementations have varying requirements due to resource constraints and legal considerations; any model must therefore be evaluated in the context of its intended use [9].
The present work makes two contributions for advanced residual-QSAR modeling of genotoxic carcinogenesis [20]. First, to gain mechanistic insight into mutagenesis, the influence of explicit reactivity and electrophilic parameters on the derived QSAR models of carcinogenesis was investigated. Second, the residual QSAR method is extended by considering molecular
Int. J. Mol. Sci. 2011, 12
5101
fragment information in structural alerts, which aids in elucidating the electrophilic theory of chemical carcinogenesis.
2. Alert-QSAR Method
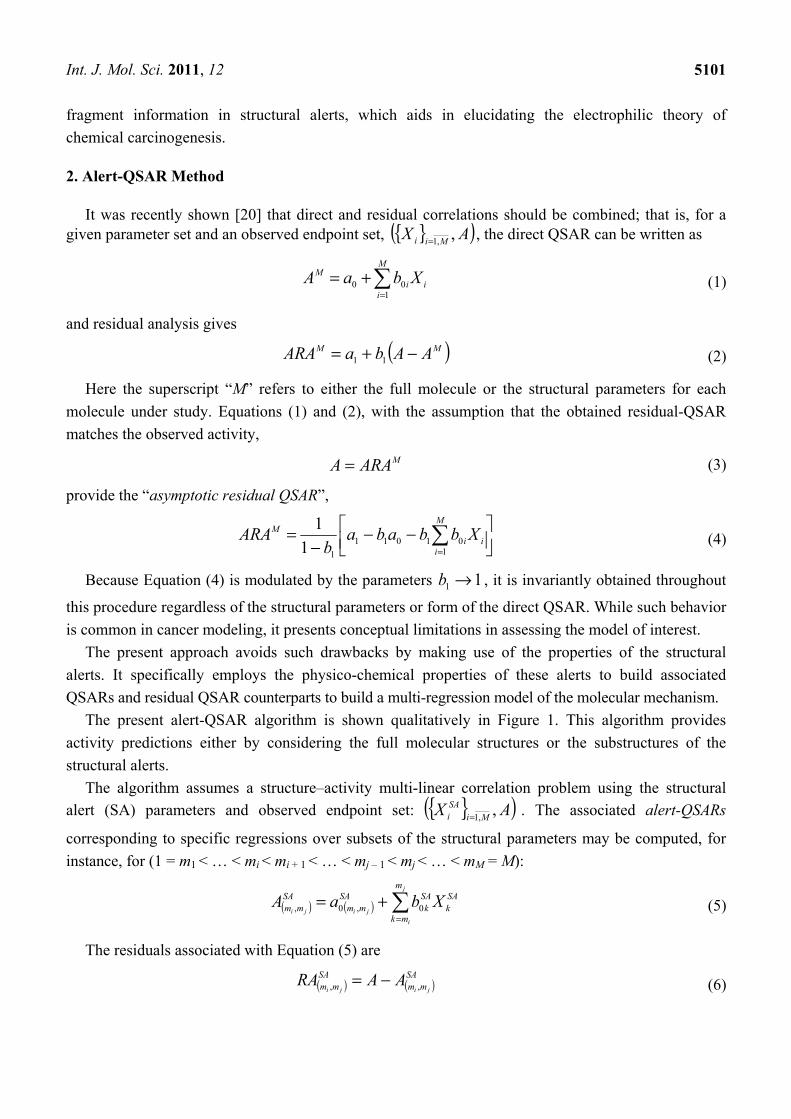
It was recently shown [20] that direct and residual correlations should be combined; that is, for a given parameter set and an observed endpoint set, { }( )AX Mii ,,1= , the direct QSAR can be written as
∑=
+=M
iii
M XbaA1
00 (1)
and residual analysis gives
( )MM AAbaARA −+= 11 (2)
Here the superscript “M” refers to either the full molecule or the structural parameters for each molecule under study. Equations (1) and (2), with the assumption that the obtained residual-QSAR matches the observed activity,
MARAA = (3)
provide the “asymptotic residual QSAR”,
⎥⎦⎤
⎢⎣⎡ −−
−= ∑
=
M
iii
M Xbbabab
ARA1
0101111
1 (4)
Because Equation (4) is modulated by the parameters 11 →b , it is invariantly obtained throughout
this procedure regardless of the structural parameters or form of the direct QSAR. While such behavior is common in cancer modeling, it presents conceptual limitations in assessing the model of interest.
The present approach avoids such drawbacks by making use of the properties of the structural alerts. It specifically employs the physico-chemical properties of these alerts to build associated QSARs and residual QSAR counterparts to build a multi-regression model of the molecular mechanism.
The present alert-QSAR algorithm is shown qualitatively in Figure 1. This algorithm provides activity predictions either by considering the full molecular structures or the substructures of the structural alerts.
The algorithm assumes a structure–activity multi-linear correlation problem using the structural alert (SA) parameters and observed endpoint set: { }( )AX Mi
SAi ,,1= . The associated alert-QSARs
corresponding to specific regressions over subsets of the structural parameters may be computed, for instance, for (1 = m1 < … < mi < mi + 1 < … < mj – 1 < mj < … < mM = M):
( ) ( ) ∑=
+=j
ijiji
m
mk
SAk
SAk
SAmm
SAmm XbaA 0,0, (5)
The residuals associated with Equation (5) are
( ) ( )SA
mmSA
mm jijiAARA ,, −= (6)

Int. J. Mol. Sci. 2011, 12
5102
Figure 1. The alert-QSAR method uses structural alerts to assemble a molecular fragment QSAR model that has predictive power similar to that of full molecular modeling.
Equations (5) and (6) give the formed residual-alert-QSAR equation
( ){ } ( ){ } ( ) ( )SA
mm
m
m
Mm
mm
SAmm
SAmm
SAmm ji
j
i
k
ij
jijijiRAbaARA ,
1,1,1,
1
1
∑ ∑−
+=
≤
=+= (7)
Combining this expression with the activity matching condition of Equation (3), here rewritten in actual terms,
( ){ }SA
mm jiARAA ,= (8)
yields the structural alert residual correlation.
( ){ }( )
( ){ } ( ) ( )⎥⎥⎦
⎤
⎢⎢⎣
⎡
⎟⎟⎠
⎞⎜⎜⎝
⎛+−
−= ∑∑ ∑
∑ ∑ ==
≤
=
=
≤
=
−
+−
+
j
i
ji
j
i
k
ij
jijij
i
k
ij
ji
ji
m
mk
SAk
SAk
SAmm
m
m
Mm
mm
SAmm
SAmmm
m
Mm
mm
SAmm
SAmm Xbaba
bARA 0,0
1,1,1
1,1
,
1
11
1
1
1
(9)
Equation (9) improves upon Equation (4) by using structural alert information instead of molecular information, avoiding singularities in the denominator, i.e.,
( )∑ ∑−
+=
≤
=≠
1
11,11
j
i
k
ij
ji
m
m
Mm
mm
SAmmb (10)
This gives a residual-alert QSAR, a self-consistent correlation equation for the observed activity based on structural alert-predicted activities and residuals thereof. The method is next illustrated by reanalyzing previous toxicological carcinogenic series and studies [20].
3. Results on Genotoxic Carcinogenesis
This study targeted carcinogenic activity in rats (Rattus norvegicus), as measured by TD50 values (in mg/kg body wt/day) derived from the Carcinogenic Potency Database (CPD) [16]. Activity is expressed here as a function of the TD50 values, A = Log(1/TD50). The working series of molecules,

Int. J. Mol. Sci. 2011, 12
5103
were chosen to have a high diversity molecular structure and fulfilling the Topliss-Costello rule [21] according to which their cardinal should be at least 5-times larger the number of structural descriptors used. They are separately shown in Tables 1 and 2, as calibration/trial/trainin sets using Gaussian screening and as test set using quasi-Gaussian distribution screening (Figure 2), respectively. The parameters recommended by Hansch [22] (hydrophobicity, polarizability and total energy) and special reactivity indices (electronegativity and chemical hardness), all computed using the semiempirical PM3 method, were used for both full molecules and structural alerts for the molecules found in Tables 1 and 2.
However, as noted by Hansch, “there is no substitute for extensive experience…in physical organic chemistry and QSAR” [22]. Highly diverse molecular groups were employed in assessing the observed genotoxic carcinogenesis/mutagenicity. Several particular choices or “degrees of freedom” can be considered in to bring the analysis in line with the traditional QSAR dogma of “congeneric molecules”.
• Physicochemical parameters: meaningful physicochemical parameters as hydrophobicity, polarizability, total energy, electronegativity, and chemical hardness should be considered in order to better interpret the derived models in terms of molecular mechanisms.
• Universal hydrophobicity: when a full molecule is identical to its structural alert, the sign of the structural alert may be flipped relative to that of the molecule for the action-reaction solubility characteristics. For instance, this can be applied to the LogP of the reagent because it is the logarithm (base 10) of the partition coefficient (P), the ratio of the compound’s organic (oil)-to-aqueous phase concentrations. Therefore, the opposite and equal values of the molecule and its identical structural alert induce a kind of “universality” in the solvation ability of the concerned toxicant. This approach may be applied to molecules with a recognized high toxicological or carcinogenic potential, and should not be overestimated in the molecular series employed. For the present trial series (Table 1), this approach was employed for molecule no. 3, acetaldehyde (ethanal, C2H4O). Such an approach is justified, because this compound’s average global production is about 106 tons/year [23]; it is a common electrophile in organic synthesis [24] (in agreement with Miller’s electrophilic theory [5,6] of genotoxic carcinogenesis: “there is sufficient evidence for the carcinogenicity of acetaldehyde (the major metabolite of ethanol) in experimental animals”) [25]; it is a probable carcinogen in humans [26], but occurs naturally in coffee, bread and ripe fruit, and is produced by plants as part of their normal metabolism; and it can be spread through air, water, land or groundwater pathways and can be absorbed through inhalation, smoking or consumption [27].
• Equal steric properties: molecules with similar carcinogenic properties may be considered to have equal optimized stericities, i.e., total energies, when their true values are in the same domains. Thus, non-carcinogenic molecules may be considered to be similar in some of their physicochemical properties, including stericity (in this case, associated with total energy). For instance, in the trial series of compounds (Table 1) molecules 8 and 10, have energies of −94064.03906 [eV] and −108827.09 [eV], respectively (as calculated with PM3 and geometry optimization). These can be considered to have the same stericities in intra-cellular binding, due to their similar energies, similar activities in rats (as given by the CPD) [28], close positions in the Gaussian graph (Figure 2) and their identical carcinogenic characteristics [29]

Int. J. Mol. Sci. 2011, 12
5104
such as damage factors, disease-specific factors, and the same uncertainty factor for the combined damage and effect factors. Consequently, the common value was set from the more carcinogenic molecule (10). However, as is the case with the above “universal hydrophobicity” adjustment, the equal stericity principle should be applied with caution (as a rule, it should be applied to less than 10% of the molecules in a series) and only to mark non-congeneric series of molecules with similarity physicochemical properties.
Figure 2. Graphical representation of the working activities for molecules in Tables 1 and 2, classified under the “Gaussian” and “quasi-Gaussian” series for the training and testing QSARs, respectively.
The direct and residual-QSARs as applied to the full molecules and structural alerts shown in Tables 1 and 2 were applied as follows:
Step I: Structural alert QSARs for the trial compounds of Table 1 gave the structural alert activities SAA shown in Table 3. Full molecular QSARs for the trial molecules of Table 1 are reported in Table 4
as “M” computed/predicted models. Combined QSAR predictions based on the molecular descriptors from Table 1 and the structural alert activities of Table 3 are reported in Table 4 as “M∧SA”; these results showcase how consideration of the structural alerts allows systematic improvement of the predictions over the molecular indicators. Note that the structural alert parameters may be combined with the molecular ones only at the level of full molecules; in this way, full molecular parameters are combined with predicted activity at the molecular level as provided by structural alerts modeling.
Step II: Residual QSARs for the structural alert models derived in Step I are computed, considering the predicted activities in Table 3; the results are presented in Table 5. Considerable correlation was found, indicating the indirect influence of structural alerts on mutagenicity and carcinogenesis.
Step III: Structural residual alert QSARs were obtained by selecting models from Step II that reproduce the structural alerts’ parameter correlations (10) as given in Equation (9). The residual-alert methodology may lead to new equations besides those presented in Table 3. The results are displayed in Table 6, with correlation performances reported for the trial molecules of Table 1 and the test compounds of Table 2.

Int. J. Mol. Sci. 2011, 12
5105
Table 1. Molecules from the Gaussian training set (Figure 2) and corresponding rat TD50 toxicities (in mg/kg body wt/day) [16] and activities A = Log(1/TD50) using semi-empirical PM3-computed (Hyperchem [30]) structural parameters: hydrophobicity (LogP), polarizability (POL) [Ǻ3], total optimized energy (Etot) [kcal/mol], electronegativity (χ = −0.5(εLUMO + εHOMO)) [eV], and chemical hardness (η = 0.5(εLUMO – εHOMO)) [eV].
No. Full Molecule: Chemical Structure
Full Molecule: Name Formula (CASRN)
Toxicity: TD50
Activity: A = Log[1/TD50]
Structural Alert (SA)
LogP: Full Molecules Structural Alert
POL [Ǻ3]: Full Molecules Structural Alert
Etot [kcal/mol]:Full Molecules Structural Alert
χ [eV]: Full Molecules Structural Alert
η [eV]: Full Molecules Structural Alert
1.
O
O
N
N
O
O
CH3
CH3
3,3'-Dimethoxy-4,4'-biphenylene diisocyanate (3,3'-Dimethoxybenzidine-4,4'-diisocyanate) C16H12N2O4 (91-93-0)
1630 2.79
N
O
2.07 −0.46
30.03 3.27
−82478.58594 −13584.68848
4.74077805 5.0497393
3.85074395 5.54064075
2. O
O
OH OH Chrysazin (Danthron) C14H8O4 (117-10-2)
245 3.61
O
O
1.87 1.52
24.44 10.8
−68162.28125 −31325.97266
5.4079765 6.3137325
3.9369375 4.6074975
3. CH3 C
H
O
Acetaldehyde C2H4O (75-07-0)
153 3.82 CH3 C
H
O
−0.58 +0.58
4.53 4.53
−13662.00781 −13662.00781
4.94880425 4.94880425
5.75505575 5.75505575
4.
CH2
N S Allyl isothiocyanate C4H5NS (57-06-7)
96 4.02
NH S
1.17 0.19
11.74 6.43
−20700.27344 −11094.80273
4.9388987 5.032356
4.2117593 4.346452
5.
CH3
CH3
ON
O
Isobutyl nitrite C4H9NO2 (542-56-3)
54.1 4.27
OHN
O
1.63 0.38
9.96 2.62
−31363 −17580.39258
5.294418075 5.4457523
5.263031925 5.3349777

Int. J. Mol. Sci. 2011, 12
5106
Table 1. Cont. No. Full Molecule:
Chemical Structure Full Molecule: Name Formula (CASRN)
Toxicity: TD50
Activity: A = Log[1/TD50]
Structural Alert (SA)
LogP: Full Molecules Structural Alert
POL [Ǻ3]: Full Molecules Structural Alert
Etot [kcal/mol]:Full Molecules Structural Alert
χ [eV]: Full Molecules Structural Alert
η [eV]: Full Molecules Structural Alert
6.
O CH3NH2
O Urethane C3H7NO2 (51-79-6)
41.3 4.38
ONH2
O
−0.06 −0.44
8.35 4.68
−27989.58203 −21103.80273
4.573154 4.474373
5.741656 5.576267
7. O
Ethylene oxide C2H4O (75-21-8)
21.3 4.67
O −0.16 −0.16
4.31 4.31
−13626.54297 −13626.54297
4.4747555 4.4747555
6.8617045 6.8617045
8.
N N
N
N
OH
OH
N OH
OH
NOH
OH Hexa(hydroxymethyl)melamine C9H18N6O6 (531-18-0)
10.2 4.99
OHNH2
1.96 0.08
27.19 5.08
−108827.09 −14382.44336
4.05956015 3.782247
4.50969485 7.116263
9. Cl
Cl
1,2-Dichloroethane C2H4Cl2 (107-06-2)
8.04 5.09
ClCH3
1.59 1.22
8.3 6.37
−21506.41406 −14559.67578
5.0714835 4.586889
5.6050665 5.823301
10.
P OOO
O
Br
Br
BrBr
Br
Br Tris(2,3-dibromopropyl) phosphate C9H15Br6O4P (126-72-7)
3.83 5.42 P
O
OO
Br
Br
BrBr
O5.37 3.73
35.91 25.15
−108827.09 −82903.73
5.6512295 5.3925243
4.5231705 4.63098575
11. O
O
Beta-Propiolactone C3H4O2 (57-57-8)
1.46 5.84
O
O
−0.25 −0.25
6.23 6.23
−23148.73047 −23148.73047
5.2018966 5.2018966
6.0842834 6.0842834
12. O
OHN
Cl
Cl
Chlorambucil C14H19Cl2NO2 (305-03-3)
0.896 6.048 N
Cl
Cl 4.14 1.2
31.04 13.32
−76933.42969 −32495.47656
4.350258535 4.4258064
4.405313465 5.31470165

Int. J. Mol. Sci. 2011, 12
5107
Table 1. Cont. No. Full Molecule:
Chemical Structure Full Molecule: Name Formula (CASRN)
Toxicity: TD50
Activity: A = Log[1/TD50]
Structural Alert (SA)
LogP: Full Molecules Structural Alert
POL [Ǻ3]: Full Molecules Structural Alert
Etot [kcal/mol]:Full Molecules Structural Alert
χ [eV]: Full Molecules Structural Alert
η [eV]: Full Molecules Structural Alert
13.
OHON
+N O
NH2
O
Azaserine C5H7N3O4 (115-02-6)
0.793 6.10
CH2
N+
N
−1.03 −0.04
14.25 4.11
−54439.625 −10877.61426
5.2656847 4.431137
4.7215543 4.794258
14. N NH
NNH2
O N NCH3
CH3
Dacarbazine C6H10N6O (4342-03-4)
0.71 6.15
NHN NH2
−0.92 0.48
17.95 4.18
−49126.58594 −12249.66113
4.9880568 4.2572947
4.1820822 5.06465235
15.
P NNN
S Thiotepa (Tris(aziridinyl)-phosphine sulfide) C6H12N3PS (52-24-4)
0.164 6.789 N
0.54 −0.38
17.63 5.02
−38905.46484 −10956.04395
5.2831755 3.5910075
3.8071835 6.3290665
16.
O
O
O
OCH3
OO
H
H Aflatoxin-B1 C17H12O6 (1162-65-8)
0.0032 8.49
O
O
0.99 1.82
29.86 15.7
−91307.82331 −40247.55469
5.3273625 5.2410253
3.9567405 4.2472247
17. Cl
Cl
OCl
Cl O
2,3,7,8-Tetrachlorodibenzo-p-dioxin C12H4Cl4 O2 (1746-01-6)
0.0000457 10.34
Cl
Cl
OCl
Cl O 4.93 4.93
28.31 28.31
−76933.75 −76933.75
4.7914412 4.7914412
4.0075488 4.0075488
18.
O
OOH
OCH3
O
O
H
H
Aflatoxicol C17H14 O6 (29611-03-8)
0.00247 8.61
O
O
0.46 1.82
30.41 15.7
−91979.58594 −40247.55469
5.140259 5.2410253
3.945276 4.2472247

Int. J. Mol. Sci. 2011, 12
5108
Table 1. Cont. No. Full Molecule:
Chemical Structure Full Molecule: Name Formula (CASRN)
Toxicity: TD50
Activity: A = Log[1/TD50]
Structural Alert (SA)
LogP: Full Molecules Structural Alert
POL [Ǻ3]: Full Molecules Structural Alert
Etot [kcal/mol]:Full Molecules Structural Alert
χ [eV]: Full Molecules Structural Alert
η [eV]: Full Molecules Structural Alert
19.
OHN NH2
O
NO 1-(2-Hydroxyethyl)-1-
nitrosourea C3H7N3O3 (13743-07-2)
0.244 6.61 N
O
N
−0.95 0.37
10.92 2.55
−42184.19141 −14202.18945
5.42904375 5.8565512
5.08170625 6.2971588
20. N
+
NNO
ON'-Nitrosonornicotine-1-N-oxide C9H11N3O2 (78246-24-9)
0.876 6.06
N+
O
0.25 0.12
19.48 10.35
−53174.95313 −25900.39453
5.04527 4.9295405
4.273811 4.3386305
21. Benzo(a)pyrene C20H12 (50-32-8)
0.956 6.02
5.37 5.37
36.04 36.04
−58881.02734 −58881.02734
4.631374 4.631374
3.410258 3.410258
22.
NH
CH3
O
2-Acetylaminofluorene C15H13NO (53-96-3)
1.22 5.91 N
H
CH3
O
2.61 2.61
26.26 26.26
−56110.60547 −56110.60547
4.38615285 4.38615285
4.02819215 4.02819215
23. Br
Br
1,2-Dibromoethane C2H4Br2 (106-93-4)
1.52 5.82
CH3 Br
1.71 1.29
9.7 7.07
−28203.0625 −15407.94336
6.1527065 5.5320367
5.0695035 5.37857335
24. O
NN CH3
CH3
CH3
CH3
Michler's ketone C17H20N2O (90-94-8)
5.64 5.25
N CH3
CH3
3.8 2.31
19.85 15.46
−67801.28125 −29500.11719
4.3453716 3.6634669
4.1924714 4.2943161

Int. J. Mol. Sci. 2011, 12
5109
Table 1. Cont. No. Full Molecule:
Chemical Structure Full Molecule: Name Formula (CASRN)
Toxicity: TD50
Activity: A = Log[1/TD50]
Structural Alert (SA)
LogP: Full Molecules Structural Alert
POL [Ǻ3]: Full Molecules Structural Alert
Etot [kcal/mol]:Full Molecules Structural Alert
χ [eV]: Full Molecules Structural Alert
η [eV]: Full Molecules Structural Alert
25.
NHNH
S
Ethylene thiourea (ETU) C3H6N2S (96-45-7)
8.13 5.09
NHNH
S 0.33 0.33
11.45 11.45
−22095.42578 −22095.42578
4.40057075 4.40057075
4.20081425 4.20081425
26. S
CH3NH2
Thioacetamide C2H5NS (62-55-5)
11.5 4.94
S
NH2HC
−0.21 −0.42
9.04 7.21
−15263.96289 −11813.05762
4.72959049 4.7550568
3.99513951 4.0219202
27.
N+O
OO CH3
o-Nitroanisole C7H7NO3 (91-23-6)
15.6 4.81
N+O
O
−0.18 0.07
14.75 12.28
−45613.03906 −35381.23828
5.5631575 5.8686355
4.3657605 4.7339745
28.
N
NN
NH2
2-Aminodipyrido[1,2-a:3`,2`-d]imidazole (Glu-P-2) C10H8N4 (67730-10-3)
42.3 4.37
N
NN
2.35 2.9
20.73 19.38
−45103.06641 −40998.30859
4.5267029 4.7452532
3.7506371 3.87575785
29.
Cl Cl
ClClCl Dichlorodiphenyltrichloroet
hane (DDT) C14H9Cl5 (50-29-3)
84.7 4.07 Cl Cl
6.39 4.92
33.4 25.23
−77956.60156 −52871.28516
4.95182645 5.0230205
4.50488155 3.2895935
30. CH3
O CH3
NH2
p-Cresidine C8H11NO (120-71-8)
98 4.01
NH2
1.48 1.26
16.09 11.79
−36280.75391 −22612.99212
3.9300665 3.7259962
4.3473585 4.3413348

Int. J. Mol. Sci. 2011, 12
5110
Table 1. Cont. No. Full Molecule:
Chemical Structure Full Molecule: Name Formula (CASRN)
Toxicity: TD50
Activity: A = Log[1/TD50]
Structural Alert (SA)
LogP: Full Molecules Structural Alert
POL [Ǻ3]: Full Molecules Structural Alert
Etot [kcal/mol]:Full Molecules Structural Alert
χ [eV]: Full Molecules Structural Alert
η [eV]: Full Molecules Structural Alert
31.
O
ClCH3
CH3
O
OCH3
Ethyl 2-(4-chlorophenoxy)-2-methylpropionate (Clofibrate) C12H15 Cl O3 (637-07-0)
169 3.77
Cl
2.97 2.56
24.73 12.36
−65740.6875 −25464.87109
4.49111609 4.6624658
4.53578491 4.72527225
32.
O
O
CH2H3C
Vinyl acetate C4H6O2 (108-05-4)
341 3.47 O CH-
−0.01 1.28
8.65 3.98
−26598.12305 −12920.42871
4.6849081 4.5472153
5.2657279 4.91445575
33.
N
OHO
OH
N
SNH
OON
Salicylazosulfapyridine C18H14N4O5S (599-79-1)
1590 2.799
NN
4.54 4.35
36.79 22.15
−107222.1719 −43772.44922
5.209331 5.0515378
3.898064 4.2222632

Int. J. Mol. Sci. 2011, 12
5111
Table 2. Molecules from the quasi-Gaussian test set (Figure 2), with the activities and structural parameters as in Table 1. No. Full Molecule:
Chemical Structure Full Molecule: Name Formula (CASRN)
Toxicity: TD50
Activity: A = Log[1/TD50]
Structural Alert (SA)
LogP: Full Molecules Structural Alert
POL [Ǻ3]: Full Molecules Structural Alert
Etot [kcal/mol]:Full Molecules Structural Alert
χ [eV]: Full Molecules Structural Alert
η [eV]: Full Molecules Structural Alert
34.
NH
O
CH3
O
CH3
Phenacetin C10H13NO2 (62-44-2)
1250 2.90
NH
CH3
O
0.99 −0.03
19.85 15.73
−49230.08203 −36279.96484
4.063315 4.1985829
4.307675 4.3648181
35.
Cl
CH3
CH3
Dimethylvinyl chloride (DMVC) C4H7Cl (513-37-1)
31.8 4.498 C
2-
Cl
1.51 0.45
9.85 4.05
−20725.60325 −13014.37793
4.32596855 5.6212095
4.98083445 4.2918295
36.
Cl
CH2N S
S
CH3
CH3
Sulfallate C8H14ClNS2 (95-06-7)
26.1 4.58
N S
S
2.73 0.62
24.79 10.21
−46435.69922 −16106.21777
4.8447835 5.093712
3.8753115 3.905288
37. O
CH3
O beta-Butyrolactone C4H6O2 (3068-88-0)
13.8 4.86 O
O
0.17 −0.25
8.06 6.23
−26599.55273 −23148.73047
5.1344426 5.2020294
6.0826774 6.0841706
38. CH2
Cl
Vinyl Chloride C2H3Cl (75-01-4)
6.11 5.21
CH2
Cl
1.01 1.01
6.18 6.18
−13820.70898 −13820.70898
4.56666095 4.56666095
5.27117005 5.27117005
39. NH2
OH2C
Acrylamide C3H5NO (79-06-1)
3.75 5.43 CH
OH2C
−0.28 0.17
7.52 6.17
−20478.92578 −16372.65625
4.77457395 5.4404992
4.91861805 5.25305085
40. Mirex C10Cl12 (2385-85-5)
1.77 5.75
6.41 6.41
38.39 38.39
−114919.4688 −114919.4688
5.27780275 5.2778028
5.22349725 5.22349725

Int. J. Mol. Sci. 2011, 12
5112
Table 2. Cont. No. Full Molecule:
Chemical Structure Full Molecule: Name Formula (CASRN)
Toxicity: TD50
Activity: A = Log[1/TD50]
Structural Alert (SA)
LogP: Full Molecules Structural Alert
POL [Ǻ3]: Full Molecules Structural Alert
Etot [kcal/mol]:Full Molecules Structural Alert
χ [eV]: Full Molecules Structural Alert
η [eV]: Full Molecules Structural Alert
41.
NN
+O
O
CH3
H3CDimethylnitramine C2H6N2O2 (4164-28-7)
0.547 6.26
N2-N
+O
O
0.97 1.32
7.64 3.18
−28551.91406 −20856.80078
5.288693895 7.5671675
5.374516105 4.9321725
42.
N NCH3
CH3
O
N-Nitrosodimethylamine C2H6N2O (62-75-9)
0.0959 7.02
N2-
N O 0.01 0.37
7.01 2.55
−21802.08203 −14202.18945
4.6046239 5.8565512
5.1639551 6.2971588
43.
N NN
+
N
NH
O
O
O
H3C
N-Methyl-N`-nitro-N-nitrosoguanidine (1-Methyl-3-nitro-1-nitroso-guanidine) C2H5N5O3 (70-25-7)
0.803 6.1 N
+NHO
O
1.5 0.84
11.13 3.97
−46112.81641 −21661.2832
5.475207 5.8694368
4.654173 5.785463245
44.
N NN
CH3
CH3
1-Phenyl-3,3-dimethyltriazene C8H11N3 (7227-91-0)
2.31 5.64
NH NNH2
2.53 0.48
17.51 4.18
−36944.65625 −12249.66113
4.65555575 4.2572947
4.28693125 5.06465235
45.
NH
NH
Hydrazobenzene C12H12N2 (122-66-7)
5.59 5.25
NH-NH-
3.4 −0.65
22.8 2.83
−44481.07422 −8164.909668
3.65518885 4.5593574
3.99645815 5.0568536
46.
O
O
O
CH2
CH3
O
1'-Acetoxysafrole C12H12O4 (34627-78-6)
25 4.6 O CH-
−0.11 1.28
22.47 3.98
−64108.48047 −12920.42871
4.516422835 4.5472153
4.517086165 4.91445575

Int. J. Mol. Sci. 2011, 12
5113
Table 2. Cont. No. Full Molecule:
Chemical Structure Full Molecule: Name Formula (CASRN)
Toxicity: TD50
Activity: A = Log[1/TD50]
Structural Alert (SA)
LogP: Full Molecules Structural Alert
POL [Ǻ3]: Full Molecules Structural Alert
Etot [kcal/mol]:Full Molecules Structural Alert
χ [eV]: Full Molecules Structural Alert
η [eV]: Full Molecules Structural Alert
47.
NO
CH3 o-Nitrosotoluene C7H7NO (611-23-4)
50.7 4.29
NO
2.29 1.82
13.48 11.65
−32074.53516 −28624.52734
5.20234765 5.2781928
4.40152935 4.43740625
48. NH
NO
p-Nitrosodiphenyl amine C12H10N2O (156-10-5)
201 3.7
NO
3.07 1.82
22.66 11.65
−50526.36328 −28624.52734
4.57337225 5.2781928
3.74357475 4.43740625
49. Cl
Cl
1,4-Dichlorobenzene(p-dichlorobenzene)C6H4Cl2 (106-46-7)
644 3.19
Cl
Cl
3.08 3.08
14.29 14.29
−32415.54297 −32415.54297
4.73892295 4.73892295
4.49613405 4.49613405
Table 3. QSAR models for the activities of the trial molecules with the physicochemical parameters of the SAs in Table 1.
Variable QSAR Model Pred. Activity R SAχ SAχ07.062.5 − SAAχ 0.026 SAη SAη149.0016.6 − SAAη 0.086
SAPOL SAPOL05.0677.4 + SAPOLA 0.27
SALogP SALogP159.0066.5 + SALogPA 0.16
SAtotE SA
totE00031.0402.4 − SAEtotA 0.35
SASA ηχ , SASA ηχ 156.009.051.6 −− SAA ηχ , 0.093 SASA POL,χ SASA POL5.008.01.5 +− χ SA
POLA ,χ 0.27 SASA LogP,χ SASA LogP16.01.054.5 +− χ SA
LogPA ,χ 0.16 SAtot
SA E,χ SAtot
SA E000032.0255.058.5 −− χ SAEtotA ,χ 0.371

Int. J. Mol. Sci. 2011, 12
5114
Table 3. Cont.
Variable QSAR Model Pred. Activity R SASA POL,η SASA POL08.038.043.2 ++ η SA
POLA ,η 0.316 SASA LogP,η SASA LogP179.005.075.4 ++ η SA
LogPA ,η 0.167 SAtot
SA E,η SAtot
SA E00004.0314.06.2 −+ η SAEtotA ,η 0.38
SASA LogPPOL , SASA LogPPOL 44.012.036.4 −+ SALogPPOLA , 0.337
SAtot
SA EPOL , SAtot
SA EPOL 00005.00625.038.4 −− SAEtotPOLA , 0.382
SASAtot LogPE , SA
totSA ELogP 00006.0412.009.4 −− SA
LogPEtotA , 0.4305 SASASA POL,,ηχ SASASA POL08.0382.0035.062.2 ++− ηχ SA
POLA ,,ηχ 0.31 SASASA LogP,,ηχ SASASA LogP179.0049.0095.025.5 ++− ηχ SA
LogPA ,,ηχ 0.17 SAtot
SASA E,,ηχ SAtot
SASA E00004.03141.0254.078.3 −+− ηχ SAEtotA ,,ηχ 0.399
SASASA LogPPOL ,,χ SASASA LogPPOL 439.012.00325.052.4 −+− χ SALogPPOLA ,,χ 0.337
SAtot
SASA EPOL ,,χ SAtot
SASA EPOL 0007.0092.045.046.6 −−− χ SAEtotPOLA ,,χ 0.4141
SAtot
SASA ELogP ,,χ SAtot
SASA ELogP 00006.045.036.075.5 −−− χ SAEtotLogPA ,,χ 0.451
SASASA LogPPOL ,,η SASASA LogPPOL 449.016.039.005.2 −++ η SALogPPOLA ,,η 0.373
SAtot
SASA EPOL ,,η SAtot
SASA EPOL 00005.0034.022.009.3 −−+ η SAEtotPOLA ,,η 0.392
SAtot
SASA ELogP ,,η SAtot
SASA ELogP 0006.0368.0156.023.3 −−+ η SAEtotLogPA ,,η 0.436
SAtot
SASA ELogPPOL ,, SAtot
SASA ELogPPOL 000057.045.0015.007.4 −−+ SAEtotLogPPOLA ,, 0.4312
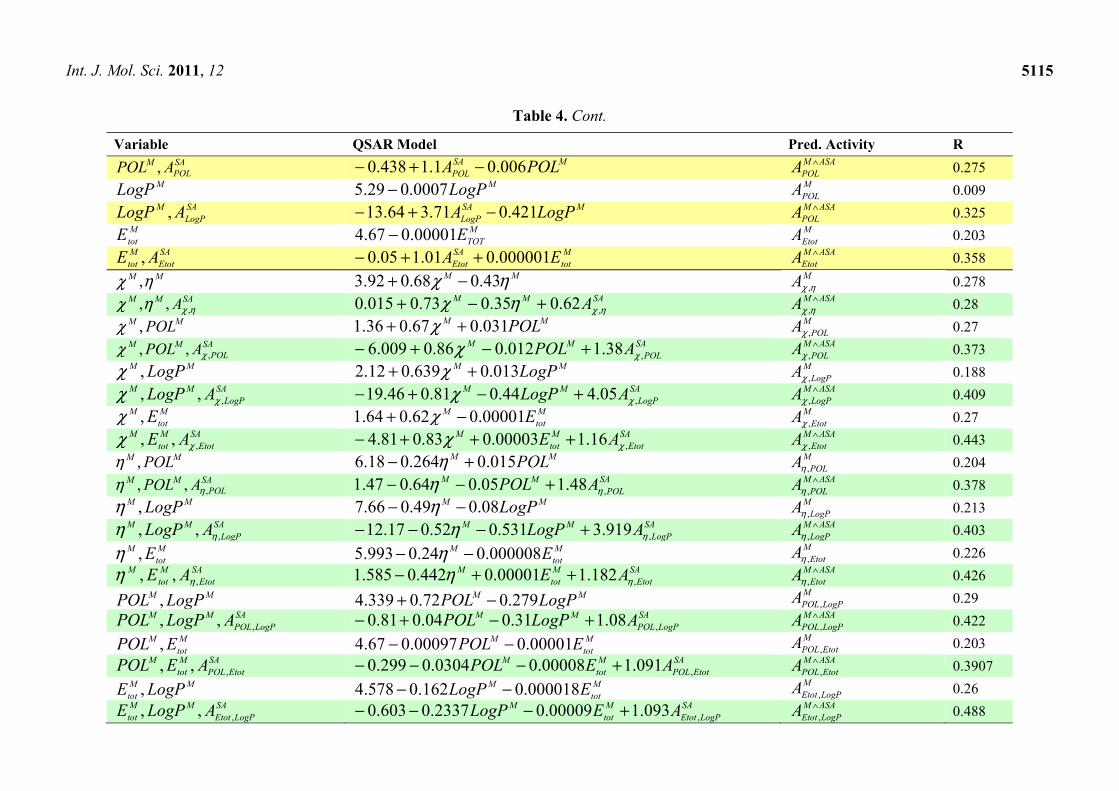
Table 4. Multi-linear QSAR models for the trial molecular activities with the full molecular (M) physicochemical parameters of Table 1 and the corresponding activities of the structural alerts (ASA or ASA) from Table 3.
Variable QSAR Model Pred. Activity R Mχ Mχ63.018.2 + MAχ 0.187
SAM Aχχ , MSAA χχ 41.11.1266.65 ++− ASAMA ∧χ 0.295
Mη Mη405.013.7 − MAη 0.192 SAM Aηη , MSAA ηη 49.0073138.11 −− ASAMA ∧
η 0.198 MPOL MPOL029.071.4 +
MPOLA 0.18
Int. J. Mol. Sci. 2011, 12
5115
Table 4. Cont.
Variable QSAR Model Pred. Activity R SAPOL
M APOL , MSAPOL POLA 006.01.1438.0 −+− ASAM
POLA ∧ 0.275 MLogP MLogP0007.029.5 − M
POLA 0.009 SALogP
M ALogP , MSALogP LogPA 421.071.364.13 −+− ASAM
POLA ∧ 0.325 MtotE M
TOTE00001.067.4 − MEtotA 0.203
SAEtot
Mtot AE , M
totSAEtot EA 000001.001.105.0 ++− ASAM
EtotA ∧ 0.358 MM ηχ , MM ηχ 43.068.092.3 −+ MA ηχ , 0.278
SAMM A ηχηχ ,,, SAMM A ηχηχ ,62.035.073.0015.0 +−+ ASAMA ∧ηχ , 0.28
MM POL,χ MM POL031.067.036.1 ++ χ MPOLA ,χ 0.27
SAPOL
MM APOL ,,, χχ SAPOL
MM APOL ,38.1012.086.0009.6 χχ +−+− ASAMPOLA ∧
,χ 0.373 MM LogP,χ MM LogP013.0639.012.2 ++ χ M
LogPA ,χ 0.188 SA
LogPMM ALogP ,,, χχ SA
LogPMM ALogP ,05.444.081.046.19 χχ +−+− ASAM
LogPA ∧,χ 0.409
Mtot
M E,χ Mtot
M E00001.062.064.1 −+ χ MEtotA ,χ 0.27
SAEtot
Mtot
M AE ,,, χχ SAEtot
Mtot
M AE ,16.100003.083.081.4 χχ +++− ASAMEtotA ∧
,χ 0.443 MM POL,η MM POL015.0264.018.6 +− η M
POLA ,η 0.204 SA
POLMM APOL ,,, ηη SA
POLMM APOL ,48.105.064.047.1 ηη +−− ASAM
POLA ∧,η 0.378
MM LogP,η MM LogP08.049.066.7 −− η MLogPA ,η 0.213
SALogP
MM ALogP ,,, ηη SALogP
MM ALogP ,919.3531.052.017.12 ηη +−−− ASAMLogPA ∧
,η 0.403 Mtot
M E,η Mtot
M E000008.024.0993.5 −− η MEtotA ,η 0.226
SAEtot
Mtot
M AE ,,, ηη SAEtot
Mtot
M AE ,182.100001.0442.0585.1 ηη ++− ASAMEtotA ∧
,η 0.426 MM LogPPOL , MM LogPPOL 279.072.0339.4 −+ M
LogPPOLA , 0.29 SA
LogPPOLMM ALogPPOL ,,, SA
LogPPOLMM ALogPPOL ,08.131.004.081.0 +−+− ASAM
LogPPOLA ∧, 0.422
Mtot
M EPOL , Mtot
M EPOL 00001.000097.067.4 −− MEtotPOLA , 0.203
SAEtotPOL
Mtot
M AEPOL ,,, SAEtotPOL
Mtot
M AEPOL ,091.100008.00304.0299.0 +−−− ASAMEtotPOLA ∧
, 0.3907 MM
tot LogPE , Mtot
M ELogP 000018.0162.0578.4 −− MLogPEtotA , 0.26
SALogPEtot
MMtot ALogPE ,,, SA
LogPEtotMtot
M AELogP ,093.100009.02337.0603.0 +−−− ASAMLogPEtotA ∧
, 0.488

Int. J. Mol. Sci. 2011, 12
5116
Table 4. Cont.
Variable QSAR Model Pred. Activity R MMM POL,,ηχ MMM POL016.028.0686.089.2 +−+ ηχ M
POLA ,,ηχ 0.288 SA
POLMMM APOL ,,,,, ηχηχ SA
POLMMM APOL ,,62.106.0696.086.019.3 ηχηχ +−−+− ASAM
POLA ∧,,ηχ 0.452
MMM LogP,,ηχ MMM LogP06.05.065.0458.4 −−+ ηχ MLogPA ,,ηχ 0.287
SALogP
MMM ALogP ,,,,, ηχηχ SALogP
MMM ALogP ,,054.452.049.0794.0899.16 ηχηχ +−−+− ASAMLogPA ∧
,,ηχ 0.462 Mtot
MM E,,ηχ Mtot
MM E00007.0293.065.0016.3 −−+ ηχ MEtotA ,,ηχ 0.298
SAEtot
Mtot
MM AE ,,,,, ηχηχ SAEtot
Mtot
MM AE ,,256.100001.0473.0841.0689.2 ηχηχ ++−+− ASAMEtotA ∧
,,ηχ 0.497 MMM LogPPOL ,,χ MMM LogPPOL 2512.007.058.0481.1 −++ χ M
LogPPOLA ,,χ 0.338 SA
LogPPOLMMM ALogPPOL ,,,,, χχ SA
LogPPOLMMM ALogPPOL ,,254.1281.0037.081.0593.5 χχ +−++− ASAM
LogPPOLA ∧,,χ 0.483
Mtot
MM EPOL ,,χ Mtot
MM EPOL 000007.0012.064.0503.1 −++ χ MEtotPOLA ,,χ 0.276
SAEtotPOL
Mtot
MM AEPOL ,,,,, χχ SAEtotPOL
Mtot
MM AEPOL ,,123.100001.0008.0725.0009.4 χχ ++−+− ASAMEtotPOLA ∧
,,χ 0.469 Mtot
MM ELogP ,,χ Mtot
MM ELogP 000017.0134.0538.0961.1 −−+ χ MEtotLogPA ,,χ 0.304
SAEtotLogP
Mtot
MM AELogP ,,,,, χχ SAEtotLogP
Mtot
MM AELogP ,,166.100007.0219.068.0251.4 χχ +−−+− ASAMEtotLogPA ∧
,,χ 0.552 MMM LogPPOL ,,η MMM LogPPOL 269.0066.0093.087.4 −+− η M
LogPPOLA ,,η 0.294 SA
LogPPOLMMM ALogPPOL ,,,,, ηη SA
LogPPOLMMM ALogPPOL ,,156.1321.0033.0153.0253.0 ηη +−+−− ASAM
LogPPOLA ∧,,η 0.466
Mtot
MM EPOL ,,η Mtot
MM EPOL 00018.0368.039.084.6 −−− η MEtotPOLA ,,η 0.239
SAEtotPOL
Mtot
MM AEPOL ,,,,, ηη SAEtotPOL
Mtot
MM AEPOL ,,598.100002.013.008.1415.3 ηη +−−− ASAMEtotPOLA ∧
,,η 0.507 Mtot
MM ELogP ,,η Mtot
MM ELogP 000015.0177.0303.0176.6 −−− η MEtotLogPA ,,η 0.287
SAEtotLogP
Mtot
MM AELogP ,,,,, ηη SAEtotLogP
Mtot
MM AELogP ,,172.100003.0261.0449.0433.1 ηη +−−− ASAMEtotLogPA ∧
,,η 0.525 Mtot
MM ELogPPOL ,, Mtot
MM ELogPPOL 000002.0273.006.0341.4 −−+ MEtotLogPPOLA ,, 0.298
SAEtotLogPPOL
Mtot
MM AELogPPOL ,,,,, SAEtotLogPPOL
Mtot
MM AELogPPOL ,,065.1000002.0288.0031.0598.0 +−−+− ASAMEtotLogPPOLA ∧
,, 0.495

Int. J. Mol. Sci. 2011, 12
5117
Table 5. Residual-QSARs for the structural alert models of Table 3.
Variable QSAR Model Pred. Activity R SARAχ SARAχ+2856.5 SAARAχ 0.999 SARAη SARAη+2856.5 SAARAη 0.996 SAPOLRA SA
POLRA+2856.5 SAPOLARA 0.961
SALogPRA SA
LogPRA+2856.5 SALogPARA 0.986
SAEtotRA SA
EtotRA+2856.5 SAEtotARA 0.933
SASA RARA ηχ , SASA RARA ηχ 114.0886.02856.5 ++ SAARA ηχ , 0.999 SAPOL
SA RARA ,χ SAPOL
SA RARA 013.0987.02856.5 ++ χ SAPOLARA ,χ 0.999
SALogP
SA RARA ,χ SALogP
SA RARA 037.0963.02856.5 ++ χ SALogPARA ,χ 0.999
SAEtot
SA RARA ,χ SAEtot
SA RARA 022.098.02856.5 ++ χ SAEtotARA ,χ 0.999
SAPOL
SA RARA ,η SAPOL
SA RARA 206.0194.12856.5 −+ η SAPOLARA ,η 0.997
SALogP
SA RARA ,η SALogP
SA RARA 103.0101.12856.5 −+ η SALogPARA ,η 0.996
SAEtot
SA RARA ,η SAEtot
SA RARA 118.0105.12856.5 −+ η SAEtotARA ,η 0.996
SALogP
SAPOL RARA , SA
LogPSAPOL RARA 684.1709.02856.5 +− SA
LogPPOLARA , 0.991 SAEtot
SAPOL RARA , SA
EtotSAPOL RARA 670.0642.12856.5 −+ SA
EtotPOLARA , 0.966 SAEtot
SALogP RARA , SA
EtotSALogP RARA 430.0395.12856.5 −+ SA
EtotLogPARA , 0.991 SAPOL
SASA RARARA ,, ηχSAPOL
SASA RARARA 030.0176.0852.02856.5 −++ ηχSA
POLARA ,,ηχ 0.999 SALogP
SASA RARARA ,, ηχSALogP
SASA RARARA 007.0123.0884.02856.5 −++ ηχSA
LogPARA ,,ηχ 0.999 SAEtot
SASA RARARA ,, ηχSAEtot
SASA RARARA 004.0104.0892.02856.5 +++ ηχSA
EtotARA ,,ηχ 0.999 SALogP
SAPOL
SA RARARA ,,χSALogP
SAPOL
SA RARARA 102.0045.0941.02856.5 +−+ χSA
LogPPOLARA ,,χ 0.999 SAEtot
SAPOL
SA RARARA ,,χSAEtot
SAPOL
SA RARARA 080.0081.0005.12856.5 +−+ χSA
EtotPOLARA ,,χ 0.999 SAEtot
SALogP
SA RARARA ,,χSAEtot
SALogP
SA RARARA 023.0003.0983.02856.5 +−+ χSA
EtotLogPARA ,,χ 0.999 SALogP
SAPOL
SA RARARA ,,ηSALogP
SAPOL
SA RARARA 450.0418.0951.02856.5 +−+ ηSA
LogPPOLARA ,,η 0.997 SAEtot
SAPOL
SA RARARA ,,ηSAEtot
SAPOL
SA RARARA 067.0290.0212.12856.5 +−+ ηSA
EtotPOLARA ,,η 0.997 SAEtot
SALogP
SA RARARA ,,ηSAEtot
SALogP
SA RARARA 185.0213.0955.02856.5 −++ ηSA
EtotLogPARA ,,η 0.997 SAEtot
SALogP
SAPOL RARARA ,, SA
EtotSALogP
SAPOL RARARA 227.0617.1423.02856.5 −+− SA
EtotLogPPOLARA ,, 0.991

Int. J. Mol. Sci. 2011, 12
5118
Table 5. Cont.
Variable QSAR Model Pred. Activity R SALogP
SAPOL
SASA RARARARA ,,, ηχ SALogP
SAPOL
SASA RARARARA 093.0082.0170.0815.02856.5 +−++ ηχ SALogPPOLARA ,,,ηχ 0.999
SAEtot
SALogP
SAPOL
SA RARARARA ,,,χ SAEtot
SALogP
SAPOL
SA RARARARA 074.0083.0121.0966.02856.5 ++−+ χ SAEtotLogPPOLARA ,,,χ 0.999
SAEtot
SALogP
SAPOL
SA RARARARA ,,,η SAEtot
SALogP
SAPOL
SA RARARARA 038.0422.0461.0966.02856.5 ++−+ η SAEtotLogPPOLARA ,,,η 0.999
SAEtot
SALogP
SASA RARARARA ,,, ηχ SAEtot
SALogP
SASA RARARARA 016.0034.0117.0902.02856.5 +−++ ηχ SAEtotLogPARA ,,,ηχ 0.999
SAEtot
SAPOL
SASA RARARARA ,,, ηχ SAEtot
SAPOL
SASA RARARARA 088.0138.0193.0858.02856.5 +−++ ηχ SAEtotPOLARA ,,,ηχ 0.999
SAEtot
SALogP
SAPOL
SASA RARARARARA ,,,, ηχ SAEtot
SALogP
SAPOL
SASA RARARARARA 083.0070.0171.0188.0830.02856.5 ++−++ ηχ SAEtotLogPPOLARA ,,,,ηχ 0.999
( )SARA ηχ , ( )
SARA ηχ ,2856.5 + ( )SAARA ηχ , 0.99
( )SA
POLRA ,χ ( )SA
POLRA ,2856.5 χ+ ( )SA
POLARA ,χ 0.96
( )SA
LogPRA ,χ ( )SA
LogPRA ,2856.5 χ+ ( )SA
LogPARA ,χ 0.985
( )SA
EtotRA ,χ ( )SA
EtotRA ,2856.5 χ+ ( )SA
EtotARA ,χ 0.928
( )SA
POLRA ,η ( )SA
POLRA ,2856.5 η+ ( )SA
POLARA ,η 0.985
( )SA
LogPRA ,η ( )SA
LogPRA ,2856.5 η+ ( )SA
LogPARA ,η 0.985
( )SA
EtotRA ,η ( )SA
EtotRA ,2856.5 η+ ( )SA
EtotARA ,η 0.92
( )SA
LogPPOLRA , ( )SA
LogPPOLRA ,2856.5 + ( )SA
LogPPOLARA , 0.93
( )SA
EtotPOLRA , ( )SA
EtotPOLRA ,2856.5 + ( )SA
EtotPOLARA , 0.923
( )SA
LogPEtotRA , ( )SA
LogPEtotRA ,2856.5 + ( )SA
LogPEtotARA , 0.902
( ) ( )SA
LogPPOLRA ,,,ηχ ( ) ( )SA
LogPPOLSA RARA ,, 212.0200.12856.5 −+ ηχ ( ) ( )
SALogPPOLARA ,,,ηχ 0.996
( ) ( )SA
EtotPOLRA ,,,ηχ ( ) ( )SA
EtotPOLSA RARA ,, 0003.00003.12856.5 −+ ηχ ( ) ( )
SAEtotPOLARA ,,,ηχ 0.995
( ) ( )SA
LogPEtotRA ,,,ηχSA
LogPEtotSA RARA ,, 0009.09991.02856.5 ++ ηχ ( ) ( )
SALogPEtotARA ,,,ηχ 0.995
( ) ( )SA
LogPPOLRA ,,, ηχ ( ) ( )SA
LogPSA
POL RARA ,, 471.1490.02856.5 ηχ +− ( ) ( )SA
LogPPOLARA ,,, ηχ 0.988

Int. J. Mol. Sci. 2011, 12
5119
Table 5. Cont.
Variable QSAR Model Pred. Activity R
( ) ( )SA
EtotPOLRA ,,, ηχ ( ) ( )SA
EtotSA
POL RARA ,, 036.0033.12856.5 ηχ −+ ( ) ( )SA
EtotPOLARA ,,, ηχ 0.96
( ) ( )SA
LogPEtotPOLRA ,,,χ ( ) ( )SA
PLogEtotSA
POL RARA ,, 062.0945.02856.5 ++ χ ( ) ( )SA
LogPEtotPOLARA ,,,χ 0.961
( ) ( )SA
POLLogPRA ,,, ηχ ( ) ( )SA
POLSA
LogP RARA ,, 339.0319.12856.5 ηχ −+ ( ) ( )SA
POLLogPARA ,,, ηχ 0.987
( ) ( )SA
EtotLogPRA ,,, ηχ ( ) ( )SA
EtotSA
LogP RARA ,, 167.0148.12856.5 ηχ −+ ( ) ( )SA
EtotLogPARA ,,, ηχ 0.986
( ) ( )SA
EtotPOLLogPRA ,,,χ ( ) ( )SA
EtotPOLSA
LogP RARA ,, 097.0086.12856.5 −+ χ ( ) ( )SA
EtotPOLLogPARA ,,,χ 0.985
( ) ( )SA
POLEtotRA ,,, ηχ ( ) ( )SA
POLSA
Etot RARA ,, 081.1084.02856.5 ηχ +− ( ) ( )SA
POLEtotARA ,,, ηχ 0.948
( ) ( )SA
LogPEtotRA ,,, ηχ ( ) ( )SA
LogPSA
tEto RARA ,, 353.1388.02856.5 ηχ +− ( ) ( )SA
LogPEtotARA ,,, ηχ 0.99
( ) ( )SA
LogPEtotRA ,,, ηχ ( ) ( )SA
LogPPOLSA
Etot RARA ,, 706.0308.02856.5 ++ χ ( ) ( )SA
LogPEtotARA ,,, ηχ 0.944
( ) ( )SA
LogPEtotPOLRA ,,,η ( ) ( )SA
LogPEtotSA
POL RARA ,, 145.0870.02856.5 ++ η ( ) ( )SA
LogPEtotPOLARA ,,,η 0.949
( ) ( )SA
EtotPOLLogPRA ,,,η ( ) ( )SA
EtotPOLSA
LogP RARA ,, 173.0155.12856.5 −+ η ( ) ( )SA
EtotPOLLogPARA ,,,η 0.987
( ) ( )SA
LogPPOLEtotRA ,,,η ( ) ( )SA
LogPPOLSA
Etot RARA ,, 685.0342.02856.5 ++ η ( ) ( )SA
LogPPOLEtotARA ,,,η 0.947
( )SA
POLRA ,,ηχ ( )SA
POLRA ,,2856.5 ηχ+ ( )SA
POLARA ,,ηχ 0.948
( )SA
LogPRA ,,ηχ ( )SA
LogPRA ,,2856.5 ηχ+ ( )SA
LogPARA ,,ηχ 0.985
( )SA
EtotRA ,,ηχ ( )SA
EtotRA ,,2856.5 ηχ+ ( )SA
EtotARA ,,ηχ 0.916
( )SA
LogPPOLRA ,,χ ( )SA
LogPPOLRA ,,2856.5 χ+ ( )SA
LogPPOLARA ,,χ 0.941
( )SA
EtotPOLRA ,,χ ( )SA
EtotPOLRA ,,2856.5 χ+ ( )SA
EtotPOLARA ,,χ 0.91
( )SA
EtotLogPRA ,,χ ( )SA
EtotLogPRA ,,2856.5 χ+ ( )SA
EtotLogPARA ,,χ 0.89
( )SA
LogPPOLRA ,,η ( )SA
LogPPOLRA ,,2856.5 η+ ( )SA
LogPPOLARA ,,η 0.927
( )SA
EtotPOLRA ,,η ( )SA
EtotPOLRA ,,2856.5 η+ ( )SA
EtotPOLARA ,,η 0.919
( )SA
EtotLogPRA ,,η ( )SA
EtotLogPRA ,,2856.5 η+ ( )SA
EtotLogPARA ,,η 0.899
( )SA
EtotLogPPOLRA ,, ( )SA
EtotLogPPOLRA ,,2856.5 + ( )SA
EtotLogPPOLARA ,, 0.902

Int. J. Mol. Sci. 2011, 12
5120
Table 6. Residual-alert QSARs for the models of Table 5 that fulfill Equation (10) with highest trial correlation factors. These are compared with the respective direct structural alert models of Table 3 using their correlation performances for the trial and test molecules in Tables 1 and 2, respectively.
No. Crt. Variabile QSAR Model Rtrial Rtest
aI SAtot
SA E,χ SAtot
SASA EARA 003.0347.158 −−= χ 0.368 0.168 SAtot
SASA EA 000032.0255.058.5 −−= χ 0.371 0.127
bI SASA POL,η SASASA POLARA 833.075.14866.77 ++−= η 0.078 0.505
SASASA POLA 08.038.043.2 ++= η 0.316 0.043
cI SASA LogP,η SASASA LogPARA 8822.408 ++−= η 0.063 0.725
SASASA LogPA 179.005.075.4 ++= η 0.167 0.052
dI SAtot
SA E,η SAtot
SASA EARA 0023.0615.12769.64 −+−= η 0.384 0.087 SAtot
SASA EA 00004.0314.06.2 −+= η 0.38 0.131
eI SASA LogPPOL , SASASA LogPPOLARA 68.104.176.2 −+= 0.040 0.222 SASASA LogPPOLA 44.012.036.4 −+= 0.337 0.357
fI SAtot
SA EPOL , SAtot
SASA EPOLARA 0071.0928.2821.19 −−= 0.369 0.015 SAtot
SASA EPOLA 00005.00625.038.4 −−= 0.382 0.132
gI SAtot
SA ELogP , SAtot
SASA ELogPARA 0028.0314.6142.3 −−= 0.386 0.016 SAtot
SASA ELogPA 00006.0412.009.4 −−= 0.430 0.007 11fa IIII = SA
totSASA EPOL ,,χ SA
totSASASA EPOLARA 005.05.1784 −−−= χ 0.373 0.056
SAtot
SASASA EPOLA 0007.0092.045.046.6 −−−= χ 0.414 0.018 2aII SA
totSASA ELogP ,,χ SA
totSASASA ELogPARA 0023.0133.066.22108 −−−= χ 0.371 0.149
SAtot
SASASA ELogPA 00006.045.036.075.5 −−−= χ 0.451 0.136 1bII
SASASA POL,,ηχ SASASASA POLARA 5.0135.29210 +++−= ηχ 0.018 0.592 SASASASA POLA 08.0382.0035.062.2 ++−= ηχ 0.31 0.027

Int. J. Mol. Sci. 2011, 12
5121
Table 6. Cont.
No. Crt. Variabile QSAR Model Rtrial Rtest 22eb IIII = SASASA LogPPOL ,,η SASASASA LogPPOLARA 467.4176.1294.8705.44 −++−= η 0.122 0.286
SASASASA LogPPOLA 449.016.039.005.2 −++= η 0.373 0.112 213fdb IIIIII == SA
totSASA EPOL ,,η SA
totSASASA EPOLARA 0018.0272.1363.1672.85 +++−= η 0.304 0.178
SAtot
SASASA EPOLA 00005.0034.022.009.3 −−+= η 0.392 0.152 2dc IIII = SA
totSASA ELogP ,,η SA
totSASASA ELogPARA 0029.0941.1352.858.42 −−+−= η 0.382 0.039
SAtot
SASASA ELogPA 0006.0368.0156.023.3 −−+= η 0.436 0.012 1eII SASASA LogPPOL ,,χ SASASASA LogPPOLARA 85.32154 −++−= χ 0.019 0.399
SASASASA LogPPOLA 439.012.00325.052.4 −+−= χ 0.337 0.370 33fe IIII = SA
totSASA ELogPPOL ,, SA
totSASA ELogPPOLARA 0021.0787.7636.0151.2 −−+= 0.394 0.038
SAtot
SASASA ELogPPOLA 000057.045.0015.007.4 −−+= 0.431 0.034
1III SASASASA LogPPOL ,,,ηχ SASASASASA LogPPOLARA 842.13894.12842.3052.242 −+−−= ηχ 0.289 0.277 SASASASASA LogPPOLA 45.016.04.024.0921.1 −+++= ηχ 0.373 0.007
2III SAtot
SASASA ELogPPOL ,,,χ SAtot
SASASASA ELogPPOLARA 0006.0142.226571.5928.34 −−+−−= χ 0.372 0.296 SAtot
SASASASA ELogPPOLA 00007.041.0016.039.0894.5 −−−−= χ 0.452 0.106
3III SAtot
SASASA ELogPPOL ,,,η SAtot
SASASASA ELogPPOLARA 0002.0914.1657.0085.4228.19 +−++−= η 0.21 0.184 SAtot
SASASASA ELogPPOLA 00005.045.004.023.072.2 −−++= η 0.441 0.033
4III SAtot
SASASA ELogP ,,,ηχ SAtot
SASASASA ELogPARA 004.051763384 −−−−= ηχ 0.348 0.300 SAtot
SASASASA ELogPA 00006.041.013.035.094.4 −−+−= ηχ 0.455 0.066
5III SAtot
SASASA EPOL ,,,ηχ SAtot
SASASASA EPOLARA 0003.0172666.333.2766.36 −−++= ηχ 0.274 0.225 SAtot
SASASASA EPOLA 00006.007.012.041.0587.5 −−+−= ηχ 0.416 0.021

Int. J. Mol. Sci. 2011, 12 5122
Table 7. Trial-test averages of the correlations’ connected paths between the endpoint models of Table 6, computed using the Euler Equation (11).
Endpoint Paths
SAARARΔ SAA
RΔ
Trial Test Average Trial Test Average
211 IIIIIIII faa →=→ 0.005099 0.264847 0.134973 0.057384 0.140089 0.098736
22 IIIIII aa →→ 0.003162 0.148222 0.075692α 0.080006 0.031320 0.055663β
42 IIIIII aa →→ 0.023194 0.152190 0.087692 0.080099 0.070576 0.075337
322 IIIIIIII ebb →=→ 0.098386 0.241588 0.169987 0.088729 0.104890 0.09681
3213 IIIIIIIIII fdbb →==→ 0.244769 0.327055 0.285912 0.090426 0.161375 0.125901
322 IIIIIIII ebc →=→ 0.105948 0.450693 0.278321 0.216933 0.099201 0.158067
122 IIIIIIII ebc →=→ 0.177115 0.439092 0.308104 0.206000 0.120933 0.163467
32 IIIIIIII dcc →=→ 0.362415 0.701156 0.531786 0.269046 0.045177 0.157112
42 IIIIIIII dcc →=→ 0.320806 0.733973 0.52739 0.269670 0.067201 0.168436
313 IIIIIIII dbd →=→ 0.123434 0.091197 0.107316 0.050447 0.120838 0.085643
513 IIIIIIII dbd →=→ 0.085440 0.102420 0.09393β 0.026832 0.132672 0.079752γ
32 IIIIIIII dcd →=→ 0.172011 0.152738 0.162375 0.056222 0.120838 0.08853
42 IIIIIIII dcd →=→ 0.034058 0.265377 0.149718 0.059135 0.130678 0.094907
322 IIIIIIII ebe →=→ 0.120282 0.120415 0.120349γ 0.077369 0.257421 0.167395
333 IIIIIIII fee →=→ 0.431226 0.187882 0.309554 0.094530 0.323154 0.208842
3213 IIIIIIIIII fdbf →==→ 0.114284 0.163110 0.138697 0.050009 0.120668 0.085339
333 IIIIIIII fef →=→ 0.185690 0.147800 0.166745 0.050009 0.098005 0.074007
412 IIIIIIII gag →=→ 0.027459 0.201221 0.11434 0.021377 0.146768 0.084073
32 IIIIIIII dcg →=→ 0.172046 0.146812 0.159429 0.007810 0.021587 0.014699α
42 IIIIIIII dcg →=→ 0.034234 0.262011 0.148123 0.019924 0.054230 0.037077
333 IIIIIIII feg →=→ 0.184173 0.147648 0.165911 0.010049 0.027018 0.018534
Step IV: Euclidean paths for residual-alert QSARs for the trial molecules of Table 1 and the test compounds of Table 2 were constructed from the models of Step III. The models were arranged so that each model emerges from the previous one on the basis of their common descriptors; the results are reported in Table 7 by employing the Euclidean path between two successive QSAR models (computed endpoints),
[ ] ( )2]'[][
][][ , baba RRQSARQSAR −= (11)
Step V: Optimum paths for residual-alert QSARs were derived from the results of Step IV by searching the minimum paths and the associated hierarchy according to the formal constraint [31–35]
[ ] 0...,,... ][][]1[ =mk QSARQSARQSARδ (12)
where ][][]1[ ,...,,... mk QSARQSARQSAR represent the endpoint residual-QSAR regression models computed with 1, …, k, …, m≤M structural parameters, respectively. These paths were computed for both trial and test compounds, and their average values (Table 7) for the residual-alert and direct-alert

Int. J. Mol. Sci. 2011, 12 5123 models (Table 6) are reported. The average column of Table 7 shows two sets of first (alpha), second (beta) and third (gamma) pathways in the ergodic pathways [36], i.e., those uniquely contained QSAR models across all possible combinations, namely:
• those based on residual-alert QSARs:
22: IIIIII aa →→α
SAtot
SA E,χ …SAtot
SASA ELogP ,,χ …SAtot
SASASA ELogPPOL ,,,χ (13a)
513: IIIIIIII dbd →=→β
SAtot
SA E,η …SAtot
SASA EPOL ,,η …SAtot
SASASA EPOL ,,,ηχ (13b)
322: IIIIIIII ebe →=→γ
SASA LogPPOL , …SASASA LogPPOL ,,η …
SAtot
SASASA ELogPPOL ,,,η (13c)
• and those based on direct-alert QSARs:
32: IIIIIIII dcg →=→α
SAtot
SA ELogP , …SAtot
SASA ELogP ,,η …SAtot
SASASA ELogPPOL ,,,η (14a)
22: IIIIII aa →→β
SAtot
SA E,χ …SAtot
SASA ELogP ,,χ …SAtot
SASASA ELogPPOL ,,,χ (14b)
513: IIIIIIII dbd →=→γ
SAtot
SA E,η …SAtot
SASA EPOL ,,η …SAtot
SASASA EPOL ,,,ηχ (14c)
The remaining issue is to decide among these two pathways, while noting, for instance, the α- and v-residual-alert-QSARs are reproduced as β- and γ-direct-alert-QSARs, respectively. These and the resulting molecular mechanisms for the actual genotoxic effects on rats are clarified within the OECD-QSAR principles, as discussed below.
4. OECD-QSAR Principles Discussion
Generally, risk assessment comprises hazard identification (a qualitative risk assessment dealing with the inherent toxicity of a chemical substance), qualitative mutagenicity assessment (how likely an agent is to be a human mutagen), quantitative mutagenicity risk assessment (how much mutational damage is likely under particular exposure scenarios), dose-response assessment (relationship between the dose of a chemical and adverse effects) and exposure assessment (populations exposed to toxic chemicals).
Chemicals that have exhibited mutagenic activities in various test systems have been found in foods, tobacco, drugs, food additives, cosmetics, industrial compounds, pesticides and consumer products [37]. In this context, the OECD-QSAR principles can be used to guide any quantitative risk

Int. J. Mol. Sci. 2011, 12 5124 assessment of the carcinogenic potential under study through the provided QSAR models. They will be reviewed and illustrated using the present case study while emphasizing the specific advancements elucidated in this work.
4.1. Principle 1: A Defined Endpoint
According to OECD guidance, “the intent of QSAR Principle 1 (defined endpoint) is to ensure clarity in the endpoint being predicted by a given model, since a given endpoint could be determined by different experimental protocols and under different experimental conditions. It is therefore important to identify the experimental system that is being modeled by the (Q)SAR”. Note that the actual endpoint, the genotoxic carcinogenesis with mutagenesis as the first step of organism cells’ apoptosis [9,13], arises in principle with the same binding mechanism as binding/breaking DNA, through a group with high diverse structures, giving rise to the following updating QSAR end-point approaches:
• (Eco-) toxicological studies, having various end-points (such as inhibition, activation, death, sterility, irritations, etc.) yet produced by a group of similar molecules, i.e., the case of congeneric studies;
• and carcinogenic studies, having essentially the same end-point as the exacerbated apoptosis that in principle diffuses in the organism no matter what the initial point of triggering is, may be initiated by highly structurally diverse molecule, being therefore classified as non-congeneric studies.
While the first case above is usually treated by ordinary (or direct) QSAR approaches, the second category is less frequently treated with the central QSAR dogma of congenericity. It therefore requires special approaches, such as the recent study [20] and actual residual-QSAR modeling. This relies on the fact that if no direct high correlation can be found, then there is a high probability that the action is residual, complementary or indirect.
4.2. Principle 2: An Unambiguous Algorithm
According to the OECD guidance, the intent of QSAR-Principle 2 (unambiguous algorithm) is to ensure transparency in the predictive algorithm. The actual alert-QSAR method is outlined in Section 2, and Hansch physico-chemical parameters were used in the implementation:
• hydrophobicity (LogP), corresponding to trans-cellular membrane diffusion and with translation motion of the molecules;
• polarizability (POL), accounts for the dipole perturbation and ionic interaction, and is associated with the vibrational motion of the molecules in organism; it further accounts for potentially electrophilic effects that triggers cancer, according with the Millers’ theory [5,6], and sustained by the recent research [20]; and
• optimal total energy (Etot), which contains steric information about the molecule’s 3D structure since it is given by the equilibrium conformation [30]; it may serve therefore as a potential for the rotational motion of the molecules when triggered by interaction with organism’s receptor.

Int. J. Mol. Sci. 2011, 12 5125
These three structural parameters that encode information about the basic classical molecular are based on the quantum structural computation. However, for the present QSAR for chemical carcinogenicity, additional reactivity indices such as electronegativity (χ) and chemical hardness (η) were considered. These indices, by definition, relate to the first and second derivatives (or changes/variations) of the total energy respecting the total number of electrons, and describe the effects of donating (through ionization potential IP and HOMO levels) and accepting electrons (through electronic affinity EA and LUMO levels), within the frozen core approximation of Koopmans’ theorem [38].
2)()( 11
)(
0000 +− −+−≅⎟
⎠⎞
⎜⎝⎛
∂∂= NNNN
rV
NEEEE
NEχ
22HOMOLUMOEAIP εε +−≅+≡ (15)
and
≅−=+−
≅⎟⎟⎠
⎞⎜⎜⎝
⎛∂∂= −+
222
21 11
)(2
2000 EAIPEEE
NE NNN
rV
Nη2
HOMOLUMO εε − (16)
This enables a qualitative understanding of the basic phenomena within the so-called chemical orthogonal space–COS ( ηχ ⊥ ); the first quantity Equation (15) is associated with the mid-level between the HOMO and LUMO energies, while the second quantity in Equation (16) gives the HOMO-LUMO interval/gap [39]. This idea combines the orthogonality of χ and η (necessary for QSAR analysis) with the associated reactivity principles described below [40].
• The electronegativity equalization (EE) principle relies on the equivalence of the negative electronegativity from Equation (15) with a system’s chemical potential [41], fulfilling the Gibbs rule of phases between two molecular states. The EE principle was originally stated by Sanderson as “the molecules in their fundamental state, the electronegativities of different electronic regions in molecule–are equal” [42]. This principle was further generalized and applied to many-electron systems [43]. In this work, the principle is applied at the level of ligand-receptor binding (Figure 3). The molecular electronegativity is first equalized with that of the receptor, leading to the selection of the molecular fragment (structural alert) with electronegativity complementary to that of the receptor or adjustment of the receptor’s pocket that to fit with the ligand electronegativity. This stage corresponds to a sort of electronegativity based docking based on the fundamental quantum EE principle. The induced interaction is then stabilized through chemical hardness.
• The maximum hardness principle derives from Pearson’s observation that “there seems to be a rule of nature that molecules (or the many-electronic systems in general, n.a.) arrange themselves (in their ground or valence states, n.a.) to be as hard as possible” [44]. This principle, which has been quantitatively justified [45–48], stipulates that a maximum HOMO-LUMO gap is associated with a stabilized interaction for a molecular sample.
In this study, these two fundamental reactivity principles involve intra-electrophilic (intramolecular) electron transfer from the HOMO and LUMO of the ligand molecule (or SA), such that, after donating one HOMO electron to the molecular or SA-LUMO, exo-electrophilic

Int. J. Mol. Sci. 2011, 12 5126 (intermolecular) electron transfer between the new molecule or SA-HOMO* and receptor LUMO occurs. This leaves a larger SA-HOMO–LUMO gap through ligand HOMO* relaxation (which is formally removed, so the gap between LUMO* and the second order ligand’s HOMO is increased). This produces an overall electrophilic docking effect (Figure 3). Note that other electrophilic mechanisms involving molecular or SA HOMO and LUMO frontier transformations and relaxations may be possible, but the two stages of electronegativity equalization and chemical hardness maximization should be equally satisfied.
Together, the electronegativity and chemical hardness indices unambiguously describe a ligand-receptor docking mechanism via intra- and exo-electrophilic stages, generalizing the Millers’ theory of direct electronic transfer between the molecular or SA HOMO and receptor LUMO [6].
Figure 3. The electrophilic docking structure-reactivity algorithm correlating electronegativity and chemical hardness with chemical carcinogenesis. The algorithm starts with electronegativity docking (equalization) between the ligand and the receptor (the middle dashed line). Next, intra-molecular (in connection with specific structural alerts) maximization of the HOMO-LUMO gap (i.e., of chemical hardness) is accomplished by exo-electrophilic transfer of an electron from ligand to receptor.
4.3. Principle 3: A Defined Domain of Applicability
OECD guidance justifies the need to define an applicability domain (Principle 3) by the fact that (Q)SARs are reductionist models with inevitable limitations. These include limitations in terms of the types of chemical structures, physicochemical properties and mechanisms of action for which the models can generate reliable predictions. This principle is inherently linked with the first OECD-QSAR endpoint criterion. However, in the present carcinogenicity study, it acquires a further degree of freedom because no particular molecular structure is required, though the same mechanism and endpoint should be eventually provided.
As such, the molecules in Tables 1 and 2 span many organic classes and derivatives, including amides, amines, aromatic systems, lactones, nitrites, quinines, cyanides, urethanes, ketones and cycloalkanes. From a given pool of molecules, the trial and testing series may be selected through Gaussian or quasi-Gaussian screening (Figure 2). Such a procedure may eventually generalize the

Int. J. Mol. Sci. 2011, 12 5127 previous central dogma of QSAR [9] because it may be applied either to congeneric and non-similar structural molecules while focusing on ordering their observed activities in a naturally or normal statistical series, while they are associated with essentially the same interaction mechanism towards the receptor [20].
About 10% of the trial pool of molecules may be transformed in their hydrophobicities and total optimized energies to acquire universal or equal properties depending on their uses or evident similarly recorded activity effects, respectively (see Section 3).
4.4. Principle 4: Appropriate Measures of Goodness-of-Fit, Robustness and Predictivity
OECD QSAR principle 4 (appropriate measures of goodness-of–fit, robustness and predictivity) makes a distinction between the internal performance of a model (as represented by goodness-of-fit and robustness or the correlation within the trial set of molecules) and the predictivity of a model (as determined by external validation on a test set of molecules).
The external test set of molecules is the preferred option in QSAR validation because it assures the reliability of a given derived model. This type of validation also includes situations in which the test sets provide better statistics than the calibration series, generalizing the analytical course [49]. In Step V of the alert-QSARs of Table 7, both the trial and test Euclidean paths were considered; they were thereafter averaged in order to employ information from the statistical performances and predictions of both the trial and test sets.
Note that the Euclidean distance may be further enriched with other statistical outputs and factors, although all directly or indirectly depend on the correlation factor; we are considering such enrichment [50].
4.5. Principle 5: A Mechanistic Interpretation
The intent of OECD QSAR Principle 5 is not to reject models that have no apparent mechanistic basis but to ensure that some consideration is given to the possibility of a mechanistic association between the descriptors used in a model and the endpoint being predicted and to ensure that this association is documented. Since the physico-chemical QSAR parameters were chosen in this study, a mechanistic interpretation of the models is possible. This nevertheless follows specific steps, some of them integrated in the previously discussed OECD-QSAR principles.
• With the alert-QSAR models, in either residual or direct forms, (Table 6), Euclidean measures between all computed models that successively that fall along the pathways of Table 7 are constructed (see also the Step IV of Section 3).
• The first optimum paths are selected on the ergodic basis, as described in Step V of Section 3 above, by applying Equations (11) and (12) for the residual and direct alert-QSARs, respectively.
• The two classes of paths (Equations (13) and (14)) are compared on the basis of their electrophilic-docking (sub)-mechanisms identified within the unambiguous algorithm stage of the second OECD-QSAR principle. Comparison of the alpha-paths of the two alert-QSAR routes reveals that only residual-alert-QSAR correctly displays the involvement of the electronegativity in docking. As a consequence, the electrophilic-docking mechanistic
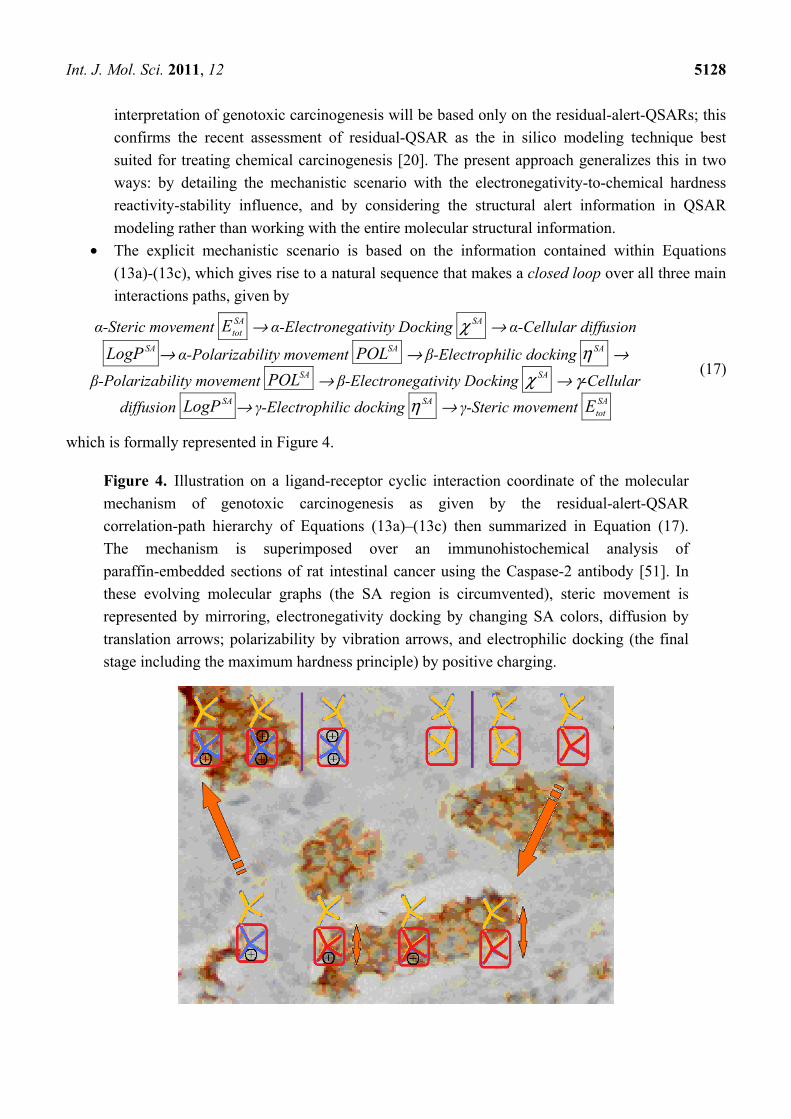
Int. J. Mol. Sci. 2011, 12 5128
interpretation of genotoxic carcinogenesis will be based only on the residual-alert-QSARs; this confirms the recent assessment of residual-QSAR as the in silico modeling technique best suited for treating chemical carcinogenesis [20]. The present approach generalizes this in two ways: by detailing the mechanistic scenario with the electronegativity-to-chemical hardness reactivity-stability influence, and by considering the structural alert information in QSAR modeling rather than working with the entire molecular structural information.
• The explicit mechanistic scenario is based on the information contained within Equations (13a)-(13c), which gives rise to a natural sequence that makes a closed loop over all three main interactions paths, given by
α-Steric movement SAtotE → α-Electronegativity Docking SAχ → α-Cellular diffusion
SALogP → α-Polarizability movement SAPOL → β-Electrophilic docking SAη →
β-Polarizability movement SAPOL → β-Electronegativity Docking SAχ → γ-Cellular
diffusion SALogP → γ-Electrophilic docking SAη → γ-Steric movement SAtotE
(17)
which is formally represented in Figure 4.
Figure 4. Illustration on a ligand-receptor cyclic interaction coordinate of the molecular mechanism of genotoxic carcinogenesis as given by the residual-alert-QSAR correlation-path hierarchy of Equations (13a)–(13c) then summarized in Equation (17). The mechanism is superimposed over an immunohistochemical analysis of paraffin-embedded sections of rat intestinal cancer using the Caspase-2 antibody [51]. In these evolving molecular graphs (the SA region is circumvented), steric movement is represented by mirroring, electronegativity docking by changing SA colors, diffusion by translation arrows; polarizability by vibration arrows, and electrophilic docking (the final stage including the maximum hardness principle) by positive charging.

Int. J. Mol. Sci. 2011, 12 5129
The cycle of Equation (17) provides insight into the residual looping mechanism of the molecule or structural alert; receptor interaction, especially for electrophilic docking, here was related to electronegativity and chemical action, as compared with the previous global molecular studies which were limited to Hansch parameters only [20]. During one such interaction loop, the SA-molecule acquires a charge of +2, thus entering the next electrophile-nucleophile interaction loop with even more reactivity; this eventually leads to amplified biological activity manifested by exacerbated apoptosis due to breaking newly formed bonds in DNA. This is in close agreement with Millers’ observation (see Introduction) [6].
One can go further by choosing the first five instead of the first three interaction paths from the data of Table 7, because this number is the cardinal of the employed correlation parameters in actual residual-alert-QSARs. However, though electronegativity and chemical hardness are closely related to the total energy (Equations (15) and (16)), using only the first three interacting residual-alert pathways seems appropriate for the present purpose. For future studies, the extra index of electrophilicity [52] can be also explicitly incorporated to test its conceptual value in the electrophilic theory of chemical carcinogenesis [53].
5. Conclusions
The carcinogenesis process is divided into three operational stages: initiation, promotion and progression, with own unique mechanisms and QSAR characteristics that lead to an integrated approach with all the important elements to be considered. Consequently, the key to successful and meaningful QSAR formulation is the selection of appropriate molecular descriptors. It is critical to minimize the appearance of false negative results to increase regulatory acceptance of the developed models [9].
For carcinogenicity, it is important to address the mechanism of action and a negative (Q)SAR prediction for genotoxicity as well as negative results of an in vitro test with the conditions that mechanisms are sufficiently defined. QSAR models focus on the relationship between molecular structure and biological activity based on a comparison between the activities and structures of a series of chemicals. Nevertheless, until recently, the central dogma of QSAR asserted that the more local (specific, or a con-generic series) a model is in chemical-biological space, the higher the accuracy of its predictions [9]. As such, alongside the logical computational methods used for the QSAR modeling, i.e., genetic algorithms (optimization and search problems), artificial neural networks (non-parametric adaptive models), self organizing maps, support vector machines (classification and regression), partial least squares, decision forests, multiple linear regressions, k-mean clustering and TSAR [54], conceptual-QSAR has been developed to produce the meaningful physico-chemical models and paths to interpret ecotoxicological effects [31–36]. This approach ultimately ends in modeling of the carcinogenesis of highly diverse chemical structures [20], while considering the outliers’a analysis will lead with essential non-linear correlations [55].
The present work continues these efforts with the aim of clarifying the electrophilic mechanism of genotoxic carcinogenesis by modeling intermediate steps using structural alerts of the involved toxicants. We draw several main conclusions, as follows:

Int. J. Mol. Sci. 2011, 12 5130
• mutagenicity may be regarded as an electrophilic ligand-receptor interaction mechanism of covalent binding between the ligand molecule or SA and receptor;
• electronegativity and chemical hardness are crucial parameters in modeling the ligand-receptor interaction due to the electronegativity equalization and maximum chemical hardness principles, respectively;
• residual-QSAR is again shown to be reliable [20] in its treatment of genotoxic carcinogenesis, as it better incorporates electronegativity and chemical hardness principles across the optimally selected pathways of organism cells’ apoptosis;
• structural alert or molecular fragment analysis improves the residual-QSAR analysis with an enriched class of QSAR models that may be associated with molecular mechanisms of interaction in complex media;
• in general, the test performances are lower than the calibration models, but also models with considerably better behavior for test molecules compared with trials are found, especially when hydrophobicity and sometimes polarizability and/or reactivity parameters of chemical hardness and electronegativity are involved; this is not surprising since they fully support the cellular transduction process (LogP) jointly with electrophilic effects (stated by reactivity principles and polarizability).
• the mechanism of carcinogenesis, being activated by non-congeneric compounds, allows consideration of similar parameters at molecular level, by advancing the universal hydrophobicity and equal stericity transformations of about 10% of the trial compounds, but only in the situations in which the molecules display identical observed carcinogenic activities.
The present study may be extended to assess the best molecular/structural alerts for residual-QSARs from a given pool of compounds. As well, it can be extended to include more statistical factors, such as standard error of estimation, Fisher and Student tests, to generalize the actual Euclidean measure to more elaborated statistical paths [56]. It may be also combined with 3D docking protocols to further validate the present residual-alert quantum-mechanical structural-reactivity analysis.
Acknowledgements
This work was supported by Romanian CNCS-UEFISCDI (former CNCSIS-UEFISCSU) project TE16/2010-2011 within the PN II-RU-TE-2009-1 framework, and partly by the grant POSDRU /21/1.5/G/38347.
References
1. Yamagiwa, K.; Ichikawa, K. Experimental study of the pathogenesis of carcinoma. J. Cancer Res. 1918, 3, l–29.
2. Yoshida, T. Uber die serienweise verfolgung der veranderungen der leber der experimentellen hepatomerzeugung durch O-Aminoazotoluol. Trans. Jpn. Pathol. Soc. 1933, 23, 636–638.
3. Hueper, W.C.; Wiley, F.H.; Wolfe, H.D. Experimental production of bladder tumors in dogs by administration of beta-naphthylamine. J. Ind. Hyg. Toxicol. 1938, 20, 46–84.

Int. J. Mol. Sci. 2011, 12 5131 4. Haddow, A. Sir Ernest Laurence Kennaway FRS, 1881–1958: Chemical causation of cancer then
and today. Perspect. Biol. Med. 1974, 17, 543–588. 5. Miller, J.A.; Miller, E. Ultimate chemical carcinogens as reactive mutagenic electrophiles. In
Origins of Human Cancer; Hiatt, H.H., Watson, J.D., Winsten, J.A., Eds.; Cold Spring Harbor Laboratory: Huntington, NY, USA, 1977; pp. 605–628.
6. Miller, E.C.; Miller, J.A. Searches for ultimate chemical carcinogens and their reactions with cellular macromolecules. Cancer 1981, 47, 2327–2345.
7. Ames, B.N. The detection of environmental mutagens and potential carcinogens. Cancer 1984, 53, 2030–2040.
8. Ashby, J.; Tennant, R.W. Chemical structure, Salmonella mutagenicity and extent of carcinogenicity as indicators of genotoxic carcinogenesis among 222 chemicals tested by the U.S.NCI/NTP. Mutat. Res. 1988, 204, 17–115.
9. Benigni, R.; Netzeva, T.I.; Benfenati, E.; Bossa, C.; Franke, R.; Helma, C.; Hulzebos, E.; Marchant, C.; Richard, A.; Woo, Y.T.; et al. The expanding role of predictive toxicology: An update on the (Q)SAR models for mutagens and carcinogens. J. Environ. Sci. Health C 2007, 25, 53–97.
10. Ferrari, T.; Gini, G. An open source multistep model to predict mutagenicity from statistical analysis and relevant structural alerts. Chem. Cent. J. 2010, 4 (Suppl 1), S2.
11. Nair, P.C.; Sobhia, M.E. Comparative QSTR studies for predicting mutagenicity of nitro compounds. J. Mol. Graphics Modell. 2008, 26, 916–934.
12. Pérez-Garrido, A.; Helguera, A.M.; Rodríguez, F.G.; Cordeiro, M.N.D.S. QSAR models to predict mutagenicity of acrylates, methacrylates and α,β-unsaturated carbonyl compounds. Dent. Mater. 2010, 26, 397–415.
13. Benigni, R.; Bossa, C.; Jeliazkova, N.; Netzeva, T.; Worth, A. The Benigni/Bossa Rules for Mutagenicity and CarcInogenicity—A Module of Toxtree. European Commission report EUR 23241 EN; IdeaConsult Ltd.: Sofia, Bulgaria, 2008. Avalilable online: http://toxtree.sourceforge.net/ carc.html (accessed on 3 August 2011).
14. Price, N. Hail Caesar. Chem. Ind. 2008, 15, 18–19. 15. Benfenati, E. CAESAR QSAR models for REACH. Chem. Cent. J. 2010, 4 (Suppl 1), S1–S5. 16. Fjodorova, N.; Vračko, M.; Novič, M.; Roncaglioni, A.; Benfenati, E. New public QSAR model
for carcinogenicity. Chem. Cent. J. 2010, 4 (Suppl 1), S3:1–S3:15. 17. Worth, A.P.; Bassan, A.; de Brujin, J.; Gallegos Saliner, A.; Netzeva, T.; Patlewicz, G.;
Pavan, M.; Tsakovska, I.; Eisenreich, S. The role of the European chemicals bureau in promoting the regulatory use of (Q)SAR methods. SAR QSAR Environ. Res. 2007, 18, 111–125.
18. OECD principles. Guidance Document on the Validation of (Quantitative) Structure-Activity Relationship [(q)sar] Models; OECD Environment Health and Safety Publications Series on Testing and Assessment No. 69; Organisation de Coopération et de Développement Economiques /Organization for Economic Co-operation and Development: Paris, France, 30 March 2007. Available online: http://appli1.oecd.org/olis/2007doc.nsf/linkto/env-jm-mono(2007)2 (accessed on 3 August 2011).

Int. J. Mol. Sci. 2011, 12 5132 19. Putz, M.V.; Putz, A.M.; Barou, R. Spectral-SAR realization of OECD-QSAR principles. Int. J.
Chem. Model. 2011, 3, 2. 20. Putz, M.V. Residual-QSAR. Implications for genotoxic carcinogenesis. Chem. Cent. J. 2011, 5,
29, doi: 10.1186/1752-153X-5-29. 21. Toplis, J.G.; Costello, J.D. Chance correlation in structure-activity studies using multiple
regression analysis. J. Med. Chem. 1972, 15, 1066–1069. 22. Hansch C.; Kurup A.; Garg R.; Gao H. Chem-bioinformatics and QSAR: A review of QSAR
lacking positive hydrophobic terms. Chem. Rev. 2001, 101, 619–672. 23. Eckert, M.; Fleischmann, G.; Jira, R.; Hermann, M.B.; Golka, K. Acetaldehyde. In Ullmann’s
Encyclopedia of Industrial Chemistry; Wiley-VCH: Weinheim, Germany, 2006. 24. Sowin, T.J.; Melcher, L.M. Acetaldehyde. In Encyclopedia of Reagents for Organic Synthesis;
Paquette, L., Ed.; Wiley & Sons: New York, NY, USA, 2004. 25. Alcohol Drinking. World Health Organization, International Agency for Research on Cancer: Lyon,
France, 1988. Available online: http://monographs.iarc.fr/ENG/Monographs/vol44/volume44.pdf (accessed on 3 August 2011).
26. Chemical summary for acetaldehyde. US Environmental Protection Agency: Washington, DC, USA, 1994. Available online: http://www.epa.gov/chemfact/s_acetal.txt (accessed on 3 August 2011).
27. Chemicals in the environment: Acetaldehyde (CAS no. 75-07-0). US Environmental Protection Agency: Washington, DC, USA, 1994. Available online: http://www.epa.gov/chemfact/f_acetal.txt (accessed on 3 August 2011).
28. Gold, L.S. The carcinogenic potency project. The Carcinogenic Potency Database (CPDB): Berkeley, CA, USA, 2011. Available online: http://potency.berkeley.edu/index.html (accessed on 3 August 2011).
29. Huijbregts, M.A.J.; Rombouts, L.J.A.; Ragas, Ad.M.J.; van de Meent, D. Human-toxicological effect and damage factors of carcinogenic and noncarcinogenic chemicals for life cycle impact assessment. Integr. Environ. Assess. Manage. 2005, 1, 181–244.
30. HyperChem 7.01, Program package and documentation. Hypercube, Inc.: Gainesville, FL, USA, 2002.
31. Putz, M.V.; Lacrămă, A.M. Introducing spectral structure activity relationship (S-SAR) analysis. Application to ecotoxicology. Int. J. Mol. Sci. 2007, 8, 363–391.
32. Lacrămă, A.M.; Putz, M.V.; Ostafe, V. A Spectral-SAR model for the anionic-cationic interaction in ionic liquids: Application to Vibrio fischeri ecotoxicity. Int. J. Mol. Sci. 2007, 8, 842–863.
33. Chicu, S.A.; Putz, M.V. Köln-Timişoara molecular activity combined models toward interspecies toxicity assessment. Int. J. Mol. Sci. 2009, 10, 4474–4497.
34. Putz, M.V.; Putz, A.M.; Lazea, M.; Ienciu, L.; Chiriac, A. Quantum-SAR extension of the Spectral-SAR algorithm. Application to polyphenolic anticancer bioactivity. Int. J. Mol. Sci. 2009, 10, 1193–1214.
35. Putz, M.V.; Putz, A.M.; Ostafe, V.; Chiriac, A. Spectral-SAR ecotoxicology of ionic liquids-acetylcholine interaction on E. Electricus species. Int. J. Chem. Model. 2010, 2, 85–96.
36. Putz, M.V. QSAR & SPECTRAL-SAR in Computational Ecotoxicology; Apple Academics: Ontario, Canada, 2011, in press.

Int. J. Mol. Sci. 2011, 12 5133 37. U.S. Environmental Protection Agency (EPA). Guidelines for mutagenicity risk assessment.
Fed. Regist. 1986, 51, 34006–34012. 38. Koopmans, T. Uber die zuordnung von wellen funktionen und eigenwerter zu den einzelnen
elektronen eines atom. Physica 1934, 1, 104–113. 39. Putz, M.V. Electronegativity and chemical hardness: Different patterns in quantum chemistry.
Curr. Phys. Chem. 2011, 1, 111–139. 40. Putz, M.V. Absolute and Chemical Electronegativity and Hardness; Nova Science Publishers
Inc.: New York, NY, USA, 2008. 41. Parr, R.G.; Donnelly, R.A.; Levy, M.; Palke, W.E. Electronegativity: The density functional
viewpoint. J. Chem. Phys. 1978, 68, 3801–3808. 42. Sanderson, R.T. Principles of electronegativity. Part I. General nature. J. Chem. Educ. 1988, 65,
112–119. 43. Mortier, W.J.; Genechten, K.v.; Gasteiger, J. Electronegativity equalization: Application and
parametrization. J. Am. Chem. Soc. 1985, 107, 829–835. 44. Pearson, R.G. Absolute electronegativity and absolute hardness of Lewis acids and bases. J. Am.
Chem. Soc. 1985, 107, 6801–6806. 45. Chattaraj, P.K.; Lee, H.; Parr, R.G. Principle of maximum hardness. J. Am. Chem. Soc. 1991, 113,
1854–1855. 46. Chattaraj, P.K.; Liu, G.H.; Parr, R.G. The maximum hardness principle in the
Gyftpoulos-Hatsopoulos three-level model for an atomic or molecular species and its positive and negative ions. Chem. Phys. Lett. 1995, 237, 171–176.
47. Ayers, P.W.; Parr, R.G. Variational principles for describing chemical reactions: The Fukui function and chemical hardness revisited. J. Am. Chem. Soc. 2000, 122, 2010–2018.
48. Putz, M.V. Maximum hardness index of quantum acid-base bonding. MATCH Commun. Math. Comput. Chem. 2008, 60, 845–868.
49. Franke, R.; Gruska, A. General introduction to QSAR. In Quantitative Structure-Activity Relationhsip (QSAR) Models of Mutagens and Carcinogens; Benigni, R., Ed.; CRC Press: Boca Raton, FL, USA, 2003; pp. 1–40.
50. Putz, M.V.; Lazea, M.; Putz, A.M.; Seiman-Duda, C. Exploring Catastrophe-QSAR. Application on anti-HIV activity. Preprint 2011, Unpublished work.
51. Caspase-2 IHC Antibody. IHC WORLD, LLC: Woodstock, MD, USA, 2011. Available online: http://www.ihcworld.com/products/antibody-datasheets/Caspase2.IW-PA1113.htm (accessed on 3 August 2011).
52. Parr, R.G.; Szentpály, L.V.; Liu, S. Electrophilicity index. J. Am. Chem. Soc. 1999, 121, 1922–1924.
53. Parthasarathi, R.; Subramanian, V.; Roy, D.R.; Chattaraj, P.K. Electrophilicity index as a possible descriptor of biological activity. Bioorg. Med. Chem. 2004, 12, 5533–5543.
54. Pooja, M.; Tripathi, V.; Yadav B.S. Insilico QSAR modeling and drug development process. GERF Bull. Biosci. 2010, 1, 37–40.
55. Tarko, L.; Putz, M.V. On Quantitative Structure-Toxicity Relationships (QSTR) using high chemical diversity molecules group. Preprint 2011, Unpublished work.

Int. J. Mol. Sci. 2011, 12 5134 56. Putz, M.V.; Putz, A.M.; Lazea, M.; Chiriac, A. Spectral vs. statistic approach of structure-activity
relationship. Application on ecotoxicity of aliphatic amines. J. Theor. Comput. Chem. 2009, 8, 1235–1251.
© 2011 by the authors; licensee MDPI, Basel, Switzerland. This article is an open access article distributed under the terms and conditions of the Creative Commons Attribution license (http://creativecommons.org/licenses/by/3.0/).