Embed Size (px)
Citation preview

1 | Program Name or Ancillary Text eere.energy.gov
Building Technologies Office
Program Peer Review
Alexis Abramson Chief Scientist
April 2, 2013
Building Technologies Office Prioritization Tool

2 | Building Technologies Office eere.energy.gov
Vision: develop an analytical tool that considers building efficiency measures and technologies, and assesses and compares their potential value into the future
Uses: • Inform programmatic decision-making • Examine “what if” scenarios • Create targets for FOAs • Set programmatic goals • Provide public with a comprehensive analytical tool
FY13 peer review completed March 2013 BTO review of outputs ongoing in April 2013 – no output review today
The prioritization tool provides quantitative insight to decision-making

3 | Building Technologies Office eere.energy.gov
The analytical framework involves defining inputs, calculating, and generating outputs
Inputs
• Performance improvement • Cost • Market • Lifetime
Analysis
• Stock and flow dynamics • Technology diffusion • Cost of Conserved Energy (CCE) • Staging framework
Outputs
• CCE and annual energy savings • Technical potential • Full-Adoption potential • BTO-Adoption adjusted potential • Staged potential
Service Demand per unit stock
Efficiency
Equipment Stock
Total energy use
U = S X E -1 X SD = S X C
Consumption

4 | Building Technologies Office eere.energy.gov
Outputs are viewed through different ‘lenses’
LENS 1: Imagine replacing all existing stock with the new measure overnight = Technical Potential
LENS 2: A ‘stock and flow’ model accounts for unit replacement, elimination or addition = Maximum Adoption Potential (unstaged)
LENS 3: To avoid ‘double counting,’ measures with lowest CCE “stage” first to capture their share of the market = Maximum Adoption Potential (staged)
LENS 4: Market penetration and BTO influence on acceleration can be examined using the Bass Diffusion Model to represent more “realistic” market diffusion = Adjusted Adoption Potential
BT
Us Baseline
energy
consumed
today
Technical potential in 2030
BTUs saved
CC
E (
$/B
TU
s)
Energy technology/measure
A
B
C
D
E
Red
uce
cost
Improve
performance

5 | Building Technologies Office eere.energy.gov
Reviewing…
#1: How much energy is currently used for lighting and is expected to be used in the future? #2: Imagine that every lamp was replaced with an LED lamp overnight. What would be the reduction in energy use?
#3: What if we replaced every lamp at the end of its life with an LED lamp (or at an accelerated rate when it was cost effective to do so)? How much energy would be saved then?
#4: Now we want as accurate a depiction as possible of the rate our LED lamps are adopted by the market, taking into consideration the impact of DOE’s spending on R&D, deployment, or standards activity.
Business As Usual
(BAU)
Technical Potential
Maximum Adoption Potential
Adjusted Adoption Potential

6 | Building Technologies Office eere.energy.gov
Accounts for market size and relative performance between measure and baseline, but does not account for cost effectiveness
Imagine replacing existing stock with the new measure overnight = Technical Potential
Fit BAU: Extrapolation of BAU based on NEMS
2010 2030 2050 Year
Residential R-10 Windows
Pri
mar
y en
erg
y T
BT
Us
BAU 2000 1800 1600 1400 1200 1000 800 600 400 200
0
Energy saved!
Technical potential
Preliminary
7 | Building Technologies Office eere.energy.gov
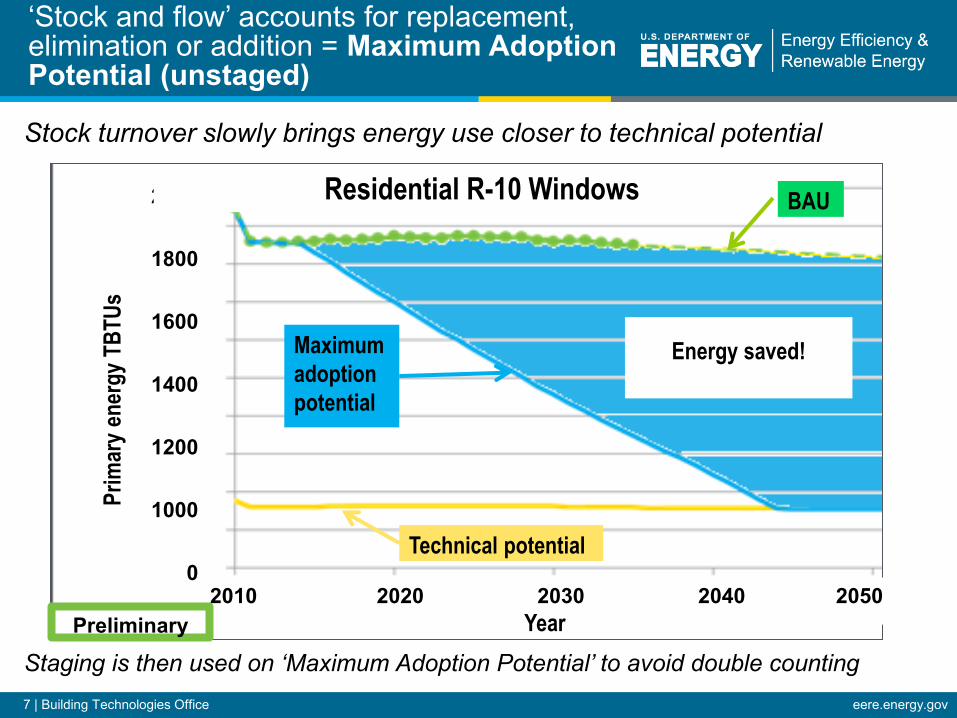
Stock turnover slowly brings energy use closer to technical potential Staging is then used on ‘Maximum Adoption Potential’ to avoid double counting
‘Stock and flow’ accounts for replacement, elimination or addition = Maximum Adoption Potential (unstaged)
2000
1800
1600
1400
1200
1000
0 2010 2020 2030 2040 2050
Year
Residential R-10 Windows
Pri
mar
y en
erg
y T
BT
Us
BAU
Energy saved!
Technical potential
Maximum
adoption
potential
Preliminary
8 | Building Technologies Office eere.energy.gov
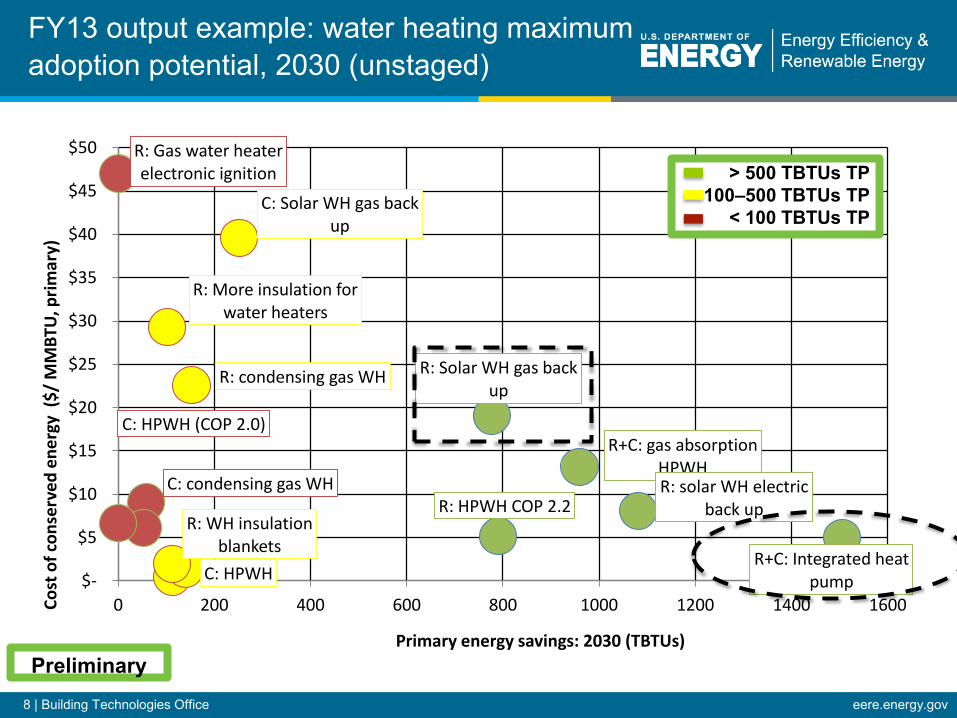
FY13 output example: water heating maximum adoption potential, 2030 (unstaged)
R+C: Integrated heat pump
R: HPWH COP 2.2
R+C: gas absorption HPWH R: solar WH electric
back up
R: Solar WH gas back up
C: HPWH
R: WH insulation blankets
C: Solar WH gas back up
R: More insulation for water heaters
R: condensing gas WH
C: condensing gas WH
C: HPWH (COP 2.0)
R: Gas water heater electronic ignition
$-
$5
$10
$15
$20
$25
$30
$35
$40
$45
$50
0 200 400 600 800 1000 1200 1400 1600 Co
st o
f co
nse
rve
d e
ne
rgy
($
/ M
MB
TU, p
rim
ary)
Primary energy savings: 2030 (TBTUs)
> 500 TBTUs TP 100–500 TBTUs TP
< 100 TBTUs TP
Preliminary

9 | Building Technologies Office eere.energy.gov
FY13 output example: water heating maximum adoption potential, 2030 (staged)
R+C: Integrated heat pump
R: HPWH COP 2.2
R+C: Gas absorption HPWH
R+C: ASHPWH, tech limit
R+C: gas HPWH, tech limit
R: solar WH electric backup
R: Solar WH gas backup
C: HPWH
R: WH insulation blankets
C: Solar WH gas back up
R: More insulation for water heaters
R: condensing gas WH
$-
$5
$10
$15
$20
$25
$30
$35
$40
$45
$50
0 200 400 600 800 1000 1200 1400 1600
Co
st o
f co
nse
rve
d e
ne
rgy
($
/ M
MB
TU, p
rim
ary)
Primary energy savings: 2030 (TBTUs)
> 500 TBTUs TP 100–500 TBTUs TP
< 100 TBTUs TP
Preliminary

10 | Building Technologies Office eere.energy.gov
• Bass Diffusion Model (p’s and q’s) accounts for market penetration • Market acceleration can be further enhanced through BTO investment • Standards/codes action initiates path towards full adoption
Market penetration scenarios can also be explored = Adjusted Adoption Potential
2010 2020 2030 2040 2050 Year
Pri
mar
y en
erg
y T
BT
Us
Residential R-10 Windows 2000
1800
1600
1400
1200
1000
0
BAU
Energy
saved!
Technical potential
Maximum
adoption
potential
Adjusted
adoption
potential
Preliminary

11 | Building Technologies Office eere.energy.gov
The staged maximum adoption potential results can be used to formulate an ‘economic potential’ uber goal for BTO 1. Measures are plotted in order of increasing CCE: CCE and energy savings 2. Measures that fall below “cost of energy” line are cost effective 3. Compare cost effective savings to baseline to generate ‘economic potential’ goal
2030
Cost of energy
Cost effective
Not cost effective
Preliminary

12 | Building Technologies Office eere.energy.gov
The ‘uber’ goal can also be broken down by sector
- 5
10 15 20 25 30 35 40 45
Qua
ds o
f Prim
ary
Ener
gy
Res
iden
tial
C
om
mer
cial
Preliminary

13 | Building Technologies Office eere.energy.gov
The prioritization tool can be used for various purposes…
• Generate quantitative goals for sub-programs (e.g. 70% energy savings in lighting by 2030”)
• Analyze outputs to identify gaps and opportunities (with a critical eye)
• Conduct sensitivity analyses (“what if” scenarios) to “test” realistic target ranges
• Inform programmatic decision-making
– Focus on HITs: “high impact technologies”
– Identify gaps and opportunities
– Remove lemons: technologies with limited national impact
• Set FOA topic targets (e.g. thermal insulation R-value
8 at
0.08/ft2/R)
New FY13 focus on Building Sensors, Controls and Transactions

14 | Building Technologies Office eere.energy.gov
• Prior/current activities: – Input/output peer review (improved interface/forms) – Four 2-hour classes for key stakeholders – Release of “A Tool to Prioritize Energy Efficiency Investments” Report
and Nature commentary – Coordination with other federal building activities – Output review, planning, goal setting (ongoing NOW for FY14 AOP)
• Future activities: – Continual improvement (e.g. adjusted-adopted methodology) – RFI release to solicit broader public input (May 2013) – Professional recorded webinar (May 2013) – Publications/presentations/reports on outputs and implications
(Summer 2013) – Public release of tool – Renaming?
The prioritization tool is ‘evergreen’ and will continue to be improved

15 | Building Technologies Office eere.energy.gov
Initial publications
Available at: http://www.nrel.gov/docs/fy12osti/54799.pdf

16 | Building Technologies Office eere.energy.gov
Omar Abdelaziz, Ph.D. Oak Ridge National Laboratory Building Technologies Office Edward Barbour and Bobby Dean Navigant Phil Farese , Ph.D. (Formerly) National Renewable Energy Laboratory Advantix Systems Pat Phelan, Ph.D. Building Technologies Office Peer reviewers (too many to name) from National Labs and Industry
Acknowledgments