Embed Size (px)
Citation preview

Regional Innovation Cluster and Economic Competitiveness
Alfredo Miranda L.Burke Murphy
September 25, 2012

México

What is Sintonía?
•State competitiveness ranking in 2001 placed Puebla 28th out of
32 states, ten years later neighboring states move from the
lower ranking to the top ten.
•Puebla is ranked fifth in terms of population. 5’383,133
inhabitants.
•Contributes 3.7% of the GDP
•95% of economic organization rank of SME’s
A regional competitiveness initiative that was formed by
in January 2012
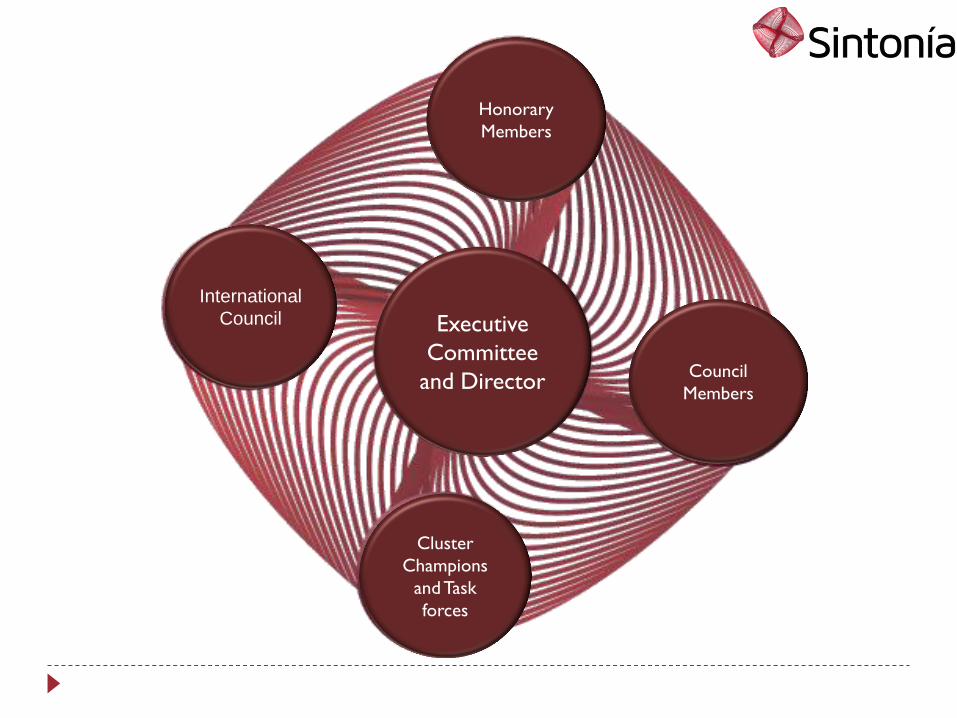
Executive
Committee
and Director
International
Council
Cluster
Champions
and Task
forces
Council
Members
Honorary
Members

Sintonía´s Kickoff •Feb. 13th 2012
Convening Stakeholders
• 3 Conferences with
International speakers
• Industry Workshops
• Plenary sessions
Clustering Workshops • General sessions with all
organizations
• Breakups by cluster
• cluster individual sessions
• Shared Value
The Journey up to now

In paralell
Mexico and Puebla Mapping Project
At Harvard, with Dr. Porter´s team,
Rick Bryden, Niels Ketelhöhn,
Alfonso Mendoza and Pablo Nuño
• 55 students
• 46 decided to work their final cluster
project related to Sintonia´s needs
• The students joined Sintonia groups
• Clusters are formed by business,
government, universities, and MOC
students
MOC Graduate Ph.D and M.S. Clustering workshops
• General sessions with all organizations
• Breakups by cluster
• Several individual sessions by cluster
Drivers
Cluster Map

Puebla
$0
$20,000
$40,000
$60,000
$80,000
$100,000
$120,000
$140,000
$160,000
$180,000
25 30 35 40 45 50 55 60
Competitiveness in Mexican States
Competitiveness Index, 2008
Gro
ss D
om
estic P
rodu
ct p
er
Ca
pita
, 2
01
0
(in
co
nsta
nt 2
00
3 M
exic
an P
esos)
Mexico GDP per Capita:
$77,212
Campeche ($333,700)
Baja California Sur
Distrito Federal
Tabasco
Baja California
Querétaro
Aguascalientes Sonora
Zacatecas
Nayarit Veracruz
Coahuila
Chiapas
Tlaxcala
Quintana Roo
Tamaulipas
Chihuahua Durango
Morelos
Colima Jalisco
Sinaloa San Luis Potosí
Yucatán Guanajuato
México
Hidalgo Michoacán
Oaxaca
Guerrero
Source: INEGI. Sistema de Cuentas Nacionales de México.
Nuevo León
0%
10%
20%
30%
40%
50%
60%
70%
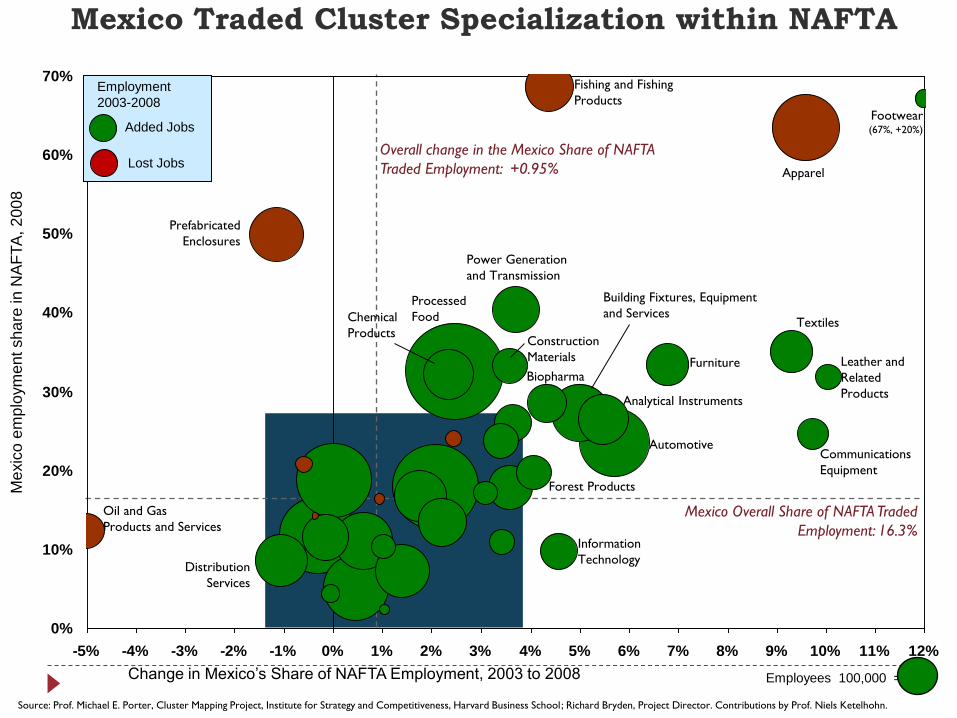
-5% -4% -3% -2% -1% 0% 1% 2% 3% 4% 5% 6% 7% 8% 9% 10% 11% 12%
Change in Mexico’s Share of NAFTA Employment, 2003 to 2008
Me
xic
o e
mp
loym
ent sh
are
in N
AF
TA
, 2
00
8
Employees 100,000 =
Mexico Traded Cluster Specialization within NAFTA
Overall change in the Mexico Share of NAFTA
Traded Employment: +0.95%
Source: Prof. Michael E. Porter, Cluster Mapping Project, Institute for Strategy and Competitiveness, Harvard Business School; Richard Bryden, Project Director. Contributions by Prof. Niels Ketelhohn.
Mexico Overall Share of NAFTA Traded
Employment: 16.3%
Added Jobs
Lost Jobs
Employment
2003-2008
Leather and
Related
Products
Footwear (67%, +20%)
Fishing and Fishing
Products
Apparel
Automotive
Textiles
Furniture
Power Generation
and Transmission
Oil and Gas
Products and Services
Prefabricated
Enclosures
Processed
Food
Communications
Equipment
Construction
Materials
Building Fixtures, Equipment
and Services
Analytical Instruments
Biopharma
Information
Technology
Forest Products
Chemical
Products
Distribution
Services

0.0%
2.0%
4.0%
6.0%
8.0%
10.0%
12.0%
14.0%
16.0%
-2.0% -1.0% 0.0% 1.0% 2.0% 3.0%
Change in Puebla’s share of National Employment, 2003 to 2008
Pu
eb
la’s
na
tio
na
l e
mplo
ym
ent sh
are
, 2
00
8
Employees 5,000 =
Traded Cluster Composition of the Puebla Economy Employement
Overall change in the Puebla Share of
Mexican Traded Employment: +0.09%
Puebla Overall Share of Mexican
Traded Employment: 4.20%
Added Jobs
Lost Jobs
Employment
2003-2008
Education and
Knowledge Creation
Textiles
Apparel
Information
Technology
Construction
Materials
Automotive
Processed
Food
Building Fixtures, Equipment
and Services
Distribution Services
Heavy Machinery
Furniture Leather and Related
Products
Forest Products
Chemical
Products
Source: Prof. Michael E. Porter, Cluster Mapping Project, Institute for Strategy and Competitiveness, Harvard Business School; Richard Bryden, Project Director. Contributions by Prof.
Niels Ketelhohn and UPAEP University, Puebla, México.

Furniture
1.24 Building
Fixtures,
Equipment &
Services
1.77
Fishing &
Fishing
Products
0.05 Hospitality
& Tourism
0.65
Agricultural
Products
0.65
Transportation
& Logistics
0.80
Puebla Cluster Portfolio, 2008
Plastics
0.48
Oil &
Gas
Chemical
Products
0.48
Biopharma-
Ceuticals
0.56
Power
Generation &
Transmission
0.54
Aerospace
Vehicles &
Defense
Lighting &
Electrical
Equipment Financial
Services
0.46
Publishing
& Printing
0.66
Entertainment
0.59
Information
Tech.
0.62
Communi
cations
Equipment
0.01
Aerospace
Engines
Business
Services
0.53
Distribution
Services
0.93
Forest
Products
1.23
Heavy
Construction
Services
0.73
Construction
Materials
3.29
Prefabricated
Enclosures
0.35
Heavy
Machinery
0.56
Sporting
& Recreation
Goods
0.35
Automotive
2.41
Production
Technology
0.67
Motor Driven
Products
0.26
Metal
Manufacturing
0.52
Apparel
3.01
Leather &
Related
Products
1.33
Jewelry &
Precious
Metals
0.27
Textiles
3.57
Footwear
0.48
Processed
Food
1.19
Tobacco
Medical
Devices
0.54
Analytical
Instruments
0.11
Education &
Knowledge
Creation
1.27
LQ > 3.0
LQ > 1.5
LQ > 1.0
LQ, or Location Quotient, measures the state’s share in cluster employment relative to its overall share of Mexican employment. An LQ > 1 indicates an above
average employment share in a cluster.
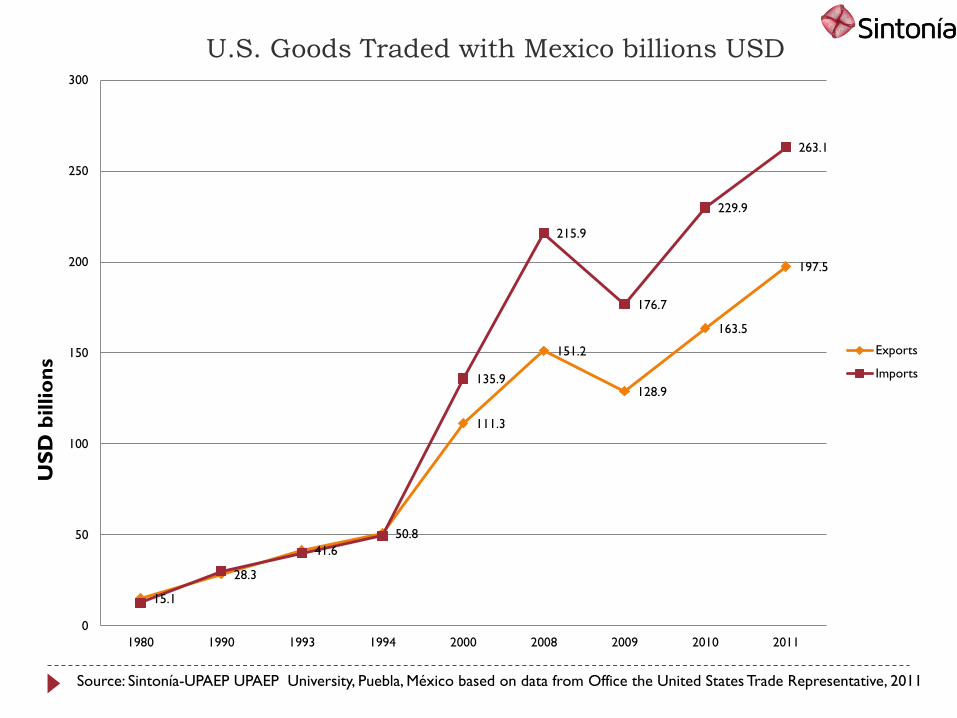
15.1
28.3
41.6
50.8
111.3
151.2
128.9
163.5
197.5
135.9
215.9
176.7
229.9
263.1
0
50
100
150
200
250
300
1980 1990 1993 1994 2000 2008 2009 2010 2011
U.S. Goods Traded with Mexico billions USD
Exports
Imports
US
D b
illio
ns
Source: Sintonía-UPAEP UPAEP University, Puebla, México based on data from Office the United States Trade Representative, 2011

8.6
10.4 11.3
15.5
24.8
25.9
23.1 24.1
25.6
6.7 7.4
7.9
10.8
15.2 15.5
13.5 13.7 14
0
5
10
15
20
25
30
1990 1993 1994 2000 2007 2008 2009 2010 2011
U.S. Services Traded with Mexico (billions USD)
Exports
ImportsUS
D
billio
s
Source: Sintonía-UPAEP UPAEP University, Puebla, México based on data from Office the United States Trade Representative, 2011
Exports
0.00
5.00
10.00
15.00
20.00
25.00
30.00
35.00
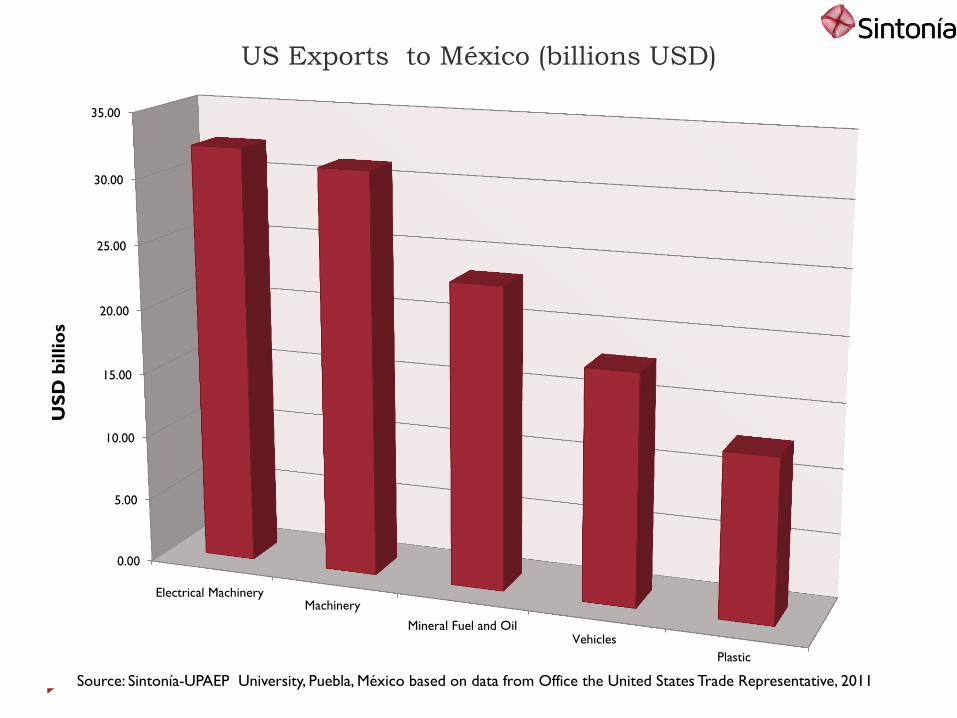
Electrical MachineryMachinery
Mineral Fuel and OilVehicles
Plastic
US Exports to México (billions USD) U
SD
billio
s
Source: Sintonía-UPAEP University, Puebla, México based on data from Office the United States Trade Representative, 2011
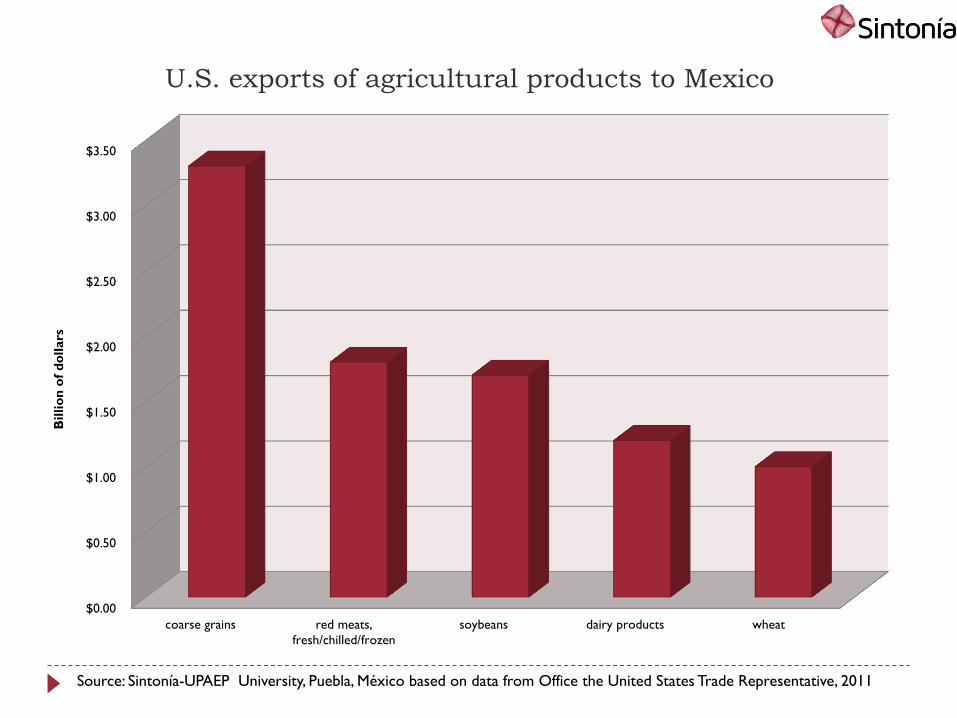
$0.00
$0.50
$1.00
$1.50
$2.00
$2.50
$3.00
$3.50
coarse grains red meats,
fresh/chilled/frozen
soybeans dairy products wheat
Billio
n o
f d
ollars
U.S. exports of agricultural products to Mexico
Source: Sintonía-UPAEP University, Puebla, México based on data from Office the United States Trade Representative, 2011

$0.00
$10.00
$20.00
$30.00
$40.00
$50.00
$60.00
Electrical Machinery Vehicles (cars, trucks
and parts)
Mineral Fuel and Oil
(crude)
Machinery Precious Stones (gold
and silver)
US
D b
illio
n
The five largest México exports to US in 2011
Source: Sintonía-UPAEP University, Puebla, México based on data from Office the United States Trade Representative, 2011

$0.00
$0.50
$1.00
$1.50
$2.00
$2.50
$3.00
$3.50
$4.00
$4.50
fresh vegetables fresh fruit (excluding bananas) wine and beer snack foods (including
chocolate)
US
D b
illio
n
México exports of agricultural products to US
Source: Sintonía-UPAEP University, Puebla, México based on data from Office the United States Trade Representative, 2011

México one of the open economies
Mexico has 42 free trade agreements.
Exports and imports as a percentage of GDP is:
58.6% in Mexico
18.5% in Brazil
51.7% in Canada

Competitiveness trend
Companies are beginning to set aside the outsourcing, and
beginning to use near sourcing
China is losing competitiveness

Global Context Automotive Sector
Global Vehicle Production 2011: 75 million units (56 million are light
vehicles), with global sales of USD 2400 billion.
% Automotive World Production 2011 (Units)
World Producer Market
Place (2011)
8th
World Export Market
Place (2011)
5th
World Producer Market
Total Production (2011)
2.55 million cars
Source: MOC-UPAEP University, Puebla, México based on data from OICA

Mexico’s Automotive Sector
National Manufacturing GDP
(2011)
20%
Employees
(2011)
Approx. 550,000
World´s leading OEMs assembly
plant
(2011)
8 companies producing
light vehicles
Export
Quantity
(2011)
2.14
million
cars
Growth
Domestic
Production
(2011)
14.4%
Growth
Domestic
Mkt
(2011)
10.4%
% Market Share by Brand Mexico
(1Q 2012)
GENERAL
MOTORS
21.3%
NISSAN
23.7%
VOLKSWAGEN
19.9%
FORD
MOTOR
9%
CHRYSLER
9%
TOYOTA
5%
HONDA
4%
MAZDA
3%
RENAULT
3% REST
9%
Source: MOC-UPAEP University, Puebla, México based on AMIA, Business Monitor International

Puebla’s Automotive share
State Manufacturing
GDP
(2011)
25.6%
Total export value
(2011)
USD$ 611 Million
Population
(2011)
5th
Tier 1 purchasing share 2011
Source: MOC-UPAEP University, Puebla, México based on National Institute of Statistics and Geography (INEGI),http://www.inegi.org.mx/.
Puebla
39%
Rest of Mexico
61%

Puebla’s Automotive Cluster Map
Source: MOC-UPAEP University, Puebla, México.
TEXTILE

VW de Mexico largest automotive plant
in North America >403k during first 8
months of 2012

Puebla 115 companies in auto supply chain

25
48%
16%
13%
7%
3%
3%
3% 2%
2% 1% 1% 1% 0%
World Exports by Subcluster
2010
Others
Vegetables and Fruits
Meat and Related Products
Grains
Sugars, Molasses and Honey
Packaged Cereal Foods
Candy and Chocolate
Spirits and Miscellaneous
Fermented BeveragesMetal and Glass Containers
Paper Containers and Boxes
Non-alcoholic Beverages
Malt Beverages
Miscellaneous Vegetable
Materials
World Exports of the clusters in 2010:
USD $ 1.12 Billions
Mexico Ranking: 18 | USD $ 18,471.23
$0.00 $0.05 $0.10 $0.15
1° USA
Netherlands
Germany
France
Brazil
China
Italy
Canada
Belgium
Argentina
18° Mexico
Millons
Export Value by Nation, 2010
Agricultural Products Cluster Processed Food Cluster
Mexico: 1.64% of World Exports
$ 12,125.95 $ 6,345.29
Agricultural Products and Processed Food
Source: MOC-UPAEP University, Puebla, México based on data from Harvard


Sintonía cluster workshops

Collaboration index
Source: Sintonía-UPAEP University, Puebla, México.

Project detonator framework
Articulation
Collaboration Index
Critical Success Factors
Performance indicators goals in the short, medium and long term
Strategy Implementation
justification Objectives Schedule of activities Financial and institutional
responsibilities for its development.
Diagnosis of the competitive situation
Description and assessment of the competitiveness factors
Diagnosing competitive position. (Porter Diamond)
Identification of national and international best practices (benchmarking)
Proyect Detonador
Definition
Source: L.B.Murphy , Sintonía-UPAEP University, Puebla, México.

Beginning of the network
Shift interest
Agreement
Consistent attendance
Project Detonator
Increase revenue
Relevant talent development
Increased health
outcomes
Industry demand driven
education
Environmental impacts
Global competitiveness
Articulation-
Sintonía
Source: L.B.Murphy , Sintonía-UPAEP University, Puebla, México.

Project: Collaboration between the private sector in response to 14
catastrophic sickness through Seguro Popular
Stakeholder:
Exacta
H. Christus Muguerza
Beneficencia Española
Secretaría de Salud
Hospital Puebla
Recovery Páez
Radiología Diagnóstico Clínico. Unidad Médica La loma
Red Estatal de prevención de discapacidad
Centro Medico Quirúrgico.
Cluster Coordinator:
Luis Miguel Perez – H. Christus Muguerza
Status of the proyect: Cooperating private and public hospitals.
Clúster: Salud
Septiembre 2012
Shared Value project detonators
Source: Sintonía-UPAEP University, Puebla, México.

Project: Develop a matrix that allows an easy access to credits, and develop a
new model of business plan
Stakeholder:
Banco del Bajío
Bancomer
Nacional Financiera
Bancomer
HSBC
Nafinsa
Cluster Coordinator:
Gonzalo Hortega - VWFS
Status of the project: Research information of credit supply of 10
banking institutions
Cluster: Finance
Shared Value project detonators
Source: Sintonía-UPAEP University, Puebla, México.

Pilot project detonator of tourism
Shared Value–Anchor Strategy.
Africam

![[PPT]PREFABRICATED BUILDING - Wikispacescarlavl.wikispaces.com/file/view/PREFABRICATED+BUILDING.ppt · Web viewPREFABRICATED BUILDING Vargas, Valentina Vásquez, Carla CONTENT: Prefabricated](https://img.pdfslide.net/doc/110x75/5ada5d397f8b9a6d7e8ca107/pptprefabricated-building-buildingpptweb-viewprefabricated-building-vargas.jpg)