Embed Size (px)
Citation preview
S22 Extra Practice
Lesson
10-1
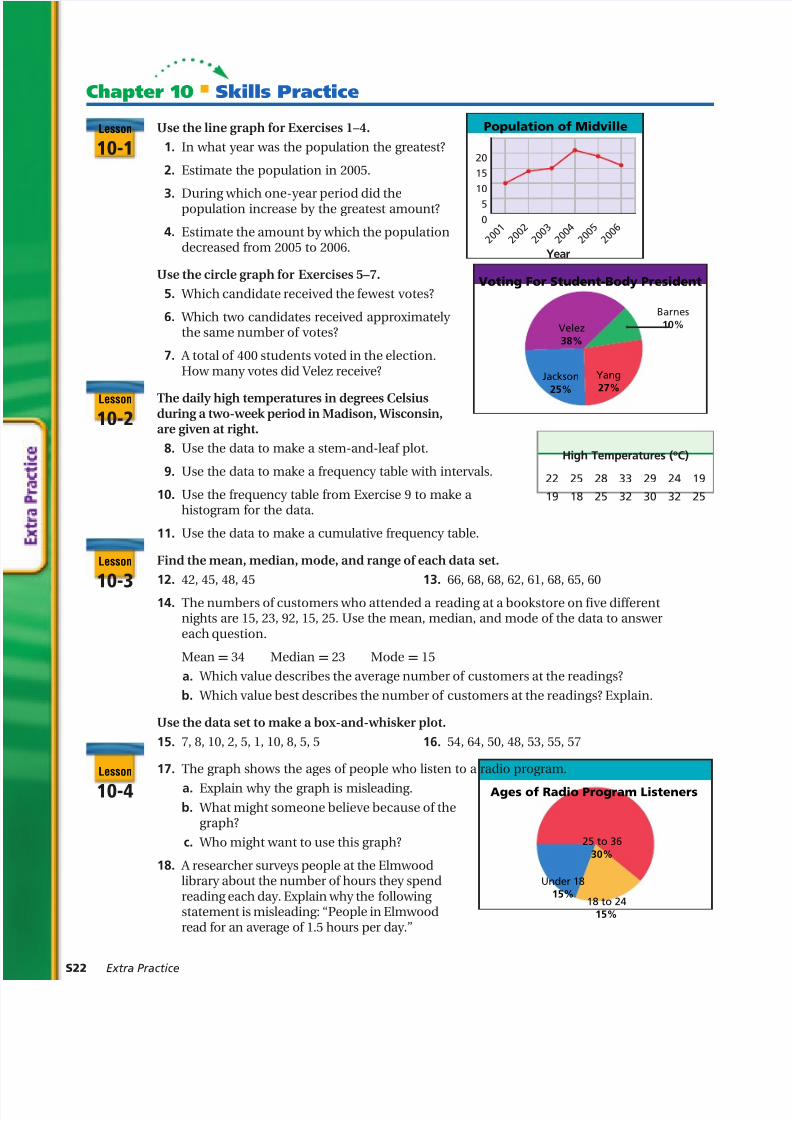
Use the line graph for Exercises 1–4.
1. In what year was the population the greatest?
2. Estimate the population in 2005.
3. During which one-year period did thepopulation increase by the greatest amount?
4. Estimate the amount by which the populationdecreased from 2005 to 2006.
Use the circle graph for Exercises 5–7.
5. Which candidate received the fewest votes?
6. Which two candidates received approximately the same number of votes?
7. A total of 400 students voted in the election.How many votes did Velez receive?
Lesson
10-2
The daily high temperatures in degrees Celsiusduring a two-week period in Madison, Wisconsin,are given at right.
8. Use the data to make a stem-and-leaf plot.High Temperatures (oC)
22 25 28 33 29 24 19
19 18 25 32 30 32 25
9. Use the data to make a frequency table with intervals.
10. Use the frequency table from Exercise 9 to make ahistogram for the data.
11. Use the data to make a cumulative frequency table.
Lesson
10-3
Find the mean, median, mode, and range of each data set.
12. 42, 45, 48, 45 13. 66, 68, 68, 62, 61, 68, 65, 60
14. The numbers of customers who attended a reading at a bookstore on five differentnights are 15, 23, 92, 15, 25. Use the mean, median, and mode of the data to answereach question.
Mean= 34 Median = 23 Mode = 15
a. Which value describes the average number of customers at the readings?
b. Which value best describes the number of customers at the readings? Explain.
Use the data set to make a box-and-whisker plot.
15. 7, 8, 10, 2, 5, 1, 10, 8, 5, 5 16. 54, 64, 50, 48, 53, 55, 57
Lesson
10-4
17. The graph shows the ages of people who listen to a radio program.
a. Explain why the graph is misleading.
b. What might someone believe because of thegraph?
c. Who might want to use this graph?
18. A researcher surveys people at the Elmwoodlibrary about the number of hours they spendreading each day. Explain why the following statement is misleading: “People in Elmwoodread for an average of 1.5 hours per day.”
Chapter 10 Skills Practice
Óä
£x
£ä
x
ä
*«Õ>ÌÊvÊ`Ûi
9i>À
Ó ä ä £
Ó ä ä Ó
Ó ä ä Î
Ó ä ä {
Ó ä ä x
Ó ä ä È
6Ì}ÊÀÊ-ÌÕ`iÌ`ÞÊ*ÀiÃ`iÌ
6iiâ
În¯
>VÃ
Óx¯
9>}
Óǯ
>ÀiÃ
£ä¯
}iÃÊvÊ,>`Ê*À}À>ÊÃÌiiÀÃ
ÓxÊÌÊÎÈ
Îä¯
£nÊÌÊÓ{
£x¯
1`iÀÊ£n
£x¯
Extra Practice S23
Lesson
10-5
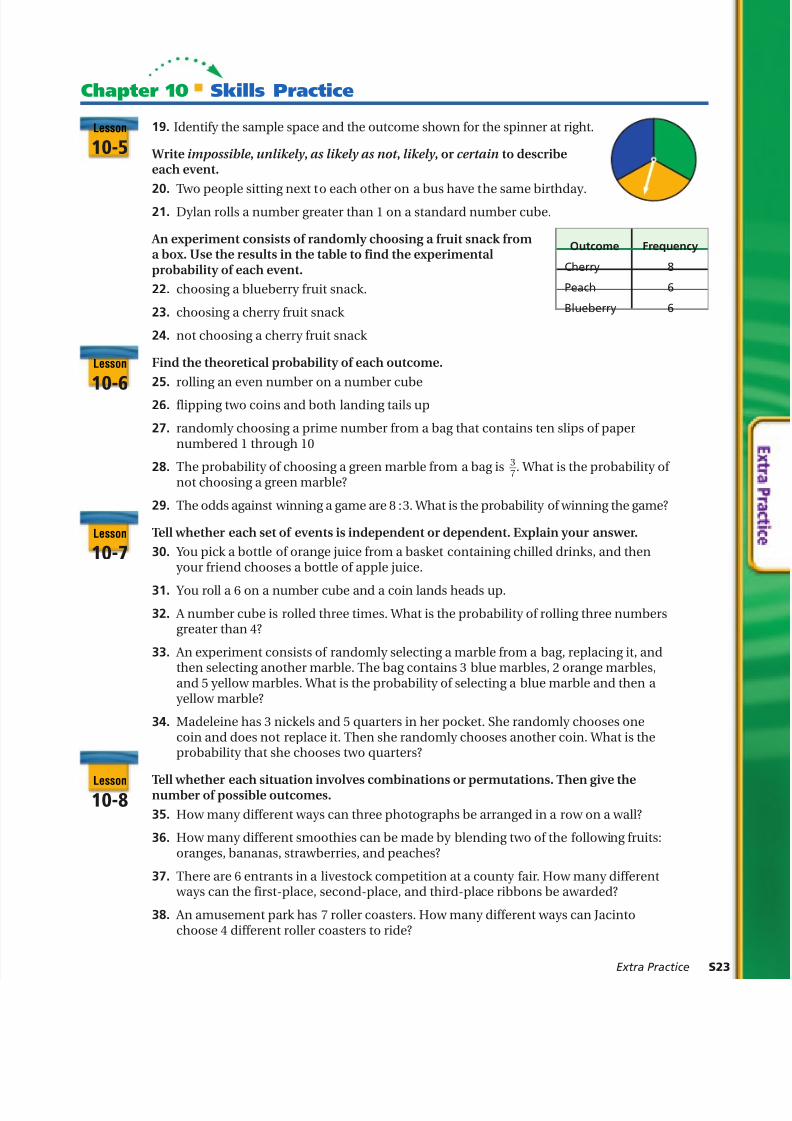
19. Identify the sample space and the outcome shown for the spinner at right.
Write impossible , unlikely , as likely as not , likely , or certain to describeeach event.
20. Two people sitting next to each other on a bus have the same birthday.
21. Dylan rolls a number greater than 1 on a standard number cube.
An experiment consists of randomly choosing a fruit snack fromOutcome Frequency
Cherry 8
Peach 6
Blueberry 6
a box. Use the results in the table to find the experimentalprobability of each event.
22. choosing a blueberry fruit snack.
23. choosing a cherry fruit snack
24. not choosing a cherry fruit snack
Lesson
10-6
Find the theoretical probability of each outcome.
25. rolling an even number on a number cube
26. flipping two coins and both landing tails up
27. randomly choosing a prime number from a bag that contains ten slips of papernumbered 1 through 10
28. The probability of choosing a green marble from a bag is 3 __ 7
. What is the probability of not choosing a green marble?
29. The odds against winning a game are 8 : 3. What is the probability of winning the game?
Lesson
10-7
Tell whether each set of events is independent or dependent. Explain your answer.
30. You pick a bottle of orange juice from a basket containing chilled drinks, and then your friend chooses a bottle of apple juice.
31. You roll a 6 on a number cube and a coin lands heads up.
32. A number cube is rolled three times. What is the probability of rolling three numbersgreater than 4?
33. An experiment consists of randomly selecting a marble from a bag, replacing it, andthen selecting another marble. The bag contains 3 blue marbles, 2 orange marbles,and 5 yellow marbles. What is the probability of selecting a blue marble and then a
yellow marble?
34. Madeleine has 3 nickels and 5 quarters in her pocket. She randomly chooses onecoin and does not replace it. Then she randomly chooses another coin. What is theprobability that she chooses two quarters?
Lesson
10-8
Tell whether each situation involves combinations or permutations. Then give thenumber of possible outcomes.
35. How many different ways can three photographs be arranged in a row on a wall?
36. How many different smoothies can be made by blending two of the following fruits:oranges, bananas, strawberries, and peaches?
37. There are 6 entrants in a livestock competition at a county fair. How many different ways can the first-place, second-place, and third-place ribbons be awarded?
38. An amusement park has 7 roller coasters. How many different ways can Jacintochoose 4 different roller coasters to ride?
Chapter 10 Skills Practice


