Embed Size (px)
Citation preview
ALGEBRA/DATA ANALYSIS
Public Release 2007

Session 1
Algebra/Data Analysis Public Release 2007 Page 4Copyright © 2007 by Maryland State Department of Education.
■ 1 The matrices below show the number of students that participate in sports at Valley High School.
Soccer
Swimming
Basketball
Volleyball
6
11
7
6
5
9
12
15
10
3
11
9
3
7
9
1
Grade
9 10 11 12
Males
Soccer
Swimming
Basketball
Volleyball
4
2
5
6
7
0
8
10
12
1
13
4
2
1
11
8
Grade
9 10 11 12
Females
SPORTS PARTICIPATION
What sport has the greatest number of 11th-grade students who participate in that sport?
A soccer
B swimming
C basketball
D volleyball
■ 2 Look at the pattern below.
a a a a+ + + +5 2 8 3 11 4 14, , , , . . .
If this pattern continues, what will be the next term?
F 4 16a +
G 4 17a +
H 5 14a +
J 5 17a +

Session 1
Algebra/Data Analysis Public Release 2007 Page 5Copyright © 2007 by Maryland State Department of Education.
■ 3 The table below shows the percent of golfers who participate in other activities.
Fishing
Boating/Sailing
Snow Skiing
Watching Sports on TV
Frequent Flying
Activity
OTHER ACTIVITIES OF GOLFERS
32%
16%
15%
58%
33%
GolfersWho Participate
Based on the table, out of 50 golfers, how many would be expected to watch sports on TV?
A 16 golfers
B 29 golfers
C 33 golfers
D 58 golfers
■ 4 An item is on sale for 25% off the original price. Which of these expressions represents the sale price of an item that originally sold for y dollars?
F 0 25. y y−
G y y− 0 25.
H y − 0 25.
J 25y y−
Session 1
Algebra/Data Analysis Public Release 2007 Page 6Copyright © 2007 by Maryland State Department of Education.
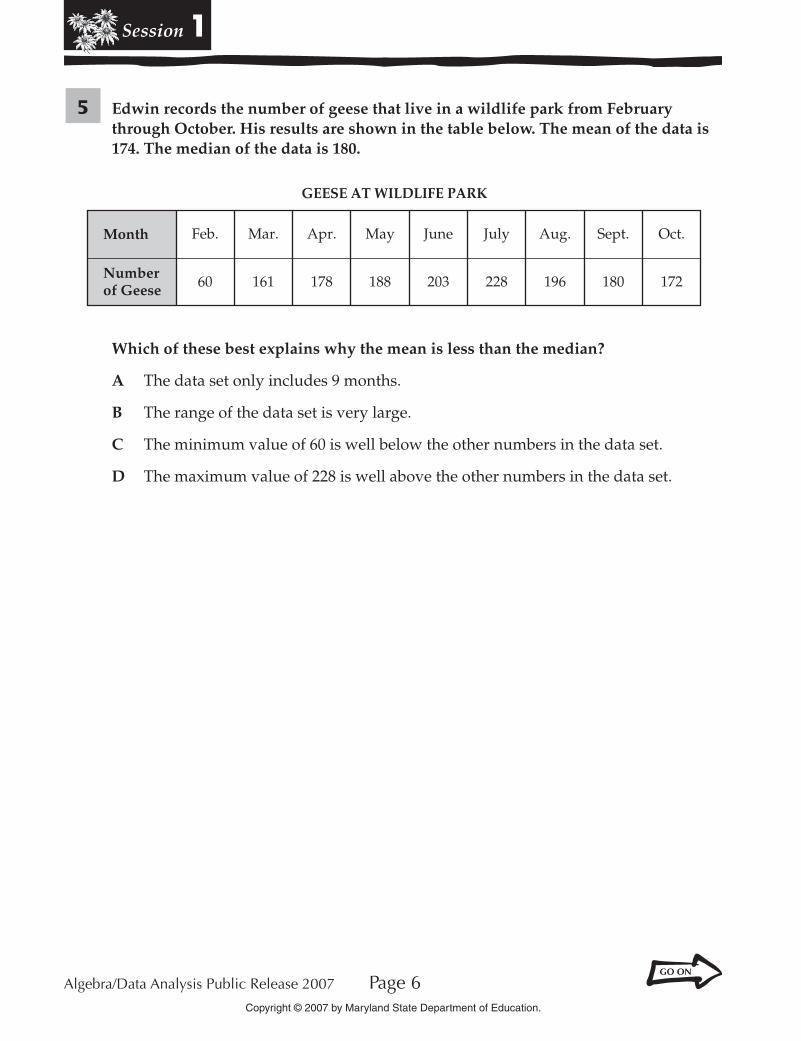
■ 5 Edwin records the number of geese that live in a wildlife park from February through October. His results are shown in the table below. The mean of the data is 174. The median of the data is 180.
GEESE AT WILDLIFE PARK
Month
Numberof Geese
Feb.
60
Mar.
161
Apr.
178
May
188
June
203
July
228
Aug.
196
Sept.
180
Oct.
172
Which of these best explains why the mean is less than the median?
A The data set only includes 9 months.
B The range of the data set is very large.
C The minimum value of 60 is well below the other numbers in the data set.
D The maximum value of 228 is well above the other numbers in the data set.
Session 1
Algebra/Data Analysis Public Release 2007 Page 7Copyright © 2007 by Maryland State Department of Education.
6BCR
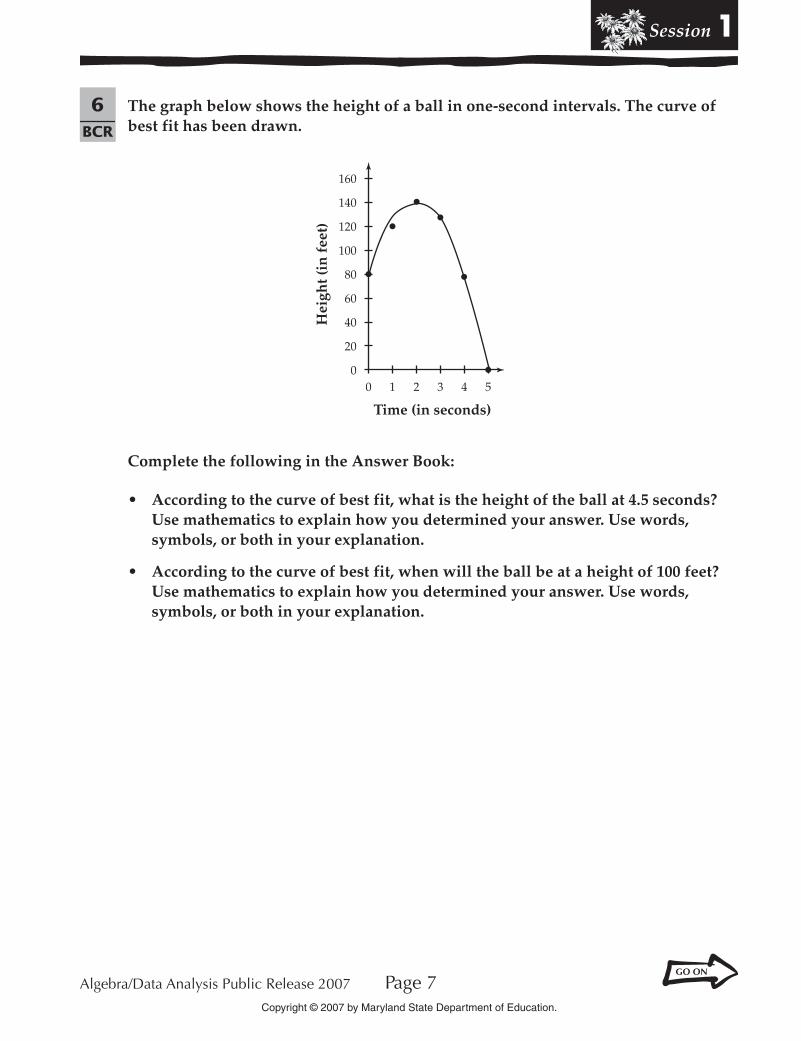
The graph below shows the height of a ball in one-second intervals. The curve of best fit has been drawn.
0 1 2 3 4 50
20
40
60
80
100
120
140
160
Hei
ght (
in f
eet)
Time (in seconds)
Complete the following in the Answer Book:
• According to the curve of best fit, what is the height of the ball at 4.5 seconds? Use mathematics to explain how you determined your answer. Use words, symbols, or both in your explanation.
• According to the curve of best fit, when will the ball be at a height of 100 feet? Use mathematics to explain how you determined your answer. Use words, symbols, or both in your explanation.
Session 1
Algebra/Data Analysis Public Release 2007 Page 8Copyright © 2007 by Maryland State Department of Education.
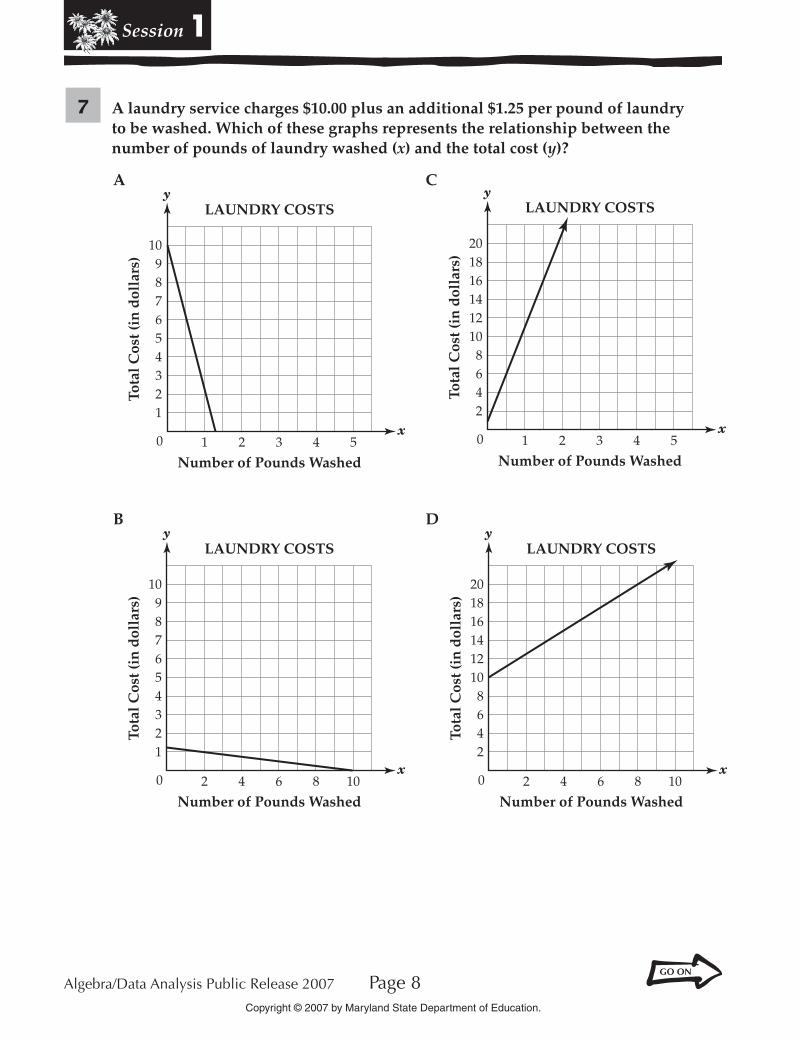
■ 7 A laundry service charges $10.00 plus an additional $1.25 per pound of laundry to be washed. Which of these graphs represents the relationship between the number of pounds of laundry washed (x) and the total cost (y)?
Ay
x
Tota
l Cos
t (in
dol
lars
)
Number of Pounds Washed
LAUNDRY COSTS
10987654321
0 1 2 3 54
C y
x
Tota
l Cos
t (in
dol
lars
)Number of Pounds Washed
LAUNDRY COSTS
2018161412108642
0 1 2 3 54
B y
x
Tota
l Cos
t (in
dol
lars
)
Number of Pounds Washed
LAUNDRY COSTS
10987654321
0 2 4 6 108
D y
x
Tota
l Cos
t (in
dol
lars
)
Number of Pounds Washed
LAUNDRY COSTS
2018161412108642
0 2 4 6 108
Session 1
Algebra/Data Analysis Public Release 2007 Page 9Copyright © 2007 by Maryland State Department of Education.
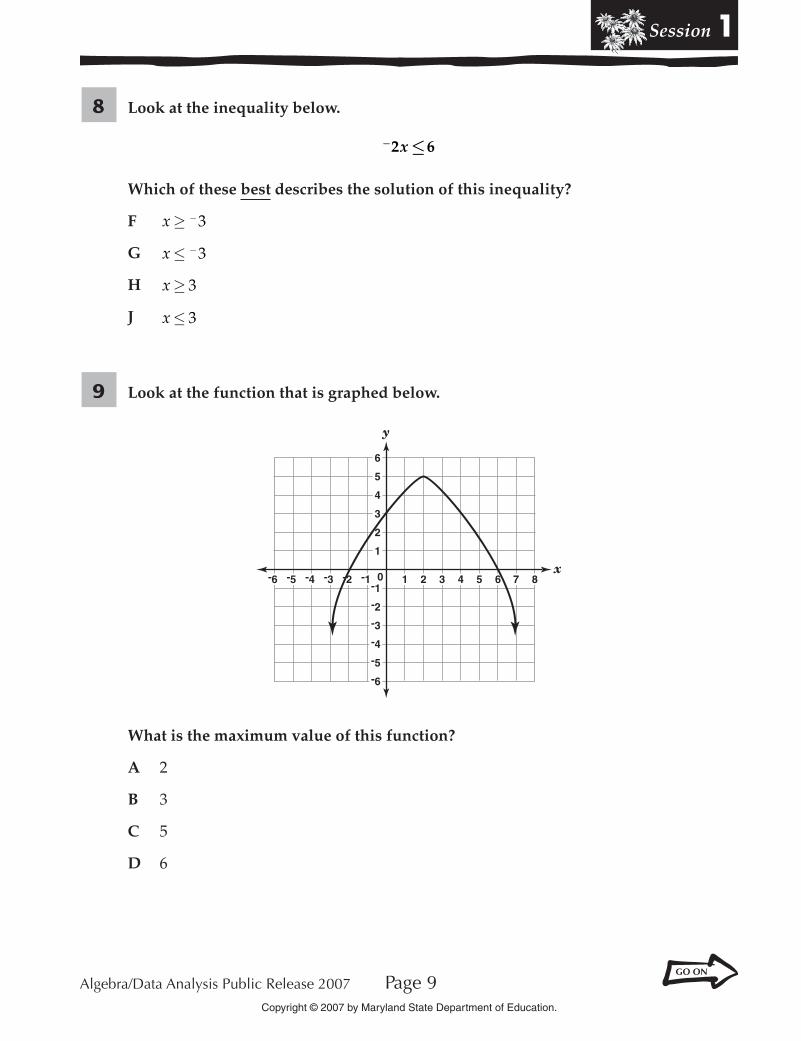
■ 8 Look at the inequality below.
− ≤2 6x
Which of these best describes the solution of this inequality?
F x ≥ −3
G x ≤ −3
H x ≥ 3
J x ≤ 3
■ 9 Look at the function that is graphed below.
y
x654321
6
5
4
3
2
1
-1
-2
-3
-4
-5
-6
-6 -5 -4 -3 -2 -1 0 7 8
What is the maximum value of this function?
A 2
B 3
C 5
D 6
Session 1
Algebra/Data Analysis Public Release 2007 Page 10Copyright © 2007 by Maryland State Department of Education.
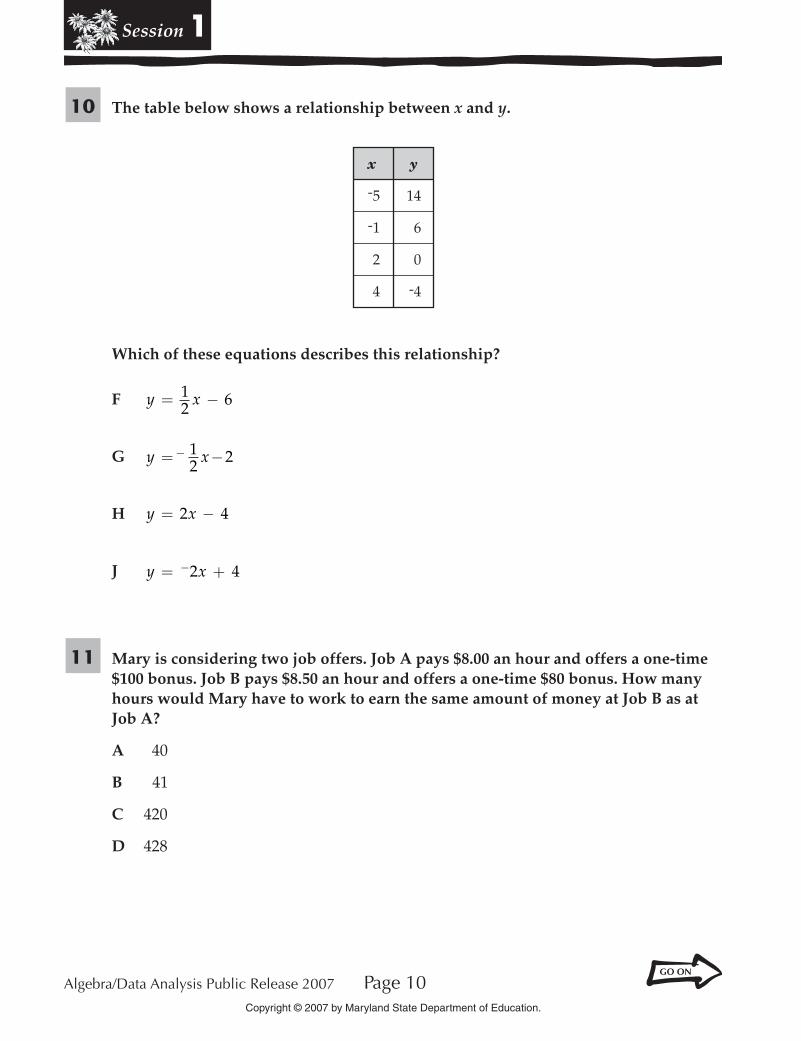
■ 10 The table below shows a relationship between x and y.
x y
14
6
0
-4
-5
-1
2
4
Which of these equations describes this relationship?
F y x= −12 6
G y x= −− 12 2
H y x= −2 4
J y x= +−2 4
■ 11 Mary is considering two job offers. Job A pays $8.00 an hour and offers a one-time $100 bonus. Job B pays $8.50 an hour and offers a one-time $80 bonus. How many hours would Mary have to work to earn the same amount of money at Job B as at Job A?
A 40
B 41
C 420
D 428
Session 1
Algebra/Data Analysis Public Release 2007 Page 11Copyright © 2007 by Maryland State Department of Education.
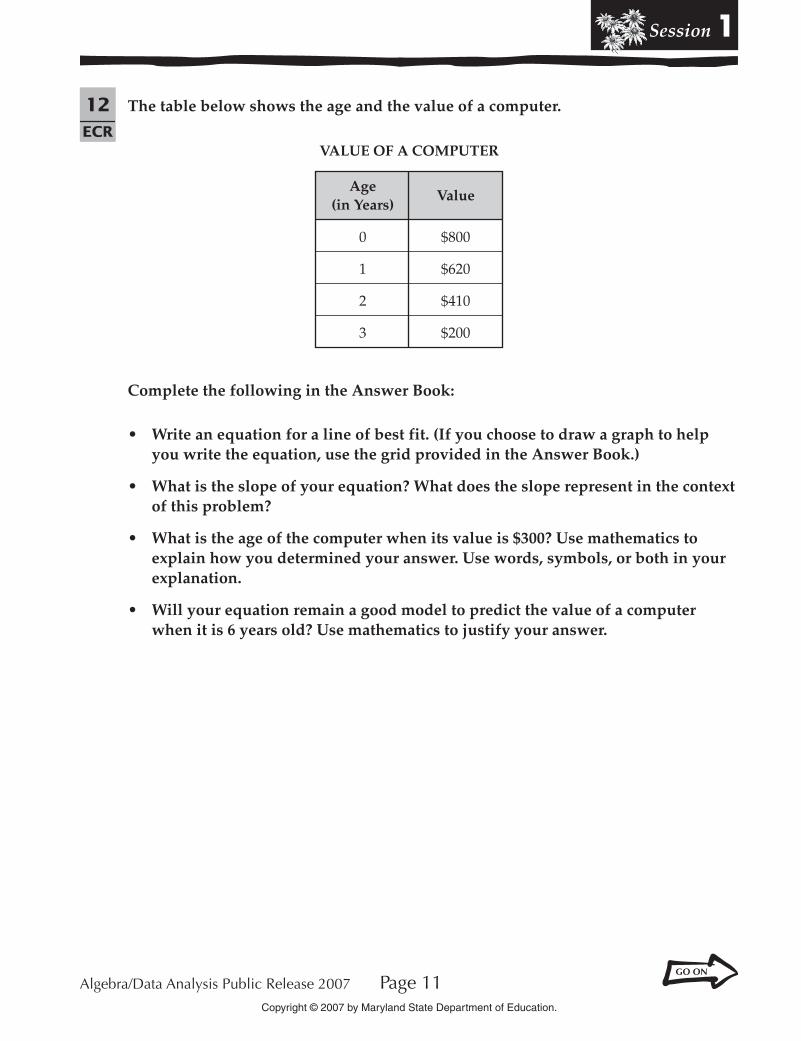
12ECR
The table below shows the age and the value of a computer.
ValueAge
(in Years)
VALUE OF A COMPUTER
$800
$620
$410
$200
0
1
2
3
Complete the following in the Answer Book:
• Write an equation for a line of best fit. (If you choose to draw a graph to help you write the equation, use the grid provided in the Answer Book.)
• What is the slope of your equation? What does the slope represent in the context of this problem?
• What is the age of the computer when its value is $300? Use mathematics to explain how you determined your answer. Use words, symbols, or both in your explanation.
• Will your equation remain a good model to predict the value of a computer when it is 6 years old? Use mathematics to justify your answer.
Session 1
Algebra/Data Analysis Public Release 2007 Page 12Copyright © 2007 by Maryland State Department of Education.
Directions
Use the Response Grids in the Answer Book to complete Numbers 13 through 15.
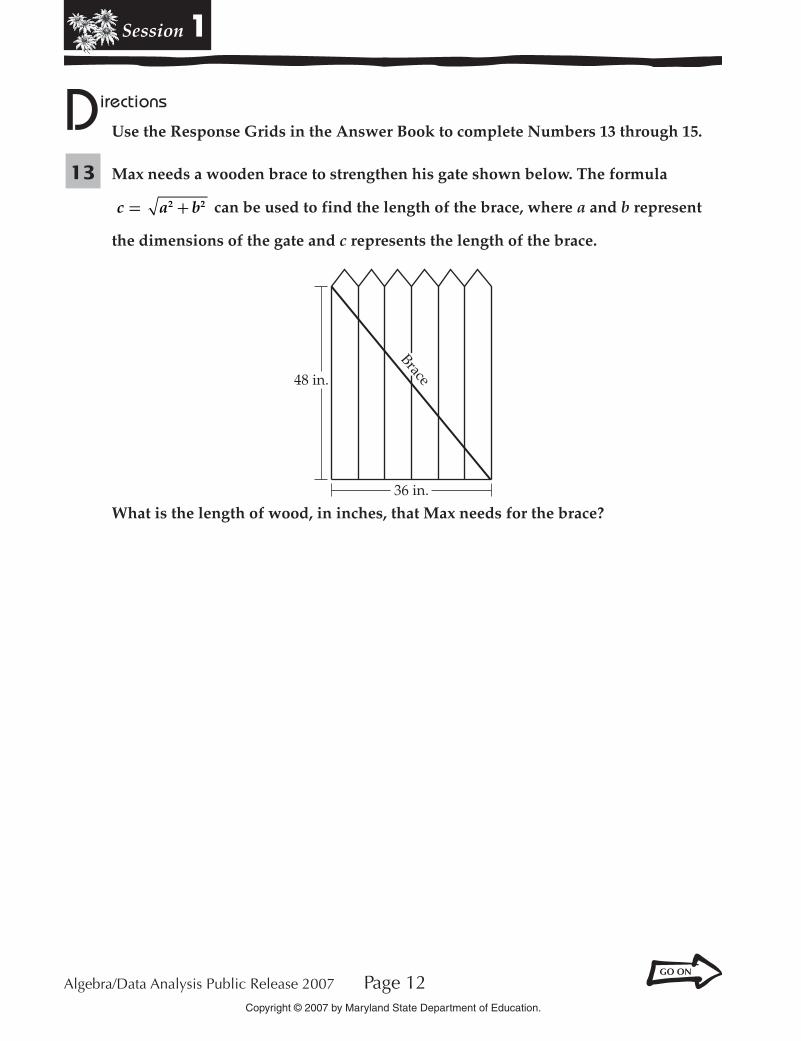
■ 13 Max needs a wooden brace to strengthen his gate shown below. The formula
c a b= +2 2 can be used to find the length of the brace, where a and b represent
the dimensions of the gate and c represents the length of the brace.
36 in.
48 in.Brace
What is the length of wood, in inches, that Max needs for the brace?
Session 1
Algebra/Data Analysis Public Release 2007 Page 13Copyright © 2007 by Maryland State Department of Education.
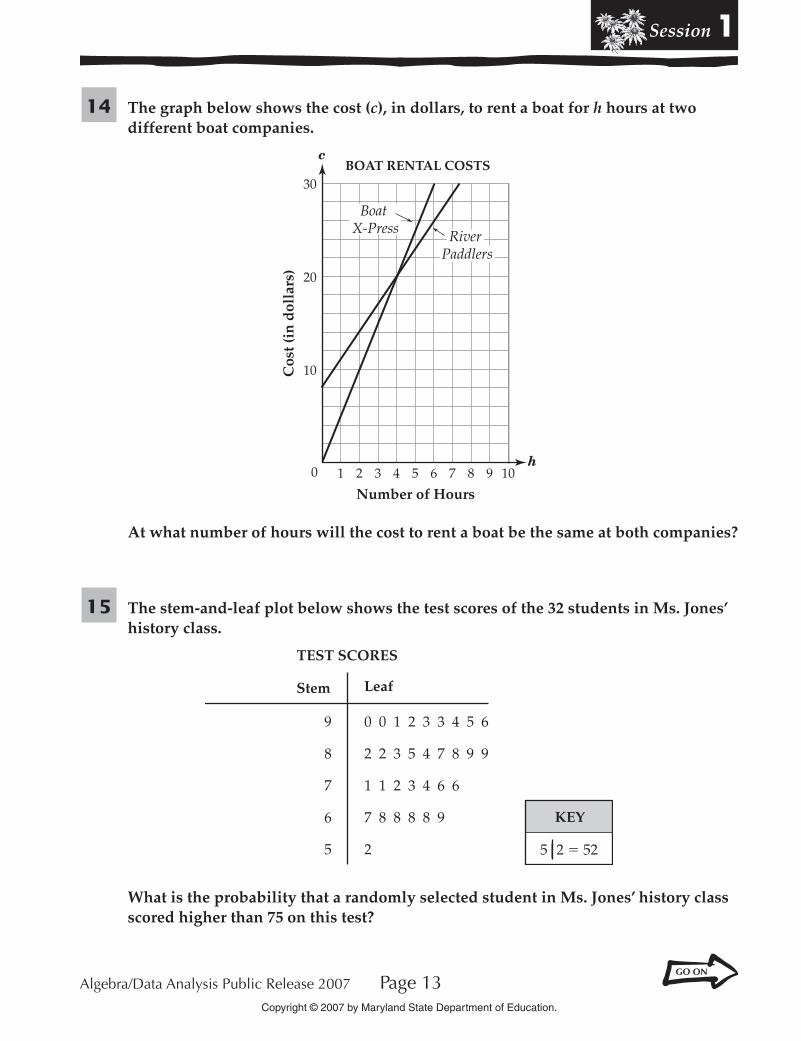
■ 14 The graph below shows the cost (c), in dollars, to rent a boat for h hours at two different boat companies.
30
20
10Cos
t (in
dol
lars
)
0 1 2 3 4 5 6 7 8 9 10
Number of Hours
BOAT RENTAL COSTSc
h
Boat X-Press River
Paddlers
At what number of hours will the cost to rent a boat be the same at both companies?
■ 15 The stem-and-leaf plot below shows the test scores of the 32 students in Ms. Jones’ history class.
TEST SCORES
Stem Leaf
0 0 1 2 3 3 4 5 6
2 2 3 5 4 7 8 9 9
1 1 2 3 4 6 6
7 8 8 8 8 9
2
9
8
7
6
5 5|2 � 52
KEY
What is the probability that a randomly selected student in Ms. Jones’ history class scored higher than 75 on this test?
Session 1
Algebra/Data Analysis Public Release 2007 Page 14Copyright © 2007 by Maryland State Department of Education.
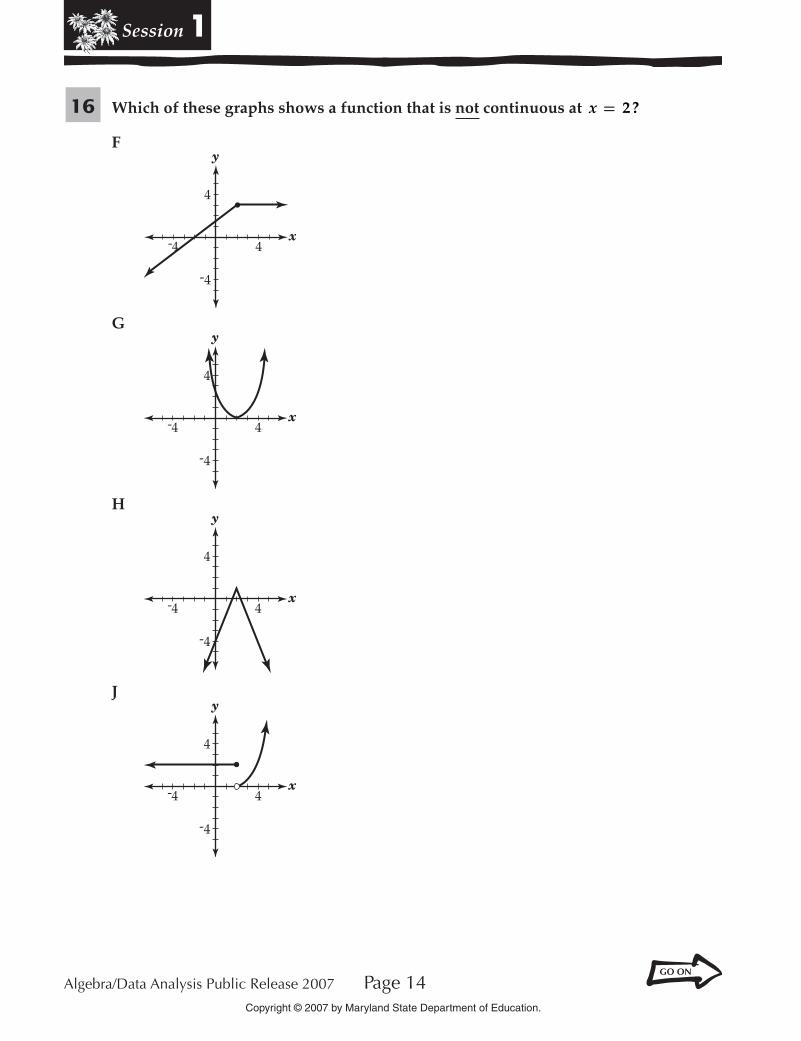
■ 16 Which of these graphs shows a function that is not continuous at x = 2?
F
-
-4
4 4
4
y
x
G
-
-4
4 4
4
y
x
H
-
-4
4 4
4
y
x
J
-
-4
4 4
4
y
x
Session 1
Algebra/Data Analysis Public Release 2007 Page 15Copyright © 2007 by Maryland State Department of Education.
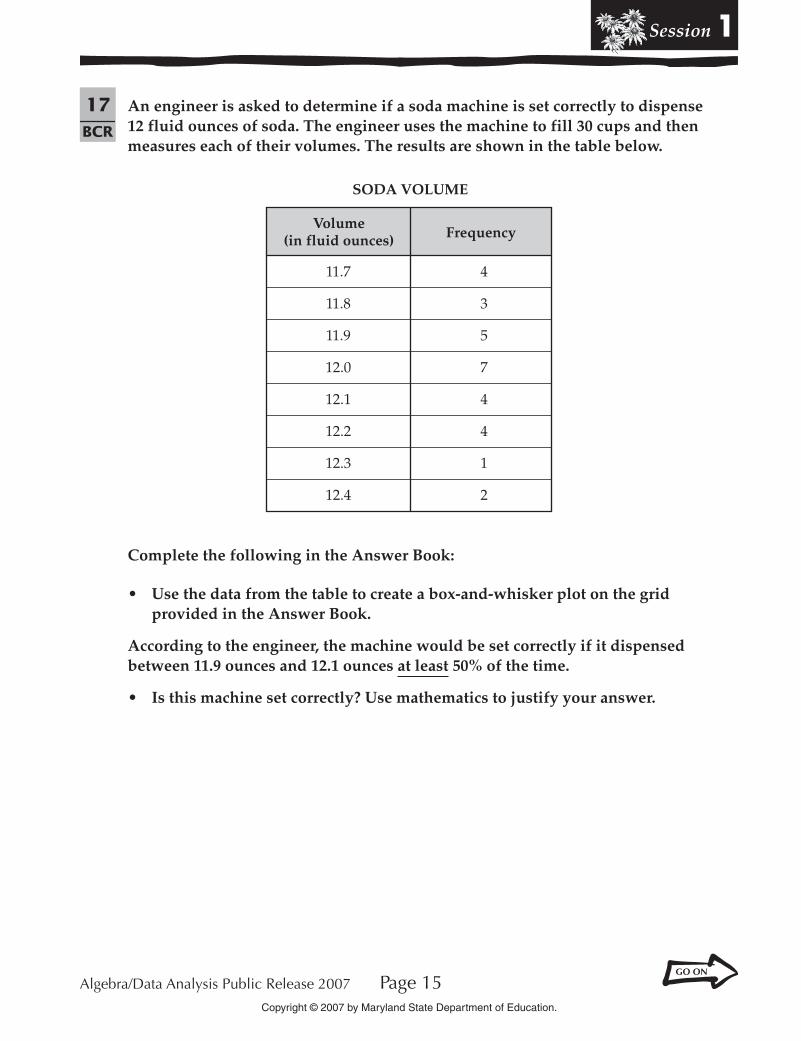
17BCR
An engineer is asked to determine if a soda machine is set correctly to dispense 12 fluid ounces of soda. The engineer uses the machine to fill 30 cups and then measures each of their volumes. The results are shown in the table below.
SODA VOLUME
FrequencyVolume
(in fluid ounces)
4
3
5
7
4
4
1
2
11.7
11.8
11.9
12.0
12.1
12.2
12.3
12.4
Complete the following in the Answer Book:
• Use the data from the table to create a box-and-whisker plot on the grid provided in the Answer Book.
According to the engineer, the machine would be set correctly if it dispensed between 11.9 ounces and 12.1 ounces at least 50% of the time.
• Is this machine set correctly? Use mathematics to justify your answer.
Session 1
Algebra/Data Analysis Public Release 2007 Page 16Copyright © 2007 by Maryland State Department of Education.
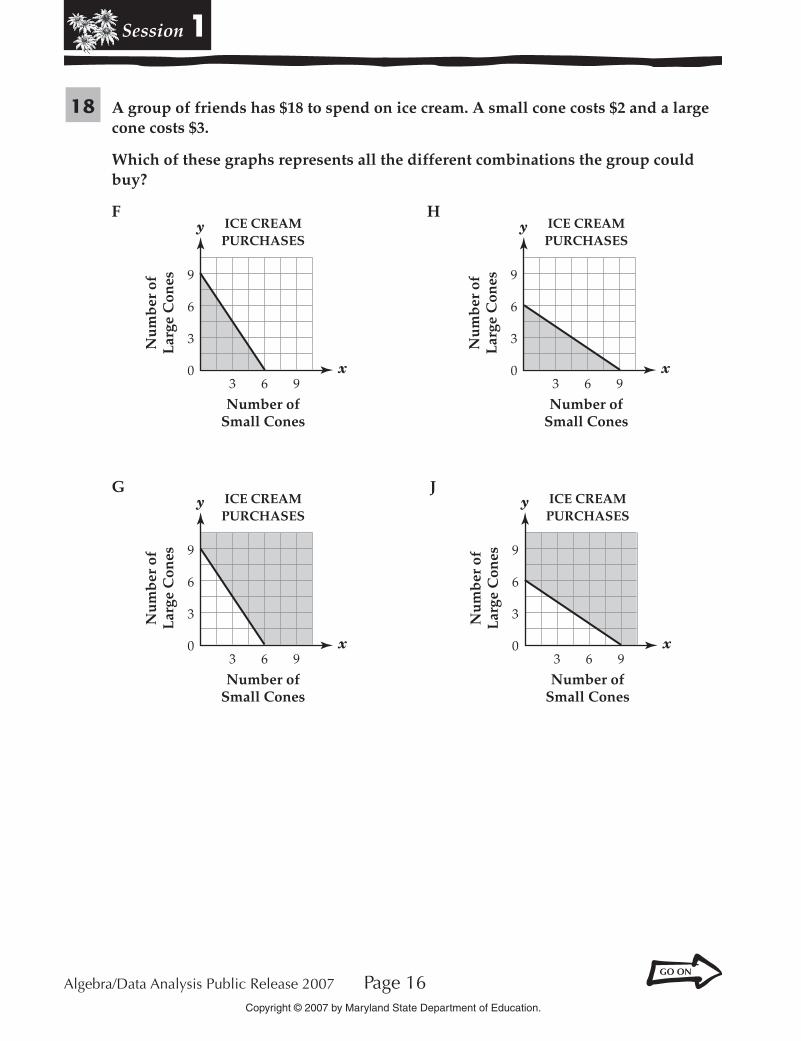
■ 18 A group of friends has $18 to spend on ice cream. A small cone costs $2 and a large cone costs $3.
Which of these graphs represents all the different combinations the group could buy?
F
Number ofSmall Cones
Nu
mb
er o
fL
arge
Con
es 9
6
3
03 6 9
ICE CREAMPURCHASES
y
x
H
Number ofSmall Cones
Nu
mb
er o
fL
arge
Con
es 9
6
3
03 6 9
ICE CREAMPURCHASES
y
x
G
Number ofSmall Cones
Nu
mb
er o
fL
arge
Con
es 9
6
3
03 6 9
ICE CREAMPURCHASES
y
x
J
Number ofSmall Cones
Nu
mb
er o
fL
arge
Con
es 9
6
3
03 6 9
ICE CREAMPURCHASES
y
x
Session 1
Algebra/Data Analysis Public Release 2007 Page 17Copyright © 2007 by Maryland State Department of Education.
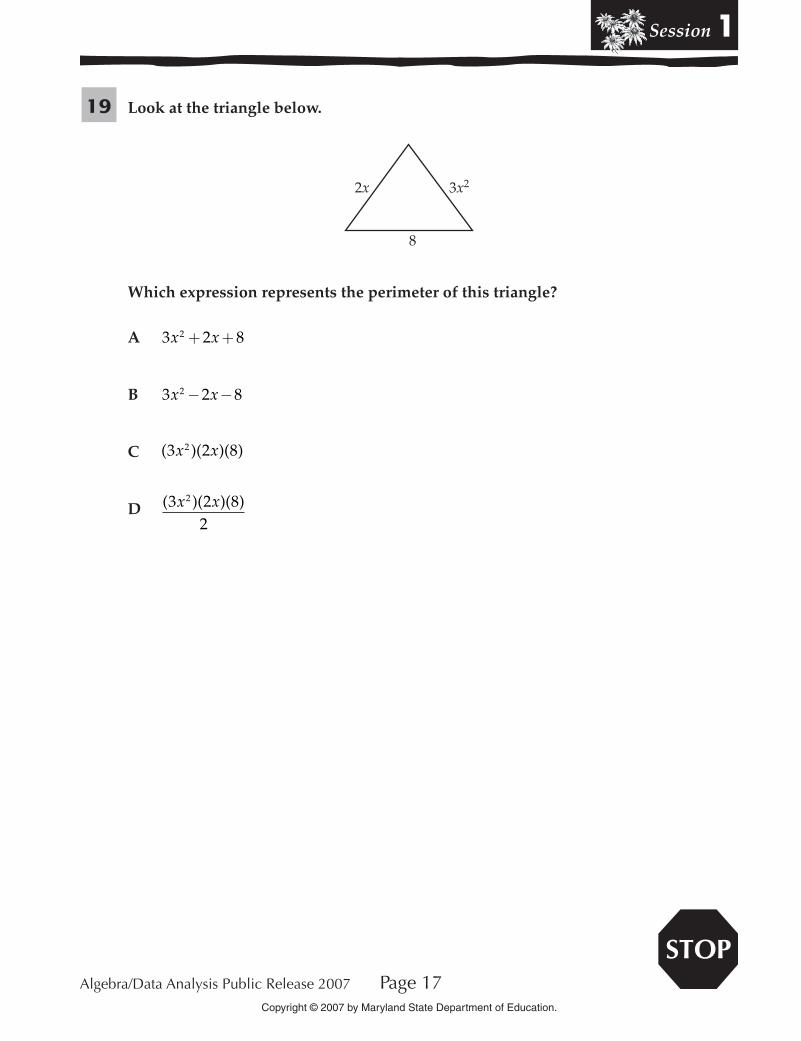
■ 19 Look at the triangle below.
2x 3x2
8
Which expression represents the perimeter of this triangle?
A 3 2 82x x+ +
B 3 2 82x x− −
C ( )( )( )3 2 82x x
D ( )( )( )3 2 82
2x x
Algebra/Data Analysis Public Release 2007 Page 20
Session 2
Copyright © 2007 by Maryland State Department of Education.
■ 20 Fred wants to determine the mean hourly wage of the working students at his school. He asks thirty of his friends their hourly wage and calculates the sample mean to be $6. Which of these statements must be true?
F The sample was selected randomly.
G Bias was present in the selection process.
H The sample was representative of the population.
J The mean hourly wage of the working students at Fred’s school was $6.
■ 21 Two lines are parallel. The equation of the first line is y x= +2 3. Which of these could be the equation of the other line?
A y x= − 2
B y x= − 12
C y x=12
D y x= 2
Session 2
Algebra/Data Analysis Public Release 2007 Page 21Copyright © 2007 by Maryland State Department of Education.
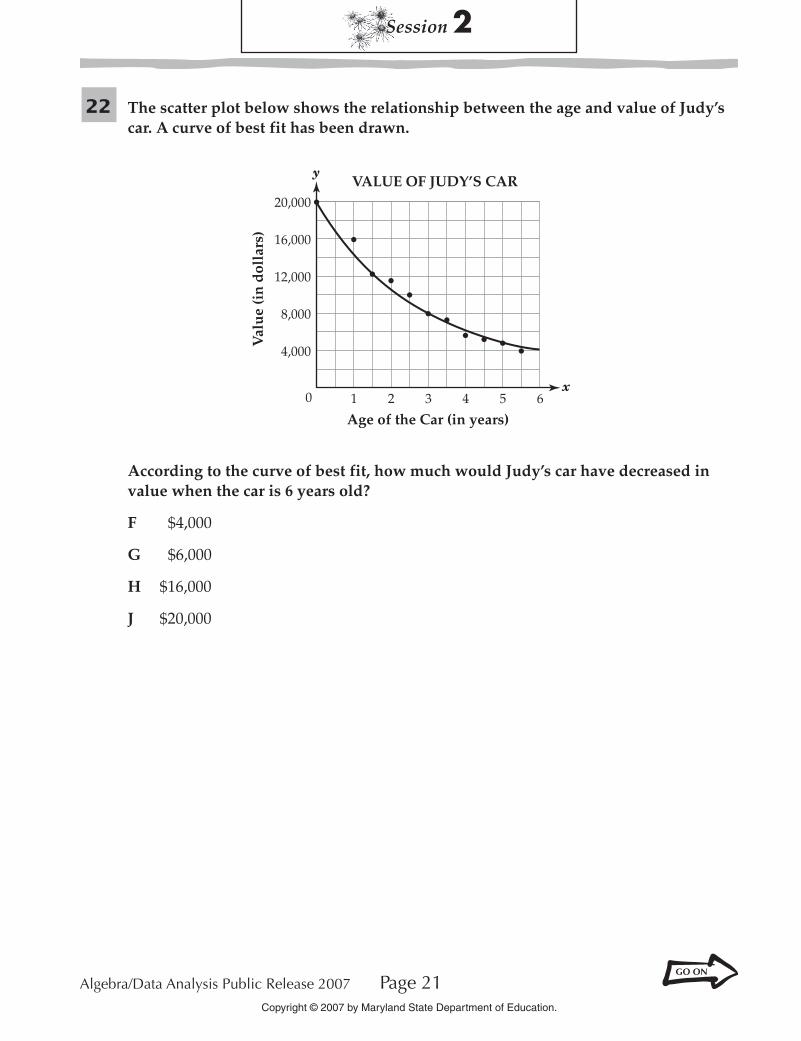
■ 22 The scatter plot below shows the relationship between the age and value of Judy’s car. A curve of best fit has been drawn.
20,000
16,000
12,000
8,000
4,000
Val
ue
(in
dol
lars
)
0 1 2 3 4 5 6
Age of the Car (in years)
VALUE OF JUDY’S CARy
x
According to the curve of best fit, how much would Judy’s car have decreased in value when the car is 6 years old?
F $4,000
G $6,000
H $16,000
J $20,000
Algebra/Data Analysis Public Release 2007 Page 22
Session 2
Copyright © 2007 by Maryland State Department of Education.
23ECR At the beginning of the summer, Sarah has $250. She takes a summer job and saves
$150 per week. Felicia has $1,650 at the beginning of the summer. She travels during the summer and spends $200 per week.
Complete the following in the Answer Book:
• Write an equation that represents the amount of money Sarah has at the end of each week.
• Write an equation that represents the amount of money Felicia has at the end of each week.
• Graph the two equations on the grid provided in the Answer Book. (Suggested graphing window: 0 10 0 2000≤ ≤ ≤ ≤ )weeks amount; .
• At the end of which week do Sarah and Felicia have the same amount of money? How much money do they have? Use mathematics to justify your answer.
Session 2
Algebra/Data Analysis Public Release 2007 Page 23Copyright © 2007 by Maryland State Department of Education.
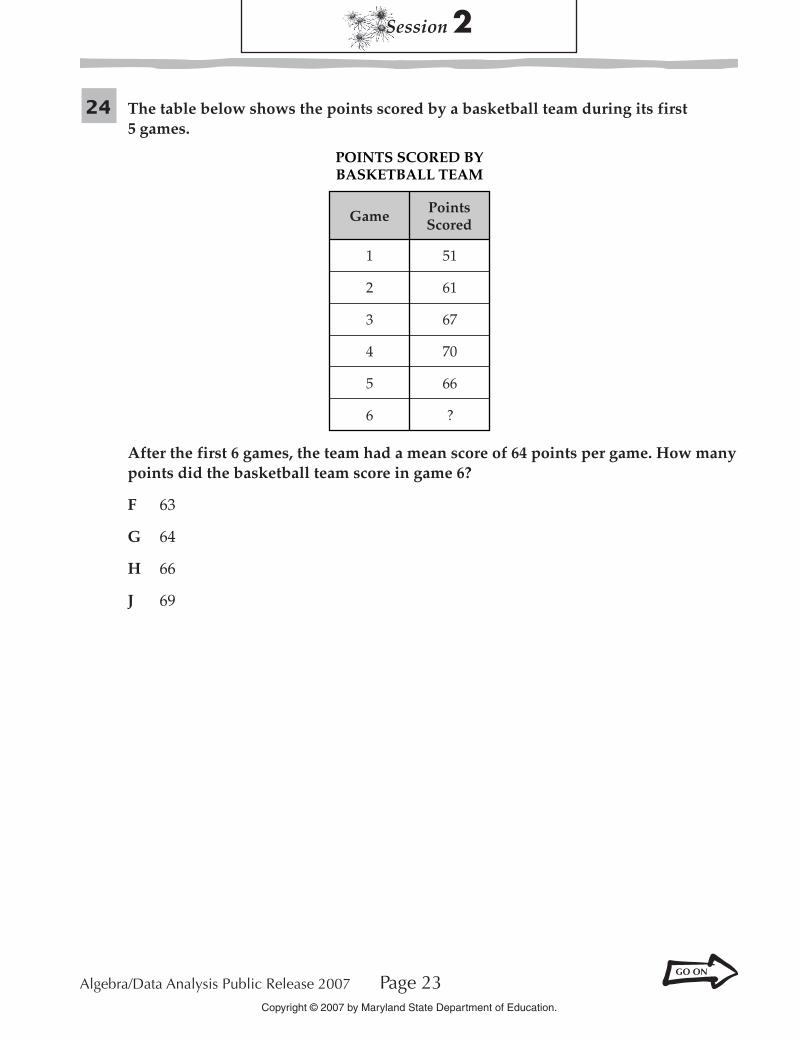
■ 24 The table below shows the points scored by a basketball team during its first 5 games.
Game PointsScored
1
2
3
4
5
6
51
61
67
70
66
?
POINTS SCORED BYBASKETBALL TEAM
After the first 6 games, the team had a mean score of 64 points per game. How many points did the basketball team score in game 6?
F 63
G 64
H 66
J 69
Algebra/Data Analysis Public Release 2007 Page 24
Session 2
Copyright © 2007 by Maryland State Department of Education.
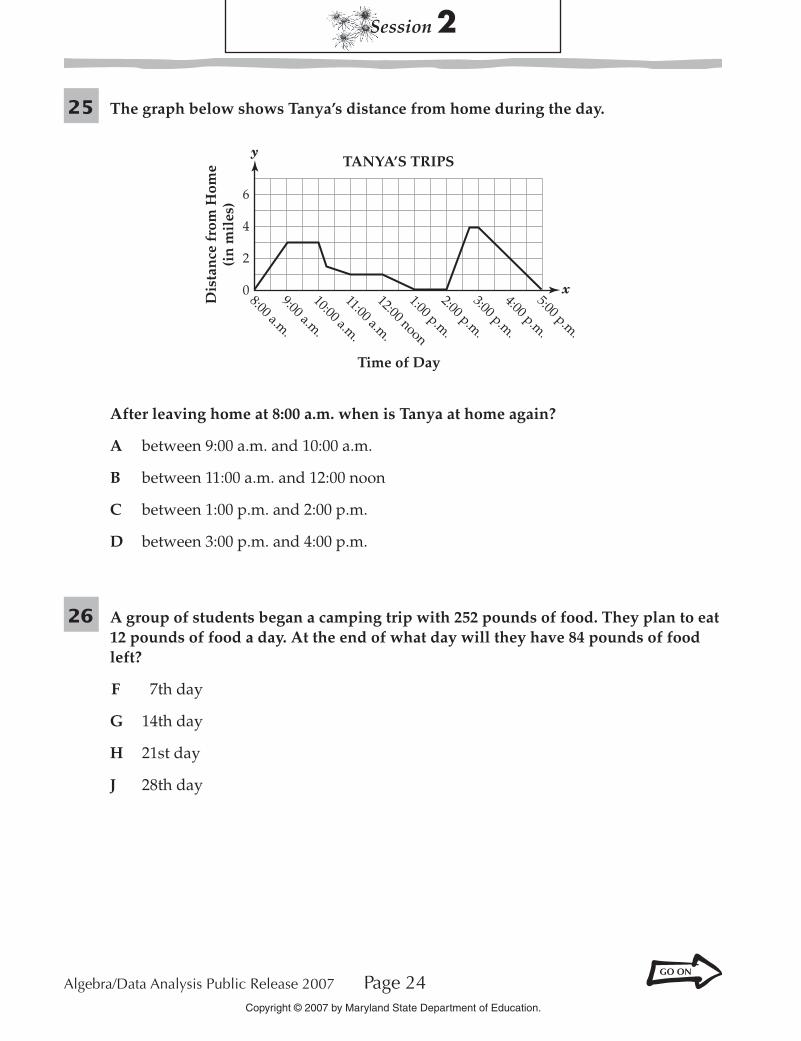
■ 25 The graph below shows Tanya’s distance from home during the day.
8:00 a.m.
9:00 a.m.
10:00 a.m.
11:00 a.m.
12:00 noon
1:00 p.m.
2:00 p.m.
3:00 p.m.
4:00 p.m.
5:00 p.m.
TANYA’S TRIPS
Time of Day
Dis
tan
ce f
rom
Hom
e(i
n m
iles
)
y
x
6
4
2
0
After leaving home at 8:00 a.m. when is Tanya at home again?
A between 9:00 a.m. and 10:00 a.m.
B between 11:00 a.m. and 12:00 noon
C between 1:00 p.m. and 2:00 p.m.
D between 3:00 p.m. and 4:00 p.m.
■ 26 A group of students began a camping trip with 252 pounds of food. They plan to eat 12 pounds of food a day. At the end of what day will they have 84 pounds of food left?
F 7th day
G 14th day
H 21st day
J 28th day
Session 2
Algebra/Data Analysis Public Release 2007 Page 25Copyright © 2007 by Maryland State Department of Education.
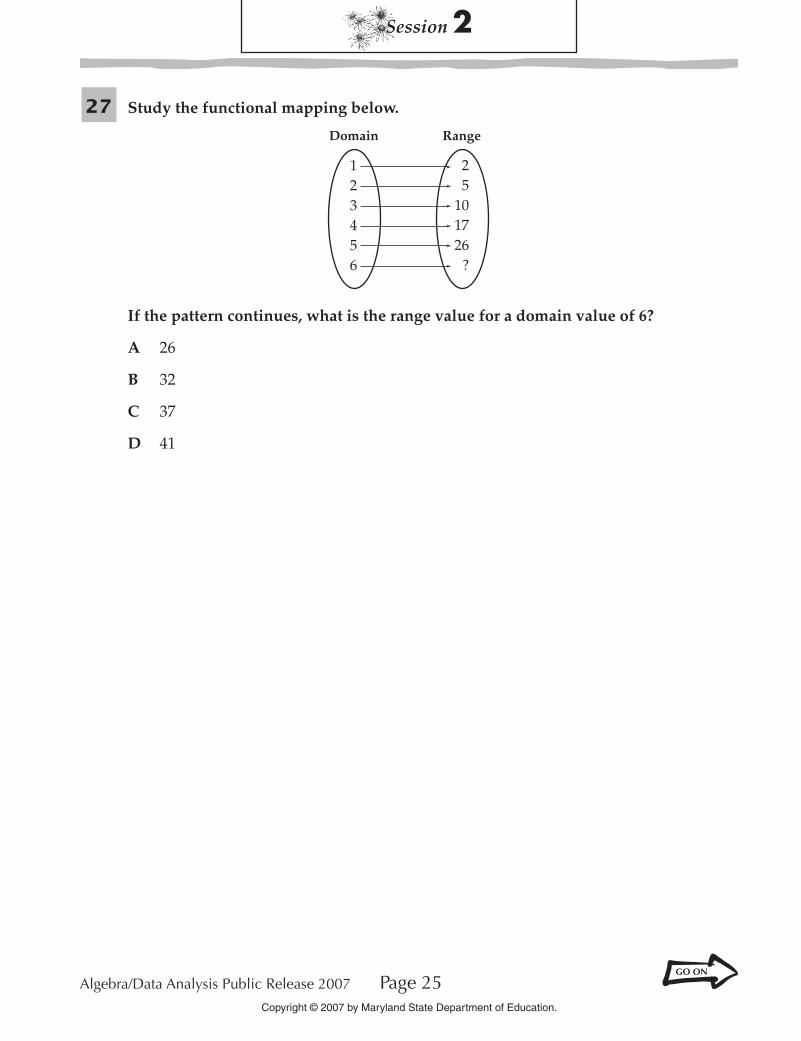
■ 27 Study the functional mapping below.
Domain
123456
Range
25
101726
?
If the pattern continues, what is the range value for a domain value of 6?
A 26
B 32
C 37
D 41
Algebra/Data Analysis Public Release 2007 Page 26
Session 2
Copyright © 2007 by Maryland State Department of Education.
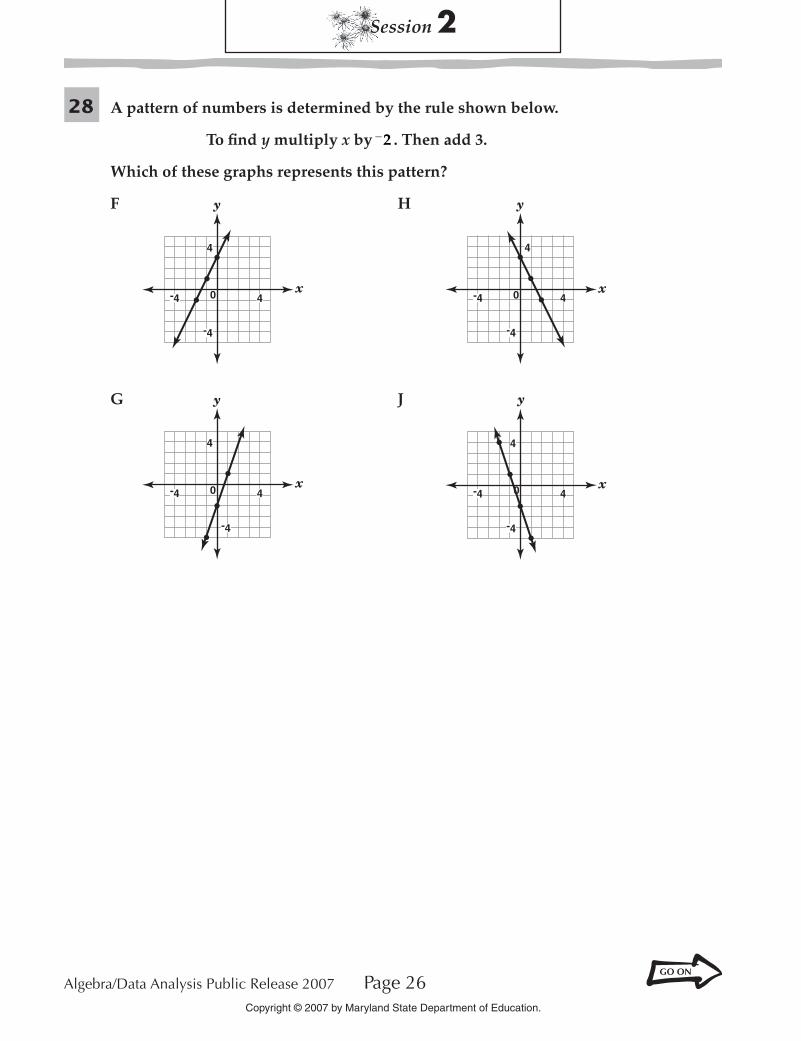
■ 28 A pattern of numbers is determined by the rule shown below.
To fi nd y multiply x by −2 . Then add 3.
Which of these graphs represents this pattern?
F y
x0-4 4
-4
4
H y
x0
4
4
-4
-4
G y
x0
4
-4
-4
4
J y
x
4
4
-4
-4 0
Session 2
Algebra/Data Analysis Public Release 2007 Page 27Copyright © 2007 by Maryland State Department of Education.
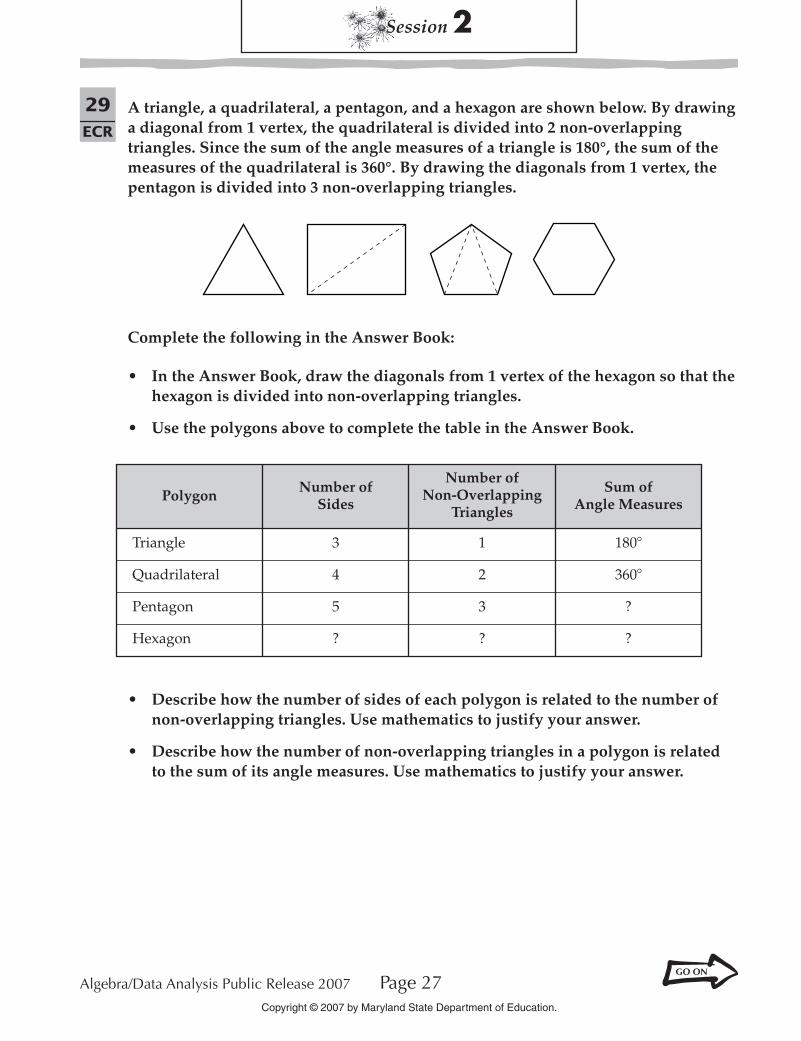
29ECR
A triangle, a quadrilateral, a pentagon, and a hexagon are shown below. By drawing a diagonal from 1 vertex, the quadrilateral is divided into 2 non-overlapping triangles. Since the sum of the angle measures of a triangle is 180°, the sum of the measures of the quadrilateral is 360°. By drawing the diagonals from 1 vertex, the pentagon is divided into 3 non-overlapping triangles.
Complete the following in the Answer Book:
• In the Answer Book, draw the diagonals from 1 vertex of the hexagon so that the hexagon is divided into non-overlapping triangles.
• Use the polygons above to complete the table in the Answer Book.
Polygon
Triangle
Quadrilateral
Pentagon
Hexagon
Number ofSides
3
4
5
?
Number ofNon-Overlapping
Triangles
1
2
3
?
Sum ofAngle Measures
180�
360�
?
?
• Describe how the number of sides of each polygon is related to the number of non-overlapping triangles. Use mathematics to justify your answer.
• Describe how the number of non-overlapping triangles in a polygon is related to the sum of its angle measures. Use mathematics to justify your answer.
Algebra/Data Analysis Public Release 2007 Page 28
Session 2
Copyright © 2007 by Maryland State Department of Education.
Directions
Use the Response Grids in the Answer Book to complete Numbers 30 through 32.
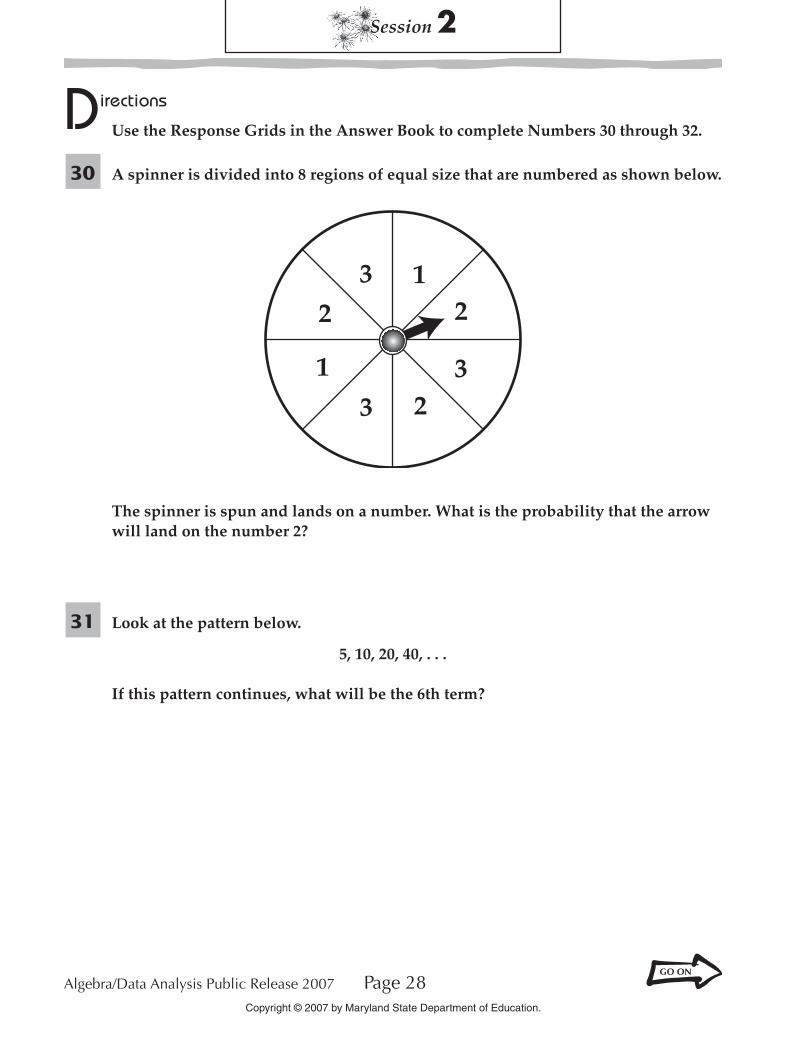
■ 30 A spinner is divided into 8 regions of equal size that are numbered as shown below.
2
3
1
12
3 23
The spinner is spun and lands on a number. What is the probability that the arrow will land on the number 2?
■ 31 Look at the pattern below.
5, 10, 20, 40, . . .
If this pattern continues, what will be the 6th term?
Session 2
Algebra/Data Analysis Public Release 2007 Page 29Copyright © 2007 by Maryland State Department of Education.
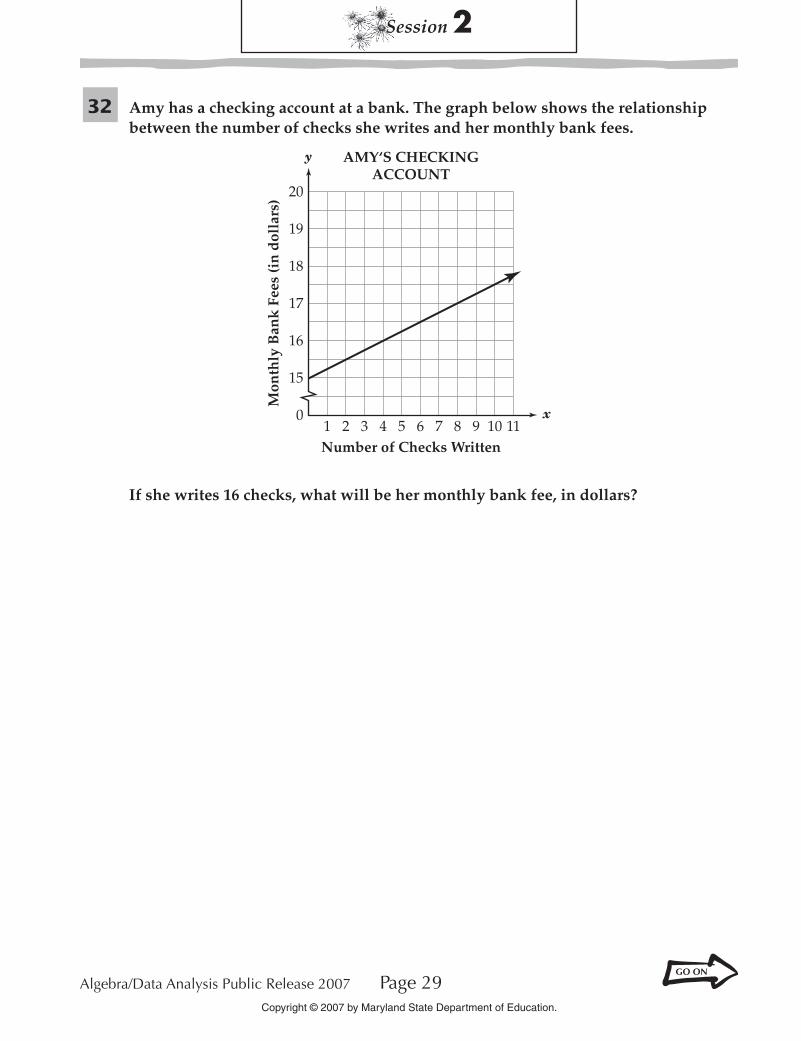
■ 32 Amy has a checking account at a bank. The graph below shows the relationship between the number of checks she writes and her monthly bank fees.
If she writes 16 checks, what will be her monthly bank fee, in dollars?
Algebra/Data Analysis Public Release 2007 Page 30
Session 2
Copyright © 2007 by Maryland State Department of Education.
33BCR
The principal will survey 100 students to determine which elective courses to offer next year. The principal will use one of the methods below.
Method A: Survey the first 100 students who enter the cafeteria on a randomly selected day.
Method B: Have 25 teachers each randomly select 4 eleventh-grade students to be surveyed.
Method C: Assign each student a number. Use a random number generator to generate 100 numbers. Survey those students whose numbers are generated.
Complete the following in the Answer Book:
• Which method will provide the principal with a simple random sample of the student population? Use principles of simple random sampling to justify your answer.
• Use principles of simple random sampling to justify why each of the other two methods does not provide a simple random sample.
Session 2
Algebra/Data Analysis Public Release 2007 Page 31Copyright © 2007 by Maryland State Department of Education.
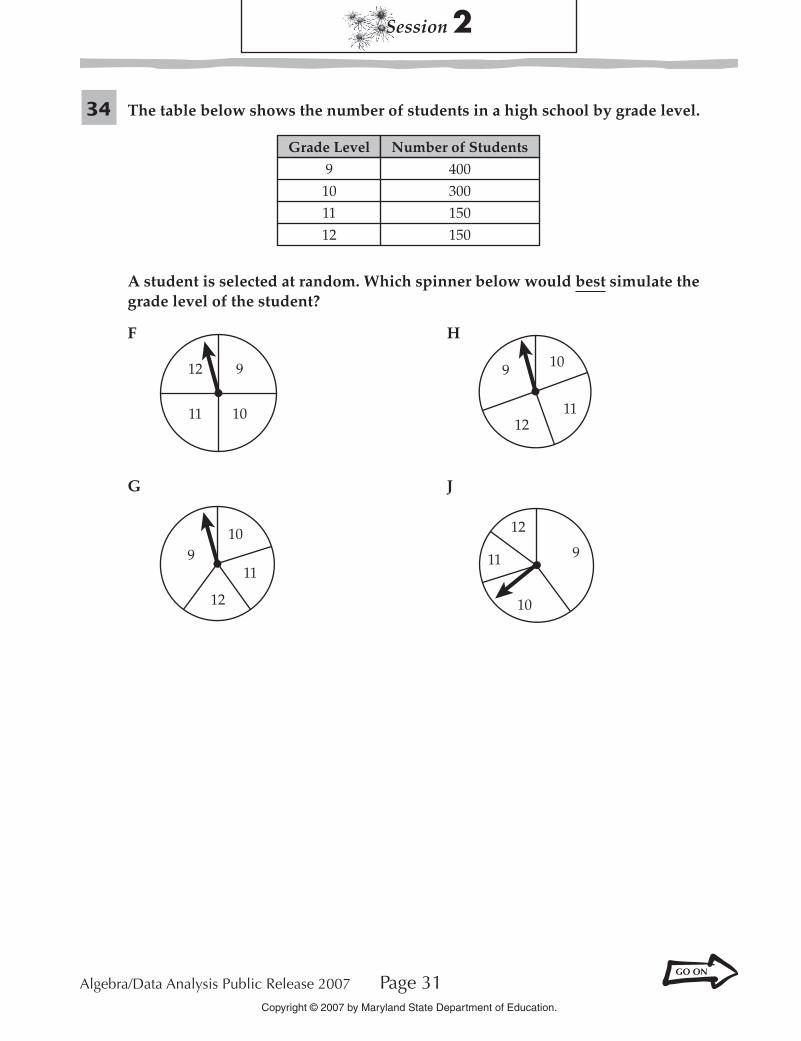
■ 34 The table below shows the number of students in a high school by grade level.
Grade Level
9101112
Number of Students
400300150150
A student is selected at random. Which spinner below would best simulate the grade level of the student?
F
12 9
11 10
H
10
1112
9
G
10
12
119
J
9
10
11
12
Algebra/Data Analysis Public Release 2007 Page 32
Session 2
Copyright © 2007 by Maryland State Department of Education.
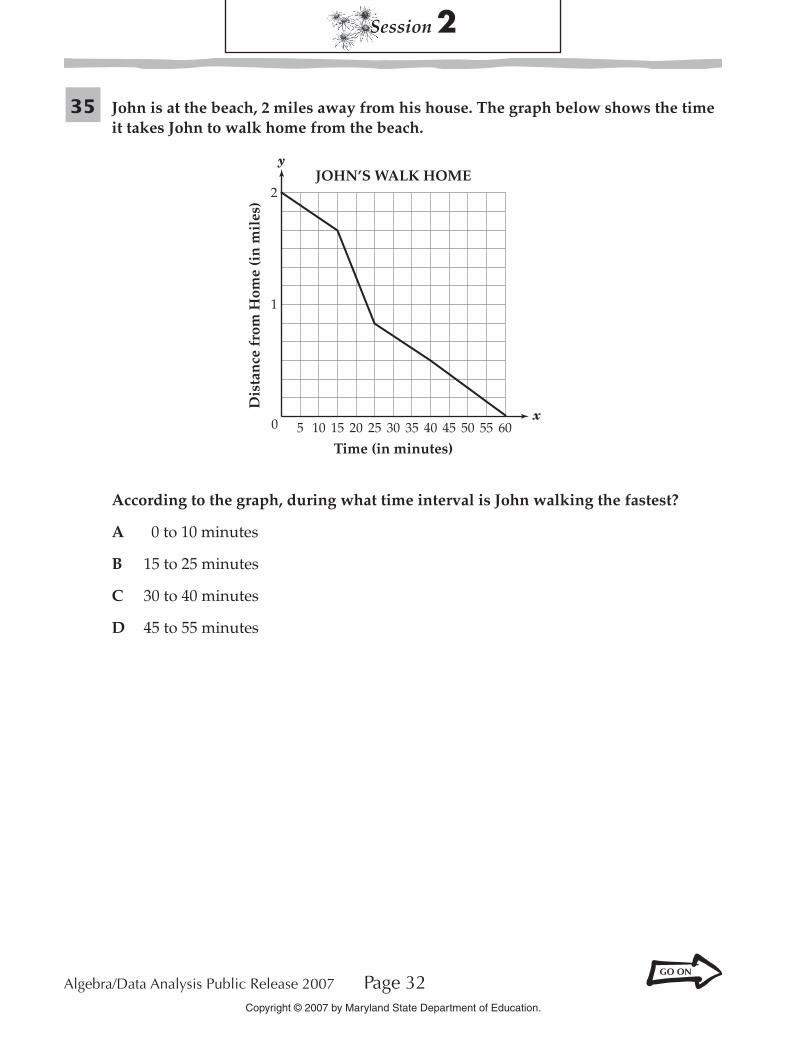
■ 35 John is at the beach, 2 miles away from his house. The graph below shows the time it takes John to walk home from the beach.
2
1
0
Time (in minutes)
JOHN’S WALK HOME
Dis
tan
ce f
rom
Hom
e (i
n m
iles
)
6055
y
x5 10 15 20 25 30 35 40 45 50
According to the graph, during what time interval is John walking the fastest?
A 0 to 10 minutes
B 15 to 25 minutes
C 30 to 40 minutes
D 45 to 55 minutes
Session 2
Algebra/Data Analysis Public Release 2007 Page 33Copyright © 2007 by Maryland State Department of Education.
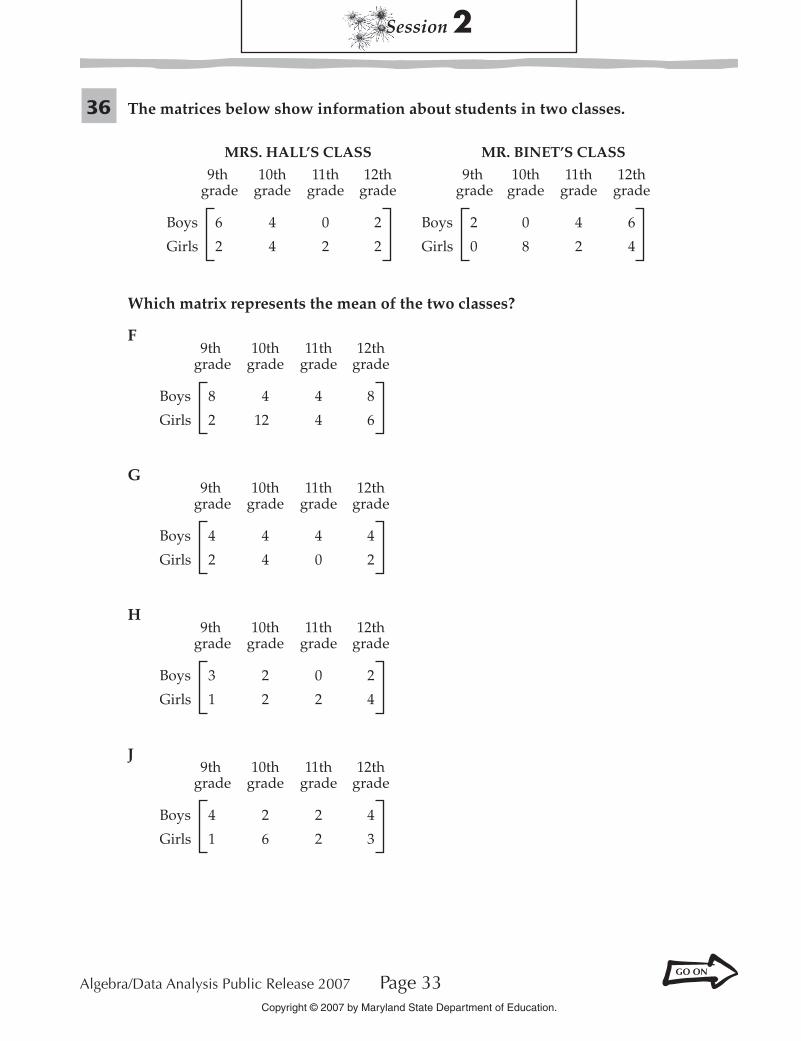
■ 36 The matrices below show information about students in two classes.
MRS. HALL’S CLASS
6
2
4
4
0
2
2
2
9th grade
10thgrade
11thgrade
12thgrade
Boys
Girls
MR. BINET’S CLASS
2
0
0
8
4
2
6
4
9th grade
10thgrade
11thgrade
12thgrade
Boys
Girls
Which matrix represents the mean of the two classes?
F
8
2
4
12
4
4
8
6
9th grade
10thgrade
11thgrade
12thgrade
Boys
Girls
G
4
2
4
4
4
0
4
2
9th grade
10thgrade
11thgrade
12thgrade
Boys
Girls
H
3
1
2
2
0
2
2
4
9th grade
10thgrade
11thgrade
12thgrade
Boys
Girls
J
4
1
2
6
2
2
4
3
9th grade
10thgrade
11thgrade
12thgrade
Boys
Girls
Algebra/Data Analysis Public Release 2007 Page 34
Session 2
Copyright © 2007 by Maryland State Department of Education.
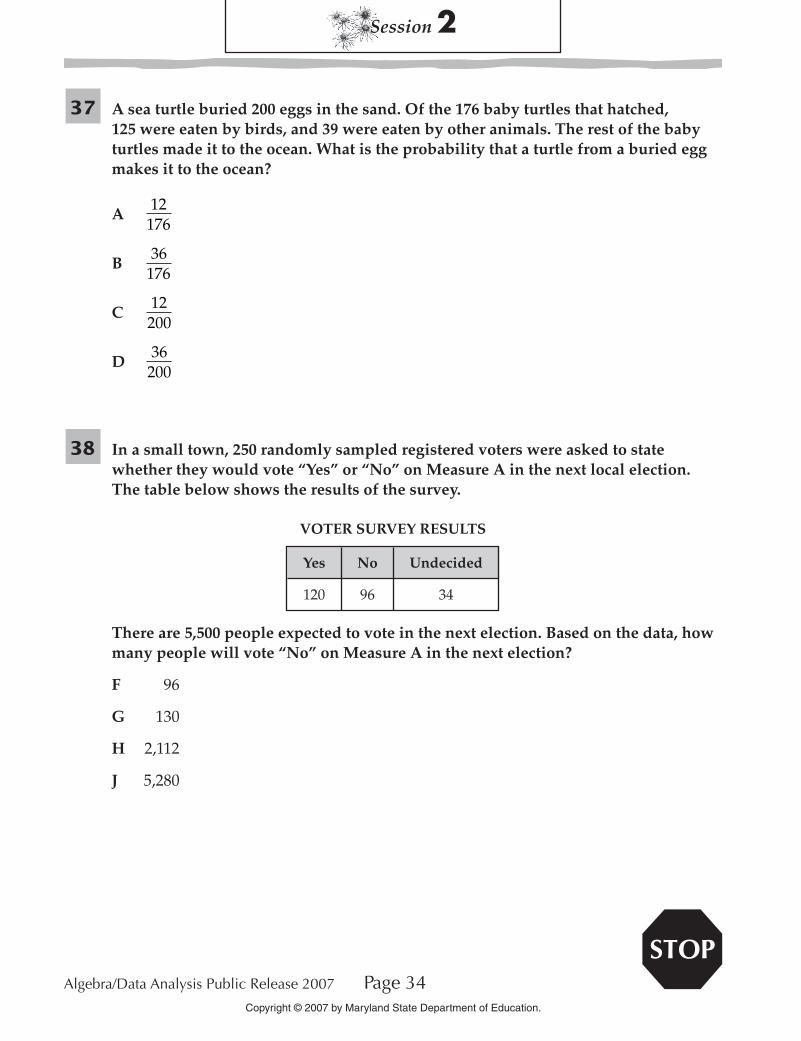
■ 37 A sea turtle buried 200 eggs in the sand. Of the 176 baby turtles that hatched, 125 were eaten by birds, and 39 were eaten by other animals. The rest of the baby turtles made it to the ocean. What is the probability that a turtle from a buried egg makes it to the ocean?
A 12
176
B 36
176
C 12200
D 36200
■ 38 In a small town, 250 randomly sampled registered voters were asked to state whether they would vote “Yes” or “No” on Measure A in the next local election. The table below shows the results of the survey.
Yes No Undecided
VOTER SURVEY RESULTS
96 34120
There are 5,500 people expected to vote in the next election. Based on the data, how many people will vote “No” on Measure A in the next election?
F 96
G 130
H 2,112
J 5,280
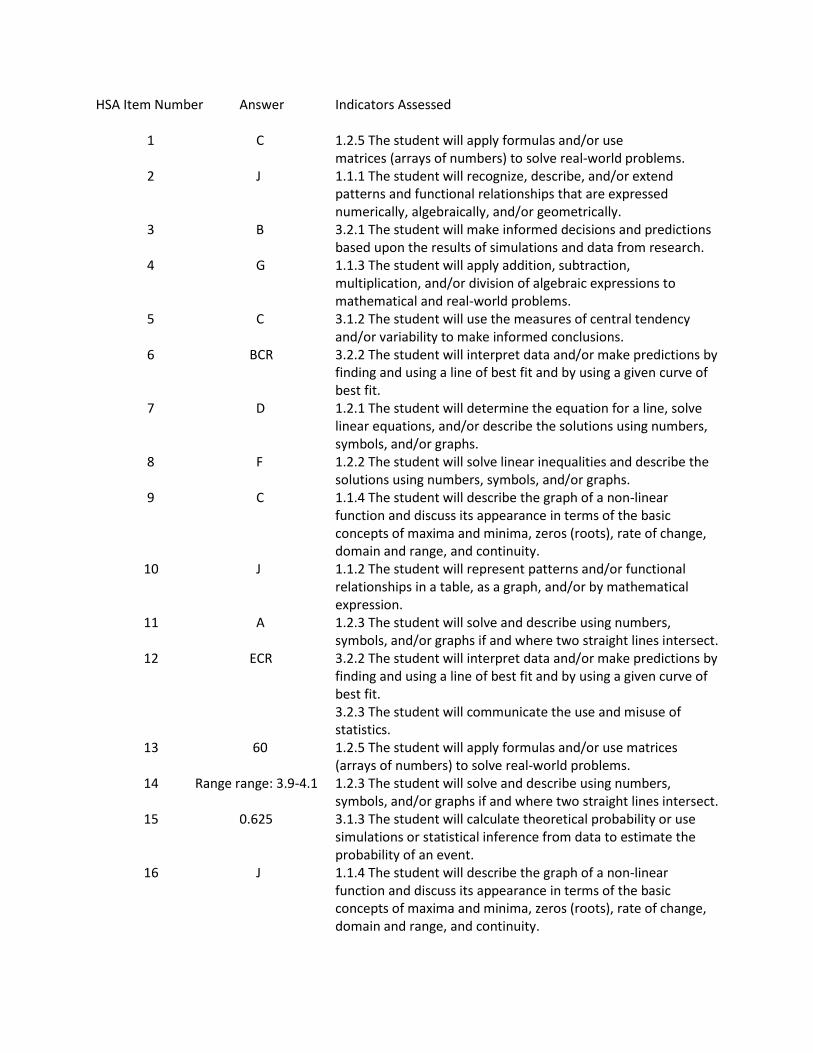
HSA Item Number Answer Indicators Assessed
1 C 1.2.5 The student will apply formulas and/or use matrices (arrays of numbers) to solve real-world problems.
2 J 1.1.1 The student will recognize, describe, and/or extend patterns and functional relationships that are expressed numerically, algebraically, and/or geometrically.
3 B 3.2.1 The student will make informed decisions and predictions based upon the results of simulations and data from research.
4 G 1.1.3 The student will apply addition, subtraction, multiplication, and/or division of algebraic expressions to mathematical and real-world problems.
5 C 3.1.2 The student will use the measures of central tendency and/or variability to make informed conclusions.
6 BCR 3.2.2 The student will interpret data and/or make predictions by finding and using a line of best fit and by using a given curve of best fit.
7 D 1.2.1 The student will determine the equation for a line, solve linear equations, and/or describe the solutions using numbers, symbols, and/or graphs.
8 F 1.2.2 The student will solve linear inequalities and describe the solutions using numbers, symbols, and/or graphs.
9 C 1.1.4 The student will describe the graph of a non-linear function and discuss its appearance in terms of the basic concepts of maxima and minima, zeros (roots), rate of change, domain and range, and continuity.
10 J 1.1.2 The student will represent patterns and/or functional relationships in a table, as a graph, and/or by mathematical expression.
11 A 1.2.3 The student will solve and describe using numbers, symbols, and/or graphs if and where two straight lines intersect.
12 ECR 3.2.2 The student will interpret data and/or make predictions by finding and using a line of best fit and by using a given curve of best fit. 3.2.3 The student will communicate the use and misuse of statistics.
13 60 1.2.5 The student will apply formulas and/or use matrices (arrays of numbers) to solve real-world problems.
14 Range range: 3.9-4.1 1.2.3 The student will solve and describe using numbers, symbols, and/or graphs if and where two straight lines intersect.
15 0.625 3.1.3 The student will calculate theoretical probability or use simulations or statistical inference from data to estimate the probability of an event.
16 J 1.1.4 The student will describe the graph of a non-linear function and discuss its appearance in terms of the basic concepts of maxima and minima, zeros (roots), rate of change, domain and range, and continuity.
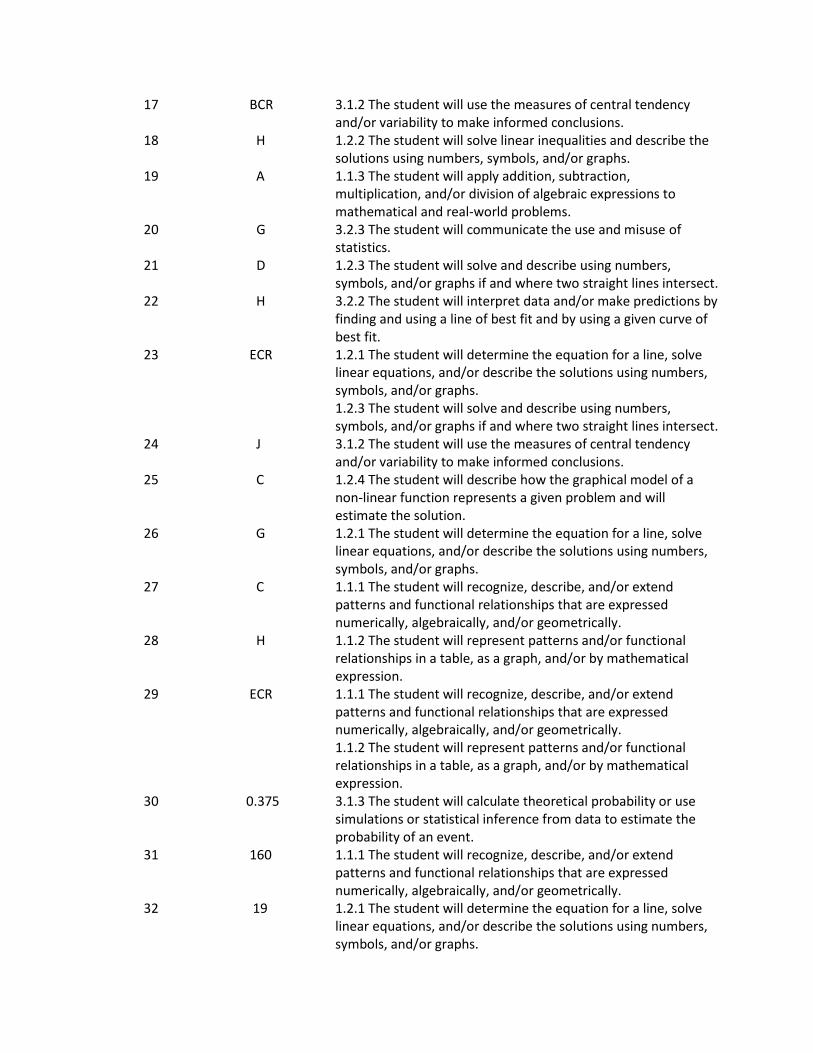
17 BCR 3.1.2 The student will use the measures of central tendency and/or variability to make informed conclusions.
18 H 1.2.2 The student will solve linear inequalities and describe the solutions using numbers, symbols, and/or graphs.
19 A 1.1.3 The student will apply addition, subtraction, multiplication, and/or division of algebraic expressions to mathematical and real-world problems.
20 G 3.2.3 The student will communicate the use and misuse of statistics.
21 D 1.2.3 The student will solve and describe using numbers, symbols, and/or graphs if and where two straight lines intersect.
22 H 3.2.2 The student will interpret data and/or make predictions by finding and using a line of best fit and by using a given curve of best fit.
23 ECR 1.2.1 The student will determine the equation for a line, solve linear equations, and/or describe the solutions using numbers, symbols, and/or graphs. 1.2.3 The student will solve and describe using numbers, symbols, and/or graphs if and where two straight lines intersect.
24 J 3.1.2 The student will use the measures of central tendency and/or variability to make informed conclusions.
25 C 1.2.4 The student will describe how the graphical model of a non-linear function represents a given problem and will estimate the solution.
26 G 1.2.1 The student will determine the equation for a line, solve linear equations, and/or describe the solutions using numbers, symbols, and/or graphs.
27 C 1.1.1 The student will recognize, describe, and/or extend patterns and functional relationships that are expressed numerically, algebraically, and/or geometrically.
28 H 1.1.2 The student will represent patterns and/or functional relationships in a table, as a graph, and/or by mathematical expression.
29 ECR 1.1.1 The student will recognize, describe, and/or extend patterns and functional relationships that are expressed numerically, algebraically, and/or geometrically. 1.1.2 The student will represent patterns and/or functional relationships in a table, as a graph, and/or by mathematical expression.
30 0.375 3.1.3 The student will calculate theoretical probability or use simulations or statistical inference from data to estimate the probability of an event.
31 160 1.1.1 The student will recognize, describe, and/or extend patterns and functional relationships that are expressed numerically, algebraically, and/or geometrically.
32 19 1.2.1 The student will determine the equation for a line, solve linear equations, and/or describe the solutions using numbers, symbols, and/or graphs.
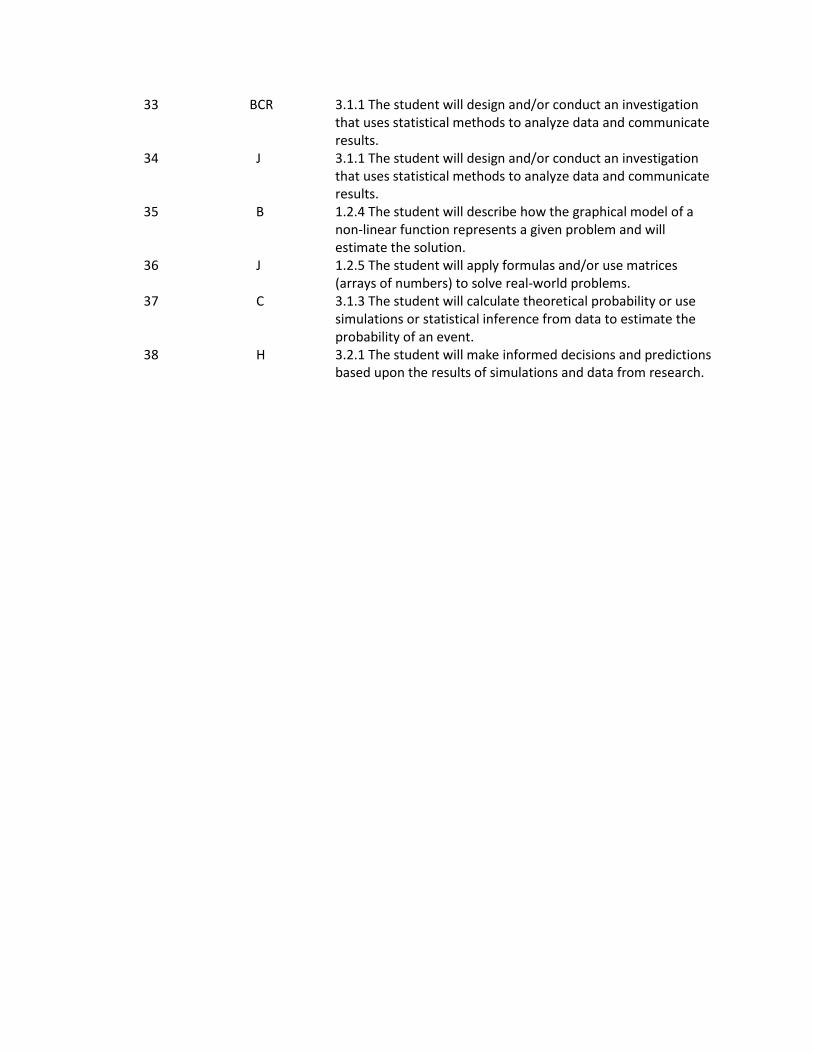
33 BCR 3.1.1 The student will design and/or conduct an investigation that uses statistical methods to analyze data and communicate results.
34 J 3.1.1 The student will design and/or conduct an investigation that uses statistical methods to analyze data and communicate results.
35 B 1.2.4 The student will describe how the graphical model of a non-linear function represents a given problem and will estimate the solution.
36 J 1.2.5 The student will apply formulas and/or use matrices (arrays of numbers) to solve real-world problems.
37 C 3.1.3 The student will calculate theoretical probability or use simulations or statistical inference from data to estimate the probability of an event.
38 H 3.2.1 The student will make informed decisions and predictions based upon the results of simulations and data from research.