Embed Size (px)
Citation preview

Algebra ISection 7-5
Exponential Functions


- growth functions: increase from left to right
integer values for base
- decay functions: decrease from left to right
fraction values for base

- domain: all real numbers - range:
look at pictureeither all positive numbers or
all negative numbers
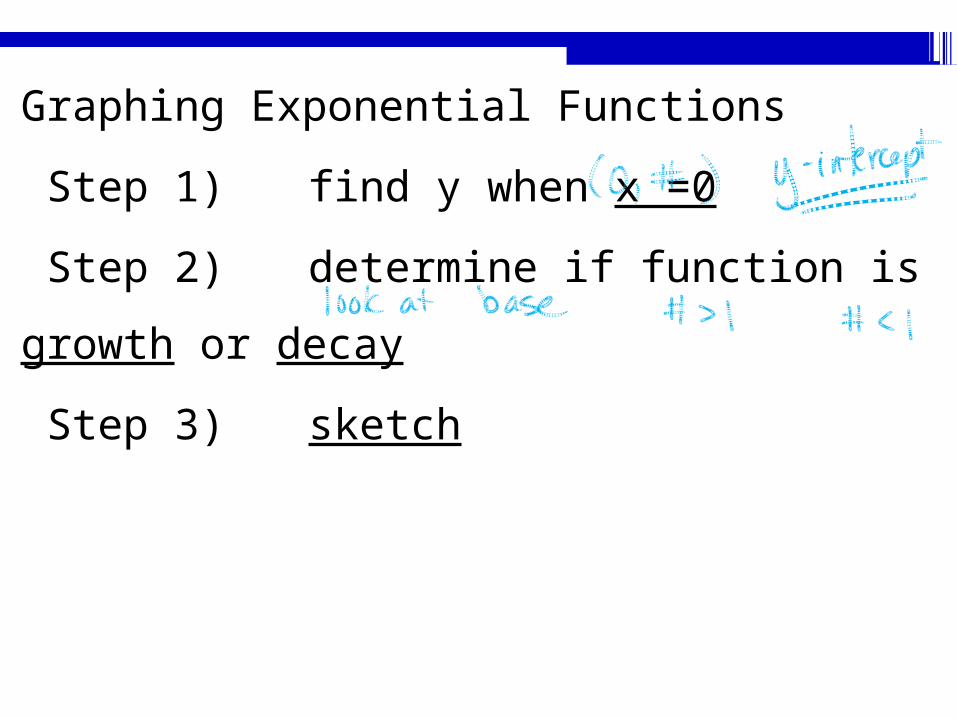
Graphing Exponential Functions
Step 1) find y when x =0
Step 2) determine if function is growth or
decay
Step 3) sketch


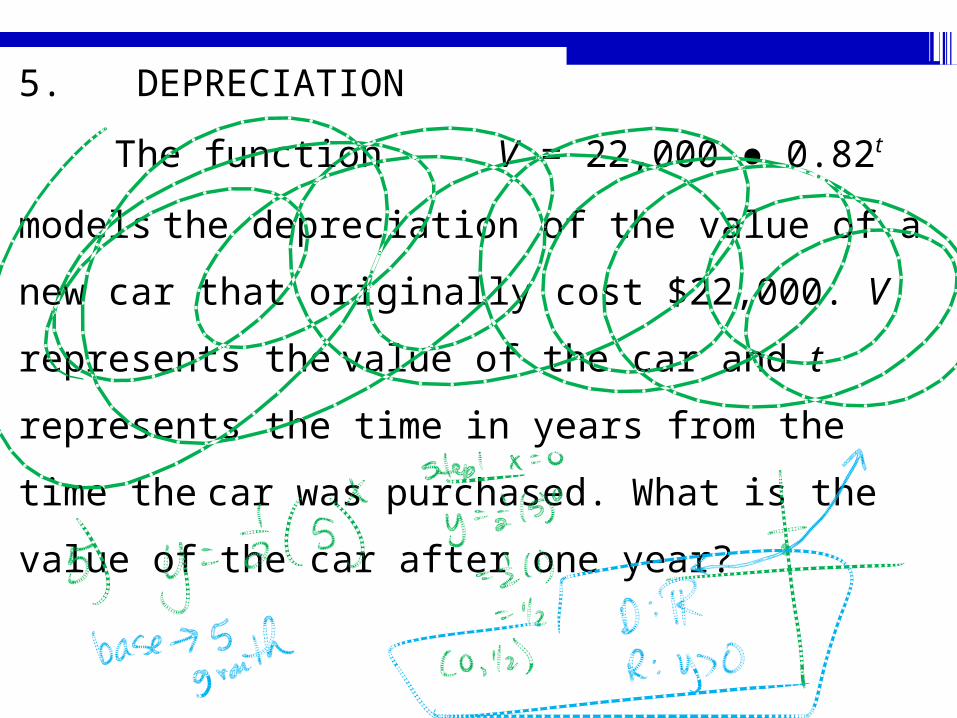
5. DEPRECIATION
The function V = 22,000 ● 0.82t
models the depreciation of the value of a new car that
originally cost $22,000. V represents the value of the
car and t represents the time in years from the time the
car was purchased. What is the value of the car after
one year?

Identify Exponential Behavior
- look for regular intervals of the x-values
counting by: 1’s, 2’s, 5’s, …
- look for common factor (multiply or divide)
of the y-values

Determine whether the set of data shown below displays exponential behavior. Write yes or no, and explain why or why not.
6. X 0 3 6 9 12 15
Y 12 16 20 24 28 32

Determine whether the set of data shown below displays exponential behavior. Write yes or no, and explain why or why not.
7. X 0 10 20 30
Y 10 25 62.5 156.25

Homework
Worksheet 7-5
Chapter 7 Test Friday 1/30