Embed Size (px)
Citation preview
Algorithms for Drawing Graphs:
an Annotated Bibliography∗
Giuseppe Di BattistaDipartimento di Informatica e Sistemistica
Universita di Roma “La Sapienza”Via Salaria, 113 — Roma
00198 [email protected]
Peter EadesDepartment of Computer Science
University of NewcastleUniversity Drive — Callaghan
NSW 2308, [email protected]
Roberto TamassiaDepartment of Computer Science
Brown UniversityProvidence, RI 02912–1910
Ioannis G. TollisDepartment of Computer ScienceThe University of Texas at Dallas
Richardson, Texas 75083–0688USA
June 1994
Abstract
Several data presentation problems involve drawing graphs so that they are easy to read and un-derstand. Examples include circuit schematics and software engineering diagrams. In this paper wepresent a bibliographic survey on algorithms whose goal is to produce aesthetically pleasing drawings ofgraphs. Research on this topic is spread over the broad spectrum of Computer Science. This bibliogra-phy constitutes an attempt to encompass both theoretical and application oriented papers from disparateareas.
∗This document is available via anonymous ftp from wilma.cs.brown.edu (128.148.19.15), files/pub/papers/compgeo/gdbiblio.tex.Z and /pub/papers/compgeo/gdbiblio.ps.Z.

Contents
1 Introduction 2
2 Background 4
3 Trees 53.1 Rooted Trees . . . . . . . . . . . . . . . . . . . . . . . . . . . . . . . . . . . . . . . . . . . . . 53.2 Free Trees . . . . . . . . . . . . . . . . . . . . . . . . . . . . . . . . . . . . . . . . . . . . . . . 6
4 General Graphs 74.1 Straight-Line Drawings . . . . . . . . . . . . . . . . . . . . . . . . . . . . . . . . . . . . . . . . 84.2 Planarization . . . . . . . . . . . . . . . . . . . . . . . . . . . . . . . . . . . . . . . . . . . . . 94.3 Polyline Drawings . . . . . . . . . . . . . . . . . . . . . . . . . . . . . . . . . . . . . . . . . . 11
5 Planar Graphs 115.1 Planarity Testing and Planar Representations . . . . . . . . . . . . . . . . . . . . . . . . . . . 115.2 Straight-Line Drawings . . . . . . . . . . . . . . . . . . . . . . . . . . . . . . . . . . . . . . . . 135.3 Orthogonal Grid Drawings . . . . . . . . . . . . . . . . . . . . . . . . . . . . . . . . . . . . . . 155.4 Visibility Representations . . . . . . . . . . . . . . . . . . . . . . . . . . . . . . . . . . . . . . 165.5 Other Graphic Standards . . . . . . . . . . . . . . . . . . . . . . . . . . . . . . . . . . . . . . 18
6 Directed Graphs 206.1 Acyclic Digraphs . . . . . . . . . . . . . . . . . . . . . . . . . . . . . . . . . . . . . . . . . . . 20
6.1.1 Upward Planarity . . . . . . . . . . . . . . . . . . . . . . . . . . . . . . . . . . . . . . 206.1.2 Hierarchical Drawings . . . . . . . . . . . . . . . . . . . . . . . . . . . . . . . . . . . . 226.1.3 Dominance Drawings . . . . . . . . . . . . . . . . . . . . . . . . . . . . . . . . . . . . . 26
6.2 General Digraph Drawing Algorithms . . . . . . . . . . . . . . . . . . . . . . . . . . . . . . . 266.3 Application-Specific Algorithms . . . . . . . . . . . . . . . . . . . . . . . . . . . . . . . . . . . 27
7 Graph Drawing Systems 28
8 Special Topics 308.1 Parallel Algorithms . . . . . . . . . . . . . . . . . . . . . . . . . . . . . . . . . . . . . . . . . . 308.2 Dynamic Algorithms . . . . . . . . . . . . . . . . . . . . . . . . . . . . . . . . . . . . . . . . . 318.3 Three Dimensions . . . . . . . . . . . . . . . . . . . . . . . . . . . . . . . . . . . . . . . . . . 318.4 Hypergraphs . . . . . . . . . . . . . . . . . . . . . . . . . . . . . . . . . . . . . . . . . . . . . 328.5 Separator-Based Algorithms . . . . . . . . . . . . . . . . . . . . . . . . . . . . . . . . . . . . . 328.6 Declarative Methods . . . . . . . . . . . . . . . . . . . . . . . . . . . . . . . . . . . . . . . . . 328.7 Aesthetics . . . . . . . . . . . . . . . . . . . . . . . . . . . . . . . . . . . . . . . . . . . . . . . 338.8 Compound Graphs . . . . . . . . . . . . . . . . . . . . . . . . . . . . . . . . . . . . . . . . . . 338.9 Angles . . . . . . . . . . . . . . . . . . . . . . . . . . . . . . . . . . . . . . . . . . . . . . . . . 33
9 Open Problems 34
A Graph Drawing ’93 35
B Graph Drawing ’94 37
C Index of Authors 39
1
1 Introduction
A number of data presentation problems involve the drawing of a graph on a two-dimensional surface.Examples include circuit schematics, algorithm animation, and software engineering. In this paper wepresent a bibliographic survey on algorithms whose goal is to produce clear and readable drawings of graphs.
Various graphic standards have been proposed for the representation of graphs in the plane. Usually, thevertices are represented by symbols such as circles or boxes, and each edge (u, v) is represented by a simpleopen curve between the symbols associated with the vertices u and v.
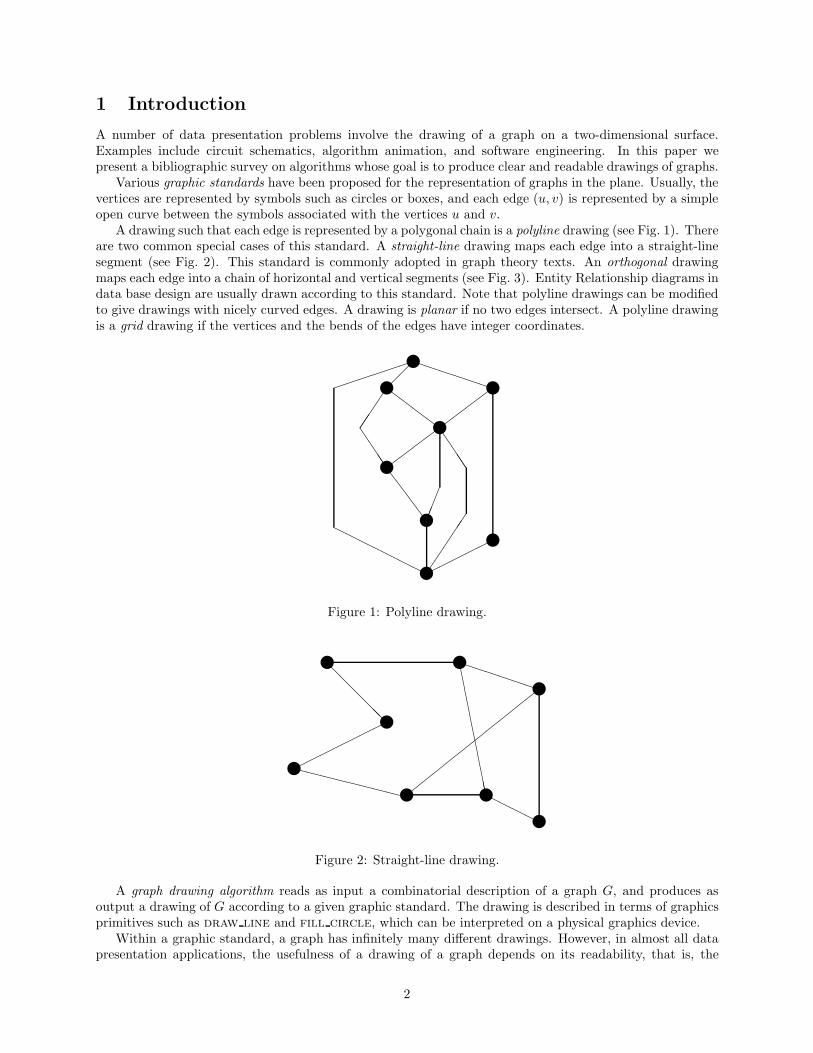
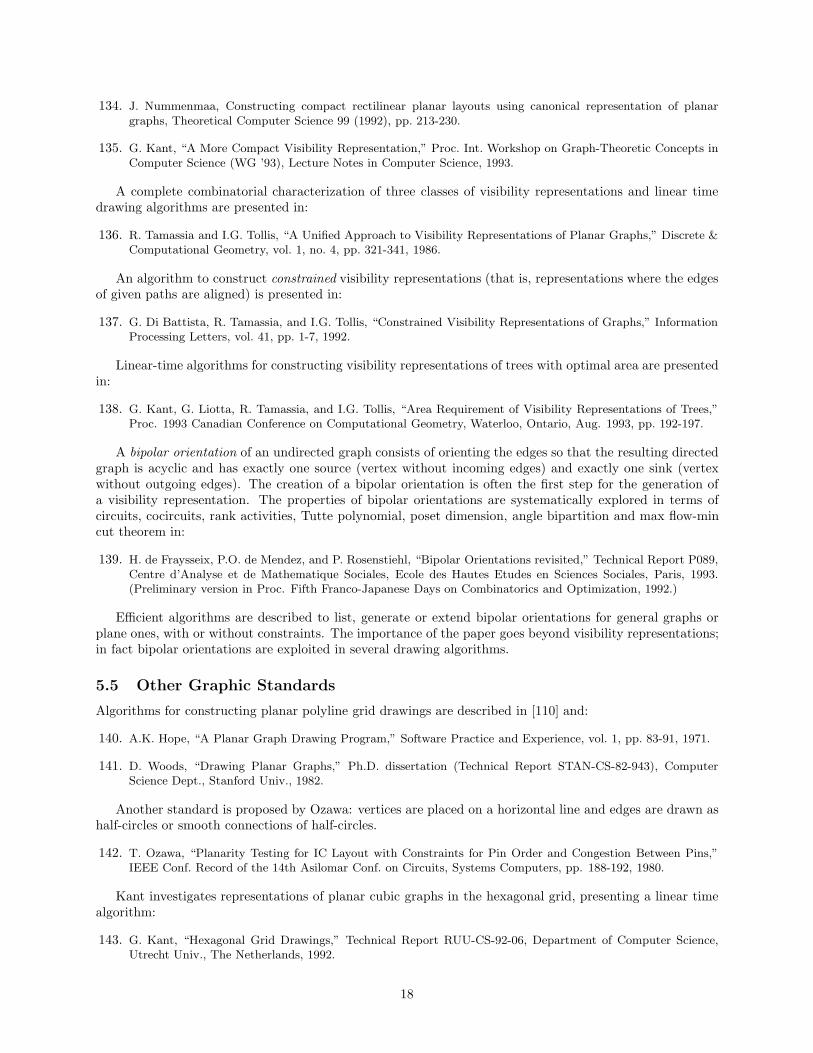
A drawing such that each edge is represented by a polygonal chain is a polyline drawing (see Fig. 1). Thereare two common special cases of this standard. A straight-line drawing maps each edge into a straight-linesegment (see Fig. 2). This standard is commonly adopted in graph theory texts. An orthogonal drawingmaps each edge into a chain of horizontal and vertical segments (see Fig. 3). Entity Relationship diagrams indata base design are usually drawn according to this standard. Note that polyline drawings can be modifiedto give drawings with nicely curved edges. A drawing is planar if no two edges intersect. A polyline drawingis a grid drawing if the vertices and the bends of the edges have integer coordinates.
y
y y
PPPPPP
y
J
JJJ
y
Z
ZZ
Z
y
SS
SS
y
JJJJ
y
HHHHHHH
Figure 1: Polyline drawing.
y y
yPPPPPP
y
DDDDDDDDDDDHHHH
yy##
##
##
##
##
y
@@
@@@
y
XXXXXXXX
Figure 2: Straight-line drawing.
A graph drawing algorithm reads as input a combinatorial description of a graph G, and produces asoutput a drawing of G according to a given graphic standard. The drawing is described in terms of graphicsprimitives such as draw line and fill circle, which can be interpreted on a physical graphics device.
Within a graphic standard, a graph has infinitely many different drawings. However, in almost all datapresentation applications, the usefulness of a drawing of a graph depends on its readability, that is, the
2

capability of conveying the meaning of the diagram quickly and clearly. Readability issues are expressed bymeans of aesthetics, which can be formulated as optimization goals for the drawing algorithms. In general,the aesthetics depend on the graphic standard adopted and the particular class of graphs of interest. Afundamental and classical aesthetic is the minimization of crossings between edges. In polyline drawings it isdesirable to avoid bends in edges. In grid drawings, the area of the smallest rectangle covering the drawingshould be minimal. In all graphic standards, the display of symmetries is desirable. It should be noted thataesthetics are subjective and may need to be tailored to suit personal preferences, traditions and culture.For example, although the cube graph is planar, it is traditionally drawn with crossing edges, as shown inFig. 4.
y
y y
y
y
yy
y
y
y
Figure 3: Orthogonal drawing.
y y
y y
y
y
y
y
@@
@@
y
y y
y
y
y
y
y
Figure 4: Two drawings of the cube graph.
Research on graph drawing algorithms is spread over the broad spectrum of Computer Science, fromVLSI to data base design. This bibliography constitutes a first attempt to encompass both theoretical andapplication oriented papers from disparate areas. However, we do not consider layout algorithms (suchas some VLSI layout techniques) that have no impact on the problem of producing aesthetically pleasingdrawings. As indicated in the title, this bibliography concentrates on algorithms for drawing graphs. It iswritten from a Computer Science viewpoint, and does not deal with other aspects of the problem of drawinggraphs. Namely, we do not attempt to cover the large literature on the mathematical theory of embeddingsof graphs, work on circuit and facilities layout, or psychological and philosophical issues of aestheticallypleasing drawings. We have omitted many papers which describe graphic user interfaces and visualizationsystems; although these often use graph drawings, few currently have automatic layout facilities. However,introductory textbooks on graphs and algorithms, and a few significant papers from related areas have beenincluded for the reader’s convenience.
In Section 2 we mention background reference material for graph drawing problems. Sections 3, 4, 5,and 6 consider in turn algorithms for drawing trees, general graphs, planar graphs and directed graphs.
3

Literature on systems which use graph layout algorithms is outlined in Section 7. Papers on topics that donot fit the above classification are mentioned in Section 8. A list of significant open problems is given inSection 9. The talks given at Graph Drawing ’93 are listed in Appendix A. Appendix B contains the callfor papers of Graph Drawing ’94. An index of authors is provided in Appendix C.
Throughout the paper n and m denote the number of vertices and edges of the graph currently beingconsidered.
2 Background
For elementary graph theory, the following textbooks may be consulted
1. J.A. Bondy and U.S.R. Murty, Graph Theory with Applications, North Holland, Amsterdam, 1976.
2. F. Harary, Graph Theory, Addison-Wesley, Reading, MA, 1969.
Fundamentals of data structures and algorithms are described in
3. E. Horowitz and S. Sahni, Fundamentals of Data Structures, Computer Science Press, 1983.
4. T.H. Cormen, C.E. Leiserson, and R.L. Rivest, Introduction to Algorithms, The MIT Press, 1990.
5. E.M. Reingold, J. Nievergelt, and N. Deo, Combinatorial Algorithms: Theory and Practice, Prentice Hall,1977.
Algorithms for graph problems and applications are described in
6. S. Even, Graph Algorithms, Computer Science Press, Potomac, MD, 1979.
7. A. Gibbons, Algorithmic Graph Theory, Cambridge University Press, Cambridge, Great Britain, 1985.
8. J.A. McHugh, Algorithmic Graph Theory, Prentice Hall, Englewood Cliffs, NJ, 1990.
9. R.E. Tarjan, “Data Structures and Network Algorithms,” CBMS-NSF Regional Conference Series in AppliedMathematics, vol. 44, Society for Industrial Applied Mathematics, 1983.
Algorithms for planar graphs are presented in:
10. T. Nishizeki and N. Chiba, Planar Graphs: Theory and Algorithms, Annals of Discrete Mathematics 32,North-Holland, 1988.
Concepts and applications of NP-completeness and complexity theory are described in
11. M.R. Garey and D.S. Johnson, Computers and Intractability: A Guide to the Theory of NP-Completeness,Freeman, 1979.
Basic concepts of computer graphics and computational geometry are given in
12. J.D. Foley, A. van Dam, S.K. Feiner, and J.F. Hughes, “Computer Graphics: Principles and Practice,” Addison-Wesley, 1990.
13. F.P. Preparata and M.I. Shamos, Computational Geometry, Springer-Verlag, New York, 1985.
Two previous versions of this bibliography have appeared as:
14. P. Eades and R. Tamassia, “Algorithms for Drawing Graphs: An Annotated Bibliography,” Technical Report82, Department of Computer Science, University of Queensland 1987.
15. P. Eades and R. Tamassia, “Algorithms for Drawing Graphs: An Annotated Bibliography,” Technical ReportCS-09-89, Department of Computer Science, Brown University 1989.
Many abstracts of recent papers on graph drawing appear in
16. G. Di Battista, H. de Fraysseix, P. Eades, P. Rosenstiehl, and R. Tamassia (Editors), Graph Drawing’93,Proc. ALCOM International Workshop on Graph Drawing and Topological Graph Algorithms, Sevres, Parcof Saint Cloud, Paris, September 25–29, 1993. Available by anonymous ftp from wilma.cs.brown.edu,/pub/papers/compgeo/gd93.tex.Z, /pub/papers/compgeo/gd93.ps.Z.
The talks presented at Graph Drawing’93 are listed in Appendix A.
4

3 Trees
3.1 Rooted Trees
Rooted trees are often used to represent hierarchies such as family trees, organization charts, and searchtrees. Planar straight-line drawings and orthogonal polyline drawings are commonly used to represent rootedtrees (see Fig. 5). The following additional aesthetics are often adopted.
• Vertices are placed along horizontal lines according to their level (graph-theoretic distance from theroot).
• There is a minimum separation distance between two consecutive vertices on the same level.
• The width of the drawing is as small as possible.
Further, for ordered binary trees such as search trees, we require:
• The left and right children of each vertex v are placed to the left and right of v, respectively.
SS
SS
AAAA
SS
SS
y
y
y y y
y
y
y y
-width
Level 0
Level 1
Level 2
Level 3
@@
@@
-minimum horizontalseparation
Figure 5: Drawings of a rooted tree in straight line and polyline orthogonal standards.
The following papers contain heuristics for drawing rooted trees that address the above aesthetics. Ad-ditional aesthetics, such as centering each parent upon its children, and generating congruent drawings forisomorphic subtrees, are also investigated.
17. R.E. Sweet, “Empirical Estimates of Program Entropy,” Technical Report STAN-CS-78-698, Stanford Univ.,Stanford, CA, 1978.
18. C. Wetherell and A. Shannon, “Tidy Drawing of Trees,” IEEE Trans. on Software Engineering, vol. SE-5, no.5, pp. 514-520, 1979.
19. J. Vaucher, “Pretty Printing of Trees,” Software Practice and Experience, vol. 10, no. 7, pp. 553-561, 1980.
20. E. Reingold and J. Tilford, “Tidier Drawing of Trees,” IEEE Trans. on Software Engineering, vol. SE-7, no. 2,pp. 223- 228, 1981.
21. J.S. Tilford, “Tree Drawing Algorithms,” Technical Report UIUCDCS-R-81-1055, Dept. of Computer Science,Univ. of Illinois at Urbana-Champaign, 1981.
5

22. J.Q. Walker II, “A Node-positioning Algorithm for General Trees,” Software Practice and Experience, vol. 20,no. 7, pp. 685-705, 1990.
Implementation details of a variation of the algorithm by Reingold and Tilford [20] are discussed byBrueggemann-Klein and Wood; the paper presents a set of TeX macros to implement the algorithm.
23. A. Brueggemann-Klein and D. Wood, Drawings Trees Nicely with TEX, Electronic Publishing, Origination,Dissemination, and Design, vol. 2, pp. 101-115 (1989).
The extension of these algorithms to rooted trees with arbitrary vertex degree is straightforward. Thealgorithms give aesthetically acceptable drawings. However, Supowit and Reingold show that they canproduce drawings much wider than necessary.
24. K.J. Supowit and E.M. Reingold, “The Complexity of Drawing Trees Nicely,” Acta Informatica, vol. 18, pp.377-392, 1983.
This paper addresses the problem of constructing a minimum width drawing of a binary tree such thatparents are centered upon their children and isomorphic subtrees are congruent. This problem is NP-completeif a grid drawing is required, but otherwise polynomially solvable by linear programming techniques.
The area requirement of straight-line and polyline grid drawings of binary and rooted trees is investigatedin:
25. P. Crescenzi, G. Di Battista, and A. Piperno “A Note on Optimal Area Algorithms for Upward Drawings ofBinary Trees,” Computational Geometry: Theory and Applications, vol. 2, pp. 187-200, 1992.
26. A. Garg, M.T. Goodrich and R. Tamassia, “Area-Efficient Upward Tree Drawings,” Proc. ACM Symp. onComputational Geometry, pp. 359-368, 1993.
Three drawing conventions that are appealing for their practical applicability are investigated in:
27. P. Eades, T. Lin, and X. Lin, “Two Tree Drawing Conventions,” International Journal of ComputationalGeometry and Applications, vol. 3, no. 2, pp 133 - 153, 1993.
28. P. Eades, T. Lin, and X. Lin, “Minimum Size h-v Drawings,” Advanced Visual Interfaces (Proc. AVI 92),World Scientific Series in Computer Science Volume 36, 386-394.
In the inclusion convention nodes are represented by boxes and parent-child relationships are representedby inclusion of one box in another. The tip-over convention is similar to the classical one, however, childrenof some nodes may be arranged vertically rather than horizontally. An h-v drawing is similar to a tip-overdrawing. Examples of inclusion and tip-over drawings are in Fig. 6.
3.2 Free Trees
“Free” trees do not represent hierarchies and have no specific root. The above algorithms for rooted treescan be modified to produce acceptable radial drawings of free trees by arranging the vertices of each level ona concentric circle about the graphtheoretic center of the tree. Folklore on radial and other simple drawingsof free trees is summarized in
29. P.D. Eades, “Drawing Free Trees,” Bulletin of the Institute for Combinatorics and its Applications, vol. 5,1992, 10-36.
Strategies for constructing radial drawings are described in
30. M.A. Bernard, “On the Automated Drawing of Graphs,” Prc. 3rd Caribbean Conf. on Combinatorics andComputing, pp. 43-55, 1981.
31. T. Kamada, Visualizing Abstract Objects and Relations, World Scientific, 1989.
The following paper shows how to display symmetries in radial drawings.
6

a
b
d e
c
f
a
b
d
e
c
f
(a) (b)
Figure 6: Inclusion and tip-over conventions.
32. J. Manning and M.J. Atallah, “Fast Detection and Display of Symmetry in Trees,” Congressus Numerantium,vol. 64, pp. 159-169, 1988.
Bhatt and Cosmadakis show that it is NP-complete to construct an orthogonal grid drawing of a treesuch that the maximum edge length is minimized:
33. S. Bhatt and S. Cosmadakis, “The Complexity of Minimizing Wire Lengths in VLSI Layouts,” InformationProcessing Letters, vol. 25, pp. 263-267, 1987.
The techniques of Bhatt and Cosmodakis are refined and extended in the following:
34. F.J. Brandenburg, “Nice Drawings of Graphs and Trees are Computationally Hard,” Technical Report MIP-8820, Fakultat fur Mathematik und Informatik, Univ. Passau, 1988.
35. A. Gregori, “Unit Length Embedding of Binary Trees on a Square Grid,” Information Processing Letters, vol.31, pp. 167-172, 1989.
36. P. J. Idicula, “Drawing Trees in Grids,” Masters Thesis, Department of Computer Science, University ofAuckland 1990.
4 General Graphs
There are several aesthetics for obtaining attractive drawings of general undirected graphs. The main suchaesthetics are:
• display symmetry;
• avoid edge crossings;
• avoid bends in edges;
• keep edge lengths uniform;
• distribute vertices uniformly.
7

In general, the optimization problems associated with these aesthetics are NP-hard. Several complexityresults are reported in:
37. D.S. Johnson, “The NP-Completeness Column: an Ongoing Guide,” J. of Algorithms, vol. 3, no. 1, pp. 89-99,1982.
38. D.S. Johnson, “The NP-Completeness Column: an Ongoing Guide,” J. of Algorithms, vol. 5, no. 2, pp. 147-160,1984.
Many problems are NP-hard even for restricted classes of graphs, such as trees and planar graphs. Specificresults are presented in [24, 27, 33, 34, 35, 36, 121] and:
39. M.R. Garey and D.S. Johnson, “Crossing Number is NP-Complete,” SIAM J. Algebraic and Discrete Methods,vol. 4, no. 3, pp. 312-316, 1983.
40. M.R. Kramer and J. van Leeuwen, “The Complexity of Wire-Routing and Finding Minimum Area Layouts forArbitrary VLSI Circuits,” in Advances in Computing Research, vol. 2, ed. F.P. Preparata, pp. 129-146, JAIPress, Greenwich, CT, 1984.
41. Z. Miller and J.B. Orlin, “NP-Completeness for Minimizing Maximum Edge Length in Grid Embeddings,” J.Algorithms, vol. 6, pp. 10-16, 1985.
Besides time complexity limitations, the above aesthetics are also “competitive” in that the optimality ofone often prevents the optimality of others. Because of such difficulties, general approaches to graph drawingare usually heuristic.
4.1 Straight-Line Drawings
A model for measuring the symmetry of a straight-line drawing of a graph is given in:
42. R. Lipton, S. North, and J. Sandberg, “A Method for Drawing Graphs,” Proc. ACM Symp. on ComputationalGeometry, pp. 153-160, 1985.
This paper also proposes an algorithm for constructing a straight-line drawing of a graph with as muchsymmetry as possible; however the algorithm requires the solution of the apparently intractable problemof computing the automorphism group of a graph. A completely different approach to symmetry display(which avoids computing automorphisms) is described in:
43. P. Eades, “A Heuristic for Graph Drawing,” Congressus Numerantium, vol. 42, pp. 149-160, 1984.
This algorithm, called spring embedder, is a heuristic based on a physical model. The straight-line standardis adopted. The drawing process is to simulate a mechanical system, where vertices are replaced by rings,and edges are replaced by springs. The springs attract the rings if they are too far apart, and repel them ifthey are too close.
The algorithms of [89, 90, 94, 95] may be viewed as spring algorithms with the positions of some of thevertices fixed; although originally designed for planar graphs, they may be applied to nonplanar graphs withreasonable results.
Other algorithms of a similar “force directed” nature are described in [31] and
44. J.E. Cuny, D.A. Bayley, J.W. Hagerman, and A.A. Hough, “The Simple Simon Programming Environment: AStatus Report,” Technical Report 87-22, Dept. of Computer and Information Science, Univ. of Massachusetts,Amherst, MA, May 1987.
45. T. Kamada and S. Kawai, “Automatic Display of Network Structures for Human Understanding,” TechnicalReport 88-007, Dept. of Information Science, Univ. of Tokyo, 1988.
46. T. Kamada, “On Visualization of Abstract Objects and Relations,” Ph.D. dissertation, Dept. of InformationScience, Univ. of Tokyo, 1988.
8

47. T. Kamada and S. Kawai, “An Algorithm for Drawing General Undirected Graphs,” Information ProcessingLetters, vol. 31, pp. 7-15, 1989.
48. T. Kamada, “Symmetric Graph Drawing by a Spring Algorithm and its Applications to Radial Drawing,”Manuscript, Dept. of Information Science, Univ. of Tokyo, 1989.
49. T. Fruchterman and E. Reingold, “Graph Drawing by Force-Directed Placement,” Software-Practice and Ex-perience, vol. 21, no. 11, pp. 1129-1164, 1991.
A general model for spring algorithms is defined in [190]; this thesis also attempts to explain mathemat-ically the apparent connection between spring algorithms and symmetrical drawings.
An extension of the spring approach is presented by Davidson and Harel. An energy function is defined interms of the desired aesthetics: for instance, the number of edge crossings plus a measure of the closeness ofvertices. A layout of minimal energy (an thus maximal beauty according to the energy function) is obtainedby simulated annealing.
50. R. Davidson and D. Harel, “Drawing Graphs Nicely Using Simulated Annealing,” Technical Report CS 89–13,Department of Applied Mathematics and Computer Science, The Weizmann Institute of Science, Rehovot,1989 (revised July 1993, to appear in Communications ACM).
An algorithm based on multidimensional scaling (a standard statistical method) that finds a placementof vertices with euclidean distances that approximate the graph-theoretic distances is presented in
51. J.B. Kruskal and J.B. Seery, “Designing Network Diagrams,” Proc. First General Conference on Social Graphics,U. S. Department of the Census, Washington, D.C., pp. 22-50, July 1980.
An algorithm that uses several heuristics to obtain “near-optimal” drawings is presented by Tunkelang.The heuristics improve on existing approaches by focusing on three aspects of the graph drawing problem:computation of the aesthetic cost of a drawing, order of node placement, and local optimization techniques.The algorithm and comparison with the techniques of [49] and [50] are described in:
52. D. Tunkelang, “An Aesthetic Layout Algorithm for Undirected Graphs,” M.S. Thesis, Department of ElectricalEngineering and Computer Science, MIT, 1992.
A simple heuristic for constructing straight-line drawings which adds one vertex at a time is describedin:
53. H. Watanabe, “Heuristic Graph Displayer for G-BASE,” Technical Report no. 17, Ricoh Software ResearchCenter, Tokyo, Japan, 1988.
Makinen considers straight-line drawings with vertices placed along the circumference of a circle. Heshows that several related optimization problems are NP-complete and gives a heuristic for reducing themaximum edge length.
54. E. Makinen, “On Circular Layouts,” Int. Journal of Computer Mathematics, vol. 24, pp. 29-37, 1988.
4.2 Planarization
As discussed above, most of the techniques for drawing general undirected graphs are heuristics based onvarious types of simulation. Given the wealth of techniques available for drawing planar graphs, a sensiblestrategy for drawing a nonplanar graph is to first planarize the graph, and then apply a planar graph drawingalgorithm. Significant examples of this strategy are presented in [107,73]. The term planarization is usedfor several related problems. In general, planarization seeks to transform a nonplanar graph into a planargraph with a small number of well defined operations.
The most common planarization operation is edge deletion: one must find a small number of edges whosedeletion yields a planar graph. This is equivalent to finding a planar subgraph with a large number of edges.Finding a planar subgraph with a maximum number of edges is NP-hard. However, a maximal planarsubgraph can be found efficiently, as shown in [279] and:
9

55. J. Cai, X. Han, and R.E. Tarjan, “An O(m log n)-time Algorithm for the Maximal Subgraph Problem,” SIAMJ. on Computing, to appear.
Heuristics for finding a maximum planar subgraph and algorithms for finding a maximal planar subgraphare presented in:
56. M. Marek-Sadowska, “Planarization Algorithms for Integrated Circuits Engineering,” Proc. IEEE Int. Symp.on Circuits and Systems, pp. 919-923, 1978.
57. N. Chiba, I. Nishioka, and I. Shirakawa, “An Algorithm of Maximal Planarization of Graphs,” Proc. IEEE Int.Symp. on Circuits and Systems, pp. 649-652, 1979.
58. E. Nardelli and M. Talamo, “A Fast Algorithm for Planarization of Sparse Diagrams,” Technical Report R.105,IASI-CNR, Rome, 1984.
59. T. Ozawa and H. Takahashi, “A Graph-planarization Algorithm and its Applications to Random Graphs,”Graph Theory and Algorithms, Lecture Notes in Computer Science, vol. 108, pp. 95-107, 1981.
60. R. Jayakumar, K. Thulasiraman, and M.N.S. Swamy, “On Maximal Planarization of Nonplanar Graphs,” IEEETrans. Circuits and Systems, vol. CAS-33, no. 8, 843–854, 1986.
61. R. Jayakumar, K. Thulasiraman, and M.N.S Swamy, “O(n2) Algorithms for Graph Planarization,” TechnicalReport CSD-88-01, Dept. Computer Science, Concordia Univ., 1988.
62. G. Kant, “An O(n2) Maximal Planarization Algorithm based on PQ-trees,” Technical Report RUU-CS-92-03,Department of Computer Science, Utrecht Univ., The Netherlands, 1992.
63. L.R. Foulds, P.B. Gibbons, and J.W. Giffin, “Graph Theoretic Heuristics for the Facilities Layout Problem:An Experimental Comparison,” Operations Research, 1985.
64. P. Eades, L. Foulds, and J. Giffin, “An Efficient Heuristic for Identifying a Maximal Weight Planar Subgraph,”Combinatorial Mathematics IX, Lecture Notes in Mathematics, vol. 952, pp. 239-251, 1982.
65. O. Goldschmidt and A. Takvorian, “An Efficient Graph Planarization Two-Phase Heuristic,” Technical ReportORP91-01, Dept. of Mechanical Engineering, Univ. Texas at Austin, 1991.
66. M. Junger and P. Mutzel, “Solving the Maximum Weight Planar Subgraph Problem,” Proc. 3rd Integer Pro-gramming and Combinatorial Optimization Conf., pp. 479-492, 1993.
Another planarization technique is to find a drawing with the minimum number of crossings. Again, thisproblem is NP-hard [39]. Heuristics for crossing minimization are given in:
67. D. Ferrari and L. Mezzalira, “On Drawing a Graph with the Minimum Number of Crossings,” Technical Reportn. 69-11, Istituto di Elettrotecnica ed Elettronica, Politecnico di Milano, 1969.
A new technique for planarization is “splitting”. The splitting operation is to make two copies of a vertexand share the neighbors between the two copies. This technique is used in manual layout to simplify complexgraphs. A minimum splitting sequence is a minimum length sequence of splittings which makes the graphplanar. Heuristics for finding a minimum splitting sequence are discussed in
68. C.X. Mendonca, “Heuristics for Planarization by Vertex Splitting,” manuscript, University of Newcastle 1992.
The topological equivalence among nonplanar drawings of a graph is studied in:
69. R.B. Eggleton, “Rectilinear Drawings of Graphs,” Utilitas Mathematica, vol. 29, pp. 146-172, 1986.
There is an extensive mathematical literature on crossing numbers of graphs, see the following papers forreferences:
70. H. Harborth and I. Mengersen, “Edges Without Crossings in Drawings of Complete Graphs,” J. CombinatorialTheory (B), vol. 17, no. 3, pp. 229-311, 1974.
71. R.K. Guy, “Crossing Numbers of Graphs,” Graph Theory and Applications, Lecture Notes in Mathematics,vol. 303, pp. 111-124, 1972.
10

4.3 Polyline Drawings
A comprehensive approach to the construction of orthogonal grid drawings, based on a number of graphalgorithms, is presented in:
72. C. Batini, E. Nardelli, M. Talamo, and R. Tamassia, “A Graphtheoretic Approach to Aesthetic Layout ofInformation Systems Diagrams,” Proc. 10th Int. Workshop on Graphtheoretic Concepts in Computer Science(Berlin, June 1984), pp. 9-18, Trauner Verlag, 1984.
73. R. Tamassia, G. Di Battista, and C. Batini, “Automatic Graph Drawing and Readability of Diagrams,” IEEETransactions on Systems, Man and Cybernetics, vol. SMC-18, no. 1, pp. 61-79, 1988.
Within this approach the drawing is incrementally specified in three phases (see Fig. 7): The first phase,planarization, determines the topology of the drawing. The second phase, orthogonalization, computes anorthogonal shape for the drawing. The third phase, compaction, produces the final drawing. This approachallows homogeneous treatment of a wide range of diagrammatic representations, aesthetics and constraints.
Another approach to the construction of orthogonal grid drawings, based on the results of [83] and onvisibility representations (Section 5.4), is presented in:
74. H. de Fraysseix and P. Rosenstiehl, “Structures Combinatoires pour des Traces Automatiques de Reseaux,”Proc. 3rd European Conf. on CAD/CAM and Computer Graphics, Paris, pp. 332-337, Hermes, 1984.
An algorithm for constructing polyline grid drawings that allows the user to choose between a hierarchicaldrawing method and the orthogonal grid drawing technique of [73] is presented in.
75. H. Trickey, “Drag: A Graph Drawing System,” Proc. Int. Conf. on Electronic Publishing, pp. 171-182, Cam-bridge University Press, 1988.
Orthogonal grid drawings of graphs whose vertices have preassigned locations in the plane are investigatedin:
76. Y. Kajitani and H. Takahashi, “Rectilinear Drawing of a Graph on a Plane with the Minimum Number ofSegments,” Manuscript (presented at the 2nd Int. Catania Combinatorial Conf.), 1989.
5 Planar Graphs
A graph is planar if it admits a planar drawing. Planar graphs play an important role in graph theory [1, 2]and graph algorithms; see [6, 10], and:
77. R.E. Tarjan, “Algorithm Design,” Communications ACM, vol. 30, no. 3, pp. 205-212, 1987.
Clearly, planar drawings are aesthetically desirable. Furthermore, as discussed in the previous section,algorithms for drawing nonplanar graphs often begin by planarizing the graph (see section 4.2), and then byapplying a planar graph drawing algorithm.
5.1 Planarity Testing and Planar Representations
A planar representation is a data structure representing the combinatorial adjacencies between the faces ofa planar drawing. Most planar graph drawing methods proceed as follows:
Step 1. Test planarity.
Step 2. (if the graph is planar) Construct a planar representation.
Step 3. Use the planar representation to draw the graph according to some graphic standard.
In this subsection we consider the first two steps.Finding a linear time algorithm to test the planarity of a graph was an interesting challenge for early
algorithms research. The first algorithm to succeed used a path addition approach and was presented in:
11

y y
y
y
y
y
@@
@@
@@
HHHHHH
HHHHHH
y y
y y
y
i
@@
SS
SS
PPPPP
y
y
y i
y
y
y
y
y
y
y
y
y
y
(a)(b)
(c)(d)
Figure 7: A general strategy for orthogonal grid drawings. (a) Given graph. (b) Planarization. (c) Orthog-onalization. (d) Compaction.
78. J. Hopcroft and R.E. Tarjan, “Efficient Planarity Testing,” J. ACM, vol. 21, no. 4, pp. 549-568, 1974.
Minor errors of [78] are corrected in:
79. N. Deo, “Note on Hopcroft and Tarjan’s Planarity Algorithm,” J. ACM, vol. 23, no. 1, pp. 74-75, 1976.
The vertex addition approach was developed to give a linear time algorithm in the following papers:
80. A. Lempel, S. Even, and I. Cederbaum, “An Algorithm for Planarity Testing of Graphs,” in Theory of Graphs,Int. Symposium (Rome, 1966), pp. 215-232, Gordon and Breach, New York, 1967.
81. S. Even and R.E. Tarjan, “Computing an st-Numbering,” Theoretical Computer Science, vol. 2, pp. 339-344,1976.
82. K. Booth and G. Lueker, “Testing for the Consecutive Ones Property, Interval Graphs, and Graph PlanarityUsing PQ-Tree Algorithms,” J. of Computer and System Sciences, vol. 13, pp. 335-379, 1976.
Another approach is presented in:
83. H. de Fraysseix and P. Rosenstiehl, “A Depth-First-Search Characterization of Planarity,” Annals of DiscreteMathematics, vol. 13, pp. 75-80, 1982.
The aforementioned planarity testing algorithms can be modified to construct planar representations.The following paper extends the algorithm of [82] in this way.
84. N. Chiba, T. Nishizeki, S. Abe, and T. Ozawa, “A Linear Algorithm for Embedding Planar Graphs UsingPQ-Trees,” J. of Computer and System Sciences, vol. 30, no. 1, pp. 54-76, 1985.
In the remainder of this Section we consider drawing algorithms that construct a planar drawing from agiven planar representation.
12

5.2 Straight-Line Drawings
A classical result independently established by Wagner, Fary and Stein shows that every planar graph admitsa planar straight-line drawing.
85. K. Wagner, “Bemerkungen zum Vierfarbenproblem,” Jber. Deutsch. Math.-Verein, vol. 46, pp. 26-32, 1936.
86. I. Fary, “On Straight Lines Representation of Planar Graphs,” Acta Sci. Math. Szeged, vol. 11, pp. 229-233,1948.
87. S.K. Stein, “Convex Maps,” Proc. Amer. Math. Soc., vol. 2, pp. 464-466, 1951.
This result also follows from Steinitz’s theorem on convex polytopes in three dimensions.
88. E. Steinitz and H. Rademacher, Vorlesung uber die Theorie der Polyeder, Springer, Berlin, 1934.
Convex drawings of planar graphs, that is, planar straight-line drawings where every face is drawn as aconvex polygon (see Fig. 8) were first studied by Tutte.
89. W.T. Tutte, “Convex Representations of Graphs,” Proc. London Math Soc., vol. 10, pp. 304-320, 1960.
90. W.T. Tutte, “How to Draw a Graph,” Proc. London Math Soc., vol. 3, no. 13, pp. 743-768, 1963.
y
JJJJ
JJ
JJJ
JJ
JJJ
JJ
JJ
JJ
JJ
PPPPPP
!!!!!!!!!!
aaaaaaaaaa
aaaaaaaaaa
PPPPPP
!!!!!!!!!!
y
y
y
y
y
y
y
y
y
y
y
Figure 8: Convex drawing.
Tutte shows that a convex drawing of a 3-connected graph (see [1]) can be obtained by solving a systemof linear equations. Thomassen characterizes the class of graphs that admit a convex drawing.
91. C. Thomassen, “Planarity and Duality of Finite and Infinite Planar Graphs,” J. Combinatorial Theory, SeriesB, vol. 29, pp. 244-271, 1980.
Chiba et al. show that Thomassen’s result can be implemented as an algorithm for producing a convexdrawing in linear time.
92. N. Chiba, T. Yamanouchi, and T. Nishizeki, “Linear Algorithms for Convex Drawings of Planar Graphs,” inProgress in Graph Theory, ed. J.A. Bondy and U.S.R. Murty, pp. 153-173, Academic Press, 1984.
93. N. Chiba, K. Onoguchi, and T. Nishizeki, “Drawing Planar Graphs Nicely,” Acta Informatica, vol. 22, pp.187-201, 1985.
13

Becker et al. investigate the problem of minimizing the total edge length (according to several metrics,not including the Euclidean metric) in a planar straight-line drawing where the external face is a prescribedconvex polygon. They show that the optimal drawing is unique and convex, and can be obtained by standardnumerical techniques.
94. B. Becker and G. Hotz, “On The Optimal Layout of Planar Graphs with Fixed Boundary,” SIAM J. Computing,vol. 16, no. 5, pp. 946-972, 1987.
95. B. Becker and H.G. Osthof, “Layout with Wires of Balanced Length,” Information and Computation, vol. 73,pp. 45-58, 1987.
Eades and Wormald show that the problem of constructing a planar straight-line drawing with prescribededge lengths (according to the Euclidean metric) is NP-hard.
96. P. Eades and N. Wormald, “Fixed Edge Length Graph Drawing is NP- hard,” Discrete Applied Mathematics,vol. 28, pp. 111-134, 1990.
An elegant algorithm for constructing planar straight-line drawings has been given by Read. The algo-rithm uses O(n) time but O(n2) storage.
97. R. Read, “New Methods for Drawing a Planar Graph Given the Cyclic Order of the Edges at Each Vertex,”Congressus Numerantium, vol. 56, pp. 31-44, 1987.
Manning and Atallah give algorithms for and discuss complexity of displaying symmetries in planarstraight-line drawings of planar graphs in [32] and:
98. J. Manning and M. Atallah. “Fast Detection and Display of Symmetry in Outerplanar Graphs,” DiscreteApplied Mathematics vol. 39 no. 1 pp. 13–35 (1992).
99. M.J. Atallah and J. Manning, “Fast Detection and Display of Symmetry in Embedded Planar Graphs,”Manuscript, Purdue Univ., 1988.
100. J. Manning, “Computational Complexity of Geometric Symmetry Detection in Graphs,” Lecture Notes inComputer Science vol. 507 pp. 1–7 Springer-Verlag, June 1991.
101. J. Manning. “Geometric Symmetry in Graphs,” Ph.D. Thesis, Department of Computer Sciences, PurdueUniversity, Dec 1990.
Schnyder and de Fraysseix et al. independently show that every planar graph admits a planar straight-linegrid drawing with area O(n2).
102. H. de Fraysseix, J. Pach, and R. Pollack, “Small Sets Supporting Fary Embeddings of Planar Graphs,” Proc.20th ACM Symp. on Theory of Computing, pp. 426-433, 1988.
103. H. de Fraysseix, J. Pach, and R. Pollack, “How to Draw a Planar Graph on a Grid,” Combinatorica, vol. 10,pp. 41-51, 1990.
104. W. Schnyder, “Embedding Planar Graphs on the Grid,” Proc. ACM- SIAM Symp. on Discrete Algorithms,pp. 138-148, 1990.
Chrobak and Payne show that the constructive proof of [102] can be modified to yield an O(n)-timedrawing algorithm.
105. M. Chrobak and T.H. Payne, “A Linear Time Algorithm for Drawing a Planar Graph on a Grid,” TechnicalReport UCR-CS-90-2, Dept. of Math. and Comput. Sci., Univ. California, Riverside, 1990.
The performance of the algorithms in [92], [105], [97], and [90] are compared in the following paper.These algorithms have been implemented and tested on randomly generated maximal planar graphs. Thestandard deviations in angle size, edge length, and face area are used to compare the quality of the planarstraight-line drawings produced.
14

106. S. Jones, P. Eades, A. Moran, N. Ward, G. Delott, and R. Tamassia, “A Note on Planar Graph DrawingAlgorithms,” Technical Report 216, Dept. of Computer Science, Univ. of Queensland, 1991.
Kant presents an algorithm for constructing planar convex straight-line grid drawings with area O(n2).His technique has several other graph drawing applications.
107. G. Kant, “Algorithms for Drawing Planar Graphs,” Ph.D. Thesis, Utrecht University, 1993.
108. G. Kant, “Drawing Planar Graphs Using the lmc-Ordering,” Proc. IEEE Symp. on Foundations of ComputerScience, pp. 101-110, 1992.
Several of the algorithms that produce planar straight-line drawings operate primarily on triangulations.Thus for this and other applications, algorithms for triangulating planar graphs are required. Such algorithmsare presented in:
109. G. Kant and H.L. Bodlaender, “Triangulating Planar Graphs while Minimizing the Maximum Degree,” inAlgorithm Theory (SWAT ’92), (Proc. 3rd Scandinavian Workshop on Algorithm Theory, Helsinki, July 1992),ed. O. Nurmi E. Ukkonen, pp. 258-271, Lecture Notes in Computer Science, vol. 621, Springer-Verlag, 1992.
5.3 Orthogonal Grid Drawings
Investigations of planar orthogonal grid drawings were first motivated by problems in circuit layout. Withinthis graphic standard, minimizing the number of bends and the area is important for both diagram readabilityand VLSI applications (see Fig. 9).
Any planar graph of degree at most 4 admits a planar orthogonal grid drawing with area O(n2). Further,there are graphs which need quadratic area. These results are presented in:
110. Y. Shiloach, “Arrangements of Planar Graphs on the Planar Lattice,” Ph.D. Thesis, Weizmann Institute ofScience, Rehovot, Israel, 1976.
111. L. Valiant, “Universality Considerations in VLSI Circuits,” IEEE Transactions on Computers, vol. C-30, no.2, pp. 135-140, 1981.
The problem of testing whether a graph admits a planar orthogonal drawing with no bends is NP-complete, as shown in:
112. A. Garg and R. Tamassia, “On the Computational Complexity of Upward and Rectilinear Planarity Testing,”Technical Report CS-94-10, Dept. of Computer Science, Brown Univ., 1994.
Hence, the corresponding bend-minimization probelm is NP-hard.Tamassia uses network flow techniques to give an O(n2 log n)-time algorithm for minimizing bends in a
fixed embedding setting.
113. R. Tamassia, “On Embedding a Graph in the Grid with the Minimum Number of Bends,” SIAM J. Computing,vol. 16, no. 3, pp. 421-444, 1987.
Di Battista, Liotta, and Vargiu give polynomial time algorithms for minimizing bends (considering allthe possible embeddings) for series-parallel graphs and graphs with degree at most 3.
114. G. Di Battista, G. Liotta, and F. Vargiu, “Spirality of Orthogonal Representations and Optimal Drawings ofSeries-Parallel Graphs and 3-Planar Graphs,” Proc. WADS’93, LNCS 709, pp. 15–162, 1993.
Storer gives three heuristics for constructing drawings with O(n) bends.
115. J.A. Storer, “On Minimal Node-Cost Planar Embeddings,” Networks, vol. 14, pp. 181-212, 1984.
Tamassia and Tollis present another heuristic for bend minimization which has the same performancebounds as the ones by Storer and runs in O(n) time.
15

y
y
y y y
y y
y
y
1 2
3
4
56
7
8
y
y y y
y
y
y
1 2
3
4 5
6 7
8
area 20, bends 6 area 9, bends 2
Figure 9: Examples of planar orthogonal grid drawings.
116. R. Tamassia and I.G. Tollis, “Efficient Embedding of Planar Graphs in Linear Time,” Proc. IEEE Int. Symp.on Circuits and Systems, pp. 495-498, Philadelphia, 1987.
117. R. Tamassia and I.G. Tollis, “Planar Grid Embedding in Linear Time,” IEEE Trans. on Circuits and Systems,vol. CAS-36, no. 9, pp. 1230-1234, 1989.
The structure of orthogonal embeddings of graphs is investigated in:
118. G. Vijayan and A. Wigderson. “Rectilinear Graphs and their Embeddings,” SIAM Journal on Computing, vol.14, no. 2, pp. 355-372, May 1985.
Lower bounds for planar orthogonal drawings of graphs, and parallel algorithms for achieving the sameperformance bounds as the ones by Storer and Tamassia and Tollis are described in
119. R. Tamassia, I.G. Tollis, and J.S. Vitter, “Lower Bounds for Planar Orthogonal Drawings of Graphs,” Infor-mation Processing Letters, vol. 39, pp. 35-40 (1991).
120. R. Tamassia, I.G. Tollis, and J.S. Vitter, “Lower Bounds and Parallel Algorithms for Planar Orthogonal GridDrawings,” Proc. IEEE Symposium on Parallel and Distributed Processing, pp. 386-393 (1991).
NP-completeness results related to the minimization of area and total edge length in planar orthogonalgrid drawings have been presented in [33, 34, 115, 35, 36] and:
121. D. Dolev, F.T. Leighton, and H. Trickey, “Planar Embedding of Planar Graphs,” in Advances in ComputingResearch, vol. 2, ed. F.P. Preparata, pp. 147-161, JAI Press Inc., Greenwich, CT, 1984.
This paper also gives a heuristic for area minimization.Orthogonal drawing algorithms are briefly surveyed in:
122. R. Tamassia, “Planar Orthogonal Drawings of Graphs,” Proc. IEEE Int. Symp. on Circuits and Systems, 1990.
5.4 Visibility Representations
A visibility representation for a planar graph G consists of representing the vertices of G by horizontalsegments, and the edges of G by vertical segments, so that the edge-segment associated with each edge (u, v)intersects exactly the vertex-segments associated with u and v, and no other vertex-segment (see Fig. 10).
The study of this graphic standard was originally motivated by VLSI layout and compaction problemsbecause it gives regular and modular drawings.
16

1
2
3
4
5
6
7
8
Figure 10: Visibility representation for the graph of Fig. 9.
123. M. Schlag, F. Luccio, P. Maestrini, D.T. Lee, and C.K. Wong, “A Visibility Problem in VLSI Layout Com-paction,” in Advances in Computing Research, vol. 2, ed. F.P. Preparata, pp. 259- 282, JAI Press Inc., Green-wich, CT, 1985.
Theoretical results characterizing visibility representations and variations of it appear in:
124. P. Duchet, Y. Hamidoune, M. Las Vergnas, and H. Meyniel, “Representing a Planar Graph by Vertical LinesJoining Different Levels,” Discrete Mathematics, vol. 46, pp. 319- 321, 1983.
125. C. Thomassen, “Plane Representations of Graphs,” in Progress in Graph Theory, ed. J.A. Bondy and U.S.R.Murty, pp. 43-69, Academic Press, 1984.
126. S.K. Wismath, “Characterizing Bar Line-of-Sight Graphs,” Proc. ACM Symp. on Computational Geometry,pp. 147-152, 1985.
127. R. Tamassia and I.G. Tollis, “Centipede Graphs and Visibility on a Cylinder,” in Graph-Theoretic Conceptsin Computer Science, (Proc. Int. Workshop WG ’86, Bernierd, June 1986), ed. G. Tinhofer and G. Schmidt,pp. 252-263, Lecture Notes in Computer Science, vol. 246, Springer-Verlag, 1987.
128. R. Tamassia and I.G. Tollis, “Representations of Graphs on a Cylinder,“ SIAM J. on Discrete Mathematics,vol. 4, no. 1, pp. 139-149, 1991.
129. F. Luccio, S. Mazzone, and C. Wong, “A Note on Visibility Graphs,” Discrete Mathematics, vol. 64, pp.209-219, 1987.
130. D.G. Kirkpatrick and S.K. Wismath, “Weighted Visibility Graphs of Bars and Related Flow Problems,” Al-gorithms and Data Structures (Proc. WADS’89), pp. 325-334, Lecture Notes in Computer Science, vol. 382,Springer-Verlag, 1989.
131. T. Andreae, “Some Results on Visibility Graphs,” Discrete Applied Mathematics, vol. 40, pp. 5-17, 1992.
Algorithms that construct visibility representations in linear time are given in the following papers andin [136].
132. R.H.J.M. Otten and J.G. van Wijk, “Graph Representations in Interactive Layout Design,” Proc. IEEE Int.Symp. on Circuits and Systems, pp. 914-918, New York, 1978.
133. P. Rosenstiehl and R.E. Tarjan, “Rectilinear Planar Layouts and Bipolar Orientations of Planar Graphs,”Discrete & Computational Geometry, vol. 1, no. 4, pp. 343-353, 1986.
17
134. J. Nummenmaa, Constructing compact rectilinear planar layouts using canonical representation of planargraphs, Theoretical Computer Science 99 (1992), pp. 213-230.
135. G. Kant, “A More Compact Visibility Representation,” Proc. Int. Workshop on Graph-Theoretic Concepts inComputer Science (WG ’93), Lecture Notes in Computer Science, 1993.
A complete combinatorial characterization of three classes of visibility representations and linear timedrawing algorithms are presented in:
136. R. Tamassia and I.G. Tollis, “A Unified Approach to Visibility Representations of Planar Graphs,” Discrete &Computational Geometry, vol. 1, no. 4, pp. 321-341, 1986.
An algorithm to construct constrained visibility representations (that is, representations where the edgesof given paths are aligned) is presented in:
137. G. Di Battista, R. Tamassia, and I.G. Tollis, “Constrained Visibility Representations of Graphs,” InformationProcessing Letters, vol. 41, pp. 1-7, 1992.
Linear-time algorithms for constructing visibility representations of trees with optimal area are presentedin:
138. G. Kant, G. Liotta, R. Tamassia, and I.G. Tollis, “Area Requirement of Visibility Representations of Trees,”Proc. 1993 Canadian Conference on Computational Geometry, Waterloo, Ontario, Aug. 1993, pp. 192-197.
A bipolar orientation of an undirected graph consists of orienting the edges so that the resulting directedgraph is acyclic and has exactly one source (vertex without incoming edges) and exactly one sink (vertexwithout outgoing edges). The creation of a bipolar orientation is often the first step for the generation ofa visibility representation. The properties of bipolar orientations are systematically explored in terms ofcircuits, cocircuits, rank activities, Tutte polynomial, poset dimension, angle bipartition and max flow-mincut theorem in:
139. H. de Fraysseix, P.O. de Mendez, and P. Rosenstiehl, “Bipolar Orientations revisited,” Technical Report P089,Centre d’Analyse et de Mathematique Sociales, Ecole des Hautes Etudes en Sciences Sociales, Paris, 1993.(Preliminary version in Proc. Fifth Franco-Japanese Days on Combinatorics and Optimization, 1992.)
Efficient algorithms are described to list, generate or extend bipolar orientations for general graphs orplane ones, with or without constraints. The importance of the paper goes beyond visibility representations;in fact bipolar orientations are exploited in several drawing algorithms.
5.5 Other Graphic Standards
Algorithms for constructing planar polyline grid drawings are described in [110] and:
140. A.K. Hope, “A Planar Graph Drawing Program,” Software Practice and Experience, vol. 1, pp. 83-91, 1971.
141. D. Woods, “Drawing Planar Graphs,” Ph.D. dissertation (Technical Report STAN-CS-82-943), ComputerScience Dept., Stanford Univ., 1982.
Another standard is proposed by Ozawa: vertices are placed on a horizontal line and edges are drawn ashalf-circles or smooth connections of half-circles.
142. T. Ozawa, “Planarity Testing for IC Layout with Constraints for Pin Order and Congestion Between Pins,”IEEE Conf. Record of the 14th Asilomar Conf. on Circuits, Systems Computers, pp. 188-192, 1980.
Kant investigates representations of planar cubic graphs in the hexagonal grid, presenting a linear timealgorithm:
143. G. Kant, “Hexagonal Grid Drawings,” Technical Report RUU-CS-92-06, Department of Computer Science,Utrecht Univ., The Netherlands, 1992.
18

Representations of planar graphs by means of subdivisions of the plane into polygons (usually rectangles)have been motivated by problems in architectural design. Each vertex is represented by a polygon, and foreach edge (u, v) the polygons associated with vertices u and v are geometrically adjacent. Essentially, thisamounts to representing the graph by its dual. In most cases, the polygons are required to be rectangles;linear time algorithms for finding such dual representations are presented in:
144. J. Bhasker and S. Sahni, “A Linear Algorithm to Find a Rectangular Dual of a Planar Triangulated Graph,”Algorithmica, vol. 3, no. 2, pp. 247-278, 1988.
145. X. He, “On Finding the Rectangular Duals of Planar Triangulated Graphs,” SIAM J. Computing (to appear).Technical Report 90-24, Department of Computer Science, University of Buffalo 1990.
146. G. Kant and X. He, “Two Algorithms for Finding Rectangular Duals of Planar Graphs,” Proc. Int. Workshopon Graph-Theoretic Concepts in Computer Science (WG ’93), Lecture Notes in Computer Science, 1993.
Background to the architectural motivation can be found in:
147. J.P. Steadman, Architectural Morphology, Pion, London, 1983.
In a tessellation representation, each constituent (vertex, edge, and face) of an embedded planar graph isrepresented by a rectangle with horizontal and vertical sides, and incidencies between constituents correspondto geometric adjacencies between rectangles (see Fig. 11). These representations are investigated in:
148. R. Tamassia and I.G. Tollis, “Tessellation Representations of Planar Graphs,” Proc. 27th Annual AllertonConf., pp. 48-57, 1989.
y
y y
@@
@@
yHHHH
y
yAAAA
AAAA
y
TTTTTTTTTT
e1
e2 e3
e4 e5
e6 e7
e8
e9 e10
e1
e2
e3
e4 e5
e6 e7 e8
e9e10
(a)
(b)
Figure 11: (a) A planar graph G. (b) Tessellation representation for G.
An algorithm that maps vertices to grid points to facilitate the construction of a planar drawing isdescribed in:
149. R. Jayakumar, K. Thulasiraman, and M.N.S Swamy, “Planar Embedding: Linear-Time Algorithms for VertexPlacement and Edge Ordering,” IEEE Trans. on Circuits and Systems, vol. 35, no. 3, pp. 334-344, 1988.
19

6 Directed Graphs
6.1 Acyclic Digraphs
Acyclic digraphs are widely used to display hierarchical structures. Examples include PERT diagrams, ISAhierarchies, and various dependency graphs. It is customary to represent these graphs so that the edges allflow in the same direction, e.g., from top to bottom, or from left to right (see Fig. 12). Namely, we say thata drawing of a digraph is upward if each arc is a curve monotonically increasing in the y-direction.
An important class of acyclic digraphs are covering digraphs of partially ordered sets. These digraphs arecommonly represented by upward straight-line drawings, called order diagrams, Hasse diagrams, or simplydiagrams.
A drawing algorithm for order diagrams is described in:
150. H. Jurgensen and J. Loewer: Drawing Hasse diagrams of partially ordered sets. In: G. Kalmbach, Orthomodularlattices. Academic Press, London, 1983, pp. 331–345.
Several issues in drawing order diagrams, such as the minimization of the number of slopes used for thearcs, are investigated in:
151. I. Rival and R. Wille, “Lattices Freely Generated by Partially Ordered Sets: Which can be Drawn?,” J. furReine und Angew. Math., vol. 310, pp. 56-80, 1979.
152. J. Czyzowicz, A. Pelc, and I. Rival, “Drawing Orders with Few Slopes,” Technical Report TR-87-12, Dept. ofComputer Science, Univ. of Ottawa, 1987.
153. J. Czyzowicz, A. Pelc, I. Rival, and J. Urrutia, “Crooked Diagrams with Few Slopes,” Technical Report TR-87-26, Dept. of Computer Science, Univ. of Ottawa, 1987.
154. A. Pelc and I. Rival, “Orders with Level Diagrams,” Technical Report TR-87-11, Dept. of Computer Science,Univ. of Ottawa, March 1987.
155. J. Czyzowicz, “Lattice Diagrams with Few Slopes,” Technical Report #3, Departement D’Informatique, Univ.of Quebec at Hull, 1987.
156. J. Czyzowicz, “Planar Lattices and the Slope Problem,” Technical Report #4, Departement D’Informatique,Univ. of Quebec at Hull, 1987.
157. J. Czyzowicz, A. Pelc, and I. Rival, “Planar Ordered Sets of Width Two,” Technical Report TR-87-31, Dept.of Computer Science, Univ. of Ottawa, 1987.
Surveys on drawing techniques for order diagrams appear in:
158. I. Rival, “The Diagram,” in Graphs and Orders, ed. I. Rival, pp. 103-133, Reidel Publishing, 1985.
159. I. Rival, “Graphical Data Structures for Ordered Sets,” in Algorithms and Order, ed. I. Rival, pp. 3-31, KluwerAcademic Publishers, 1989.
160. I. Rival, “Reading, Drawing, and Order,” in Algebras and Orders, eds. I.G. Rosenberg and G. Sabidussi, pp.359-404, Kluwer Academic Publishers, 1993.
6.1.1 Upward Planarity
The notion of planarity of undirected graphs has a corresponding notion of “upward planarity” for directedgraphs. A digraph is said to be upward planar if it admits a planar upward drawing (see Fig. 12). Notethat an upward planar graph must be acyclic and its underlying undirected graph must be planar; however,there are planar acyclic digraphs which are not upward planar: see Fig. 13.
Various combinatorial characterizations of upward planarity are presented in:
161. D. Kelly and I. Rival, “Planar Lattices,” Canadian J. Mathematics, vol. 27, no. 3, pp. 636-665, 1975.
20

y@@
@@@I
*
yy
3
ZZ
ZZ
ZZ
y@@
@@@I6
y
y
7
AA
AA
AK
y
BBB
BBB
BBM
y
Figure 12: Planar upward drawing of an acyclic digraph.
y
y
y
y
y
y@@@I
@@
@@
@@I6 6
@@@I
Figure 13: Planar acyclic digraph which is not upward planar.
162. C. Platt, “Planar Lattices and Planar Graphs,” J. Combinatorial Theory, Series B, vol. 21, pp. 30-39, 1976.
163. D. Kelly, “Fundamentals of Planar Ordered Sets,” Discrete Mathematics, vol. 63, pp. 197-216, 1987.
164. G. Di Battista and R. Tamassia, “Algorithms for Plane Representations of Acyclic Digraphs,” TheoreticalComputer Science, vol. 61, pp. 175-198, 1988.
165. C. Thomassen, “Planar Acyclic Oriented Graphs,” Order, vol. 5, no. 4, pp. 349-361, 1989.
The problem of testing whether a digraph is upward planar is NP-complete, as shown in [112]. For specialclasses of graphs, polynomial time algorithms have been found. These appear in:
166. G. Di Battista, W.P. Liu, and I. Rival, “Bipartite Graphs, Upward Drawings, and Planarity,” InformationProcessing Letters, vol. 36, pp. 317-322, 1990.
167. M.D. Hutton and A. Lubiw, “Upward Planar Drawing of Single Source Acyclic Digraphs,” Proc. 2nd ACM-SIAM Symp. on Discrete Algorithms, pp. 203-211, 1991.
168. P. Bertolazzi and G. Di Battista, “On Upward Drawing Testing of Triconnected Digraphs,” Proc. 7th ACMSymp. on Computational Geometry, pp. 272-280, 1991.
21
169. P. Bertolazzi, G. Di Battista, G. Liotta, and C. Mannino “Upward Drawings of Triconnected Digraphs,”Algorithmica (to appear).
170. P. Bertolazzi, G. Di Battista, C. Mannino, and R. Tamassia, “Optimal Upward Planarity Testing of Single-Source Digraphs,” Proc. European Symp. on Algorithms, 1993.
Planarization-based algorithms for upward drawings have three steps corresponding to the three phasesfor drawing general graphs as described in Subsection 4.3.
If the topological structure (that is, a planar representation) of an upward planar digraph is known, thenan upward drawing may be efficiently obtained; algorithms are given in [164]. For a survey see:
171. R. Tamassia, “Drawing Algorithms for Planar st-Graphs,” Australasian Journal of Combinatorics, vol. 2,pp. 217-235 (1990).
In contrast to undirected graphs, upward planar straight line grid drawings may require exponential area.These results, as well as a discussion of symmetry display, may be found in:
172. G. Di Battista, R. Tamassia, and I.G. Tollis, “Area Requirement and Symmetry Display in Drawing Graphs,”Proc. ACM Symp. on Computational Geometry, pp. 51-60, 1989.
173. G. Di Battista, R. Tamassia, and I.G. Tollis, “Area Requirement and Symmetry Display of Planar UpwardDrawings,” Discrete & Computational Geometry, vol. 7, pp. 381-401, 1992.
Lower bounds on area requirements and algorithms for constructing planar upward drawings of series-parallel digraphs are given in:
174. P. Bertolazzi, R.F. Cohen, G. Di Battista, R. Tamassia, and I.G. Tollis, “How to Draw a Series-ParallelDigraph,” in Algorithm Theory (SWAT ’92), (Proc. 3rd Scandinavian Workshop on Algorithm Theory, Helsinki,July 1992), ed. O. Nurmi E. Ukkonen, pp. 272-283, Lecture Notes in Computer Science, vol. 621, Springer-Verlag, 1992.
175. P. Bertolazzi, R.F. Cohen, G. Di Battista, R. Tamassia, and I.G. Tollis, “How to Draw a Series-ParallelDigraph,” International Journal of Computational Geometry & Applications (to appear).
6.1.2 Hierarchical Drawings
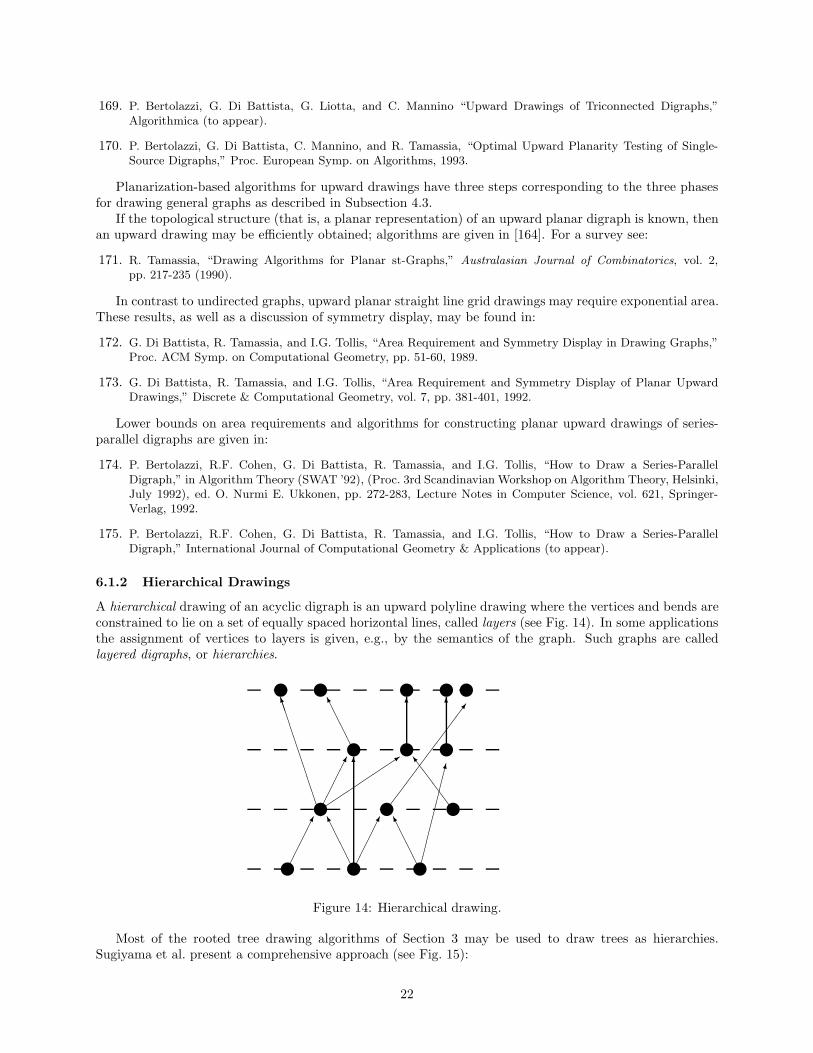
A hierarchical drawing of an acyclic digraph is an upward polyline drawing where the vertices and bends areconstrained to lie on a set of equally spaced horizontal lines, called layers (see Fig. 14). In some applicationsthe assignment of vertices to layers is given, e.g., by the semantics of the graph. Such graphs are calledlayered digraphs, or hierarchies.
y
y
AA
AAK
y
y
AA
AAK
y
y
6
3
y
ySS
SSo
y
y
BB
BB
BB
BB
BBM
y y y
AA
AAK
y6 6
7
Figure 14: Hierarchical drawing.
Most of the rooted tree drawing algorithms of Section 3 may be used to draw trees as hierarchies.Sugiyama et al. present a comprehensive approach (see Fig. 15):
22

Step 1 Assign vertices to the layers so that arcs are directed upward and vertices are distributed uniformly.
Step 2 Select a permutation of the vertices in each layer to reduce crossings.
Step 3 Adjust the position of the vertices in each layer to reduce the number of bends.
176. K. Sugiyama, S. Tagawa, and M. Toda, “Methods for Visual Understanding of Hierarchical Systems,” IEEETrans. on Systems, Man, and Cybernetics, vol. SMC-11, no. 2, pp. 109- 125, 1981.
177. K. Sugiyama and M. Toda, “Structuring Information for Understanding Complex Systems: A Basis for DecisionMaking,” FUJITSU Scientific and Technical Journal, vol. 21, no. 2, pp. 144-164, 1985.
178. K. Sugiyama, “A Cognitive Approach for Graph Drawing,” Cybernetics and Systems: An International Journal,vol. 18, pp. 447-488, 1987.
Variations and extensions of this approach are presented in:
179. M.J. Carpano, “Automatic Display of Hierarchized Graphs for Computer Aided Decision Analysis,” IEEETrans. on Systems, Man, and Cybernetics, vol. SMC-10, no. 11, pp. 705-715, 1980.
180. M.J. Carpano and M. Delarche, “Apport des Techniques Graphiques Interactives a l’Analyse Structurale deSystemes. II- Exemples de Realization et d’Application,” RAIRO Sept. Anal. Cont., June 1980.
181. M. May and P. Mennecke, “Layout of Schematic Drawings,” Syst. Anal. Model. Simul., vol. 1, 4, pp. 307-338,1984.
182. L.A. Rowe, M. Davis, E. Messinger, C. Meyer, C. Spirakis, and A. Tuan, “A Browser for Directed Graphs,”Software Practice and Experience, vol. 17, no. 1, pp. 61-76, 1987.
183. E.B. Messinger, “Automatic Layout of Large Directed Graphs,” Technical Report 88-07-08, Univ. of Washing-ton, Dept. of Computer Science, 1988.
184. E.R. Gansner, S.C. North, and K.P. Vo, “DAG – A Program that Draws Directed Graphs,” Software Practiceand Experience, vol. 18, no. 11, pp. 1047-1062, 1988.
185. D. Jablonowski and V.A. Guarna, “GMB: A Tool for Manipulating and Animating Graph Data Structures,”Software Practice and Experience, vol. 19, no. 3, pp. 283-301, 1989.
186. E.R. Gansner, E. Koutsofios, S.C. North, and K.P. Vo, “A Technique for Drawing Directed Graphs,” IEEETrans. on Software Engineering, vol. 19, no. 3, pp. 214-230, 1993.
Analyses of algorithms used at each of the three steps are presented in:
187. P. Eades and X. Lin, “How to Draw a Directed Graph,” Proc. IEEE Workshop on Visual Languages (VL’89),pp. 13-17, 1989.
188. P. Eades and K. Sugiyama, “How to Draw a Directed Graph,” Journal of Information Processing, vol. 14, no.4, pp. 424–437, 1990.
189. P. Eades, “Complexity Issues in Drawing Directed Graphs,” Proc. Int. Workshop on Discrete Algorithms andComplexity, pp. 9–15, Fukuoka, Japan, 1989.
190. X. Lin, “Analysis of Algorithms for Drawing Graphs,” PhD thesis, Department of Computer Science, Universityof Queensland, 1992.
Heuristics for the assignment of vertices to layers in Step 1 of the above technique are described in:
191. K. Sugiyama, “A Readability Requirement on Drawing Digraphs: Level Assignment and Edge Removal for Re-ducing the Total Length of Lines,” Research Report no. 45, Int. Inst. for Advanced Study of Social InformationScience, FUJITSU, Numazu, Japan, March 1984.
23

y
y
y@@
@@I
y y
y
AA
AK
6 6
y
6
y
1 2
34 5
67 8
y
y
y
y y
y
y
@@
@@I 6
y
@@
@@I
1 2
34 5
7 6 8
y y
yy
@@
@@I
y
HHHHHHHY
y
*y
@@
@@I
AA
AK
y
@@
@@I
1 2
3 4 5
6 7 8
y
y
y
y
y y
y y
AAAU
?
BBBBBBBBBBBN
@@
@@
@@
@@@I
1
2
3
45
6
7
8
(a) (b)
(c) (d)
Figure 15: A general strategy for hierarchical drawings. (a) Given digraph. (b) Assignment of vertices tolayers. (c) Crossing reduction. (d) Placement of vertices and bends.
192. P. Eades and X. Lin,, “Notes on the Layer Assignment Problem for Drawing Directed Graphs,” ACSC 14,Proc. 14th Australian Computer Science Conference, University of New South Wales, pp. 26-10, 1991.
A divide-and-conquer algorithm for hierarchical drawings is proposed in:
193. E.B. Messinger, L.A. Rowe, and R.H. Henry, “A Divide-and-Conquer Algorithm for the Automatic Layout ofLarge Directed Graphs,” IEEE Trans. on Systems, Man, and Cybernetics, vol. SMC-21, no. 1, pp. 1-12, 1991.
A recursive algorithm for hierarchical drawings that partitions the original graph into subgraphs whoseelements are closely related is presented in:
194. D.J. Gschwind and T.P. Murtagh, “A Recursive Algorithm for Drawing Hierarchical Directed Graphs,” Tech-nical Report CS-89-02, Dept. of Computer Science, Williams College, 1989.
A linear time algorithm for constructing hierarchical drawings is presented in:
195. G. Robins, “The ISI Grapher: A Portable Tool for Displaying Graphs Pictorially,” Technical Report ISI/RS-87-196, Information Sciences Inst., Univ. of Southern California, 1987. (Also in Proc. Symboliikka ’87, Helsinki,Finland, August 1987)
Orthogonal hierarchical drawings are investigated in:
196. J.E. Savage, “Heuristics for Level Graph Embeddings,” Proc. Workshop on Graphtheoretic Concepts in Com-puter Science, pp. 307-318, Trauner Verlag, 1983.
Crossing reduction is a fundamental aesthetic for hierarchical drawings. An efficient algorithm to con-struct a planar hierarchical drawing of a layered digraph is given in:
24

197. G. Di Battista and E. Nardelli, “An Algorithm for Testing Planarity of Hierarchical Graphs,” in Graph-Theoretic Concepts in Computer Science, (Proc. Int. Workshop WG ’86, Bernierd, June 1986), ed. G. Tinhoferand G. Schmidt, pp. 277-289, Lecture Notes in Computer Science, vol. 246, Springer-Verlag, 1987.
198. G. Di Battista and E. Nardelli, “Hierarchies and Planarity Theory,” IEEE Trans. on Systems, Man, andCybernetics, 1988.
An algorithm which uses a technique adapted from [90] for hierarchical drawings is presented in:
199. P. Eades, X. Lin and R. Tamassia, An Algorithm for Drawing a Hierarchical Graph, Proc. Second CanadianConference on Computational Geometry, (edit. J. Urrutia) University of Ottawa, 1990, 142-146.
Minimizing crossings for layered digraphs is NP-hard even if there are only two layers [39], and even ifthere is only one node in each layer:
200. S. Masuda, K. Nakajima, T. Kashiwabara and T. Fujisawa, Crossing Minimization in Linear Embeddings ofGraphs, IEEE Transactions on Computers, vol. 39, no. 1 (1990), pp 124 - 127.
Further NP-completeness results, as well as analyses of an heuristics (one of which gives at most threetimes the minimum number of crossings) are given in:
201. P. Eades, B. McKay, and N. Wormald, “On an Edge Crossing Problem,” Proc. 9th Australian ComputerScience Conf., pp. 327-334, Australian National University, 1986.
202. P. Eades and N. Wormald, “Edge Crossings in Drawings of Bipartite Graphs” Technical Report 108, Departmentof Computer Science, University od Queensland. (to appear in Algorithmica).
Other heuristics for crossing minimization in layered digraphs are studied in the following papers:
203. J. Warfield, “Crossing Theory and Hierarchy Mapping,” IEEE Trans. on Systems, Man, and Cybernetics, vol.SMC-7, no. 7, pp. 502-523, 1977.
204. P. Eades and D. Kelly, “Heuristics for Drawing 2- Layered Networks,” Ars Combinatoria, vol. 21.A, pp. 89-98,1986.
205. E. Makinen, “Experiments on Drawing 2-Level Hierarchical Graphs,” International Journal of Computer Math-ematics 36 (1990), 175-181.
206. E. Makinen, “A Note on the Median Heuristic for Drawing Bipartite Graphs,” Fundamenta Informaticae XII(1989), 563-570.
207. T. Catarci, “The Assignment Heuristic for Crossing Reduction in Bipartite Graphs,” Proc. 26th Annual AllertonConf., 1988.
208. M. May and K. Szkatula, “On the Bipartite Crossing Number,” Control and Cybernetics, vol. 17, no. 1, pp.85-98, 1988.
209. E. Makinen, “Remarks on the Assignment Heuristic for Drawing Bipartite Graphs,” Technical Report A-1990-7,Dept. of Computer Science, Univ. of Tampere, Finland, 1990.
210. E. Makinen, “On Drawing Regular Bipartite Graphs,” International Journal of Computer Mathematics 43(1992), 39-43.
A heuristic algorithm that simplifies dense hierarchical graphs by replacing complete bipartite subgraphswith a single “concentrator node” is presented in the following paper.
211. F.J. Newbery, “Edge Concentration: A Method for Clustering Directed Graphs,” Proc. 2nd Int. Workshop onSoftware Configuration Management, pp. 76-85, 1989.
The transformation greatly enhances visual simplicity and may reduce the number of crossings; see [190] fora discussion of the complexity issues involved.
The display of symmetries in hierarchical drawings is investigated in [199] and:
25

212. K. Sugiyama, “Achieving Uniqueness Requirement in Drawing Digraphs: Optimum Code Algorithm and Hi-erarchic Isomorphism,” Research Report no. 58, Int. Inst. for Advanced Study of Social Information Science,FUJITSU, Numazu, Japan, July 1985.
Radial drawings of layered digraphs are investigated in [179] and:
213. M.G. Reggiani and F.E. Marchetti, “A Proposed Method for Representing Hierarchies,” IEEE Trans. on Sys-tems, Man, and Cybernetics, vol. 18, no. 1, pp. 2-8, 1988.
6.1.3 Dominance Drawings
A dominance drawing of an acyclic directed graph G = (V, E) is a function f : V ← Rk such that(f(u), f(v)) ∈ E if and only if f(u) 6= f(v) and each coordinate of f(v) is at least as large as the cor-responding coordinate of f(u). A dominance drawing in dimension k can be viewed as an embedding of thegraph in a k dimensional partial order. Thus several mathematical results on partial orders can be used toderive algorithms for dominance drawings. Algorithms and complexity of creating such representations aregiven in [173] and:
214. T. Kameda, On the vector representation of the reachability in planar directed graphs, Information ProcessingLetters, vol. 3, no. 3 (1975) pp. 75-77.
215. A. Pnueli, A. Lempel, and S. Even, “Transitive orientation of graphs and identification of permutation graphs,”Canad. J. Math., 23 (1971) pp. 160-175.
216. M. Yannakakis, “The complexity of the partial order dimension problem,” SIAM J. Alg. and Disc. Meth., vol.3, no. 3 (1982) pp. 351-358.
Related results appear in [161] and [163].Algorithms for dominance drawings of series parallel graphs are in [174]. A linear time algorithm for
finding a dominance drawing of a bipartite graph in two dimensions is given in
217. P. Eades, H. ElGindy, M. Houle, W. Lenhart, M. Miller, D. Rappaport and S. Whitesides, “DominanceDrawings of Bipartite Graphs,” manuscript 1993.
6.2 General Digraph Drawing Algorithms
When the representation of flow in digraphs with cycles is an important aesthetic, one would like to maximizethe number of arcs that are directed upward. This problem is equivalent to reversing a minimum number ofarcs to make the digraph acyclic, and is commonly known as the feedback arc set problem. The problem isNP-complete in general, but it is polynomially solvable for several classes of graphs including planar digraphs:
218. A. Frank, “How to Make a Digraph Strongly Connected,” Combinatorica, vol. 1, no. 2, 1981.
Heuristics for the feedback arc set problem are discussed in [176, 179, 182, 183, 184, 185, 191, 193, 194,187, 190], and
219. B. Berger and P. Shor, “Approximation Algorithms for the Maximum Acyclic Subgraph Problem,” Proc.ACM-SIAM Symposium on Discrete Algorithms (1990), pp. 236-243.
After the transformation into an acyclic digraph, the techniques surveyed in the previous subsection canbe applied.
If the representation of flow is not important, algorithms for drawing undirected graphs can be appliedby ignoring the directions of the arcs.
26

6.3 Application-Specific Algorithms
There are several drawing algorithms developed for specific applications, especially circuit schematics andsoftware engineering diagrams. In this framework, the semantics of the diagram and the conventions of theapplication area may put constraints on the drawing. For example, vertices representing interfaces in a DataFlow diagram are conventionally placed on the external boundary. In this section we list a sample of paperscovering such application specific techniques.
The problem of dealing with constraints on the drawing imposed by the user is specifically investigatedin:
220. R. Tamassia, “New Layout Techniques for Entity-Relationship Diagrams,” Proc. 4th Int. Conf. on Entity-Relationship Approach, pp. 304-311, Chicago, 1985.
The automatic generation of schematic diagrams for digital systems is studied in:
221. A. Arya, A. Kumar, V. Swaminathan, and A. Misra, “Automatic Generation of Digital System SchematicDiagrams,” Proc. 22nd Design Automation Conf., pp. 388-395, 1985.
222. F. Aoudja, M. Laborie, and A. Saint-Paul, “CASE: Automatic Generation of Electrical Diagrams,” Computer-Aided Design, vol. 18, no. 7, pp. 356-360, 1986.
223. M.A. Majewski, F.N. Krull, T.E. Fuhrman, and P.J. Ainslie, “Autodraft: Automatic Synthesis of CircuitSchematics,” Proc. IEEE Int. Conf. on Computer-Aided Design, pp. 435-438, 1986.
Following the classical layout approach for integrated circuits, these algorithms perform the placementof modules and the routing of connections in two separate steps.
A drawing algorithm for PERT diagrams is presented in:
224. G. Di Battista, E. Pietrosanti, R. Tamassia, and I.G. Tollis, “Automatic Layout of PERT Diagrams withXPERT,” Proc. IEEE Workshop on Visual Languages (VL’89), pp. 171-176, 1989.
An algorithm for drawing flowcharts appears in:
225. D.E. Knuth, “Computer Drawn Flocharts,” Communications of the ACM, vol. 6, 1963.
The following papers describe divide-and-conquer algorithms targeted toward Entity Relationship dia-grams:
226. D. Reiner, M. Brodie, G. Brown, M. Chilenskas, M. Friedell, D. Kramlich, J. Lehman, and A. Rosenthal, “ADatabase Design and Evaluation Workbench: Preliminary Report,” Proc. Int. Conf. on Systems Developmentand Requirements Specification, Gothenburg, Sweden, 1984.
227. D. Reiner, G. Brown, M. Friedell, J. Lehman, R. McKee, P. Rheingans, and A. Rosenthal, “A Database De-signer’s Workbench,” in Entity-Relationship Approach (Proc. 5th Int. Conf. on Entity-Relationship Approach,Dijon, France, 1987), ed. S. Spaccapietra, pp. 347-360, North-Holland, 1987.
228. D. Reiner and G. Brown, “Heuristic Layout for DDEW ER+ Diagrams,” Manuscript, Computer Corporationof America, 1985.
An algorithm for Entity Relationship diagrams based on visibility representations is in:
229. J. Nummenmaa and J. Tuomi, “Constructing Layouts for ER-Diagrams from Visibility Representations,” Proc.9th Int. Conf. on Entity-Relationship Approach, pp. 303-317, Lausanne, Switzerland, 1990.
Based on the general strategy of [72, 73], drawing algorithms for three diagrammatic representationswidely used in databases and software engineering are given in:
230. C. Batini, M. Talamo, and R. Tamassia, “Computer Aided Layout of Entity-Relationship Diagrams,” TheJournal of Systems and Software, vol. 4, pp. 163-173, 1984.
27

231. P. Di Felice and R. Tamassia, “Automatic Layout of Flow Diagrams: Preliminary Analysis,” Proc. ISMM, pp.263-267, Madrid, 1985.
232. C. Batini, E. Nardelli, and R. Tamassia, “A Layout Algorithm for Data-Flow Diagrams,” IEEE Transactionson Software Engineering, vol. SE-12, no. 4, pp. 538-546, 1986.
Layout methods for class hierarchies used in object-oriented systems are developed in:
233. H. Koike, “An Application of Three Dimensional Visualization to Object-Oriented Programming,” AdvancedVisual Interfaces (Proc. AVI’92), World Scientific Series in Computer Science vol. 36, 180-192.
7 Graph Drawing Systems
There are many computer systems available for editing graphs and graph-like diagrams. Some of thesecontain a simple automatic drawing facility:
234. M. Dao, M. Habib, J. Richard, and D. Tallot, “CABRI, an Interactive System for Graph Manipulation,” inGraph- Theoretic Concepts in Computer Science, (Proc. Int. Workshop WG ’86, Bernierd, June 1986), ed. G.Tinhofer and G. Schmidt, pp. 58-67, Lecture Notes in Computer Science, vol. 246, Springer-Verlag, 1987.
235. J.M Fourneau, I. Fournier, A. Germa, and D. Sotteau, “Unicorn: A Computer-Aided Scratch Book for GraphTheory,” Technical Report 381, L.R.I., UA410 CNRS, Univ. Paris Sud, 1987.
236. F. Aschim and B.M. Mostue, “IFIP WG 8.1 Case Solved Using SYSDOC and SYSTEMATOR,” in InformationSystems Design Methodologies: a Comparative Review (Proc. of the IFIP WG 8.1 Working Conf. on Com-parative Review of Information Systems Design Methodologies), ed. T. Olle et al., pp. 15- 40, North-Holland,Noordwijkerhout, the Netherlands, 1982.
237. M. Nagl and H. Zischler, “A Dialog System for the Graphical Representation of Graphs,” Applied ComputerScience, vol. 13 (Proc. Workshop WG ’78 on Graphtheoretic Concepts in Computer Science), pp. 325-339,1979.
238. M. Sarkar and M.H. Brown, “Graphical Fisheye Views of Graphs,” Technical Report CS-91-61, Dept. ofComputer Science, Brown Univ., 1991.
Other systems use significant layout algorithms. They are described in [281, 140, 141, 150, 176, 177, 179,182, 184, 185, 44, 46, 53, 73, 222, 223, 224, 226, 227] and:
239. M. Himsolt, “GraphEd: An Interactive Graph Editor,” Proc. STACS 89, Lecture Notes in Computer Science,vol. 349, pp. 532- 533, Springer-Verlag, 1989.
240. J. Hynd and P. Eades, “The Typed Graph Editing System - TYGES,” Proc. 3rd Australasian Conf. on Com-puter Graphics (Ausgraph 85), pp. 15-19, Brisbane, Australia, 1985.
241. P. Eades, I. Fogg and D. Kelly, “SPREMB: a System for Developing Graph Algorithms”. Congressus Numer-antium vol. 66 (1988), 123-140.
242. C. Batini, E. Nardelli, M. Talamo, and R. Tamassia, “GINCOD: a Graphical Tool for Conceptual Design ofData Base Applications,” in Computer Aided Data Base Design, ed. A. Albano, V. De Antonellis, and A. DiLeva, pp. 33-51, North Holland, 1985.
243. G. Di Battista and R. Tamassia, “An Integrated Graphic System for Designing and Accessing Statistical DataBases,” Proc. 7th Symp. on Computational Statistics (COMPSTAT 1986), pp. 231- 236, Physica-Verlag, 1986.
244. C. Batini, P. Brunetti, G. Di Battista, P. Naggar, E. Nardelli, G. Richelli, and R. Tamassia, “An AutomaticLayout Facility and its Applications,” Proc. Int. Workshop on Software Engineering Environment, pp. 139-157,China Academic Publishers, Beijing, China, 1986. (invited paper)
245. R. Read, “Methods for Computer Display and Manipulation of Graphs, and the Corresponding Algorithms,”Research Report CORR 86-12, Faculty of Mathematics, Univ. of Waterloo, July 1986.
28

246. K. Nakamura, H. Fujimoto, T. Suzuki, Y. Tarui, and Y. Kiyokane, “Visual Programming Environment inCommunications Software,” Proc. 5th IEEE Global Telecom Conf., pp. 435-439, 1986.
247. W.F. Tichy and F.J. Newbery, “Knowledge-based Editors for Directed Graphs,” in ESEC’87 (Proc. 1st Eu-ropean Software Engineering Conf.), ed. H.K. Nichols and D. Simpson, pp. 109-117, Springer-Verlag, 1987.
248. G. Kar, B.P. Madden, and R.S. Gilbert, “Heuristic Layout Algorithms for Network Management PresentationServices,” IEEE Network, (November, 1988), pp. 29-36.
249. F. Newbery, “An Interface Description Language for Graph Editors,” Proc. IEEE Workshop on Visual Lan-guages, 1988.
250. F. Newberry Paulisch and W.F. Tichy: “EDGE: An Extendible Graph Editor,” Software-Practice and Expe-rience, vol. 20, no. S1, pp. 63-88, 1990
251. S.P. Reiss and J.N. Pato, “Displaying Program and Data Structures,” Proc. 20th Hawaii Int. Conf. on SystemSciences, 1987.
252. S.P. Reiss, “Integration Mechanisms in the FIELD Environment,” Technical Report CS-88-18, Dept. of Com-puter Science, Brown Univ., 1988.
253. S.P. Reiss, S. Meyers, and C. Duby, “Interacting with the FIELD Environment,” Technical Report CS-89-51,Dept. of Computer Science, Brown Univ., 1989.
254. B. Birgisson and G. Shannon, “GraphView: A Workstation-Based Environment for Viewing Graphs and Ani-mating Graph Algorithms,” Technical Report 295, Dept. Computer Science, Indiana Univ., 1989.
255. V. Jansen, A. Potthoff, W. Thomas, and U. Wermuth, “A Short Guide to the AMORE System,” TechnicalReport 90-2, Fachgruppe Informatik, RWTH Aachen, 1990.
256. O. Baudon, “Cabri-graphes, un CAhier de BRouillon Interactif pour la theorie des graphes,” These de Doctoratde l’Universite Joseph Fourier, Grenoble, France, 1990.
257. J. Bordier and J.M. Laborde, “An Interactive Tool for Graph Theory,” Proc. 7th Annual Apple EuropeanUniversity Consortium Conference, Paris, France, ed. Apple Computer Europe, Inc, pp. 51-53, 1991.
258. G. Di Battista, G. Liotta, M. Strani and F. Vargiu, “Diagram Server,” Advanced Visual Interfaces (Proc. AVI92), World Scientific Series in Computer Science, vol. 36, pp. 415-417, 1992.
259. G. Di Battista, A. Giammarco, G. Santucci, and R. Tamassia, “The Architecture of Diagram Server,” Proc.IEEE Workshop on Visual Languages (VL’90), pp. 60-65, 1990.
260. M. Beccaria, P. Bertolazzi, G. Di Battista, and G. Liotta, “A Tailorable and Extensible Automatic LayoutFacility,” Proc. IEEE Workshop on Visual Languages (VL’91), pp. 68-73, 1991.
261. M. Bousset and P. Rosenstiehl, “Twist,” Tech. Rep. CAMS P.073, 1991.
262. J.C. Smart and V. Vemuri, “A-Vu: A Visualization Tool for Complex Software Systems” Proc. Symposiumon Assessment of Quality Software Development Tools, IEEE Computer Society Press, New Orleans LA, May27-29, 1992.
263. E.R. Gansner, E. Koutsofios, S.C. North, and K.P. Vo, “Graph Visualization in Software Analysis” Proc.Symposium on Assessment of Quality Software Development Tools, IEEE Computer Society Press, New OrleansLA, May 27-29, 1992.
264. S. Skiena, “Implementing Discrete Mathematics,” Addison Wesley, 1990.
A graph drawing system for dataflow diagrams based on placement-and-routing techniques is describedin:
29

265. L.B. Protsko, P.G. Sorenson, J.P. Tremblay, and D.A. Schaefer, “Towards the Automatic Generation of SoftwareDiagrams,”IEEE Trans. on Software Engineering, vol. SE-17, no. 1, pp. 10-21, 1991.
A tool for displaying large graphs supporting multiple views, nonuniform scaling, and user-defined con-straints on the layout is described in:
266. T.R. Henry and S.E. Hudson, “Viewing Large Graphs,” Technical Report 90-13, Dept. of Computer Science,Univ. of Arizona, 1990.
A tool that uses clustering techniques is described in:
267. P. Brown, T. Gargiulo, “An Object Oriented Layout for Directed Graphs,” Proc. Symposium on Assessmentof Quality Software Development Tools, IEEE Computer Society Press, New Orleans LA, May 27-29, 1992.
8 Special Topics
8.1 Parallel Algorithms
A parallel algorithm for planarity testing that runs in O(log n) time on a CRCW PRAM with(n log log n)/ log n processors is presented in:
268. V. Ramachandran and J.H. Reif, “An Optimal Parallel Algorithm for Graph Planarity,” Proc. IEEE Symp. onFoundations of Computer Science, pp. 282-293, 1989.
269. V. Ramachandran and J. Reif, “Planarity Testing in Parallel,” Technical Report TR-90-15, Dept. of ComputerScience, The University of Texas at Austin, 1990.
Previous results on parallel planarity testing are:
270. J. Ja’Ja’ and J. Simon, “Parallel Algorithms in Graph Theory: Planarity Testing,” SIAM J. Comput., vol. 11,no. 2, pp. 314-328, 1982.
271. G.L. Miller and J.H. Reif, “Parallel Tree Contraction and its Applications,” Proc. 26th IEEE Symp. on Foun-dations of Computer Science, pp. 478-489, 1985.
272. P.N. Klein and J.H. Reif, “An Efficient Parallel Algorithm for Planarity,” J. Computer and System Sciences,vol. 37, no. 2, pp. 190-246, 1988.
Parallel graph drawing algorithms for planar graphs are presented in [120] and in the following papers:
273. R. Tamassia and J.S. Vitter, “Optimal Parallel Algorithms for Transitive Closure and Point Location in PlanarStructures,” Proc. ACM Symp. on Parallel Algorithms and Architectures, pp. 399-408 (1989).
274. R. Tamassia and J.S. Vitter, “Parallel Transitive Closure and Point Location in Planar Structures,“ SIAM J.Computing, vol. 20, no. 4, pp. 708-725, 1991.
275. M. Furer, X. He, M.-Y. Kao, and B. Raghavachari, “O(n log log n)-Work Parallel Algorithms for Straight-LineGrid Embeddings of Planar Graphs,“ Proc. ACM Symp. on Parallel Algorithms and Architectures, 1992.
276. M. Furer, X. He, M.-Y. Kao, and B. Raghavachari, “Optimal Parallel Algorithms for Straight-Line GridEmbeddings of Planar Graphs,“ SIAM J. Discrete Mathematics, (to appear).
277. F. Dehne, H. Djidjev and J.-R. Sack, “An Optimal PRAM Algorithm for Planar Convex Embedding,”Manuscript, 1993.
30

8.2 Dynamic Algorithms
A reference model for dynamic drawing algorithms is given in:
278. R.F. Cohen, G. Di Battista, R. Tamassia, I.G. Tollis, and P. Bertolazzi, “A Framework for Dynamic GraphDrawing,” Proc. ACM Symp. on Computational Geometry, pp. 261-270, 1992.
The paper contains also several results on dynamic problems within the proposed model.An on-line planarity testing algorithm supporting insertions of vertices and edges with logarithmic
query/update time is presented in:
279. G. Di Battista and R. Tamassia, “Incremental Planarity Testing,” Proc. 30th IEEE Symp. on Foundations ofComputer Science, pp. 436-441, 1989.
The best result on fully dynamic planarity testing (where both insertions and deletions are allowed) isan algorithm with O(
√n) amortized query and update time, given in
280. D. Eppstein, Z. Galil, G.F. Italiano, and T.H. Spencer, “Separator Based Sparsification for Dynamic PlanarGraph Algorithms,” Proc. ACM Symp. on Theory of Computing, pp. 208-217, 1993.
An algorithm for drawing trees in a dynamic environment is presented in:
281. S. Moen, “Drawing Dynamic Trees,” IEEE Software, vol. 7, pp. 21-28, 1990.
The incremental construction of an orthogonal drawing is investigated in
282. K. Miriyala, S.W. Hornick, and R. Tamassia, “An Incremental Approach to Aesthetic Graph Layout,” Proc.Int. Workshop on Computer-Aided Software Engineering (CASE ’93), pp. 297 (1993).
An important consideration in dynamic graph layout is preserving the mental map: when a change ismade to a graph by the user, the re-application of a layout algorithm may destroy the user’s “mental map”.Models and techniques for preserving the mental map are discussed in
283. P. Eades, W. Lai, K. Misue and K. Sugiyama, “Preserving the Mental Map of a Diagram,” Proc. Compugraphics91, Portugal 1991, pp. 24-33.
284. K. Lyons, “Cluster Busting in Anchored Graph Drawing,” Proc. CAS Conference, IBM Centre for AdvancedStudies, Toronto 1992, pp. 327-338.
285. K. Bohringer and F. Newbery Paulisch, “Using Constraints to Achieve Stability in Automatic Graph LayoutAlgorithms,” Proc. ACM CHI 90, (1990) pp 43-51.
8.3 Three Dimensions
Three-dimensional drawings of graphs are investigated in [185, 233] and
286. G.G. Robertson, J.D. Mackinlay, and S.K. Card, “Cone Trees: Animated 3D Visualizations of HierarchicalInformation,” Proc. CHI, pp. 189-193, 1991.
287. S.P. Reiss, “A Framework for Abstract 3D Visualization,” Proc. IEEE Symp. on Visual Languages (VL ’93),1993.
288. A. Rudich, D. Zernik and G. Zodik. “Visage — Visualization of Attribute Graphs: A foundation for a ParallelProgramming Environment,” Environments and Tools for Parallel Scientific Computing North Holland, Ed.J.J. Dongarra and B. Tourancheau, pp. 171-192.
31
8.4 Hypergraphs
Two notions of planarity for hypergraphs and NP-completeness results are given in:
289. D.S. Johnson and H.O. Pollak, “Hypergraph Planarity and the Complexity of Drawing Venn Diagrams,” J.Graph Theory, vol. 10, no. 3, pp. 309-325, 1987.
A new formalism for representing graphs and hypergraphs, called higraph, is introduced in:
290. D. Harel, “On Visual Formalisms,” Communications of the ACM, vol. 31, no. 5, pp. 514-530, 1988.
An algorithm for drawing hypergraphs is presented in:
291. E. Makinen, “How to Draw a Hypergraph,” International Journal of Computer Mathematics 34 (1990), 177-185.
8.5 Separator-Based Algorithms
Separator-based algorithms for area-efficient (nonplanar) orthogonal drawings of trees, planar graphs, andother computationally interesting networks (e.g., d-dimensional mesh, cube-connected cycles, and shuffle-exchange) are studied in [111] and:
292. C.E. Leiserson, “Area-Efficient Graph Layouts (for VLSI),” Proc. IEEE Symp. on Foundations of ComputerScience, pp. 270-281, 1980.
293. D. Sherlekar, “Minimizing the Maximum Wire Length in VLSI Graph Layouts,“ Proc. 28th Annual AllertonConf., 1990.
Goodrich gives an optimal algorithm for the separator decomposition of planar graphs, which improvesthe time complexity of separator-based algorithm for planar graphs.
294. M.T. Goodrich, “Planar Separators and Parallel Polygon Triangulation,” Proc. 24th ACM Symp. on Theoryof Computing, pp. 507-516, 1992.
8.6 Declarative Methods
Several recent techniques for graph drawing emphasize the expression of the aesthetics rather than thealgorithmic complexity of achieving the aesthetics. These techniques, called declarative techniques, oftenrequire very large computational resources, and are perhaps outside the scope of this bibliography. Anexample is the use of genetic algorithms:
295. C. Kosak and J. Marks, “A Parallel Genetic Algorithm for Network-Diagram Layout,” Proc. 4th Int. Conf. onGenetic Algorithms (ICGA91), 1991.
296. C. Kosak, J. Marks, and S. Shieber, “New Approaches to Automating Network-Diagram Layout,” IEEE Trans.on Systems, Man, and Cybernetics. To appear. 1993.
Other examples include the simulated annealing methods of [50], and the constraint resolution methodsof [31].
The formal specification of constraints in the drawing of a graph is studied in [265] and in
297. J.D. Mackinlay, “Automating the Design of Graphical Presentations of Relational Information,” ACM Trans-actions on Graphics, vol. 5, no. 2, 1986.
298. J. Marks, “A Formal Specification Scheme for Network Diagrams that Facilitates Automated Design,” J. VisualLanguages and Computing, vol. 2, pp. 395-414, 1991.
299. E. Dengler, M. Friedell, and J. Marks, “Constraint-Driven Diagram Layout,” Proc. IEEE Symp. on VisualLanguages (VL ’93), 1993.
32

300. S. Deal, “The Specification and Recognition of Optimal Layout Configurations for Graph Structures,” Ph.D.dissertation, Dept. Computer Science, Univ. College London, 1989.
An approach to drawing graphs based on graph grammars is presented by Brandenburg:
301. F.J. Brandenburg, “Layout Graph Grammars: the Placement Approach,” Graph-Grammars and Their Appli-cation to Computer Science, Proc. 4th Int. Workshop, Bremen, Germany, 1990, Lecture Notes in ComputerScience 532, pp. 144-156. Springer-Verlag, 1991.
A visual approach to graph drawing is presented in:
302. I.F. Cruz, R. Tamassia and P. Van Hentenryck, “A Visual Approach to Graph Drawing,” Manuscript, BrownUniversity, 1993.
8.7 Aesthetics
A discussion of graph drawing aesthetics appears in:
303. C. Esposito, “Graph Graphics: Theory and Practice,” Comput. Math. Applic., vol. 15, no. 4, pp. 247-253,1988.
An experimental study of aesthetics used in Entity Relationship diagrams is reported in:
304. C. Batini, L. Furlani, and E. Nardelli, “What is a Good Diagram? A Pragmatic Approach,” Proc. 4th Int.Conf. on the Entity Relationship Approach, Chicago, 1985.
An analogous study in the field of data structure diagrams is in:
305. C. Ding and P. Mateti, “A Framework for the Automated Drawing of Data Structure Diagrams,” IEEE Trans.on Software Engineering, vol. SE-16, no. 5, pp. 543-557, 1990.
8.8 Compound Graphs
In compound digraphs, edges represent both adjacency and inclusion relations. Compound graphs and similarstructures (such as higraphs [290]) are powerful modeling tools for relational information.
Layout algorithms for compound digraphs are given in [31] and
306. K. Sugiyama and K. Misue, “Visualization of Structural Information: Automatic Drawing of Compound Di-graphs,” IEEE Transactions on Systems, Man and Cybernetics, vol. 21, no. 4, pp. 876-892, 1991.
8.9 Angles
An interesting aesthetic is to ensure that the angles between the segments that represent edges are not toosmall. Studies of this aesthetic applied to planar straight-line drawings are in:
307. G. Vijayan, “Geometry of Planar Graphs with Angles,” Proc. ACM Symp. on Computational Geometry, pp.116-124, 1986.
308. S. Malitz and A. Papakostas, “On the Angular Resolution of Planar Graphs,” Proc. 24th ACM Symp. on theTheory of Computing, pp. 527-538, 1992.
309. G. Di Battista and L. Vismara, “Angles of Planar Triangular Graphs,” Proc. ACM Symp. on Theory ofComputing, pp. 431-437, 1993.
It is shown in [308] that it is always possible to construct a straight line planar drawing whose smallestangle is Ω(αd), where 0 < α < 1, and d is the maximum degree of a vertex of the graph. Further results aregiven for outerplanar graphs.
A similar problem, but for nonplanar graphs, is considered in:
310. M. Formann, T. Hagerup, J. Haralambides, M. Kaufmann, F.T. Leighton, A. Simvonis, E. Welzl, and G.Woeginger, “Drawing Graphs in the Plane with High Resolution,” Proc. IEEE Symp. on Foundations ofComputer Science, pp. 86-95, 1990. (To appear in SIAM J. on Computing, 1993.)
It is shown that it is always possible to construct a drawing whose smallest angle between the edgesincident at a vertex is Ω(1/d2), where d is the maximum degree of a vertex of the graph. Other results aregiven for particular classes of graphs.
33

9 Open Problems
Despite the abundance of literature on graph drawing, many theoretical and practical problems are stillopen. A few of the most promising directions for further research are listed below.
Performance Bounds for Planarization Although crossing minimization is a fundamental issue, non-trivial performance bounds have not been found for any heuristic. A guaranteed heuristic would bevery important both for aesthetic graph drawing and VLSI layout.
Simple Planarity Testing The known planarity algorithms that achieve linear time complexity (Sec-tion 5.1) are all difficult to understand and implement. This is a serious limitation for their use inpractical systems. A simple and efficient algorithm for testing the planarity of a graph and constructingplanar representations would be a significant contribution.
General Strategy for Straight-Line Drawings General strategies have been successfully developed forhierarchical drawings (Section 6.1) and orthogonal grid drawings (Section 4.3). These techniques takeseveral aesthetics into account. The simplicity of straight-line drawings is very appealing, and a generalstraight-line drawing technique would find immediate applications. The most versatile technique forplanar straight-line drawings is the the one by Kant [108]. Some further progress in this direction isreported in [259].
Dynamic Drawing Algorithms Several graph manipulation systems allow the user to interactively mod-ify a graph by inserting and deleting vertices and edges. Data structures that allow for fast restructuringof the drawing would be very useful. Especially important is the dynamic planarity testing problem,where we want a data structure for planar graphs that supports in polylogarithmic time the followingoperations: (a) testing whether a new edge can be added while preserving planarity; (b) adding verticesand edges which preserve planarity; and (c) removing vertices and edges. When only insertions areallowed, this problem can be efficiently solved in O(log n) time per test or update, as shown in [279].However, the best solution for the general problem (insertions and deletions) has O(
√n) amortized
query and update time [280].
Complexity of Bend Minimization Several issues on the computational complexity of minimizing bendsin planar orthogonal drawings are open. If the embedding is fixed, bend minimization can be done intime O(n2 log n) [113]. Particular classes of graphs are investigated in [114]. It would be interesting toimprove on the sequential complexity and to develop a fast parallel algorithm for the fixed-embeddingproblem.
Area of Planar Upward Drawings of Trees The area requirement of upward planar drawings of treeshas been studied in [25, 26], where tight bounds are given for polyline drawings (Θ(n)) and orthogonaldrawings (Θ(n log log n)). The area requirement of straight-line drawings is not known instead. Thebest upper bound is O(n log n), while only the trivial Ω(n) lower bound is known.
Angular Resolution of Planar Straight-Line Drawings The angular resolution of a planar straight-line drawing is the minimum angle formed by two edges incident on the same vertex. It has been shownthat a planar graph of degree d has a drawing with angular resolution Ω(1/7d) [308]. Only the trivialO(1/d) upper bound is known.
Size Bounds for Three Dimensional Grid Drawings Graph drawing systems which exploit for threedimensions already exist but very little theory has been developed. In particular, practically nothingis known about upper and lower bounds for the sides of the enclosing rectangular prism of a threedimensional grid drawing.
Acknowledgements
The authors wish to thank the many graph drawers who have pointed out errors and omissions in the firstthree versions, and those who have helped with updates to create this fourth version.
34

A Graph Drawing ’93
The following papers have been presented at Graph Drawing’93 [16].
Session 0: Invited Lecture. Chair: Pierre Rosenstiehl
On the Four Colour Problem. C. Berge
Session 1: Geometric Graph Theory. Chair: Roberto Tamassia
New Developments in Geometric Graph Theory. J. Pach
Session 2: Trees. Chair: Giuseppe Di Battista
Characterizing Proximity Trees. P. Bose, W. Lenhart and G. Liotta
A Note on free Drawings of Binary Trees on a Square. F. J. Brandenburg and P. Eades
Two Algorithms for Drawing Trees in Three Dimensions. B. Regan
Area Requirement of Visibility Representations of Trees. G. Kant, G. Liotta, R. Tamassia and I. G. Tollis
Session 3: Upward Drawings. Chair: Takao Nishizeki
Efficient Computation of Planar Straight-Line Upward Drawings. A. Garg and R. Tamassia
An Approach for Bend-Minimal Upward Drawing. U. Foßmeier and M. Kaufmann
Session 4: Invited Lecture. Chair: Hubert de Fraysseix
Representations of Planar Graphs. C. Thomassen
Session 5: Representations in the Plane I. Chair: Anna Lubiw
On Lattice Structures Induced by Orientations. P. O. de Mendez
Complexity of Intersection Classes of Graphs. J. Kratochvıl and Jirı Matousek
On Triangle Contact Graphs. H. de Fraysseix, P. O. de Mendez and P. Rosenstiehl
Session 6: Representations in the Plane II. Chair: Ioannis G. Tollis
Characterization and Construction of the Rectangular Dual of a Graph. S. Pimont and M. Terrenoire
Two Algorithms for Finding Rectangular Duals of Planar Graphs. G. Kant and X. He
A More Compact Visibility Representation. G. Kant
Cone Visibility Graphs. A. Lubiw
Session 7: Beyond the Plane I. Chair: Janos Pach
Circle Packing Representations in Polynomial Time. B. Mohar
Generalizing Kuratowski’s Theorem. B. Mohar
Automorphisms and Genus on Generalised Maps. A. Bergey
Upward Drawing on Surfaces. I. Rival
Session 8: Beyond the Plane II. Chair: Ivan Rival
Tessellation and Visibility Representations of Maps on the Torus. B. Mohar and P. Rosenstiehl
A Simple Construction of High Representativity Triangulations. T. M. Przytycka and J. H. Przytycki
On a Visibility Representation for Graphs in Three Dimensions. P. Bose, H. Everett, S. Fekete, A. Lubiw, H.Meijer, K. Romanik, T. Shermer and S. Whitesides
On Graph Drawings with Smallest Number of Faces. J. Chen, S. P. Kanchi and J. L. Gross
Session 9: Drawings and Flows. Chair: Michael Kaufmann
A Flow Model of Low Complexity for Twisting a Layout. M. Bousset
Convex and non-Convex Cost Functions of Orthogonal Representations. G. Di Battista, G. Liotta and F. Vargiu
Topology and Geometry of Planar Triangular Graphs. G. Di Battista and L. Vismara
Session 10: Complexity. Chair: Joseph Manning
An Optimal PRAM Algorithms for Planar Convex Embedding. F. Dehne, H. Djidjev and J.-R. Sack
Algorithms for Embedding Graphs Into a 3-page Book. M. S. Miyauchi
Dominance Drawings of Bipartite Graphs. H. ElGindy, M. Houle, B. Lenhart, M. Miller, D. Rappaport and S.Whitesides
Computing the Overlay of Regular Planar Subdivisions in Linear Time. U. Finke and K. Hinrichs
Generation of Random Planar Maps. A. Denise
Session 11: Symmetry. Chair: Peter Eades
Symmetric Drawings of Graphs. J. Manning
35

Recognizing Symmetric Graphs. T. Pisanski
Session 12: Declarative Approaches. Chair: Franz J. Brandenburg
Algorithmic and Declarative Approaches to Aesthetic Layout. P. Eades and T. Lin
A Visual Approach to Graph Drawing. I. F. Cruz, R. Tamassia and P. Van Hentenryck
Layout of Trees with Attribute Graph Grammars. G. Zinßmeister
The Display, Browsing and Filtering of Graph-Trees. S. P. Foubister and C. Runciman
Session 13: Graph Drawing Systems I. Chair: David Rappaport
A Layout Algorithm for Undirected Graphs. D. Tunkelang
Drawing Ranked Digraphs with Recursive Clusters. S. C. North
Session 14: Graph Drawing Systems II. Chair: Robert F. Cohen
Graph Drawing Algorithms for the Design and Analysis of Telecommunication Networks. I. G. Tollis and C. Xia
A View to Graph Drawing Algorithms through GraphEd. M. Himsolt
An Automated Graph Drawing System Using Graph Decomposition. C. L. McCreary, C. L. Combs, D. H. Gilland J. V. Warren
Session 15: Embedding and Planarization I. Chair: Bojan Mohar
Maximum Planar Subgraphs and Nice Embeddings: Practical Layout Tools. M. Junger and P. Mutzel
Heuristics for Planarization by Vertex Splitting. P. Eades and X. Mendonca
Planar Graph Embedding with a Specified Set of Face-Independent Vertices. T. Ozawa
Session 16: Embedding and Planarization II. Chair: Herbert Fleischner
Implementation of the Planarity Testing Algorithm by Demoucron, Malgrange and Pertuiset. S. B. Johansen
A Unified Approach to Testing, Embedding and Drawing Planar Graphs. J. F. Small
A Simple Linear-Time Algorithm for Embedding Maximal Planar Graphs. H. Stamm-Wilbrandt
36

B Graph Drawing ’94
Call for Papers, Demos, and Participation
Graph Drawing ’94
DIMACS Workshop on Graph DrawingPrinceton, New Jersey, October 10-12, 1994
Scope Graph drawing addresses the problem of constructing geometric representations of abstract graphsand networks. The automatic generation of drawings of graphs has important applications in key computertechnologies such as software engineering, database design, and visual interfaces. Recent progress in algo-rithm design, computational geometry, topological graph theory, and order theory has considerably affectedthe evolution of this field, and has widened the range of issues being investigated.
Call for Participation The aim of Graph Drawing ’94 (GD ’94) is to cover the major trends in thearea. The format of the workshop will be informal. Industry representatives are welcome to attend. It isanticipated that the workshop will further collaborative efforts between computer scientists, mathematicians,and applied researchers. GD ’94 follows the GD ’93 ALCOM Workshop, held in Paris, and the GD ’92Work Meeting, held in Rome. GD ’94 is sponsored by DIMACS, the NSF Science and Technology Center inDiscrete Mathematics and Theoretical Computer Science hosted by Rutgers University, Princeton University,AT&T Bell Laboratories, and Bellcore. Limited financial support for partial coverage of expenses of selectedparticipants is available. Priority will be given to junior researchers and Ph.D. students. To receive fullconsideration, requests should be made to one of the organizers by July 20.
Call for Papers Papers describing original research and surveys addressing open problems are sought.Areas of interest include, but are not limited to:
• Applications of graph drawing, such as software visualization,user interfaces, database queries, infor-mation browsers, and computer-aided instruction.
• Tools and systems for graph drawing.
• Topological graph theory; combinatorial issues such as planarity, orientations, and orders.
• Geometric graph theory; 2- and 3-dimensional representations of graphs and hypergraphs by geometricrelations, such as visibility, proximity, intersection, and inclusion.
• Models, algorithms, and techniques for drawing graphs, such as partitioning, layering, orientation,planarization, dynamic layout restructuring, graph grammars, and declarative specifications.
• Drawing algorithms for specific families of graphs, such as trees, planar graphs, and order digraphs.
Call for Demos A great deal of research in graph drawing is motivated by applications to systems forviewing and interacting with graphs. Also, recent theoretical advances in graph drawing need to be im-plemented in practical systems. Submissions for demos to be presented at GD ’94 are solicited. Areas ofinterest include, but are not limited to:
• Mathematical visualization of graphs.
• Novel graph-based software visualization and software engineering applications.
• Database visualization with graphs and hypergraphs.
• Programming environments for graphs and their layouts.
• Algorithm animation with graphs.
• User interfaces for viewing graphs, e.g., interactive exploration of large graphs and presentation ofdynamic graphs.
Submission of Papers and Demos The program committee invites three types of submissions: regularpapers (submit a 6-12 page extended abstract); short papers (submit a 1-4 page abstract); and demos (submita 1-4 page abstract, descriptive screen dumps, and a list of the hardware needed).
The deadline for submissions is July 20. Submissions can be made by email or hardcopy. Emailsubmissions in LATEX, postscript (compressed and uuencoded), or plain text should be sent to RobertoTamassia ([email protected]). Hardcopy submissions should be sent in 10 copies to: Ioannis G. Tollis,Dept. of Computer Science, The University of Texas at Dallas, P.O. Box 830688, EC 31, Richardson, TX75083-0688 (USA).
Notification of acceptance or rejection will be done by email on or before September 1. Camera-ready versions are due at the workshop. The proceedings of GD ’94 will include short papers, regularpapers, and demo descriptions, and will be published after the workshop by Springer-Verlag or the AmericanMathematical Society (AMS).
Program Committee Franz J. Brandenburg (Univ. Passau, Germany), Giuseppe Di Battista (Univ.Rome, Italy), Hubert de Fraysseix (CNRS, France), Alberto O. Mendelzon (Univ. Toronto, Canada), TakaoNishizeki (Tohoku Univ., Japan), Stephen North (AT&T Bell Labs, USA), Ivan Rival (Univ. Ottawa,Canada), Roberto Tamassia, co-chair (Brown Univ., USA), Ioannis G. Tollis, co-chair (Univ. Texas atDallas, USA), Sue Whitesides (McGill Univ., Canada).
OrganizersRoberto Tamassia ([email protected])Ioannis G. Tollis ([email protected])
CoordinatorPat Toci ([email protected])
38

C Index of Authors
Abe, S. 84.
Ainslie, P.J. 223.
Andreae, T. 131
Aoudja, F. 222.
Arya, A. 221.
Aschim, F. 236.
Atallah, M.J. 32, 98, 99.
Batini, C. 72, 73, 230, 232, 242, 244, 304.
Baudon, O. 256.
Bayley, D.A. 44.
Beccaria, M. 260.
Becker, B. 94, 95.
Berger, B. 219.
Bernard, M.A. 30.
Bertolazzi, P. 168, 169, 170, 174, 175, 260, 278.
Bhasker, J. 144.
Bhatt, S. 33.
Birgisson, B. 254.
Bodlaender, H.L. 109.
Bohringer, K. 285.
Bondy, J. 1.
Booth, K. 82.
Bordier, J. 257.
Bousset, M. 261.
Brandenburg, F.J. 34, 301.
Brodie, M. 226.
Brown, G. 226, 227, 228.
Brown, M.. 238.
Brown, P. 267.
Brueggemann-Klein, A. 23.
Brunetti, P. 244.
Cai, J. 55.
Card, S.K. 286
Carpano, M.J. 179, 180.
Catarci, T. 207.
Cederbaum, I. 80.
Chiba, N. 10, 57, 84, 92, 93.
Chilenskas, M. 226.
Chrobak, M. 105.
Cohen, R.F. 174, 175, 278.
Cormen, T.H. 4.
Cosmadakis, S. 33.
Crescenzi, P. 25.
Cruz, I.F. 302.
Cuny, J.E. 44.
Czyzowicz, J. 152, 153, 155, 156, 157.
Dao, M. 234.
Davidson, R. 50.
Davis, M. 182.
Deal, S. 300.
Dehne, F. 277.
Delarche, M. 180.
Delott, G. 106.
Dengler, E. 299.
Deo, N. 5, 79.
Di Battista, G. 16, 25, 73, 114, 137, 164, 166, 168, 169,170, 172, 173, 174, 175, 197, 198, 224, 243, 244,258, 259, 260, 278, 279, 309.
Di Felice, P. 231.
Ding, C. 305.
Djidjev, H. 277.
Dolev, D. 121.
Duby, C. 253.
Duchet, P. 124.
Eades, P. 14, 15, 16, 27, 28, 29, 43, 64, 96, 106, 187, 188,189, 192, 199, 201, 202, 204, 217, 240, 241, 283.
Eggleton, R.B. 69.
ElGindy, H. 217.
Eppstein, D. 280.
Esposito, C. 303.
Even, S. 6, 80, 81, 215.
Fary, I. 86.
Feiner, S.K. 12.
Ferrari, D. 67.
Fogg, I. 241.
Foley, J.D. 12.
Formann, M. 310.
Foulds, L. 63, 64.
Fourneau, J.M. 235.
Fournier, I. 235.
Frank, A. 218.
de Fraysseix, H. 16, 74, 83, 102, 103, 139.
Friedell, M. 226, 227, 299.
39

Fruchterman, T. 49.
Fuhrman, T.E. 223.
Fujimoto, H. 246.
Fujisawa, T. 200.
Furer, M. 275, 276.
Furlani, L. 304.
Gansner, E.R. 184, 186, 263.
Garey, M.R. 11, 39.
Galil, Z. 280.
Garg, A. 26, 112.
Gargiulo, T. 267.
Germa, A. 235.
Giammarco, A. 259.
Gibbons, P.B. 7, 63.
Giffin, J. 63, 64.
Gilbert, R.S. 248.
Goldschmidt, O. 65.
Goodrich, M.T. 26, 294.
Gregori, A. 35.
Gschwind, D.J. 194.
Guarna, V.A. 185.
Guy, R.K. 71.
Habib, M. 234.
Hagerman, J.W. 44.
Hagerup, T. 310.
Hamidoune, Y. 124.
Han, X. 55.
Haralambides, J. 310.
Harary, F. 2.
Harborth, H. 70.
Harel, D. 50, 290.
He, X. 145, 146, 275, 276.
Henry, R.H. 193.
Henry, T.R. 266.
Himsolt, M. 239.
Hopcroft, J. 78.
Hope, A.K. 140.
Hornick, S.W. 282.
Horowitz, E. 3.
Hotz, G. 94.
Hough, A.A. 44.
Houle, M. 217.
Hudson, S.E. 266.
Hughes, J.F. 12.
Hutton, M.D. 167.
Hynd, J. 240.
Idicula, P.J. 36.
Italiano, G.F. 280.
Ja’Ja’, J. 270.
Jablonowski, D. 185.
Jansen, V. 255.
Jayakumar, R. 60, 61, 149.
Johnson, D.S. 11, 37, 38, 39, 289.
Jones, S. 106.
Junger, M. 66.
Jurgensen, H. 150.
Kajitani, Y. 76.
Kamada, T. 31, 45, 46, 47, 48.
Kameda T. 214.
Kant, G. 62, 107, 108, 109, 135, 138, 143, 146.
Kao, M.Y. 275, 276.
Kar, G. 248.
Kashiwabara, T. 200.
Kaufmann, M. 310.
Kawai, S. 45, 47.
Kelly, D. 161, 163.
Kelly, D. 204, 241.
Kirkpatrick, D.G. 130.
Kiyokane, Y. 246.
Klein, P.N. 272.
Knuth, D.E. 225.
Koike, H. 233.
Kosac, C. 295, 296.
Koustofios, E. 186, 263.
Kramer, M.R. 40.
Kramlich, D. 226.
Krull, F.N. 223.
Kruskal, J.B. 51
Kumar, A. 221.
Laborde, J.M. 257.
Laborie, M. 222.
Lai, W. 283.
Las Vergnas, M. 124.
Lee, D.T. 123.
Lehman, J. 226, 227.
Leighton, F.T. 121, 310.
Leiserson, C.E. 4, 292.
Lempel, A. 80, 215.
40

Lenhart, W. 217.
Lin, T. 27, 28.
Lin, X. 27, 28, 187, 190, 192, 199.
Liotta, G. 114, 138, 169, 258, 260.
Lipton, R. 42.
Liu, W.P. 166.
Loewer, J. 150.
Lubiw, A. 167.
Luccio, F. 123, 129.
Lueker, G. 82.
Lyons, K. 284.
Mackinlay, J.D. 286, 297.
Madden, B.P. 248.
Maestrini, P. 123.
Majewski, M.A. 223.
Makinen, E. 54, 205, 206, 209, 210, 291.
Malitz, S. 308.
Manning, J. 32, 98, 99, 100, 101.
Mannino, C. 169, 170.
Marchetti, F.E. 213.
Marek-Sadowska, M. 56.
Marks, J. 295, 296, 298, 299.
Masuda, S. 200.
Mateti, P. 305.
May, M. 181, 208.
Mazzone, S. 129.
McHugh, J.A. 8
McKay, B. 201.
McKee, R. 227.
de Mendez, P.O. 139.
Mendonca, C.X. 68.
Mengersen, I. 70.
Mennecke, P. 181.
Messinger, E. 182, 183, 193.
Meyer, C. 182.
Meyers, S. 253.
Meyniel, H. 124.
Mezzalira, L. 67.
Miller, G.L. 271.
Miller, M. 217.
Miller, Z. 41.
Miriyala, K. 282.
Misra, A. 221.
Misue, K. 283, 306.
Moen, S. 281.
Moran, A. 106.
Mostue, B.M. 236.
Murtagh, T.P. 194.
Murty, U. 1.
Mutzel, P. 66.
Naggar, P. 244.
Nagl, M. 237.
Nakajima, K. 200.
Nakamura, K. 246.
Nardelli, E. 58, 72, 197, 198, 232, 242, 244, 304.
Newbery, F.J. 211, 247, 249, 250, 285.
Nievergelt, J. 5.
Nishioka, I. 57.
Nishizeki, I. 10, 84, 92, 93.
North, S.C. 42, 184, 186, 263.
Nummenmaa, J. 134, 229.
Onoguchi, K. 93.
Orlin. J.B. 41.
Osthof, H.G. 95.
Otten, R.H.J.M. 132.
Ozawa, T. 59, 84, 142.
Pach, J. 102, 103.
Papakostas, A. 308.
Pato, J. 251.
Payne, T.H. 105.
Pelc, A. 152, 153, 154, 157.
Pietrosanti, E. 224.
Piperno, A. 25.
Platt, C. 162.
Pnueli, A. 215.
Pollack, R. 102, 103.
Pollak, H.O. 289.
Potthoff, A. 255.
Preparata, F.P. 13.
Protsko, L.B. 265.
Rademacher, H. 88.
Raghavachari, B. 275, 276.
Ramachandran, V. 268, 269.
Rappaport, D. 217.
Read, R. 97, 245.
Reggiani, M.G. 213.
Reif, J.H. 268, 269, 271, 272.
Reiner, D. 226, 227, 228.
41
Reingold, E. 5, 20, 24, 49.
Reiss, S. 251, 252, 253, 287.
Rheingans, P. 227.
Richard, J. 234.
Richelli, G. 244.
Rival, I. 151, 152, 153, 154, 157, 158, 159, 160, 161, 166.
Rivest, R.L. 4.
Robertson, G.G. 286.
Robins, G. 195.
Rosenstiehl, P. 16, 74, 83, 133, 139, 261.
Rosenthal, A. 226, 227.
Rowe, L.A. 182, 193.
Rudich, A. 288.
Sack, J.-R. 277.
Sahni, S. 3, 144.
Saint-Paul, A. 222.
Sandberg, J. 42.
Santucci, G. 259.
Sarkar, M. 238.
Savage, J.E. 196.
Schaefer, D.A. 265.
Schlag, M. 123.
Schnyder, W. 104.
Seery, J.B. 51
Shamos, M.I. 13.
Shannon, A. 18.
Shannon, G. 254.
Sherlekar, D. 293.
Shieber, S. 296.
Shiloach, Y. 110.
Shirakawa, I. 57.
Shor, P. 219.
Simon, J. 270.
Simvonis, T. 310.
Skiena, S., 264
Smart, J.C. 262.
Sorenson, P.G. 265.
Sotteau, D. 235.
Spencer, T.H. 280.
Spirakis, C. 182.
Steadman, J.P. 147.
Stein, S.K. 87.
Steinitz, E. 88.
Storer, J.A. 115.
Strani, M. 258.
Sugiyama, K. 176, 177, 178, 188, 191, 212, 283, 306.
Supowit, K. 24.
Suzuki, T. 246.
Swaminathan, V. 221.
Swamy, M.N.S. 60, 61, 149.
Sweet, R.E. 17.
Szkatula, K. 208.
Tagawa, S. 176.
Takahashi, H. 59, 76.
Takvorian, A. 65.
Talamo, M. 58, 72, 230, 242.
Tallot, D. 234.
Tamassia, R. 14, 15, 16, 26, 72, 73, 106, 113, 116, 117,119, 120, 122, 127, 128, 136, 137, 138, 148, 164,170, 171, 172, 173, 174, 175, 199, 220, 224, 230,231, 232, 242, 243, 244, 259, 273, 274, 278, 279,282, 302, 112.
Tarjan, R.E. 9, 55, 77, 78, 81, 133.
Tarui, Y. 246.
Thomas, W. 255.
Thomassen, C. 91, 125, 165.
Thulasiraman, K. 60, 61, 149.
Tichy, W.F. 247, 250.
Tilford, J. 20, 21.
Toda, M. 176, 177.
Tollis, I.G. 116, 117, 119, 120, 127, 128, 136, 137, 138,148, 172, 173, 174, 175, 224, 278.
Tremblay, J.P. 265.
Trickey, H. 75, 121.
Tuan, A. 182.
Tunkelang, D. 52.
Tuomi, J. 229.
Tutte, W.T. 89, 90.
Urrutia, J. 153.
Valiant, L. 111.
van Dam, A. 12.
Van Hentenryck, P. 302.
van Leeuwen, J. 40.
van Wijk, J.G. 132.
Vargiu, F. 114, 258.
Vaucher, J. 19.
Vemuri, V. 262.
Vijayan, G. 118, 307.
Vismara, L. 309.
42

Vitter, J.S. 119, 120, 273, 274.
Vo, K.P. 184, 186, 263.
Wagner, K. 85.
Walker II, J.Q. 22.
Ward, N. 106.
Warfield, J. 203.
Watanabe, H. 53.
Welzl, E. 310.
Wermuth, U. 255.
Wetherell, C. 18.
Whitesides, S. 217.
Wigderson, A. 118.
Wille, R. 151.
Wismath, S. 126, 130.
Woeginger, G. 310.
Wong, C.K. 123, 129.
Wood, D. 23.
Woods, D. 141.
Wormald, N. 96, 201, 202.
Yamanouchi, T. 92.
Yannakakis, M. 216.
Zernik, D. 288.
Zischler, H. 237.
Zodik, G. 288.
43
![AR CRO Sylvia Crowe collection - University of Reading · [landuse, landscape and geology plan], Tyneham Valley, Dorset Drawn by: LK Drawing type: annotated plan Drawing scale: 6](https://img.pdfslide.net/doc/110x75/6002ddef9be1e04dc8213360/ar-cro-sylvia-crowe-collection-university-of-reading-landuse-landscape-and-geology.jpg)