Embed Size (px)
Citation preview

Aligning Public-Private Partnership Contracts
with Public Objectives for Transportation Infrastructure
Martha E. Gross
Dissertation
Submitted to the Faculty of the Virginia Polytechnic Institute and State University in partial fulfillment of the requirements for the degree of
Doctor of Philosophy
in
Civil Engineering
Committee:
Michael J. Garvin, Chair Gary R. Allen
Gerardo W. Flintsch Raman Kumar
August 18, 2010
Blacksburg, Virginia
Keywords: public-private partnerships, procurement, transportation policy, toll roads, qualitative comparative analysis
© 2010 Martha Gross


Aligning Public-Private Partnership Contracts
with Public Objectives for Transportation Infrastructure
Martha E. Gross
Abstract
With its central role in the development of public-private partnership (PPP) contracts, procurement
structure has a significant influence on the economic and policy success of privately-financed toll
roads throughout their lifecycle. Following a review of PPP fundamentals and the public-policy
differentiation between public interest and public objectives, several approaches for establishing
the key contract strategies of toll pricing, concession length, and risk mitigation are explored.
These underpinnings motivate the central research question: Given specific policy objectives
for road pricing, how should public owners select PPP contract strategies which support these
outcomes?
Through qualitative comparative analysis (QCA), a recently-developed method for evaluating
qualitative data quantitatively, patterns of PPP contract strategies which correspond to three
common policy objectives—achieving a specific toll rate, managing congestion, and minimizing
state subsidy/maximizing revenue—are identified through evaluation of 18 domestic and inter-
national projects. Three practical decision-making tools resulting from this work are illustrated
through application to current PPP procurements: (1) a traffic-risk worksheet, which provides
a rapid estimate of a toll-financed project’s viability; (2) analytical QCA results, which offer
guidance for structuring PPP contracts based on the desired pricing objectives; and (3) case-
library comparisons, which enable drawing parallels between proposed procurements and
established PPP projects. Additional insights explore the nature of risk in this study, which
concludes with thoughts on the appropriate role of PPPs in infrastructure delivery.


iii
ACKNOWLEDGEMENTS
“No man is an island,” wrote the poet John Donne in 1624, succinctly illustrating individuals’
reliance on each other. Likewise, the aid of countless supporters has been vital throughout my
journey toward developing this document. Although space permits highlighting only a few by
name, each one’s contributions are deeply appreciated, and I hope to pass similar assistance
along to many others in the future.
Drs. Francis X. “Buddy” Watson and R. Edward Minchin deserve special mention: without their
early mentoring and guidance, I would not have embarked on the unlikely transition from testing
concrete on construction sites to undertaking doctoral studies in public-private partnerships.
I owe particular gratitude to the Via Department of Civil and Environmental Engineering, the
Myers-Lawson School of Construction, and the National Science Foundation for their generous
support of my studies at Virginia Tech over these past three years.
During my journey up the PhD mountain, I am thankful to have met Dr. Raymond E. Levitt,
whose timely suggestion to consider qualitative comparative analysis as a research approach
provided a crucial breakthrough in the development of this work.
Not only have my committee and particularly my advisor, Dr. Michael J. Garvin, been a pleasure
to work with throughout this endeavor, but their guidance has made this document much stronger
and more practical. My friends and colleagues, especially those in the “Garvin Research Group,”
have been a greatly-appreciated cheering section along the way.
Finally, very few graduate students are blessed with a family as supportive as mine. Although
anything I write here is inadequate to express my gratitude, I offer them nonetheless a heartfelt
thank you.

iv
This work was funded by grant CMMI-0629260 from the National Science Foundation, whose
support is gratefully acknowledged. Any opinions, findings, conclusions, or recommendations
expressed in this paper are those of the writer and do not necessarily reflect the views of the
National Science Foundation.

v
TABLE OF CONTENTS
List of Figures ............................................................................................................................... ix
List of Tables ................................................................................................................................. x
Chapter 1 Introduction ........................................................................................................... 1
1.1. Infrastructure Funding: The Historical Context ...................................................... 1
1.2. Private Involvement in Infrastructure Provision ..................................................... 3
1.3. PPP Contract Structures .......................................................................................... 4
1.3.1. Project Types .......................................................................................... 5
1.3.2. Revenue-Transfer Mechanisms .............................................................. 6
1.4. Sector Choice and Risk Assessment ....................................................................... 8
1.5. PPP Contracts and Public Interest ......................................................................... 10
1.5.1. Separating Public Objectives and Contract Structure ......................... 11
1.5.2. Structuring Contracts to Achieve Public Objectives ............................ 13
1.6. Research Pursuit.................................................................................................... 14
Chapter 2 PPP Contract Strategies ..................................................................................... 17
2.1. Toll Pricing Approaches ....................................................................................... 17
2.1.1. Price as PPP Competition Factor ........................................................ 17
2.1.2. Rate-Adjustment Mechanisms .............................................................. 19
2.2. Economic Underpinning of Road Pricing ............................................................. 21
2.2.1. Average Cost Pricing (Maintenance-Cost Models) ............................. 22
2.2.2. Marginal Social Cost Pricing (Congestion-Cost Models) ................... 23
2.2.3. Revenue-Maximizing Pricing ............................................................... 24
2.3. Economic Theory: Monopoly Pricing .................................................................. 25
2.4. Concession Length Approaches ............................................................................ 27
2.4.1. Contract-Length Considerations .......................................................... 27
2.4.2. Duration as PPP Competition Factor .................................................. 29
2.4.3. Variable-Length Concessions ............................................................... 30
2.5. Summary ............................................................................................................... 32
Chapter 3 Research Methodology ...................................................................................... 33
3.1. Selection of Research Method .............................................................................. 34

vi
3.2. Application of Qualitative Comparative Analysis ................................................ 37
3.2.1. Identifying Outcomes of Interest .......................................................... 38
3.2.2. Selecting Cases ..................................................................................... 40
3.2.3. Selecting Conditions ............................................................................. 42
3.2.4. Assigning Values to Conditions and Outcomes .................................... 44
3.2.5. Constructing and Reviewing the Data Table ....................................... 46
3.2.6. Analysis, Interpretation, and Refinement ............................................. 46
3.2.7. Application ........................................................................................... 48
3.3. Special Discussion of RISK Condition ................................................................. 48
3.3.1. Project Settings ..................................................................................... 49
3.3.2. Traffic Risk Index ................................................................................. 50
Chapter 4 Analysis and Results ........................................................................................... 53
4.1. Data Collection and Conditioning ........................................................................ 53
4.2. Internal Validity Testing ....................................................................................... 58
4.2.1. Intermediate QCA Tests ....................................................................... 58
4.2.2. Inter-Rater Reliability Test ................................................................... 61
4.3. Minimization of the Data Table ............................................................................ 62
4.4. Results ................................................................................................................... 64
4.4.1. TOLLRATE Outcome: Achieving Specific Toll Levels ......................... 64
4.4.2. FREEFLOW Outcome: Maximizing Throughput ................................. 65
4.4.3. MINMAX Outcome: Minimizing Subsidy or Maximizing Revenue ...... 66
4.5. Descriptive Metrics and Sensitivity Analysis ....................................................... 67
4.5.1. Descriptive Metrics .............................................................................. 67
4.5.2. Sensitivity Analysis ............................................................................... 69
4.6. Interpretation ......................................................................................................... 73
4.6.1. TOLLRATE Outcome: Achieving Specific Toll Levels ......................... 73
4.6.2. FREEFLOW Outcome: Maximizing Throughput ................................. 74
4.6.3. MINMAX Outcome: Minimizing Subsidy or Maximizing Revenue ...... 75
Chapter 5 Applications for Policy and Practice ................................................................ 77
5.1. Traffic-Risk Worksheet ........................................................................................ 77
5.1.1. Route 460 Project History .................................................................... 77
5.1.2. Risk Score ............................................................................................. 79

vii
5.2. Application of QCA Guidance for Structuring Procurements .............................. 81
5.2.1. Midtown Tunnel Project History .......................................................... 81
5.2.2. Identification of Pricing Objective ....................................................... 83
5.2.3. QCA Recommendations for Contract Structure ................................... 84
5.3. Comparison with Similar Projects from QCA Case Library ................................ 86
5.3.1. QCA Configuration: New Route 460 Procurement .............................. 87
5.3.2. Case-Library Comparison .................................................................... 87
5.3.3. Epilogue: Addendum to Route 460 Procurement ................................. 89
Chapter 6 Discussion............................................................................................................. 91
6.1. Further Outcome-Specific Observations............................................................... 91
6.1.1. MINMAX Outcome: Minimizing Subsidy or Maximizing Revenue ...... 91
6.1.2. FREEFLOW Outcome: Maximizing Throughput ................................. 92
6.1.3. TOLLRATE Outcome: Achieving Specific Toll Levels ......................... 94
6.2. Review and Comparison of Risk Scores ............................................................... 94
6.2.1. Outcome Trends in Risk Scores ............................................................ 94
6.2.2. Chronological Trends in Risk Scores ................................................... 95
6.2.3. Geographic Trends in Risk Scores ....................................................... 96
6.3. General Observations on PPP Risk ....................................................................... 97
6.3.1. Renegotiation and Contingency Reduction .......................................... 97
6.3.2. Distinguishing Demand Risk and Project Risk .................................. 100
6.3.3. Practical Application of Modified Traffic-Risk Worksheet ................ 102
Chapter 7 Conclusion ......................................................................................................... 105
7.1. Summary of Contributions .................................................................................. 105
7.2. Limitations of Study ........................................................................................... 106
7.3. Directions for Future Work ................................................................................. 107
7.4. Implications for Policy and Practice ................................................................... 107
7.5. Final Thoughts .................................................................................................... 108
References .................................................................................................................................. 111
Appendix A Survey of PPP Literature .................................................................................. 115
Appendix B Rubric for Assigning QCA Values ................................................................... 141
Appendix C Case Summaries ................................................................................................ 149
Appendix D Risk Worksheets ................................................................................................ 169
Appendix E Software Output ................................................................................................ 189


ix
LIST OF FIGURES
Figure 2-1: Chicago Skyway Toll Escalation .............................................................................. 21
Figure 3-1: Spectrum of Research Methods ................................................................................ 35
Figure 3-2: Comparison of QCA Methods .................................................................................. 36
Figure 3-3: Research Structure .................................................................................................... 37
Figure 3-4: Sample Configuration Table with QCA Nomenclature ............................................ 38
Figure 4-1: Map of Case-Study Locations ................................................................................... 54
Figure 4-2: Distribution of Project Risk Scores ........................................................................... 57
Figure 4-3: RISK Thresholds for Sensitivity Analysis ................................................................ 69
Figure 4-4: Manual Selection of Prime Implicants ...................................................................... 76
Figure 5-1: Route 460 Location Map ........................................................................................... 78
Figure 5-2: Route 460 Procurement Timeline ............................................................................. 78
Figure 5-3: Midtown Tunnel Location Map ................................................................................ 82
Figure 5-4: Midtown Tunnel Procurement Timeline ................................................................... 83
Figure 6-1: Distribution of Risk Scores by Outcome .................................................................. 95
Figure 6-2: Distribution of Risk Scores by Year ......................................................................... 96
Figure 6-3: Distribution of Risk Scores by Region ..................................................................... 97
Figure 6-4: Contingency Reduction upon Renegotiation .......................................................... 100
Figure 6-5: One Interpretation of Traffic Risk .......................................................................... 101
Figure 6-6: Another Interpretation of Traffic Risk .................................................................... 102

x
LIST OF TABLES
Table 2-1: Toll Establishment and Adjustment Strategies .......................................................... 20
Table 3-1: mvQCA Variables (Conditions and Outcome) and Values ........................................ 45
Table 3-2: Standard & Poor’s Traffic Risk Index ........................................................................ 51
Table 3-3: Risk Worksheet with Modified Traffic Risk Index .................................................... 52
Table 4-1: Overview of Project Cases ......................................................................................... 55
Table 4-2: QCA Raw Data Table ................................................................................................. 56
Table 4-3: Preliminary QCA Configuration Table ...................................................................... 57
Table 4-4: Final QCA Configuration Table ................................................................................. 60
Table 4-5: Analysis of TOLLRATE = 1 (without remainders) ................................................... 65
Table 4-6: Analysis of TOLLRATE = 1 (with remainders) ........................................................ 65
Table 4-7: Analysis of FREEFLOW = 1 (without remainders) ................................................... 66
Table 4-8: Analysis of FREEFLOW = 1 (with remainders) ........................................................ 66
Table 4-9: Analysis of MINMAX = 1 (without remainders) ....................................................... 66
Table 4-10: Analysis of MINMAX = 1 (with remainders) .......................................................... 66
Table 4-11: Revised Analysis of TOLLRATE = 1 (without remainders) ................................... 70
Table 4-12: Revised Analysis of TOLLRATE = 1 (without remainders) ................................... 72
Table 5-1: Risk Worksheet for Route 460 ................................................................................... 80
Table 5-2: QCA Configurations for Route 460 Procurements .................................................... 87
Table 6-1: MINMAX Outcome Sorted by Risk Score ................................................................ 92
Table 6-2: FREEFLOW Outcome Sorted by Risk Score ............................................................ 93
Table 6-3: TOLLRATE Outcome Sorted by Risk Score ............................................................. 94
Table 6-4: Experience-Dependent Risk Factors and Scores ........................................................ 98
Table 6-5: Excerpt from Risk Worksheet with Modified Traffic Risk Index ............................ 103

Chapter 1 1
Chapter 1 INTRODUCTION
Public-private partnerships (PPPs) in transportation have garnered much attention as a potential
solution to critical infrastructure funding shortfalls (Grimsey and Lewis 2004). Yet the function
of these contracts is not simply to provide or maintain facilities, but to do so in a manner which
accommodates a diverse array of stakeholder objectives. That this latter function is often more
challenging than the former is evidenced by recent PPP procurements which have experienced
considerable public opposition, been restructured or cancelled prior to award, or required
subsequent renegotiation of contract terms (Garvin and Bosso 2008).
What factors influence a PPP’s success or failure in meeting stakeholder goals? To identify the
procurement design as a key element seems unremarkably obvious, but a closer examination of
the sometimes-conflicting objectives underlying a toll-facility procurement reveals the complex
interaction of a contract’s decision components—such as pricing strategies, length, and risk/
reward allocation—with external factors such as user demand. Identifying which patterns of
these elements support specific objectives is the focus of this study, whose motivation and
approach are outlined in this opening chapter.
1.1. Infrastructure Funding: The Historical Context
Transportation, and with it the requirement to construct and maintain public roads, is among the
earliest concepts of civilization. The primary sources of funding to support this infrastructure
have traditionally been taxes and tolls: Sharp et al. (1986) noted the history of road tolls dates
back to pre-Christian times. In Britain, the 1285 Statute of Westminster and the 1555 Highways
Act regulated the upkeep of public roads, with the latter act securing the necessary resources by
requiring several days’ labor annually from local residents—a form of taxation (Levinson 2005).
But Adam Smith (1776), in his writings on transportation infrastructure, questioned the propriety
of funding roads through taxes on the general population:

2 Introduction
It does not seem necessary that the expense of those public works should be defrayed from [taxes].1 The greater part of such public works may easily be so managed as to afford a particular revenue sufficient for defraying their own expense, without bringing any burden upon the general revenue of the society. A highway, a bridge, a navigable canal, for example, may in most cases be both made and maintained by a small toll upon the carriages which make use of them.
Smith noted an advantage of funding infrastructure via tolls rather than taxes is that tolls, being
dependent on user demand, efficiently stimulate construction of transportation facilities only in
locations and only to the extent that users are willing to support. Tax-supported infrastructure,
on the other hand, is equally viable whether built in locations of greater or lesser benefit.
Although fuel taxes are more directly related to transportation facilities than are general taxes,
Gramlich (1994) observed tolls are still a more economically efficient means of infrastructure
funding: direct user fees impact only those who use a roadway, while fuel taxes also burden
those who do not cause wear and tear to the facility. Vickrey (1963) noted tolls, unlike taxes,
can also be used as a tool for managing traffic congestion, a concept whose implications are
examined in greater detail below.
Recognizing some roads cannot be sustained by tolls, though, Smith noted such infrastructure
is best provided and maintained by regional governments, so that local residents can receive the
benefit of the taxes they pay to support these roadways. Even though these charges are levied
on some who may not use the facility, such residents still benefit indirectly from the lower cost
of goods enabled by the existence of the local road.
In US history, both tolls and taxes have been used extensively for supporting transportation
infrastructure. In the early twentieth century, many major roads were built and maintained by
state turnpike authorities, which recovered their costs through tolls on these facilities. Such
construction largely ceased when the 1956 Federal Aid Highway Act established the toll-free
interstate highway system, which was 90% funded by federal grants from fuel-tax revenues.
1 In the original: “that public revenue, as it is commonly called, of which the collection and application is in most countries assigned to the executive power.”

Chapter 1 3
Although tolls are common for long-distance highways in some countries (e.g., Japan and Chile),
this concept was not adopted in the US. According to Sharp et al. (1986):
[T]he network concept makes it inappropriate to charge for the use of specific links in the system. The aim is to foster a national market for goods within a spatially integrated market. More pragmatically, the Clay Committee, which examined road finance in 1955, explicitly rejected tolls for the interstate system, because it estimated that some 10 to 20 percent of the mileage would not meet financial evaluation criteria and thus “toll financing on a sound financial basis” would meet only a portion of the requirement.
With the expansion of the fuel-tax-funded interstate highway network, motorists’ perception
of the link between tolls and infrastructure support lessened. Those limited facilities which
continue to maintain tolls face constant pressure to defer rate increases or to remove these
charges altogether, even as inflation continuously decreases the real value of fees collected.
Fuel taxes, generally levied at a constant nominal rate per gallon, are experiencing similar
erosion in their purchasing power, while recent increases in vehicles’ fuel efficiency
simultaneously decrease the revenues raised through per-gallon taxes.
Despite these economic considerations and historical choices of taxes and tolls, private-sector
involvement in infrastructure provision is not inherently dependent on a particular funding
mechanism, as discussed by Fayard (2005). Nevertheless, a toll system is admittedly more
conducive to and efficient for private financing, since the collection and allocation of user fees
can be administered entirely by the private party. Taxes, on the other hand, must be levied and
disbursed by the state, adding a further layer of coordination for private infrastructure financing.
1.2. Private Involvement in Infrastructure Provision
Private finance of transportation infrastructure in the US is not a recent development. As early
as the 1790’s, individual citizens had successfully petitioned the government for franchises to
construct and toll frontier roads and river crossings. Land grants were issued in the 1850’s to
encourage privately-operated railroads in the Midwest, and even New York’s 1890’s subway
construction resembled a modern-day public-private partnership (Garvin 2007).

4 Introduction
Along with the growth of the interstate highway system, post-WWII legislation steered new
infrastructure projects increasingly toward the separately-phased design-bid-build procurement
method, which effectively decoupled finance and construction, and this model was used almost
exclusively for delivery of transportation facilities over the next half century. Not until the late
1980’s and early 1990’s did private involvement in infrastructure finance resume, with state
legislation in California and Virginia permitting experimentation with early forms of PPPs
which bundled finance, design, and construction into a single contract.
Around the same time, a series of economic reforms in the UK led to the 1992 establishment
of the country’s Private Finance Initiative (PFI), which laid the foundation for a wide range of
PPPs for infrastructure including schools, hospitals, highways, and utilities. Although the PFI
program was initially motivated by concerns about the government’s ability to fund infrastruc-
ture improvements, the program subsequently shifted its focus to the benefits of improved risk
allocation and operational efficiency (Sawyer 2005). PFI implementation expanded rapidly,
and by 2007, the Urban Land Institute (2007) estimated 16 percent of the UK’s infrastructure
expenditures involved PPP delivery. Commonwealth countries such as Australia, Canada, and
New Zealand developed their own private infrastructure-finance programs in parallel with or in
close succession to the UK’s efforts.
Other recent developments in private transportation finance include advances in Spain, where
simple toll-road PPPs were first implemented in the 1960’s (Albalate and Bel 2009) and
significantly influenced the subsequent expansion of this procurement method in continental
Europe. In the early 1990’s, Chile pioneered the delivery of privately-financed transportation
facilities in South America (Vassallo and Sánchez-Soliño 2006).
1.3. PPP Contract Structures
This confluence of road-tolling history with the modern-day resurgence of private infrastructure
finance has given rise to a wide array of contract structures grouped together under the PPP
heading. A brief review of terminology and common project types helps provide context for
the subsequent discussion.

Chapter 1 5
The almost-continuous spectrum of PPP procurement forms may be categorized by the nature of
the financing arrangements, level of new construction required, and/or type of facility involved.
Frequently PPPs are also characterized by the mechanism through which the private sector
receives revenue for its services: user fees, public-sector payments, or hybrids of these two.
1.3.1. Project Types
The term PPP is often construed to cover a broad array of innovative contracting and finance
strategies, including A+B (price-plus-duration) design-bid-build procurements, design-build
contracting, and developer-financed projects. For this study, greenfield PPPs are defined more
narrowly in accordance with the US Department of Transportation’s description of DBFO
(design-build-finance-operate) procurements, under which “the private sector is responsible for
all or a major part of project financing as well as facility design, construction, operation, and
maintenance. Typically the facility reverts to the State after 25+ years. Revenues to the private
sector can come from direct user charges, payments from the public sector, or both” (USDOT
2004). Brownfield projects, or operating leases of existing facilities, involve little new
construction but are also a common form of PPPs. Contractual considerations differ significantly
for greenfield and brownfield projects, with the former requiring recovery of construction costs
and often involving significant demand uncertainties, while the latter generally entail neither.
Although the PPP procurement model is used for a wide variety of infrastructure projects,
including hospitals, schools, and prisons, this study focuses on PPPs for tolled transportation
facilities. Debande (2002) notes several fundamental differences between transportation projects
and those in other sectors: “(i) the magnitude of the construction and operation risks (market
risks, limited ability for transferring of operational risk to specialized subcontractors given their
limited number, and revenue stability depending on the toll road mechanisms); (ii) the structure
of the payment mechanism; (iii) the potential for mitigating operational risks; and (iv) the
existence of exclusivity rights for the use of the asset.”

6 Introduction
1.3.2. Revenue-Transfer Mechanisms
The primary mechanisms for compensating the private sector for its role in infrastructure
provision include direct tolls, availability payments, and shadow tolls. Each of these methods,
as well as hybrids, may be used for both greenfield and brownfield projects.
1.3.2.1. Direct Tolls (Market Risk)
Under the direct-toll model, which in the US is used almost exclusively, facility operators charge
drivers a fee for each vehicle’s use of the roadway. Although concessionaires plan for a certain
level of revenue from these tolls, they typically bear the market risk that actual traffic levels may
fail to meet initial forecasts. With the historical difficulty of accurately predicting greenfield
traffic demand, the private sector includes large contingencies to cover market risk in such
projects.
Market-risk tolls also have demand-side effects which can be structured to promote more
efficient use of available roadway capacity. Due to tolls’ direct impact on users, some drivers
prefer to avoid the tolled facility and choose less costly neighboring routes, even if these road-
ways are lengthier or more congested. The higher the toll rate, the greater this level of diversion.
Transportation planners have taken account of this behavior in developing congestion-pricing
schemes, which raise toll rates in particularly congested areas during peak-usage periods to
encourage drivers to distribute their trips more evenly throughout the day. Systems for real-time
variable tolling—which continuously monitor congestion levels and adjust toll rates accordingly
to promote free flow of traffic—are in their early stages in the US. The I-495 HOT Lanes
concession in northern Virginia presents one example of this strategy.
1.3.2.2. Public-Sector Payments
Instead of providing revenue solely from user fees, a PPP arrangement may compensate the
private sector through direct payments from the state. This compensation structure can take
multiple forms, the most common of which are availability payments and shadow tolls.
Although these contract types (if not also coupled with direct tolls) are not the focus of this
study, their structure is outlined here for completeness’ sake.

Chapter 1 7
Under the availability-payment model, concessionaires receive their revenue through periodic
transfers from the public sector. These payments’ base level and duration are negotiated as part
of the contract terms, and amounts are reduced for any deficiencies in agreed-upon operating
standards, such as timely pothole repair or debris removal. Availability payments are generally
independent of the number of vehicles using the facility, though they may sometimes be indexed
for unexpectedly heavy traffic volumes. The state may or may not impose a toll on the facility.
The FHWA (2007b) notes several advantages of the availability-payment model:
– It creates an incentive for timely completion of project construction (since payments
do not begin until the facility opens);
– It provides an incentive for continued high operating and maintenance standards; and
– It lowers the concessionaire’s cost of capital by eliminating traffic risk.
Though availability-payment PPPs are more common abroad, Florida is pioneering this model
in the US with a variety of toll structures. The Port of Miami Tunnel, for instance, will not
be tolled: the concessionaire will receive monthly payments over a 30-year term after facility
opening, with deductions for not meeting specified performance and service criteria. In contrast,
the I-595 improvements in southern Florida will incorporate reversible express lanes tolled with
variable congestion pricing; the state will retain the toll revenues throughout the 30-year
concession and provide availability payments to the developer. In these projects, though, the
concessionaire assumes a measure of appropriations risk, since these disbursements must be
approved annually by the state legislature.
A second state-administered option for revenue transfer, shadow tolls, is frequently used for
international transportation projects but has not yet been applied in the US. Under this model,
which is in some ways a hybrid of the previous two, the public owner provides the concession-
aire a fixed fee (potentially reduced for service deficiencies) per vehicle which uses the facility.
No diversion or congestion-pricing considerations arise, since drivers are not charged directly.
“This eliminates the need to install tolling equipment and collect tolls directly from the users of
the facility, while encouraging the concession team to operate and preserve the highway at high
performance standards to ensure the availability and use of the roadway” (FHWA 2007a).

8 Introduction
Spain’s PPP program illustrates simultaneous use of the direct-toll and state-administered
revenue-transfer options. Of the country’s 4300 km of national highways, 3800 km are direct-
tolled, with the remainder shadow-tolled. Shadow tolls are used only when the government
anticipates a facility’s traffic volumes will not be high enough to yield sufficient compensation
for the private developer. Portugal similarly favors direct tolling but sometimes applies a hybrid
scheme combining the two approaches when expected traffic levels are low (FHWA 2009).
1.4. Sector Choice and Risk Assessment
Given this variety of contract structures, owners face increasing complexity in evaluating
private-finance alternatives as options in their capital-budgeting decisions. Even before the
question is posed about which type of PPP to use, though, a more fundamental issue is whether
to use one at all. Overshadowing the details of individual PPP delivery methods is the matter of
whether the public or the private sector ultimately delivers greater lifecycle value in developing
and operating a transportation facility.
Among the key determinants in answering this question is risk allocation: if one of these parties
is better suited to manage risks which influence concession value, this advantage is appropriately
recognized in considering the assignment of a project to one sector or the other. These risks
include a broad range of potential issues ranging from the procurement phase (e.g., political or
financial-market instability) to the construction phase (e.g., discovery of hazardous materials or
unexpected subsurface conditions) to the operations phase (e.g., lower-than-anticipated demand
for a facility or changes in project-relevant legislation). A summary of literature addressing such
risk-related issues is presented in Appendix A (Box 5: Risk Management).
A common adage is that project risks should be allocated to the party best able to manage them:
superior ability to mitigate certain risks may give one party a competitive advantage over the
other. To provide a tool to convert these risks into up-front costs, the Value for Money (VFM)
analysis was developed to quantify the public and private sectors’ risk-management capabilities.
Typically the analysis is coupled with evaluation of the Public Sector Comparator (PSC), a
hypothetical present-value equivalent of the public owner’s cost to provide and operate a facility.
The PSC “represents the most efficient public procurement cost.... This benchmark is used as the

Chapter 1 9
baseline for assessing the potential value for money of private party bids in projects” (Canada
2003). A “shadow bid” reflecting private-sector costs is also developed for comparison in order
to identify the higher-value provider, and PPP delivery is selected only if the private-sector cost
is favorable.
PSC values depend on variables including capital and operations expenditures, discount rates,
annual escalation, transaction costs, and taxes. The resulting amount is only one component of
the VFM analysis, which also considers qualitative factors such as service quality and broader
social goals. The analysis also adjusts for analysts’ tendency toward excessive optimism due to
neglecting unlikely or ill-defined risks (UK 2007).
Although the VFM approach is widely used in the UK and Commonwealth countries, Russell
and Nelms (2006) identify several weaknesses of such PSC comparisons. Most serious is their
difficulty in accurately assessing the private sector’s measurement and pricing of risk, which can
differ widely from the public sector’s perceptions. This deficiency can limit the practical value
of VFM analysis for sector-choice decisions.
Nevertheless, efforts to convert risks into up-front costs can still indicate which party is better
positioned to manage these uncertainties. Under the Australian approach, for instance, PPP risks
are assigned to the private sector unless it is specifically determined they should be retained by
the government (Australia 2006). The analysis can also help identify third-party options for risk
transfer: “Many risks which are transferred from the public sector to the private sector under PPP
deals are potentially insurable. The availability of insurance should be a consideration when risk
allocation is being negotiated” (Canada 2003).
Quantifying the cost of such risks can have other implications. It may be, for instance, that the
state cannot afford the resulting project-cost increase of assigning certain risks to the private
sector, and thus must retain exposure to risks which it would not otherwise have kept. Alter-
nately, a project may no longer be financially feasible once its risk costs become explicit upon
assignment to the private sector. With demand risk as one of a project’s potentially most costly
unknowns, the US PPP market is beginning to re-examine its traditional assignment of this risk

10 Introduction
to the private sector, as evidenced for instance by the 2008 award of the country’s first
availability-payment concession, Florida’s I-595 express lanes.
1.5. PPP Contracts and Public Interest
Once the decision is made to involve the private sector in a facility’s financing and development,
the PPP contract’s treatment of risk is key in determining the distribution of potential project
profits between the state and concessionaire. Given this importance of risk-allocation decisions
and a growing awareness of their long-term impact, strategies for safeguarding public interests in
PPP contracts are a common topic in the literature, with selected contributions summarized in
Appendix A (Box 8: Public-Sector Considerations).
Many of these authors treat “public interest” as a concept which needs no definition, regarding it
broadly as that which promotes the general welfare, or considering it synonymous with public
policy. Yet there is benefit in considering public interest more specifically and in recognizing
two distinct facets of the term: one which represents its public-policy aspects, and another which
corresponds to universal best practices for public procurement.
The public-policy goals for a PPP often vary depending on an administration’s priorities, while
best practices for procurement and capital programming remain constant. This latter component
includes principles of proper value, transparency, appropriate competition and selection criteria,
risk allocation, use of proceeds, and so on (Miller et al. 2000). With these static elements being
crucial to any successful contract, some PPPs have failed (either financially or from a public-
perception standpoint) because they did not comply with these principles. An example is the
2008 operating lease of Chicago’s parking meters, a publicly-reviled procurement which the
city’s inspector general censured for inadequate transparency and asset valuation.2
Yet the satisfaction of public-policy objectives, in addition to procurement principles, is an
equally vital requirement for successful transportation PPPs. These objectives are the concrete
2 “Report of Inspector General’s Findings and Recommendations: an Analysis of the Lease of the City’s Parking Meters,” City of Chicago, June 2, 2009.

Chapter 1 11
aims that an owner intends to achieve through a project; as such, they do not represent a static
goal or single ideal which one optimal contract structure can satisfy. Rather, the public-policy
objectives which may be addressed, particularly through toll pricing of an infrastructure project,
are numerous and often contradictory. For instance, the state may have a genuine interest in both
maximum revenue and maximum vehicular throughput on a new tolled roadway, yet for practical
purposes these goals are inherently in conflict and are difficult to satisfy simultaneously. Other
public-sector objectives may include minimizing exposure to traffic risk or limiting the prospect
of private-sector “super-profits”; an owner may target one or more of these policy outcomes in a
specific procurement.
This distinction between static public interests and dynamic public objectives is crucial to this
study’s central research question, which recognizes differing policy objectives require differing
PPP contract structures to ensure these goals are satisfied.
1.5.1. Separating Public Objectives and Contract Structure
In this context, one challenge in studying public objectives for PPPs is the frequent temptation
to evaluate the contract structure independently from the motivating policy, as illustrated in the
well-intentioned debates over PPP concession length (a primary element of contract structure)
and its impact on the public interest. Given the typical profitability of PPP toll facilities in their
steady-state phase, some authors question the propriety of allowing concessionaires to reap
decades of potentially generous returns at minimal risk, noting such returns could be more
appropriately collected by public agencies and re-invested in other infrastructure needs. Other
observers highlight a related concern about the state’s loss of control of its revenue-producing
assets for extended periods. Though frequently couched in language of “public interest,” such
issues of concession length are more specifically ones of public-policy objectives.
One example is provided by the 99-year operating lease of the Chicago Skyway in 2005 to a
private operator for a $1.83 billion up-front payment. Due to the concession’s lengthy term and
aggressive toll-escalation structure, the contract was criticized for failing to protect the public
interest (PIRG 2009). But since Chicago’s goal for the procurement had been to raise cash for
municipal needs (Bel and Foote 2009), this PPP was correspondingly structured to attain the

12 Introduction
highest up-front fee for the city. Bel and Foote calculated that, all other factors and growth
assumptions being equal, the same concession with only a 23-year term would have yielded 58%
of the 99-year amount, a payment of $1.06 billion. Further, a 23-year concession coupled with
more moderate toll and traffic growth would have yielded only $446 million, or 24% of the
achieved amount. Whether the city’s goal of revenue maximization was ultimately “in the public
interest” is a question which primarily involves Chicago’s public-policy objectives, not the
procurement’s structure. The concession’s length and toll-escalation rates, having been tailored
to meet the city’s goals, were simply a consequence of policy decisions which would perhaps
have been a more appropriate subject for critics’ attention.
Other public-interest concerns raised in conjunction with long-term concessions are also more
specifically policy issues, linked to the goals of a particular administration, rather than procure-
ment-related practices. Among these concerns is the application of proceeds gained through
“monetization” of an existing revenue-producing asset, such as the Chicago Skyway. Public
agencies may be tempted to use these substantial amounts for popular short-term needs: Chicago
programmed $100 million of the Skyway proceeds to support five years of social services such
as home heating assistance, children’s after-school activities, and Meals on Wheels.3 Such
decisions, in effect, incurred a debt to be paid off by future generations of Skyway users who
will see little benefit from the city’s earlier spending. Though such policy concerns indeed arise
as a result of funds provided by a long concession term, these issues are ultimately based on
public-sector priorities and are not caused by the PPP procurement structure itself.
An incomplete understanding of the public-interest distinction between policy issues and
procurement practices and structure can lead to excessive regulation. Targeting lengthy
concessions as a cause and not an effect, some state legislators have sought to restrict PPP
durations universally.4,5 But longer concession terms are not without benefits and may be a
3 “Skyway Lease a Good Deal for Chicago Residents, Daley Says,” Chicago mayor’s press office, Jan. 31, 2006. 4 Virginia General Assembly 2010, SB605 summary: Legislation “requires approval of the General Assembly before any lease for longer than 10 years or sale of the Virginia ports is permitted.” 5 Virginia General Assembly 2010, SB140 summary: “Any leases, concession agreements, or similar type of agreements...for a period longer than 20 years at a time are prohibited. Any such leases, concession agreements, or similar type of agreements under 20 years shall be approved by the Governor.” Neither SB140 nor SB605 passed.

Chapter 1 13
useful option to support certain policy goals. In addition to higher up-front revenues or reduced
state subsidies, greater PPP durations can also offer tax advantages and facility lifecycle-cost
benefits: an increased period of operational responsibility may incentivize an operator to provide
higher-quality improvements which last for a longer contract period. When policy objectives do
justify longer concession terms, contracts can be structured to address concerns about potential
private-sector “super-profits”: Mayer (2007) recommends revenue-sharing arrangements in lieu
of strict limits on concessionaires’ upside benefit, since such caps can reduce private-sector
incentives for efficiency, a potential advantage of PPP delivery.
Ortiz and Buxbaum (2008) note additional public-policy issues which can be associated with
long concessions. Particularly in the US, where much of the public sector has limited experience
with the complex financial and legal elements of PPP contracts, they note state agencies may not
yet be sufficiently qualified to evaluate contract-structure options efficiently. In such a case,
longer concession terms could magnify the impact of any missteps in the procurement process.
1.5.2. Structuring Contracts to Achieve Public Objectives
These considerations clarify the distinctions between static best-practice procurement principles,
variable public-policy objectives, and the role of PPP contract structures in accommodating both.
Given the significance of policy outcomes in shaping procurements and the variety of possible
objectives, a valid question is how these goals are chosen. According to Benouaich (2007), this
selection, as well as the necessary arbitration among conflicting objectives, must be government
decisions. Although one might profitably study which public-policy outcomes the state should
favor under various conditions, such a focus is beyond the scope of this inquiry. The following
investigation seeks instead to probe which PPP contract strategies support specific objectives,
providing public-sector decision-makers a tool to identify those means which most efficiently
accomplish the desired ends.
This effective structuring of PPP contracts is not a straightforward matter. Unlike the Chicago
Skyway, which successfully achieved the city’s unpopular objective to obtain maximum revenue
from the procurement, other contracts have failed to realize their goals due to ineffective contract
strategies. Mexico’s 1989-1994 highway-concession program provides one example: a major

14 Introduction
objective of these PPP contracts was to transfer development costs for an aggressive highway-
expansion program to the private sector. Yet the state eventually assumed billions of dollars of
obligations by restructuring dozens of struggling concessions, largely due to ineffective contracts
which led to toll revenues being much lower than anticipated:
Instead of using objective demand criteria to determine toll levels, measures were selected with a view to minimizing the term of each concession. Relatively short concession periods were obtained by charging high fares to the users, disregarding the principles of economic efficiency. The average length of the 22 concessions granted during the first stage of the program was about 12 years, although extreme cases were also observed with terms of only 5 years. (Landa and Rogozinski 1998)
In the pursuit of structuring PPP contracts to achieve public-policy objectives, the question also
arises how private-sector interests are accommodated to enable “balancing public and private
interests.” In contrast to the public sector’s diverse objectives, the private sector can be
considered to have a single primary goal: to earn profits (Mayer 2007; Vining and Boardman
2008). This profit motive is not improper, but rather is a necessary incentive for promoting
business and innovation. Without an opportunity to achieve returns greater than costs, the
private sector will choose not to participate in contracts, whether PPPs or otherwise. Thus a
concessionaire’s voluntary decision to pursue a contract can be taken as implicit confirmation
that the concessionaire sees profit potential, and thus the achievement of its goal, in the project.
Given this relative homogeneity in private industry, this investigation focuses on the more
complex contract-structuring decisions necessary in the public sector. This emphasis is further
supported by owners’ dominant role in contract formation and their responsibility to tailor the
content of procurement documents to accomplish their specific aims. Among the contract
elements most effective in shaping PPPs to achieve such outcomes are these contracts’ pricing
and duration strategies, as explored further in the following chapter.
1.6. Research Pursuit
This preceding review lays the foundation for the central research question: Given specific
policy objectives for road pricing, how should public owners select PPP contract strategies
which support these outcomes?

Chapter 1 15
To investigate this question, the subsequent chapters are organized as follows:
Chapter 2 presents a detailed examination of contract strategies as tools in the toolbox for
shaping a PPP contract, or recipe ingredients for formulating contracts with specific objectives.
Pricing and duration approaches form two of the key building blocks for structuring a PPP toll-
road contract, and the practical and theoretical underpinnings of these strategies are described.
With this foundation, Chapter 3 introduces the research methodology. Because traditional
quantitative and qualitative methods both present significant challenges for an investigation of
this nature, a middle-ground approach is outlined. Qualitative comparative analysis, though
infrequently applied in construction research to date, combines elements of quantitative and
qualitative methods to offer a robust approach for probing the question above.
Chapter 4 details the analysis and results of this undertaking. Eighteen case studies, representing
domestic and international PPP procurements for tolled transportation facilities, are characterized
according to five contract strategies and three public objectives—achievement of a specific toll
rate, congestion management, and revenue maximization. Patterns of contract strategies which
support these objectives are identified, interpreted, and validated.
Chapter 5 demonstrates three practical tools resulting from this research by applying them to the
US Route 460 and Midtown Tunnel procurements in Virginia. A traffic demand risk worksheet
offers a summary assessment of a toll-financed project’s viability, while the previous chapter’s
research findings provide guidance for structuring PPP contracts with specific pricing objectives.
In addition, the 18 projects studied above are presented as a “case library,” enabling comparison
of these established PPPs with proposed procurements having similar analytical characteristics.
Chapter 6 discusses further thoughts based on this work. Patterns among case-study procure-
ments sharing the same public objectives are identified, as are geographical and chronological
trends in project risk characteristics. General observations on PPP risk also provide guidance
for interpreting traffic-demand risk and allocating contingency in renegotiation scenarios.

16 Introduction
In conclusion, Chapter 7 summarizes six major contributions of this research and presents
specific guidance for policy and practice, along with suggestions for future work.
The appendices include a compendium of nearly 450 PPP publications, categorized by topic, in
addition to case-study data and material supporting the method’s development and application.

Chapter 2 17
Chapter 2 PPP CONTRACT STRATEGIES
The elements of toll pricing and concession duration are key factors in structuring a PPP to meet
specific public objectives, and the practical approaches and theoretical underpinnings for these
contract strategies are examined below. Appendix A (Box 2: Contract Design) offers a summary
of resources which investigate these decision factors and their relationships in detail.
2.1. Toll Pricing Approaches
The decision factor of contract pricing can take several forms, depending on the type of project:
it may be a toll rate schedule for a greenfield concession, an up-front fee offered to the public
sector for a brownfield operating lease, or a proposed availability payment for either type of PPP.
All of these provide an objective evaluation factor for contract award, but the methods used to
specify these amounts vary considerably. These approaches are reviewed for the cases of
market-risk, availability-payment, and duration-dependent contracts.
2.1.1. Price as PPP Competition Factor
2.1.1.1. For Market-Risk Contracts
Competition by toll rate is one available scheme for awarding concessions, though it requires
a tightly defined scope (e.g., technical proposals meeting a specified level of qualifications) to
ensure proposers can be evaluated on an equal basis.
Yet Guasch (2004) observes from his experience with concessions in Latin America:
Tariffs [tolls] are “soft” anchors for concession awarding. They are vulnerable, because they constitute a parameter that, at least every so often, automatically appears at the table for modifications and review, even in the best of circum-stances, and at that opportunity if not before, it can be subject to modifications, compensation, and rent extraction. Tariff bids have the major disadvantage that the winning tariff will almost always be less than the long-run marginal cost of providing the service, and they are likely to be changed very quickly—mostly through renegotiation or review.
18 Contract Strategies
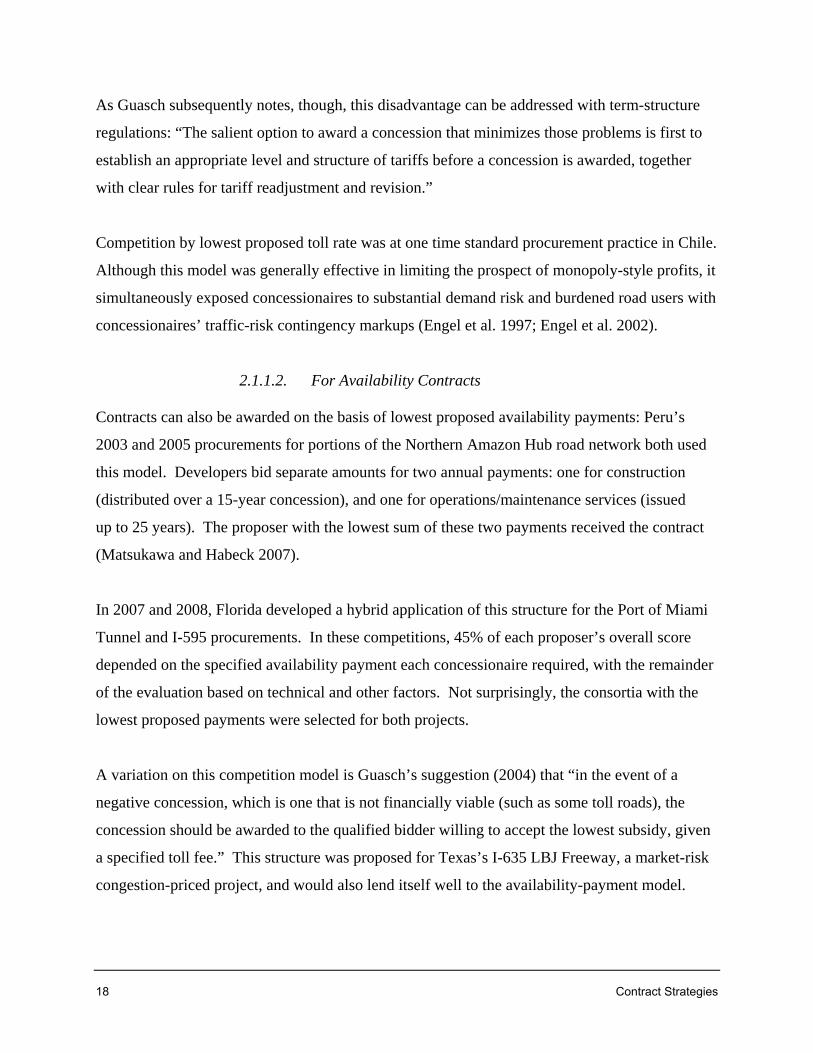
As Guasch subsequently notes, though, this disadvantage can be addressed with term-structure
regulations: “The salient option to award a concession that minimizes those problems is first to
establish an appropriate level and structure of tariffs before a concession is awarded, together
with clear rules for tariff readjustment and revision.”
Competition by lowest proposed toll rate was at one time standard procurement practice in Chile.
Although this model was generally effective in limiting the prospect of monopoly-style profits, it
simultaneously exposed concessionaires to substantial demand risk and burdened road users with
concessionaires’ traffic-risk contingency markups (Engel et al. 1997; Engel et al. 2002).
2.1.1.2. For Availability Contracts
Contracts can also be awarded on the basis of lowest proposed availability payments: Peru’s
2003 and 2005 procurements for portions of the Northern Amazon Hub road network both used
this model. Developers bid separate amounts for two annual payments: one for construction
(distributed over a 15-year concession), and one for operations/maintenance services (issued
up to 25 years). The proposer with the lowest sum of these two payments received the contract
(Matsukawa and Habeck 2007).
In 2007 and 2008, Florida developed a hybrid application of this structure for the Port of Miami
Tunnel and I-595 procurements. In these competitions, 45% of each proposer’s overall score
depended on the specified availability payment each concessionaire required, with the remainder
of the evaluation based on technical and other factors. Not surprisingly, the consortia with the
lowest proposed payments were selected for both projects.
A variation on this competition model is Guasch’s suggestion (2004) that “in the event of a
negative concession, which is one that is not financially viable (such as some toll roads), the
concession should be awarded to the qualified bidder willing to accept the lowest subsidy, given
a specified toll fee.” This structure was proposed for Texas’s I-635 LBJ Freeway, a market-risk
congestion-priced project, and would also lend itself well to the availability-payment model.

Chapter 2 19
2.1.1.3. For Duration-Dependent Contracts
Although the variable-length concession model typically involves the public sector selecting a
preferred value for toll rates and allowing the concession term to float, another option is to have
the concessionaire propose values for both items as bid variables.
One example is the 2004 concession for the EastLink highway and tunnels in Melbourne,
Australia. The procuring agency asked candidates to propose both toll rates and concession
term length as bid variables, and the agency then applied a public-sector-comparator approach
to determine the resultant value-for-money for each bidder’s package. Based on this analysis,
the contract was awarded to a concessionaire offering a low toll rate—in fact, the lowest per-
kilometer rate in Australia—in combination with a relatively lengthy 39-year concession term.
2.1.2. Rate-Adjustment Mechanisms
Most toll-based PPP competitions stipulate a particular mechanism for adjusting toll rates over
time, which can also influence a contract’s achievement of certain policy objectives. Table 2-1
illustrates a variety of structures specified in the US to set and adjust toll levels, showing little
consensus exists in establishing unified structures for this important contract parameter. Some
of these projects treat the gross domestic product (GDP) and the consumer price index (CPI,
or inflation) as interchangeable rates, for instance, even though these indices historically vary
significantly and are not necessarily related to a concessionaire’s cost growth for operating a toll
road. Escalating tolls by GDP typically results in higher rate increases than does CPI escalation.
The private sector can reap significant benefits from generous toll increases over long-term
concessions. As indicated in Figure 2-1, much of the value for the 99-year Chicago Skyway
lease accrued not so much from anticipated traffic growth but from aggressive toll increases. In
the first 12 years of this concession, the contract permitted doubling passenger-vehicle tolls from
$2.50 in 2005 to $5.00 in 2017, after which rates would increase by the greatest of GDP, CPI, or
2% annually. The tolls for seven-axle trucks more than tripled in the same 12-year timeframe.6
6 Chicago Skyway Concession and Lease Agreement (Schedule 6, Section 3: “Tolling Level Requirements”), Journal of the Proceedings of the City Council of the City of Chicago, Illinois, October 27, 2004, pp. 33532-6.

20 Contract Strategies
Project User Fee Structure
Dulles Greenway
User fees follow a predefined schedule of escalation through 2012, after which the concessionaire may escalate fees annually, upon request, at the consumer price index (CPI) rate plus 1%.
California AB 680 Program
Under a regulated rate-of-return model, concessionaire is to contribute receipts in excess of stipulated rate of return to debt principal balance or to state highway fund.
Chicago Skyway Concessionaire may raise user fees by the greater of the CPI or contractually-specified limits to increase toll from $2.50 to $5.00 by 2017. After 2017, annual increases are permitted at the rate of the CPI, nominal GDP per capita, or 2%, whichever is greatest.
Confederation Bridge
Initial user fees were set at the same rates as existing ferry services; concessionaire is subsequently permitted to escalate tolls at an annual rate not to exceed 75% of the CPI.
Highway 407 ETR
Phase I User fees specified by public owner.
Phase II
A market-based approach was established during peak travel periods with penalties for the concessionaire’s failure to balance throughput and the market price; a detailed schedule governs user fees in off-peak periods.
I-495 HOT Lanes
Variable tolling was specified to manage congestion. If concessionaire exceeds targeted equity internal rates of return, 5% to 30% of excess revenues will be shared with public owner.
Pocahontas Parkway
Phase I
A user-fee schedule was established for the first two years, after which the public owner held the right to adjust tolls subject to covenants in the bond indenture.
Phase II
A specific tolling schedule was defined in the agreement through 2016, after which the concessionaire may increase annual toll rates by the greater of the rise in GDP, the CPI, or 2.8%.
Table 2-1: Toll Establishment and Adjustment Strategies
(based on Garvin 2007)

Chapter 2 21
$-
$1.00
$2.00
$3.00
$4.00
$5.00
$6.00
$7.00
2005 2010 2015 2020 2025
Contract escalation (showing 2% growth af ter 2017)
2% annual growth (for comparison)
Figure 2-1: Chicago Skyway Toll Escalation
(from Chicago Skyway Concession and Lease Agreement)
These practical applications of toll pricing and escalation are based on an extensive body of
underlying economic theory which provides a more complete understanding of the motivation
for selecting specific toll structures. From the perspective of transportation economics, road
pricing and its relation to tolls are next considered, followed by an examination of monopoly-
pricing theories as applicable to brownfield concessions. A summary of literature in this field
is given in Appendix A (Box 7: Economic Elements).
2.2. Economic Underpinning of Road Pricing
Road-pricing structures can generally be classified as supply-based or demand-based. In the
former category are average-cost pricing models, which set user fees at a level just adequate
to cover a facility’s long-term average costs, including ongoing operations and maintenance
expenses (as well as capital expenditures, if not already recovered). These rates are typically
lower than those under marginal-social-cost and revenue-maximizing pricing models, which
fall into the demand-based category. In setting user fees, these two latter approaches take into

22 Contract Strategies
account the elasticity of user demand, often in relation to roadway congestion levels. The
following review examines fundamental economic principles underlying all three toll-rate
structures, along with their strengths and weaknesses in practical application, in the context of
concessions for which tolls are the private sector’s sole source of operational revenue.
2.2.1. Average Cost Pricing (Maintenance-Cost Models)
“...in no other major area are pricing practices so irrational, so out of date, and so conducive to
waste as in urban transportation,” wrote economist and later Nobel laureate William Vickrey in
1963. The issues surrounding average cost pricing—the seemingly logical establishment of toll
rates at levels exactly covering the economic cost of road provision—show Vickrey’s observa-
tion still has merit today.
From a theoretical standpoint, Sharp et al. (1986) agreed tolls for uncongested roadways should
generally be set equal to the facility’s operating costs but not include construction expenses,
since these higher rates would create economic distortions and artificially decrease demand for
the roadway. Ragazzi (2005) noted linking user fees to actual road costs (whether with or with-
out construction expenses) would contribute to an irrational patchwork of toll levels throughout
a country, as illustrated by the case of 24 highway concessionaires in Italy charging between 4.6
and 14 euro cents per kilometer. For a publicly-administered highway system, Oh et al. (2007)
countered this concern by calculating and proposing an average per-mile cost-recovery fee which
could be imposed state- or nationwide.
As these divergent perspectives indicate, implementing tolls for true average-cost pricing can be
difficult from a practical standpoint. One challenge lies in defining the span of time over which
long-term average costs are evaluated, thus determining which expenditures are incorporated in
the average. “Alligator Alley,” a 78-mile stretch of I-75 in Florida, for instance, requires only
26% of toll revenues for ongoing operations and maintenance, even though this roadway has (at
3.2¢ per mile) one of the lowest unit toll rates in the US (Samuel 2008). Although this road’s
toll might seem overpriced from a short-term perspective, consideration of a longer time span
would absorb periodic rehabilitation costs as well.

Chapter 2 23
Specifying a PPP concession length provides one definition for the long term over which to
measure average cost. Yet this economic cost includes not only tangible outlays for facility
operations and maintenance, but also an additional amount covering investors’ opportunity cost
of capital. Because this rate of return corresponds to the operator’s economic breakeven point,
average cost pricing for a PPP can be implemented under the structure of a regulated monopoly,
as outlined by Brown and Heal (1983). Under such a scenario, the facility’s pricing structure and
the operator’s permissible rate of return are specified such that long-term average costs are just
covered, giving the private sector the incentive to operate the roadway as efficiently as possible.
This scenario assumes average costs can be estimated with considerable certainty, indicating a
minimal level of risk. In practice, a regulated-monopoly implementation of average cost pricing
would likely include a higher rate of return than the pure opportunity cost of capital in order to
allow for a degree of risk and entice private-sector participation. Other monopoly and regulation
issues are explored further below.
2.2.2. Marginal Social Cost Pricing (Congestion-Cost Models)
Marginal social cost pricing, a demand-based fee structure, recognizes tolls’ ability to influence
traffic congestion and thus addresses a shortcoming of the average cost pricing model, whose
economic justification applies only to uncongested facilities. These congestion-cost models seek
to quantify overcrowded roadways’ economic costs, such as increased delay and pollution, and
to hold drivers accountable for these impacts through establishment of corresponding user fees.
Another perspective is that those who use a road during peak hours and cause it to be congested
are those driving the need for an eventual facility expansion, and therefore these road users (who
need the additional capacity) are appropriately charged to fund such upgrades. Because average
cost pricing recognizes only the relatively constant costs incurred by the facility operator, this
model is not suited to account for the varying environmental impacts imposed by road users.
Further, the fixed pricing inherent in average-cost schemes restricts tolls’ ability to influence
drivers’ behavior or help allocate limited capacity when demand for a roadway exceeds supply.
This relationship between tolls and traffic demand received little attention until the 1960’s; until
then, the standard solution for congestion had been constantly to increase capacity, primarily by

24 Contract Strategies
building additional roads (Thomson 1998). But the Smeed Report (UK 1964), a seminal
publication in transportation economics, proposed more efficient use of existing roadway
capacity by charging drivers for the impacts (or “marginal social costs”), particularly congestion,
which they imposed on their surrounding environment.
Because precise measurement of these costs, given the temporal and spatial variations in
congestion throughout a transport network, was prohibitively difficult, economists developed
numerous “second-best solutions” for road pricing. These studies sought to optimize social
benefits under various constraints on time-of-day variations, spatial tolling limits, or vehicle-
category differentiation (de Palma et al. 2005). Other authors (Chu and Tsai 2004; Newbery
1989) investigated the feasibility of combining the average-cost and marginal-cost pricing
approaches by considering operations and maintenance costs as a type of environmental impact
caused by driving. They proposed developing an optimal toll level by adding an average-cost
operations component to the previously-derived marginal social cost.
Although the Smeed Report authors recognized the systems of their day could not assess
continuously-variable user charges, more recent advances in tolling technology now enable
continuous monitoring of congestion levels and regulation of toll rates to influence driver
demand and promote free flow of traffic. This real-time adjustment of congestion-based tolls
approximates the constantly-changing marginal social cost of roadway usage. One mechanism
for setting these variable tolls is illustrated by the I-495 High Occupancy/Toll (HOT) Lanes
concession in northern Virginia, whose operator will monitor traffic speed and raise toll rates
when congestion decreases the express lanes’ average speed below 45 mph. Hence users with
inelastic demand can choose to pay a variable toll to drive on uncongested lanes, while drivers
with more elastic demand travel on the heavier-traffic lanes for free. The effectiveness of this
strategy awaits confirmation by northern Virginia drivers once the facility opens.
2.2.3. Revenue-Maximizing Pricing
Although revenue-maximizing pricing is also a demand-based tolling structure, it differs from
marginal social cost pricing by decoupling the link between tolls and congestion (or environ-
mental impact) levels. Rather, it estimates the levels of traffic demand for a specific transporta-

Chapter 2 25
tion network segment under various toll rates, then sets pricing for that roadway at the level
resulting in the highest overall toll revenue for the operator. These models predict the extent to
which tolls will divert travelers to less direct but less costly routes, based on the value of drivers’
time and vehicle operating costs, as well as the characteristics of these alternate routes (HRPDC
2005).
Except in the uncommon case when demand is perfectly elastic, Ubbels and Verhoef (2008) note
the revenue-maximizing toll necessarily exceeds the welfare-maximizing, or marginal social
cost, charge. The result, economically speaking, is an underutilized road with unused capacity.
Yet in some cases, public agencies choose to specify revenue-maximizing PPP procurements to
accommodate other goals. Even when public agencies prefer a throughput-maximizing pricing
structure, the revenue-maximizing toll calculations can still be used to determine the bounds of a
candidate PPP project’s financial feasibility.
As outlined above, the choice of toll structure is nevertheless a significant factor in concession
length determination: higher revenue conceptually allows the private sector to accept a shorter
lease term to recoup its investment. This tradeoff highlights one of the complex linkages
between the cost and time variables of PPP agreements.
2.3. Economic Theory: Monopoly Pricing
A second province of economic theory pertinent to evaluating PPP procurement strategies is the
body of knowledge related to monopolies. Although market constraints and public-interest
elements effectively restrict the formation of true economic monopolies for PPPs, the related
theory is helpful in understanding the forces which affect the competition and pricing aspects
relevant to awarding brownfield concessions.
Demsetz (1968) was among the first to explore the unique economic aspects of competition for
furnishing public-utility services, a market very similar to PPP operating leases for transportation
facilities. Although such competition is for the field in its entirety, rather than in the field, he
concluded the single winning firm nevertheless cannot employ monopoly pricing levels after a
properly structured competition. With increasing numbers of contestants, he noted, the winning

26 Contract Strategies
bid price approaches the cost of providing the service; and this natural competition reduces the
need for external regulation. Ponti (2005) explored the effect of such “Demsetz competition” on
roadway concession length. For operating leases which are periodically re-bid, he cautioned
long-term concessions can pose risks of information asymmetry and “capture” by the current
operator. D’Alpaos et al. (2006) further noted the private sector’s increased flexibility in
investment timing decisions enabled by longer lease terms can, but does not necessarily,
increase a concession’s up-front value.
If brownfield transportation concessions may be analyzed as a form of monopoly, then the
economic concepts of monopoly pricing can also be relevant in determining toll rates. The
Ramsey pricing model, sometimes termed Ramsey-Boiteux pricing, was developed in the 1920’s
“to identify the prices to be charged by a natural monopoly to maximize consumer welfare while
meeting revenue requirements” (Hartman et al. 1994). For a transportation (or any) monopoly,
though, these two pursuits are in conflict. Maximizing consumer welfare, the “first-best
solution,” would mean charging each user the concessionaire’s marginal cost of providing the
roadway; but since this marginal cost declines with each additional user, the concessionaire
would necessarily lose money under such a structure. Under a monopoly, on the other hand, the
concessionaire can maximize his revenue by setting toll levels in inverse proportion to users’
elasticity of demand. Ramsey pricing provides a “second-best solution” which balances these
two conflicting aims while permitting the concessionaire some specified level of profit. This
model thus incorporates elements of both the marginal-cost pricing and the revenue-maximizing
pricing approaches discussed above.
In practice, though, some economists dispute the efficacy of Ramsey pricing. Sheehan (1991)
and Hartman et al. (1994) point out the model does not account for the prospect of some users’
resulting avoidance of the monopolized facility altogether, such as by choosing alternate means
to accomplish their travel needs. Further, since brownfield toll rate schedules must be approved
by the roadway’s public owner, opportunities for concessionaires to establish a true monopoly in
the US market are negligible, limiting the practical need to develop applications of Ramsey
pricing. Other factors besides pricing also involve these potential issues of private-sector market
control, as examined in the following section.

Chapter 2 27
2.4. Concession Length Approaches
Unlike toll pricing, the contract strategy of concession length has a uniform meaning for both
greenfield and brownfield projects, though its implications vary substantially for these project
types. Following a review of contract-duration issues, this element’s role in structuring fixed-
length and variable-length concessions is examined. The discussion below limits its focus to
finite agreements, rather than contracts in perpetuity: although privately-owned facilities may
also offer a viable option for infrastructure delivery in some cases, they fall outside this study’s
definition of PPPs, whose facilities remain under public-sector ownership. A selection of
literature on this topic is categorized in Appendix A (Box 4: Contract Design).
2.4.1. Contract-Length Considerations
Greenfield and brownfield concessions have distinctly different sensitivities to the factor of
contract duration. For a greenfield project, several years after facility opening are necessary for
traffic levels to stabilize as drivers become accustomed to using a new roadway. This initial
“ramp-up period” entails considerable risk for concessionaires, since it reveals whether their
initial traffic forecasts—a core element of financial models—are accurate. Once traffic levels
reach this equilibrium phase, after which growth continues at a generally constant rate, the
concessionaire’s risk level decreases substantially, and the project is considered a mature
infrastructure investment which will yield stable, low-risk returns for the remainder of
the concession period.
For US greenfield concessions, contract terms typically range from 35 years (California’s
SR-125 South Bay Expressway) to 80 years (Virginia’s I-495 HOT Lanes). Although the bulk of
these long durations generally corresponds to the steady-state phase outlined above, predicting
with certainty the point at which a facility will reach this steady-state phase is nearly impossible.
Numerous examples exist of projects, such as Virginia’s Dulles Greenway, in which forecasted
traffic levels and growth rates were far too optimistic, forcing developers to carry facilities at a
loss until traffic eventually materialized or until the projects reached bankruptcy. Hence the
value to a concessionaire of a 75-year lease versus a 50-year lease, for example, lies primarily
not in the increased value of gross toll receipts over time, since the present value of the terminal

28 Contract Strategies
years’ revenue is negligible. Rather, developers favor longer greenfield concessions because the
additional time also provides a buffer to smooth out the historically-common problems with
traffic demand. The engineering literature has proposed various approaches, including fuzzy
simulation models (Ng et al. 2007) and Monte Carlo simulation (Zhang and AbouRizk 2006),
to manage these risks and develop optimal greenfield concession lengths.
Brownfield concessions, on the other hand, generally entail lesser revenue risk, since fairly
accurate demand forecasts can typically be developed from historical traffic counts at the
existing facility. One consideration which has influenced brownfield PPP lengths in the US is
the public sector’s interest in the higher up-front concession payments resulting from longer
terms. Longer durations also make these revenue-generating operating leases more attractive
as assets for investment and pension funds seeking stable long-range returns.
For both greenfield and brownfield contracts, Vassallo (2004) notes several procurement
disadvantages of long PPP durations: not only are traffic levels and technological improve-
ments difficult to forecast far in the future, but long concessions also increase the risk that a
concessionaire will effectively assume monopoly control of a facility. While Vassallo also
highlights potential drawbacks of short PPP terms, such as decreased incentive for the private
sector to invest in facility upkeep, he notes these issues can be largely contained with carefully-
written contract specifications.
One particular disadvantage of short-term greenfield concessions is the limited time available
to collect sufficient direct-toll revenue to cover facility construction costs. As one solution,
Vassallo (2004) presents the concept of a “reversion fee,” an amount paid to the developer at the
end of a concession to capture the difference between the private sector’s investments and the
facility’s remaining value. This amount may be specified by bidders as a competition factor up
front, or calculated at the end of the concession term based on pre-determined factors such as
actual traffic demand levels. The state can obtain funding for the reversion fee, if desired, by
subsequently soliciting bids for a follow-on brownfield concession for facility operation. Spain’s
first reversion-fee PPP, a 25-year contract, was awarded for construction of a new access road to
the Madrid airport in 2003.

Chapter 2 29
Relative to the 25- to 30-year PPP terms common internationally, US contract durations are
typically very long: most start at 50 years and range up to 75 or even 99 years. Due to features
of the US tax code, such length enables significant financial advantages for the private sector:
Another important consideration for having such long leases has to do with tax benefits. Chief among the federal tax benefits is accelerated depreciation. Although the lessee (concessionaire) is not the owner of the existing toll road, if the term of the lease exceeds the remaining design life of the asset at the time of the transaction, barring other countervailing factors, the IRS will treat the concessionaire as owner for tax purposes. Tax ownership qualifies the lessee to depreciate the portion of its upfront payment allocated to the tangible physical assets over 15 years for a highway, as opposed to the full term of the lease. ... Another portion of the upfront payment is allocated to the right to impose and collect tolls [an intangible asset]. This portion of payment is amortized over 15 years on a straight line basis. A third portion of the upfront payment may be treated as pre-paid rent that is amortized over the full term of the lease. (US House of Representatives 2007)
FHWA (2007c) further notes “IRS rules require [in] lease contracts of 50 years or more for the
lessee to be considered the effective operating owner, thereby granting the lessee the ability to
take depreciation tax credit against the value of the asset.” These tax advantages, which amount
to a federal subsidy of private infrastructure finance and thus are not a true social benefit (Small
2010), cannot be realized by the tax-exempt public sector. Goldman Sachs (2005) has estimated
such tax-depreciation benefits are worth 1.0 to 1.5% of a $1 billion infrastructure concession.
In addition to the above procurement issues involving concession length, there are also public-
policy aspects to the matter, as outlined in the preceding chapter. The next section considers
various award strategies which include contract duration as a PPP decision factor.
2.4.2. Duration as PPP Competition Factor
The possibility of using concession length as a proposal evaluation factor was employed in the
late 1980’s and early 1990’s in Mexico, “where the franchise procedure awarded concessions to
the firm that consented to build the road and operate it for the shortest period. The result was
highway tolls as high as $35. Because parallel (although congested) freeways were available,

30 Contract Strategies
the toll highways had little traffic. The government was pressured into bailing out the franchises
(and the banks that lent to them), at a cost of at least $8 billion” (Engel et al. 2002).
A different procurement strategy based on contract length is the two-period concession presented
by Ye and Tiong (2003). These procurements specify separate contract lengths for a project’s
construction and operations phases. If the construction work is completed early, the concession-
aire is typically permitted to retain any operational revenues collected before the formal start of
the operations phase; these funds can be shared with the contractor as an early-completion
incentive. Although this model provides a useful structure for containing PPP construction
delays, this issue has not been a significant problem in PPP procurements to date.
Another duration-based award strategy is linked to the steady-state nature of brownfield projects.
If a public agency wishes to retain greater control over a roadway’s operations at the tradeoff of
a lower up-front concession fee, it can specify shorter lease terms and re-bid the concession more
frequently, thus encouraging competition and limiting the possibility of long-term PPP monopoly
leases. Klein (1998) provides the illustration of Argentina’s mandatory re-bidding of electricity-
distribution concessions (analogous to brownfield transportation leases) after the first 15 years
and subsequently every ten years.
2.4.3. Variable-Length Concessions
A relatively new award strategy is the variable-length concession, which is significant enough
to merit a more detailed discussion. These contracts end when certain financial targets are met,
such as debt coverage, rate of return, or present value of revenues collected; and the primary
advantage of these contracts is the reduction of demand risk for both the public and private
sectors. This model is in increasing use in Europe and South America.
Among the first examples of a variable-length concession was the contract for the Queen
Elizabeth II toll bridge across the river Thames, which was awarded in 1993 for a “concession
period of 20 years or such earlier date as the Contractor accumulates sufficient revenue to exceed
the total debt outstanding” (Walsh 2003). In this case, high demand for the project enabled toll

Chapter 2 31
revenues to reach that level within ten years, though the developer’s recourse in the case of
abnormally low traffic demand was apparently minimal.
A common type of variable-length concession is the least present value of revenue (LPVR)
auction, which was first used in Chile. There the concession term for the Santiago-Valparaíso-
Viña del Mar toll road was limited to 300 months or the point at which toll revenues reached the
concessionaire’s pre-specified level, whichever occurred sooner. The project was awarded in
1998 to the bidder accepting the least present value of revenue, given a fixed toll structure and
discount rate (Matsukawa and Habeck 2007).
The variable-length LPVR structure is championed by Engel et al. (2002) for its elimination of
fixed concession lengths, which are inflexible to actual demand. A drawback of LPVR auctions,
though, is that they contain little incentive for concessionaires to maintain transportation
facilities (e.g., through expeditious pothole repair or snow removal) to minimize demand-
reducing deficiencies. Yet this issue can be addressed by contractually-stipulated maintenance
standards and inspections (Engel et al. 1997; Engel et al. 2001).
Guasch (2004) notes other disadvantages of the LPVR structure can include complications in
arranging financing due to the uncertain concession length, as well as the necessity for the public
and private parties to agree on an appropriate discount rate for LPVR calculation. De Rus and
Romero (2004) find LPVR pricing does not adequately account for operating costs which are
solely duration-dependent and not proportional to traffic demand (e.g., roadway lighting
expenses). They recommend the slightly modified least present value of net revenue (LPVNR)
model, with a separate bid variable for time-dependent costs, to address this concern.
Mayer (2007) observes these present-value-of-revenue contract structures are much simpler to
audit than the debt-based or IRR concessions. Further, an attractive public-policy consideration
is the relative ease with which the public sector can change toll rates if circumstances require,
since the target revenue total is not affected: the concession length automatically adjusts to the
new toll levels (Nombela and de Rus 2004).

32 Contract Strategies
Based in part on the success of the earlier LPVR contracts, Spain introduced a new concession
law in 2003 which allows modifications to contract durations as well as toll rates based on the
relation of the accumulated present value of revenue to pre-defined targets (Vassallo and Gallego
2005). Under these procurements, private-sector offers are evaluated based on the targets they
propose. Similarly, Portugal and the UK can adjust concession lengths when private-sector
revenues differ significantly from initial projections (FHWA 2008).
2.5. Summary
The above discussion both outlines the function of tolls and concession lengths in PPPs and
highlights the strengths and weaknesses of these strategies’ implementation in current practice.
This array of procurement structures provides an ample toolbox of strategies for aligning PPP
contracts to satisfy specific public objectives for road pricing. But because relationships among
these elements are often not superficially apparent, the following chapter details a research
approach for identifying patterns of contract strategies which meet these goals.

Chapter 3 33
Chapter 3 RESEARCH METHODOLOGY
The foregoing summary of contract strategies presented a wide variety of pricing and duration
options for structuring a PPP agreement, and combinations of these elements can be tailored to
support diverse public-policy goals as outlined in the opening chapter. Yet the potent role of
PPP contract variables in achieving these objectives is not universally understood. Over half
the state agencies surveyed in McGraw-Hill’s market report (2009), for instance, considered
“unacceptable profits by private entities at expense of users” as the largest single factor
negatively impacting the use of PPPs. Yet this possibility of excessive private-sector returns
can be effectively addressed through appropriate contract structuring, if this objective is
prioritized during procurement. To help clarify the relationship of these elements, the central
research question emerges: Given specific policy objectives for road pricing, how should public
owners select PPP contract strategies which support these outcomes?
Following a brief discussion of potential approaches for investigating this question, a research
design using qualitative comparative analysis is outlined. The method is explained and applied
to a selection of PPP procurements to identify patterns of contract strategies which correspond
with specific pricing-related outcomes. A subsequent application chapter illustrates several
helpful tools to assist decision-makers in applying these findings to policy and practice.
The use of these tools presumes the PPP delivery method has already been determined as the
most appropriate contracting form for a given infrastructure project. As cautioned by Miller
(2000), owners must consider the full range of project-delivery options in the planning process,
avoiding the temptation to pre-select a specific procurement strategy independent of a facility’s
characteristics and then forcing the project to fit that method.
The scope of the following investigation is expressly limited to direct-tolled transportation PPPs,
thus excluding shadow-tolled facilities and untolled availability-payment projects. The effect of
toll charges on drivers’ behavior is an important factor in influencing demand for PPP facilities,
which in turn affects the achievement of many public-policy objectives for these procurements.

34 Methodology
3.1. Selection of Research Method
Taylor et al. (2009) noted research in the construction industry often encounters methodological
challenges not present in many other fields. The magnitude and expense of large construction
ventures, such as those procured through PPPs, limits the number of projects available for
evaluation, and the resulting high-complexity, small-size data sets are difficult to investigate
meaningfully using experimental and quantitative methods. Although case-study and interview-
based research, on the other hand, can accommodate these issues by enabling analysis of small
sample sizes and complex relationships, extensive collection of case data is necessary to enable a
thorough understanding of the factors involved. For PPPs, though, such detailed project data are
often commercially sensitive and difficult to obtain. Further, qualitative approaches are also
susceptible to methodological challenges with rigor and replication, if not carefully applied.
An alternative for construction investigations is the middle-ground option provided by a family
of research methods collectively known as qualitative comparative analysis (QCA), which is
capable of analyzing both small and large populations. QCA shares aspects of both quantitative
and qualitative methods, as reflected by the method’s French name, Analyse Quali-Quantitative
Comparée. As with the case-study approach, QCA retains a contextual sensitivity to interactions
among variables, unlike statistical methods which analyze variables in isolation. Yet QCA also
incorporates the systematic analysis and fixed rules characteristic of quantitative methods, thus
adding rigor and strengthening its replicability and transparency. Due to its emphasis on case
histories and the researcher’s judgment at decision points throughout the process, QCA is
considered closer to the qualitative end of the research-methods spectrum (Figure 3-1).
QCA is a relatively new approach, first propounded by sociologist Charles Ragin in 1987, but its
principles have since been applied extensively, primarily in the fields of sociology and political
science but also in management and economics. Although construction researchers have not yet
made substantial use of this method, QCA is attractive for the current study because it relaxes the
constraints inherent in purely quantitative or qualitative approaches, as noted above, which
complicate the application of these methods to PPP research.

Chapter 3 35
Case
Studi
es
Statis
tical
Ana
lysis
Qua
litativ
eCom
para
tive
Analys
is
Figure 3-1: Spectrum of Research Methods
The subsequent choice among several variants of QCA depends on the research question and the
data available. Ragin’s initial formulation of QCA (now also termed crisp set QCA, or csQCA)
required the conversion of qualitative data into strictly dichotomous variables, with individual
characteristics quantified into binary categories as 1 (attribute is present/high) or 0 (absent/low)
values. Concerns about the resulting loss of information led to the subsequent development of
multi-value QCA (mvQCA) and fuzzy-set QCA (fsQCA) variants, which respectively accommo-
date stepped and continuous gradations of non-binary variables, such as cost and time. Each of
these approaches has domains for which it is best suited, as indicated in Figure 3-2.
In the current investigation, several of the proposed condition variables—presence or absence
of revenue-sharing, for instance—lend themselves well to the binary structure with minimal loss
of contextual information, making csQCA potentially an attractive option. Yet other variables,
such as economic pricing rationale, are more complex and cannot be labeled simply “present”
or “absent.” Consequently, mvQCA emerges as a suitable approach for this investigation, since
it also easily accommodates binary values where no further detail is needed. This accords with
Figure 3-2, which indicates mvQCA preserves greater richness in a data set than does strictly-
binary csQCA.
Figure 3-3 provides a summary of QCA’s application in this investigation, as described in the
following section.

36 Methodology
Low
Hig
hM
ediu
m
Siz
e o
f D
ata
Set
(N
um
ber
of
Cas
es)
Figure 3-2: Comparison of QCA Methods
from Herrmann and Cronqvist (2009)

Chapter 3 37
Pre
limin
ary
Inve
stig
atio
nR
esea
rch
Des
ign
Co
nd
itio
nin
gA
nal
ysis
Figure 3-3: Research Structure
3.2. Application of Qualitative Comparative Analysis
In summary, QCA involves identifying a specific outcome of interest, along with conditions
which are posited to affect that outcome. The conditions and outcomes for multiple cases are
quantified and tabulated, and patterns in the resulting data array are identified to highlight
combinations of conditions which support a given outcome.
The application of QCA involves numerous methodological considerations which are addressed
below in the context of the central research question. To illustrate the nomenclature used in this

38 Methodology
discussion, Figure 3-4 provides a sample data table labeled with these terms. For this study,
various pricing objectives serve as the QCA outcomes, while PPP contract strategies are the
conditions posited to influence these outcomes.
Objective: (A) (B) (C) (D) (E)
Minimize Public-SectorExposure to Traffic Risk
Pricing Approach
Concession Length
Upside Revenue Sharing
DownsideRisk Sharing
Revenue-Transfer
Mechanism
ObjectiveAchieved?
I-495 HOT Lanes (Virginia) 1 2 1 1 1 1
El Melon Tunnel (Chile) 2 1 0 0 1 1
I-595 Improvements (Florida) 1 1 0 0 0 0
Santiago Highway (Chile) 0 0 1 1 1 0
etc.
OutcomeConditions
Variables
Configuration
Figure 3-4: Sample Configuration Table with QCA Nomenclature
3.2.1. Identifying Outcomes of Interest
The first step of the QCA investigation, even prior to case selection, is to define the outcome(s)
under consideration. This step facilitates the selection of cases with sufficient representation of
each outcome, since the analysis will be less robust if the conditions and outcomes under study
exhibit little variation.
This characterization of outcomes is specifically limited to PPP objectives which are related to
pricing decisions. Other valid public goals may also be classified as policy objectives, such as
delivering facilities which integrate highway and transit, providing access to certain communi-
ties, or achieving specific maintenance or safety standards. But since these goals are, at best,
modestly related to toll-pricing elements, they cannot effectively be addressed with these
contract-strategy tools and are not evaluated here.

Chapter 3 39
Based on a review of academic literature, institutional documents, and individual projects, the
following initial set of public objectives for PPPs was identified:
– Minimizing state exposure to traffic risk – Minimizing state subsidy – Maximizing up-front revenue – Achieving a specific toll rate – Managing congestion
Closer evaluation of these five proposed QCA outcomes indicated the first entry, minimizing
state exposure to traffic risk, is not primarily a pricing-related objective. Though it can be influ-
enced by certain contract-structure variables (e.g., absence of downside risk-sharing provisions),
this outcome is much more directly controlled by larger-scale procurement decisions, such as the
selection of direct tolls instead of availability payments as a PPP’s revenue-transfer mechanism.
Further, this objective is ultimately more an effect than a cause: efforts to minimize traffic-risk
exposure typically support the more fundamental goal of containing a project’s impact on the
public budget—an objective which is even less affected by contract-specific pricing elements.
Based on these conclusions, this initial outcome was removed from further consideration.
Examination of the next two objectives, minimizing state subsidy and maximizing up-front
revenue, showed these two are not functionally independent of each other. Because both goals
pursue the most favorable result for the state’s budget, they incorporate the same contractual
strategy: to provide greater latitude in a PPP toll structure’s “degrees of freedom” to enable the
concessionaire to deliver the most advantageous financial offer. In essence, then, these two
outcomes differ only according to the relationship of a project’s cost to its anticipated toll
revenues, and they were accordingly combined for subsequent evaluation in this study.
The last two proposed objectives, achieving a specific toll rate and managing congestion, were
evaluated and found to be both pricing-related and functionally independent. The final list of
PPP objectives selected as QCA outcomes was thus as follows:
1. Achieving a specific toll rate
2. Managing congestion
3. Minimizing subsidy or maximizing revenue

40 Methodology
Most projects’ pricing goals intuitively fall into one of these three categories. For instance,
efforts to align the toll rates for a new river crossing with the previous level of charges for ferry
service would indicate the first objective above, while a concession awarded on the basis of the
highest up-front payment (such as the Chicago Skyway) would correspond to the third objective,
since this procurement approach rewards bidders who can implement a procurement’s intended
toll structure to generate the greatest possible revenue throughout the life of the contract.
To test the validity of this selection, the above outcomes were reviewed with senior public-sector
officials who have extensive experience in structuring PPP procurements. They concurred these
three objectives accurately characterized the public sector’s major pricing goals, noting that the
prioritization of these outcomes in practice was often challenging and could easily differ at the
federal, state, and local levels.
3.2.2. Selecting Cases
3.2.2.1. Type of Cases
In applying QCA, as noted above, identification of cases exhibiting the greatest possible variety
of configurations is desirable. Although the conscious selection of cases with certain conditions
and outcomes might appear to be an improper manipulation of the data set, this practice is
appropriate under QCA because the method’s logic is not probabilistic: that is, it does not
consider whether few or many cases exhibit certain characteristics. Of interest is rather the
existence at all of specific combinations of contract strategies and objectives. Hence, the
identification of cases exhibiting maximum heterogeneity of condition and outcome values
contributes to the richest possible explanations of relationships among the widest array of data.
3.2.2.2. Number of Cases
As indicated in Figure 3-2, different QCA variants are more suited to certain data-set sizes. In
the process of identifying patterns in the data table, the basic QCA algorithm supplements the
observed configurations with hypothetical cases (termed logical remainders) in order to fill
the data table with configurations representing absent combinations of variables. The greater
the number of conditions and possible values, the larger the data space which must be filled,

Chapter 3 41
whether by real or hypothetical cases. A csQCA analysis (whose variables can assume only the
binary values 0 or 1) involves 2n total such configurations, where n is the number of conditions.
For mvQCA, the calculation depends on the number of values possible for each condition: the
current study involves two three-value conditions and three two-value conditions, for example,
resulting in a data space with 3 × 3 × 2 × 2 × 2 = 72 possible configurations.
Logical remainders are not inherently objectionable, since it is infeasible or impossible to locate
cases exhibiting every possible configuration, and the QCA algorithm can produce robust results
even with large amounts of “empty data space.” Even so, these non-observed cases can contri-
bute to less concise explanations of data patterns, as Berg-Schlosser and De Meur (2009) note:
The number of possible logical combinations can quickly exceed the number of cases, and the empirically observed cases will occupy only a tiny proportion of the potential “logical space”...This is the limited diversity problem: the observed data are far less rich than the potential property space delineated by the conditions. ...In the extreme, only a description of the cases—of each separate case—will be obtained, rather than a genuine explanation. (p. 27)
These authors therefore recommend limiting the ratio between the number of conditions and the
number of cases. This caution agrees with Figure 3-2’s indication of larger data sets for mvQCA
and fsQCA studies, which entail larger data spaces due to the additional values permitted for
each condition. Although QCA literature avoids rigid definition of data-set sizes, authors have
variously suggested “intermediate-N” investigations lie within ranges such as 5-40 or 10-100
cases, with “small-N” and “large-N” data sets being those outside these limits (Berg-Schlosser
and De Meur 2009; Ragin and Rihoux 2004). For this study’s mvQCA application, the number
of cases falls into this intermediate-N range, which is appropriate for the number of conditions
selected (see next section). Further, the majority of the mvQCA condition variables selected
have binary values, thus also limiting the size of the analytical data space.
Another consideration in determining data-set size is the researcher’s ability to maintain close
knowledge of cases: “When pondering how many cases you can manage, ask yourself whether
you can gain sufficient familiarity (empirical ‘intimacy’) with each case” (Berg-Schlosser and
De Meur 2009). Though data collection for QCA investigations is not as detailed as for case-

42 Methodology
study analyses, this familiarity—the ability to “dialogue with the cases”—is crucial for selecting
explanatory conditions and operationalizing them meaningfully, as well as for identifying any
contextually-sensitive adjustments necessary for subsequent iteration.
This study initially identified 18 PPP cases, recognizing the number and identity of cases cannot
be rigidly fixed at the outset, since the data-analysis stage may indicate logical inconsistencies in
the resulting explanation which must be further probed, in some instances by iteratively adding
cases to the analysis.
3.2.3. Selecting Conditions
As noted above, conditions are the variables which distinguish one case from another—in this
study, the contract strategies for toll pricing and concession length. Careful consideration is
necessary for establishing both the number and identity of conditions in a QCA investigation.
3.2.3.1. Number of Conditions
Although there is no established method for determining an ideal number of QCA conditions, a
general principle is that more conditions add complexity to the logic model and can obscure the
identification and interpretation of the resulting patterns. Berg-Schlosser and De Meur (2009)
offer the following guidance:
A good balance must be reached between the number of cases and the number of condi-tions. The ideal balance is not a purely numerical one and will most of the time be found by trial and error. A common practice in an intermediate-N analysis (say, 10 to 40 cases) would be to select from 4 to 6-7 conditions.
Based on this guidance, five conditions are used in this investigation, which involves 18 cases.
The initial number of conditions may be adjusted during the analysis process.
3.2.3.2. Identity of Conditions
QCA literature has identified six strategies for selecting initial conditions (Amenta and Poulsen
1994; Yamasaki and Rihoux 2009):

Chapter 3 43
1. The comprehensive approach, where the full array of possible factors is considered in an iterative process
2. The perspective approach, where a set of conditions representing two or three theories are tested in the same model
3. The significance approach, where the conditions are selected on the basis of statistical significance criteria
4. The second look approach, where the researcher adds one or several conditions that are considered as important although dismissed in a previous analysis
5. The conjunctural approach, where conditions are selected based on joint interactions among theories which predict multiple causal combinations for a certain outcome
6. The inductive approach, where conditions are mostly selected on the basis of case knowledge and not on existing theories
This study applied the sixth approach, inductively selecting initial conditions based on prior
literature review and case investigations. As with the QCA outcomes, a preliminary list of
contract strategies posited to affect public-sector objectives for PPPs was first established:
– Pricing approach – Concession length – Revenue-transfer mechanism – Upside revenue-sharing – Downside risk-sharing – Existence of parallel facilities – Level of congestion – User tolerance for tolls
The first two conditions were well established in Chapter 2 as significant influences on pricing-
related PPP outcomes. But the third proposed QCA condition, the revenue-transfer mechanism,
presents an “apples and oranges” comparison: not only does it involve an earlier-stage contract-
structuring decision than the other conditions, but some of its values are not applicable to certain
values of other variables. For instance, shadow tolling (a revenue-transfer mechanism) and
marginal social cost pricing (a pricing approach) are mutually exclusive. For these reasons, this
study was restricted to direct-tolled projects, as noted above, and this proposed condition was
excluded from further consideration.

44 Methodology
The next entries on the list, revenue and risk sharing in the event of a contract’s over- or under-
performance, are clearly related to a contract’s pricing and duration variables; but since they
function independently of these decisions, they are appropriate for study as QCA conditions.
The final three elements, though, pose a challenge: each addresses a different but important
aspect of traffic-demand risk. Although this risk is an external factor in the project environment,
not a contract variable, it nevertheless has a substantial impact on PPP contract structure.
Further deliberation identified an approach (detailed in Section 3.3) for combining these three
elements into a single variable, which was included in the final group of QCA conditions:
1. Pricing approach
2. Concession length
3. Upside revenue-sharing
4. Downside risk-sharing
5. Traffic-demand risk
As with the QCA outcomes, this resulting list of conditions was reviewed with experienced
public-sector officials. They agreed these contract strategies, along with the risk environment,
are appropriate and highly significant factors influencing the achievement of PPP objectives.
In addition, they suggested a reasonable direction in which to expand the study could involve
considering specific internal-rate-of-return thresholds for upside revenue-sharing. Although such
an investigation would require more detailed contractual data than gathered in the current study,
it offers a worthwhile direction for future research.
3.2.4. Assigning Values to Conditions and Outcomes
Table 3-1 represents the final selection of variables for this study, along with the assignment of
values for each condition and outcome. Among the reasons the QCA approach is well suited for
this investigation is the clearly dichotomous nature of many of the conditions: revenue-sharing
provisions, for instance, are either present or absent in a PPP contract. Little information is lost
in converting these contract characteristics to binary values. As demonstrated here, mvQCA can
accommodate both binary and multi-valued variables simultaneously: the multi-valued PRICING
condition is also discrete and clearly defined.

Chapter 3 45
For continuous variables, such as LENGTH and RISK, careful attention (potentially including
sensitivity analysis) is necessary in specifying cutoff values to convert continuous data sets to
discrete values, since the choice of these thresholds can materially affect QCA results. The 50-
year threshold for dividing short and long concession lengths represents one such cutoff value,
substantively chosen due to the favored tax treatment of US concessions longer than 50 years.
The RISK traffic-demand variable, which represents a crucial incorporation of external project
factors influencing PPP demand risk, is addressed in detail in Section 3.3.
Conditions Variable
Name Meaning Value
Toll-rate approach PRICING Average cost pricing (ACP) 0
Marginal social-cost pricing (MSC) 1
Revenue-maximizing pricing (RMP) 2
Concession length LENGTH Variable length 0
Short concession (< 50 years) 1
Long concession (≥ 50 years) 2
Upside revenue sharing UPSIDE Absent 0
Present 1
Downside risk sharing DOWNSIDE Absent 0
Present 1
Traffic-demand risk RISK Low risk (Index = 1 to 2.2) 0
High risk (Index = 2.3 to 5.0) 1
Outcomes Variable
Name Meaning Value
Achieve specific toll rate? TOLLRATE No 0
Yes 1
Manage congestion? FREEFLOW No 0
Yes 1
Minimize subsidy or MINMAX No 0
maximize revenue? Yes 1
Table 3-1: mvQCA Variables (Conditions and Outcome) and Values

46 Methodology
3.2.5. Constructing and Reviewing the Data Table
Once the QCA outcomes, conditions, values, and cases are established, case data are tabulated
for each objective under study, resulting in a configuration table such as that shown previously
in Figure 3-4. (For csQCA studies with their binary variables, this same array is termed a truth
table.) Numerical values are assigned to the conditions and outcome for each case, according to
the classifications in Table 3-1. For outcomes, the zero value (“objective not achieved”) does
not indicate a failure of the PPP procurement represented or of its component contract strategies,
but rather serves as a neutral statement of fact that a certain outcome did not occur with the
strategies under consideration.
One logic issue which may become apparent at this point is that of contradictory
configurations—cases for which all condition values are identical, but whose outcomes are
different. Such cases must be addressed before proceeding with the analysis, for instance by
adding or replacing conditions, reconsidering the scope of the outcome variable, or examining
whether the conflicting cases should indeed be classed within the same population (Rihoux and
De Meur 2009). Such adjustments are not arbitrary trial-and-error manipulations, but rather
must be theoretically or empirically grounded.
Distilling appropriate outcomes, cases, and conditions into a data table is not an insignificant
milestone: “Analyzable truth tables are not the starting point of comparative research; rather,
they are formed near the end of a long process of case-oriented comparative investigation”
(Ragin and Rihoux 2004).
3.2.6. Analysis, Interpretation, and Refinement
Once a contradiction-free configuration table is established, the next step is to condense or
minimize the table to highlight patterns of conditions which correspond to the 0 and 1 outcomes.
Although this logic process can be performed manually, use of software such as Tosmana (Tool
for Small-N Analysis) is recommended. This program’s algorithm, which first isolates csQCA
or mvQCA configurations with the desired outcome and then seeks the most logically succinct

Chapter 3 47
combinations of conditions necessary and sufficient to produce that outcome, is explained in
detail by its developer Cronqvist (2007).
This minimization process is performed for each outcome, resulting in logical formulae which
summarize patterns in the data. A simple such pattern might be, “PPP Outcome 1 is observed
when Conditions 2 and 4 are present, or when Conditions 1 and 4 are present but 3 is absent.”
Such an expression is purely descriptive: it preserves maximum richness of the data set but does
not extend beyond the bounds of the existing data. For some purposes, these summaries may be
entirely appropriate.
It is possible, though, to obtain more concise expressions in subsequent iterations of the analysis
by generalizing the observed data to include simplifying assumptions. Based on case
knowledge, the researcher may consider which assumptions would be appropriate and include
logical remainders (non-observed cases) in the analysis along with the observed data. This step
typically results in a more succinct expression of data patterns and offers further insights into the
phenomena under study.
This step of adding hypothetical data to the analysis is not initially intuitive and merits additional
explanation. De Meur et al. (2009) characterize such generalization as a necessary element of
any research method:
To be qualified as “scientific,” research must go beyond the mere description of observed phenomena. It must contain a complementary step: inference, not in the narrow, statistical sense, but in its more general meaning—moving beyond observed data, to that which is not directly observed. ... Any generalization necessitates going beyond the observed cases and therefore—necessarily—the use of some form of non-observed cases. This is often done unconsciously or at least without being made explicit in many different types of research.
Ragin (1987) regards QCA’s explicit acknowledgement of such non-observed cases as a strength
of the method: “Direct consideration of combinations of causal conditions that do not exist in the
data...forces the investigator to confront the theoretical assumptions that permit more general
causal statements.” From the more immediate standpoint of data analysis, De Meur et al. (2009)
offer further reassurance: “Logical remainders that receive an outcome value and subsequently

48 Methodology
become simplifying assumptions are, structurally, never in contradiction with the observed
cases. In other words, the inclusion of the logical remainders does not change anything about
the properties of the empirical (observed) cases.”
With this guidance for targeted use of simplifying assumptions, the initial contract-strategy
patterns are generalized, as appropriate, into minimal formulae which represent the core of the
proposed decision-making support tool. These patterns “allow the researcher to ask more
focused ‘causal’ questions about ingredients and mechanisms producing (or not) an outcome
of interest, with an eye on both within-case narratives and cross-case patterns” (Rihoux and
De Meur 2009).
This process of analysis, interpretation, and refinement is repeated independently for each of
the policy outcomes under consideration. Although a traditional QCA application would also
involve repeating the full analysis for each zero outcome (“objective not achieved”) to identify
strategy patterns tending not to support each public-policy goal, the practical value of these
findings is limited, and the zero-outcome analysis is not performed in this instance.
3.2.7. Application
Not only does QCA yield generalized patterns of contract strategies which support certain
outcomes, but it also enables developing a data set or library of procurements corresponding to
each QCA configuration. Other PPP projects can be evaluated to establish their QCA condition
and outcome values, thus producing configurations of their own which can be compared to the
set of existing case studies. Further insights into these additional procurements can be gained
not only through the process of determining their QCA values, but also in comparing them to
“library projects” with similar configurations, yielding qualitative insights as to how the new
projects may develop. Such an application is demonstrated as part of this study.
3.3. Special Discussion of RISK Condition
Of the five condition variables in Table 3-1—Pricing, Length, Upside, Downside, and Risk—
the last one is unique in that it does not evaluate a PPP’s contractual aspects, but rather considers

Chapter 3 49
external characteristics influencing the project’s sensitivity to traffic-demand risk. As such, this
condition is more complex than the others, and further discussion is merited here.
3.3.1. Project Settings
Exploring PPP cases in the context of QCA’s application to the research question indicated that
not all projects respond the same way to the same contract strategies. Rather, procurements are
influenced by external characteristics which modify how they respond to various toll-pricing and
concession-length approaches. To provide a structure for accommodating these project-specific
characteristics, the concept of “project settings” was initially defined to measure PPPs according
to distinguishing factors, such as the following, identified from review of literature and practice:
Congestion level. This condition addresses whether a roadway typically experiences traffic
delays for some portion of the day. Since congestion indicates insufficient supply of
transportation capacity, it usually suggests a different set of pricing strategies than for an
uncongested facility.
Demand certainty. New facilities, such as greenfield PPPs, offer no historical data to estimate
traffic volumes and thus involve significant demand uncertainty. This often results in
large risk contingencies when developers’ revenues are based on direct tolls.
Parallel facilities. The presence or subsequent construction of a competing free road can
seriously impact the revenue of a toll facility.
Capital expenditures. Some PPPs require significant one-time capital outlays for construction
of new facilities, while other projects primarily involve costs only for routine operations
and maintenance.
User tolerance. In some cases, the toll rate which would otherwise be suitable for a road is
infeasible due to users’ inability or unwillingness to pay that fee level.
The initial plan envisioned separating the data set of PPP cases into numerous categories
representing different values of these project settings, then repeating the QCA procedure for each
of these values to characterize projects’ varying responses to contract strategies in these different
settings. Yet this plan not only complicated the analysis but also decreased the number of cases
available for each QCA iteration, reducing the robustness of the method’s results. To address
these issues, an alternate strategy for accommodating these differentiating factors was identified.

50 Methodology
3.3.2. Traffic Risk Index
Because all these above-listed elements are ultimately components of demand risk for a PPP
transportation facility, a single metric was proposed instead to accommodate the influence of
projects’ external characteristics on the performance of contract strategies. This metric, the
RISK variable in Table 3-1, is developed from a modified version of the Standard & Poor’s
traffic risk index: Table 3-2 illustrates the full index, and Table 3-3 represents the condensed
version used in this study. The original table was modified to omit decision options, such as
tolling strategies and traffic-survey approaches, in order to focus on facility-specific elements
(such as the above) which influence demand. The modified table also adds quantitative risk
scoring, as proposed by Bain (2009), with the equally-weighted average of each factor’s risk
level rounded to one decimal place yielding the overall demand-risk score for each PPP case.
The characterization of Table 3-3’s risk score as “low” or “high,” with the corresponding
assignment of the QCA condition variable RISK as 0 or 1, deserves further discussion. As
mentioned above, QCA results are sensitive to the threshold-setting strategy for continuous
variables such as this, and the development of an appropriate cutoff point between low-risk
and high-risk scores is discussed in the following chapter.

Chapter 3 51
Table 3-2: Standard & Poor’s Traffic Risk Index
from Bain (2009)
Project Attribute
0 1 2 3 4 5 6 7 8 9 10
Tolling regime
Shadow tolls User-paid tolls
Tolling culture
Toll roads well established: data on actual use are available
No toll roads in the country, uncertainty over toll acceptance
Tariff escalation
Flexible rate setting/escalation formula; no government approval
All tariff hikes require regulatory approval
Forecast horizon
Near-term forecasts required Long-term (30+ year) forecasts required
Toll facility Facility already open Facility at the very earliest stages of planning
details Estuarial crossings Dense, urban networks
Radial corridors into urban areas Ring roads/beltways around urban areas
Extension of existing road Greenfield site
Alignment: strong rationale (including tolling points and intersections)
Confused/unclear road objectives (not where people want to go)
Alignment: strong economics Alignment: strong politics
Clear understanding of future highway network Many options for network extensions exist
Stand-alone (single) facility Reliance on other, proposed highway improvements
Highly congested corridor Limited/no congestion
Few competing roads Many alternative routes
Clear competitive advantage Weak competitive advantage
Only highway competition Multi-modal competition
Good, high-capacity connectors Hurry up and wait
Surveys/data collection
“Active” competition protection (e.g., traffic calming, truck bans)
Autonomous authorities can do what they want
Easy to collect (laws exist) Difficult/dangerous to collect
Experienced surveyors No culture of data collection
Up to date Historical information
Locally calibrated parameters
Parameters imported from elsewhere (another country?)
Existing zone framework (widely used) Develop zone framework from scratch
Users: Clear market segment(s) Unclear market segments
private Few key origins and destinations Multiple origins and destinations
Dominated by single-journey purpose (e.g., commute, airport)
Multiple-journey purposes
High-income, time-sensitive market Average/low-income market
Tolls in line with existing facilities Tolls higher than the norm: extended ramp-up?
Simple toll structure
Complex toll structure (local discounts, frequent users, variable pricing, etc.)
Flat demand profile (time-of-day, day-of-week, etc.) Highly seasonal and/or “peaky” demand profile
Users: Fleet operator pays toll Owner-driver pays toll
commercial Clear time and operating cost savings Unclear competitive advantage
Simple route choice decision making Complicated route choice decision making
Strong compliance with weight restrictions Overloading of trucks is commonplace
Macro- Strong, stable, diversified local economy Weak/transitioning local/national economy
economics Strict land-use planning regime Weak planning controls/enforcement
Stable, predictable population growth
Population forecast dependent on many exogenous factors
Traffic growth
Driven by/correlated with existing, established, and predictable factors
Reliance on future factors, new developments, structural changes, etc.
High car ownership Low/growing car ownership

52 Methodology
Project Attribute
Traffic Risk Index Toll Facility
1 2 3 4 5 Risk
Score Comments
Tolling Culture
Toll roads well estab-lished: data on actual use are available
No toll roads in the country; uncertainty over toll acceptance
Toll Facility Details
Estuarial crossings; radial corridors into urban areas
Dense, urban networks; ring roads/beltways around urban areas
Extension/expansion of existing road
Greenfield site
Stand-alone (single) facility
Reliance on other, proposed highway improvements
Highly congested corridor
Limited/no congestion
Few competing roads Many alternative routes
Users High-income, time-sensitive market
Average/low-income market
Traffic Growth
Driven by/correlated with existing factors
Reliance on future growth factors, new developments, etc.
Sum of Risk Scores: ...
Average Risk Score: ... Low/High Risk
Table 3-3: Risk Worksheet with Modified Traffic Risk Index
based on Bain (2009)

Chapter 4 53
Chapter 4 ANALYSIS AND RESULTS
Building on the framework established in the previous chapter, the analysis now investigates the
relationship of contract strategies and public objectives based on patterns drawn from 18 cases.
These represent 16 projects, two of which were re-procured and thus were included in the data
set twice. They cover a wide array of PPP delivery strategies and span eight countries on four
continents, as shown in Figure 4-1.
The cases were limited to projects for which tolls were charged directly to users (excluding
shadow-toll and some availability-payment contracts) and for which the public sector targeted
at least one pricing-related outcome (excluding PPPs such as Canada’s Golden Ears Bridge, a
design-build-finance-operate contract in which the state retained revenue risk and emphasized a
functional outcome—providing a fixed link between two riverside communities—rather than a
pricing-related goal).
The analysis presented in this chapter was carried out using Tosmana software version 1.3, pro-
duced by mvQCA developer Lasse Cronqvist and available as freeware from www.tosmana.net.
4.1. Data Collection and Conditioning
Table 4-1 provides a brief overview of the 18 case studies. Additional detail is given in
Appendix C, which outlines each project’s background in relation to contract strategies and
includes a table of the corresponding values for each QCA condition variable. Although the
RISK variable for traffic demand is included in these summaries, its calculation is detailed
separately in Appendix D’s worksheets (see also Table 3-3) due to this variable’s complexity.
Table 3-1 describes the operationalization of the condition and outcome variables, linking their
numerical values with specific contract strategies and public objectives. The qualitative facts
representing case conditions and outcomes were converted to quantitative QCA values through
application of the rubrics in Appendix B.

54 Analysis and Results
Ro
ute
46
0(V
irgi
nia
)
I-4
95(V
irgin
ia)
SH
-12
1(T
exa
s)
San
tia
go
(Chi
le)
El
Me
lon
(Ch
ile)
Sky
e B
rid
ge
(UK
)
War
no
w T
un
nel
(Ger
ma
ny)
I-5
95(F
lorid
a)
Co
nfe
der
ati
on
Bri
dg
e (C
ana
da)
He
rre
n T
un
nel
(Ge
rman
y)4
07
ET
R(C
anad
a)
Cro
ss C
ity
T
un
ne
l(A
ust
ralia
)
Ta
gu
s
Cro
ssi
ng
(Por
tug
al)
M-1
2(S
pai
n)
SR
-91
(Ca
lifo
rnia
)
Ch
icag
o
Sky
wa
y(I
llin
ois)
Fig
ure
4-1
: M
ap o
f C
ase-
Stu
dy
Loc
atio
ns
pres
enta
tionm
agaz
ine.
com
(m
ap t
empl
ate)

Chapter 4 55
Project Location Year of
Contract ID Description
Route 460 Corridor Improvements
USA (Virginia)
-- ROUTE460 Proposed new highway with parallel free route; procurement terminated in 2010.
I-595 Express Lanes USA
(Florida) 2009 I-595
Tolled express lanes for congestion relief; first US PPP with availability payments.
I-495 Capital Beltway HOT Lanes
USA (Virginia)
2007 I-495 Tolled express lanes in median of congested Washington beltway.
Chicago Skyway USA
(Illinois) 2005 SKYWAY
Operating lease of elevated roadway; up-front payment and long concession term.
SR-91 Express Lanes
USA (California)
1990 SR91 Freeway project; profitable due to strong demand and was bought back by state.
SH-121 Managed Lanes
USA (Texas)
2007 SH121 Tolled express lanes planned to reduce congestion in Dallas-Fort Worth area.
Warnow Tunnel – first procurement
Germany 1996 WARNOW1 Germany’s first PPP; tunnel replaced ferry service across river.
Warnow Tunnel – renegotiated contract
Germany 2006 WARNOW2 Concession for above tunnel was lengthened due to low traffic demand.
Herren Tunnel Germany 1999 HERREN Germany’s second PPP; tunnel replaced bridge crossing, but with low demand.
Skye Bridge UK 1991 SKYE Bridge provided sole fixed link from UK mainland to lightly populated island.
Second Tagus Crossing
Portugal 1994 LISBON Additional bridge in downtown Lisbon provided congestion relief.
Autopista M-12 Spain 2003 MADRID Highway and tunnel enabled access to new airport terminal in Madrid.
El Melón Tunnel Chile 1993 ELMELON Chile’s first PPP; toll tunnel provided alternative to free mountain-pass route.
Santiago-Valparaíso-Viña del Mar Tollroad
Chile 1998 SANTIAGO Highway connecting major cities was first variable-length concession in Americas.
407 ETR – first procurement
Canada 1994 407ETR1 Highway for congestion relief in Toronto was developed with public financing.
407 ETR – second procurement
Canada 1999 407ETR2 Operating lease was granted for recently-built highway, resulting in toll increases.
Confederation Bridge Canada 1992 CONFED Bridge provided sole fixed link to Cana-dian province of Prince Edward Island.
Cross City Tunnel Australia 2002 CROSCITY Tunnel under downtown Sydney was planned to reduce surface congestion.
Table 4-1: Overview of Project Cases

56 Analysis and Results
Table 4-2 summarizes the resulting values of these conditions and outcomes, with conditions
(contract strategies) tabulated in the first five numerical columns, followed by data for the three
outcomes under investigation. As the sole continuous variable, RISK is recorded in the raw data
table as the risk index calculated in Appendix D and is subsequently converted into dichotomous
QCA values with the aid of Tosmana’s threshold setter.
ID PRICING LENGTH UPSIDE DOWNSIDE RISK TOLLRATE FREEFLOW MINMAX
ROUTE460 2 0 1 0 3.4 0 0 1
I-595 1 1 0 0 1.3 0 1 0
I-495 1 2 1 1 1.8 0 1 0
SKYWAY 2 2 0 0 1.8 0 0 1
SR91 1 1 1 0 1.4 0 1 0
SH121 1 2 1 1 1.4 1 1 0
WARNOW1 0 1 0 0 3.4 1 0 0
WARNOW2 2 2 0 0 2.6 1 0 1
HERREN 0 1 0 0 3.0 0 0 1
SKYE 0 0 0 1 2.4 1 0 0
LISBON 0 0 0 0 1.6 1 0 0
MADRID 0 1 0 0 2.1 1 0 0
ELMELON 2 1 1 0 2.8 0 0 1
SANTIAGO 2 0 0 1 1.3 1 0 0
407ETR1 1 1 0 0 2.9 0 1 0
407ETR2 2 2 0 0 1.9 0 1 1
CONFED 0 1 0 1 2.4 1 0 0
CROSCITY 2 1 0 0 3.0 0 0 1
Table 4-2: QCA Raw Data Table
The only difference between this raw data table and the final configuration table is in the RISK
variable. The project evaluations in Appendix D yielded numeric scores on a scale of 1 (low
traffic-demand risk) to 5 (high risk), but it was necessary to convert these scores to dichotomous
values prior to the QCA investigation. To aid in setting a meaningful threshold between low-risk
(RISK = 0) and high-risk (RISK = 1) projects, the raw data values (risk scores) were plotted for
the 18 projects using Tosmana’s threshold-setter function, as shown in Figure 4-2.

Chapter 4 57
Figure 4-2: Distribution of Project Risk Scores
Although the threshold between low- and high-risk projects was originally anticipated at 2.5, an
estimated midpoint in the data array, the plot of project risk scores indicated the median of 2.25
as a more reasonable threshold: not simply because half the points fell on either side, but also
because this limit corresponded to a wider natural gap in the existing data set. Hence projects
with risk scores of 2.2 or lower were assigned a RISK value of 0, while those with scores 2.3
and above were classed with a RISK value of 1, resulting in the QCA configurations in Table
4-3. A subsequent sensitivity analysis was performed to consider alternate threshold values.
ID PRICING LENGTH UPSIDE DOWNSIDE RISK TOLLRATE FREEFLOW MINMAX
ROUTE460 2 0 1 0 1 0 0 1
I-595 1 1 0 0 0 0 1 0
I-495 1 2 1 1 0 0 A 1 0
SKYWAY 2 2 0 0 0 0 0 B 1
SR91 1 1 1 0 0 0 1 0
SH121 1 2 1 1 0 1 A 1 0
WARNOW1 0 1 0 0 1 1 C 0 0 C
WARNOW2 2 2 0 0 1 1 0 1
HERREN 0 1 0 0 1 0 C 0 1 C
SKYE 0 0 0 1 1 1 0 0
LISBON 0 0 0 0 0 1 0 0
MADRID 0 1 0 0 0 1 0 0
ELMELON 2 1 1 0 1 0 0 1
SANTIAGO 2 0 0 1 0 1 0 0
407ETR1 1 1 0 0 1 0 1 0
407ETR2 2 2 0 0 0 0 1 B 1
CONFED 0 1 0 1 1 1 0 0
CROSCITY 2 1 0 0 1 0 0 1
Table 4-3: Preliminary QCA Configuration Table (contradictory configurations highlighted)
Median = 2.25 Originally-intended threshold = 2.5

58 Analysis and Results
4.2. Internal Validity Testing
4.2.1. Intermediate QCA Tests
Development of the QCA configuration table, a milestone in the study, enabled an intermediate
quality check to help ensure the robustness of the subsequent analysis. The criteria proposed by
Rihoux and De Meur (2009) were evaluated through a brief scan of the table:
1. Ensure more-than-minimal representation of both positive and negative outcomes.
2. Avoid counterintuitive configurations (e.g., cases in which all causal conditions are absent but the specified outcome is present).
3. Ensure cross-condition diversity (i.e., that condition pairs do not display the same values across all cases).
4. Ensure sufficient variation for each condition: “a variable must vary.” A general rule is that each dichotomous value should appear in at least one third of the cases.
The above table satisfied these criteria well,7 underscoring the previously-noted importance of
selecting cases deliberately to achieve maximum diversity. Projects with identical values across
all QCA variables—a situation encountered in pilot testing for this study—yield no additional
benefit in the analysis, which seeks to examine the range of as many combinations as possible.
Despite the table’s robust level of variation, a preliminary inspection also revealed three pairs of
contradictory configurations. These were projects with identical condition values but dissimilar
outcomes, such as the I-495 and SH-121 cases (highlighted as A above), which shared the same
condition values but differed in their TOLLRATE outcome. Similarly, the Chicago Skyway and
second 407 Express Toll Route contract (pair B) were identical except for varying FREEFLOW
outcomes; the initial Warnow Tunnel procurement and the Herren Tunnel project (pair C) also
agreed in all their condition and outcome values except for TOLLRATE and MINMAX.
Such contradictory configurations, although a frequent occurrence in QCA studies, pose a logic
problem for the analysis, which requires each combination of conditions to correspond to a
unique outcome. Identical sets of conditions linked to different outcomes may indicate several
7 The zero-value conditions and positive outcome for the LISBON project do not conflict with Criterion 2, since the null values for the PRICING and LENGTH conditions represent types of contract strategies, not their absence.

Chapter 4 59
issues: (a) errors in operationalizing the variables, (b) an insufficiently defined outcome, (c) a
lack of suitably descriptive conditions, or (d) the inclusion of a case which does not fit in the
same population as the others. As noted previously, solutions for contradictory configurations
include re-evaluating the cases and correcting inaccurately-coded variables, refining outcome
definitions, adding or modifying conditions to help differentiate the cases, or dropping one of the
conflicting cases from the analysis altogether.
For the contradictions above, the operationalization of variables was first re-evaluated. Although
both I-495 and SH-121 had identical configurations and included the FREEFLOW = 1 outcome,
a conflict resulted from SH-121’s additional outcome of TOLLRATE = 1 due to the specific toll
charges incorporated in the project’s concession agreement. One element which stood out upon
reviewing the projects’ variables was the asymmetry of I-495’s upside and downside provisions:
although the upside revenue-sharing clause was based on the concessionaire’s overall rate of
return, the downside protection was quite limited, covering only a specific revenue-shortfall
scenario (high usage by toll-exempt high-occupancy vehicles). In recognition of the functionally
limited protection provided by this clause, especially in contrast to the much broader downside
coverage of other projects for which DOWNSIDE was coded as 1, I-495’s DOWNSIDE variable
was re-coded to zero, thus resolving the contradiction with SH-121.
The configurational conflict between the Chicago Skyway and second 407 ETR procurement
was next addressed. These projects exhibited the same condition values and the same outcome
on the revenue-maximizing variable (MINMAX = 1), but the 407 ETR also listed an additional
pricing outcome of throughput maximization (FREEFLOW = 1). Although the 407 ETR
contract did include requirements for setting tolls to manage congestion (see project description
in Appendix C), substantial similarities exist between throughput-maximizing and revenue-
maximizing pricing strategies. Since both are based on users’ elasticity of demand, a project
which maximizes revenue is necessarily also controlling congestion. Closer examination of the
contract’s structure (notably its long concession term and unlimited upside) indicated the state
considered congestion management a desirable but lesser goal relative to revenue maximization,
and the FREEFLOW variable was accordingly re-coded as zero. This resulted in fully identical
configurations for both the Skyway and 407 ETR contracts. This is intuitively reasonable: both

60 Analysis and Results
projects were long-term brownfield operating leases for which the public sector sought to obtain
the maximum up-front payment.
Finally, the conflicting configuration for the Herren and Warnow Tunnels was considered. It
was found that PRICING for the Herren Tunnel should have been coded as 2 instead of 0: even
though the facility’s initial toll rate was primarily intended to cover the concessionaire’s costs
(PRICING = 0), the charge was almost immediately increased to revenue-maximizing levels
(PRICING = 2), as permitted by the contract. Re-coding this variable eliminated the contra-
diction but gave the Herren Tunnel the same QCA configuration as the Cross City Tunnel, which
is intuitively reasonable in retrospect, given the considerable similarities in the projects’ develop-
ment and traffic-demand history. Nevertheless, like the Skyway/ETR 407 re-coding, this change
also decreased the variation in the data pool, leaving 16 distinct project configurations and two
duplicate configurations, which are retained in the modified conflict-free QCA table (Table 4-4).
ID PRICING LENGTH UPSIDE DOWNSIDE RISK TOLLRATE FREEFLOW MINMAX
ROUTE460 2 0 1 0 1 0 0 1
I-595 1 1 0 0 0 0 1 0
I-495 1 2 1 0 0 0 1 0
SKYWAY 2 2 0 0 0 0 0 1
SR91 1 1 1 0 0 0 1 0
SH121 1 2 1 1 0 1 1 0
WARNOW1 0 1 0 0 1 1 0 0
WARNOW2 2 2 0 0 1 1 0 1
HERREN 2 1 0 0 1 0 0 1
SKYE 0 0 0 1 1 1 0 0
LISBON 0 0 0 0 0 1 0 0
MADRID 0 1 0 0 0 1 0 0
ELMELON 2 1 1 0 1 0 0 1
SANTIAGO 2 0 0 1 0 1 0 0
407ETR1 1 1 0 0 1 0 1 0
407ETR2 2 2 0 0 0 0 0 1
CONFED 0 1 0 1 1 1 0 0
CROSCITY 2 1 0 0 1 0 0 1
Table 4-4: Final QCA Configuration Table (changes highlighted)

Chapter 4 61
4.2.2. Inter-Rater Reliability Test
To ensure the assignment of values to the QCA variables was indeed robust and replicable, an
inter-rater reliability test was conducted to evaluate the rubric used for converting qualitative
project data to quantitative form. Through independent raters’ review and feedback, the initial
rubric was iteratively refined and re-tested, with the final version as shown in Appendix B.
For this purpose, eight of the 18 project cases were evaluated in three sets, as follows:
1. I-495 HOT Lanes
2. Skye Bridge
3. Route 460
4. Second Tagus Crossing
5. El Melon Tunnel
6. 407 ETR – first procurement
7. 407 ETR – second procurement
8. Cross City Tunnel
These eight cases were selected based on the following factors:
(a) their geographical coverage (projects from six of the eight countries in the case set
are represented);
(b) the fairly good distribution of values: for all variables except DOWNSIDE, each
value (for each condition and outcome) appeared at least twice; and
(c) the availability of English-language source documents for the raters’ use.
The initial rubric was provided to the reviewers, along with the same project documentation
as used for the QCA scoring above. These raters were then asked to evaluate these documents
according to the rubric and assign values to the five conditions and three outcomes using the
scoring worksheet given at the end of Appendix B. Their scores were subsequently compared
to the values above, and the reviewers were queried for their rationale in assigning these scores;
this feedback provided guidance for clarifying and expanding on the initial rubric. Following
the review of Set 1, the process was repeated for Set 2 and then Set 3 projects, applying the
iteratively refined rubric each time.
Set 3
Set 2
Set 1

62 Analysis and Results
Two raters independently evaluated the first two case sets. Because their findings after the
second iteration were in substantial agreement, a single rater was employed for scoring the
third set of projects.
The reviewers’ comments identified several areas of the rubric which required refinement. The
initial rubric included only a summary explanation of coding the PRICING variable, for instance,
obliging the raters to use supplemental literature beyond the rubric and project documents to
interpret this variable. Following iterative expansion of the “How to code these elements” field
within the PRICING rubric, the Set 3 rater agreed the final description was sufficiently complete
to use as standalone guidance.
The correlation of raters’ scores with the above QCA values improved with their evaluation of
sequential project sets. Although they observed this was due in part to intermediate clarifications
of the rubric, they noted a significant portion of this improvement was also due to their increased
familiarity with applying the rubric to a greater range of case data as the test progressed. One
challenge in particular lay in scoring the eight attributes on the RISK-variable worksheet at first,
especially for scaled elements such as “high-income/low-income market.” Without experience
in scoring projects at varying points along such a spectrum, the raters noted initial difficulty in
calibrating their evaluations of project data. As the raters gained experience throughout the test,
their RISK scores increasingly converged on the worksheet values in Appendix D.
For the RISK-variable worksheet, which was scored on a scale of 1 to 5, raters’ values within
one unit of the Appendix D worksheet values were considered functionally equivalent. For the
QCA variables (scored as 0, 1, and in some cases 2), exact correspondence was targeted. By the
completion of the Set 3 project evaluation, the rater’s scores were in close agreement with those
presented in this work, substantiating the relative robustness of the final QCA rubric as presented
in Appendix B.
4.3. Minimization of the Data Table
With a tested and conflict-free data table established, the next step was to distill from it patterns
which link recurring condition values, or groups of values, to each of the three outcomes. This

Chapter 4 63
process was carried out by Boolean minimization, a procedure which reduces or summarizes the
data table into “prime implicants”—combinations of condition values which are necessary and
sufficient to produce the outcome under consideration. As expressed by Ragin (1987), “If two
Boolean expressions [or mvQCA configurations] differ in only one causal condition yet produce
the same outcome, then the causal condition that distinguishes the two expressions can be consi-
dered irrelevant and can be removed to create a simpler, combined expression.” The algorithm,
which is automated by the Tosmana software, essentially asks: Which conditions are always
present when a certain outcome is achieved? Does that outcome always occur when a certain
condition is present by itself, or only when that condition is simultaneously present with others?
To answer these questions, the minimization process can either use solely the existing cases to
achieve a descriptive summary of the data set, or it can supplement these observed cases with
consistent but non-observed cases to enable more concise generalizations about the phenomena
at hand. The methodological validity of these hypothetical cases, or “logical remainders,” was
addressed previously, and the quantity of such cases in an analysis depends on the number of
conditions and condition values.
For this investigation, the array of conditions in Table 4-4 corresponded to a logical “data space”
with 72 configurations (3 × 3 × 2 × 2 × 2, the product of possible values for each of these five
conditions). With 16 distinct observed cases, the analysis thus incorporated a large amount of
unfilled data space, as is common in QCA investigations: it is highly unlikely that actual cases
representing all, or even most, possible configurations can be observed.8 Yet the analysis of
16 cases with five conditions was well within the accepted range of QCA research designs, as
outlined in the previous chapter.
For each outcome, the analysis examined both the descriptive data-set summaries and the
more concise solutions including the non-observed cases necessary to generalize the QCA
relationships.
8 A common political-science application of QCA involves comparing international characteristics to identify contributing factors to social or political developments. The number of cases available for such a study of (say) Latin American or European phenomena is undeniably limited by the number of countries in these regions.

64 Analysis and Results
4.4. Results
The data minimization process was performed twice, both excluding and including logical
remainders, for the three separate outcomes under consideration. (Sample Tosmana analysis
menus, as well as the complete output, are provided in Appendix E.) As might be anticipated,
the solutions with remainders were considerably more succinct than those without; these
combinations are interpreted and discussed in the following section.
The first row in each output table below indicates the QCA solution, with each cell in this row
containing a prime implicant—the most concise expression able to explain the case(s) in the row
beneath. As is standard practice for QCA output, the results are given in Boolean notation, in
which addition represents OR and multiplication represents AND. For instance:
Expression: PRICING{0} + DOWNSIDE{1} + LENGTH{2} RISK{1}
Translation: PRICING = 0 or DOWNSIDE = 1 or ( LENGTH = 2 and RISK = 1 )
Interpretation: Either average-cost pricing is used, or downside-risk protection is present, or a concession 50 years or longer exists with high traffic-demand risk.
4.4.1. TOLLRATE Outcome: Achieving Specific Toll Levels
The effort to identify patterns of contract strategies which correspond to the TOLLRATE = 1
outcome (achieving specific toll rates) produces an extremely unwieldy expression if these
patterns are sought only from existing data, without considering supplemental cases. One
indicator of the strength of a prime implicant is the number of cases it can explain, yet the
implicants in Table 4-5 below are barely useful in defining cross-case patterns: all but the first
two can explain only a single case. Further, the last five expressions contain as many terms as
there are conditions in the analysis, indicating no summarization or reduction was possible. In
fact, these expressions are identical to the configurations in the original data table.

Chapter 4 65
Expression (from Tosmana output):
PRICING{0} * LENGTH{1} * UPSIDE{0} * RISK{1} +
PRICING{0} * LENGTH{1} * UPSIDE{0} * DOWNSIDE{0} +
PRICING{1} * LENGTH{2} * UPSIDE{1} * DOWNSIDE{1}* RISK{0} +
PRICING{2} * LENGTH{2} * UPSIDE{0} * DOWNSIDE{0}* RISK{1} +
PRICING{0} * LENGTH{0} * UPSIDE{0} * DOWNSIDE{1} * RISK{1} +
PRICING{0} * LENGTH{0} * UPSIDE{0} * DOWNSIDE{0}* RISK{0} +
PRICING{2} * LENGTH{0} * UPSIDE{0} * DOWNSIDE{1}* RISK{0}
Cases explained by this expression:
(WARNOW1+CONFED)
(WARNOW1+MADRID)
(SH121) (WARNOW2) (SKYE) (LISBON) (SANTIAGO)
Table 4-5: Analysis of TOLLRATE = 1 (without remainders)
When non-observed cases are included in the TOLLRATE = 1 analysis, the solution is much
more concise, and each implicant except the last is able to explain multiple cases (Table 4-6). To
avoid the “black box” pitfall of adopting such a tidy solution without acknowledging its under-
lying logic, though, it is crucial to understand the substantial generalizations involved. Sheet 1B
in Appendix E lists the 44 hypothetical cases, or simplifying assumptions, which were necessary
to enable this summary. Although this number is relatively large, it does not invalidate the
summary, but such a quantity of hypothetical cases indicates the pattern is not as strong as the
succinct expression below might indicate.
Table 4-6: Analysis of TOLLRATE = 1 (with remainders)
4.4.2. FREEFLOW Outcome: Maximizing Throughput
The FREEFLOW = 1 minimization based on existing case data (Table 4-7) is far more concise
than that that for the previous TOLLRATE outcome. Each implicant is capable of explaining
multiple cases and has fewer terms than the number of conditions in the analysis. In addition,
each shares the PRICING = 1 element; several other conditions also appear in two of these three
implicants, indicating a more meaningful level of summarization.
Expression: PRICING{0} + DOWNSIDE{1} + LENGTH{2}RISK{1}
Interpretation: Average cost pricing Downside risk protection Concession 50+ years and high traffic-demand risk
Cases Explained: (WARNOW1+SKYE+LISBON+MADRID+CONFED)
(SH121+SKYE+SANTIAGO+CONFED)
(WARNOW2)

66 Analysis and Results
Expression: PRICING{1} * LENGTH{1} * DOWNSIDE{0} * RISK{0} +
PRICING{1} * LENGTH{1} * UPSIDE{0} * DOWNSIDE{0} +
PRICING{1} * LENGTH{2} * UPSIDE{1} * RISK{0}
Cases Explained: (I-595+SR91) (I-595+407ETR1) (I-495+SH121)
Table 4-7: Analysis of FREEFLOW = 1 (without remainders)
Not only can the FREEFLOW = 1 solution with logical remainders be summarized to a single
term (Table 4-8), but Sheet 2B in Appendix E indicates this expression required 19 simplifying
assumptions—fewer than half as many as for the TOLLRATE solution.
Expression: PRICING{1}
Interpretation: Marginal social cost pricing
Cases Explained: (I-595+I-495+SR91+SH121+407ETR1)
Table 4-8: Analysis of FREEFLOW = 1 (with remainders)
4.4.3. MINMAX Outcome: Minimizing Subsidy or Maximizing Revenue
Without inclusion of hypothetical cases, the MINMAX = 1 minimization (Table 4-9) is able to
provide limited summarization of the case data: two of the three terms explain more than one
case, though the third implicant simply repeats an entire configuration from the data table.
Expression: PRICING{2} * LENGTH{2} *
UPSIDE{0} * DOWNSIDE{0} +
PRICING{2} * LENGTH{1}* DOWNSIDE{0} * RISK{1} +
PRICING{2} * LENGTH{0} * UPSIDE{1} * DOWNSIDE{0} * RISK{1}
Cases Explained:
(SKYWAY,407ETR2+ WARNOW2)
(HERREN,CROSCITY+ ELMELON)
(ROUTE460)
Table 4-9: Analysis of MINMAX = 1 (without remainders)
The analysis for the MINMAX = 1 outcome, including simplifying assumptions, yields another
single-implicant solution (Table 4-10). This generalization requires only 7 logical remainders, as
listed on Sheet 3B in Appendix E, indicating a strong pattern in the data.
Expression: PRICING{2}DOWNSIDE{0}
Interpretation: Revenue-maximizing pricing with no downside-risk protection
Cases Explained: (ROUTE460+SKYWAY,407ETR2+WARNOW2+HERREN,CROSCITY+ELMELON)
Table 4-10: Analysis of MINMAX = 1 (with remainders)

Chapter 4 67
4.5. Descriptive Metrics and Sensitivity Analysis
Since the conversion of qualitative data into quantitative values can introduce a degree of
subjectivity into an investigation, two tests are carried out to validate key elements of the work
and strengthen its replicability: an inter-rater reliability test for assigning values to the QCA
conditions and outcomes, and a sensitivity analysis on the threshold between 0 and 1 scores for
the RISK variable.
4.5.1. Descriptive Metrics
Before these solutions are formally interpreted, a summary evaluation of their “goodness of fit”
provides further insights into the applicability of the results. Two quantitative metrics have been
established for assessing the level of correspondence between QCA conditions and the outcomes
which they are posited to support (Ragin 2006).
The first of these measures, consistency, evaluates a condition’s necessity for achieving a
particular outcome. Once the conflict-free QCA table is developed, it can be calculated as
follows (Rihoux and De Meur 2009):
Consistency =
Values close to 1, or ideally at least 0.75, are desirable to indicate a meaningful relationship
between conditions and outcomes (Ragin 2006). But because this measure depends on the
presence or absence of a condition, it can be applied only to csQCA and fsQCA data, since
mvQCA conditions do not necessarily indicate presence or absence of a phenomenon (e.g.,
PRICING and LENGTH) as in csQCA and fsQCA.
Coverage, the second descriptive metric for evaluating the relationship between conditions and
outcomes, is calculated following the development of QCA summary expressions and is valid for
all QCA variants. This metric is a practical indicator of the effectiveness or comprehensiveness
of each solution term in explaining the outcome:
number of cases for which both a given condition and outcome are present number of cases for which only the outcome is present
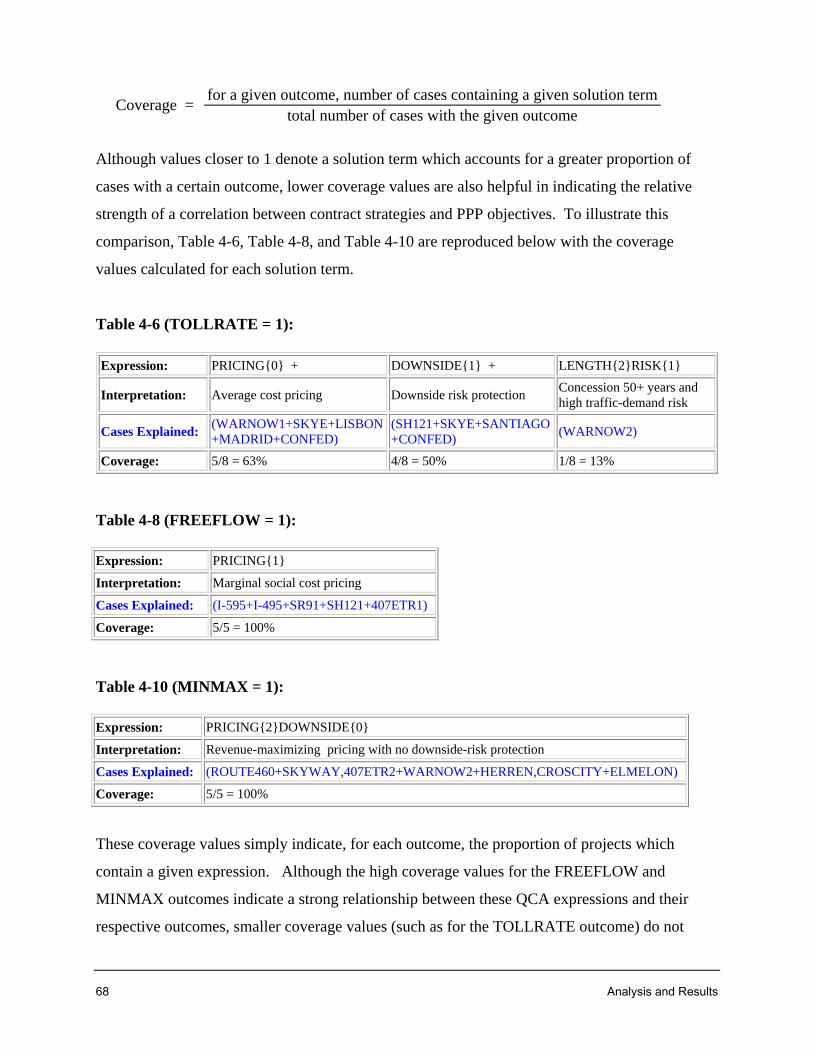
68 Analysis and Results
Coverage =
Although values closer to 1 denote a solution term which accounts for a greater proportion of
cases with a certain outcome, lower coverage values are also helpful in indicating the relative
strength of a correlation between contract strategies and PPP objectives. To illustrate this
comparison, Table 4-6, Table 4-8, and Table 4-10 are reproduced below with the coverage
values calculated for each solution term.
Table 4-6 (TOLLRATE = 1):
Table 4-8 (FREEFLOW = 1): Expression: PRICING{1}
Interpretation: Marginal social cost pricing
Cases Explained: (I-595+I-495+SR91+SH121+407ETR1)
Coverage: 5/5 = 100%
Table 4-10 (MINMAX = 1): Expression: PRICING{2}DOWNSIDE{0}
Interpretation: Revenue-maximizing pricing with no downside-risk protection
Cases Explained: (ROUTE460+SKYWAY,407ETR2+WARNOW2+HERREN,CROSCITY+ELMELON)
Coverage: 5/5 = 100%
These coverage values simply indicate, for each outcome, the proportion of projects which
contain a given expression. Although the high coverage values for the FREEFLOW and
MINMAX outcomes indicate a strong relationship between these QCA expressions and their
respective outcomes, smaller coverage values (such as for the TOLLRATE outcome) do not
Expression: PRICING{0} + DOWNSIDE{1} + LENGTH{2}RISK{1}
Interpretation: Average cost pricing Downside risk protection Concession 50+ years and high traffic-demand risk
Cases Explained: (WARNOW1+SKYE+LISBON+MADRID+CONFED)
(SH121+SKYE+SANTIAGO+CONFED)
(WARNOW2)
Coverage: 5/8 = 63% 4/8 = 50% 1/8 = 13%
for a given outcome, number of cases containing a given solution term total number of cases with the given outcome

Chapter 4 69
signify inferior QCA solutions. Rather, the coverage metric is especially valuable in these
situations to show the relative explanatory strength of each sub-expression, since these could
otherwise appear on equal footing with each other. Although these coverage values were
calculated above for primary QCA solutions, the metric is also useful for evaluating and
comparing the relative explanatory ability of expressions in non-primary solutions, such as
those given in Table 4-5, Table 4-7, and Table 4-9.
4.5.2. Sensitivity Analysis
As noted above, the initial threshold separating low- and high-traffic-risk projects was taken as
2.25, the median value of the RISK scores in this data set. For the sensitivity analysis, two
additional threshold scenarios were considered, as shown in Figure 4-3.
Figure 4-3: RISK Thresholds for Sensitivity Analysis
4.5.2.1. Scenario 1: Threshold = 1.95
Under the first scenario, projects with an overall risk score of 1.9 or less were classed as RISK =
0 (low traffic risk), and those scoring 2.0 or above were categorized as RISK = 1 (high risk). As
Figure 4-3 indicates, only one project was affected by moving the threshold leftward from its
original position. This case was the Autopista M-12, Madrid’s airport-access road, whose risk-
worksheet score was calculated at 2.1. The new QCA configuration became as follows:
ID PRICING LENGTH UPSIDE DOWNSIDE RISK TOLLRATE FREEFLOW MINMAX
MADRID 0 1 0 0 0 1 1 0 0
Scenario 2: Threshold = 2.55
Original Threshold = 2.25
Scenario 1: Threshold = 1.95

70 Analysis and Results
This change in the RISK variable transformed the Madrid project into the same 0 / 1 / 0 / 0 / 1
1 / 0 / 0 configuration as the first Warnow Tunnel procurement. Since this Warnow Tunnel
configuration had already been considered in the preceding QCA investigation, Scenario 1 of the
sensitivity analysis produced no new information for evaluating the TOLLRATE = 1 outcome.
Relative to the original Table 4-5 expression (reproduced below for comparison), the removal
of the previous Madrid configuration from the analysis eliminated one of the seven terms in the
solution (Table 4-11), although this change has minimal practical impact.
Expression (from Tosmana output):
PRICING{0} * LENGTH{1} * UPSIDE{0} * RISK{1} +
PRICING{0} * LENGTH{1} * UPSIDE{0} * DOWNSIDE{0} +
PRICING{1} * LENGTH{2} * UPSIDE{1} * DOWNSIDE{1}* RISK{0} +
PRICING{2} * LENGTH{2} * UPSIDE{0} * DOWNSIDE{0}* RISK{1} +
PRICING{0} * LENGTH{0} * UPSIDE{0} * DOWNSIDE{1} * RISK{1} +
PRICING{0} * LENGTH{0} * UPSIDE{0} * DOWNSIDE{0}* RISK{0} +
PRICING{2} * LENGTH{0} * UPSIDE{0} * DOWNSIDE{1}* RISK{0}
Cases explained by this expression:
(WARNOW1+CONFED)
(WARNOW1+MADRID)
(SH121) (WARNOW2) (SKYE) (LISBON) (SANTIAGO)
Table 4-5: Original Analysis of TOLLRATE = 1 (without remainders)
Expression (from Tosmana output):
PRICING{0} * LENGTH{1} * UPSIDE{0} * RISK{1} +
x PRICING{1} * LENGTH{2} * UPSIDE{1} * DOWNSIDE{1} * RISK{0} +
PRICING{2} * LENGTH{2} * UPSIDE{0} * DOWNSIDE{0} * RISK{1} +
PRICING{0} * LENGTH{0} * UPSIDE{0} * DOWNSIDE{1} * RISK{1} +
PRICING{0} * LENGTH{0} * UPSIDE{0} * DOWNSIDE{0} * RISK{0} +
PRICING{2} * LENGTH{0} * UPSIDE{0} * DOWNSIDE{1} * RISK{0}
Cases explained by this expression:
(WARNOW1, MADRID+ CONFED)
x (SH121) (WARNOW2) (SKYE) (LISBON) (SANTIAGO)
Table 4-11: Revised Analysis of TOLLRATE = 1 (without remainders)
The sensitivity analysis also yielded no impact on the TOLLRATE = 1 solution with remainders,
though it now involved 45 simplifying assumptions instead of 44.
Of secondary note in this scenario is the curiosity that a slight adjustment of the RISK threshold
should give a promising facility such as the Madrid airport road the same configuration as the
Warnow Tunnel, a project which significantly underperformed initial traffic expectations and

Chapter 4 71
had its contract renegotiated after only three years. Initial project documents (and the road’s
Spanish name, Eje Aeropuerto) emphasized the facility’s role as the primary access road to a
new airport terminal, a situation which would improve its traffic demand and which contributed
to favorable scoring in the risk worksheet. But subsequent evaluation of original-language M-12
reports indicated the project was not nearly as promising as these factors had indicated: much of
the road’s forecast traffic volume was based on its location as an outer-beltway option around
Madrid, even though the alternate routes were untolled. Initial traffic was less than 40% of the
projected volume and remained sluggish; similar to the Warnow Tunnel procurement, the M-12
concessionaire requested rebalancing of the contract after only three years of operation.
Although re-evaluation of the Madrid project was not an anticipated outcome of this review, the
robustness of the analysis is nevertheless underscored by the minimal resulting impact on the
QCA findings from even a project for which incomplete information initially led to an overly-
optimistic risk score.
4.5.2.2. Scenario 2: Threshold = 2.55
Under the second scenario for the sensitivity analysis, projects with an overall risk score of 2.5
or less were categorized as RISK = 0 (low risk), and those scoring 2.6 or above were classed as
RISK = 1 (high risk). The two projects affected by this rightward shift of the threshold (see
Figure 4-3) were the Confederation Bridge and Skye Bridge, both with risk scores of 2.4.
Their new QCA configurations became as follows:
ID PRICING LENGTH UPSIDE DOWNSIDE RISK TOLLRATE FREEFLOW MINMAX
CONFED 0 1 0 1 1 0 1 0 0
SKYE 0 0 0 1 1 0 1 0 0
Neither of these duplicated existing configurations in the case set. Since these cases both had the
same objective of targeting a specific toll level, only the TOLLRATE outcome was considered in
evaluating the impact of this revised RISK threshold. Again comparing the TOLLRATE = 1
expression (without remainders) from Table 4-5:

72 Analysis and Results
Expression (from Tosmana output):
PRICING{0} * LENGTH{1} * UPSIDE{0} * RISK{1} +
PRICING{0} * LENGTH{1} * UPSIDE{0} * DOWNSIDE{0} +
PRICING{1} * LENGTH{2} * UPSIDE{1} * DOWNSIDE{1}* RISK{0} +
PRICING{2} * LENGTH{2} * UPSIDE{0} * DOWNSIDE{0}* RISK{1} +
PRICING{0} * LENGTH{0} * UPSIDE{0} * DOWNSIDE{1} * RISK{1} +
PRICING{0} * LENGTH{0} * UPSIDE{0} * DOWNSIDE{0}* RISK{0} +
PRICING{2} * LENGTH{0} * UPSIDE{0} * DOWNSIDE{1}* RISK{0}
Cases explained by this expression:
(WARNOW1+CONFED)
(WARNOW1+MADRID)
(SH121) (WARNOW2) (SKYE) (LISBON) (SANTIAGO)
Table 4-5: Original Analysis of TOLLRATE = 1 (without remainders)
After reclassification of the Confederation Bridge and Skye Bridge risk scores, the total number
of component expressions declined from seven to six, and the number of expressions explaining
only a single case also decreased from five to three (Table 4-12). As before, this change has
little practical impact.
Expression (from Tosmana output):
PRICING{0} * LENGTH{1} * UPSIDE{0} * DOWNSIDE{0} +
PRICING{0} * LENGTH{0} * UPSIDE{0} * RISK{0} +
PRICING{0} * LENGTH{1} * UPSIDE{0} * RISK{0} +
PRICING{1} * LENGTH{2} * UPSIDE{1} * DOWNSIDE{1} * RISK{0} +
PRICING{2} * LENGTH{2} * UPSIDE{0} * DOWNSIDE{0} * RISK{1} +
PRICING{2} * LENGTH{0} * UPSIDE{0} * DOWNSIDE{1} * RISK{0}
Cases explained by this expression:
(WARNOW1+ MADRID)
(SKYE+ LISBON)
(MADRID+ CONFED)
(SH121) (WARNOW2) (SANTIAGO)
Table 4-12: Revised Analysis of TOLLRATE = 1 (without remainders)
For the TOLLRATE = 1 solution including logical remainders, this scenario of the sensitivity
analysis had no effect, and the number of simplifying assumptions remained unchanged at 44.
In summary, both scenarios of the sensitivity analysis (with alternate RISK thresholds at 1.95
and 2.55) had a slight influence on the expanded solutions omitting simplifying assumptions, and
no impact on the generalized solutions. This finding supports the use of the 2.25 median score as
a threshold between the RISK = 0 and RISK =1 values in this study. For instances in which an
individual project is compared with others in the case library, though, it may still be beneficial
to consider the wider range of thresholds if risk-worksheet scores fall between 2.0 and 2.5.

Chapter 4 73
4.6. Interpretation
The next step in a QCA study is to evaluate the concrete meanings of the expressions developed
in the analysis above and consider whether these patterns provide meaningful guidance which
can be applied to other cases outside the original data set. This step focuses primarily on the
outputs which incorporate simplifying assumptions, due to the greater generality and broader
applicability of these expressions.
4.6.1. TOLLRATE Outcome: Achieving Specific Toll Levels
With logical remainders, the summarized expression of contract strategies corresponding to the
TOLLRATE = 1 outcome is PRICING{0} + DOWNSIDE{1} + LENGTH{2}RISK{1}.
This signifies “PPP contracts are conducive to supporting a targeted toll rate when average-cost
pricing is used, downside risk-sharing is present, or the project has high traffic-demand risk and
a concession term 50 years or longer.”
These implicants are considered individually whether they seem sensible. The first element, the
suitability of average-cost pricing in achieving a specific toll level, is reasonable enough to be
almost self-apparent, since this approach is the lowest-cost of the three pricing options and the
only one which is based on infrastructure supply, not demand. But this element’s presence in the
TOLLRATE = 1 expression is to be expected and verifies the method can accurately identify
contract strategies which correspond to certain outcomes.
The next implicant in the solution, the presence of downside risk-sharing, is less obvious but also
very plausible: when a fixed toll rate is specified in a PPP agreement, the concessionaire has less
contractual flexibility to make up potential shortfalls, and thus the added incentive of downside
risk sharing (perhaps in the form of a traffic or revenue guarantee) would be attractive in
offsetting the contract’s greater risks.
Finally, the combination element of greater concession length with higher traffic risk is similarly
reasonable: when the private sector is not permitted the flexibility to make up revenue shortfalls
through toll-rate adjustments, a longer concession term is entirely logical as a buffer to absorb

74 Analysis and Results
short-term revenue fluctuations, particularly when a contract already has higher traffic-demand
risk.
In application, then, a public-sector agency which sets the achievement of a specific toll rate as
a priority should consider these three contract strategies, particularly the establishment of down-
side risk sharing and a longer concession term, as sound options in structuring a PPP agreement.
4.6.2. FREEFLOW Outcome: Maximizing Throughput
The minimized expression for the FREEFLOW = 1 outcome, PRICING = 1, has a fully logical
interpretation: “PPPs tend to be effective in controlling congestion when marginal social cost
pricing is used.” Because this explanation is such an obvious solution (though again a reassuring
verification of the method’s discrimination), it is worthwhile to probe the less general solution
in Table 4-7 above to seek additional patterns in the data. Prior to the inclusion of simplifying
assumptions, two of the three implicants in the expression include LENGTH = 1, DOWNSIDE =
0, and RISK = 0.
Do these make sense as potential tools for supporting the objective of throughput maximization?
These elements indicate, respectively, that shorter concession lengths (up to 50 years), absence
of downside risk sharing, and lower traffic-risk projects are elements which correspond with this
goal. As might be expected from the less-conclusive approach for distilling these factors, the
practical justification is less strong for these strategies than for those supporting the previous
outcome. Still, one could draw the rational conclusion that roadways on which congestion
control is desirable are obviously experiencing proven demand and thus will have lower traffic-
risk index scores. As a result of this strong demand, the private-sector partner can reasonably
expect significant downside traffic risk will be less likely, and he can thus recoup his costs
during a shorter concession period than otherwise.
An application of these concepts might include strengthening the public sector’s negotiating
position for PPP contracts on facilities for which congestion-control pricing is targeted, in that
the established demand reduces the need for long concessions or traffic-risk-sharing provisions.

Chapter 4 75
4.6.3. MINMAX Outcome: Minimizing Subsidy or Maximizing Revenue
As with the previous outcome, the MINMAX = 1 objective produced a succinct QCA solution:
“The PPP goal of low subsidies or high income tends to be achieved when revenue-maximizing
pricing is applied in the absence of downside risk sharing.” Although the pricing aspect of the
expression seems self-apparent, it is also understandable (though not immediately obvious) that
the prospect of a more-likely upside benefit might be balanced with unlimited downside risk as
well. In practice, though, owners have sometimes used the incentive of revenue-maximizing
pricing in an attempt to make risky projects more marketable, as exemplified by a review of
the data table for the El Melon Tunnel and Route 460. Even though these projects’ downside
scenario is more likely, both procurements optimistically included provisions for upside revenue
sharing, without corresponding downside protections.
The inconclusive guidance from the MINMAX solution allows exploring an additional facet of
the QCA evaluation which was not available for the two previous outcomes. The Tosmana
analysis automatically selects the most concise expression explaining each set of configurations,
and in some cases (such as the TOLLRATE and FREEFLOW analyses), this expression is the
only valid summary possible. In other cases, though, additional less-concise solutions are also
valid, and the software offers the option to select other combinations of these prime implicants
manually.
Such alternative solutions are possible for the MINMAX analysis, whose available prime
implicants are shown in Figure 4-4, along with the cases which they explain. It is quickly
apparent that the single implicant PRICING{2}DOWNSIDE{0} explains all five configurations.
But if less concise expressions are of interest, an alternative result can be manually developed by
combining (for instance) the first and fourth rows, which cover all project configurations. The
resulting PRICING{2}LENGTH{1,2} + PRICING{2}RISK{1} is another valid solution and
indicates the MINMAX = 1 outcome corresponds to both long and short concessions (but not
variable-length ones) or projects which have a high risk index. This secondary solution is also
intuitively reasonable and sheds additional light on the factors influencing this outcome. As
shown in Sheet 3C of Appendix E, these implicants require 12 simplifying assumptions—an
indicator that this is not the most concise solution explaining these configurations.

76 Analysis and Results
Figure 4-4: Manual Selection of Prime Implicants
One application of this alternate solution lies in the negative rather than the positive: while PPPs
for which high revenue-generation is prioritized should certainly employ revenue-maximizing
pricing, the outcome is not supported by using that pricing strategy in conjunction with variable-
length concessions or for low traffic-risk projects. These findings are intuitive: by its structure,
the variable-length concession is not conducive to excess revenue generation. Neither are PPPs
with minimal demand risk likely to be coupled with a reward disproportionate to their low risk.
Based on the above analysis and results, the next chapter transitions to the practical application
of this research. The QCA expressions established here form one of three decision-support tools
developed from this study, and all three approaches are illustrated through application to current
PPP procurements.

Chapter 5 77
Chapter 5 APPLICATIONS FOR POLICY AND PRACTICE
The various decision-support elements developed in the course of this study are now applied to
demonstrate this work’s relevance to policy and practice. This guidance can be distilled into
three tools for PPP decision-making: (1) the modified traffic-risk worksheet, which provides a
rapid estimate of a toll-financed project’s viability; (2) the analytical QCA results, which offer
guidance for structuring PPP contracts once the pricing objectives are established or are under
consideration; and (3) case-library comparisons, which enable drawing parallels between
proposed procurements and established PPP projects.
Each of these three tools is illustrated with respect to current PPP solicitations in Virginia, where
contemporary developments have furnished well-suited opportunities to apply this research. The
Route 460 and Midtown Tunnel projects, both under procurement as PPPs in mid-2010, are
introduced and evaluated below.
5.1. Traffic-Risk Worksheet
The proposed US Route 460 expansion in southeastern Virginia (Figure 5-1) provides an outlet
for applying the traffic-risk worksheet which was developed in Chapter 3 and which serves as
the basis of the RISK variable. Its initial procurement is one of the case studies in the data set.
5.1.1. Route 460 Project History
As indicated in Figure 5-2, improvements to Route 460 were the focus of state legislation in
2003. The proposed scope involved developing a tolled 55-mile highway parallel to an existing
free route which had lower speed, capacity, and safety standards. Since no public funds were
available, the project had to support itself through its own revenue stream. The February 2006
solicitation for conceptual proposals drew a cautious private-sector response due to concerns
about low demand, particularly through traffic diversion to the free parallel route. Even though
the draft concession agreement offered the first US variable-length PPP in an effort to reduce
project risk, no responses were received to the December 2008 request for detailed proposals.

78 Applications
Figure 5-1: Route 460 Location Map
(Source: Virginia Department of Transportation)
2003 – Virginia legislation requires PPP solicitation
Feb 2006 – Solicitation for conceptual proposals
Sep 2006 – Three conceptual proposals submitted
Dec 2008 – Solicitation for detailed proposals
May 2010 – Procurement cancelled; new solicitationJuly 2010 – Revision of new solicitation
Figure 5-2: Route 460 Procurement Timeline

Chapter 5 79
Given this lukewarm response, along with changes in the economy, the state terminated the
original Route 460 procurement in May 2010 and issued a new solicitation for conceptual
proposals.9 The physical scope of the project remained similar—to develop the 55-mile highway
alongside the existing route—but proposers were allowed additional flexibility in structuring
financial plans, including the opportunity to incorporate non-toll revenues such as those from
commercial development. The concession duration also was changed from a variable length
to a fixed length, with a maximum of 75-99 years.
5.1.2. Risk Score
As shown in Table 5-1, an evaluation of the eight elements in the risk-index worksheet indicated
none of these attributes had changed significantly under the new procurement: a logical outcome,
since the worksheet factors are linked primarily to a facility’s physical and demographic charac-
teristics at a given time, not to contract specifics. But the new solicitation’s traffic assumptions
appeared to rely more heavily on future growth factors, as evidenced by its suggestion (Section
3.1.1.2) that proposers consider potential revenues from new commercial development: “The
Comprehensive Agreement will include provisions to address a number of commercial issues,
including...support for the development of commercial facilities determined to be essential for
the transportation of persons or goods....” The increased uncertainty related to this future
development produced a slight uptick in the attribute score for traffic growth, yielding an
overall risk index of 3.5—still decisively in the high-risk project category.
9 Virginia Department of Transportation. (2010a). Solicitation for Conceptual Proposals: U.S. Route 460 Corridor Improvements Project through the Public-Private Transportation Act (issued May 5, 2010).

80 Applications
Project Attribute
Traffic Risk Index Route 460 Risk Scores and Comments
1 2 3 4 5 #1 Comments #2
Tolling Culture
Toll roads well established: data on actual use are available
No toll roads in the country, uncertainty over toll acceptance
4
Few tollroads in region; prospect of toll facilities unpopular with majority of drivers
4
Toll
Facility Details
Estuarial crossings; radial corridors into urban areas
Dense, urban net-works; ring roads/ beltways around urban areas
1 Radial connector between Richmond and Hampton Roads metropolitan areas
1
Extension/ expansion of existing road
Greenfield site 3 Parallel route to existing road
3
Stand-alone (single) facility
Reliance on other, proposed highway improvements
1 Contract to include all necessary connections to existing routes
1
Highly congested corridor
Limited/no congestion
5 Existing parallel facility occasionally congested, e.g. at stoplights
5
Few competing roads
Many alternative routes
5 Free existing parallel route (460); free interstate alternative (I-64)
5
Users High-income, time-sensitive market
Average/low-income market
4 Average-income users; significant commercial/ freight traffic component
4
Traffic Growth
Driven by/ correlated with existing factors
Reliance on future growth factors, new develop-ments, etc.
4
Relies on future growth of Hampton Roads port/freight Relies traffic on future commercial development
5
Sum of Risk Scores: 27 28
Average Risk Score: 3.4 High Risk 3.5
Table 5-1: Risk Worksheet for Route 460

Chapter 5 81
5.2. Application of QCA Guidance for Structuring Procurements
The second decision-support tool resulting from this research stems from the QCA findings in
the previous chapter. These combinations of contract strategies which support specific pricing
outcomes can be applied to procurements in development, as illustrated below by Virginia’s
Midtown Tunnel PPP.
5.2.1. Midtown Tunnel Project History
The Hampton Roads region of southeastern Virginia both benefits and suffers from the numerous
waterways crisscrossing the area. Although the Chesapeake Bay and the Elizabeth River have
been crucial to the region’s development as a naval and shipping hub, they also pose significant
transportation challenges for linking the area’s roads across these waterways. To help connect
the cities of Norfolk and Portsmouth, the two-lane Downtown and Midtown Tunnels were built
under the Elizabeth River in 1952 and 1962, respectively. Although the Downtown Tunnel was
expanded to four lanes in 1987, the Midtown remained at its original configuration and became
the busiest two-lane road in Virginia, carrying over 35,000 vehicles per day.
Shortly after passage of Virginia’s Public-Private Transportation Act in 1995, the state received
several unsolicited proposals to add two more lanes to the Midtown Tunnel, upgrade the Down-
town Tunnel, and construct a freeway extension linking the two (see Figure 5-3 and Figure 5-4).
Approval from the Norfolk and Portsmouth city councils was necessary before evaluation could
proceed, but Portsmouth voted against the proposed tolls in 1999, scuttling the effort. Five years
later, the Virginia Department of Transportation (VDOT) revived the project, requesting expres-
sions of interest from the private sector in 2004 and soliciting conceptual proposals in 2008.
Although an interim agreement was signed with the sole proposer in 2010, this PPP is currently
grappling with the challenge of developing a contract approach which satisfies its pricing goals.
The application of QCA findings is demonstrated to explore combinations of contract strategies
which may be effective in structuring this procurement to achieve public-sector objectives.

82 Applications
Figure 5-3: Midtown Tunnel Location Map (Source: Virginia Department of Transportation, 1996 FEIS)
Midtown Tunnel
Downtown Tunnel
Freeway Extension

Chapter 5 83
1996 – Two unsolicited proposals submitted
1999 – Local city council votes against tolls
Nov 2004 – Request for statements of interest
May 2008 – Solicitation for conceptual proposalsSep 2008 – One conceptual proposal received
Jan 2010 – Interim agreement executed
1997 – New proposal submitted by merged teams
Jan 2005 – Three statements of interest received
Figure 5-4: Midtown Tunnel Procurement Timeline
5.2.2. Identification of Pricing Objective
Although the Midtown Tunnel’s solicitation for conceptual proposals listed multiple project
objectives—increasing capacity, providing safe operations, mitigating environmental impact,
coordinating with adjacent land uses, and supporting traffic growth, for instance—none of these
goals were pricing outcomes which could be influenced meaningfully by the PPP contract
structure. It was necessary to probe deeper to identify which of the three primary pricing
objectives, as defined previously, was targeted for this procurement.
MINMAX, the outcome which seeks to minimize public subsidy or maximize up-front payment
from the concessionaire, was not a likely prospect: a regional toll-feasibility study (HRPDC 2005)
indicated the project, at its then-current scope and estimated costs, would not require a subsidy.
Nor was an up-front payment of significant interest to the public sector: at most, the ideas in the
study considered applying any excess Midtown revenues to improving other nearby facilities.
Another possible objective was FREEFLOW—a reasonable option, since the existing Midtown
Tunnel corridor was heavily congested at peak travel times. But since the project scope would
already double the facility’s available lanes, the very nature of this expansion would provide a
substantial contribution toward relieving (though perhaps not completely eliminating) traffic
delays, even without this outcome being specifically prioritized as a pricing goal.

84 Applications
The TOLLRATE objective offered another possibility. Although the 2008 private-sector
proposal for this project estimated initial tunnel tolls between $2.00 and $3.00, public officials
have promoted a target rate of $1.50 to enable greater affordability for users.10 The ultimate
pricing objective for this procurement remains in flux; this is a by-product of using an interim
agreement for a PPP project, since project objectives and conditions are typically negotiated
through an iterative process between the public and private partners. Current indications,
however, suggest that the pricing objective—achieving tolls at a specific level—is likely to
govern the other options, making it worthwhile to consider how this outcome might be
supported through application of the QCA findings.
5.2.3. QCA Recommendations for Contract Structure
Table 4-6 of the QCA study (reproduced below) identified three distinct patterns of contract
strategies in the PPP cases which also targeted the TOLLRATE = 1 outcome. Although these
combinations are not a recipe for achieving procurement outcomes, they provide guidance by
distilling common characteristics of projects which have pursued this same goal in the past.
Table 4-6 (TOLLRATE = 1):
For a procurement such as the Midtown Tunnel which may share the TOLLRATE = 1 pricing
objective, these patterns offer a point of comparison for defining contract strategies. The
selection among (or combination of) the three options above is influenced by the individual
circumstances of a procurement.
10 Letter re: “Midtown Tunnel Public-Private Transportation Act (PPTA) Proposal” from Norfolk Mayor Paul Fraim to Virginia Governor Robert McDonnell, July 26, 2010.
Expression: PRICING{0} + DOWNSIDE{1} + LENGTH{2}RISK{1}
Interpretation: Average-cost pricing or Downside risk protection or Concession 50+ years and high traffic-demand risk
Cases Explained: (WARNOW1+SKYE+LISBON+MADRID+CONFED)
(SH121+SKYE+SANTIAGO+CONFED)
(WARNOW2)
Coverage: 5/8 = 63% 4/8 = 50% 1/8 = 13%

Chapter 5 85
For instance, average-cost pricing sets toll rates at the minimum feasible level to cover a
project’s costs; if this level is still higher than the targeted toll rate, public subsidies may be
added, or a different option from the TOLLRATE = 1 solution menu can be chosen. Other
procurement scenarios may find the second pattern, provision of downside risk protection,
more suitable: this strategy essentially reduces a project’s cost by decreasing its risk and can be
applied either in conjunction with or separately from average-cost pricing. The third option, in
which a PPP having high traffic-demand risk is structured with a long concession term, is not
applicable to the Midtown procurement. 11 The traffic-risk worksheet (Table 3-3) yielded a risk
score of 1.8 for this project, indicating the Midtown Tunnel falls into the low-risk category.
The percentages in the final row of Table 4-6 indicate what percentage of the TOLLRATE = 1
case population was covered by each pattern, showing the relative frequency of each solution in
this data set as additional guidance for comparing contract-strategy options.
In addition to considering these primary solutions, probing deeper into the QCA findings for
TOLLRATE = 1 yields further insights on contract structuring. Table 4-5 lists the secondary
QCA patterns for this outcome, a step in the process toward developing the summaries above.
These lengthier expressions do not incorporate simplifying assumptions, an element discussed
in the previous chapter, which provide the more general solutions in Table 4-6.
Table 4-5 (TOLLRATE = 1):
Expression (from Tosmana output):
PRICING{0} * LENGTH{1} * UPSIDE{0} * RISK{1} +
PRICING{0} * LENGTH{1} * UPSIDE{0} * DOWNSIDE{0} +
PRICING{1} * LENGTH{2} * UPSIDE{1} * DOWNSIDE{1}* RISK{0} +
PRICING{2} * LENGTH{2} * UPSIDE{0} * DOWNSIDE{0}* RISK{1} +
PRICING{0} * LENGTH{0} * UPSIDE{0} * DOWNSIDE{1} * RISK{1} +
PRICING{0} * LENGTH{0} * UPSIDE{0} * DOWNSIDE{0}* RISK{0} +
PRICING{2} * LENGTH{0} * UPSIDE{0} * DOWNSIDE{1}* RISK{0}
Cases explained by this expression:
(WARNOW1+CONFED)
(WARNOW1+MADRID)
(SH121) (WARNOW2) (SKYE) (LISBON) (SANTIAGO)
11 Due to US tax-code benefits for PPP contracts 50 years or longer, this duration has become an artificial lower limit for some domestic PPPs, regardless of whether these projects’ other characteristics necessitate such durations. Since the QCA data set includes PPPs from countries without such a tax structure, the contract-length patterns in the QCA results do not necessarily reflect occasions when 50+ year US contracts would help achieve pricing objectives.

86 Applications
One contract strategy which appeared in many of these eight cases, though it was neither necessary
nor sufficient by itself to support the TOLLRATE = 1 outcome, was the UPSIDE = 0 condition;
that is, the absence of upside revenue-sharing provisions. The logic is understandable, since an
opportunity for increased upside benefit can potentially offset a lower toll rate. Although this
contract strategy may or may not be suitable for a given procurement, its frequency in the data
set made it worth considering as a complement to the primary solutions above.
In summary, if the pricing objective is to achieve a specific toll rate for the Midtown Tunnel,
then decision-makers might consider structuring the contract with one or both of the following
conditions in accordance with the QCA recommendations:
1. Toll rates at the minimum feasible level to cover the project’s costs. (Public subsidies
may be necessary if this level is still higher than the desired toll rate.)
2. Contract provisions for downside risk protection.
The QCA solution for TOLLRATE = 1 also includes a third term, suggesting long-term contract
durations for projects with high traffic-demand risk. Since the Midtown Tunnel procurement has
a low risk score, an initial thought would be that this third QCA term does not apply in this case.
But findings from the QCA method are not to be applied mechanically, but rather combined with
contextual insight. As indicated in the previous footnote, a concession length greater than 50
years may in fact be advisable for US PPPs, regardless of the project risk level, if the value of
the resulting tax benefits would help achieve a desired toll rate.
This approach, which illustrated the use of QCA solutions for structuring a procurement with the
TOLLRATE = 1 outcome, can also be applied to help develop contract strategies for PPPs which
target the other pricing objectives, FREEFLOW = 1 and MINMAX = 1.
5.3. Comparison with Similar Projects from QCA Case Library
To illustrate the third decision-support tool, the full QCA configuration for the new Route 460
solicitation was developed and compared to the existing case library. A mature “parallel project”
with the same configuration was identified, offering a degree of forecasting to suggest potential
results of a procurement in its early stage; subsequent project developments are also considered.

Chapter 5 87
5.3.1. QCA Configuration: New Route 460 Procurement
For the May 2010 solicitation, values for the Route 460 condition and outcome variables are
summarized in Table 5-2, with the initial procurement shown in the first row for comparison.
This procurement emphasized, as previously, the non-availability of public funding. For this
$1-billion-plus project to be viable, the concessionaire would need to implement tolls at or near
revenue-maximizing pricing levels, resulting in a PRICING = 2 value. The proposed 75- to 99-
year length of the new concession produced a LENGTH = 2 value, and the apparent absence of
revenue- and risk-sharing provisions in the concession’s draft term sheet (Appendix F of the
solicitation) corresponded to UPSIDE = 0 and DOWNSIDE = 0. The previously-calculated
raw risk score, being greater than 2.25, equated to a value of RISK = 1.
As for the project’s QCA outcome, efforts to achieve a specific toll rate were not apparent in the
solicitation, nor was congestion management a significant concern for this facility, indicating
TOLLRATE = 0 and FREEFLOW = 0. With no public funding available, the implicit pricing-
related objective was to maximize not an up-front payment, but rather the project scope which
could be achieved with limited toll revenues—a goal which corresponded to MINMAX = 1.
But these circumstances also highlighted a procurement inherently in conflict with itself: the
private sector’s preliminary cost estimates for the minimum project scope were hundreds of
millions of dollars greater than the forecast level of toll income.
ID PRICING LENGTH UPSIDE DOWNSIDE RISK TOLLRATE FREEFLOW MINMAX
460 #1 2 0 1 0 3.4 1 0 0 1
460 #2 2 2 0 0 3.5 1 0 0 1
Table 5-2: QCA Configurations for Route 460 Procurements
5.3.2. Case-Library Comparison
This combination of QCA variables for the second Route 460 procurement was next compared to
the existing library of case configurations to identify a similarly-configured case and to examine
potential parallels between these projects, as was done in the previous chapter’s sensitivity-
analysis comparison of the Madrid airport road with the identically-configured Warnow Tunnel.

88 Applications
Although QCA configuration is not a strict recipe for project performance, it is nonetheless useful
to compare similar procurements to consider whether analogous qualitative results might
reasonably arise and to exercise appropriate cautions in project development.
Prior to exploring such similarities, though, it is necessary to establish which project outcomes
in the historical data set are considered less preferable. Although more specific descriptors can
certainly be defined, a useful qualitative starting point is to characterize the following general
results as undesirable: actual traffic demand substantially lower than anticipated levels, contract
renegotiation (actual or requested), and/or widespread public backlash against the project.
A review of Table 4-4 indicated the new Route 460 procurement exhibited the same conditions
and MINMAX outcome as the renegotiated Warnow Tunnel contract in Rostock, Germany.
This project, as detailed in Appendix C, relied on strong demand to support its development,
but actual traffic counts lay between half and a quarter of initial forecasts, thus meeting the
above criterion of an undesired outcome. A significant driver of the project’s disappointing
revenue performance was the slower-than-anticipated development of Rostock’s port, resulting
in a much smaller percentage of commercial traffic (2% instead of the forecast 8%) for which
toll rates were 5-6 times higher than for passenger vehicles.
The 2 / 2 / 0 / 0 / 1 configuration was not the originally-intended structure for this project but
resulted from a renegotiation of the tunnel’s contract, as requested by the concessionaire. The
revised contract not only provided the operator greater flexibility in setting toll rates but also
lengthened the concession’s duration from 30 years to 50 years. The Rostock community agreed
to these terms largely because the tunnel’s insolvency could have placed the facility in the city’s
hands, yet the law did not permit the public sector to charge tolls for its operation. As a result,
the city would have had to raise taxes or reduce services elsewhere, and more favorable terms
for the private operator were seen as the lesser of two evils.
The Warnow Tunnel’s situation bears some apparent parallels with the Route 460 procurement.
Both depended on development of a strong commercial traffic base to be viable, and both treated
concession extensions as appropriate means to absorb project risks. (Section 13.02(f) of the

Chapter 5 89
proposed Route 460 term sheet specified contract extensions in lieu of financial payments for
any compensation events.) For a contract proceeding on the basis of the May 2010 solicitation
for Route 460, it would be reasonable to develop a particularly robust contingency strategy for
toll-revenue forecasts, given the Warnow Tunnel’s susceptibility to traffic-demand variations.
5.3.3. Epilogue: Addendum to Route 460 Procurement
In July 2010, a substantial revision to the new Route 460 solicitation was released.12 Among
many other changes, the most significant was the announcement that public funding would now
be allocated to the project. Instead of developing the road solely as a toll-supported facility,
proposers were asked to indicate the minimum subsidy they would require for delivering the
specified scope of work—still a MINMAX = 1 outcome. The addendum correspondingly
reduced the project’s reliance on commercial development, deleting the previously-mentioned
Section 3.1.1.2 which had declared the Comprehensive Agreement’s “support for the develop-
ment of commercial facilities,” and including instead simply a note that the state would consider
any proposed commercial-development options which would help improve the project’s
feasibility (Section 3.1.1.8).
The revised solicitation also indicated the state’s willingness to accept additional construction-
phase risk (e.g., for differing site conditions) and to provide limited operations-phase mainten-
ance services if desired by the concessionaire. The prior term sheet was deleted in its entirety,
market-precedent conditions for major contract provisions were assured, and previous require-
ments for small-business participation were relaxed. These modifications combined to reduce
the project’s cost relative to its earlier scope, terms, and risk allocation.
The direction of this shift in the procurement serves to reinforce the prior conclusions drawn
by evaluating Route 460 alongside the Warnow Tunnel. Although the July 2010 addendum
appeared after the previous QCA comparisons were drafted, it effectively addressed the central
imbalance which was identified as common to both projects—excessive costs in relation to
anticipated revenues. The Route 460 procurement is now internally consistent, no longer in 12 Virginia Department of Transportation. (2010b). Solicitation for Conceptual Proposals: U.S. Route 460 Corridor Improvements Project through the Public-Private Transportation Act, Addendum #1 (issued July 12, 2010).

90 Applications
conflict with itself: by both reducing cost and increasing revenue, the revised solicitation trans-
formed the project’s marketability and attractiveness to concessionaires. Whether these steps
will be sufficient to make the Route 460 endeavor ultimately successful remains to be seen.
The conclusions of this case-library comparison, corroborated by subsequent developments,
illustrate one of the three decision-making tools resulting from this research. Along with the
other two applications—estimating a toll-financed project’s viability using the risk worksheet
and evaluating QCA patterns for contract-structuring guidance—these approaches provide a
practical toolkit to assist decision-makers in planning and evaluating PPP procurements.

Chapter 6 91
Chapter 6 DISCUSSION
The preceding analysis not only indicated distinct patterns of contract strategies corresponding
to specific public-policy outcomes, but also shed light on general underlying principles which
influence the effectiveness of certain strategies in achieving these objectives. These principles
are here probed further through consideration of the data set from other angles, providing
additional insights on the relationship of PPP contract structure and outcomes.
These investigations fall under three broad headings. First, the QCA table of configurations
for each outcome is studied more closely to identify more subtle trends in the data set. Next, a
review and comparison of the cases’ risk scores indicates additional patterns not apparent in the
previous analysis, which necessarily dichotomized this variable for QCA evaluation but gave up
some information in the process. Finally, general observations on the nature of PPP risk are
elucidated though closer consideration of the traffic-risk index.
6.1. Further Outcome-Specific Observations
Sorting the cases by outcome and manually reviewing the trends in the conditions offered further
insights into the interactions among these variables, in addition to the patterns identified through
QCA application. In the following, the RISK variable is shown as its raw traffic-risk score, and
the cases for each outcome are sorted from highest to lowest risk score in order to probe possible
relationships between risk variations and other conditions.
6.1.1. MINMAX Outcome: Minimizing Subsidy or Maximizing Revenue
Although QCA already identified the correspondence of PRICING = 2 and DOWNSIDE = 0 to
the MINMAX = 1 outcome, other more subtle patterns became evident from a review of Table
6-1. In particular, the LENGTH variable was inversely proportional, so to speak, with the risk
score; that is, projects with lowest traffic-demand risk generally had the longest concession
terms, while those with moderate-to-high risk had short or variable-length terms. Although the
correspondence of a longer concession with a less risky project may initially seem contradictory,

92 Discussion
closer reflection indicates this pair of variables is reasonable for revenue-maximizing projects:
since the objective is to achieve the smallest subsidy or greatest possible toll income, this result
will logically be achieved by lengthening the concession term. Similarly, for the higher-risk,
shorter-term projects such as the Herren, Cross City, and El Melon tunnels, one might reasonably
expect a high level of traffic-demand risk would lead to a longer or variable-length concession to
buffer this risk. One can only conclude that the architects of these contracts felt the length-to-
risk relationship was appropriate.
ID PRICING LENGTH UPSIDE DOWNSIDE RISK TOLLRATE FREEFLOW MINMAX
ROUTE460 2 0 1 0 3.4 0 0 1
HERREN 2 1 0 0 3.4 0 0 1
CROSCITY 2 1 0 0 3.0 0 0 1
ELMELON 2 1 1 0 2.8 0 0 1
WARNOW2 2 2 0 0 2.6 1 0 1
407ETR2 2 2 0 0 1.9 0 0 1
SKYWAY 2 2 0 0 1.8 0 0 1
Table 6-1: MINMAX Outcome Sorted by Risk Score
While it is not surprising to encounter revenue-maximizing pricing for projects whose objective
is MINMAX = 1 (to minimize public subsidy, to maximize an up-front payment, or generally to
provide greater latitude in a PPP toll structure’s “degrees of freedom,” enabling a concessionaire
to deliver the most advantageous financial offer), the consistent appearance of DOWNSIDE = 0
along with this PRICING = 2 condition validates QCA’s ability to identify contextual patterns of
contract strategies, not merely isolated conditions which support a given outcome. Even though
this DOWNSIDE = 0 and PRICING = 2 combination is not necessarily an anticipated solution, it
is nonetheless logical and underscores the strength of the QCA approach in highlighting inter-
relationships among variables, one of its advantages over many strictly quantitative methods.
6.1.2. FREEFLOW Outcome: Maximizing Throughput
The previous chapter’s analysis highlighted the not-unsurprising relationship between PRICING
= 1 and the outcome FREEFLOW = 1, with demand-linked toll rates being effective in managing
traffic congestion. But another facet of these projects, as shown in Table 6-2, is the absence of

Chapter 6 93
variable-length concessions (LENGTH = 0) in conjunction with this outcome. Although this
could result from the limited diversity of the data set, it also stands to reason that projects with
relatively certain demand can be marketable with fixed-length concessions, a structure which is
more familiar to the finance sector, since a primary advantage of variable-term contracts is their
ability to absorb demand uncertainties without significantly inflating the project’s cost.
ID PRICING LENGTH UPSIDE DOWNSIDE RISK TOLLRATE FREEFLOW MINMAX
407ETR1 1 1 0 0 2.9 0 1 0
I-495 1 2 1 0 1.8 0 1 0
SR91 1 1 1 0 1.4 0 1 0
SH121 1 2 1 1 1.4 1 1 0
I-595 1 1 0 0 1.3 0 1 0
Table 6-2: FREEFLOW Outcome Sorted by Risk Score
Another benefit provided by the QCA approach is the ability to examine secondary solutions,
prior to inclusion of simplifying assumptions, to identify more subtle relationships among the
variables. The FREEFLOW = 1 outcome is no exception: even though its primary solution
(PRICING = 1) is not unintuitive, an examination of Table 4-7, reproduced below, highlights
other trends as well.
Table 4-7: Analysis of FREEFLOW = 1 (with remainders)
Expression: PRICING{1} * LENGTH{1} * DOWNSIDE{0} * RISK{0} +
PRICING{1} * LENGTH{1} * UPSIDE{0} * DOWNSIDE{0} +
PRICING{1} * LENGTH{2} * UPSIDE{1} * RISK{0}
Cases Explained: (I-595+SR91) (I-595+407ETR1) (I-495+SH121)
In addition to the expected PRICING = 1 solution for all five cases, the secondary solution shows
four of these projects also exhibit the RISK = 0 condition, indicating the close correspondence of
the public-sector prioritization of a throughput-maximizing outcome with a low traffic-demand-
risk environment. Similarly, the DOWNSIDE = 0 condition appears for four of the five cases, a
coverage rate of 80%, suggesting the less-obvious conclusion that PPPs with the PRICING = 1
outcome frequently incorporate no provisions for downside-risk protection. While this finding is
less immediately apparent, it is nevertheless a logical result for projects with high traffic demand
and underscores again QCA’s ability to identify subtle as well as general patterns in data sets.

94 Discussion
6.1.3. TOLLRATE Outcome: Achieving Specific Toll Levels
For the TOLLRATE = 1 outcome, fewer clear data trends are evident in Table 6-3 than for the
preceding objectives. An element of potential interest is that only one of these eight configura-
tions evidences an UPSIDE = 1 value, and this project (SH121) is the sole case in this class
which also has a dual FREEFLOW = 1 outcome. Hence it appears reasonable to conclude that
projects for which the sole pricing objective is to target a specific toll rate generally have not
included upside revenue-sharing provisions—perhaps a tacit acknowledgement that PPPs with
this goal are not expected to generate a significant upside possibility.
ID PRICING LENGTH UPSIDE DOWNSIDE RISK TOLLRATE FREEFLOW MINMAX
WARNOW1 0 1 0 0 3.4 1 0 0
WARNOW2 2 2 0 0 2.6 1 0 1
SKYE 0 0 0 1 2.4 1 0 0
CONFED 0 1 0 1 2.4 1 0 0
MADRID 0 1 0 0 2.1 1 0 0
LISBON 0 0 0 0 1.6 1 0 0
SH121 1 2 1 1 1.4 1 1 0
SANTIAGO 2 0 0 1 1.3 1 0 0
Table 6-3: TOLLRATE Outcome Sorted by Risk Score
6.2. Review and Comparison of Risk Scores
6.2.1. Outcome Trends in Risk Scores
One question which arose during the data-collection phase was whether the non-dichotomized
traffic-risk scores would correspond significantly with certain pricing outcomes. These data are
charted in Figure 6-1; the total number of points is greater than the case population, since some
projects evidenced multiple simultaneous outcomes. Not unexpectedly, the MINMAX = 1
projects were significantly riskier, as befits the principle of aligning greater risk with greater
reward. Although the TOLLRATE and FREEFLOW outcomes each had a single high-risk
outlier (in both cases, the first contract for a PPP which was later re-procured), the remainder
of these data sets indicates projects for which the FREEFLOW outcome is prioritized tend to be
the least risky, followed by those for which a certain toll rate is targeted. Both these outcomes
correspond to lower-risk projects than those seeking to achieve the MINMAX objective.
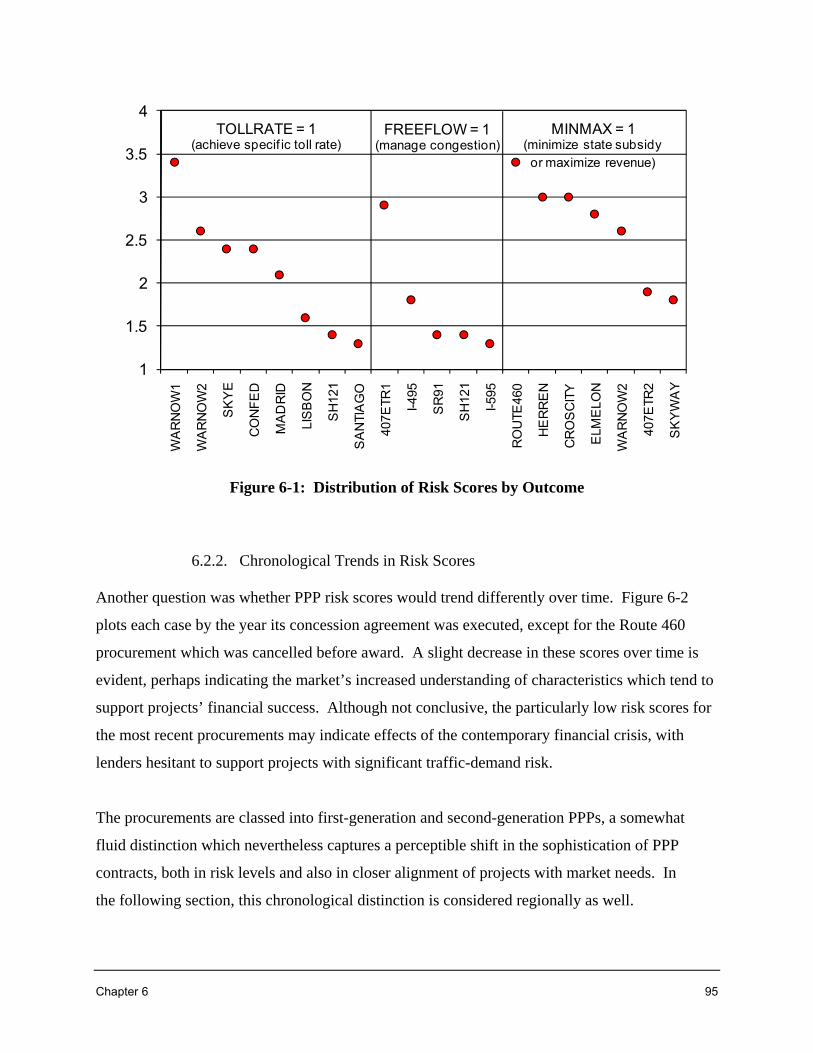
Chapter 6 95
1
1.5
2
2.5
3
3.5
4
WA
RN
OW
1
WA
RN
OW
2
SK
YE
CO
NF
ED
MA
DR
ID
LIS
BO
N
SH
121
SA
NTI
AG
O
407E
TR1
I-495
SR
91
SH
121
I-595
RO
UTE
460
HE
RR
EN
CR
OS
CIT
Y
ELM
ELO
N
WA
RN
OW
2
407E
TR2
SK
YW
AY
TOLLRATE = 1(achieve specif ic toll rate)
FREEFLOW = 1(manage congestion)
MINMAX = 1(minimize state subsidyor maximize revenue)
Figure 6-1: Distribution of Risk Scores by Outcome
6.2.2. Chronological Trends in Risk Scores
Another question was whether PPP risk scores would trend differently over time. Figure 6-2
plots each case by the year its concession agreement was executed, except for the Route 460
procurement which was cancelled before award. A slight decrease in these scores over time is
evident, perhaps indicating the market’s increased understanding of characteristics which tend to
support projects’ financial success. Although not conclusive, the particularly low risk scores for
the most recent procurements may indicate effects of the contemporary financial crisis, with
lenders hesitant to support projects with significant traffic-demand risk.
The procurements are classed into first-generation and second-generation PPPs, a somewhat
fluid distinction which nevertheless captures a perceptible shift in the sophistication of PPP
contracts, both in risk levels and also in closer alignment of projects with market needs. In
the following section, this chronological distinction is considered regionally as well.

96 Discussion
1
1.5
2
2.5
3
3.5
4
1990
1991
1992
1993
1994
1994
1996
1998
1999
1999
2002
2003
2005
2006
2007
2007
2009
First-Generation PPPs Second-Generation PPPs
Figure 6-2: Distribution of Risk Scores by Year
6.2.3. Geographic Trends in Risk Scores
The risk scores for each country or region with more than one project in the data set are plotted
in Figure 6-3 from highest- to lowest-risk projects within each region, and several trends are
apparent from this chart. Germany, whose infrastructure-PPP program is relatively young
(having started with the Warnow Tunnel, whose concession agreement was signed in 1996),
evidences projects with uniformly higher risk scores than Spain and Portugal, countries with
decades of experience in selecting and structuring highway concessions. Canada’s PPPs largely
span the European range, while the generally recent US projects in this data set tend toward
lower risk scores, an indicator of that market’s lesser appetite for demand risk.13 The high-risk
Route 460 outlier was indeed not financeable as initially proposed.
13 The US is not without its share of high-risk PPPs: earlier procurements such as the Dulles Greenway (opened in 1995) and Pocahontas Parkway (opened in 2002) would have higher risk scores but are not included in this data set.

Chapter 6 97
The first- and second-generation PPPs are again identified in the chart below, indicating regional
variations in risk levels over time. As might be expected, risk scores generally decreased over
time as countries’ PPP markets matured.
1.0
1.5
2.0
2.5
3.0
3.5
4.0
WA
RN
OW
1
HE
RR
EN
WA
RN
OW
2
MA
DR
ID
LIS
BO
N
407E
TR1
CO
NF
ED
407E
TR2
RO
UTE
460
SK
YW
AY
I-495
SR
91
SH
121
I-595
ELM
ELO
N
SA
NTI
AG
O
Germany CanadaIberia USA Chile
First-generation PPPs Second-generation PPPs
Figure 6-3: Distribution of Risk Scores by Region
6.3. General Observations on PPP Risk
6.3.1. Renegotiation and Contingency Reduction
One observation which arises from comparing the risk levels in the pairs of re-procured projects
(i.e., Germany’s Warnow Tunnel and Canada’s 407 ETR) is that these projects’ traffic-demand
risk decreased significantly from the original procurement: from 2.9 to 1.9, respectively, and
from 3.4 to 2.6. Although this reduction intuitively seems plausible, and authors such as Hart
and Moore (1988) note contract renegotiations indeed take place under conditions of reduced
uncertainty, the risk table helps quantify the decrease and identifies specific project-risk elements

98 Discussion
which explain the majority of this shift. For both the Warnow Tunnel and 407 ETR, the most
significant areas of risk improvement lay in the knowledge of an area’s toll-acceptance culture
and of usage patterns for a specific facility, as expressed by the Tolling Culture and Toll Facility
Details elements in Table 6-4.
Project Attribute
Traffic Risk Index Warnow Tunnel
407 ETR
1 2 3 4 5 #1 #2 #1 #2
Tolling Culture
Toll roads well estab-lished: data on actual use are available
No toll roads in the country, uncertainty over toll acceptance
5 1 5 1
Toll Facility Details
Extension/expansion of existing road
Greenfield site 3 1 4 1
Table 6-4: Experience-Dependent Risk Factors and Scores
Even so, the contrast between 407 ETR and the Warnow Tunnel highlights that a decrease in risk
does not automatically make a risky project safe or a loss-making PPP profitable.
Independent of any variations in the other risk elements, these projects’ scores for the above two
factors decreased to 1 after several years of operations. This decrease holds true even though
these PPPs were re-procured for different reasons: while the Warnow Tunnel was renegotiated
due to the developer’s financial distress, the 407 ETR concession was unilaterally re-procured by
the government to achieve a different contract structure. Although this latter transaction was not
a renegotiation, strictly speaking, it nevertheless shares a common theme with the Warnow
Tunnel in having its contract terms revisited after several years of operational data became
available.
Comparison of these projects reveals two discrete elements to be considered in pricing a
renegotiation. The more obvious, and more commonly addressed, aspect is whether the project
is exceeding or lagging its revenue forecasts: 407 ETR and the Warnow Tunnel offer respective
examples of these situations. The second and more subtle element is constant, regardless of a

Chapter 6 99
project’s revenue performance, and involves the benefit of reduced uncertainty. Since PPP risk
is priced as cost contingencies relative to its magnitude, and this PPP risk decreases as uncertain
aspects of the project become known, a renegotiated contract properly allots lower compensation
for assuming reduced risk. The revenue-positive or -negative discoveries made on the basis of
prior operational experience are, in essence, sunk costs (or benefits) which are factored into the
renegotiated contract pricing as known elements. In either situation, the risk contingency to be
included in that future contract is reduced, as indicated in the area under the curves in Figure 6-4.
This diagram shows the sample case of a project underperforming its traffic-forecasts but still
benefiting from reduced uncertainty through a smaller subsequent contingency.
Obviously this contingency reduction is not universal: there are still many unknowns remaining
in a renegotiated PPP contract which merit appropriate risk allowances. But as shown in the
above evaluation of the traffic-risk tables, the elements of project risk associated with tolling
culture and facility-usage patterns do indeed decrease with operational experience, regardless of
whether the project lags or exceeds its revenue forecasts. Those in the position of renegotiating
or re-procuring PPP contracts should be aware of this distinction to take both these aspects into
consideration.
As one illustration, the Warnow Tunnel developer’s demand-risk contingency was clearly an
insufficient cushion for actual usage, with traffic levels at half to a quarter of initial forecasts
(7000 vehicles per day, compared to pre-opening daily estimates of 13,000 to 27,000+ vehicles).
Although contract renegotiations lengthened the concession term by 67% (from 30 years to 50
years) to address the initial element of revenue performance, it is difficult to ascertain whether
the state took into account the second aspect of renegotiation pricing—the mitigating influence
of contingency reduction relative to the base case. This implicit benefit should have accrued to
the state in this negotiation, based on the decrease in demand uncertainty in elements such as
toll-acceptance culture and facility-usage patterns between the tunnel’s 2003 opening and its
2006 renegotiation.

100 Discussion
Pro
babi
lity
Range of Anticipated Traffic Demand
Pro
babi
lity
Range of Anticipated Traffic Demand
Forecast Traffic
Actual Traffic Renegotiated
Contract
InitialContract
Contingency
Figure 6-4: Contingency Reduction upon Renegotiation
6.3.2. Distinguishing Demand Risk and Project Risk
The above definition of the RISK variable sharpens the question of what exactly is meant in
referring to a “risky PPP.” At least two interpretations are common, and their understanding
impacts the treatment of upside benefit and the type of incentives which can effectively be
incorporated in a PPP contract.

Chapter 6 101
Pro
bab
ility
Pro
bab
ility
Figure 6-5: One Interpretation of Traffic Risk
(Demand Risk)
The first is reflected in the frequent maxim in PPP discussions that risk should correlate with
reward; i.e., a project with a more significant downside should allow the private sector the
opportunity for more generous returns, and vice versa. This understanding of the concept treats
risk as the likelihood of an outcome and corresponds with the interpretation shown in Figure 6-5:
the curve on the right has a greater downside possibility and thus is balanced with a greater
potential upside benefit.
But another interpretation can also be at play when a “risky project” is discussed, as indicated in
the Standard & Poor’s traffic-risk worksheet and Figure 6-6. This metric addresses more of a
project’s overall economic risk than simply its demand risk. In fact, the term risk is almost a
misnomer here, because the downside scenario is fairly certain: projects with a high S&P traffic-
risk score (and which were designated high-risk in the analysis, or RISK = 1) were likely to have
light traffic demand, a factor which influenced many other elements of the contract structure.
Hence, considering this interpretation as “risk” may indeed be appropriate on a larger project-
level scale in which the near certainty of low traffic levels makes the entire project risky from a
financing or viability standpoint. There is no practical level of upside reward or incentive which
can effectively be offered in such cases to offset this economic risk; as indicated in the left-side
curve of Figure 6-6, even the upside scenario (or right-hand tail) of this probability distribution
still corresponds to a low amount of traffic overall.

102 Discussion
Pro
bab
ility
Pro
bab
ility
Figure 6-6: Another Interpretation of Traffic Risk
(Economic Risk)
6.3.3. Practical Application of Modified Traffic-Risk Worksheet
The Standard & Poor’s traffic-risk index introduced in Bain (2009) formed the basis for
calculating the RISK variable, as detailed previously. Bain observed higher scores on this scale
indicated projects were potentially exposed to greater forecasting risk and uncertainty, and he
further noted these scores “represented lender exposure to particular risks” and “highlighted
issues which required further investigation or analysis.”
While these uses of the risk index are valuable and appropriate, another application for the risk
index emerges from the above analysis. Table 6-5 reiterates the toll-facility attributes evaluated
in this study, and it becomes evident that these categories not only are demand-risk indicators, as
originally intended, but also (when considered together) form a reasonable proxy for gauging
overall traffic demand for a PPP facility. For instance, a highly-congested corridor will by
definition have much stronger demand than one with limited or no congestion; similarly, the
presence of fewer competing roads simply means more of the existing traffic will use the facility
in question. Other attributes, such as the greenfield/brownfield distinction, are less quantitatively
linked to traffic demand; but in the aggregate, the traffic risk score developed below is a useful
“back of the envelope” calculation which can be performed at the earliest stages of a project to
gain an understanding of whether a project is likely to be self-supporting on its own without
outside subsidy or public-sector support.

Chapter 6 103
Notably, the attributes in Table 6-5 are ones which can be evaluated based on existing physical,
geographic, and demographic characteristics. Other elements of the unmodified Standard &
Poor’s index (Table 3-2) require traffic surveys, traffic and revenue studies, and even an
established tolling plan—attributes which require fairly advanced development of a project.
But the subset of factors summarized here can be evaluated even before development begins,
furnishing a rough proxy for a road’s feasibility as a self-supporting PPP.
Project Attribute
Traffic Risk Index
1 2 3 4 5
Tolling Culture
Toll roads well established: data on actual use are available
No toll roads in the country; uncertainty over toll acceptance
Toll Facility Details
Estuarial crossings; radial corridors into urban areas
Dense, urban networks; ring roads/ beltways around urban areas
Extension/expansion of existing road Greenfield site
Stand-alone (single) facility
Reliance on other, proposed highway improvements
Highly congested corridor Limited/no congestion
Few competing roads Many alternative routes
Users High-income, time-sensitive market Average/low-income market
Traffic Growth
Driven by/correlated with existing factors Reliance on future growth factors, new developments, etc.
Table 6-5: Excerpt from Risk Worksheet with Modified Traffic Risk Index
based on Bain (2009)
In summary, these closer considerations of the QCA data set and the nature of risks evaluated in
the analysis shed additional light on how contract strategies interact with outcomes, and how the
definition of traffic risk can affect negotiations and early-stage project evaluation.


Chapter 7 105
Chapter 7 CONCLUSION
Through a review of international PPP contract strategies and the exploration of relevant public-
policy principles, the central research question—“Given specific policy objectives for road
pricing, how should public owners select PPP contract strategies which support these outcomes?”
—was developed. The method of qualitative comparative analysis provided a flexible frame-
work for identifying similarities among seemingly-disparate projects, and for applying these
common elements for decision-making in structuring future procurements.
7.1. Summary of Contributions
This work presents six main contributions: the first three are primarily focused toward academia,
while the last three provide new decision-making tools to aid practitioners.
1. Unifying and making accessible PPP-related contributions from academic literature
across a broad span of disciplines, including construction, transportation, finance,
economics, accounting, policy, and law. Over 450 papers are identified and categorized
by topic (Appendix A), furnishing an extensive interdisciplinary catalog of the prior art
for researchers in this field.
2. Distinguishing public objectives and public interest—topics which are frequently used
interchangeably, complicating the core issues and making them more difficult to address.
Yet considering public interest to represent the unvarying best practices for infrastructure
procurements, while public objectives comprise goals which may legitimately vary
among procurements, enables more effective consideration of the central issues in
procurement structuring and policy.
3. Introducing qualitative comparative analysis to applied construction research. In this
field, this work is among the first contributions to use the QCA method and is the first, to
the author’s knowledge, to apply the mvQCA approach. Given the frequent occurrence

106 Conclusion
of qualitative problems in construction research, the availability of such a tool with
quantitative aspects can be of great value in strengthening rigor and replicability in
future investigations.
4. Introducing the modified traffic-risk index as a simple-to-use proxy for PPP feasibility.
This eight-attribute worksheet can be applied early in the development process to gauge
the approximate overall economic risk of a proposed toll-road project.
5. Clarifying the relationship of PPP contract strategies to specific outcomes. The QCA
patterns developed in this work yield insights into effective combinations of pricing,
duration, and risk-management approaches for achieving desired contract objectives.
6. Developing a PPP case library for assessing projects under consideration. This
framework for distilling projects into numeric configurations of contract strategies and
outcomes furnishes a structured approach for comparing past and future procurements
and developing general predictions about outcomes. The resulting case library of project
characteristics may be compared to current and proposed PPPs throughout the world.
7.2. Limitations of Study
This study necessarily faces several limitations in its approach and application. Among the
methodological cautions of the QCA approach is that its results, as crisp and tidy as they may
appear, must not be over-generalized. The method summarizes and reports patterns from the
available data set, whether or not this set is entirely representative of the broader population.
Further, given the complexity of qualitative phenomena, the interpretation and application of
QCA findings must be taken as guidelines, not as guaranteed recipes for project success.
An additional limitation, noted above, involves the possibility of geographic bias in this study’s
data set. On one hand, a wider assortment of PPPs could yield more comprehensive insights into
the interaction among contract strategies and outcomes; but on the other, country-specific traits
(such as US tax benefits for PPP contracts 50 years and longer) are obscured with a more diverse
geographic population. These constraints must be borne in mind while interpreting the results.

Chapter 7 107
7.3. Directions for Future Work
Two initiatives for further developing this work include (a) introducing new conditions into the
QCA structure and (b) further populating the case library to assist in evaluating future procure-
ments. Consideration of additional conditions, or contract strategies, would potentially lend new
insights into other factors which may be significant in influencing procurement outcomes. Some
elements may be specific to certain regions or types of projects, and thus not fully considered in
this current study. In addition, the benefit of developing further cases for the core data set would
provide a greater array of projects against which to compare future procurements with similar
QCA configurations, strengthening the predictive aspects of this decision-support framework.
In discussing comparative applications for the case library, contract outcomes which could
be qualitatively considered less desirable were mentioned briefly—actual traffic demand far
lower than anticipated levels, contract renegotiation (actual or requested), and/or widespread
public backlash against the contract. The presence or absence of these situations could also
be considered a QCA outcome in itself, enabling a subsequent study to analyze projects for
patterns of factors contributing to these undesirable results.
7.4. Implications for Policy and Practice
This work developed three practical tools to assist decision-makers in structuring PPP procure-
ments. The first of these, the modified traffic-risk worksheet, distilled a lengthy list of project
attributes into an eight-step evaluation which enables a rapid early-stage estimate of a toll-
financed project’s viability, even before financial and traffic studies have been performed. By
quantifying characteristics of the Route 460 PPP in southeastern Virginia, this tool classified the
procurement as one with high traffic risk which would encounter challenges in sustaining itself
solely by toll revenues. The state’s subsequent allotment of public funds to support the project
furnished an independent corroboration of this quick analysis.
The second tool directly applied the analytical QCA results as guidance for selecting PPP
contract strategies, based on desired pricing objectives. Through a study of 18 domestic and
international PPP case studies, this research identified patterns of contract strategies which

108 Conclusion
were consistently present for projects targeting three specific pricing objectives—a given toll
rate, congestion management, or a minimum subsidy/maximum up-front payment. Application
of this tool to Virginia’s Midtown Tunnel, a current procurement aiming to deliver a broad scope
of improvements for a $1.50 toll rate, illustrated several contract-structuring options based on
QCA patterns from previous PPPs with the same objective.
Finally, case-library comparisons furnished a third decision-support tool for drawing parallels
between proposed and established PPPs. Procurements with the same QCA configuration—a
numerical pattern summarizing a project’s contract strategies and pricing objectives—can be
compared with each other to provide a quasi-forecast suggesting potential outcomes for a PPP
still under development. Because the re-issued Route 460 procurement shared the same QCA
configuration as another case study in the data set, a troubled tunnel concession in Germany,
mitigation strategies appropriate to this contract were proposed for Route 460 as well. The
recommended approach, taking decisive steps to narrow the gap between forecast project costs
and revenues, was indeed followed in a subsequent addendum to the Route 460 solicitation.
7.5. Final Thoughts
The previous analysis and conclusions spring from the central idea that economic viability is the
key determinant for the feasibility of PPP toll-road contracts. Thus, for instance, outcomes were
selected which focused on pricing-related objectives, and the risk analysis characterized projects
with greater traffic demand as those which were more likely to be self-supporting. This approach
is indeed vital for infrastructure which is project-financed, or paid for entirely by the revenue
stream which it produces.
Although the role of defining appropriate public-policy objectives for PPPs lies outside the scope
of this work, as noted earlier, a few thoughts on the topic can nevertheless be offered. The PPP
delivery method is intrinsically best suited for applications in which it enables infrastructure to
be entirely self-supporting, converting user demand into a facility which directly satisfies that
demand. Adam Smith’s eloquent observations in 1776 are no less valid today:
Chapter 7 109
When high roads, bridges, canals, etc., are in this manner made and supported by the commerce which is carried on by means of them, they can be made only where that commerce requires them, and consequently where it is proper to make them. Their expenses too, their grandeur and magnificence, must be suited to what that commerce can afford to pay. They must be made consequently as it is proper to make them. A magnificent high road cannot be made through a desert country where there is little or no commerce...A great bridge cannot be thrown over a river at a place where nobody passes, or merely to embellish the view from the windows of a neighboring palace.
Highway development differs markedly from the development of social infrastructure—schools,
hospitals, and prisons, for instance—whose funding is rarely linked to users’ contributions and
which thus relinquish the sensitivity of being influenced by users’ choices. This responsiveness
to consumers’ decisions adds both challenge and elegance to the study of highway procurement.
Although infrastructure facilities can certainly be provided where traffic demand is not sufficient
to support them, it is essential to recognize these projects will require external revenues and that
the PPP delivery structure cannot make such projects financially self-sustaining. It is hoped this
study can offer some small contribution toward evaluating when PPPs are best used, and in these
cases, how they can be structured to achieve their desired outcomes most effectively.

References 111
REFERENCES
Albalate, D., and Bel, G. (2009). "Regulating concessions of toll motorways: an empirical study on fixed vs. variable term contracts." Transp. Res. Part A, 43(2), 219-229.
Amenta, E., and Poulsen, J. D. (1994). "Where to begin: a survey of five approaches to selecting independent measures for qualitative comparative analysis." Sociol. Methods Res., 23(1), 22-53.
Australia: Department of Treasury and Finance. (2006). Partnerships Victoria guidance material: overview, July 2006, Melbourne.
Bain, R. (2009). Toll road traffic & revenue forecasts: an interpreter's guide, Robert Bain, Kent, UK.
Bel, G., and Foote, J. (2009). "Tolls, terms and public interest in road concessions privatization: a comparative analysis of recent transactions in the USA and France." Transp. Rev., 29(3), 397-413.
Benouaich, M. A. (2007). "Aligning public and private interests through tolling regime in concession contracts." Presentation, IBTTA 75th Annual Meeting, Vienna, Austria, <http://www.ibtta.org/files/PDFs/Benouaich_Michael.pdf> (July 31, 2009).
Berg-Schlosser, D., and De Meur, G. (2009). "Comparative research design: case and variable selection." Configurational comparative methods: qualitative comparative analysis (QCA) and related techniques, B. Rihoux and C. C. Ragin, eds., SAGE Publications, Thousand Oaks, CA, 19-32.
Brown, D. J., and Heal, G. M. (1983). "Marginal vs. average cost pricing in the presence of a public monopoly." Am. Econ. Rev., 73(2), 189-193.
Canada: Industry Canada. (2003). The public sector comparator: a Canadian best practices guide, May 2003, Ottawa.
Chu, C.-P., and Tsai, J.-F. (2004). "Road-pricing models with maintenance cost." Transportation, 31(4), 457-477.
Cronqvist, L. (2007). "Konfigurationelle Analyse mit Multi-Value QCA als Methode der vergleichenden Politikwissenschaft mit einem Fallbeispiel aus der vergleichenden Parteienforschung," Dissertation, Philipps-Universität, Marburg, Germany.
d'Alpaos, C., Dosi, C., and Moretto, M. (2006). "Concession length and investment timing flexibility." Water Resources Res., 42(2), 1-4.
De Meur, G., Rihoux, B., and Yamasaki, S. (2009). "Addressing the critiques of QCA." Configurational comparative methods: qualitative comparative analysis (QCA) and related techniques, B. Rihoux and C. C. Ragin, eds., SAGE Publications, Thousand Oaks, CA, 147-165.
de Palma, A., Kilani, M., and Lindsey, R. (2005). "Comparison of second-best and third-best tolling schemes on a road network." Transp. Res. Rec., 1932, 89-96.
de Rus, G., and Romero, M. (2004). "Private financing of roads and optimal pricing: is it possible to get both?" Annals Regional Sci., 38(3), 485-497.
Debande, O. (2002). "Private financing of transport infrastructure: an assessment of the UK experience." J. Transp. Econ. Policy, 36(3), 355-387.
Demsetz, H. (1968). "Why regulate utilities?" J. Law Econ., 11(1), 55-65. Engel, E., Fischer, R., and Galetovic, A. (1997). "Highway franchising: pitfalls and opportunities."
Am. Econ. Rev., 87(2), 68-72.
112 References
Engel, E., Fischer, R., and Galetovic, A. (2001). "Least-present-value-of-revenue auctions and highway franchising." J. Political Econ., 109(5), 993-1020.
Engel, E., Fischer, R., and Galetovic, A. (2002). "A new approach to private roads." Regulation, 25(3), 18-22.
Fayard, A. (2005). "Analysis of highway concession in Europe." Res. Transp. Econ., 15, 15-28. FHWA. (2007a). Case studies of transportation public-private partnerships around the world, July
7, 2007, Washington, DC. FHWA. (2007b). Case studies of transportation public-private partnerships in the United States,
July 7, 2007, Washington, DC. FHWA. (2007c). User guidebook on implementing public-private partnerships for transportation
infrastructure projects in the United States, July 7, 2007, Washington, DC. FHWA. (2008). "Public-private partnerships for highway infrastructure." Public-private
partnerships for highway infrastructure, (in press). FHWA. (2009). Public-private partnerships for highway infrastructure: capitalizing on
international experience, Report No. FHWA-PL-09-010, Washington, DC. Garvin, M. J. (2007). "America's infrastructure strategy: drawing on history to guide the future."
White paper, KPMG and Stanford University Collaboratory for Research on Global Projects.
Garvin, M. J., and Bosso, D. (2008). "Assessing the effectiveness of infrastructure public-private partnership programs and projects." Pub. Works Manage. Policy, 13(2), 162-178.
Goldman Sachs. (2005). Presentation, US/Mexico Border Finance Conf., August 17, 2005, <http://uac.sct.gob.mx/fileadmin/espanol/seminariocct/resultados/sesion_5/S5A_JH.pdf> (April 10, 2008).
Gramlich, E. M. (1994). "Infrastructure investment: a review essay." J. Econ. Lit., 32(3), 1176-1196.
Grimsey, D., and Lewis, M. K. (2004). Public private partnerships: the worldwide revolution in infrastructure provision and project finance, Edward Elgar, Cheltenham, UK.
Guasch, J. L. (2004). Granting and renegotiating infrastructure concessions: doing it right, World Bank, Washington, DC.
Hart, O., and Moore, J. (1988). "Incomplete contracts and renegotiation." Econometrica, 56(4), 755-785.
Hartman, R. S., Jensen, K. A., and Seiden, K. P. (1994). "Strategic rate making in the context of dynamic Ramsey pricing." Applied Econ., 26(4), 363-374.
Herrmann, A. M., and Cronqvist, L. (2009). "When dichotomisation becomes a problem for the analysis of middle-sized datasets." Int. J. Soc. Res. Method., 12(1), 33-50.
HRPDC: Hampton Roads Planning District Commission. (2005). "Travel demand forecasting: state of practice review." Toll feasibility study, October 28, 2005.
Klein, M. (1998). "Rebidding for concessions." Public policy for the private sector, World Bank, Note No. 161 (Nov. 1998).
Landa, R. T., and Rogozinski, J. (1998). "Private infrastructure concessions: the 1989-1994 national highway program in Mexico." Working paper 138273, Social Science Research Network.
Levinson, D. (2005). "Paying for the fixed costs of roads." J. Transp. Econ. Policy, 39(3), 279-294.
Matsukawa, T., and Habeck, O. (2007). Review of risk mitigation instruments for infrastructure financing and recent trends and developments, World Bank, Washington, DC.

References 113
Mayer, J. (2007). "Private returns, public concerns: addressing private-sector returns in public-private highway toll concessions." Transp. Res. Rec., 1996, 9-15.
McGraw-Hill. (2009). "Public-private partnership: accelerating transportation infrastructure investment." SmartMarket Report, M. A. Russo, ed., McGraw-Hill Construction, Bedford, MA.
Miller, J. B. (2000). Principles of public and private infrastructure delivery, Kluwer Academic Publishers, Norwell, MA.
Miller, J. B., Garvin, M. J., Ibbs, C. W., and Mahoney, S. E. (2000). "Toward a new paradigm: simultaneous use of multiple project-delivery methods." J. Manage. Eng., 16(3), 58-67.
Newbery, D. M. (1989). "Cost recovery from optimally designed roads." Economica, 56(222), 165-185.
Ng, S. T., Xie, J., Skitmore, M., and Cheung, Y. K. (2007). "A fuzzy simulation model for evaluating the concession items of public-private partnership schemes." Automation in Constr., 17(1), 22-29.
Nombela, G., and de Rus, G. (2004). "Flexible-term contracts for road franchising." Transp. Res. Part A, 38(3), 163-179.
Oh, J. E., Labi, S., and Sinha, K. C. (2007). "Implementation and evaluation of self-financing highway pricing schemes: a case study." Transp. Res. Rec., 1996, 25-33.
Ortiz, I. N., and Buxbaum, J. N. (2008). "Protecting the public interest in long-term concession agreements for transportation infrastructure." Pub. Works Manage. Policy, 13(2), 126-137.
PIRG Education Fund, Illinois. (2009). Privatization and the public interest: the need for transparency and accountability in Chicago’s public asset lease deals, Fall 2009, Chicago, IL.
Ponti, M. (2005). "The regulatory issues of transport infrastructures, and of toll highways in particular." Res. Transp. Econ., 15, 1-4.
Ragazzi, G. (2005). "Tolls and project financing: a critical view." Res. Transp. Econ., 15, 41-53. Ragin, C. C. (1987). The comparative method: moving beyond qualitative and quantitative
strategies, University of California Press, Berkeley, CA. Ragin, C. C. (2006). "Set relations in social research: evaluating their consistency and coverage."
Political Analysis, 14(3), 291-310. Ragin, C. C., and Rihoux, B. (2004). "Qualitative comparative analysis (QCA): state of the art and
prospects." Qualitative Methods: Newsletter of Am. Pol. Sci. Assn., 2(2), 3-13. Rihoux, B., and De Meur, G. (2009). "Crisp-set qualitative comparative analysis (csQCA)."
Configurational comparative methods: qualitative comparative analysis (QCA) and related techniques, B. Rihoux and C. C. Ragin, eds., SAGE Publications, Thousand Oaks, CA, 33-68.
Russell, A. D., and Nelms, C. (2006). "The public sector comparator: uses and abuses." Proc., Joint CIB W065/W055/W086 Int'l Symposium: Construction in the XXI Century, Rome.
Samuel, P. (2008). "Florida DOT to explore lease/concession or monetization of I-75 Alligator Alley." TollRoadsNews, March 21, 2008.
Sawyer, M. (2005). "The Private Finance Initiative: the UK experience." Res. Transp. Econ., 15, 231-245.
Sharp, C., Button, K., and Deadman, D. (1986). "The economics of tolled road crossings." J. Transp. Econ. Policy, 20(2), 255-274.
Sheehan, M. (1991). "Why Ramsey pricing is wrong: the case of telecommunications regulation." J. Econ. Iss., 25(1), 21-32.

114 References
Small, K. A. (2010). "Private provision of highways: economic issues." Transp. Rev., 30(1), 11-31. Smith, A. (1776). "Of the expense of public works and public institutions." An inquiry into the
nature and causes of the wealth of nations, W. Strahan and T. Cadell, London. Taylor, J. E., Dossick, C. S., and Garvin, M. J. (2009). "Constructing research with case studies."
Proc., Construction Research Congress 2009, ASCE, Seattle, Wa., 1469-1478. Thomson, J. M. (1998). "Reflections on the economics of traffic congestion." J. Transp. Econ.
Policy, 32(1), 93-110. Ubbels, B., and Verhoef, E. T. (2008). "Auctioning concessions for private roads." Transp. Res.
Part A, 42(1), 155-172. United Kingdom: Ministry of Transport. (1964). Road pricing: the economic and technical
possibilities, HM Stationery Office, London. United Kingdom: HM Treasury. (2007). Quantitative assessment user guide, March 2007, London. Urban Land Institute (ULI) and Ernst & Young. (2007). Infrastructure 2007: a global perspective,
Urban Land Institute, Washington, DC. US House of Representatives. (2007). "Public-private partnerships: financing and protecting the
public interest." Hearing, Transportation and Infrastructure Committee, Feb. 13, 2007 (110th Congress, 1st session), Government Printing Office, Washington, DC.
US Department of Transportation (USDOT). (2004). Report to Congress on public-private partnerships, December 2004, Washington, DC.
Vassallo, J. M. (2004). "Short-term infrastructure concessions: conceptual approach and recent applications in Spain." Pub. Works Manage. Policy, 8(4), 261-270.
Vassallo, J. M., and Gallego, J. (2005). "Risk sharing in the new public works concession law in Spain." Transp. Res. Rec., 1932, 1-8.
Vassallo, J. M., and Sánchez-Soliño, A. (2006). "Minimum income guarantee in transportation infrastructure concessions in Chile." Transp. Res. Rec., 1960, 15-22.
Vickrey, W. (1963). "Pricing in urban and suburban transport." Am. Econ. Rev., 53(2), 452-465. Vining, A. R., and Boardman, A. E. (2008). "Public-private partnerships in Canada: theory and
evidence." Can. Public Admin., 51(1), 9-44. Walsh, A. (2003). "A legal perspective on risk management in public-private partnership." Public-
private partnerships: managing risks and opportunities, A. Akintoye, M. Beck, and C. Hardcastle, eds., Blackwell Science, Oxford, UK, 153-181.
Yamasaki, S., and Rihoux, B. (2009). "A commented review of applications." Configurational comparative methods: qualitative comparative analysis (QCA) and related techniques, B. Rihoux and C. C. Ragin, eds., SAGE Publications, Thousand Oaks, CA, 123-145.
Ye, S., and Tiong, R. L. K. (2003). "The effect of concession period design on completion risk management of BOT projects." Constr. Manage. Econ., 21(5), 471-482.
Zhang, X., and AbouRizk, S. M. (2006). "Determining a reasonable concession period for private-sector provision of public works and services." Can. J. Civ. Eng., 33(5), 622-631.

115
Appendix A: Survey of PPP Literature


Appendix A 117
The following compendium of PPP-related literature includes nearly 450 citations, primarily
from archival sources in the fields of construction, finance, transportation, economics, public
policy, accounting, and law.
To facilitate locating works of interest, these items are grouped by topic into nine categories,
which are further divided into 69 sub-groups. Although some citations could reasonably be
assigned to multiple categories among these sub-groups, in each case a single classification
deemed most descriptive has been chosen.
1. General Concepts
Topic References
Historical overview (Bovaird 2004); (de Lemos et al. 2000); (Gomez-Ibañez et al. 1991); (Gramlich 1994); (Kwak et al. 2009); (Rienstra and Nijkamp 1997)
PPP terminology (El-Diraby and Gill 2006); (Linder 1999); (Mazouz et al. 2008); (Wettenhall 2003)
Effectiveness of PPPs
(Garvin and Bosso 2008); (Hodge and Greve 2007); (Hodge and Greve 2009)
Success factors (Abdel-Aziz 2007a); (Galilea and Medda 2009); (Jacobson and Choi 2008); (Jefferies 2006); (Li et al. 2005b); (Qiao et al. 2001); (Qiao et al. 2002); (Trafford and Proctor 2006); (Zhang 2005c); (Zhang 2005d)
Research trends and agenda
(Broadbent and Laughlin 1999); (Broadbent and Laughlin 2003b); (Ke et al. 2009); (Schäferhoff et al. 2009); (Sciulli 2007); (Wall and Connolly 2009)

118 PPP Literature
2. Governance Issues
Topic References
Relationship management
(Edelenbos and Klijn 2009); (Edkins and Smyth 2006a); (Grimsey and Lewis 2004); (Hall et al. 2000); (Leitch and Motion 2003); (Smyth and Edkins 2007); (Teicher et al. 2006); (Tranfield et al. 2005); (Yeo and Tiong 2000)
Stakeholder participation, roles, and competencies
(Asenova and Hood 2006); (Becker and Patterson 2005); (Bojović 2006); (El-Gohary et al. 2006); (Fischbacher and Beaumont 2003); (Joyner 2007); (Mustafa 1999); (Norton and Blanco 2009); (Raisbeck 2008); (Scharle 2002); (Wamuziri and Jiang 2008); (Zhang 2005a)
Partnership formation and institutionalization
(Chen et al. 2006b); (Clifton and Duffield 2006); (Demirag et al. 2009); (Koppenjan 2005); (Kumaraswamy et al. 2007); (Kumaraswamy and Anvuur 2008); (Weihe 2008)
Managerial roles/ decisions/skill sets
(Klijn et al. 2008); (Jones and Noble 2008); (Noble and Jones 2006); (Ricaurte et al. 2008)
Institutional roles/ challenges
(Fischer et al. 2006); (Klijn and Teisman 2003); (Kumaraswamy and Zhang 2001)
Public and private-sector perspectives
(Asenova et al. 2002); (Cheung et al. 2009); (Edkins and Smyth 2006b); (Li et al. 2005c); (Zhang 2006)
Public relations (Michalski-Karl et al. 2009)

Appendix A 119
3. Procurement
Topic References
Project selection and viability assessment
(Ashley et al. 1998); (Chen et al. 2001); (Laishram and Kalidindi 2009); (Ock and Han 2002); (Ock et al. 2005); (Ranasinghe 1999); (Ribeiro et al. 2003); (Roco 2005); (Salman et al. 2007); (Tsamboulas et al. 2000); (Wibowo 2005)
Bidding decision and costs
(Dudkin and Välilä 2006); (Ezulike et al. 1997); (Zitron 2006)
Competition (Aragão et al. 2006); (Athias and Nuñez 2008); (Chong et al. 2006); (de Lemos et al. 2003b); (Tiong and Alum 1997a)
Negotiation and proposal selection
(Ababutain and Bullen 2003); (Ahadzi and Bowles 2004); (Ghere 2001b); (Liou and Huang 2008); (Ngee et al. 1997); (Noble 2006); (Tiong and Alum 1997b); (Tiong and Alum 1997c); (Zhang 2004); (Zhang 2005b)
Renegotiation (de Brux 2010); (Guasch and Straub 2006); (Guasch et al. 2007); (Guasch et al. 2008); (Guasch and Straub 2009); (Ho 2006)
Facility lifecycle design
(Loizos et al. 2007); (McClure et al. 2008); (Swaffield and McDonald 2008)
Performance and service objectives
(Robinson and Scott 2009); (Yuan et al. 2009); (Yuan et al. 2010)
Innovation and quality (Eaton et al. 2006); (Eger and Wilsker 2007); (Leiringer 2006); (Rangel and Galende 2010)

120 PPP Literature
4. Contract Design
Topic References
Contract structuring and framework
(Abdel-Aziz 2007b); (Abdel-Aziz and Russell 2001); (Cheng and Tiong 2005); (Cook 2008); (Martimort and Pouyet 2008); (Marty et al. 2005); (Ng and Wong 2006); (Ng and Wong 2007); (Pongsiri 2002); (Rausser and Stevens 2009); (Rodríguez 1999); (Ye and Tiong 2003b)
Contract design modeling
(Chen et al. 2003); (Chen et al. 2006a); (Chen and Subprasom 2007); (Chiou and Lan 2006); (Guo and Yang 2009); (McCowan and Mohamed 2007); (Ng et al. 2007a); (Ng et al. 2007b); (Shen et al. 2002); (Shen and Wu 2005); (Shen et al. 2007); (Subprasom et al. 2003); (Yang and Meng 2000); (Zhou et al. 2008)
Toll adjustment (Athias and Saussier 2006); (Ye and Tiong 2003c)
Concession length (d'Alpaos et al. 2006); (Vassallo 2004); (Ye and Tiong 2003a); (Zhang and AbouRizk 2006)
Variable-length concessions
(Albalate and Bel 2009); (de Rus and Romero 2004); (Engel et al. 1997); (Engel et al. 2001); (Engel et al. 2002); (Engel et al. 2006); (Nombela and de Rus 2004)
Tolls and congestion management
(DeCorla-Souza 2006a); (DeCorla-Souza 2006b)
Traffic risk mitigation strategies
(Singh and Kalidindi 2006); (Vassallo 2006); (Vassallo and Sánchez-Soliño 2006)
Revenue/risk sharing (Charoenpornpattana and Minato 2007); (Takashima et al. 2010)

Appendix A 121
5. Risk Management
Topic References
Risk identification and assessment
(Akintoye et al. 2003a); (Gallimore et al. 1997); (Grimsey and Lewis 2002b); (Iyer and Sagheer 2010); (Johnston and Gudergan 2007); (Songer et al. 1997); (Yang et al. 2010)
Risk modeling (Chiara and Garvin 2008); (Kang et al. 2005); (Kang and Feng 2009); (Medda 2007); (Ng and Xie 2008); (Thomas et al. 2006); (Xu et al. 2010); (Zayed and Chang 2002)
Risk allocation (Abdul-Malak et al. 2001); (Abednego and Ogunlana 2006); (Jin and Doloi 2008); (Li et al. 2005a); (Vega 1997)
Risk transfer (Alonso-Conde et al. 2007); (Ball et al. 2003); (Eaton and O'Connor 2002a); (Hodge 2004a); (Hodge 2004b); (Lonsdale 2005)
Risk management (Akintoye et al. 1998); (Asenova and Beck 2003a); (de Lemos et al. 2001); (Dey et al. 2002); (Dey and Ogunlana 2004); (Doloi and Jin 2007); (Froud 2003); (Hood and McGarvey 2002); (Nisar 2007a); (Özdoganm and Birgönül 2000); (Zou et al. 2008)
Financial risk (Asenova and Beck 2003b); (Barney and White 2003); (Lam and Chow 1999); (Lu et al. 2000); (Wang et al. 2000a); (Wang et al. 2000b)
Political risk (Smith and Gannon 2008); (Wang and Tiong 1999); (Wang and Tiong 2000)
Legal risk (Xenidis and Angelides 2005)
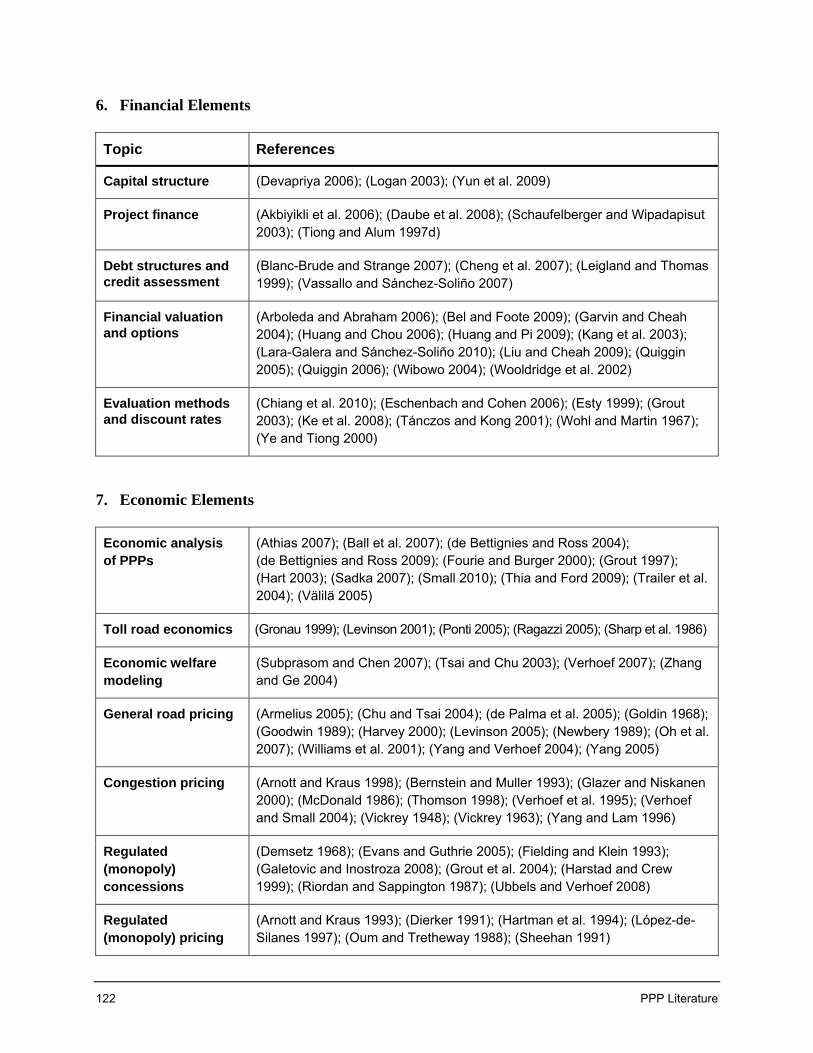
122 PPP Literature
6. Financial Elements
Topic References
Capital structure (Devapriya 2006); (Logan 2003); (Yun et al. 2009)
Project finance (Akbiyikli et al. 2006); (Daube et al. 2008); (Schaufelberger and Wipadapisut 2003); (Tiong and Alum 1997d)
Debt structures and credit assessment
(Blanc-Brude and Strange 2007); (Cheng et al. 2007); (Leigland and Thomas 1999); (Vassallo and Sánchez-Soliño 2007)
Financial valuation and options
(Arboleda and Abraham 2006); (Bel and Foote 2009); (Garvin and Cheah 2004); (Huang and Chou 2006); (Huang and Pi 2009); (Kang et al. 2003); (Lara-Galera and Sánchez-Soliño 2010); (Liu and Cheah 2009); (Quiggin 2005); (Quiggin 2006); (Wibowo 2004); (Wooldridge et al. 2002)
Evaluation methods and discount rates
(Chiang et al. 2010); (Eschenbach and Cohen 2006); (Esty 1999); (Grout 2003); (Ke et al. 2008); (Tánczos and Kong 2001); (Wohl and Martin 1967); (Ye and Tiong 2000)
7. Economic Elements
Economic analysis of PPPs
(Athias 2007); (Ball et al. 2007); (de Bettignies and Ross 2004); (de Bettignies and Ross 2009); (Fourie and Burger 2000); (Grout 1997); (Hart 2003); (Sadka 2007); (Small 2010); (Thia and Ford 2009); (Trailer et al. 2004); (Välilä 2005)
Toll road economics (Gronau 1999); (Levinson 2001); (Ponti 2005); (Ragazzi 2005); (Sharp et al. 1986)
Economic welfare modeling
(Subprasom and Chen 2007); (Tsai and Chu 2003); (Verhoef 2007); (Zhang and Ge 2004)
General road pricing (Armelius 2005); (Chu and Tsai 2004); (de Palma et al. 2005); (Goldin 1968); (Goodwin 1989); (Harvey 2000); (Levinson 2005); (Newbery 1989); (Oh et al. 2007); (Williams et al. 2001); (Yang and Verhoef 2004); (Yang 2005)
Congestion pricing (Arnott and Kraus 1998); (Bernstein and Muller 1993); (Glazer and Niskanen 2000); (McDonald 1986); (Thomson 1998); (Verhoef et al. 1995); (Verhoef and Small 2004); (Vickrey 1948); (Vickrey 1963); (Yang and Lam 1996)
Regulated (monopoly) concessions
(Demsetz 1968); (Evans and Guthrie 2005); (Fielding and Klein 1993); (Galetovic and Inostroza 2008); (Grout et al. 2004); (Harstad and Crew 1999); (Riordan and Sappington 1987); (Ubbels and Verhoef 2008)
Regulated (monopoly) pricing
(Arnott and Kraus 1993); (Dierker 1991); (Hartman et al. 1994); (López-de-Silanes 1997); (Oum and Tretheway 1988); (Sheehan 1991)

Appendix A 123
8. Public Sector Considerations
Topic References
Public procurement principles
(de Lemos et al. 2003a); (Grimsey and Lewis 2007); (Grout and Stevens 2003); (McQuaid and Scherrer 2010); (Murphy 2008); (Siemiatycki 2010); (Vining and Boardman 2008b)
Public finance and budgeting
(Ball et al. 2002); (Ball and King 2006); (Fourie 2006); (Posner et al. 2009)
Public interest (Ball et al. 2000); (Bloomfield 2006); (Buxbaum and Ortiz 2009); (Hood et al. 2006); (Mayer 2007); (Ortiz and Buxbaum 2008)
Value for money (Akintoye et al. 2003b); (Colman 2000); (Eaton and O'Connor 2002b); (Grimsey and Lewis 2005); (Heald 2003); (Miyamoto et al. 2005); (Morallos and Amekudzi 2008); (Morallos et al. 2009); (Nisar 2007b); (Pitt et al. 2006)
Public sector comparator
(Coulson 2008); (Lamb and Merna 2004); (Quiggin 2004); (Russell and Nelms 2006)
Public accountability and transparency
(Broadbent and Laughlin 2003a); (Demirag et al. 2004); (Demirag and Khadaroo 2008); (Hodge 2006); (Watson 2003); (Watson 2004); (Watson 2006)
Accounting treatment (Badawi 2003); (Broadbent and Laughlin 2002); (Grimsey and Lewis 2002a); (Heald and Geaughan 1997); (Hodges and Mellett 2002); (Hodges and Mellett 2004); (Hodges and Mellett 2005); (Khadaroo 2005); (Kirk and Wall 2001); (Maskin and Tirole 2008); (Rutherford 2003); (Walker 2003)
Policy and ethics (Ghere 2001a); (Newberry and Pallot 2003); (Shaoul et al. 2007)
Probity and auditing (English 2007); (Templeman and Paradise 2006)
Political aspects (English and Skellern 2005); (Flinders 2005); (Kerr 1998)
Legal aspects (Blackshield 2006); (Braun 2003); (Erhardt 2008); (Payne 1997)

124 PPP Literature
9. National Applications and Case Studies (generalized topics with national applications are listed in previous categories)
Topic References
UK (including PFI program analysis)
(Carrillo et al. 2008); (Clark and Root 1999); (Deakin 2002); (Debande 2002); (Dixon et al. 2005); (Glaister 1999); (Grubb 1998); (Hagan 1998); (Kirk and Wall 2002); (Pollock et al. 2007); (Sawyer 2005); (Shaoul et al. 2006); (Spackman 2002)
Northern Europe (Collin 1998); (Greve 2003); (Reeves 2003); (Reeves 2005); (Tieva and Junnonen 2009)
Western Europe (Burnham 2001); (Fayard and Bousquet 1998); (Fayard 2005); (Fernandes and Viegas 1999); (Koch and Buser 2006); (Lienhard 2006); (Sánchez-Soliño and Vassallo 2009); (Torres and Pina 2001); (Vassallo and Gallego 2005)
Eastern and Southern Europe
(Adamiak 2008); (Christakos and Kalfakakou 2007); (Cindea 2008); (Clement-Davies 2001); (Eaton et al. 2007); (Maslyukivska and Sohail 2007); (Roumboutsos and Anagnostopoulos 2008); (Tiede and Krispenz 2007)
Africa (Binza 2008); (Ibrahim et al. 2006); (Rintala et al. 2008); (Serres 2000)
North America (Algarni et al. 2007); (Battaglio and Khankarli 2008); (Cohn 2008); (Garvin 2010); (Mendoza et al. 1999); (Price 2001); (Vining et al. 2005); (Vining and Boardman 2008a)
Central and South America
(Alencar 2000); (Barral and Haas 2007); (Nicolini-Llosa 2002); (Paredes and Sánchez 2004); (Sirtaine et al. 2005)
Asia and Pacific (except China)
(Handley 1997); (Kumaraswamy and Morris 2002); (Mahalingam 2010); (Malini 1999); (Malone 2005); (Mubin and Ghaffar 2008); (Regan 2006); (Syuhaida and Aminah 2009); (Takim et al. 2008); (Takim et al. 2009); (Tam 1999); (Thomas et al. 2003); (Ward and Sussman 2006); (Wei and Chung 2002); (Yingsutthipun and Minato 1998)
China (Adams et al. 2006); (Chan et al. 2005); (Chan et al. 2009); (Chan et al. 2010); (Chen and Doloi 2008); (Cheung and Chan 2009); (Chiang and Cheng 2009); (Hanley 1999); (Ke et al. 2010); (Liu and Yamamoto 2009); (Sachs et al. 2007); (Shen et al. 2006); (Zhang and Kumaraswamy 2001a); (Zhang and Kumaraswamy 2001b); (Zhang et al. 2002)
Developing and transition economies
(Dailami and Leipziger 1998); (Handley-Schachler and Gao 2003); (Jamali 2004); (Queiroz 2007); (Tanaka et al. 2005)

Appendix A 125
Bibliography Ababutain, A. Y., and Bullen, A. G. R. (2003). "Multicriteria decision-making model for selection of build-operate-
transfer toll road proposals in the public sector." Transp. Res. Rec., 1848, 1-9. Abdel-Aziz, A. M. (2007a). "Successful delivery of public-private partnerships for infrastructure development." J.
Constr. Eng. Manage., 133(12), 918-931. Abdel-Aziz, A. M. (2007b). "A survey of the payment mechanisms for transportation DBFO projects in British
Columbia." Constr. Manage. Econ., 25(5), 529-543. Abdel-Aziz, A. M., and Russell, A. D. (2001). "A structure for government requirements in public-private
partnerships." Can. J. Civ. Eng., 28(6), 891-909. Abdul-Malak, M.-A. U., Kaysi, I. A., and Schoucair, M. S. (2001). "Allocation of risks under build-operate transfer
delivery approach for transport infrastructure projects." Transp. Res. Rec., 1761, 137-147. Abednego, M. P., and Ogunlana, S. O. (2006). "Good project governance for proper risk allocation in public-private
partnerships in Indonesia." Int. J. Proj. Manage., 24(7), 622-634. Adamiak, J. (2008). "Importance of public-private partnership in delivery of public services." Olsztyn Econ. J., 3(1),
44-56. Adams, J., Young, A., and Wu, Z. (2006). "Public private partnerships in China: system, constraints and future
prospects." Int. J. Public Sector Manage., 19(4), 384-396. Ahadzi, M., and Bowles, G. (2004). "Public-private partnerships and contract negotiations: an empirical study."
Constr. Manage. Econ., 22(9), 967-978. Akbiyikli, R., Eaton, D., and Turner, A. (2006). "Project finance and the Private Finance Initiative (PFI)." J. Struct.
Finance, 12(2), 67-75. Akintoye, A., Beck, M., Hardcastle, C., Chinyio, E., and Asenova, D. (2003a). "Outsourcing the risk analysis
function in Private Finance Initiative projects." J. Constr. Procure., 9(1), 15-30. Akintoye, A., Hardcastle, C., Beck, M., Chinyio, E., and Asenova, D. (2003b). "Achieving best value in private
finance initiative project procurement." Constr. Manage. Econ., 21(5), 461-470. Akintoye, A., Taylor, C., and Fitzgerald, E. (1998). "Risk analysis and management of private finance initiative
projects." Eng., Constr., Archit. Manage., 5(1), 9-21. Albalate, D., and Bel, G. (2009). "Regulating concessions of toll motorways: an empirical study on fixed vs.
variable term contracts." Transp. Res. Part A, 43(2), 219-229. Alencar, C. T. (2000). "Highway concessions in Brazil: an analysis towards the feasibility of the securitization." J.
Fin. Manage. Prop. Constr., 5(3), 79-84. Algarni, A. M., Arditi, D., and Polat, G. (2007). "Build-operate-transfer in infrastructure projects in the United
States." J. Constr. Eng. Manage., 133(10), 728-735. Alonso-Conde, A. B., Brown, C., and Rojo-Suarez, J. (2007). "Public private partnerships: incentives, risk transfer
and real options." Rev. Fin. Econ., 16(4), 335-349. Aragão, J., Santos, E., Orrico Filho, R., and Brasileiro, A. (2006). "PPP investment in land passenger transportation
infrastructure: exploratory comments regarding its effects on competition." Transportes, 14(2), 42-53. Arboleda, C. A., and Abraham, D. M. (2006). "Evaluation of flexibility in capital investments of infrastructure
systems." Eng., Constr., Archit. Manage., 13(3), 254-274. Armelius, H. (2005). "An integrated approach to urban road pricing." J. Transp. Econ. Policy, 39(1), 75-92. Arnott, R., and Kraus, M. (1993). "The Ramsey problem for congestible facilities." J. Public Econ., 50(3), 371-396. Arnott, R., and Kraus, M. (1998). "When are anonymous congestion charges consistent with marginal cost pricing?"
J. Public Econ., 67(1), 45-64. Asenova, D., and Beck, M. (2003a). "Scottish local authorities and the procurement of Private Finance Initiative
projects: a pattern of developing risk management expertise?" Pub. Works Manage. Policy, 8(1), 11-27. Asenova, D., and Beck, M. (2003b). "The UK financial sector and risk management in PFI projects: a survey." Pub.
Money Manage., 23(3), 195-202. Asenova, D., Beck, M., Akintoye, A., Hardcastle, C., and Chinyio, E. (2002). "Partnership, value for money and
best value in PFI projects: obstacles and opportunities." Pub. Policy Admin., 17(4), 5-19. Asenova, D., and Hood, J. (2006). "PFI and the implications of introducing new long-term actors into public service
delivery." Pub. Policy Admin., 21(4), 23-41. Ashley, D., Bauman, R., Carroll, J., Diekmann, J. E., and Finlayson, F. (1998). "Evaluating viability of privatized
transportation projects." J. Infrastruct. Syst., 4(3), 102-110.
126 PPP Literature
Athias, L. (2007). "Uncertainty, renegotiation, and incentives in public private partnerships: an economic analysis of worldwide toll concessions," Doctoral thesis, University of Paris.
Athias, L., and Nuñez, A. (2008). "Winner’s curse in toll road concessions." Econ. Letters, 101(3), 172-174. Athias, L., and Saussier, S. (2006). "Contractual design of toll adjustment provisions in infrastructure concession
contracts." Working paper, Social Science Research Network. Badawi, I. M. (2003). "Globalization of the BOT system and its taxation problems." Rev. Business, 24(2), 60-64. Ball, R., Heafey, M., and King, D. (2000). "Private Finance Initiative: a good deal for the public purse or a drain on
future generations?" Policy, Politics, 29(1), 95-108. Ball, R., Heafey, M., and King, D. (2002). "The Private Finance Initiative and public sector finance." Env. and
Planning C, 20(1), 57-74. Ball, R., Heafey, M., and King, D. (2003). "Risk transfer and value for money in PFI projects." Pub. Manage. Rev.,
5(2), 279-290. Ball, R., Heafey, M., and King, D. (2007). "The Private Finance Initiative in the UK: a value for money and
economic analysis." Pub. Manage. Rev., 9(2), 289-310. Ball, R., and King, D. (2006). "The Private Finance Initiative in local government." Econ. Affairs, 26(1), 36-40. Barney, L. D., and White, H. (2003). "Project-specific financing and interest rate risk in capital budgeting." Eng.
Economist, 48(2), 169-182. Barral, W., and Haas, A. (2007). "Public-private partnership (PPP) in Brazil." Int. Lawyer, 41(3), 957-973. Battaglio, R. P., Jr., and Khankarli, G. A. (2008). "Toll roads, politics, and public-public partnerships: the case of
Texas State Highway 121." Pub. Works Manage. Policy, 13(2), 138-148. Becker, F., and Patterson, V. (2005). "Public-private partnerships: balancing financial returns, risks, and roles of the
partners." Pub. Perf. Manage. Review, 29(2), 125-144. Bel, G., and Foote, J. (2009). "Tolls, terms and public interest in road concessions privatization: a comparative
analysis of recent transactions in the USA and France." Transp. Rev., 29(3), 397-413. Bernstein, D., and Muller, J. (1993). "Understanding the competing short-run objectives of peak period road
pricing." Transp. Res. Rec., 1395, 122-128. Binza, S. M. (2008). "Public-private partnerships in metropolitan government: perspectives on governance, value for
money and the roles of selected stakeholders." Development S. Africa, 25(3), 297-315. Blackshield, A. R. (2006). "Constitutional issues affecting public private partnerships." Univ. New S. Wales Law J.,
29(3), 302-7. Blanc-Brude, F., and Strange, R. (2007). "How banks price loans to public-private partnerships: evidence from the
European markets." J. App. Corp. Fin., 19(4), 94-106. Bloomfield, P. (2006). "The challenging business of long-term public-private partnerships: reflections on local
experience." Public Admin. Rev., 66(3), 400-411. Bojović, V. (2006). "Public private partnership as a last resort for traditional public procurement." Panoeconomicus,
53(3), 299-311. Bovaird, T. (2004). "Public-private partnerships: from contested concepts to prevalent practice." Int. Rev. Admin.
Sci., 70(2), 199-215. Braun, P. (2003). "Strict compliance versus commercial reality: the practical application of EC public procurement
law to the UK's Private Finance Initiative." Eur. Law J., 9(5), 575-598. Broadbent, J., and Laughlin, R. (1999). "The Private Finance Initiative: clarification of a future research agenda."
Fin. Accountability, Manage., 15(2), 95-114. Broadbent, J., and Laughlin, R. (2002). "Accounting choices: technical and political trade-offs and the UK's Private
Finance Initiative." Acctg., Auditing, Accountability J., 15(5), 622-654. Broadbent, J., and Laughlin, R. (2003a). "Control and legitimation in government accountability processes: the
Private Finance Initiative in the UK." Crit. Perspectives in Acctg., 14(1-2), 23-48. Broadbent, J., and Laughlin, R. (2003b). "Public private partnerships: an introduction." Acctg., Auditing,
Accountability J., 16(3), 332-341. Burnham, J. (2001). "Local public-private partnerships in France: rarely disputed, scarcely competitive, weakly
regulated." Pub. Policy Admin., 16(4), 47-60. Buxbaum, J. N., and Ortiz, I. N. (2009). NCHRP Synthesis 391: public sector decision making for public-private
partnerships, Transportation Research Board, Washington, DC. Carrillo, P., Robinson, H., Foale, P., Anumba, C., and Bouchlaghem, D. (2008). "Participation, barriers, and
opportunities in PFI: the United Kingdom experience." J. Manage. Eng., 24(3), 138-145.

Appendix A 127
Chan, A. P. C., Lam, P. T. I., Chan, D. W. M., Cheung, E., and Ke, Y. (2009). "Drivers for adopting public-private partnerships: empirical comparison between China and Hong Kong Special Administrative Region." J. Constr. Eng. Manage., 135(11), 1115-1124.
Chan, A. P. C., Lam, P. T. I., Chan, D. W. M., Cheung, E., and Ke, Y. (2010). "Potential obstacles to successful implementation of public-private partnerships in Beijing and the Hong Kong Special Administrative Region." J. Manage. Eng., 26(1), 30-40.
Chan, W. T., Chen, C., Messner, J. I., and Chua, D. K. H. (2005). "Interface management for China's build-operate-transfer projects." J. Constr. Eng. Manage., 131(6), 645-655.
Charoenpornpattana, S., and Minato, T. (2007). "Innovative revenue-sharing scheme for public-private partnerships in infrastructure projects." Proc., Construction Management and Economics 25th Anniversary Conf., Reading, UK.
Chen, A., and Subprasom, K. (2007). "Analysis of regulation and policy of private toll roads in a build-operate-transfer scheme under demand uncertainty." Transp. Res. Part A, 41(6), 537-558.
Chen, A., Subprasom, K., and Chootinan, P. (2001). "Assessing financial feasibility of a build-operate-transfer project under uncertain demand." Transp. Res. Rec., 1771, 124-130.
Chen, A., Subprasom, K., and Ji, Z. (2003). "Mean-variance model for the build-operate-transfer scheme under demand uncertainty." Transp. Res. Rec., 1857, 93-101.
Chen, A., Subprasom, K., and Ji, Z. (2006a). "A simulation-based multi-objective genetic algorithm (SMOGA) procedure for BOT network design problem." Optimization, Eng., 7(3), 225-247.
Chen, C., and Doloi, H. (2008). "BOT application in China: driving and impeding factors." Int. J. Proj. Manage., 26(4), 388-398.
Chen, M.-S., Lu, H.-F., and Lin, H.-W. (2006b). "Are the nonprofit organizations suitable to engage in BOT or BLT scheme? A feasible analysis for the relationship of private and nonprofit sectors." Int. J. Proj. Manage., 24(3), 244-252.
Cheng, E. W. L., Chiang, Y. H., and Tang, B. S. (2007). "Alternative approach to credit scoring by DEA: evaluating borrowers with respect to PFI projects." Bldg. and Env., 42(4), 1752-1760.
Cheng, L., and Tiong, R. L. K. (2005). "Minimum feasible tariff model for BOT water supply projects in Malaysia." Constr. Manage. Econ., 23(3), 255-263.
Cheung, E., and Chan, A. P. C. (2009). "Is BOT the best financing model to procure infrastructure projects? a case study of the Hong Kong-Zhuhai-Macau Bridge." J. Prop. Invest. Fin., 27(3), 290-302.
Cheung, E., Chan, A. P. C., and Kajewski, S. (2009). "Reasons for implementing public private partnership projects: perspectives from Hong Kong, Australian and British practitioners." J. Prop. Invest. Fin., 27(1), 81-95.
Chiang, Y.-H., and Cheng, E. W. L. (2009). "Perception of financial institutions toward financing PFI projects in Hong Kong." J. Constr. Eng. Manage., 135(9), 833-840.
Chiang, Y.-H., Cheng, E. W. L., and Lam, P. T. I. (2010). "Employing the NPV consistent IRR methods for PFI contracts." J. Constr. Eng. Manage., 136(7), 811-814.
Chiara, N., and Garvin, M. J. (2008). "Variance models for project financial risk analysis with applications to greenfield BOT highway projects." Constr. Manage. Econ., 26(9), 925-939.
Chiou, Y., and Lan, L. (2006). "Royalty models for build-operate-transfer transportation projects with uncertainties." Transportmetrica, 2(3), 175-197.
Chong, E., Huet, F., and Saussier, S. (2006). "Auctions, ex post competition and prices: the efficiency of public-private partnerships." Annals, Public Cooperative Econom., 77(4), 521-554.
Christakos, E., and Kalfakakou, G. (2007). "An economic evaluation model for concession-on-convention infrastructure projects in Greece." Operational Res., 7(1), 147-164.
Chu, C.-P., and Tsai, J.-F. (2004). "Road-pricing models with maintenance cost." Transportation, 31(4), 457-477. Cindea, D. (2008). "Public-private partnership in providing public goods and services." Studies in Bus., Econ., 3(3),
14-19. Clark, G. L., and Root, A. (1999). "Infrastructure shortfall in the United Kingdom: the Private Finance Initiative and
government policy." Polit. Geography, 18(3), 341-365. Clement-Davies, C. (2001). "Public/private partnerships in central and eastern Europe: structuring the concession
agreement." Bus. Law Int., 2(1), 17-46. Clifton, C., and Duffield, C. F. (2006). "Improved PFI/PPP service outcomes through the integration of Alliance
principles." Int. J. Proj. Manage., 24(7), 573-586. Cohn, D. (2008). "British Columbia’s capital asset management framework: moving from transactional to
transformative leadership on public-private partnerships, or a “railroad job”?" Can. Public Admin., 51(1), 71-97.

128 PPP Literature
Collin, S.-O. (1998). "In the twilight zone: a survey of public-private partnerships in Sweden." Pub. Productivity, Manage. Rev., 21(3), 272-283.
Colman, J. (2000). "Examining the value for money of deals under the Private Finance Initiative/public private partnership." Pub. Policy Admin., 15(4), 71-81.
Cook, J. (2008). "Modern enhancements for PPP concession agreements." Constr. Law., 28(4), 24-29, 45-46. Coulson, A. (2008). "Value for money in PFI proposals: a commentary on the UK Treasury guidelines for public
sector comparators." Public Admin., 86(2), 483-498. d'Alpaos, C., Dosi, C., and Moretto, M. (2006). "Concession length and investment timing flexibility." Water
Resources Res., 42(2), 1-4. Dailami, M., and Leipziger, D. (1998). "Infrastructure project finance and capital flows: a new perspective." World
Development, 26(7), 1283-1298. Daube, D., Vollrath, S., and Alfen, H. W. (2008). "A comparison of project finance and the forfeiting model as
financing forms for PPP projects in Germany." Int. J. Proj. Manage., 26(4), 376-387. de Brux, J. (2010). "The dark and bright sides of renegotiation: an application to transport concession contracts."
Utilities Policy, 18(2), 77-85. de Bettignies, J.-E., and Ross, T. W. (2004). "The economics of public-private partnerships." Can. Public Policy,
30(2), 135-154. de Bettignies, J.-E., and Ross, T. W. (2009). "Public-private partnerships and the privatization of financing: an
incomplete contracts approach." Int. J. Industr. Organiz., 27(3), 358-368. de Lemos, T., Betts, M., Eaton, D., and de Almeida, L. T. (2000). "From concessions to project finance and the
Private Finance Initiative." J. Proj. Finance, 6(3), 19-37. de Lemos, T., Betts, M., Eaton, D., and de Almeida, L. T. (2001). "Model for management of whole life cycle risk
uncertainty in the Private Finance Initiative (PFI)." J. Proj. Finance, 6(4), 68-79. de Lemos, T., Betts, M., Eaton, D., and de Almeida, L. T. (2003a). "The nature of PFI." J. Struct. Finance, 9(1), 59-
75. de Lemos, T., de Almeida, L. T., Betts, M., and Eaton, D. (2003b). "An examination on the sustainable competitive
advantage of Private Finance Initiative projects." Constr. Innovation, 3(4), 249-259. de Palma, A., Kilani, M., and Lindsey, R. (2005). "Comparison of second-best and third-best tolling schemes on a
road network." Transp. Res. Rec., 1932, 89-96. de Rus, G., and Romero, M. (2004). "Private financing of roads and optimal pricing: is it possible to get both?"
Annals Regional Sci., 38(3), 485-497. Deakin, N. (2002). "Public-private partnerships: a UK case study." Pub. Manage. Rev., 4(2), 133-147. Debande, O. (2002). "Private financing of transport infrastructure: an assessment of the UK experience." J. Transp.
Econ. Policy, 36(3), 355-387. DeCorla-Souza, P. (2006a). "Implementing congestion pricing on metropolitan highway networks with self-
financing public-private partnerships." J. Transp. Res. Forum, 45(1), 5-22. DeCorla-Souza, P. (2006b). "A self-financing, multimodal, public-private partnership approach to restore
metropolitan mobility." Pub. Works Manage. Policy, 10(3), 235-241. Demirag, I., Dubnick, M. J., and Khadaroo, M. I. (2004). "A framework for examining accountability and value for
money in the UK’s Private Finance Initiative." J. Corp. Citizenship, 15, 63-76. Demirag, I., and Khadaroo, M. I. (2008). "Accountability and value for money in Private Finance Initiative
contracts." Fin. Accountability, Manage., 24(4), 455-478. Demirag, I., Khadaroo, M. I., and Clark, W. (2009). "The institutionalisation of public-private partnerships in the
UK and the nation-state of California." Int. J. Public Policy, 4(3), 190-213. Demsetz, H. (1968). "Why regulate utilities?" J. Law Econ., 11(1), 55-65. Devapriya, K. A. K. (2006). "Governance issues in financing of public-private partnership organisations in network
infrastructure industries." Int. J. Proj. Manage., 24(7), 557-565. Dey, P. K., and Ogunlana, S. O. (2004). "Selection and application of risk management tools and techniques for
build-operate-transfer projects." Industr. Manage., Data Systems, 104(4), 334-346. Dey, P. K., Ogunlana, S. O., and Takehiko, N. (2002). "Risk management in build-operate-transfer projects." Int. J.
Risk Assess. Manage., 3(2), 269-291. Dierker, E. (1991). "The optimality of Boiteux-Ramsey pricing." Econometrica, 59(1), 99-121. Dixon, T., Pottinger, G., and Jordan, A. (2005). "Lessons from the Private Finance Initiative in the UK." J. Prop.
Invest. Fin., 23(5), 421-423.

Appendix A 129
Doloi, H., and Jin, X.-H. (2007). "Risk management in public-private partnership (PPP) projects from the project management perspective." Proc., Construction Management and Economics 25th Anniversary Conf., Construction Management and Economics, Reading, UK.
Dudkin, G., and Välilä, T. (2006). "Transaction costs in public-private partnerships: a first look at the evidence." Competition, Regulation in Network Industries, 1(2), 307-330.
Eaton, D., Akbiyikli, R., de Lemos, T., Gunnigan, L., Kutanis, R. O., Casensky, M., Ladra, J., and El Sawalhi, N. (2007). "An examination of the suitability of a UK PFI model within the Czech Republic, the Republic of Ireland, Palestine (Gaza-West Bank), Portugal and Turkey." Constr. Innovation, 7(1), 122-142.
Eaton, D., Akbiyikli, R., and Dickinson, M. (2006). "An evaluation of the stimulants and impediments to innovation within PFI/PPP projects." Constr. Innovation, 6(2), 63-77.
Eaton, D., and O'Connor, C. (2002a). "PFI/DBFO: roads to the future? Do PFI/DBFO schemes provide acceptable risk transfer?" J. Struct. Finance, 8(1), 53-62.
Eaton, D., and O'Connor, C. (2002b). "PFI/DBFO: roads to the future? Do these schemes present value for money?" J. Struct. Proj. Finance, 7(4), 50-67.
Edelenbos, J., and Klijn, E.-H. (2009). "Project versus process management in public-private partnership: relation between management style and outcomes." Int. Public Manage. J., 12(3), 310-331.
Edkins, A. J., and Smyth, H. J. (2006a). "Contractual management in PPP projects: evaluation of legal versus relational contracting for service delivery." J. Prof. Iss. Eng., 132(1), 82-93.
Edkins, A. J., and Smyth, H. J. (2006b). "The imperative of trust in PPPs: evaluations from the provision of 'full service' contracts." J. Constr. Procure., 12(2), 142-157.
Eger, R. J., and Wilsker, A. L. (2007). "Cost effectiveness analysis and transportation: practices, problems, and proposals." Pub. Budgeting and Fin., 27(1), 104-116.
El-Diraby, T. A., and Gill, S. M. (2006). "A taxonomy for construction terms in privatized-infrastructure finance: supporting semantic exchange of project-risk information." Constr. Manage. Econ., 24(3), 271-285.
El-Gohary, N. M., Osman, H., and El-Diraby, T. E. (2006). "Stakeholder management for public private partnerships." Int. J. Proj. Manage., 24(7), 595-604.
Engel, E., Fischer, R., and Galetovic, A. (1997). "Highway franchising: pitfalls and opportunities." Am. Econ. Rev., 87(2), 68-72.
Engel, E., Fischer, R., and Galetovic, A. (2001). "Least-present-value-of-revenue auctions and highway franchising." J. Political Econ., 109(5), 993-1020.
Engel, E., Fischer, R., and Galetovic, A. (2002). "A new approach to private roads." Regulation, 25(3), 18-22. Engel, E., Fischer, R., and Galetovic, A. (2006). "Privatizing highways in the United States." Rev. Industr. Organiz.,
29(1), 27-53. English, L. M. (2007). "Performance audit of Australian public private partnerships: legitimising government
policies or providing independent oversight?" Fin. Accountability, Manage., 23(3), 313-336. English, L. M., and Skellern, M. (2005). "Public-private partnerships and public sector management reform: a
comparative perspective (editorial)." Int. J. Public Policy, 1(1), 1-21. Erhardt, E. M. (2008). "Caution ahead: changing laws to accommodate public-private partnerships in
transportation." Valparaiso Univ. Law Rev., 42(3), 905-953. Eschenbach, T., and Cohen, R. (2006). "Which interest rate for evaluating projects?" Eng. Manage. J., 18(3), 11-19. Esty, B. C. (1999). "Improved techniques for valuing large-scale projects." J. Proj. Finance, 5(1), 9-25. Evans, L. T., and Guthrie, G. A. (2005). "Risk, price regulation, and irreversible investment." Int. J. Industr.
Organiz., 23(1), 109-128. Ezulike, E. I., Perry, J. G., and Hawwash, K. (1997). "The barriers to entry into the PFI market." Eng., Constr.,
Archit. Manage., 4(3), 179-193. Fayard, A. (2005). "Analysis of highway concession in Europe." Res. Transp. Econ., 15, 15-28. Fayard, A., and Bousquet, F. (1998). "Pragmatic approach to finance infrastructure: analysis of French experience
with highway concessions." Transp. Res. Rec., 1649, 9-16. Fernandes, C., and Viegas, J. (1999). "Private financing of road infrastructure: the Portuguese experience." Transp.
Res. Rec., 1659, 23-30. Fielding, G. J., and Klein, D. B. (1993). "How to franchise highways." J. Transp. Econ. Policy, 27(2), 113-130. Fischbacher, M., and Beaumont, P. B. (2003). "PFI, public-private partnerships and the neglected importance of
process: stakeholders and the employment dimension." Pub. Money Manage., 23(3), 171-176. Fischer, K., Jungbecker, A., and Alfen, H. W. (2006). "The emergence of PPP task forces and their influence on
project delivery in Germany." Int. J. Proj. Manage., 24(7), 539-547. Flinders, M. (2005). "The politics of public-private partnerships." Brit. J. Politics Ind. Rel., 7(2), 215-239.

130 PPP Literature
Fourie, D. J. (2006). "Analysis of the utilisation of public private partnerships in public financial management." J. Public Admin., 41(4.1), 925-934.
Fourie, F. C., and Burger, P. (2000). "An economic analysis and assessment of public-private partnerships (PPPs)." S. African J. Econ., 68(4), 305-316.
Froud, J. (2003). "The Private Finance Initiative: risk, uncertainty, and the state." Acctg., Organiz., Society, 28(6), 567-589.
Galetovic, A., and Inostroza, J. R. (2008). "A lesson from Argentina: setting transmission tolls in a competitive auction is much better than regulating them." Energy Econ., 30(4), 1334-1366.
Galilea, P., and Medda, F. (2009). "Analyzing the influence of national political and economical factors on the success of public-private partnerships in transport." Ingeniería y Desarrollo, 25, 1-24.
Gallimore, P., Williams, W., and Woodward, D. (1997). "Perceptions of risk in the Private Finance Initiative." J. Proj. Finance, 8(2), 164-176.
Garvin, M. J. (2010). "Enabling development of the transportation public-private partnership market in the United States." J. Constr. Eng. Manage., 136(4), 402-411.
Garvin, M. J., and Bosso, D. (2008). "Assessing the effectiveness of infrastructure public-private partnership programs and projects." Pub. Works Manage. Policy, 13(2), 162-178.
Garvin, M. J., and Cheah, C. Y. J. (2004). "Valuation techniques for infrastructure investment decisions." Constr. Manage. Econ., 22(4), 272-383.
Ghere, R. K. (2001a). "Ethical futures and public-private partnerships: peering far down the track." Pub. Organiz. Review, 1(3), 303-319.
Ghere, R. K. (2001b). "Probing the strategic intricacies of public-private partnership: the patent as a comparative reference." Public Admin. Rev., 61(4), 441-451.
Glaister, S. (1999). "Past abuses and future uses of private finance and public private partnerships in transport." Pub. Money Manage., 19(3), 29-36.
Glazer, A., and Niskanen, E. (2000). "Which consumers benefit from congestion tolls?" J. Transp. Econ. Policy, 34(1), 43-54.
Goldin, K. D. (1968). "Three aspects of highway efficiency: amount, quality and price." J. Transp. Econ. Policy, 2(3), 349-366.
Gomez-Ibañez, J. A., Meyer, J. R., and Luberoff, D. E. (1991). "The prospects for privatising infrastructure: lessons from US roads and solid waste." J. Transp. Econ. Policy, 25(3), 259-278.
Goodwin, P. B. (1989). "Rule of three: a possible solution to the political problem of competing objectives for road pricing." Traffic Eng. Control, 30(10), 495-497.
Gramlich, E. M. (1994). "Infrastructure investment: a review essay." J. Econ. Lit., 32(3), 1176-1196. Greve, C. (2003). "Public-private partnerships in Scandinavia." Int. Public Manage. Rev., 4(2), 59-69. Grimsey, D., and Lewis, M. K. (2002a). "Accounting for public private partnerships." Acctg. Forum, 26(3-4), 245-
270. Grimsey, D., and Lewis, M. K. (2002b). "Evaluating the risks of public private partnerships for infrastructure
projects." Int. J. Proj. Manage., 20(2), 107-118. Grimsey, D., and Lewis, M. K. (2004). "The governance of contractual relationships in public-private partnerships."
J. Corp. Citizenship(15), 91-109. Grimsey, D., and Lewis, M. K. (2005). "Are public private partnerships value for money?" Acctg. Forum, 29(1),
345-378. Grimsey, D., and Lewis, M. K. (2007). "Public private partnerships and public procurement." Agenda: J. Policy
Analysis, Reform, 14(2), 171-88. Gronau, R. (1999). "The economics of a single toll road in a toll-free environment." J. Transp. Econ. Policy, 33(2),
163-172. Grout, P. A. (1997). "The economics of the Private Finance Initiative." Oxford Rev. Econ. Policy, 13(4), 53-66. Grout, P. A. (2003). "Public and private sector discount rates in public-private partnerships." Econ. J., 113(486),
C62-C68. Grout, P. A., Jenkins, A., and Zalewska, A. (2004). "Privatisation of utilities and the asset value problem." Eur.
Econ. Rev., 48(4), 927-941. Grout, P. A., and Stevens, M. (2003). "The assessment: financing and managing public services." Oxford Rev. Econ.
Policy, 19(2), 215-234. Grubb, S. R. T. (1998). "The private finance initiative: public private partnerships." Proc. Inst. Civil Eng.: Civ. Eng.,
126(3), 133-140.

Appendix A 131
Guasch, J. L., Laffont, J.-J., and Straub, S. (2007). "Concessions of infrastructure in Latin America: government-led renegotiation." J. App. Econometrics, 22(7), 1267-1294.
Guasch, J. L., Laffont, J.-J., and Straub, S. (2008). "Renegotiation of concession contracts in Latin America: evidence from the water and transport sectors." Int. J. Industr. Organiz., 26(2), 421-442.
Guasch, J. L., and Straub, S. (2006). "Renegotiation of infrastructure concessions: an overview." Annals, Public Cooperative Econom., 77(4), 479-493.
Guasch, J. L., and Straub, S. (2009). "Corruption and concession renegotiations: evidence from the water and transport sectors in Latin America." Utilities Policy, 17(2), 185-190.
Guo, X., and Yang, H. (2009). "Analysis of a build-operate-transfer scheme for road franchising." Int. J. Sust. Transp., 3(5), 312-338.
Hagan, A. (1998). "The Private Finance Initiative: local authority transport programmes." Proc. Inst. Civil Eng.: Municip. Engr., 127(1), 24-31.
Hall, M., Holt, R., and Graves, A. (2000). "Private finance, public roads: configuring the supply chain in PFI highway construction." Eur. J. Purch. Supply Manage., 6(3-4), 227-235.
Handley-Schachler, M., and Gao, S. S. (2003). "Can the Private Finance Initiative be used in emerging economies? Lessons from the UK's successes and failures." Managerial Finance, 29(5/6), 36-51.
Handley, P. (1997). "A critical view of the build-operate-transfer privatisation process in Asia." Asia Pac. J. Public Admin., 19(2), 203-243.
Hanley, T. P. (1999). "BOT circular: an evaluation of the new regulatory framework governing privately-financed infrastructure projects in the People's Republic of China." Stanford J. Law Bus. Fin., 5(1), 59-98.
Harstad, R. M., and Crew, M. A. (1999). "Franchise bidding without holdups: utility regulation with efficient pricing and choice of provider." J. Regulatory Econ., 15(2), 141-163.
Hart, O. (2003). "Incomplete contracts and public ownership: remarks, and an application to public-private partnerships." Econ. J., 113(486), C69-C76.
Hartman, R. S., Jensen, K. A., and Seiden, K. P. (1994). "Strategic rate making in the context of dynamic Ramsey pricing." Applied Econ., 26(4), 363-374.
Harvey, M. (2000). "Road pricing and cost recovery: an economic viewpoint." Road, Transp. Res., 9(1), 65-83. Heald, D. (2003). "Value for money tests and accounting treatment in PFI schemes." Acctg., Auditing,
Accountability J., 16(3), 342-371. Heald, D., and Geaughan, N. (1997). "Accounting for the Private Finance Initiative." Pub. Money Manage., 17(3),
11-16. Ho, S. P. (2006). "Model for financial renegotiation in public-private partnership projects and its policy
implications: game theoretic view." J. Constr. Eng. Manage., 132(7), 678-688. Hodge, G. A. (2004a). "Risks in public-private partnerships: shifting, sharing or shirking?" Asia Pac. J. Public
Admin., 26(2), 155-179. Hodge, G. A. (2004b). "The risky business of public-private partnerships." Austr. J. Public Admin., 63(4), 37-49. Hodge, G. A. (2006). "Public private partnerships and legitimacy." Univ. New S. Wales Law J., 29(3), 318-327. Hodge, G. A., and Greve, C. (2007). "Public-private partnerships: an international performance review." Public
Admin. Rev., 67(3), 545-558. Hodge, G. A., and Greve, C. (2009). "PPPs: the passage of time permits a sober reflection." Econ. Affairs, 29(1), 33-
39. Hodges, R., and Mellett, H. (2002). "Investigating standard setting: accounting for the United Kingdom's Private
Finance Initiative." Acctg. Forum, 26(2), 126-151. Hodges, R., and Mellett, H. (2004). "Reporting PFI in annual accounts: a user's perspective." Pub. Money Manage.,
24(3), 153-158. Hodges, R., and Mellett, H. (2005). "Accounting for the UK's Private Finance Initiative: an interview-based
investigation." Abacus, 41(2), 159-180. Hood, J., Fraser, I. A. N., and McGarvey, N. (2006). "Transparency of risk and reward in UK public-private
partnerships." Pub. Budgeting and Fin., 26(4), 40-58. Hood, J., and McGarvey, N. (2002). "Managing the risks of public-private partnerships in Scottish local
government." Policy Studies, 23(1), 21-35. Huang, Y.-L., and Chou, S.-P. (2006). "Valuation of the minimum revenue guarantee and the option to abandon in
BOT infrastructure projects." Constr. Manage. Econ., 24(4), 379-389. Huang, Y.-L., and Pi, C.-C. (2009). "Valuation of multi-stage BOT projects involving dedicated asset investments: a
sequential compound option approach." Constr. Manage. Econ., 27(7), 653-666.
132 PPP Literature
Ibrahim, A. D., Price, A. D. F., and Dainty, A. R. J. (2006). "The analysis and allocation of risks in public private partnerships in infrastructure projects in Nigeria." J. Fin. Manage. Prop. Constr., 11(3), 149-163.
Iyer, K. C., and Sagheer, M. (2010). "Hierarchical structuring of PPP risks using interpretative structural modeling." J. Constr. Eng. Manage., 136(2), 151-159.
Jacobson, C., and Choi, S. O. (2008). "Success factors: public works and public-private partnerships." Int. J. Public Sector Manage., 21(6), 637-657.
Jamali, D. (2004). "Success and failure mechanisms of public private partnerships (PPPs) in developing countries." Int. J. Public Sector Manage., 17(5), 414-430.
Jefferies, M. (2006). "Critical success factors of public private sector partnerships: a case study of the Sydney SuperDome." Eng., Constr., Archit. Manage., 13(5), 451-462.
Jin, X.-H., and Doloi, H. (2008). "Interpreting risk allocation mechanism in public-private partnership projects: an empirical study in a transaction cost economics perspective." Constr. Manage. Econ., 26(7), 707-721.
Johnston, J., and Gudergan, S. P. (2007). "Governance of public-private partnerships: lessons learnt from an Australian case?" Int. Rev. Admin. Sci., 73(4), 569-582.
Jones, R., and Noble, G. (2008). "Managing the implementation of public-private partnerships." Pub. Money Manage., 28(2), 109-114.
Joyner, K. (2007). "Dynamic evolution in public-private partnerships: the role of key actors in managing multiple stakeholders." Mangerial Law, 49(5/6), 206-217.
Kang, C.-C., and Feng, C.-M. (2009). "Risk measurement and risk identification for BOT projects: a multi-attribute utility approach." Math., Computer Modelling, 49(9-10), 1802-1815.
Kang, C.-C., Feng, C.-M., and Huang, S.-C. (2003). "The new finance model of BOT projects." J. East Asia Soc. Transp. Studies, 5, 2920–2931.
Kang, C.-C., Feng, C.-M., and Khan, H. A. (2005). "Risk assessment for build-operate-transfer projects: a dynamic multi-objective programming approach." Computers, Ops. Res., 32(6), 1633-1654.
Ke, Y., Liu, X., and Wang, S. (2008). "Equitable financial evaluation method for public-private partnership projects." Tsinghua Sci. Tech., 13(5), 702-707.
Ke, Y., Wang, S., Chan, A. P. C., and Cheung, E. (2009). "Research trend of public-private partnership in construction journals." J. Constr. Eng. Manage., 135(10), 1076-1086.
Ke, Y., Wang, S., Chan, A. P. C., and Lam, P. T. I. (2010). "Preferred risk allocation in China's public-private partnership (PPP) projects." Int. J. Proj. Manage., 28(5), 482-492.
Kerr, D. (1998). "The Private Finance Initiative and the changing governance of the built environment." Urban Studies, 35(12), 2277-2301.
Khadaroo, M. I. (2005). "An institutional theory perspective on the UK's Private Finance Initiative (PFI) accounting standard setting process." Pub. Manage. Rev., 7(1), 69-94.
Kirk, R. J., and Wall, A. P. (2001). "Substance, form and PFI contracts." Pub. Money Manage., 21(3), 41-46. Kirk, R. J., and Wall, A. P. (2002). "The Private Finance Initiative: has the Accounting Standards Board reduced the
scheme's value for money?" Pub. Manage. Rev., 4(4), 529-547. Klijn, E.-H., Edelenbos, J., Kort, M., and van Twist, M. (2008). "Facing management choices: an analysis of
managerial choices in 18 complex environmental public-private partnership projects." Int. Rev. Admin. Sci., 74(2), 251-282.
Klijn, E.-H., and Teisman, G. R. (2003). "Institutional and strategic barriers to public-private partnership: an analysis of Dutch cases." Pub. Money Manage., 23(3), 137-146.
Koch, C., and Buser, M. (2006). "Emerging metagovernance as an institutional framework for public private partnership networks in Denmark." Int. J. Proj. Manage., 24(7), 548-556.
Koppenjan, J. F. M. (2005). "The formation of public-private partnerships: lessons from nine transport infrastructure projects in the Netherlands." Public Admin., 83(1), 135-157.
Kumaraswamy, M. M., and Anvuur, A. M. (2008). "Selecting sustainable teams for PPP projects." Bldg. and Env., 43(6), 999-1009.
Kumaraswamy, M. M., Ling, F. Y. Y., Anvuur, A. M., and Rahman, M. M. (2007). "Targeting relationally integrated teams for sustainable PPPs." Eng., Constr., Archit. Manage., 14(6), 581-596.
Kumaraswamy, M. M., and Morris, D. A. (2002). "Build-operate-transfer-type procurement in Asian megaprojects." J. Constr. Eng. Manage., 128(2), 93-102.
Kumaraswamy, M. M., and Zhang, X. (2001). "Governmental role in BOT-led infrastructure development." Int. J. Proj. Manage., 19(4), 195-205.
Kwak, Y. H., Chih, Y., and Ibbs, C. W. (2009). "Towards a comprehensive understanding of public private partnerships for infrastructure development." Calif. Manage. Rev., 51(2), 51-78.
Appendix A 133
Laishram, B. S., and Kalidindi, S. N. (2009). "Desirability rating analysis for debt financing of public-private partnership road projects." Constr. Manage. Econ., 27(9), 823-837.
Lam, K. C., and Chow, W. S. (1999). "The significance of financial risks in BOT procurement." Bldg. Res. and Info., 27(2), 84-95.
Lamb, D., and Merna, A. (2004). "Development and maintenance of a robust public sector comparator." J. Struct. Proj. Finance, 10(1), 86-94.
Lara-Galera, A. L., and Sánchez-Soliño, A. (2010). "A real options approach for the valuation of highway concessions." Transp. Sci., doi: 10.1287/trsc.1090.0299.
Leigland, J., and Thomas, R. H. (1999). "Municipal bonds as alternatives to PPPs: facilitating direct municipal access to private capital." Development S. Africa, 16(4), 729-750.
Leiringer, R. (2006). "Technological innovation in PPPs: incentives, opportunities and actions." Constr. Manage. Econ., 24(3), 301-308.
Leitch, S., and Motion, J. (2003). "Public-private partnerships: consultation, cooperation and collusion." J. Public Affairs, 3(3), 273-277.
Levinson, D. (2001). "Why states toll: an empirical model of finance choice." J. Transp. Econ. Policy, 35(2), 223-238.
Levinson, D. (2005). "Paying for the fixed costs of roads." J. Transp. Econ. Policy, 39(3), 279-294. Li, B., Akintoye, A., Edwards, P. J., and Hardcastle, C. (2005a). "The allocation of risk in PPP/PFI construction
projects in the UK." Int. J. Proj. Manage., 23(1), 25-35. Li, B., Akintoye, A., Edwards, P. J., and Hardcastle, C. (2005b). "Critical success factors for PPP/PFI projects in the
UK construction industry." Constr. Manage. Econ., 23(5), 459-471. Li, B., Akintoye, A., Edwards, P. J., and Hardcastle, C. (2005c). "Perceptions of positive and negative factors
influencing the attractiveness of PPP/PFI procurement for construction projects in the UK." Eng., Constr., Archit. Manage., 12(2), 125-148.
Lienhard, A. (2006). "Public private partnerships (PPPs) in Switzerland: experiences, risks, potentials." Int. Rev. Admin. Sci., 72(4), 547-563.
Linder, S. H. (1999). "Coming to terms with the public-private partnership: a grammar of multiple meanings." Am. Behav. Sci., 43(1), 35-51.
Liou, F.-M., and Huang, C.-P. (2008). "Automated approach to negotiations of BOT contracts with the consideration of project risk." J. Constr. Eng. Manage., 134(1), 18-24.
Liu, J., and Cheah, C. Y. J. (2009). "Real option application in PPP/PFI project negotiation." Constr. Manage. Econ., 27(4), 331-342.
Liu, Z., and Yamamoto, H. (2009). "Public-private partnerships (PPPs) in China: present conditions, trends, and future challenges." Interdisciplinary Info. Sci., 15(2), 223-230.
Logan, T.-M. (2003). "Optimal debt capacity for BOT projects in emerging economies." J. Proj. Finance, 9(3), 71-79.
Loizos, A., Karlaftis, A. G., and Karlaftis, M. G. (2007). "An approach for optimizing pavement design-redesign parameters in PPP projects." Struct. Infrastruct. Eng., 3(3), 257-265.
Lonsdale, C. (2005). "Risk transfer and the UK Private Finance Initiative: a theoretical analysis." Policy, Politics, 33(2), 231-249.
López-de-Silanes, F. (1997). "Determinants of privatization prices." Quarterly J. Econ., 112(4), 965-1025. Lu, Y.-C., Wu, S., Chen, D.-H., and Lin, Y.-Y. (2000). "BOT projects in Taiwan: financial modeling risk, term
structure of net cash flows, and project at risk analysis." J. Proj. Finance, 5(4), 53-63. Mahalingam, A. (2010). "PPP experiences in Indian cities: barriers, enablers, and the way forward." J. Constr. Eng.
Manage., 136(4), 419-429. Malini, E. (1999). "Build operate transfer municipal bridge projects in India." J. Manage. Eng., 15(4), 51-58. Malone, N. (2005). "The evolution of private financing of government infrastructure in Australia: 2005 and
beyond." Austr. Econ. Review, 38(4), 420-430. Martimort, D., and Pouyet, J. (2008). "To build or not to build: normative and positive theories of public-private
partnerships." Int. J. Industr. Organiz., 26(2), 393-411. Marty, F., Trosa, S., and Voisin, A. (2005). "The financial determinants of government commitment in public-
private partnerships." Int. J. Public Policy, 1(1), 41-57. Maskin, E., and Tirole, J. (2008). "Public-private partnerships and government spending limits." Int. J. Industr.
Organiz., 26(2), 412-420. Maslyukivska, O., and Sohail, M. (2007). "European infrastructure procurement through PPP." Proc. Inst. Civil
Eng.: Manage., Procure., Law, 160(4), 159-67.

134 PPP Literature
Mayer, J. (2007). "Private returns, public concerns: addressing private-sector returns in public-private highway toll concessions." Transp. Res. Rec., 1996, 9-15.
Mazouz, B., Facal, J., and Viola, J.-M. (2008). "Public-private partnership: elements for a project-based management typology." Proj. Manage. J., 39(2), 98-110.
McClure, S., Lowry, J., and Woodland, J. (2008). "Public-private partnerships: case study in evaluating equivalent single-axle loads for long-term performance warranties in New Mexico." Transp. Res. Rec., 2079, 109-118.
McCowan, A. K., and Mohamed, S. (2007). "Decision support system to evaluate and compare concession options." J. Constr. Eng. Manage., 133(2), 114-123.
McDonald, J. F. (1986). "Urban highway congestion: an analysis of second-best tolls." Transportation, 22(4), 353-369.
McQuaid, R. W., and Scherrer, W. (2010). "Changing reasons for public–private partnerships (PPPs)." Pub. Money Manage., 30(1), 27-34.
Medda, F. (2007). "A game theory approach for the allocation of risks in transport public private partnerships." Int. J. Proj. Manage., 25(3), 213-218.
Mendoza, E., Gold, M., Carter, P., and Parmar, J. (1999). "The sale of Highway 407 Express Toll Route: a case study." J. Struct. Finance, 5(3), 5-14.
Michalski-Karl, R., Pernsteiner, S. M., and Schaffhauser-Linzatti, M. M. (2009). "Signaling public private partnership activities: reporting behavior within annual reports." Intl. Advances Econ. Res., 15(2), 178-185.
Miyamoto, K., Sato, Y., and Kitazume, K. (2005). "Private-sector participation in infrastructure projects and value for money: economic and financial impacts." Transp. Res. Rec., 1932, 16-22.
Morallos, D., and Amekudzi, A. (2008). "The state of the practice of value for money analysis in comparing public private partnerships to traditional procurements." Pub. Works Manage. Policy, 13(2), 114-125.
Morallos, D., Amekudzi, A., Ross, C., and Meyer, M. (2009). "Value for money analysis in US transportation public-private partnerships." Transp. Res. Rec., 2115, 27-36.
Mubin, S., and Ghaffar, A. (2008). "BOT contracts: applicability in Pakistan for infrastructure development." Pak. J. Eng. & Appl. Sci., 3, 33-46.
Murphy, T. J. (2008). "The case for public-private partnerships in infrastructure." Can. Public Admin., 51(1), 99-126.
Mustafa, A. (1999). "Public-private partnership: an alternative institutional model for implementing the Private Finance Initiative in the provision of transport infrastructure." J. Proj. Finance, 5(1), 56-71.
Newberry, S., and Pallot, J. (2003). "Fiscal (ir)responsibility: privileging PPPs in New Zealand." Acctg., Auditing, Accountability J., 16(3), 467-492.
Newbery, D. M. (1989). "Cost recovery from optimally designed roads." Economica, 56(222), 165-185. Ng, S. T., and Wong, Y. M. W. (2006). "Adopting non-privately funded public-private partnerships in maintenance
projects: a case study in Hong Kong." Eng., Constr., Archit. Manage., 13(2), 186-200. Ng, S. T., and Wong, Y. M. W. (2007). "Payment and audit mechanisms for non private-funded PPP-based
infrastructure maintenance projects." Constr. Manage. Econ., 25(9), 915-923. Ng, S. T., and Xie, J. (2008). "A simulation model for evaluating the tariff stability of concession-based PPP
proposals." Constr. Innovation, 8(2), 106-119. Ng, S. T., Xie, J., Cheung, Y. K., and Jefferies, M. (2007a). "A simulation model for optimizing the concession
period of public-private partnerships schemes." Int. J. Proj. Manage., 25(8), 791-798. Ng, S. T., Xie, J., Skitmore, M., and Cheung, Y. K. (2007b). "A fuzzy simulation model for evaluating the
concession items of public-private partnership schemes." Automation in Constr., 17(1), 22-29. Ngee, L., Tiong, R. L. K., and Alum, J. (1997). "Automated approach to negotiation of BOT contracts." J.
Computing Civ. Eng., 11(2), 121-128. Nicolini-Llosa, J. L. (2002). "Toll road concessions in Argentina: what can be learned." Transp. Res. Rec., 1812, 10-
21. Nisar, T. M. (2007a). "Risk management in public-private partnership contracts." Pub. Organiz. Review, 7(1), 1-19. Nisar, T. M. (2007b). "Value for money drivers in public private partnership schemes." Int. J. Public Sector
Manage., 20(2), 147-156. Noble, G. (2006). "The role of contracts in public private partnerships." Univ. New S. Wales Law J., 29(3), 276-81. Noble, G., and Jones, R. (2006). "The role of boundary-spanning managers in the establishment of public-private
partnerships." Public Admin., 84(4), 891-917. Nombela, G., and de Rus, G. (2004). "Flexible-term contracts for road franchising." Transp. Res. Part A, 38(3), 163-
179.

Appendix A 135
Norton, S. D., and Blanco, L. (2009). "Public-private partnerships: a comparative study of new public management and stakeholder participation in the UK and Spain." Int. J. Public Policy, 4(3), 214-231.
Ock, J. H., and Han, S. H. (2002). "Selecting a viable build-operate-transfer (BOT) project to propose." J. Civ. Eng. (Korean Soc. Civ. Eng.), 6(3), 203-216.
Ock, J. H., Han, S. H., Park, H. K., and Diekmann, J. E. (2005). "Improving decision quality: a risk-based go/no-go decision for build-operate-transfer (BOT) projects." Can. J. Civ. Eng., 32(3), 517-532.
Oh, J. E., Labi, S., and Sinha, K. C. (2007). "Implementation and evaluation of self-financing highway pricing schemes: a case study." Transp. Res. Rec., 1996, 25-33.
Ortiz, I. N., and Buxbaum, J. N. (2008). "Protecting the public interest in long-term concession agreements for transportation infrastructure." Pub. Works Manage. Policy, 13(2), 126-137.
Oum, T. H., and Tretheway, M. W. (1988). "Ramsey pricing in the presence of externality costs." J. Transp. Econ. Policy, 22(3), 307-316.
Özdoganm, I. D., and Birgönül, M. T. (2000). "A decision support framework for project sponsors in the planning stage of build-operate-transfer (BOT) projects." Constr. Manage. Econ., 18(3), 343-353.
Paredes, R. D., and Sánchez, J. M. (2004). "Government concession contracts in Chile: the role of competition in the bidding process." Econ. Development, Cultural Change, 53(1), 215-234.
Payne, H. (1997). "Key legal issues in projects procured under the private finance initiative." Eng., Constr., Archit. Manage., 4(3), 195-202.
Pitt, M., Collins, N., and Walls, A. (2006). "The Private Finance Initiative and value for money." J. Prop. Invest. Fin., 24(4), 363-373.
Pollock, A. M., Price, D., and Player, S. (2007). "An examination of the UK Treasury's evidence base for cost and time overrun data in UK value-for-money policy and appraisal." Pub. Money Manage., 27(2), 127-134.
Pongsiri, N. (2002). "Regulation and public-private partnerships." Int. J. Public Sector Manage., 15(6), 487-495. Ponti, M. (2005). "The regulatory issues of transport infrastructures, and of toll highways in particular." Res. Transp.
Econ., 15, 1-4. Posner, P., Ryu, S. K., and Tkachenko, A. (2009). "Public-private partnerships: the relevance of budgeting." OECD
J. Budgeting, 9(1), 1-26. Price, W. T. (2001). "An odyssey of privatizing highways: the evolving case of SR 91." Pub. Works Manage.
Policy, 5(4), 259-269. Qiao, L., Wang, S., Tiong, R. L. K., and Chan, T.-S. (2001). "Framework for critical success factors of BOT projects
in China." J. Proj. Finance, 7(1), 53-61. Qiao, L., Wang, S., Tiong, R. L. K., and Chan, T.-S. (2002). "Critical success factors for tendering BOT
infrastructure projects in China." J. Proj. Finance, 8(1), 40-52. Queiroz, C. (2007). "Public-private partnerships in highways in transition economies: recent experience and future
prospects." Transp. Res. Rec., 1996, 34-40. Quiggin, J. (2004). "Risk, PPPs and the public sector comparator." Austr. Acctg. Review, 14(2), 51-61. Quiggin, J. (2005). "Public-private partnerships: options for improved risk allocation." Austr. Econ. Review, 38(4),
445-450. Quiggin, J. (2006). "Public private partnerships: options for improved risk allocation." Univ. New S. Wales Law J.,
29(3), 289-93. Ragazzi, G. (2005). "Tolls and project financing: a critical view." Res. Transp. Econ., 15, 41-53. Raisbeck, P. (2008). "Perceptions of architectural design and project risk: understanding the architects' role in a PPP
project." Constr. Manage. Econ., 26(11), 1145-1157. Ranasinghe, M. (1999). "Private sector participation in infrastructure projects: a methodology to analyse viability of
BOT." Constr. Manage. Econ., 17(5), 613-623. Rangel, T., and Galende, J. (2010). "Innovation in public–private partnerships (PPPs): the Spanish case of highway
concessions." Pub. Money Manage., 30(1), 49-54. Rausser, G., and Stevens, R. (2009). "Public-private partnerships: goods and the structure of contracts." Ann. Rev.
Resource Econ., 1(1), 75-98. Reeves, E. (2003). "Public-private partnerships in Ireland: policy and practice." Pub. Money Manage., 23(3), 163-
170. Reeves, E. (2005). "Public private partnerships in the Irish roads sector: an economic analysis." Res. Transp. Econ.,
15, 107-120. Regan, M. (2006). "Australian involvement in public private partnerships in the Asia-Pacific region." Univ. New S.
Wales Law J., 29(3), 342-8.

136 PPP Literature
Ribeiro, K., Dantas, A., and Yamamoto, K. (2003). "A methodological framework for evaluating concession of highways in a private-public partnership context." J. East Asia Soc. Transp. Studies, 5, 2893-2903.
Ricaurte, J. L., Arboleda, C. A., and Peña-Mora, F. (2008). "Civil engineers in public-private partnerships and as master planners for infrastructure development." Leadership, Manage. Eng., 8(4), 276-286.
Rienstra, S. A., and Nijkamp, P. (1997). "Lessons from private financing of transport infrastructure: Dutch infrastructure in the 19th century and European projects in the 20th century." Revue économique, 48(2), 231-245.
Rintala, K., Root, D., Ive, G., and Bowen, P. (2008). "Organizing a bidding competition for a toll road concession in South Africa: the case of Chapman's Peak Drive." J. Manage. Eng., 24(3), 146-155.
Riordan, M. H., and Sappington, D. E. M. (1987). "Awarding monopoly franchises." Am. Econ. Rev., 77(3), 375-387.
Robinson, H., and Scott, J. (2009). "Service delivery and performance monitoring in PFI/PPP projects." Constr. Manage. Econ., 27(2), 181-197.
Roco, C. E. (2005). "Predicting the conditional viability of build-operate-transfer contracts for transportation facilities without forecasting revenues." Transp. Law J., 33(3), 339-370.
Rodríguez, D. A. (1999). "Expanding the urban transportation infrastructure through concession agreements: lessons from Latin America." Transp. Res. Rec., 1659, 3-10.
Roumboutsos, A., and Anagnostopoulos, K. P. (2008). "Public-private partnership projects in Greece: risk ranking and preferred risk allocation." Constr. Manage. Econ., 26(7), 751-763.
Russell, A. D., and Nelms, C. (2006). "The public sector comparator: uses and abuses." Proc., Joint CIB W065/W055/W086 Int'l Symposium: Construction in the XXI Century, Rome.
Rutherford, B. A. (2003). "The social construction of financial statement elements under Private Finance Initiative schemes." Acctg., Auditing, Accountability J., 16(3), 372-396.
Sachs, T., Tiong, R. L. K., and Wang, S. (2007). "Analysis of political risks and opportunities in public private partnerships (PPP) in China and selected Asian countries." Chinese Mgmt. Studies, 1(2), 126-148.
Sadka, E. (2007). "Public-private partnership: a public economics perspective." CESifo Econ. Studies, 53(3), 466-490.
Salman, A. F. M., Skibniewski, M. J., and Basha, I. (2007). "BOT viability model for large-scale infrastructure projects." J. Constr. Eng. Manage., 133(1), 50-63.
Sánchez-Soliño, A., and Vassallo, J. M. (2009). "Using public-private partnerships to expand subways: Madrid-Barajas International Airport case study." J. Manage. Eng., 25(1), 21-28.
Sawyer, M. (2005). "The Private Finance Initiative: the UK experience." Res. Transp. Econ., 15, 231-245. Schäferhoff, M., Campe, S., and Kaan, C. (2009). "Transnational public-private partnerships in international
relations: making sense of concepts, research frameworks, and results." Int. Studies Rev., 11(3), 451-474. Scharle, P. (2002). "Public-private partnership (PPP) as a social game." Innovation: Eur. J. Soc. Sci., 15(3), 227-
252. Schaufelberger, J. E., and Wipadapisut, I. (2003). "Alternate financing strategies for build-operate-transfer projects."
J. Constr. Eng. Manage., 129(2), 205-213. Sciulli, N. (2007). "Public private partnerships: identifying practical issues for an accounting research agenda." J.
Bus. Syst., Governance, Ethics, 2(2), 17-28. Serres, F. (2000). "Public/private partnership for the development of public infrastructure in Africa: the possible role
of a regulating authority and the guarantees of fairness." Bus. Law Int., 1(4), 329-356. Shaoul, J., Stafford, A., and Stapleton, P. (2006). "Highway robbery? a financial analysis of design, build, finance
and operate (DBFO) in UK roads." Transp. Rev., 26(3), 257-274. Shaoul, J., Stafford, A., and Stapleton, P. (2007). "Evidence-based policies and the meaning of success: the case of a
road built under design build finance and operate (DBFO)." Evidence and Policy, 3(2), 159-179. Sharp, C., Button, K., and Deadman, D. (1986). "The economics of tolled road crossings." J. Transp. Econ. Policy,
20(2), 255-274. Sheehan, M. (1991). "Why Ramsey pricing is wrong: the case of telecommunications regulation." J. Econ. Iss.,
25(1), 21-32. Shen, L.-Y., Li, H., and Li, Q. M. (2002). "Alternative concession model for build operate transfer contract
projects." J. Constr. Eng. Manage., 128(4), 326-330. Shen, L.-Y., Platten, A., and Deng, X. P. (2006). "Role of public private partnerships to manage risks in public
sector projects in Hong Kong." Int. J. Proj. Manage., 24(7), 587-594. Shen, L.-Y., and Wu, Y. Z. (2005). "Risk concession model for build/operate/transfer contract projects." J. Constr.
Eng. Manage., 131(2), 211-220.
Appendix A 137
Shen, L. Y., Bao, H. J., Wu, Y. Z., and Lu, W. S. (2007). "Using bargaining-game theory for negotiating concession period for BOT-type contract." J. Constr. Eng. Manage., 133(5), 385-392.
Siemiatycki, M. (2010). "Delivering transportation infrastructure through public-private partnerships: planning concerns." J. Am. Planning Assn., 76(1), 43-58.
Singh, L. B., and Kalidindi, S. N. (2006). "Traffic revenue risk management through annuity model of PPP road projects in India." Int. J. Proj. Manage., 24(7), 605-613.
Sirtaine, S., Pinglo, M. E., Guasch, J. L., and Foster, V. (2005). "How profitable are private infrastructure concessions in Latin America? Empirical evidence and regulatory implications." Quarterly Rev. Econ. Finance, 45(2), 380-402.
Small, K. A. (2010). "Private provision of highways: economic issues." Transp. Rev., 30(1), 11-31. Smith, N. J., and Gannon, M. (2008). "Political risk in light rail transit PPP projects." Proc. Inst. Civil Eng.:
Manage., Procure., Law, 161(4), 179-185. Smyth, H. J., and Edkins, A. J. (2007). "Relationship management in the management of PFI/PPP projects in the
UK." Int. J. Proj. Manage., 25(3), 232-240. Songer, A. D., Diekmann, J. E., and Pecsok, R. S. (1997). "Risk analysis for revenue dependent infrastructure
projects." Constr. Manage. Econ., 15(4), 377-382. Spackman, M. (2002). "Public-private partnerships: lessons from the British approach." Econ. Sys., 26(3), 283-301. Subprasom, K., and Chen, A. (2007). "Effects of regulation on highway pricing and capacity choice of a build-
operate-transfer scheme." J. Constr. Eng. Manage., 133(1), 64-71. Subprasom, K., Chen, A., and Kongsomsaksakul, S. (2003). "Optimal selection of capacity and toll in a build-
operate-transfer scheme under multiple uncertainties." J. East Asia Soc. Transp. Studies, 5, 1155-1170. Swaffield, L. M., and McDonald, A. M. (2008). "The contractor's use of life cycle costing on PFI projects." Eng.,
Constr., Archit. Manage., 15(2), 132-148. Syuhaida, I., and Aminah, M. Y. (2009). "The provision of infrastructure via Private Finance Initiative." Theor.,
Empirical Res. Urban Manage., 1S, 76-86. Takashima, R., Yagi, K., and Takamori, H. (2010). "Government guarantees and risk sharing in public-private
partnerships." Rev. Fin. Econ., 19(2), 78-83. Takim, R., Abdul-Rahman, R., Ismail, K., and Egbu, C. (2008). "The acceptability of Private Finance Initiative
(PFI) scheme in Malaysia." Asian Soc. Sci., 4(12), 71-82. Takim, R., Ismail, K., Nawawi, A. H., and Jaafar, A. (2009). "The Malaysian Private Finance Initiative and value for
money." Asian Soc. Sci., 5(3), 103-111. Tam, C. M. (1999). "Build-operate-transfer model for infrastructure developments in Asia: reasons for successes and
failures." Int. J. Proj. Manage., 17(6), 377-382. Tanaka, D. F., Ishida, H., Tsutsumi, M., and Okamoto, N. (2005). "Private finance for road projects in developing
countries: improving transparency through VFM risk assessment." J. East Asia Soc. Transp. Studies, 6, 3899-3914.
Tánczos, K., and Kong, G. S. (2001). "A review of appraisal methodologies of feasibility studies done by public private partnership in road project development." Periodica Polytechnica: Transp. Eng., 29(1-2), 71-81.
Teicher, J., Alam, Q., and Van Gramberg, B. (2006). "Managing trust and relationships in PPPs: some Australian experiences." Int. Rev. Admin. Sci., 72(1), 85-100.
Templeman, D., and Paradise, P. (2006). "PPP: probity and the perpetual processor." Univ. New S. Wales Law J., 29(3), 282-288.
Thia, H., and Ford, G. (2009). "Delivery of economic benefits using public private partnerships in the development of infrastructure projects." Int. Rev. Bus. Res. Papers, 5(3), 214-226.
Thomas, A. V., Kalidindi, S. N., and Ananthanarayanan, K. (2003). "Risk perception analysis of BOT road project participants in India." Constr. Manage. Econ., 21(4), 393-407.
Thomas, A. V., Kalidindi, S. N., and Ganesh, L. S. (2006). "Modelling and assessment of critical risks in BOT road projects." Constr. Manage. Econ., 24(4), 407-424.
Thomson, J. M. (1998). "Reflections on the economics of traffic congestion." J. Transp. Econ. Policy, 32(1), 93-110.
Tiede, W., and Krispenz, S. (2007). "Analysis of the first draft of the Moldovan law on public-private partnerships, including an analysis of German and Russian legislation." SE Eur. Rev. Labour, Soc. Affairs, 4, 135-55.
Tieva, A., and Junnonen, J.-M. (2009). "Proactive contracting in Finnish PPP projects." Int. J. Strat. Property Manage., 13(3), 219-28.
Tiong, R. L. K., and Alum, J. (1997a). "Distinctive winning elements in BOT tender." Eng., Constr., Archit. Manage., 4(2), 83-94.

138 PPP Literature
Tiong, R. L. K., and Alum, J. (1997b). "Evaluation of proposals for BOT projects." Int. J. Proj. Manage., 15(2), 67-72.
Tiong, R. L. K., and Alum, J. (1997c). "Final negotiation in competitive BOT tender." J. Constr. Eng. Manage., 123(1), 6-10.
Tiong, R. L. K., and Alum, J. (1997d). "Financial commitments for BOT projects." Int. J. Proj. Manage., 15(2), 73-78.
Torres, L., and Pina, V. (2001). "Public-private partnership and private finance initiatives in the EU and Spanish local governments." Eur. Acctg. Rev., 10(3), 601-619.
Trafford, S., and Proctor, T. (2006). "Successful joint venture partnerships: public-private partnerships." Int. J. Public Sector Manage., 19(2), 117-129.
Trailer, J. W., Rechner, P. L., and Hill, R. C. (2004). "A compounded agency problem: an empirical examination of public-private partnerships." J. Am. Acad. Business, 5(1/2), 308-315.
Tranfield, D., Rowe, A., Smart, P. K., Levene, R., Deasley, P., and Corley, J. (2005). "Coordinating for service delivery in public-private partnership and Private Finance Initiative construction projects: early findings from an exploratory study." Proc. Inst. Mech. Eng.: Part B, 219(1), 165-175.
Tsai, J.-F., and Chu, C.-P. (2003). "The analysis of regulation on private highway investment under a build-operate-transfer scheme." Transportation, 30(2), 221-243.
Tsamboulas, D., Panou, K., and Abacoumkin, C. (2000). "Attractiveness of transportation infrastructure projects to private-sector financing: assessing the hierarchical analysis, risk scenario method." Transp. Res. Rec., 1732, 12-21.
Ubbels, B., and Verhoef, E. T. (2008). "Auctioning concessions for private roads." Transp. Res. Part A, 42(1), 155-172.
Välilä, T. (2005). "How expensive are cost savings? On the economics of public-private partnerships." EIB Papers, 10(1), 94-119.
Vassallo, J. M. (2004). "Short-term infrastructure concessions: conceptual approach and recent applications in Spain." Pub. Works Manage. Policy, 8(4), 261-270.
Vassallo, J. M. (2006). "Traffic risk mitigation in highway concession projects: the experience of Chile." J. Transp. Econ. Policy, 40(3), 359-381.
Vassallo, J. M., and Gallego, J. (2005). "Risk sharing in the new public works concession law in Spain." Transp. Res. Rec., 1932, 1-8.
Vassallo, J. M., and Sánchez-Soliño, A. (2006). "Minimum income guarantee in transportation infrastructure concessions in Chile." Transp. Res. Rec., 1960, 15-22.
Vassallo, J. M., and Sánchez-Soliño, A. (2007). "Subordinated public participation loans for financing toll highway concessions in Spain." Transp. Res. Rec., 1996, 1-8.
Vega, A. O. (1997). "Risk allocation in infrastructure financing." J. Proj. Finance, 3(2), 38-42. Verhoef, E. T. (2007). "Second-best road pricing through highway franchising." J. Urban Econ., 62(2), 337-361. Verhoef, E. T., Nijkamp, P., and Rietveld, P. (1995). "Second-best regulation of road transport externalities." J.
Transp. Econ. Policy, 29(2), 147-164. Verhoef, E. T., and Small, K. A. (2004). "Product differentiation on roads: constrained congestion pricing with
heterogeneous users." J. Transp. Econ. Policy, 38(1), 127-156. Vickrey, W. (1948). "Some objections to marginal-cost pricing." J. Political Econ., 56(3), 218-238. Vickrey, W. (1963). "Pricing in urban and suburban transport." Am. Econ. Rev., 53(2), 452-465. Vining, A. R., and Boardman, A. E. (2008a). "Public-private partnerships in Canada: theory and evidence." Can.
Public Admin., 51(1), 9-44. Vining, A. R., and Boardman, A. E. (2008b). "Public-private partnerships: eight rules for governments." Pub. Works
Manage. Policy, 13(2), 149-161. Vining, A. R., Boardman, A. E., and Poschmann, F. (2005). "Public-private partnerships in the US and Canada:
there are no free lunches." J. Comp. Policy Analysis, 7(3), 199-220. Walker, R. G. (2003). "Public-private partnerships: form over substance?" Austr. Acctg. Review, 13(30), 54-59. Wall, A. P., and Connolly, C. (2009). "The Private Finance Initiative: an evolving research agenda?" Pub. Manage.
Rev., 11(5), 707-724. Wamuziri, S., and Jiang, M. (2008). "Role of export credit agencies in PFI/PPP projects." Proc. Inst. Civil Eng.:
Manage., Procure., Law, 161(4), 163-69. Wang, S., and Tiong, R. L. K. (1999). "Political risks: analysis of key contract clauses in China's BOT project." J.
Constr. Eng. Manage., 125(3), 190-197.

Appendix A 139
Wang, S., and Tiong, R. L. K. (2000). "Evaluation and management of political risks in China's BOT projects." J. Constr. Eng. Manage., 126(3), 242-250.
Wang, S., Tiong, R. L. K., Ting, S. K., and Ashley, D. (2000a). "Evaluation and management of foreign exchange and revenue risks in China's BOT projects." Constr. Manage. Econ., 18(2), 197-207.
Wang, S., Tiong, R. L. K., Ting, S. K., and Ashley, D. (2000b). "Foreign exchange and revenue risks: analysis of key contract clauses in China's BOT project." Constr. Manage. Econ., 18(3), 311-320.
Ward, J., and Sussman, J. (2006). "Malaysian toll road public-private partnership program: analysis and recommendations for policy improvements." Transp. Res. Rec., 1960, 119-127.
Watson, D. (2003). "The rise and rise of public private partnerships: challenges for public accountability." Austr. Acctg. Review, 13(31), 2-14.
Watson, D. (2004). "The challenge for public accounts committees in evaluating public-private partnerships." Austr. Acctg. Review, 14(33), 78-84.
Watson, D. (2006). "The private sector as a regulatory tool for public private partnerships." Univ. New S. Wales Law J., 29(3), 294-301.
Wei, C.-H., and Chung, M.-C. (2002). "Transportation BOT schemes for public and private sector financing scenario analysis: the experience in Taiwan." IATSS Res. (Intl. Assoc. Traffic Safety Sci.), 26(1), 60-70.
Weihe, G. (2008). "Public-private partnerships and public-private value trade-offs." Pub. Money Manage., 28(3), 153-158.
Wettenhall, R. (2003). "The rhetoric and reality of public-private partnerships." Pub. Organiz. Review, 3(1), 77-107. Wibowo, A. (2004). "Valuing guarantees in a BOT infrastructure project." Eng., Constr., Archit. Manage., 11(6),
395-403. Wibowo, A. (2005). "Estimating general threshold traffic levels of typical build, operate, and transfer toll road
projects in Indonesia." Constr. Manage. Econ., 23(6), 621-630. Williams, H. C. W. L., Van Vliet, D., Parathira, C., and Kim, K. S. (2001). "Highway investment benefits under
alternative pricing regimes." J. Transp. Econ. Policy, 35(2), 257-284. Wohl, M., and Martin, B. V. (1967). "Methods of evaluating alternative road projects." J. Transp. Econ. Policy,
1(1), 28-45. Wooldridge, S. C., Garvin, M. J., Cheah, Y. J., and Miller, J. B. (2002). "Valuing flexibility in private toll road
development." J. Struct. Finance, 7(4), 25-36. Xenidis, Y., and Angelides, D. (2005). "The legal risks in build-operate-transfer projects." J. Constr. Res., 6(2), 273-
292. Xu, Y., Chan, A. P. C., and Yeung, J. F. Y. (2010). "Developing a fuzzy risk allocation model for PPP projects in
China." J. Constr. Eng. Manage., 136(8), 894-903. Yang, H., and Lam, W. H. K. (1996). "Optimal road tolls under conditions of queueing and congestion." Transp.
Res. Part A, 30(5), 319-332. Yang, H., and Meng, Q. (2000). "Highway pricing and capacity choice in a road network under a build-operate-
transfer scheme." Transp. Res. Part A, 34(3), 207-222. Yang, H., and Verhoef, E. T. (2004). "Road pricing problems: recent methodological advances." Networks, Spatial
Econ., 4(2), 131-133. Yang, J.-B., Yang, C.-C., and Kao, C.-K. (2010). "Evaluating schedule delay causes for private participating public
construction works under the Build-Operate-Transfer model." Int. J. Proj. Manage., 28(6), 569-579. Yang, J. Q. (2005). "Sensitivity analysis based method for optimal road network pricing." Annals Ops. Research,
133(1), 303-317. Ye, S., and Tiong, R. L. K. (2000). "NPV-at-risk method in infrastructure project investment evaluation." J. Constr.
Eng. Manage., 126(3), 227-233. Ye, S., and Tiong, R. L. K. (2003a). "The effect of concession period design on completion risk management of
BOT projects." Constr. Manage. Econ., 21(5), 471-482. Ye, S., and Tiong, R. L. K. (2003b). "Effects of tariff design in risk management of privately financed infrastructure
projects." J. Constr. Eng. Manage., 129(6), 610-618. Ye, S., and Tiong, R. L. K. (2003c). "Tariff adjustment frameworks for privately financed infrastructure projects."
Constr. Manage. Econ., 21(4), 409-419. Yeo, K. T., and Tiong, R. L. K. (2000). "Positive management of differences for risk reduction in BOT projects."
Int. J. Proj. Manage., 18(4), 257-265. Yingsutthipun, J., and Minato, T. (1998). "Source risks of transportation BOT projects in Thailand." J. Constr.
Manage. (Japan Soc. Civ. Eng.), 6, 163-172.

140 PPP Literature
Yuan, J., Skibniewski, M. J., Li, Q., and Zheng, L. (2010). "Performance objectives selection model in public-private partnership projects based on the perspective of stakeholders." J. Manage. Eng., 26(2), 89-104.
Yuan, J., Zeng, A. Y., Skibniewski, M. J., and Li, Q. (2009). "Selection of performance objectives and key performance indicators in public-private partnership projects to achieve value for money." Constr. Manage. Econ., 27(3), 253-270.
Yun, S., Han, S. H., Kim, H., and Ock, J. H. (2009). "Capital structure optimization for build-operate-transfer (BOT) projects using a stochastic and multi-objective approach." Can. J. Civ. Eng., 36(5), 777-790.
Zayed, T. M., and Chang, L.-M. (2002). "Prototype model for build-operate-transfer risk assessment." J. Manage. Eng., 18(1), 7-16.
Zhang, H. M., and Ge, Y. E. (2004). "Modeling variable demand equilibrium under second-best road pricing." Transp. Res. Part B, 38(8), 733-749.
Zhang, X. (2004). "Concessionaire selection: methods and criteria." J. Constr. Eng. Manage., 130(2), 235-244. Zhang, X. (2005a). "Concessionaire's financial capacity in developing build-operate-transfer type infrastructure
projects." J. Constr. Eng. Manage., 131(10), 1054-1064. Zhang, X. (2005b). "Criteria for selecting the private-sector partner in public-private partnerships." J. Constr. Eng.
Manage., 131(6), 631-644. Zhang, X. (2005c). "Critical success factors for public-private partnerships in infrastructure development." J.
Constr. Eng. Manage., 131(1), 3-14. Zhang, X. (2005d). "Paving the way for public-private partnerships in infrastructure development." J. Constr. Eng.
Manage., 131(1), 71-80. Zhang, X. (2006). "Public clients’ best value perspectives of public private partnerships in infrastructure
development." J. Constr. Eng. Manage., 132(2), 107-114. Zhang, X., and AbouRizk, S. M. (2006). "Determining a reasonable concession period for private-sector provision
of public works and services." Can. J. Civ. Eng., 33(5), 622-631. Zhang, X., and Kumaraswamy, M. M. (2001a). "BOT-based approaches to infrastructure development in China." J.
Infrastruct. Syst., 7(1), 18-25. Zhang, X., and Kumaraswamy, M. M. (2001b). "Hong Kong experience in managing BOT projects." J. Constr. Eng.
Manage., 127(2), 154-162. Zhang, X., Kumaraswamy, M. M., Zheng, W., and Palaneeswaran, E. (2002). "Concessionaire selection for build-
operate-transfer tunnel projects in Hong Kong." J. Constr. Eng. Manage., 128(2), 155-163. Zhou, J., Chen, X.-G., and Yang, H.-W. (2008). "Control strategy on road toll pricing under a BOT scheme." Syst.
Eng. Theory, Pract., 28(2), 148-151. Zitron, J. (2006). "Public-private partnership projects: towards a model of contractor bidding decision-making." J.
Purch. Supply Manage., 12(2), 53-62. Zou, P. X. W., Wang, S., and Fang, D. (2008). "A life-cycle risk management framework for PPP infrastructure
projects." J. Fin. Manage. Prop. Constr., 13(2), 123-142.

141
Appendix B: Rubric for Assigning QCA Values


Appendix B 143
PRICING Condition
Source documentation
Contract documents, industry news reports, popular news reports (in order of priority) Target elements within this literature
Permitted toll schedules (contract) and current toll levels (often published on project website)—compare to determine whether lower tolls than maximum allowable are being charged. Also see project planning documents (e.g., “Purpose and Need” chapter from EIS) to examine motivation for tolling and rationale for setting initial toll. See contract documentation to identify toll escalation rates. How to code these elements
0 = average-cost pricing: tolls are set at a fixed pre-specified level intended to cover the cost of service
provision. These may be set equivalent to rates for previous ferry service, for instance, and often escalate at a rate no higher than the consumer price index (CPI).
1 = marginal-social-cost pricing: tolling rationale is to control traffic congestion or other undesirable
side-effect of excessive road usage. Tolls are usually variable and may produce more (or in rare cases, less) revenue than necessary to cover the cost of service provision.
2 = revenue-maximizing pricing: tolling rationale is to raise the greatest possible revenues. Tolls are
often variable and are higher than marginal-social-cost pricing (toll rates for which traffic flow is optimized). These tolls often escalate at the rate of per-capita gross domestic product (GDP) or a fixed amount each year, regardless of economic indicators.

144 QCA Rubric
LENGTH Condition
Source documentation
Contract documents, industry news reports, popular news reports (in order of priority) Target elements within this literature
Contract section (or article excerpts) addressing concession length. For fixed-length concessions, consider base length, even if contract permits extensions under specified circumstances. How to code these elements
0 = concession length not fixed at outset, even if bounded by minimum/maximum limits 1 = concession length (including any construction) up to 50 years 2 = concession length (including any construction) 50 years or greater
UPSIDE Condition
Source documentation
Contract documents, industry news reports, popular news reports (in order of priority) Target elements within this literature
Contract revenue-sharing provisions, often expressed in terms of permitted profits or rate-of-return. These provisions are sometimes outlined more concisely in industry-literature articles analyzing the contract. How to code these elements
0 = concessionaire is not required to share revenues or shorten the concession when certain traffic
levels/financial indicators are reached 1 = concessionaire is required to share revenues (including refinancing gains) or accept a shorter
concession term when certain indicators are reached (For variable-length concessions, UPSIDE = 1 only if contract also includes explicit revenue-sharing
clauses in addition to varying-length provisions.)
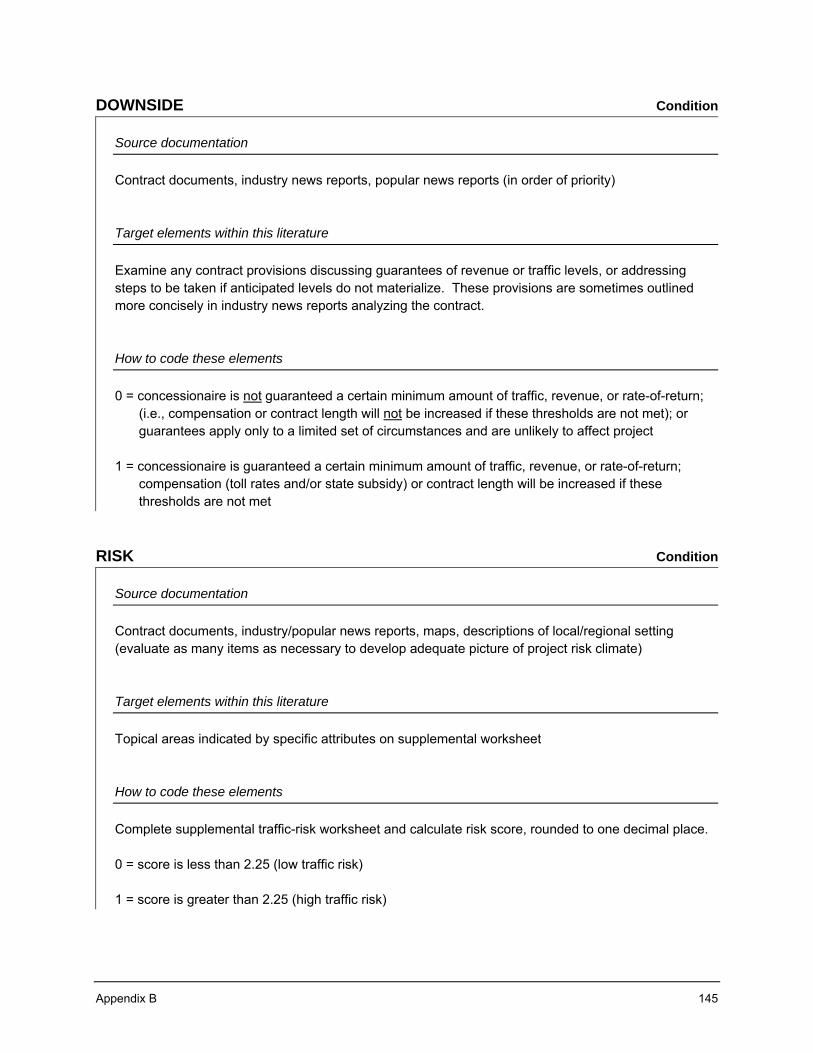
Appendix B 145
DOWNSIDE Condition
Source documentation
Contract documents, industry news reports, popular news reports (in order of priority) Target elements within this literature
Examine any contract provisions discussing guarantees of revenue or traffic levels, or addressing steps to be taken if anticipated levels do not materialize. These provisions are sometimes outlined more concisely in industry news reports analyzing the contract. How to code these elements
0 = concessionaire is not guaranteed a certain minimum amount of traffic, revenue, or rate-of-return;
(i.e., compensation or contract length will not be increased if these thresholds are not met); or guarantees apply only to a limited set of circumstances and are unlikely to affect project
1 = concessionaire is guaranteed a certain minimum amount of traffic, revenue, or rate-of-return;
compensation (toll rates and/or state subsidy) or contract length will be increased if these thresholds are not met
RISK Condition
Source documentation
Contract documents, industry/popular news reports, maps, descriptions of local/regional setting (evaluate as many items as necessary to develop adequate picture of project risk climate) Target elements within this literature
Topical areas indicated by specific attributes on supplemental worksheet How to code these elements
Complete supplemental traffic-risk worksheet and calculate risk score, rounded to one decimal place. 0 = score is less than 2.25 (low traffic risk) 1 = score is greater than 2.25 (high traffic risk)

146 QCA Rubric
TOLLRATE Outcome
Source documentation
Project planning documents (e.g., traffic-and-revenue studies), industry and/or popular news reports, academic reviews/case studies Target elements within this literature
Look for statements in project-planning documents and news reports indicating whether the public sector specified an initial toll rate and/or rate cap, and if so, how this level was determined. Were the rates project-based (e.g., linked to traffic-and-revenue studies or project cost) or project-independent (e.g., aligned to previous levels of charging, popular sentiment, or other toll levels in the network)? How to code these elements
0 = public sector does not specify an initial toll rate and/or rate cap; or, if toll levels are specified, the
rate is based on project-related factors; or tolls are variable (by time of day or congestion level) 1 = public sector specifies an initial toll rate and/or rate cap based on project-independent factors
FREEFLOW Outcome
Source documentation
Project planning documents (e.g., “Purpose and Need” chapter from EIS, traffic-and-revenue studies), current toll rates (often posted on project’s website), industry and/or popular news reports, academic reviews/case studies Target elements within this literature
In project documents, consider existing traffic levels in the corridor, and whether the public sector identified congestion management (or “throughput maximization”) as a primary goal. In this case, the project name will often include the term “managed,” “express,” or “HOT” lanes. Also examine the toll rate sheet to determine whether tolls are fixed or variable, either by time-of-day or traffic levels. How to code these elements
0 = fixed toll rates (not varying by time-of-day or traffic levels); or variable toll rates if MINMAX = 1 1 = variable toll rates, with congestion management stated as a major procurement objective for the
public sector

Appendix B 147
MINMAX Outcome
Source documentation
Project planning documents (e.g., traffic-and-revenue studies, procurement documents), industry and/or popular news reports, academic reviews/case studies Target elements within this literature
Examine the procurement documents for the evaluation criteria used in awarding the project: is the amount of up-front payment or subsidy a bid variable? Also consider news reports/analyses, which may indicate the public sector’s goal is to collect the greatest up-front payment and/or to enable a contract which generates the maximum possible revenue for the concessionaire—for instance, to make a marginally self-sustaining project viable. Such a situation tends to arise when project costs are at or above the level of revenue forecasts (see traffic-and-revenue studies or industry reports). Consider the contract’s toll-setting mechanism: does the concessionaire have low or high flexibility in determining initial toll rates in order to deliver the most advantageous financial offer? Also consider the contract’s mechanism for escalating tolls: is it based on a fixed indicator (such as CPI or GDP), or does the concessionaire have latitude to select from multiple annual indicators and/or apply a step function unrelated to these indices? How to code these elements
0 = none of the conditions below (for MINMAX = 1) are met 1 = (a) subsidy minimization/revenue maximization is a stated procurement goal; or
(b) the level of payments to the state from the concessionaire (or the level of subsidies from the public sector) is among the evaluation criteria for the procurement; or
(c) the contract allows substantial latitude in the toll structure’s “degrees of freedom,” indicated by
elements such as the following: (i) the concessionaire specifies the initial and/or ongoing toll rates, or (ii) toll escalation is based on the concessionaire’s choice among multiple indicators (one of
which is usually GDP), or by periodic increases which are much larger than typical GDP or CPI escalation

148 QCA Rubric
Project Attribute
Traffic Risk Index Toll Facility
1 2 3 4 5 Risk
Score Comments
Tolling Culture
Toll roads well estab-lished: data on actual use are available
No toll roads in the country, uncertainty over toll acceptance
Toll Facility Details
Estuarial crossings; radial corridors into urban areas
Dense, urban networks; ring roads/beltways around urban areas
Extension/expansion of existing road
Greenfield site
Stand-alone (single) facility
Reliance on other, proposed highway improvements
Highly congested corridor
Limited/no congestion
Few competing roads Many alternative routes
Users High-income, time-sensitive market
Average/low-income market
Traffic Growth
Driven by/correlated with existing factors
Reliance on future growth factors, new developments, etc.
Sum of Risk Scores:
Average Risk Score: (for average, divide sum by 8; round to one decimal place)
RISK variable = (0 if < 2.25; 1 if > 2.25)
Condition Value Outcome Value
PRICING TOLLRATE
LENGTH FREEFLOW
UPSIDE MINMAX
DOWNSIDE
RISK
Project: Scoring Worksheet

149
Appendix C: Case Summaries


Appendix C 151
Route 460 Corridor Improvements (Virginia, USA) – first procurement In 2003, Virginia’s legislature called for a PPP to expand a 55-mile segment of US Route 460 between Suffolk and Petersburg. The new parallel highway would upgrade the road’s capacity and safety standards and provide a hurricane evacuation route for the state’s low-lying coastal regions, and the procurement was purposely structured as a PPP because no public funding was available. Although three concessionaire teams submitted conceptual proposals in 2006, they expressed concern that traffic demand would likely be insufficient to support the project, whose cost was estimated between $1 billion and $2 billion. To address this revenue risk, the 2009 draft comprehensive agreement outlined the first variable-length PPP in the US, stating tolls would be set at rates proposed by the concessionaire (Section 5 and Exhibit B-5). Still, the difficulty of funding the desired project scope solely through tolls indicated a revenue-maximizing pricing structure would be necessary for this highway to be built at all. Although the concession’s variable length covered most scenarios typically addressed by revenue sharing, the agreement nevertheless included such upside provisions (Exhibit E, Part C.1) in case toll income exceeded the project’s targeted present value prior to the minimum 30-year concession term. There was no downside-risk sharing (Section 4.02(b)): if revenues did not reach the present-value target in 99 years, the concessionaire would receive no further compensation. Due to continued private-sector concerns about the project’s economic viability, particularly with substantial diversion anticipated from the new tolled route to the parallel free route, no firms responded to the 2009 solicitation for detailed proposals. The procurement was terminated in 2010.
ID PRICING LENGTH UPSIDE DOWNSIDE RISK TOLLRATE FREEFLOW MINMAX
ROUTE460 2 0 1 0 3.4 0 0 1
References Virginia Department of Transportation. (2006). Solicitation for Proposals, U.S. Route 460
Corridor Improvements Project through the Public-Private Transportation Act (issued February 15, 2006).
Virginia Department of Transportation. (2009). Request for Detailed Proposals, Part 3:
Comprehensive Agreement, U.S. Route 460 Corridor Improvements Project, Addendum #1 (issued February 24, 2009).
Virginia General Assembly. (2003). Acts of Assembly, Chapter 953: “An Act to require the
Virginia Department of Transportation to solicit proposals for improvements to U.S. Route 460 between Hampton Roads and the Richmond-Petersburg metropolitan area under the Public-Private Transportation Act of 1995.”

152 Case Summaries
I-595 Express Lanes (Florida, USA) To relieve congestion along a busy 11-mile stretch of I-595, the Florida DOT (FDOT) planned a PPP for reversible HOT lanes in the highway’s median, along with improvements to the existing corridor. Congestion pricing was envisioned on the new lanes to manage traffic flow, but FDOT recognized the desired improvements could not be fully covered by toll revenues. Hence funding for construction, operations, and maintenance was programmed into the state’s long-range plan. The state retained toll-setting authority, as well as toll revenues, and the private developer was compensated through traffic-independent availability payments. FDOT issued a RFQ in October 2007, selected a concessionaire in October 2008, and finalized the contract in March 2009. As the first availability-payment PPP in the US, this project has neither upside revenue sharing nor downside risk sharing: proposers declined the state’s offer, in the draft concession agreement, to provide a per-car traffic payment in addition to the availability payment. The concession term extends 35 years from the date of the agreement.
ID PRICING LENGTH UPSIDE DOWNSIDE RISK TOLLRATE FREEFLOW MINMAX
I-595 1 1 0 0 1.3 0 1 0
References Florida Department of Transportation. (2009). “Concession Agreement for I-595 Corridor
Roadway Improvements Project” (executed March 3, 2009).

Appendix C 153
I-495 Capital Beltway HOT Lanes (Virginia, USA) The I-495 concession extends 80 years from the date of the December 2007 comprehensive agreement, anticipating a five-year construction duration and a 75-year operating period. In order to include desired improvements to related highway facilities, the state plans to furnish $409 million of the project’s estimated $1.4 billion overall cost. Congestion pricing will be implemented on the HOT lanes to maintain traffic at free-flow speeds. The Virginia DOT agreed to cover certain elements of downside risk: “To assure that there is no disincentive for HOV and transit use of the HOT lanes, the Commonwealth will make payments to the Concessionaire if HOV use of the lanes exceeds projections under certain conditions.” The state also shares in upside benefits resulting from refinancing gains, or if the concessionaire exceeds certain IRR targets (VDOT 2007a):
The Commonwealth will also earn a permit fee (revenue sharing) of between 5 and 30 percent of earned annual gross revenue if projected HOT lane performance allows the private partners to achieve a rate of return on total invested funds in excess of agreed-to benchmarks. The permit fee will also be based on earned revenue from any positive project refinancing. Any permit fee or other revenues from the Project will be used for projects and programs that benefit the users of the HOT lanes.
(The last sentence is of interest from an economic perspective. Since it is essentially the individual drivers who have “paid too much” in the case of excess private-sector returns, the state ensures these road users realize the benefit of the shared revenues.) The contract includes no non-compete provisions, but the concessionaire receives the right of first refusal to construct additional toll lanes if congestion exceeds the HOT lanes’ capacity. Original:
ID PRICING LENGTH UPSIDE DOWNSIDE RISK TOLLRATE FREEFLOW MINMAX
I-495 1 2 1 1 1.8 0 1 0
Re-coded:
ID PRICING LENGTH UPSIDE DOWNSIDE RISK TOLLRATE FREEFLOW MINMAX
I-495 1 2 1 0 1.8 0 1 0
References Virginia Department of Transportation. (2007a). “Recommended Business Terms for the Capital
Beltway High Occupancy Toll Lanes Comprehensive Agreement,” Memo from Malcolm Kerley and Barbara Reese to David Ekern, September 5.
Virginia Department of Transportation. (2007b). “Amended and Restated Comprehensive Agreement Relating to the Route 495 HOT Lanes in Virginia Project” (executed December 19, 2007).

154 Case Summaries
Chicago Skyway (Illinois, USA) This eight-mile toll road and bridge linking southern Chicago to the Indiana border was opened in 1958. After years of light traffic, usage of the facility increased rapidly in the 1990’s, and the city of Chicago took interest in leasing it to a private operator to provide a cash infusion for the city’s budget difficulties. A competitive procurement eventually drew an offer of $1.83 billion from a consortium led by Australian investor Macquarie, and in 2005, the city finalized a 99-year operating-lease agreement structured with aggressive toll increases which enabled this sizeable up-front payment. Macquarie felt comfortable with this substantial amount, noting the facility was well positioned for continued traffic and revenue growth. Average daily traffic levels in 2003 were around 48,000 vehicles, or 8000 vehicles per lane—about a third of the theoretical daily capacity of 23,000 vehicles per lane (Macquarie 2004). Further, the feasibility of diverting to competing facilities was limited, making drivers’ demand more inelastic even with the increasing tolls.
ID PRICING LENGTH UPSIDE DOWNSIDE RISK TOLLRATE FREEFLOW MINMAX
SKYWAY 2 2 0 0 1.8 0 0 1
References Macquarie (2004). Presentation, “Skyway financial close.” <http://www.macquarie.com.au/au/
mig/acrobat/mig_chicago_close.pdf> (October 30, 2009).

Appendix C 155
SR-91 Express Lanes (California, USA) The State Route 91 project, one of four PPPs authorized by California’s AB 680 legislation in 1989, comprised the 1995 addition of express lanes to the median of a congested ten-mile stretch of California’s SR-91 freeway. Though there were no toll-rate restrictions for this facility with variable time-of-day pricing, any profits above 17% would be used to retire project debt (whose commercial interest rate was around 12%) or transferred to California’s general highway fund. “The highway...was the first toll road in the United States to use variable congestion pricing. In addition, SR 91 was the world’s first fully automated toll road, utilizing electronic transponders to collect tolls.” (GAO, pp. 41-43) Despite initial public resistance to tolling (GAO, p. 22), traffic demand was strong, with volume increasing from 7.3 million trips in 1999 to 9.5 million trips in 2002 due to growth in the region: “The project connects large residential areas in Riverside and San Bernardino counties, with major employment centers in Orange and Los Angeles counties. ...[O]ver the next 25 years Orange County is projected to add over a half million jobs, while Riverside County’s population is projected to increase by one million people.” (GAO, pp. 41, 43) The concession extended 35 years, and the contract prohibited the state from expanding SR-91 or other facilities within 1.5 miles of the highway during this period. Construction of alternate routes was in fact unlikely, due to the mountains on either side of the route. (GAO, p. 43) Public pressure to improve SR-91’s free lanes eventually led the state to buy the concession back from the developer in 2003.
ID PRICING LENGTH UPSIDE DOWNSIDE RISK TOLLRATE FREEFLOW MINMAX
SR91 1 1 1 0 1.4 0 1 0
References Fielding, G.J., and Klein, D.B. (1993). “How to franchise highways.” J. Transp. Econ. Policy,
27(2), 113-130. US Government Accounting Office (GAO). (2004). “Highways and transit: private sector
sponsorship of and investment in major projects has been limited.” Report to Congressional Requesters, GAO-04-419, Washington, DC.
Price, W.T. (2001). “An odyssey of privatizing highways: the evolving case of SR 91.” Pub.
Works Manage. Policy, 5(4), 259-269. Vining, A.R., Boardman, A.E., and Poschmann, F. (2005). “Public-private partnerships in the
US and Canada: there are no free lunches.” J. Comp. Policy Analysis, 7(3), 199-220.

156 Case Summaries
SH-121 Managed Lanes (Texas, USA) In 2007, the North Texas Tollway Authority (NTTA) granted TxDOT an up-front payment of $3.2 billion for a 50-year concession of 26 miles of State Highway 121, also known as the Sam Rayburn Tollway. At the time of the agreement, parts of SH-121 were already under construc-tion through a separate TxDOT contract, and NTTA was responsible for integrating these with its construction of the remaining segments. The completed facility is to be 12 lanes wide, with three toll lanes and three frontage lanes (free lanes with traffic lights and lower speed limits) in each direction. Heavy population growth and increasing congestion in the Dallas-Fort Worth area are the main project drivers. All-electronic time-of-day pricing will be used on the toll lanes, subject to per-mile base rate caps specified in Exhibit R, “Toll Regulations,” of the Project Agreement. These maximum rates may be escalated every two years. According to Section 22(b)(ii) of the Agreement, tolls may be further increased if necessary to “preserve the financial condition of the NTTA System [or] comply with the provisions of any bonds, notes, trust agreements or other financial instru-ments or agreements secured by the revenues of the NTTA System.” Exhibit Q of the Agreement, “Table 1 – Band Floors and Ceilings” and “Table 2 – TxDOT Revenue Share Applicable Percentages,” specifies traffic bands at which certain percentages of toll revenues will be shared with TxDOT.
ID PRICING LENGTH UPSIDE DOWNSIDE RISK TOLLRATE FREEFLOW MINMAX
SH121 1 2 1 1 1.4 1 1 0
References Samuel, P. (2007). “$3.2b financial close on public-public toll concession for TX121,”
TollRoadsNews, November 30. Texas Department of Transportation. (2007). “Project Agreement: SH 121 Toll Project”
(executed October 18, 2007).

Appendix C 157
Warnow Tunnel (Germany) – first procurement This immersed-tube tunnel, recognized as the country’s first infrastructure PPP, was completed in 2003 and replaced a ferry across the Warnow River in Rostock, Germany. The contract, based on the country’s 1994 “F Model” concessions law, was to have a 30-year term. Alternate routes included downtown city streets in Rostock, as well as a subsequently-constructed autobahn link. In the early planning stages, proposers were furnished optimistic traffic forecasts ranging from 27,000 to 35,000 vehicles per day. These forecasts assumed traffic-calming measures would be installed in downtown Rostock and neglected the impact of traffic diversion to the nearby autobahn connection completed shortly after the tunnel’s opening. The contract included no non-compete provisions. During the design and planning process, the state requested various changes which raised the project cost considerably, and it was assumed this cost growth could be covered by higher tolls. Ultimately the government contributed 12% (about €26 million) of the project’s €219 million cost, with the remainder drawn from sponsor equity and debt. Tolls were intended to cover the concessionaire’s costs, with forecast revenues based on traffic projections, and were constant for each class of vehicle: passenger-car rates were initially set at €2.50 (summer) and €2.00 (winter), for instance. A revised forecast later set the initial count at 13,000 vehicles. But traffic counts in the months after the facility’s opening averaged less than 7000 vehicles per day, leading to substantial losses for the concessionaire.
ID PRICING LENGTH UPSIDE DOWNSIDE RISK TOLLRATE FREEFLOW MINMAX
WARNOW1 0 1 0 0 3.4 1 0 0
References Beckers, T. (2005). “Die Realisierung von Projekten nach dem PPP-Ansatz bei Bundesfern-
straßen,” Dissertation, Technische Universität Berlin. Boecker, A. (2004). “Private Straßenbetreiber über Auslastung enttäuscht,” Die Deutsche
Bauindustrie, September 14. Boyce, A. (2006). “Rostock revisited.” Proc., European Transport Conference, Strasbourg. Gawel, E. (2005). “Private Finanzierung von Fernstraßen: Erfahrungen und Probleme,”
Wirtschaftsdienst, 85(3), 173-181.

158 Case Summaries
Warnow Tunnel (Germany) – renegotiated contract Following renegotiation, the Warnow Tunnel’s concession length was increased in June 2006 from 30 to 50 years. After new tolls were implemented in spring 2008 and 2009 (Macquarie 2008, 2009), the result in 2008 was a 1.4% increase in traffic and a 6.5% increase in revenue, followed by 2009 growth of 1.9% and 7.3% in traffic and revenue, respectively. Because traffic is still increasing along with revenue, toll rates are not yet at full revenue-maximizing levels. Yet the operator continues to negotiate with the state for periodic toll increases (Landtag 2009), a process which is complicated by the requirement of government approval for each adjustment. Hence the pricing outcomes are essentially a hybrid, balancing the concessionaire’s efforts to maximize revenues to the extent possible with the state’s goal to maintain toll rates which are societally acceptable. As of April 2009, passenger-car rates were €2.90 (summer) and €2.30 (winter), with discounts for transponder users.
ID PRICING LENGTH UPSIDE DOWNSIDE RISK TOLLRATE FREEFLOW MINMAX
WARNOW2 2 2 0 0 2.6 1 0 1
References Landtag Mecklenburg-Vorpommern. (2009). “Kleine Anfrage des Abgeordneten Birger Lüssow,
Fraktion der NPD, Warnowquerung und Betreiber Macquarie Bank und Antwort der Landesregierung.” Report no. 5/2501, May 14.
Macquarie (2008). “Warnow Tunnel.” Macquarie Infrastructure Group: Annual Report 2008.
<http://www.frostdesign.com.au/MIG_annual_report_2008/asset-html.html#Warnow> (April 5, 2010).
Macquarie (2009). “Warnow Tunnel.” Macquarie Infrastructure Group: Annual Report 2009.
<http://mig.republicast.com/ar2009/?page=20> (April 5, 2010). MVregio News. (2006). “Rostock: Lehren aus dem Warnowtunnel ziehen,” June 2.
<http://www.mvregio.de/nachrichten_region/hro/11990.html> (April 5, 2010).

Appendix C 159
Herren Tunnel (Germany) In 2005, a bored tunnel under the river Trave replaced an obsolete bascule bridge in Germany’s northern coastal city of Lübeck. This “Herrentunnel” was the country’s second PPP, and like the Warnow crossing, it was structured according to the “F Model,” with a 30-year concession period. The German government provided a subsidy of €89 million, the estimated amount necessary for in-kind replacement of the bascule bridge, which totaled about half the project’s €176 million cost. Based on traffic volumes across the existing bridge, 40,000 to 45,000 vehicles per day were anticipated at the tunnel, and tolls were promised at 1 mark, or €0.51, accordingly. Inflation and additional tunnel-safety requirements increased this estimate; and when a new autobahn link was completed nearby, daily traffic on the existing bridge fell to 30,000 vehicles, prompting the tunnel’s opening toll finally to be set at €0.90. New chokepoints formed at the city’s untolled bridges across the Trave, and daily traffic through the tunnel averaged 22,000 vehicles, leading to a toll increase the following year to €1.10 and a traffic volume of 20,000 vehicles. (This revenue growth, in parallel with a decline in traffic, indicates tolls near or at the revenue-maximizing level.) Initial:
ID PRICING LENGTH UPSIDE DOWNSIDE RISK TOLLRATE FREEFLOW MINMAX
HERREN 0 1 0 0 3.0 0 0 1
Re-coded:
ID PRICING LENGTH UPSIDE DOWNSIDE RISK TOLLRATE FREEFLOW MINMAX
HERREN 2 1 0 0 3.0 0 0 1
References Beckers, T. (2005). “Die Realisierung von Projekten nach dem PPP-Ansatz bei Bundes-
fernstraßen,” Dissertation, Technische Universität Berlin. Clorius, S. (2007). “Tunnel sucht Autos,” Die Zeit, August 16. Samuel, P. (2005). “Private toll tunnel opening in Lubeck, Germany,” TollRoadsNews,
August 21.

160 Case Summaries
Skye Bridge (UK) The Skye Bridge opened in 1995, with capital costs of approximately £39 million, to replace a ferry whose waiting times reached 30 minutes during seasonal peak periods. The state contributed £6 million to cover the anticipated cost of approach roads, plus nearly £3 million additional to compensate the concessionaire for time and cost impacts of occasioned by the public sector. The project’s financing was 98% debt and 2% equity. According to Debande (2002), “The concession contract assigned to SBL [the concessionaire] the rights to charge tolls for traffic using the crossing, based on a fixed-price mechanism, that is, the tolls can be increased in relation to the RPI, with annual increases after the opening of the bridge. However, if toll revenue fell below a level corresponding to some 450,000 vehicles crossing a year (the 1990 traffic level), SBL could increase tolls up to 30 per cent more than the rate of inflation.” This latter element provided downside risk protection. The state also sought a specific toll rate, not exceeding the inflation-adjusted level of 1991 ferry charges. “SBL obtained in compensation a longer concession period. The period was defined by the promoter’s worst case traffic projections inducing low volume risk. A semi-variable term for the operation of the bridge was included. The contract required SBL to cease collecting tolls when the pre-determined ‘required net present value’ or 27 years after opening the bridge was achieved, even if by this date the company had not achieved the target toll revenue.” (Debande 2002) As of 2002, traffic levels were such that the concession was expected to reach this pre-determined value of £23.64 million (at 1990 price levels, discounted at 6% plus inflation) between 2009 and 2013. Due to strong public opposition against the tolls, though, the state bought out the concession in late 2004 and abolished the tolls, paying the concessionaire a lump-sum termination fee of nearly £27 million.
ID PRICING LENGTH UPSIDE DOWNSIDE RISK TOLLRATE FREEFLOW MINMAX
SKYE 0 0 0 1 2.4 1 0 0
References Debande, O. (2002). “Private financing of transport infrastructure: an assessment of the UK
experience.” J. Transp. Econ. Policy, 36(3), 355-387. Highland Council. (2004). “Skye Bridge tolls: judicial review.” Report by Head of Legal
Services, June 24. Moles, P., and Williams, G. (1995). “Privately funded infrastructure in the UK: participants’ risk
in the Skye Bridge project.” Transp. Policy, 2(2), 129-134. Scottish Parliament (2009). “Examples of public sector PPP/PFI contract buy outs.” Advisory
Paper, Finance Committee.

Appendix C 161
Second Tagus Crossing, or Vasco da Gama Bridge (Portugal) With increasing congestion on the sole crossing of Lisbon’s Tagus River, the April 25 Bridge, a joint concession for this structure and an additional not-yet-built bridge formed Portugal’s first project-financed PPP in 1995. Construction of the new €645 million crossing, the Vasco da Gama Bridge, began in 1994, and the concessionaire took over operations of the existing span in 1996. The concession was to last 33 years (until March 2028), or until a cumulative traffic count of 2,250 million vehicles had been reached, whichever came first (de Lemos et al. 2004). The government provided a schedule of toll rates for both bridges, with original tolls on the older structure to be gradually increased to €1.50, matching the eventual level of the new bridge. But public outcry forced the state to withdraw this plan, setting tolls at €0.75 and then €1.00 instead, and to provide the difference in revenues to the concessionaire out of state funds. Although traffic counts exceeded projected demand, the concession was renegotiated in 2000 with a fixed term expiring in March 2030, independent of traffic levels.
ID PRICING LENGTH UPSIDE DOWNSIDE RISK TOLLRATE FREEFLOW MINMAX
LISBON 0 0 0 0 1.6 1 0 0
References de Lemos, T., Eaton, D., Betts, M., and de Almeida, L.T. (2004). “Risk management in the
Lusoponte concession: a case study of the two bridges in Lisbon, Portugal.” Int. J. Proj. Manage., 22(1), 63-73.
Fernandes, C., and Viegas, J.M. (2005). “Portuguese experience in motorway concessions with
real and shadow tolls.” Res. Transp. Econ., 15, 157-174.

162 Case Summaries
Autopista M-12 or Eje Aeropuerto (Spain) When Madrid expanded its Barajas Airport to include a distant new terminal, the M-12 road and tunnel were built to provide access to the new facility. This 9-km highway opened in June 2005 at a total investment cost of €427 million and was delivered as a 25-year concession with a final reversion fee. This amount, which was a bid variable, would be paid to the developer at the end of the PPP term in recognition that the short concession length may not permit recouping full capital and operations costs. Although reversion fees can be structured as variable amounts to compensate concessionaires for traffic uncertainty, in this case the constant demand for airport access was anticipated to minimize the project’s traffic-demand risk, and the fee was constant (Vassallo and Maté 2002). The initial toll was specified to increase annually by CPI (the 2010 level is €1.75), and average daily traffic in 2007 was 11,356 vehicles. After growing 16% from 2006 to 2007, these traffic levels fell 7% between 2007 and 2008, and the concessionaire submitted a request for contract rebalancing to the state in June 2008 (OHL 2008, 2009).
ID PRICING LENGTH UPSIDE DOWNSIDE RISK TOLLRATE FREEFLOW MINMAX
MADRID 0 1 0 0 2.1 1 0 0
Postscript: Subsequent review of original-language documents indicated initial traffic projections of 25,000 vehicles per day, forecast to increase to 50,000 once the new airport terminal opened in 2006. In addition to servicing the airport, the road was designed as a partial alternate outer beltway around Madrid, even though competing roads were untolled.
References OHL. (2008). “Presentation: OHL Concesiones, April 17, 2008.”
<http://acm.ohlconcesiones.com/ACM_Upload/195PUA2982008.pdf> (April 5, 2010). OHL. (2009). “Presentation: OHL Concesiones, April 23, 2009.”
<http://acm.ohlconcesiones.com/ACM_Upload/75MYZ692009.pdf> (April 5, 2010). OHL. (2010). “Presentation: OHL Concesiones, April 20, 2010.”
<http://acm.ohlconcesiones.com/ACM_Upload/214FCX3002010.pdf> (July 15, 2010). Europa Press. (2005). “Abre al tráfico la autopista M-12.” El Mundo, June 16. Vassallo, J.M. and Maté, D. (2002) “Short-term road concessions: application to new toll
motorways in Spain.” Proc., European Transport Conference, Cambridge, UK. Vassallo, J.M. (2004). “Short-term infrastructure concessions: conceptual approach and recent
applications in Spain.” Pub. Works Manage. Policy, 8(4), 261-270.

Appendix C 163
El Melón Tunnel (Chile) The 23-year concession of the El Melón Tunnel, located on the Pan-American Highway 130 km north of Santiago, was in 1993 the first project in Chile’s PPP program (Engel et al. 2003). The concession award was based on evaluation of seven variables, only two of which were weighted heavily enough to be influential in the outcome: toll rate structure and annual payment to the state. All four bidders requested the maximum allowable toll rates and concession length, with the award ultimately determined based on annual concession fee—bids for which ranged from $24,000 to $3.4 million among the four offerors (Paredes and Sánchez 2004). The emphasis on a high annual concession payment drove tolls to the maximum permissible cap. The state guaranteed minimum traffic levels, though for the sum of vehicles using the tunnel and the winding single-lane El Melón hill road. Diversion to this free route was substantial, and the concessionaire unsuccessfully pressed for renegotiation. “The government has refused to change toll prices and transfers beyond the contract stipulations on the grounds that conditions have not changed, that a bidder in a concession must accept the demand risk, and that renegotiation is costly and hampers its reputation” (Basañes et al. 1998). The concessionaire subsequently lowered tolls in an effort to attract traffic from the free road (Gómez-Lobo and Hinojosa 2000). To share any upside benefits, the contract stipulated profits must be split equally with the state once the concessionaire’s rate of return exceeds 15%.
ID PRICING LENGTH UPSIDE DOWNSIDE RISK TOLLRATE FREEFLOW MINMAX
ELMELON 2 1 1 0 2.8 0 0 1
References Basañes, C.F., Saavedra, E., and Soto, R. (1998). “Post-privatization renegotiation and disputes
in Chile.” Working paper no. 116, Infrastructure and Financial Market, Washington, DC. Engel, E., Fischer, R., and Galetovic, A. (2003). “Privatizing highways in Latin America: is it
possible to fix what went wrong?” Discussion paper no. 866, Economic Growth Center, Yale University.
Gómez-Lobo, A., and Hinojosa, S. (2000). “Broad roads in a thin country: infrastructure
concessions in Chile.” Policy research working paper no. 2279, World Bank. Kerf, M. (1998). “Concessions for infrastructure: a guide to their design and award.” Technical
paper no. 399, World Bank, Washington, DC. Paredes, R. D., and Sánchez, J. M. (2004). “Government concession contracts in Chile: the role
of competition in the bidding process.” Econ. Devel., Cult. Change, 53(1), 215-234.

164 Case Summaries
Santiago-Valparaíso-Viña del Mar Toll Road, or Route 68 (Chile) This 141-km collection of new and existing highways, connecting major cities in central Chile, was the first PPP in the Americas to use the least present value of revenue (LPVR) concession structure. Its 1998 contract also incorporated a minimum income guarantee to cover downside risk (Vassallo 2006), along with a minimum concession term of 12 years. The maximum term was 25 years, though “based on official cost and traffic estimates, the concession is expected to last approximately 17 years.” (Gómez-Lobo and Hinojosa 2000) Because most toll highways in Chile have no free alternatives (Vassallo 2006, p. 366), traffic demand risk is reduced. A comparison of this contract’s specified toll caps (Chile 2008) with the highway’s actual toll rates indicates the concessionaire is charging the highest permitted toll for almost all vehicle classes, seeking revenue-maximizing income within the rate-cap constraints. This approach is consistent with an LPVR structure, since the private sector logically seeks to reduce uncertainty about future receipts, thus preferring higher tolls in order to accelerate income and end the concession sooner.
ID PRICING LENGTH UPSIDE DOWNSIDE RISK TOLLRATE FREEFLOW MINMAX
SANTIAGO 2 0 0 1 1.3 1 0 0
References Birebent, P. (2003). “Case study: Rutas del Pacifico SA.” Project Finance International,
March 2003. Chile Ministry of Public Works. (2008). “Señala tarifas máximas en la obra pública fiscal
denominada ‘Concesión Internacional Interconexión Vial Santiago-Valparaíso-Viña del Mar’,” Santiago, December 29.
Engel, E., Fischer, R., and Galetovic, A. (2003). “Privatizing highways in Latin America: is it
possible to fix what went wrong?” Discussion paper no. 866, Economic Growth Center, Yale University.
Gómez-Lobo, A., and Hinojosa, S. (2000). “Broad roads in a thin country: infrastructure
concessions in Chile.” Research paper 2279, World Bank Institute, Washington, DC. Vassallo, J. M. (2006). “Traffic risk mitigation in highway concession projects: the experience
of Chile.” J. Transp. Econ. Policy, 40(3), 359-381.

Appendix C 165
407 ETR (Ontario, Canada) – first procurement Strong population and commercial growth around Toronto in the early 1990’s led to interest in finally constructing the long-planned Highway 407 to ease the area’s heavy traffic congestion and air pollution. Since the Ontario government was weak financially due to a recent recession, it planned to contract for the facility as a PPP toll road, which would also serve as a job-creation opportunity (Miller 2002). Without traffic or revenue guarantees, though, the cost of the originally-envisioned private-sector debt was at least 0.75% greater than that of public-sector borrowing (Vining et al. 2005). As a result, the province assumed full responsibility for the facility’s C$1.5 billion financing, and the 407 Express Toll Route (ETR) was procured in 1994 as a 30-year design-build-operate contract. During the 18 months which Ontario held the highway following completion, it retained toll-setting authority and revenues, along with the project’s revenue risk. The pricing was variable by time of day (Samuel 1996) to control congestion.
ID PRICING LENGTH UPSIDE DOWNSIDE RISK TOLLRATE FREEFLOW MINMAX
407ETR1 1 1 0 0 2.9 0 1 0
References Miller, J.B. (2002). “Highway 407 ETR – Toronto.” Case studies in infrastructure delivery,
Kluwer Academic Publishers, Norwell, Mass., 115-28. Samuel, P. (1996). “407-ETR marketing,” TollRoadsNews, October 29. Vining, A. R., Boardman, A. E., and Poschmann, F. (2005). “Public-private partnerships in the
US and Canada: there are no free lunches.” J. Comp. Policy Analysis, 7(3), 199-220.

166 Case Summaries
407 ETR (Ontario, Canada) – second procurement To retire the 407 ETR’s construction debt and divest many of the public sector’s retained risks, Ontario subsequently leased the highway to a private operator in May 1999 in exchange for an up-front payment of C$3.1 billion. As an additional condition of the 99-year operating lease, the concessionaire was required to provide some $900 million of capital improvements, adding 39 km to the facility’s existing 69 km. According to Mendoza et al. (1999), “The decision on the concession’s term generated perhaps the most debate. The objective was to offer a term long enough to extract the highest possible value from the road [italics added—indicating the state’s goal of achieving maximum revenue] but not beyond that for which no additional value could be generated. Terms from 35 to 999 years were considered. Eventually, bidders were asked to submit indicative prices based on three concession terms. A ninety-nine-year term was ultimately chosen for several reasons. First, the province believed it had a mandate to genuinely privatize Highway 407, not merely lease it. Second, the privatization team believed that a very long concession term offered ownership and financing benefits that would generate a significantly higher winning bid than a shorter term, but that no real value would be achieved beyond ninety-nine years. Finally, potential legal issues in Canada regarding leases longer than ninety-nine years were avoided.” The goal was for the road to accommodate a full capacity of 9000 vehicles/hour at peak periods. If traffic levels were less than capacity, the concessionaire was permitted to charge passenger vehicles a toll of 10¢ per km, increasing annually at a rate linked to inflation. If traffic exceeded peak-hour capacity, the concessionaire could raise tolls as necessary to bring the flow back to 9000 vehicles/hour (Miller 2002). There was no rate-of-return restriction (Mendoza et al. 1999). In 2004, the concessionaire asserted it was losing money on the contract and raised the initial base-toll levels, despite initial opposition and unsuccessful lawsuits from the government. Initial:
ID PRICING LENGTH UPSIDE DOWNSIDE RISK TOLLRATE FREEFLOW MINMAX
407ETR2 2 2 0 0 1.9 0 1 1
Re-coded:
ID PRICING LENGTH UPSIDE DOWNSIDE RISK TOLLRATE FREEFLOW MINMAX
407ETR2 2 2 0 0 1.9 0 0 1
References Mendoza, E., Gold. M., Carter, P., and Parmar, J. (1999). “The sale of Highway 407 express
toll route: a case study.” J. Proj. Finance, 5(3), 5-14. Miller, J.B. (2002). “Highway 407 ETR (Part 2).” Case studies in infrastructure delivery,
Kluwer Academic Publishers, Norwell, Mass., 149-62. Vining, A. R., Boardman, A. E., and Poschmann, F. (2005). “Public-private partnerships in the
US and Canada: there are no free lunches.” J. Comp. Policy Analysis, 7(3), 199-220.

Appendix C 167
Confederation Bridge (Prince Edward Island, Canada) When Prince Edward Island became a Canadian province in 1873, it was constitutionally established that the Canadian government would provide ferry access in perpetuity from the mainland to the island. Interest in a fixed link gradually increased due to complications from icy winter conditions in the channel as well as increasing ferry-service costs. Proposals were solicited in 1987, a developer was selected in 1992, and the eight-mile bridge was opened to traffic in 1997 at a construction cost of over $1 billion. The procurement was structured as a 35-year concession, with the compensation in the form of annual $41.9 million payments (in 1992 Canadian dollars), which represented the government’s approximate subsidy of the subsequently-discontinued ferry services. In addition, the operator collected all toll revenues, with tolls initially set at a level equivalent to the previous ferry rates, with annual increases linked to inflation. (As of 2010, car tolls were C$42.50 for a round trip, or approximately US$42.25). The state also provided the concessionaire a minimum revenue guarantee of C$13.9 million annually (Vining et al. 2005).
ID PRICING LENGTH UPSIDE DOWNSIDE RISK TOLLRATE FREEFLOW MINMAX
CONFED 0 1 0 1 2.4 1 0 0
References Miller, J.B. (2002). “Confederation Bridge over the Northumberland Strait.” Case studies in
infrastructure delivery, Kluwer Academic Publishers, Norwell, Mass., 99-114. Vining, A.R., Boardman, A.E., and Poschmann, F. (2005). “Public-private partnerships in the
US and Canada: there are no free lunches.” J. Comp. Policy Analysis, 7(3), 199-220.

168 Case Summaries
Cross City Tunnel (New South Wales, Australia) The Cross-City Tunnel under Sydney’s central business district was envisioned as a shortcut saving motorists 15-20 minutes per peak-hour trip. Although initial analyses indicated a weak cost-benefit relationship for the project (Phibbs 2008), the state nevertheless proposed advancing it as a 30-year PPP concession. Because the government insisted the tunnel be built at no cost to the public sector, numerous changes during the planning stage were offset through higher initial tolls and a more aggressive toll-escalation structure. The state paid for $75 million of extra work, for instance, by increasing the annual toll escalation from direct CPI to the greater of 4% or CPI, which would be decreased gradually to CPI escalation in the later years of the concession (Phibbs 2008). The change with the most significant impact, though, was an increase in the tunnel’s length from the originally-envisioned 1.2 km to a final length of 2.1 km. As a result of these scope changes, the base toll (which was originally estimated at $2.50 in 1998) rose to $3.56 when the $800 million tunnel opened in 2005. Part of this rate covered the winning concessionaire’s $100 million up-front payment to the state. The two unsuccessful proposers, who had calculated much lower traffic forecasts, requested government subsidies for the project instead. Traffic forecasts prepared by the concessionaire and the state’s advisor were highly optimistic: initial projections anticipated 70,000 vehicles per day, but the facility’s opening produced barely 20,000 daily users. Even a brief toll-free period raised daily traffic demand only to 50,000 trips. Although the city had planned traffic-calming measures for above-ground streets in anticipation of reduced surface traffic, the tunnel’s light usage resulted in continued heavy demand for these roadways. Significant public opposition arose to this closure and reconfiguring of downtown streets, which drivers viewed as an attempt to force them to use the tunnel by making free roads impractical. Although the concessionaire hoped traffic would grow closer to forecast levels after an initial ramp-up period, these anticipated volumes never materialized. The project went into receiver-ship in 2006, less than two years after its opening, and was sold to an investor group in 2007. It became Australia’s first road PPP to fail financially.
ID PRICING LENGTH UPSIDE DOWNSIDE RISK TOLLRATE FREEFLOW MINMAX
CROSCITY 2 1 0 0 3.0 0 0 1
References New South Wales Government. (2008). “Cross City Tunnel: summary of contracts.” Report,
Roads and Traffic Authority, June 30. Phibbs, P. (2008). “Driving alone: Sydney’s Cross City Tunnel.” Built Environment, 33(3),
364-374.

169
Appendix D: Risk Worksheets


Appendix D 171
Project: Route 460 (Virginia, USA) – first procurement Risk Worksheet
Project Attribute
Traffic Risk Index Toll Facility
1 2 3 4 5 Risk
Score Comments
Tolling Culture
Toll roads well estab-lished: data on actual use are available
No toll roads in the country, uncertainty over toll acceptance
4
Few tollroads in region; prospect of toll facilities unpopular with majority of drivers
Toll Facility Details
Estuarial crossings; radial corridors into urban areas
Dense, urban networks; ring roads/beltways around urban areas
1 Radial connector between Richmond and Hampton Roads metropolitan areas
Extension/expansion of existing road
Greenfield site 3 Parallel route to existing road
Stand-alone (single) facility
Reliance on other, proposed highway improvements
1 Contract to include all necessary connections to existing routes
Highly congested corridor
Limited/no congestion 5 Existing parallel facility occasionally congested, e.g. at stoplights
Few competing roads Many alternative routes 5 Free existing parallel route (460); free interstate alternative (I-64)
Users High-income, time-sensitive market
Average/low-income market
4 Average-income users; significant commercial/ freight traffic component
Traffic Growth
Driven by/correlated with existing factors
Reliance on future growth factors, new developments, etc.
4 Facility relies on future growth of Hampton Roads port/freight traffic
Sum of Risk Scores: 27
Average Risk Score: 3.4 High Risk

172 Risk Worksheets
Project: I-595 Express Lanes (Florida, USA) Risk Worksheet
Project Attribute
Traffic Risk Index Toll Facility
1 2 3 4 5 Risk
Score Comments
Tolling Culture
Toll roads well estab-lished: data on actual use are available
No toll roads in the country, uncertainty over toll acceptance
1 Local users/residents accustomed to paying tolls on nearby Florida Turnpike
Toll Facility Details
Estuarial crossings; radial corridors into urban areas
Dense, urban networks; ring roads/beltways around urban areas
1 Radial corridor into Ft. Lauderdale area
Extension/expansion of existing road
Greenfield site 1 Addition of express lanes to existing corridor
Stand-alone (single) facility
Reliance on other, proposed highway improvements
2 Eastward extension to I-95 to be completed later as future/separate project
Highly congested corridor
Limited/no congestion 1 Existing I-595 corridor highly congested
Few competing roads Many alternative routes 1
City-street alternatives are significantly slower; free parallel lanes are heavily congested in peak hours
Users High-income, time-sensitive market
Average/low-income market
2 Many users are urban business commuters
Traffic Growth
Driven by/correlated with existing factors
Reliance on future growth factors, new developments, etc.
1 Strong traffic flow/demand already exists
Sum of Risk Scores: 10
Average Risk Score: 1.3 Low Risk

Appendix D 173
Project: I-495 Capital Beltway HOT Lanes (Virginia, USA) Risk Worksheet
Project Attribute
Traffic Risk Index Toll Facility
1 2 3 4 5 Risk
Score Comments
Tolling Culture
Toll roads well estab-lished: data on actual use are available
No toll roads in the country, uncertainty over toll acceptance
2
Multiple tollroads already in region (e.g. Dulles Tollroad and Greenway), though no previous HOT lanes
Toll Facility Details
Estuarial crossings; radial corridors into urban areas
Dense, urban networks; ring roads/beltways around urban areas
5 Beltway around Washington, DC
Extension/expansion of existing road
Greenfield site 1 Addition of toll lanes to existing corridor
Stand-alone (single) facility
Reliance on other, proposed highway improvements
2 System partially linked to proposed I-95/395 HOT lanes project
Highly congested corridor
Limited/no congestion 1 High congestion
Few competing roads Many alternative routes 1
Few practical alternatives (free lanes on I-495 are prohibitively congested at peak hours)
Users High-income, time-sensitive market
Average/low-income market
1 High-income users
Traffic Growth
Driven by/correlated with existing factors
Reliance on future growth factors, new developments, etc.
1 Strong traffic demand already exists
Sum of Risk Scores: 14
Average Risk Score: 1.8 Low Risk
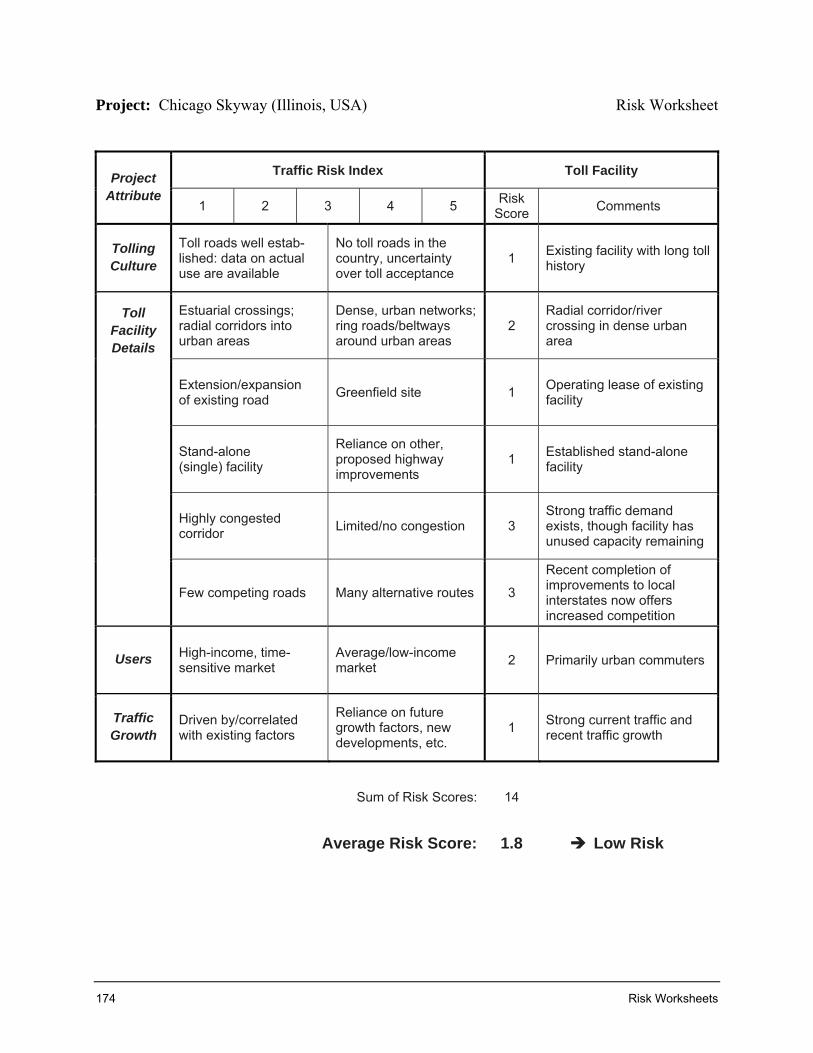
174 Risk Worksheets
Project: Chicago Skyway (Illinois, USA) Risk Worksheet
Project Attribute
Traffic Risk Index Toll Facility
1 2 3 4 5 Risk
Score Comments
Tolling Culture
Toll roads well estab-lished: data on actual use are available
No toll roads in the country, uncertainty over toll acceptance
1 Existing facility with long toll history
Toll Facility Details
Estuarial crossings; radial corridors into urban areas
Dense, urban networks; ring roads/beltways around urban areas
2 Radial corridor/river crossing in dense urban area
Extension/expansion of existing road
Greenfield site 1 Operating lease of existing facility
Stand-alone (single) facility
Reliance on other, proposed highway improvements
1 Established stand-alone facility
Highly congested corridor
Limited/no congestion 3 Strong traffic demand exists, though facility has unused capacity remaining
Few competing roads Many alternative routes 3
Recent completion of improvements to local interstates now offers increased competition
Users High-income, time-sensitive market
Average/low-income market
2 Primarily urban commuters
Traffic Growth
Driven by/correlated with existing factors
Reliance on future growth factors, new developments, etc.
1 Strong current traffic and recent traffic growth
Sum of Risk Scores: 14
Average Risk Score: 1.8 Low Risk

Appendix D 175
Project: SR-91 Express Lanes (California, USA) Risk Worksheet
Project Attribute
Traffic Risk Index Toll Facility
1 2 3 4 5 Risk
Score Comments
Tolling Culture
Toll roads well estab-lished: data on actual use are available
No toll roads in the country, uncertainty over toll acceptance
3
Several other tollroads exist in Orange County, though public opposition existed to adding another toll route
Toll Facility Details
Estuarial crossings; radial corridors into urban areas
Dense, urban networks; ring roads/beltways around urban areas
1 Radial connection between large residential zones and major employment centers
Extension/expansion of existing road
Greenfield site 1 Addition of express lanes in median of existing road
Stand-alone (single) facility
Reliance on other, proposed highway improvements
1 Express lanes effective as stand-alone project
Highly congested corridor
Limited/no congestion 1 Existing SR-91 lanes were highly congested
Few competing roads Many alternative routes 1
Contract included non-compete clause; mountains adjoining roadway also prohibited expansion
Users High-income, time-sensitive market
Average/low-income market
2 Urban/suburban commuters
Traffic Growth
Driven by/correlated with existing factors
Reliance on future growth factors, new developments, etc.
1 Project addressed existing congestion, forecast to become more severe
Sum of Risk Scores: 11
Average Risk Score: 1.4 Low Risk

176 Risk Worksheets
Project: SH-121 Managed Lanes (Texas, USA) Risk Worksheet
Project Attribute
Traffic Risk Index Toll Facility
1 2 3 4 5 Risk
Score Comments
Tolling Culture
Toll roads well estab-lished: data on actual use are available
No toll roads in the country, uncertainty over toll acceptance
1 North Texas Tollway Authority operates several other toll facilities in region
Toll Facility Details
Estuarial crossings; radial corridors into urban areas
Dense, urban networks; ring roads/beltways around urban areas
3 Partially radial, partially circumferential corridor into Dallas/Ft. Worth urban area
Extension/expansion of existing road
Greenfield site 1 Partial upgrade of existing road to freeway standards
Stand-alone (single) facility
Reliance on other, proposed highway improvements
1 Facility connects other major thoroughfares
Highly congested corridor
Limited/no congestion 1 Significant congestion already exists
Few competing roads Many alternative routes 1 Few practical alternatives
Users High-income, time-sensitive market
Average/low-income market
2 Urban/suburban commuters including Dallas/Ft. Worth airport traffic
Traffic Growth
Driven by/correlated with existing factors
Reliance on future growth factors, new developments, etc.
1 Recent strong population growth in region is forecast to continue
Sum of Risk Scores: 11
Average Risk Score: 1.4 Low Risk

Appendix D 177
Project: Warnow Tunnel (Germany) – first procurement Risk Worksheet
Project Attribute
Traffic Risk Index Toll Facility
1 2 3 4 5 Risk
Score Comments
Tolling Culture
Toll roads well estab-lished: data on actual use are available
No toll roads in the country, uncertainty over toll acceptance
5 Facility was Germany’s first modern-day toll road
Toll Facility Details
Estuarial crossings; radial corridors into urban areas
Dense, urban networks; ring roads/beltways around urban areas
3 Crossing of Warnow River, but part of ring road around city of Rostock
Extension/expansion of existing road
Greenfield site 3
No previous fixed crossing, but relevant demand data were available from ferry service at same location
Stand-alone (single) facility
Reliance on other, proposed highway improvements
1 Stand-alone facility
Highly congested corridor
Limited/no congestion 3 Tunnel allowed bypassing congestion in city center
Few competing roads Many alternative routes 5 Anticipated traffic-calming measures on free alternate routes were not installed
Users High-income, time-sensitive market
Average/low-income market
4 Many users did not place high value on time savings
Traffic Growth
Driven by/correlated with existing factors
Reliance on future growth factors, new developments, etc.
3
Commercial traffic forecasts rely on future port growth; regional population is expected to decline
Sum of Risk Scores: 27
Average Risk Score: 3.4 High Risk

178 Risk Worksheets
Project: Warnow Tunnel (Germany) – renegotiated contract Risk Worksheet
Project Attribute
Traffic Risk Index Toll Facility
1 2 3 4 5 Risk
Score Comments
Tolling Culture
Toll roads well estab-lished: data on actual use are available
No toll roads in the country, uncertainty over toll acceptance
1 Actual data on facility’s toll acceptance were available from 2003-06 operations
Toll Facility Details
Estuarial crossings; radial corridors into urban areas
Dense, urban networks; ring roads/beltways around urban areas
3 Crossing of Warnow River, but part of ring road around city of Rostock
Extension/expansion of existing road
Greenfield site 1 Actual usage levels (low) were known from traffic data since 2003 opening
Stand-alone (single) facility
Reliance on other, proposed highway improvements
1 Stand-alone facility
Highly congested corridor
Limited/no congestion 3 Tunnel allowed bypassing congestion in city center
Few competing roads Many alternative routes 5 Anticipated traffic-calming measures on free alternate routes were not installed
Users High-income, time-sensitive market
Average/low-income market
4 Many users did not place high value on time savings
Traffic Growth
Driven by/correlated with existing factors
Reliance on future growth factors, new developments, etc.
3
Commercial traffic forecasts rely on future port growth; regional population is expected to decline
Sum of Risk Scores: 21
Average Risk Score: 2.6 High Risk

Appendix D 179
Project: Herren Tunnel (Germany) Risk Worksheet
Project Attribute
Traffic Risk Index Toll Facility
1 2 3 4 5 Risk
Score Comments
Tolling Culture
Toll roads well estab-lished: data on actual use are available
No toll roads in the country, uncertainty over toll acceptance
4 Tolls for passenger vehicles relatively uncommon in Germany
Toll Facility Details
Estuarial crossings; radial corridors into urban areas
Dense, urban networks; ring roads/beltways around urban areas
1 Crossing of Trave River; radial route into city of Lübeck
Extension/expansion of existing road
Greenfield site 1 Replacement of existing bascule bridge
Stand-alone (single) facility
Reliance on other, proposed highway improvements
1 Stand-alone facility
Highly congested corridor
Limited/no congestion 5
Traffic on existing bridge was ~30,000 vehicles per day little congestion for four-lane tunnel
Few competing roads Many alternative routes 5
Other free river crossings exist; nearby autobahn link was also completed shortly before tunnel opening
Users High-income, time-sensitive market
Average/low-income market
4 Many drivers prefer to avoid toll by spending 10 minutes extra on autobahn alternate
Traffic Growth
Driven by/correlated with existing factors
Reliance on future growth factors, new developments, etc.
3 Little indication of growth consideration in developing tolling scheme
Sum of Risk Scores: 24
Average Risk Score: 3.0 High Risk

180 Risk Worksheets
Project: Skye Bridge (UK) Risk Worksheet
Project Attribute
Traffic Risk Index Toll Facility
1 2 3 4 5 Risk
Score Comments
Tolling Culture
Toll roads well estab-lished: data on actual use are available
No toll roads in the country, uncertainty over toll acceptance
4
Relatively few direct-toll facilities in country, though bridge tolls were set equal to previous ferry charges
Toll Facility Details
Estuarial crossings; radial corridors into urban areas
Dense, urban networks; ring roads/beltways around urban areas
1 Crossing of Loch Alsh between Scottish mainland and Isle of Skye
Extension/expansion of existing road
Greenfield site 3
No previous fixed crossing, but relevant demand data were available from ferry service at same location
Stand-alone (single) facility
Reliance on other, proposed highway improvements
1 Stand-alone facility
Highly congested corridor
Limited/no congestion 3
Before bridge construction, some congestion at ferry terminals during summer peak-travel months
Few competing roads Many alternative routes 1 Facility is sole fixed-link access to Isle of Skye
Users High-income, time-sensitive market
Average/low-income market
3 Combination of locals and (summer) tourists
Traffic Growth
Driven by/correlated with existing factors
Reliance on future growth factors, new developments, etc.
3 Little indication of growth consideration in developing tolling scheme
Sum of Risk Scores: 19
Average Risk Score: 2.4 High Risk

Appendix D 181
Project: Second Tagus Crossing/Vasco da Gama Bridge (Portugal) Risk Worksheet
Project Attribute
Traffic Risk Index Toll Facility
1 2 3 4 5 Risk
Score Comments
Tolling Culture
Toll roads well estab-lished: data on actual use are available
No toll roads in the country, uncertainty over toll acceptance
1 Neighboring “25 April Bridge” already tolled
Toll Facility Details
Estuarial crossings; radial corridors into urban areas
Dense, urban networks; ring roads/beltways around urban areas
1 Crossing of Tagus River in Lisbon
Extension/expansion of existing road
Greenfield site 3 Though at a greenfield site, facility connects points with known demand
Stand-alone (single) facility
Reliance on other, proposed highway improvements
1 Stand-alone facility
Highly congested corridor
Limited/no congestion 1
Severe congestion on neighboring bridge; feasibility planning for third crossing already underway
Few competing roads Many alternative routes 2
Other than also-tolled “25 April Bridge,” next fixed crossing is 40km upriver; ferry service also exists
Users High-income, time-sensitive market
Average/low-income market
2 Urban/suburban commuters
Traffic Growth
Driven by/correlated with existing factors
Reliance on future growth factors, new developments, etc.
2
Usage has grown faster than anticipated, though continued growth depends in part on land development
Sum of Risk Scores: 13
Average Risk Score: 1.6 Low Risk

182 Risk Worksheets
Project: Autopista M-12 / Eje Aeropuerto (Spain) Risk Worksheet
Project Attribute
Traffic Risk Index Toll Facility
1 2 3 4 5 Risk
Score Comments
Tolling Culture
Toll roads well estab-lished: data on actual use are available
No toll roads in the country, uncertainty over toll acceptance
1 Extensive tollroad network established in Spain
Toll Facility Details
Estuarial crossings; radial corridors into urban areas
Dense, urban networks; ring roads/beltways around urban areas
2
Generally radial route in suburban Madrid; provides access to large new airport terminal
Extension/expansion of existing road
Greenfield site 5 New route
Stand-alone (single) facility
Reliance on other, proposed highway improvements
1 Stand-alone facility
Highly congested corridor
Limited/no congestion 5 Facility goal is not to relieve congestion but to provide airport access
Few competing roads Many alternative routes 1 No other road access to new airport terminal
Users High-income, time-sensitive market
Average/low-income market
1 Users are airport travelers
Traffic Growth
Driven by/correlated with existing factors
Reliance on future growth factors, new developments, etc.
1 Airport terminal already open
Sum of Risk Scores: 17
Average Risk Score: 2.1 Low Risk

Appendix D 183
Project: El Melón Tunnel (Chile) Risk Worksheet
Project Attribute
Traffic Risk Index Toll Facility
1 2 3 4 5 Risk
Score Comments
Tolling Culture
Toll roads well estab-lished: data on actual use are available
No toll roads in the country, uncertainty over toll acceptance
1 Tolls have become widely accepted in country since first tollroad in 1963
Toll Facility Details
Estuarial crossings; radial corridors into urban areas
Dense, urban networks; ring roads/beltways around urban areas
1 Tunnel through mountain pass
Extension/expansion of existing road
Greenfield site 1 Parallel construction to existing route
Stand-alone (single) facility
Reliance on other, proposed highway improvements
1 Stand-alone facility
Highly congested corridor
Limited/no congestion 5 Facility’s primary goals are to shorten travel time and improve safety
Few competing roads Many alternative routes 5 Free parallel route over top of mountain
Users High-income, time-sensitive market
Average/low-income market
5
Many users willing to take significantly longer and less safe mountaintop road to avoid high tunnel tolls
Traffic Growth
Driven by/correlated with existing factors
Reliance on future growth factors, new developments, etc.
3 Little indication of growth consideration in developing tolling scheme
Sum of Risk Scores: 22
Average Risk Score: 2.8 High Risk

184 Risk Worksheets
Project: Santiago-Valparaíso-Viña del Mar Toll Road (Chile) Risk Worksheet
Project Attribute
Traffic Risk Index Toll Facility
1 2 3 4 5 Risk
Score Comments
Tolling Culture
Toll roads well estab-lished: data on actual use are available
No toll roads in the country, uncertainty over toll acceptance
1 Tolls have become widely accepted in country since first tollroad in 1963
Toll Facility Details
Estuarial crossings; radial corridors into urban areas
Dense, urban networks; ring roads/beltways around urban areas
1 Major artery between Santiago and the coast
Extension/expansion of existing road
Greenfield site 1
Project comprised major improvements/extensions to existing facilities, along with three new tunnels
Stand-alone (single) facility
Reliance on other, proposed highway improvements
1 Stand-alone facility
Highly congested corridor
Limited/no congestion 1 Further expansions to accommodate traffic growth are already anticipated
Few competing roads Many alternative routes 1 No practical alternatives
Users High-income, time-sensitive market
Average/low-income market
3 Urban and suburban travelers
Traffic Growth
Driven by/correlated with existing factors
Reliance on future growth factors, new developments, etc.
1 Expected strong growth is already materializing
Sum of Risk Scores: 10
Average Risk Score: 1.3 Low Risk

Appendix D 185
Project: 407 Express Toll Route (Canada) – first procurement Risk Worksheet
Project Attribute
Traffic Risk Index Toll Facility
1 2 3 4 5 Risk
Score Comments
Tolling Culture
Toll roads well estab-lished: data on actual use are available
No toll roads in the country, uncertainty over toll acceptance
5 Facility was Ontario’s first toll highway
Toll Facility Details
Estuarial crossings; radial corridors into urban areas
Dense, urban networks; ring roads/beltways around urban areas
5 Primarily circumferential beltway segment around Toronto
Extension/expansion of existing road
Greenfield site 4 Majority of facility was a new alignment
Stand-alone (single) facility
Reliance on other, proposed highway improvements
3 Future highway extensions anticipated at eastern and western termini
Highly congested corridor
Limited/no congestion 1 Parallel Highway 401 (“inner-loop beltway”) was highly congested
Few competing roads Many alternative routes 2 Parallel Highway 401 posed relatively little competition due to high congestion
Users High-income, time-sensitive market
Average/low-income market
2 Urban/suburban commuters
Traffic Growth
Driven by/correlated with existing factors
Reliance on future growth factors, new developments, etc.
1 Demand expectations based on existing growth patterns
Sum of Risk Scores: 23
Average Risk Score: 2.9 High Risk

186 Risk Worksheets
Project: 407 Express Toll Route (Canada) – second procurement Risk Worksheet
Project Attribute
Traffic Risk Index Toll Facility
1 2 3 4 5 Risk
Score Comments
Tolling Culture
Toll roads well estab-lished: data on actual use are available
No toll roads in the country, uncertainty over toll acceptance
1 Actual usage data available for operating lease
Toll Facility Details
Estuarial crossings; radial corridors into urban areas
Dense, urban networks; ring roads/beltways around urban areas
4 Partially radial, partially circumferential beltway segment around Toronto
Extension/expansion of existing road
Greenfield site 1 For operating lease, facility had several years of known traffic-demand history
Stand-alone (single) facility
Reliance on other, proposed highway improvements
2 Second extension anticipated at eastern terminus
Highly congested corridor
Limited/no congestion 1 Strong demand for route (300,000 trips/day in 2008)
Few competing roads Many alternative routes 3
Partially parallel Highways 401 and 403 pose relatively little competition due to congestion and location
Users High-income, time-sensitive market
Average/low-income market
2 Urban/suburban commuters
Traffic Growth
Driven by/correlated with existing factors
Reliance on future growth factors, new developments, etc.
1 Demand expectations based on existing growth patterns
Sum of Risk Scores: 15
Average Risk Score: 1.9 Low Risk

Appendix D 187
Project: Confederation Bridge (Canada) Risk Worksheet
Project Attribute
Traffic Risk Index Toll Facility
1 2 3 4 5 Risk
Score Comments
Tolling Culture
Toll roads well estab-lished: data on actual use are available
No toll roads in the country, uncertainty over toll acceptance
2
Toll charges were direct replacement for ferry fees, so users were accustomed to paying for crossing
Toll Facility Details
Estuarial crossings; radial corridors into urban areas
Dense, urban networks; ring roads/beltways around urban areas
1 Bridge is sole fixed crossing of Northumberland Strait
Extension/expansion of existing road
Greenfield site 3
No previous fixed crossing, but relevant demand data were available from ferry service at same location
Stand-alone (single) facility
Reliance on other, proposed highway improvements
1 Stand-alone facility
Highly congested corridor
Limited/no congestion 5 Minimal congestion, though tourist traffic increases in summer months
Few competing roads Many alternative routes 1
Ferry service provides alternate access to Prince Edward Island, but trip takes 5-6 times longer
Users High-income, time-sensitive market
Average/low-income market
5 Per-capita income on Prince Edward Island is among lowest in Canada
Traffic Growth
Driven by/correlated with existing factors
Reliance on future growth factors, new developments, etc.
1 Demand expectations based on existing growth patterns
Sum of Risk Scores: 19
Average Risk Score: 2.4 High Risk

188 Risk Worksheets
Project: Cross City Tunnel (New South Wales, Australia) Risk Worksheet
Project Attribute
Traffic Risk Index Toll Facility
1 2 3 4 5 Risk
Score Comments
Tolling Culture
Toll roads well estab-lished: data on actual use are available
No toll roads in the country, uncertainty over toll acceptance
1 Neighboring Sydney Harbor Bridge and Tunnel are both pre-existing toll facilities
Toll Facility Details
Estuarial crossings; radial corridors into urban areas
Dense, urban networks; ring roads/beltways around urban areas
5 Tunnel provided direct route under Sydney’s central business district
Extension/expansion of existing road
Greenfield site 2 Existing surface roads approximated tunnel route
Stand-alone (single) facility
Reliance on other, proposed highway improvements
1 Stand-alone facility
Highly congested corridor
Limited/no congestion 3 Some congestion on downtown surface roads
Few competing roads Many alternative routes 5
Surface roads offered alternative to tunnel, due to elimination of promised traffic-calming measures
Users High-income, time-sensitive market
Average/low-income market
3
Many drivers preferred to spend additional time on surface roads rather than pay tunnel toll
Traffic Growth
Driven by/correlated with existing factors
Reliance on future growth factors, new developments, etc.
4
Affluent suburbs at eastern end of tunnel were already developed to capacity and unlikely to grow further
Sum of Risk Scores: 24
Average Risk Score: 3.0 High Risk

189
Appendix E: Software Output


Appendix E 191
Tosmana Source Data

192 Software Output
Tosmana Analysis Options Sample menu for outcome TOLLRATE = 1 See following analysis 1B “TOLLRATE (with remainders)” for results of these selections.
Minimize configuration
for outcome [1]
Include logical remainders in
analysis

Appendix E 193
1A. TOLLRATE (without remainders)
Algorithm: MultiValue TopDown
File: Z:\MEG\Research Pieces\07 Pre-Defense\Cases.tosmana
Settings:
Minimizing Value 1
including:
Data: ID PRICING LENGTH UPSIDE DOWNSIDE RISK TOLLRATE
ROUTE460 2 0 1 0 1 0 I-595 1 1 0 0 0 0 I-495 1 2 1 0 0 0 SKYWAY,407ETR2 2 2 0 0 0 0 SR91 1 1 1 0 0 0 SH121 1 2 1 1 0 1 WARNOW1 0 1 0 0 1 1 WARNOW2 2 2 0 0 1 1 HERREN,CROSCITY 2 1 0 0 1 0 SKYE 0 0 0 1 1 1 LISBON 0 0 0 0 0 1 MADRID 0 1 0 0 0 1 ELMELON 2 1 1 0 1 0 SANTIAGO 2 0 0 1 0 1 407ETR1 1 1 0 0 1 0 CONFED 0 1 0 1 1 1
Results: (all)
PRICING{0} * LENGTH{1} * UPSIDE{0} * RISK{1} +
PRICING{0} * LENGTH{1} * UPSIDE{0} * DOWNSIDE{0} +
PRICING{1} * LENGTH{2} * UPSIDE{1} * DOWNSIDE{1}* RISK{0} +
PRICING{2} * LENGTH{2} * UPSIDE{0} * DOWNSIDE{0}* RISK{1} +
PRICING{0} * LENGTH{0} * UPSIDE{0} * DOWNSIDE{1}* RISK{1} +
PRICING{0} * LENGTH{0} * UPSIDE{0} * DOWNSIDE{0} * RISK{0} +
PRICING{2} * LENGTH{0} * UPSIDE{0} * DOWNSIDE{1}* RISK{0}
(WARNOW1+CONFED)
(WARNOW1+MADRID)
(SH121) (WARNOW2) (SKYE) (LISBON) (SANTIAGO)
Created with Tosmana Version 1.3

194 Software Output
1B. TOLLRATE (with remainders)
Algorithm: Graph-based Agent
File: Z:\MEG\Research Pieces\07 Pre-Defense\Cases.tosmana
Settings:
Minimizing Value 1
including: R
Data: ID PRICING LENGTH UPSIDE DOWNSIDE RISK TOLLRATE
ROUTE460 2 0 1 0 1 0 I-595 1 1 0 0 0 0 I-495 1 2 1 0 0 0 SKYWAY,407ETR2 2 2 0 0 0 0 SR91 1 1 1 0 0 0 SH121 1 2 1 1 0 1 WARNOW1 0 1 0 0 1 1 WARNOW2 2 2 0 0 1 1 HERREN,CROSCITY 2 1 0 0 1 0 SKYE 0 0 0 1 1 1 LISBON 0 0 0 0 0 1 MADRID 0 1 0 0 0 1 ELMELON 2 1 1 0 1 0 SANTIAGO 2 0 0 1 0 1 407ETR1 1 1 0 0 1 0 CONFED 0 1 0 1 1 1
Results: (all)
PRICING{0} + DOWNSIDE{1} + LENGTH{2}RISK{1} (WARNOW1+SKYE+LISBON+MADRID+CONFED) (SH121+SKYE+SANTIAGO+CONFED) (WARNOW2)
Simplifying Assumptions
PRICING{0}LENGTH{0}UPSIDE{0}DOWNSIDE{0}RISK{1} + PRICING{0}LENGTH{0}UPSIDE{0}DOWNSIDE{1}RISK{0} + PRICING{0}LENGTH{0}UPSIDE{1}DOWNSIDE{0}RISK{0} + PRICING{0}LENGTH{0}UPSIDE{1}DOWNSIDE{0}RISK{1} + PRICING{0}LENGTH{0}UPSIDE{1}DOWNSIDE{1}RISK{0} + PRICING{0}LENGTH{0}UPSIDE{1}DOWNSIDE{1}RISK{1} + PRICING{0}LENGTH{1}UPSIDE{0}DOWNSIDE{1}RISK{0} + PRICING{0}LENGTH{1}UPSIDE{1}DOWNSIDE{0}RISK{0} + PRICING{0}LENGTH{1}UPSIDE{1}DOWNSIDE{0}RISK{1} + PRICING{0}LENGTH{1}UPSIDE{1}DOWNSIDE{1}RISK{0} + PRICING{0}LENGTH{1}UPSIDE{1}DOWNSIDE{1}RISK{1} +

Appendix E 195
PRICING{0}LENGTH{2}UPSIDE{0}DOWNSIDE{0}RISK{0} + PRICING{0}LENGTH{2}UPSIDE{0}DOWNSIDE{0}RISK{1} + PRICING{0}LENGTH{2}UPSIDE{0}DOWNSIDE{1}RISK{0} + PRICING{0}LENGTH{2}UPSIDE{0}DOWNSIDE{1}RISK{1} + PRICING{0}LENGTH{2}UPSIDE{1}DOWNSIDE{0}RISK{0} + PRICING{0}LENGTH{2}UPSIDE{1}DOWNSIDE{0}RISK{1} + PRICING{0}LENGTH{2}UPSIDE{1}DOWNSIDE{1}RISK{0} + PRICING{0}LENGTH{2}UPSIDE{1}DOWNSIDE{1}RISK{1} + PRICING{1}LENGTH{0}UPSIDE{0}DOWNSIDE{1}RISK{0} + PRICING{1}LENGTH{0}UPSIDE{0}DOWNSIDE{1}RISK{1} + PRICING{1}LENGTH{0}UPSIDE{1}DOWNSIDE{1}RISK{0} + PRICING{1}LENGTH{0}UPSIDE{1}DOWNSIDE{1}RISK{1} + PRICING{1}LENGTH{1}UPSIDE{0}DOWNSIDE{1}RISK{0} + PRICING{1}LENGTH{1}UPSIDE{0}DOWNSIDE{1}RISK{1} + PRICING{1}LENGTH{1}UPSIDE{1}DOWNSIDE{1}RISK{0} + PRICING{1}LENGTH{1}UPSIDE{1}DOWNSIDE{1}RISK{1} + PRICING{1}LENGTH{2}UPSIDE{0}DOWNSIDE{0}RISK{1} + PRICING{1}LENGTH{2}UPSIDE{0}DOWNSIDE{1}RISK{0} + PRICING{1}LENGTH{2}UPSIDE{0}DOWNSIDE{1}RISK{1} + PRICING{1}LENGTH{2}UPSIDE{1}DOWNSIDE{0}RISK{1} + PRICING{1}LENGTH{2}UPSIDE{1}DOWNSIDE{1}RISK{1} + PRICING{2}LENGTH{0}UPSIDE{0}DOWNSIDE{1}RISK{1} + PRICING{2}LENGTH{0}UPSIDE{1}DOWNSIDE{1}RISK{0} + PRICING{2}LENGTH{0}UPSIDE{1}DOWNSIDE{1}RISK{1} + PRICING{2}LENGTH{1}UPSIDE{0}DOWNSIDE{1}RISK{0} + PRICING{2}LENGTH{1}UPSIDE{0}DOWNSIDE{1}RISK{1} + PRICING{2}LENGTH{1}UPSIDE{1}DOWNSIDE{1}RISK{0} + PRICING{2}LENGTH{1}UPSIDE{1}DOWNSIDE{1}RISK{1} + PRICING{2}LENGTH{2}UPSIDE{0}DOWNSIDE{1}RISK{0} + PRICING{2}LENGTH{2}UPSIDE{0}DOWNSIDE{1}RISK{1} + PRICING{2}LENGTH{2}UPSIDE{1}DOWNSIDE{0}RISK{1} + PRICING{2}LENGTH{2}UPSIDE{1}DOWNSIDE{1}RISK{0} + PRICING{2}LENGTH{2}UPSIDE{1}DOWNSIDE{1}RISK{1} Number of Simplifying Assumptions: 44
Created with Tosmana Version 1.3

196 Software Output
2A. FREEFLOW (without remainders)
Algorithm: MultiValue TopDown
File: Z:\MEG\Research Pieces\07 Pre-Defense\Cases.tosmana
Settings:
Minimizing Value 1
including:
Data: ID PRICING LENGTH UPSIDE DOWNSIDE RISK FREEFLOW
ROUTE460 2 0 1 0 1 0 I-595 1 1 0 0 0 1 I-495 1 2 1 0 0 1 SKYWAY,407ETR2 2 2 0 0 0 0 SR91 1 1 1 0 0 1 SH121 1 2 1 1 0 1 WARNOW1 0 1 0 0 1 0 WARNOW2 2 2 0 0 1 0 HERREN,CROSCITY 2 1 0 0 1 0 SKYE 0 0 0 1 1 0 LISBON 0 0 0 0 0 0 MADRID 0 1 0 0 0 0 ELMELON 2 1 1 0 1 0 SANTIAGO 2 0 0 1 0 0 407ETR1 1 1 0 0 1 1 CONFED 0 1 0 1 1 0
Results: (all)
PRICING{1} * LENGTH{1} * DOWNSIDE{0} * RISK{0} +
PRICING{1} * LENGTH{1} * UPSIDE{0} * DOWNSIDE{0} +
PRICING{1} * LENGTH{2} * UPSIDE{1} * RISK{0}
(I-595+SR91) (I-595+407ETR1) (I-495+SH121)
Created with Tosmana Version 1.3

Appendix E 197
2B. FREEFLOW (with remainders)
Algorithm: Graph-based Agent
File: Z:\MEG\Research Pieces\07 Pre-Defense\Cases.tosmana
Settings:
Minimizing Value 1
including: R
Data: ID PRICING LENGTH UPSIDE DOWNSIDE RISK FREEFLOW
ROUTE460 2 0 1 0 1 0 I-595 1 1 0 0 0 1 I-495 1 2 1 0 0 1 SKYWAY,407ETR2 2 2 0 0 0 0 SR91 1 1 1 0 0 1 SH121 1 2 1 1 0 1 WARNOW1 0 1 0 0 1 0 WARNOW2 2 2 0 0 1 0 HERREN,CROSCITY 2 1 0 0 1 0 SKYE 0 0 0 1 1 0 LISBON 0 0 0 0 0 0 MADRID 0 1 0 0 0 0 ELMELON 2 1 1 0 1 0 SANTIAGO 2 0 0 1 0 0 407ETR1 1 1 0 0 1 1 CONFED 0 1 0 1 1 0
Results: (all)
PRICING{1} (I-595+I-495+SR91+SH121+407ETR1)
Simplifying Assumptions
PRICING{1}LENGTH{0}UPSIDE{0}DOWNSIDE{0}RISK{0} + PRICING{1}LENGTH{0}UPSIDE{0}DOWNSIDE{0}RISK{1} + PRICING{1}LENGTH{0}UPSIDE{0}DOWNSIDE{1}RISK{0} + PRICING{1}LENGTH{0}UPSIDE{0}DOWNSIDE{1}RISK{1} + PRICING{1}LENGTH{0}UPSIDE{1}DOWNSIDE{0}RISK{0} + PRICING{1}LENGTH{0}UPSIDE{1}DOWNSIDE{0}RISK{1} + PRICING{1}LENGTH{0}UPSIDE{1}DOWNSIDE{1}RISK{0} + PRICING{1}LENGTH{0}UPSIDE{1}DOWNSIDE{1}RISK{1} + PRICING{1}LENGTH{1}UPSIDE{0}DOWNSIDE{1}RISK{0} + PRICING{1}LENGTH{1}UPSIDE{0}DOWNSIDE{1}RISK{1} + PRICING{1}LENGTH{1}UPSIDE{1}DOWNSIDE{0}RISK{1} + PRICING{1}LENGTH{1}UPSIDE{1}DOWNSIDE{1}RISK{0} +

198 Software Output
PRICING{1}LENGTH{1}UPSIDE{1}DOWNSIDE{1}RISK{1} + PRICING{1}LENGTH{2}UPSIDE{0}DOWNSIDE{0}RISK{0} + PRICING{1}LENGTH{2}UPSIDE{0}DOWNSIDE{0}RISK{1} + PRICING{1}LENGTH{2}UPSIDE{0}DOWNSIDE{1}RISK{0} + PRICING{1}LENGTH{2}UPSIDE{0}DOWNSIDE{1}RISK{1} + PRICING{1}LENGTH{2}UPSIDE{1}DOWNSIDE{0}RISK{1} + PRICING{1}LENGTH{2}UPSIDE{1}DOWNSIDE{1}RISK{1} Number of Simplifying Assumptions: 19
Created with Tosmana Version 1.3

Appendix E 199
3A. MINMAX (without remainders)
Algorithm: MultiValue TopDown
File: Z:\MEG\Research Pieces\07 Pre-Defense\Cases.tosmana
Settings:
Minimizing Value 1
including:
Data: ID PRICING LENGTH UPSIDE DOWNSIDE RISK MINMAX
ROUTE460 2 0 1 0 1 1 I-595 1 1 0 0 0 0 I-495 1 2 1 0 0 0 SKYWAY,407ETR2 2 2 0 0 0 1 SR91 1 1 1 0 0 0 SH121 1 2 1 1 0 0 WARNOW1 0 1 0 0 1 0 WARNOW2 2 2 0 0 1 1 HERREN,CROSCITY 2 1 0 0 1 1 SKYE 0 0 0 1 1 0 LISBON 0 0 0 0 0 0 MADRID 0 1 0 0 0 0 ELMELON 2 1 1 0 1 1 SANTIAGO 2 0 0 1 0 0 407ETR1 1 1 0 0 1 0 CONFED 0 1 0 1 1 0
Results: (all)
PRICING{2} * LENGTH{2} * UPSIDE{0} * DOWNSIDE{0} +
PRICING{2} * LENGTH{1} * DOWNSIDE{0} * RISK{1} +
PRICING{2} * LENGTH{0} * UPSIDE{1} * DOWNSIDE{0} * RISK{1}
(SKYWAY,407ETR2+WARNOW2) (HERREN,CROSCITY+ELMELON) (ROUTE460)
Created with Tosmana Version 1.3

200 Software Output
3B. MINMAX (with remainders)
Algorithm: Graph-based Agent
File: Z:\MEG\Research Pieces\07 Pre-Defense\Cases.tosmana
Settings:
Minimizing Value 1
including: R
Data: ID PRICING LENGTH UPSIDE DOWNSIDE RISK MINMAX
ROUTE460 2 0 1 0 1 1 I-595 1 1 0 0 0 0 I-495 1 2 1 0 0 0 SKYWAY,407ETR2 2 2 0 0 0 1 SR91 1 1 1 0 0 0 SH121 1 2 1 1 0 0 WARNOW1 0 1 0 0 1 0 WARNOW2 2 2 0 0 1 1 HERREN,CROSCITY 2 1 0 0 1 1 SKYE 0 0 0 1 1 0 LISBON 0 0 0 0 0 0 MADRID 0 1 0 0 0 0 ELMELON 2 1 1 0 1 1 SANTIAGO 2 0 0 1 0 0 407ETR1 1 1 0 0 1 0 CONFED 0 1 0 1 1 0
Results: (all)
PRICING{2}DOWNSIDE{0} (ROUTE460+SKYWAY,407ETR2+WARNOW2+HERREN,CROSCITY+ELMELON)
Simplifying Assumptions
PRICING{2}LENGTH{0}UPSIDE{0}DOWNSIDE{0}RISK{0} + PRICING{2}LENGTH{0}UPSIDE{0}DOWNSIDE{0}RISK{1} + PRICING{2}LENGTH{0}UPSIDE{1}DOWNSIDE{0}RISK{0} + PRICING{2}LENGTH{1}UPSIDE{0}DOWNSIDE{0}RISK{0} + PRICING{2}LENGTH{1}UPSIDE{1}DOWNSIDE{0}RISK{0} + PRICING{2}LENGTH{2}UPSIDE{1}DOWNSIDE{0}RISK{0} + PRICING{2}LENGTH{2}UPSIDE{1}DOWNSIDE{0}RISK{1} Number of Simplifying Assumptions: 7
Created with Tosmana Version 1.3

Appendix E 201
3C. MINMAX (with remainders and manual selection)
Algorithm: Graph-based Agent / File: Z:\MEG\Research Pieces\07 Pre-Defense\Cases.tosmana
Settings:
Minimizing Value 1
including: R
Data: ID PRICING LENGTH UPSIDE DOWNSIDE RISK MINMAX
ROUTE460 2 0 1 0 1 1 I-595 1 1 0 0 0 0 I-495 1 2 1 0 0 0 SKYWAY,407ETR2 2 2 0 0 0 1 SR91 1 1 1 0 0 0 SH121 1 2 1 1 0 0 WARNOW1 0 1 0 0 1 0 WARNOW2 2 2 0 0 1 1 HERREN,CROSCITY 2 1 0 0 1 1 SKYE 0 0 0 1 1 0 LISBON 0 0 0 0 0 0 MADRID 0 1 0 0 0 0 ELMELON 2 1 1 0 1 1 SANTIAGO 2 0 0 1 0 0 407ETR1 1 1 0 0 1 0 CONFED 0 1 0 1 1 0
Results: (individual selection - not minimized by Tosmana)
PRICING{2}LENGTH{1,2}+ PRICING{2}RISK{1} (SKYWAY,407ETR2+WARNOW2+HERREN,CROSCITY+ELMELON)
(ROUTE460+WARNOW2+HERREN,CROSCITY+ELMELON)
Simplifying Assumptions: Created with Tosmana Version 1.3
PRICING{2}LENGTH{0}UPSIDE{0}DOWNSIDE{0}RISK{1} + PRICING{2}LENGTH{0}UPSIDE{0}DOWNSIDE{1}RISK{1} + PRICING{2}LENGTH{0}UPSIDE{1}DOWNSIDE{1}RISK{1} + PRICING{2}LENGTH{1}UPSIDE{0}DOWNSIDE{0}RISK{0} + PRICING{2}LENGTH{1}UPSIDE{0}DOWNSIDE{1}RISK{0} + PRICING{2}LENGTH{1}UPSIDE{0}DOWNSIDE{1}RISK{1} + PRICING{2}LENGTH{1}UPSIDE{1}DOWNSIDE{0}RISK{0} + PRICING{2}LENGTH{1}UPSIDE{1}DOWNSIDE{1}RISK{0} + PRICING{2}LENGTH{1}UPSIDE{1}DOWNSIDE{1}RISK{1} + PRICING{2}LENGTH{2}UPSIDE{0}DOWNSIDE{1}RISK{1} + PRICING{2}LENGTH{2}UPSIDE{1}DOWNSIDE{0}RISK{1} + PRICING{2}LENGTH{2}UPSIDE{1}DOWNSIDE{1}RISK{1} Number of Simplifying Assumptions: 12