Embed Size (px)
Citation preview
ARTICLE
Aliphatic chain length by isotropic mixing (ALCHIM):determining composition of complex lipid samplesby 1H NMR spectroscopy
Joseph R. Sachleben • Ruiyang Yi • Paul A. Volden •
Suzanne D. Conzen
Received: 24 February 2014 / Accepted: 2 May 2014 / Published online: 15 May 2014
� Springer Science+Business Media Dordrecht 2014
Abstract Quantifying the amounts and types of lipids
present in mixtures is important in fields as diverse as
medicine, food science, and biochemistry. Nuclear mag-
netic resonance (NMR) spectroscopy can quantify the total
amounts of saturated and unsaturated fatty acids in mix-
tures, but identifying the length of saturated fatty acid or
the position of unsaturation by NMR is a daunting chal-
lenge. We have developed an NMR technique, aliphatic
chain length by isotropic mixing, to address this problem.
Using a selective total correlation spectroscopy technique
to excite and transfer magnetization from a resolved reso-
nance, we demonstrate that the time dependence of this
transfer to another resolved site depends linearly on the
number of aliphatic carbons separating the two sites. This
technique is applied to complex natural mixtures allowing
the identification and quantification of the constituent fatty
acids. The method has been applied to whole adipocytes
demonstrating that it will be of great use in studies of
whole tissues.
Keywords Fats � Lipids � Metabolomics � Lipidomics �Food science � NMR � TOCSY
Introduction
Understanding the composition of mixtures of lipids is
important in diverse areas of research including medicine,
food science, and biochemistry. Lipidomics is a growing
area of interest in the biomedical community as lipid
misregulation has multiple roles in human disease. For
instance, the relationship between atherosclerosis and die-
tary lipids stems from observations made by Rudolph
Virchow in the nineteenth century, and remains central in
the study of atherogenesis today (Watson 2006; Merched
and Chan 2013; Rasmiena et al. 2013; Didangelos et al.
2012; Kontush and Chapman 2010; Camont et al. 2013).
Dietary lipids, lipid metabolism, and cellular lipid com-
position also play obvious and direct roles in the patho-
genesis of the cluster of disorders that include obesity, type
2 diabetes, and the dysmetabolic syndrome (Gonzalez-
Covarrubias 2013; Boslem et al. 2013; Kien et al. 2013;
Stahlman et al. 2012; Meikle and Christopher 2011; Gross
and Han 2007; Kwan et al. 2013). Importantly, all of these
roles are heavily influenced by lipid composition, in par-
ticular the length of lipid chains and their degree of satu-
ration. Interestingly, some cancer cells, which
characteristically undergo high rates of cell division,
scavenge lipids of specific length and saturation for struc-
tural roles, but also to aid in survival during hypoxia
(Kamphorst et al. 2013). Many lipids have important
endocrine roles that depend on structural aspects, including
length and degree of saturation. For example, polyunsatu-
rated fatty acids (PUFAs) are precursors for the hormone-
like eicosanoids including prostaglandins, leucotrienes, and
thromboxanes (O’Donnell et al. 2009). Furthermore, satu-
rated fatty acids have been associated with insulin resis-
tance, whereas PUFAs have been associated with increased
insulin sensitivity (Fedor and Kelley 2009; Riccardi et al.
Electronic supplementary material The online version of thisarticle (doi:10.1007/s10858-014-9836-0) contains supplementarymaterial, which is available to authorized users.
J. R. Sachleben (&) � R. Yi
Biomolecular NMR Core Facility, Biological Sciences Division,
The University of Chicago, Chicago, IL 60637, USA
e-mail: [email protected]
P. A. Volden � S. D. Conzen
Department of Medicine, The University of Chicago, Chicago,
IL 60637, USA
123
J Biomol NMR (2014) 59:161–173
DOI 10.1007/s10858-014-9836-0
2004). The ratio of dietary and adipose tissue x-3/x-6 fatty
acids has been associated with poor outcomes in breast
cancer (Simonsen et al. 1998; Thiebaut et al. 2009).
Because of all these relationships between the type of fatty
acid and health, food scientists have long studied the fatty
acid composition of foods. These studies have ranged from
the common [cow milk (Casado et al. 2009)] to the exotic
[recent analyses of camel (Sbihi et al. 2013) and goat
(Longobardi et al. 2012) meat] as well as the oxidation of
edible oils upon heating (Guillen and Ruiz 2001).
Standard lipidomic analyses utilize powerful mass
spectrometric (MS) techniques, which usually require
covalent modification of lipids, such as esterification. For
example, in the standard AOAC method (969.33 and
963.22 F) for the analysis of glycerides and phospholipids,
glycerolipids are first saponified in methanolic NaOH
solution and then methyl esterified in the presence of BF3.
Gas chromatography (GC) analyzes the resulting methyl
esters. This method is limited by interference if large
fractions of unhydrolyzable compounds are present and due
to chemical alteration of modified fats, such as aldehydes,
ketones, and conjugated polyunsaturated materials (AOAC
1995). These methods, though clearly instrumental in
providing data on lipid composition, have shortcomings,
the most apparent being that they cannot be used on sam-
ples in intact tissues or cells. Another complication of MS-
based techniques is that time courses can be followed only
in parallel samples, which are prone to usual biological
variability.
An NMR-based technique will complement MS-based
techniques, and allow application of lipidomics to intact
cells and tissues. Furthermore, this will facilitate following
a single cell type or tissue over a time course. In addition,
H NMR avoids the above-mentioned complications by
allowing analysis with little chemical modification, typi-
cally extraction and dissolution in deuterated chloroform.
In this paper, we present a new NMR-based lipidomic
technique, aliphatic chain length by isotropic mixing
(ALCHIM), to address these problems.
Previously, it has been shown that simple 1D 1H NMR
spectra can provide information on the relative quantities
of saturated and unsaturated fatty acids, average molecular
mass, the average number of double bonds, the presence of
modified fats, and some acyl group identification (Guillen
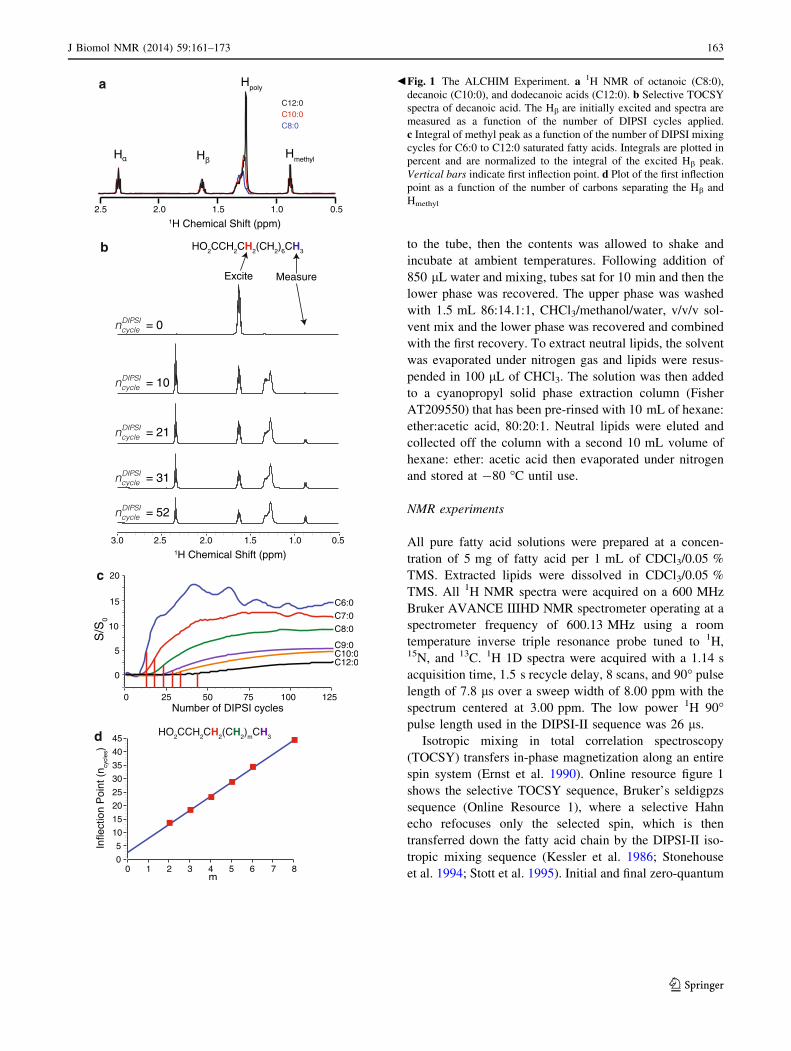
and Ruiz 2001). Figure 1a shows the 1H 1D spectra of
three saturated fatty acids. The spectra are very similar
with only the shape of the polymethylene peak at 1.3 ppm
changing in the different fatty acids. Relative integrals can
identify pure saturated fatty acids, but such an approach
will fail in mixtures. Similar overlap occurs in unsaturated
and modified fatty acids of differing lengths.
New methods need to be developed to simply and
accurately characterize these important samples. We
present a method based on the TOCSY experiment
(Braunschweiler and Ernst 1983), which correlates all
members of the spin system by an isotropic mixing period
(Rule and Hitchens 2006). Van and Shaka (1998) have
measured the selective TOCSY spectrum in 1-dodecanol
demonstrating that transfer down long aliphatic chains is
possible. While a 2D-TOCSY spectrum as typically
applied is not very useful on lipid samples as the assign-
ment is already established, the mixing period dependence
of the magnetization transfer among the resolved peaks in
lipids will measure the number of carbons separating those
sites. As we will show below, ALCHIM uses the isotropic
mixing time dependence of magnetization transfer to allow
the identification of saturated fatty acids and the position of
modification in unsaturated and other modified fatty acids.
In addition, it permits the quantification of mixtures of fatty
acids. We show applications to biological and biomedical
samples.
Materials and methods
Sample preparation
Pure fatty acids samples were purchased from Sigma-
Aldrich and used without further purification. Analytical
standard coconut oil and fatty acid methyl ester reference
mixture 2 (FAME-RM2) were supplied by Supelco (Lot
No: LB89794V and LC02665, respectively) Certificates of
analysis are provided in Online Resource 1.
Samples from mouse adipose tissue were prepared by
the following method. Gonadal adipose tissue was har-
vested from 16 week old female CD-1 mice. Upon harvest,
adipose tissue was placed into a microcentrifuge tube
containing DMEM high glucose media with 1 % pen/strep.
The tissue was then finely minced, spun at 100g for 30 s,
and the floating layer enriched in adipocytes was then
transferred to a new pre-weighed tube. 3 mL of DMEM
high, 1 % P/S media with 2 mg/mL collagenase type I
(Worthington Biochemical) media was added, per gram
adipose tissue, to the new tube. The collagenase digestion
continued for 30 min, shaking at 37 �C. The tube was then
spun at 100g for 1 min and the floating adipocytes were
filtered through a 350 lm nylon mesh. The remaining
media was removed from beneath adipocytes with a needle
and syringe. As described below, either intact adipocytes
were used or lipids were extracted from adipocytes for
NMR studies.
Lipids were extracted from the adipocytes using the
Folch method. Briefly, 1 mL of methanol was added to
100 lL of adipocytes. The adipocytes were then sonicated
for 10 s at 6 W. The entire volume was transferred to a
Pyrex tube with Teflon cap, 2 mL of chloroform was added
162 J Biomol NMR (2014) 59:161–173
123
to the tube, then the contents was allowed to shake and
incubate at ambient temperatures. Following addition of
850 lL water and mixing, tubes sat for 10 min and then the
lower phase was recovered. The upper phase was washed
with 1.5 mL 86:14.1:1, CHCl3/methanol/water, v/v/v sol-
vent mix and the lower phase was recovered and combined
with the first recovery. To extract neutral lipids, the solvent
was evaporated under nitrogen gas and lipids were resus-
pended in 100 lL of CHCl3. The solution was then added
to a cyanopropyl solid phase extraction column (Fisher
AT209550) that has been pre-rinsed with 10 mL of hexane:
ether:acetic acid, 80:20:1. Neutral lipids were eluted and
collected off the column with a second 10 mL volume of
hexane: ether: acetic acid then evaporated under nitrogen
and stored at -80 �C until use.
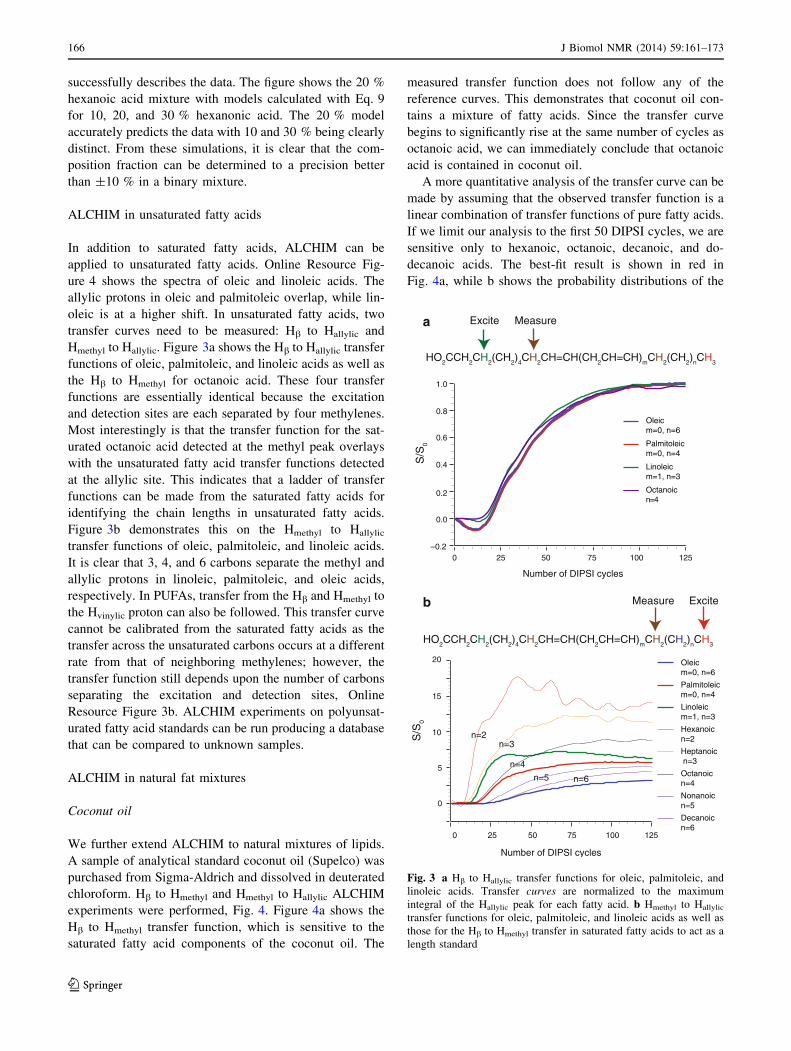
NMR experiments
All pure fatty acid solutions were prepared at a concen-
tration of 5 mg of fatty acid per 1 mL of CDCl3/0.05 %
TMS. Extracted lipids were dissolved in CDCl3/0.05 %
TMS. All 1H NMR spectra were acquired on a 600 MHz
Bruker AVANCE IIIHD NMR spectrometer operating at a
spectrometer frequency of 600.13 MHz using a room
temperature inverse triple resonance probe tuned to 1H,15N, and 13C. 1H 1D spectra were acquired with a 1.14 s
acquisition time, 1.5 s recycle delay, 8 scans, and 90� pulse
length of 7.8 ls over a sweep width of 8.00 ppm with the
spectrum centered at 3.00 ppm. The low power 1H 90�pulse length used in the DIPSI-II sequence was 26 ls.
Isotropic mixing in total correlation spectroscopy
(TOCSY) transfers in-phase magnetization along an entire
spin system (Ernst et al. 1990). Online resource figure 1
shows the selective TOCSY sequence, Bruker’s seldigpzs
sequence (Online Resource 1), where a selective Hahn
echo refocuses only the selected spin, which is then
transferred down the fatty acid chain by the DIPSI-II iso-
tropic mixing sequence (Kessler et al. 1986; Stonehouse
et al. 1994; Stott et al. 1995). Initial and final zero-quantum
a
b
c
d
b Fig. 1 The ALCHIM Experiment. a 1H NMR of octanoic (C8:0),
decanoic (C10:0), and dodecanoic acids (C12:0). b Selective TOCSY
spectra of decanoic acid. The Hb are initially excited and spectra are
measured as a function of the number of DIPSI cycles applied.
c Integral of methyl peak as a function of the number of DIPSI mixing
cycles for C6:0 to C12:0 saturated fatty acids. Integrals are plotted in
percent and are normalized to the integral of the excited Hb peak.
Vertical bars indicate first inflection point. d Plot of the first inflection
point as a function of the number of carbons separating the Hb and
Hmethyl
J Biomol NMR (2014) 59:161–173 163
123
coherence is suppressed with simultaneous gradient and
adiabatic 180� pulse (Thrippleton and Keeler 2003). A
variable loop counter is used around the fixed period of the
DIPSI sequence to make it a pseudo 2D experiment where
the number of DIPSI cycles applied during the mixing time
is varied. A typical DIPSI cycle was 2.993 ms. An AL-
CHIM transfer function is the DIPSI cycle dependence,
ncycle, of the integral of the detected resonance. This is
typically normalized to the integral of the excited peak
after a single DIPSI cycle, for which little magnetization
transfer has occurred.
Theoretical calculation
ALCHIM transfer curves in fatty acids can be modeled as a
chain of N spin � nuclei coupled only to their nearest
neighbors where the first spin of the chain is excited while
the last is detected. During the mixing period, the flip-flop
terms of the isotropic Hamiltonian relay the magnetization
down the spin chain until it arrives at the detection site. The
isotropic Hamiltonian for such a system is
H ¼ 2pJXN�1
i¼1
I!
i � I!
iþ1; ð1Þ
while the initial density matrix is
qð0Þ ¼ IZ;1 ð2Þ
and the observable is
O ¼ IZ;N : ð3Þ
In this model, the first spin is excited, the magnetization
is transferred along the chain and only the magnetization
on the last spin is detected. The signal on the detected spin
as a function of ncycle, i.e. the transfer function, is given by
S ncycle
� �¼ Tr Oe�iHncycletcycleq 0ð ÞeiHncycletcycle
� �
¼ Tr IZ;Ne�iHncycletcycle IZ;1eiHncycletcycle� �
¼ a0 þXNmax
i¼1
ai cos pncyclemitcycle
� �ð4Þ
where tcycle is the period of a single ideal isotropic mixing
sequence cycle, and the mi are proportional to the J-cou-
plings between the neighboring spins but they are typically
not rational multiples of J in large systems. Calculations for
linear chains of 2–7 spins are shown in the online resources
and demonstrate that the transfer time across the chain
increases linearly with the number of spins separating the
excited and detected sites. (Online Resource 1 and 2) This
suggests that we can use the transfer dynamics under iso-
tropic mixing as a ruler of fat length. In addition, after a
long period of isotropic mixing, a quasi-equilibrium state is
expected which is given by
qQE ¼1
N
XN
i¼1
IZ;i ¼1
NITotZ ; ð5Þ
i.e., the magnetization will be evenly distributed among all
the protons of the lipid. The simulations show this effect,
(Online Resource 2) which limits the sensitivity of this
method in long chain, saturated fatty acids.
Data analysis
ALCHIM spectra were integrated in the Bruker Topspin
software with careful baseline correction around each peak
multiplet. The Topspin T1/T2 module then extracted the
integrals as a function of ncycle from the pseudo 2D dataset.
Transfer functions of mixtures were modeled as a linear
combination of constituent transfer functions,
Smodel ncycle
� �¼
Xncomponents
i¼1
fiSi ncycle
� �: ð6Þ
The number of fatty acid components in the mixture is
ncomponents while their fraction is fi. Si’s are the measured
transfer functions of pure substances. A subset of compo-
nents can be modeled as long as the number of DIPSI
cycles is limited to less than the number necessary for
longer components to contribute to the transfer function.
Fatty acid fractions were extracted by calculating the
posterior probability function (Sachleben 2006; Sivia 1996;
Gelman et al. 2004) that the modeled fractions describe the
measured transfer function up to the maximum number of
DIPSI cycles used. The posterior probability function, P, is
given by
P ¼ N
rnmaxcycleþ2
e�1
2r2v2
; ð7Þ
where
v2 ¼Xn
maxcycle
n¼1
Sexp nð Þ � Smodel nð Þ� �2
; ð8Þ
r is the rms noise on the measured transfer curve which
was treated as an additional parameter in the posterior
probability, and N is a normalization constant that ensures
that the total probability sums to 1. P was calculated on a
multidimensional grid depending upon the number of
parameters being determined. Typically a large mesh grid
over a fairly large range of fractions is initially searched
and then refined to find the allowed range of parameters.
The largest calculation performed was the final determi-
nation of the saturated fatty acids in coconut oil. In that
case, the posterior probability was calculated on a 5
dimensional grid consisting of 314 points of the fractions of
hexanoic, octanoic, decanoic, and dodecanoic acids, and 15
points on the noise. This was projected onto each of the
164 J Biomol NMR (2014) 59:161–173
123
fraction axes for analysis and display. Notebooks written
for Mathematica 9 and run on a MacBook Pro performed
all calculations. More details of the Bayesian analysis of
the data and an example Mathematica Notebook is pro-
vided in the online resources (Online Resources 2).
Results
ALCHIM in saturated fatty acids
Figure 1b shows DIPSI cycle dependence of the transfer of
magnetization along the fatty acid chain in decanoic acid
(C10:0) after excitation of the Hb. Integrals of the Ha, Hb,
HPM, and Hmethyl are shown in Online Resources Figure 3.
Initially, magnetization is transferred to the neighboring Ha
and polymethylenes after only a couple of DIPSI cycles. The
transfer between the Ha and Hb shows a damped oscillatory
behavior because of the transfer between the neighboring
protons and the loss of magnetization from this system as the
magnetization is transferred into the polymethylenes. The
oscillations in the integrals of Ha and Hb are anticorrelated: as
magnetization is gained by Ha it is lost by Hb and vice versa.
There is a significant lag in transfer to the terminal CH3. Little
magnetization has arrived at the CH3 after 10 DIPSI cycles,
but the peak is clearly visible after 21, Fig. 1b. Figure 1c
shows the transfer curves of the series of saturated fatty acids
from 6 to 12 carbons long. It is immediately obvious that the
number of DIPSI cycles for magnetization transfer increases
while the amount of magnetization transferred decreases as
the length of the fatty acid chain grows. Figure 1d shows the
first inflection point of the transfer curves in Fig. 1c as a
function of the number of carbons separating the b and methyl
protons. The first inflection point occurs when the rate of
magnetization transfer to the detected location is maximal and
provides a well-defined metric for quantifying transfer via
isotropic mixing in a many-spin system, as opposed to the time
for maximum transfer, which depends on the rate of magne-
tization transfer into and out of the detected site. Qualitatively,
the first inflection point is expected to depend linearly on
mixing time in these systems as each methylene has the same
pattern of J-couplings responsible for magnetization transfer.
The transfer through n methylenes requires n steps of transfer
mediated by the same pattern of J-couplings. This linear
relationship is borne out in both the theoretical calculations
and the experiments on saturated fatty acid. From this, we can
conclude that the ALCHIM experiment provides a convenient
ruler of fatty acid length.
ALCHIM in mixtures of saturated fatty acids
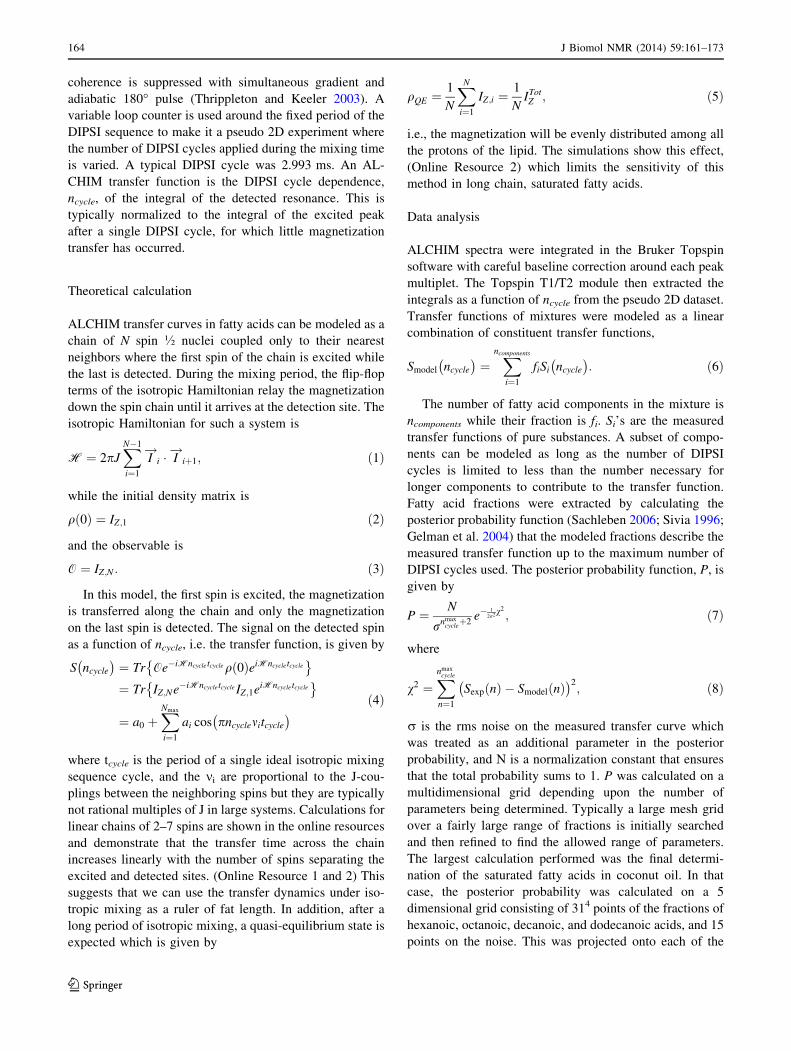
Figure 2a shows the Hb to Hmethyl transfer function for
mixtures of hexanoic and octanoic acid from 0 to 100 %
hexanoic acid. All the transfer functions for mixtures that
contain hexanoic acid begin to increase after 10 DIPSI
cycles while the pure octanoic requires 18. The intensity of
the methyl peak between 10 and 18 cycles depends only on
the presence of hexanoic acid. Beyond 18 cycles, octanoic
acid begins to contribute. In addition, as the fraction of
octanoic acid increases the limiting transfer decreases
towards that of octanoic acid. These results suggest that the
resulting transfer functions are linear combination of those
for the pure substances; i.e.,
Sðn % hexanoicÞ ¼ n
100Sð100 % hexaniocÞ
þ 1� n
100
� �Sð100 % octanoicÞ: ð9Þ
This modeling uses the experimentally determined
transfer functions for the pure components with the only
variable parameter being the fraction of hexanoic acid in
the mixture. Figure 2b demonstrates that this model
Mixtures of Hexanoicand Octanoic Acid
0
0 25 50 75 100
5
10
15
20
Number DIPSI Cycles125
0% Hex
20.0% Hex
43.0% Hex
63.8% Hex
85.8% Hex
100% Hex
S/S
0
0.0
0 25 50 75 100
5.0
10.0
Number DIPSI Cycles125
20.0% Hex
Model 10%
Model 20%
Model 30%
S/S
0
2.5
7.5
12.5
–2.5
a
b
Fig. 2 a Hb to Hmethyl transfer functions of mixtures of hexanoic and
octanoic acid. b Transfer function for the 20 % hexanoic 80 %
octanoic acid mixture as well as modeled transfer functions assuming
10, 20, and 30 % hexanoic acid
J Biomol NMR (2014) 59:161–173 165
123
successfully describes the data. The figure shows the 20 %
hexanoic acid mixture with models calculated with Eq. 9
for 10, 20, and 30 % hexanonic acid. The 20 % model
accurately predicts the data with 10 and 30 % being clearly
distinct. From these simulations, it is clear that the com-
position fraction can be determined to a precision better
than ±10 % in a binary mixture.
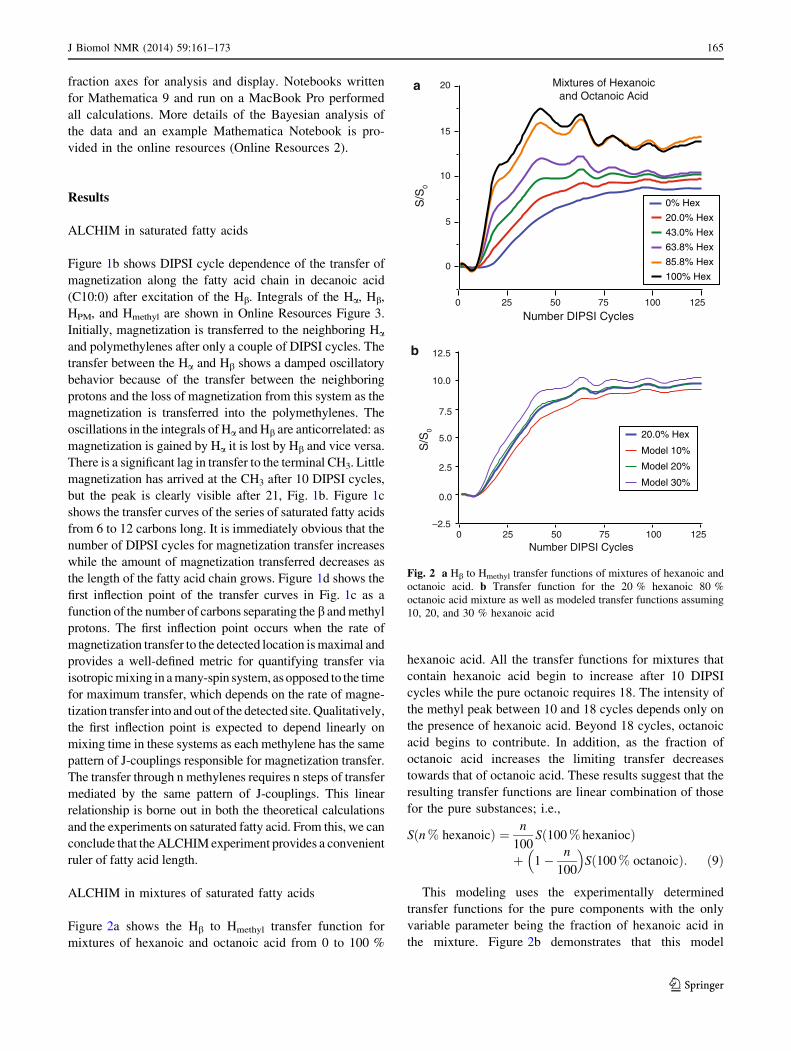
ALCHIM in unsaturated fatty acids
In addition to saturated fatty acids, ALCHIM can be
applied to unsaturated fatty acids. Online Resource Fig-
ure 4 shows the spectra of oleic and linoleic acids. The
allylic protons in oleic and palmitoleic overlap, while lin-
oleic is at a higher shift. In unsaturated fatty acids, two
transfer curves need to be measured: Hb to Hallylic and
Hmethyl to Hallylic. Figure 3a shows the Hb to Hallylic transfer
functions of oleic, palmitoleic, and linoleic acids as well as
the Hb to Hmethyl for octanoic acid. These four transfer
functions are essentially identical because the excitation
and detection sites are each separated by four methylenes.
Most interestingly is that the transfer function for the sat-
urated octanoic acid detected at the methyl peak overlays
with the unsaturated fatty acid transfer functions detected
at the allylic site. This indicates that a ladder of transfer
functions can be made from the saturated fatty acids for
identifying the chain lengths in unsaturated fatty acids.
Figure 3b demonstrates this on the Hmethyl to Hallylic
transfer functions of oleic, palmitoleic, and linoleic acids.
It is clear that 3, 4, and 6 carbons separate the methyl and
allylic protons in linoleic, palmitoleic, and oleic acids,
respectively. In PUFAs, transfer from the Hb and Hmethyl to
the Hvinylic proton can also be followed. This transfer curve
cannot be calibrated from the saturated fatty acids as the
transfer across the unsaturated carbons occurs at a different
rate from that of neighboring methylenes; however, the
transfer function still depends upon the number of carbons
separating the excitation and detection sites, Online
Resource Figure 3b. ALCHIM experiments on polyunsat-
urated fatty acid standards can be run producing a database
that can be compared to unknown samples.
ALCHIM in natural fat mixtures
Coconut oil
We further extend ALCHIM to natural mixtures of lipids.
A sample of analytical standard coconut oil (Supelco) was
purchased from Sigma-Aldrich and dissolved in deuterated
chloroform. Hb to Hmethyl and Hmethyl to Hallylic ALCHIM
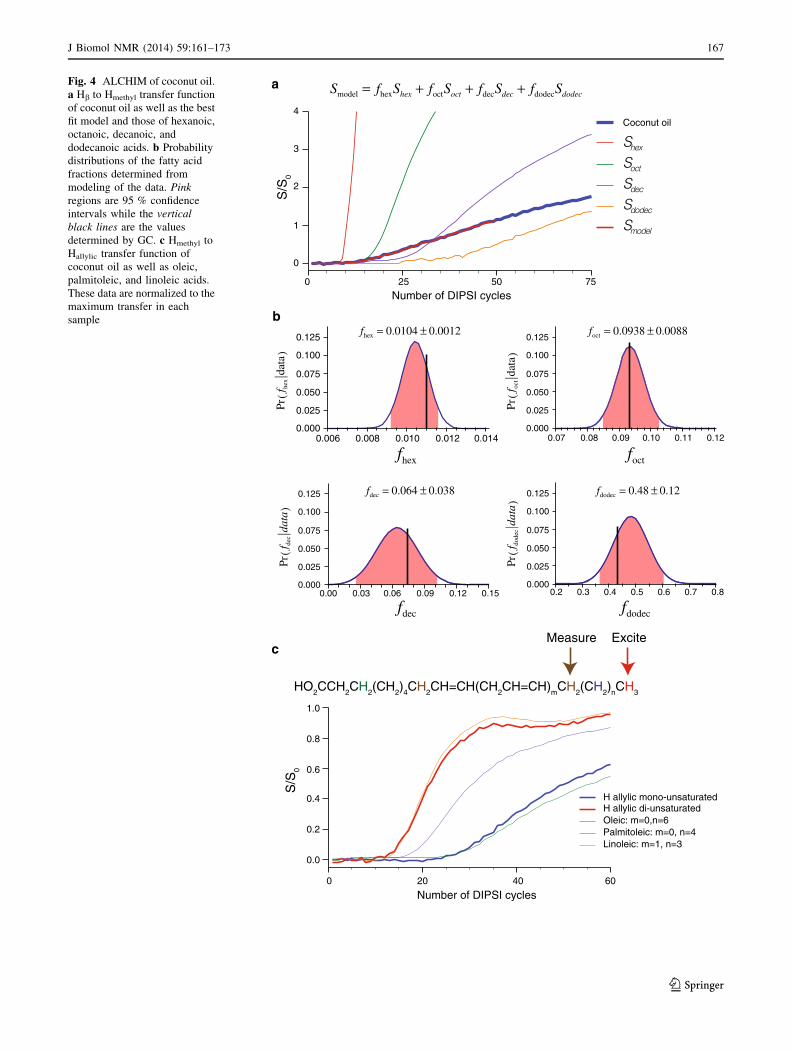
experiments were performed, Fig. 4. Figure 4a shows the
Hb to Hmethyl transfer function, which is sensitive to the
saturated fatty acid components of the coconut oil. The
measured transfer function does not follow any of the
reference curves. This demonstrates that coconut oil con-
tains a mixture of fatty acids. Since the transfer curve
begins to significantly rise at the same number of cycles as
octanoic acid, we can immediately conclude that octanoic
acid is contained in coconut oil.
A more quantitative analysis of the transfer curve can be
made by assuming that the observed transfer function is a
linear combination of transfer functions of pure fatty acids.
If we limit our analysis to the first 50 DIPSI cycles, we are
sensitive only to hexanoic, octanoic, decanoic, and do-
decanoic acids. The best-fit result is shown in red in
Fig. 4a, while b shows the probability distributions of the
HO2CCH2CH2(CH2)4CH2CH=CH(CH2CH=CH)mCH2(CH2)nCH3
Excite Measurea
b
1.0
0.8
0.6
0.4
0.2
0.0
–0.20 25 50 75 100 125
S/S
0
Number of DIPSI cycles
Oleicm=0, n=6
Palmitoleicm=0, n=4
Linoleicm=1, n=3
Octanoicn=4
20
15
10
5
0
S/S
0
Number of DIPSI cycles
0 25 50 75 100 125
HO2CCH2CH2(CH2)4CH2CH=CH(CH2CH=CH)mCH2(CH2)nCH3
ExciteMeasure
n=2n=3
n=4
n=5 n=6
Oleicm=0, n=6
Palmitoleicm=0, n=4
Linoleic m=1, n=3
Hexanoicn=2
Heptanoic n=3
Octanoicn=4
Nonanoicn=5
Decanoicn=6
Fig. 3 a Hb to Hallylic transfer functions for oleic, palmitoleic, and
linoleic acids. Transfer curves are normalized to the maximum
integral of the Hallylic peak for each fatty acid. b Hmethyl to Hallylic
transfer functions for oleic, palmitoleic, and linoleic acids as well as
those for the Hb to Hmethyl transfer in saturated fatty acids to act as a
length standard
166 J Biomol NMR (2014) 59:161–173
123
a
b
c
Fig. 4 ALCHIM of coconut oil.
a Hb to Hmethyl transfer function
of coconut oil as well as the best
fit model and those of hexanoic,
octanoic, decanoic, and
dodecanoic acids. b Probability
distributions of the fatty acid
fractions determined from
modeling of the data. Pink
regions are 95 % confidence
intervals while the vertical
black lines are the values
determined by GC. c Hmethyl to
Hallylic transfer function of
coconut oil as well as oleic,
palmitoleic, and linoleic acids.
These data are normalized to the
maximum transfer in each
sample
J Biomol NMR (2014) 59:161–173 167
123
four fractions given the data. The shaded pink regions give
the 95 % confidence intervals of fractions: 1.04 ± 0.12,
9.38 ± 0.88, 6.4 ± 3.8, and 48 ± 12 % for hexanoic,
octanoic, decanoic, and dodecanoic acids, respectively.
The values for the fractions determined by GC and sup-
plied by Supelco upon purchase (Online Resource) were
1.1, 9.3, 6.7, and 43.5 %. Thus, this method managed to
accurately determine the fractions of the first 4 saturated
fatty acids in this complex natural mixture.
The allylic peaks of the mixture were also analyzed after
Hmethyl excitation. As the allylic peaks from mono- and di-
unsaturated fats are resolved in the 1D 1H spectra (Online
Resource), they can be monitored separately in the AL-
CHIM experiment. Figure 4c shows the transfer curves to
the allylic protons for both mono- and di-unsaturated fatty
acids. The transfer to Hallylic monounsaturated overlays
with that from oleic acid while the di-unsaturated overlays
with linoleic acid. This immediately identifies the mono-
unsaturated fat in coconut oil as x-9 while the di-unsatu-
rated fat is x-6. By exciting at Hb and monitoring the two
allylic peaks, it can be shown that the unsaturated fats are
both D-9 fatty acids positively identifying them as linoleic
and oleic acids.
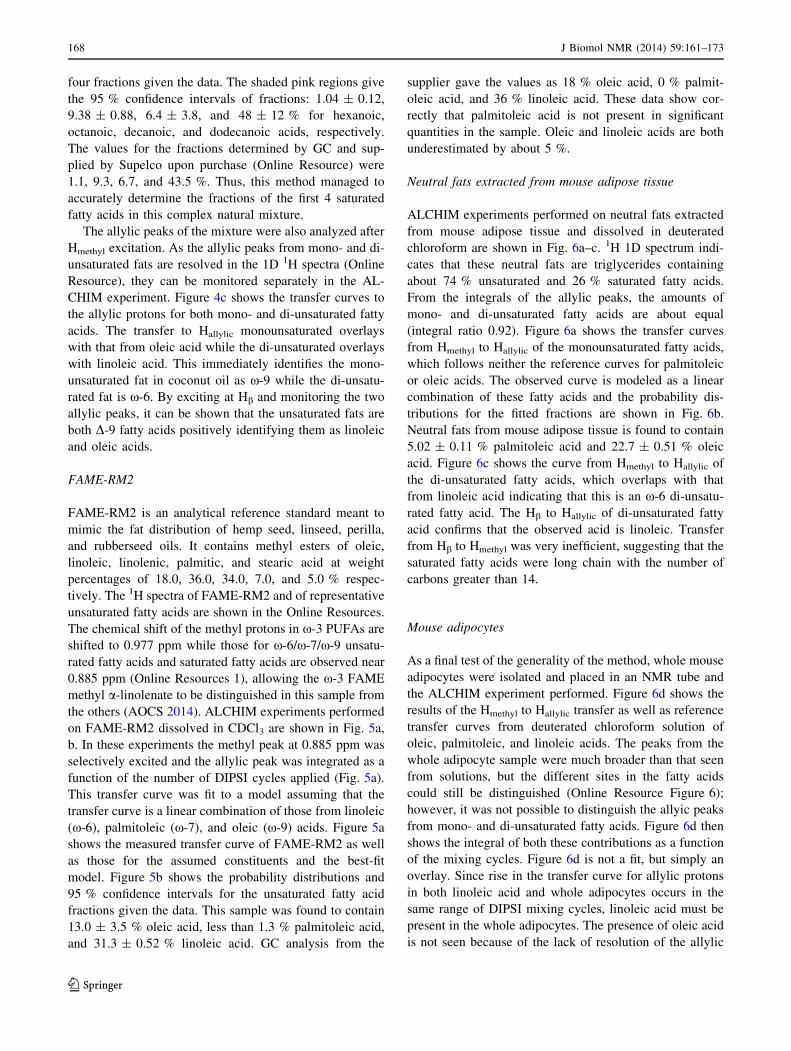
FAME-RM2
FAME-RM2 is an analytical reference standard meant to
mimic the fat distribution of hemp seed, linseed, perilla,
and rubberseed oils. It contains methyl esters of oleic,
linoleic, linolenic, palmitic, and stearic acid at weight
percentages of 18.0, 36.0, 34.0, 7.0, and 5.0 % respec-
tively. The 1H spectra of FAME-RM2 and of representative
unsaturated fatty acids are shown in the Online Resources.
The chemical shift of the methyl protons in x-3 PUFAs are
shifted to 0.977 ppm while those for x-6/x-7/x-9 unsatu-
rated fatty acids and saturated fatty acids are observed near
0.885 ppm (Online Resources 1), allowing the x-3 FAME
methyl a-linolenate to be distinguished in this sample from
the others (AOCS 2014). ALCHIM experiments performed
on FAME-RM2 dissolved in CDCl3 are shown in Fig. 5a,
b. In these experiments the methyl peak at 0.885 ppm was
selectively excited and the allylic peak was integrated as a
function of the number of DIPSI cycles applied (Fig. 5a).
This transfer curve was fit to a model assuming that the
transfer curve is a linear combination of those from linoleic
(x-6), palmitoleic (x-7), and oleic (x-9) acids. Figure 5a
shows the measured transfer curve of FAME-RM2 as well
as those for the assumed constituents and the best-fit
model. Figure 5b shows the probability distributions and
95 % confidence intervals for the unsaturated fatty acid
fractions given the data. This sample was found to contain
13.0 ± 3.5 % oleic acid, less than 1.3 % palmitoleic acid,
and 31.3 ± 0.52 % linoleic acid. GC analysis from the
supplier gave the values as 18 % oleic acid, 0 % palmit-
oleic acid, and 36 % linoleic acid. These data show cor-
rectly that palmitoleic acid is not present in significant
quantities in the sample. Oleic and linoleic acids are both
underestimated by about 5 %.
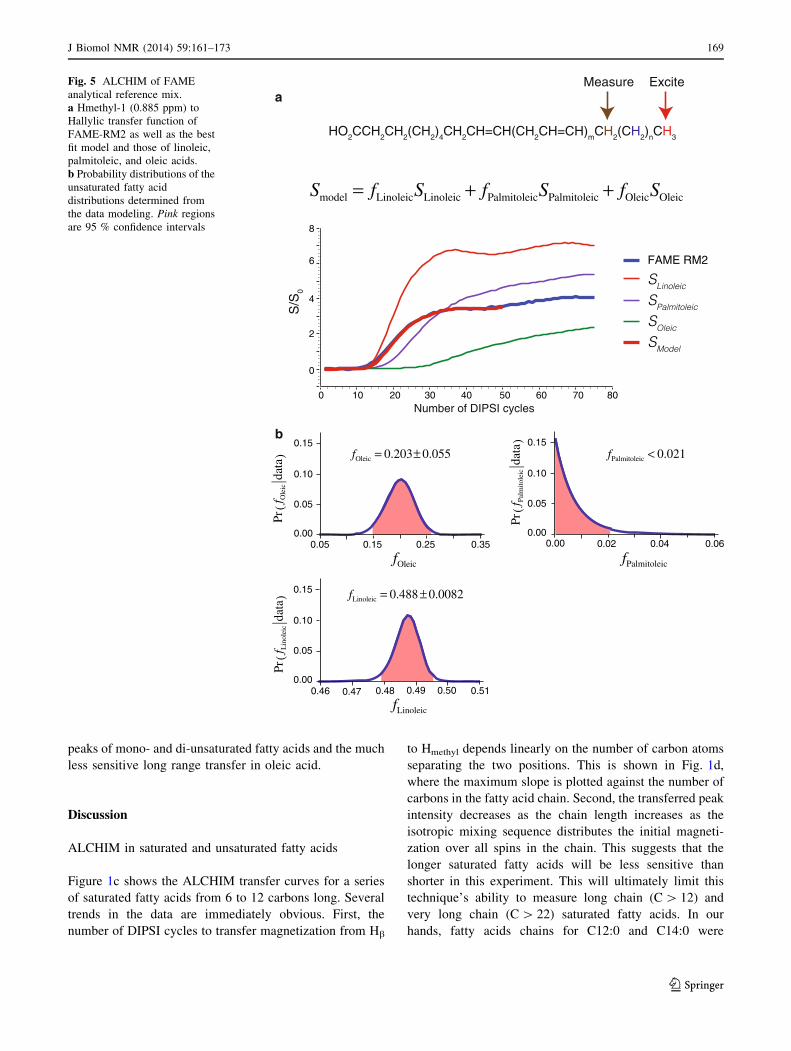
Neutral fats extracted from mouse adipose tissue
ALCHIM experiments performed on neutral fats extracted
from mouse adipose tissue and dissolved in deuterated
chloroform are shown in Fig. 6a–c. 1H 1D spectrum indi-
cates that these neutral fats are triglycerides containing
about 74 % unsaturated and 26 % saturated fatty acids.
From the integrals of the allylic peaks, the amounts of
mono- and di-unsaturated fatty acids are about equal
(integral ratio 0.92). Figure 6a shows the transfer curves
from Hmethyl to Hallylic of the monounsaturated fatty acids,
which follows neither the reference curves for palmitoleic
or oleic acids. The observed curve is modeled as a linear
combination of these fatty acids and the probability dis-
tributions for the fitted fractions are shown in Fig. 6b.
Neutral fats from mouse adipose tissue is found to contain
5.02 ± 0.11 % palmitoleic acid and 22.7 ± 0.51 % oleic
acid. Figure 6c shows the curve from Hmethyl to Hallylic of
the di-unsaturated fatty acids, which overlaps with that
from linoleic acid indicating that this is an x-6 di-unsatu-
rated fatty acid. The Hb to Hallylic of di-unsaturated fatty
acid confirms that the observed acid is linoleic. Transfer
from Hb to Hmethyl was very inefficient, suggesting that the
saturated fatty acids were long chain with the number of
carbons greater than 14.
Mouse adipocytes
As a final test of the generality of the method, whole mouse
adipocytes were isolated and placed in an NMR tube and
the ALCHIM experiment performed. Figure 6d shows the
results of the Hmethyl to Hallylic transfer as well as reference
transfer curves from deuterated chloroform solution of
oleic, palmitoleic, and linoleic acids. The peaks from the
whole adipocyte sample were much broader than that seen
from solutions, but the different sites in the fatty acids
could still be distinguished (Online Resource Figure 6);
however, it was not possible to distinguish the allyic peaks
from mono- and di-unsaturated fatty acids. Figure 6d then
shows the integral of both these contributions as a function
of the mixing cycles. Figure 6d is not a fit, but simply an
overlay. Since rise in the transfer curve for allylic protons
in both linoleic acid and whole adipocytes occurs in the
same range of DIPSI mixing cycles, linoleic acid must be
present in the whole adipocytes. The presence of oleic acid
is not seen because of the lack of resolution of the allylic
168 J Biomol NMR (2014) 59:161–173
123
peaks of mono- and di-unsaturated fatty acids and the much
less sensitive long range transfer in oleic acid.
Discussion
ALCHIM in saturated and unsaturated fatty acids
Figure 1c shows the ALCHIM transfer curves for a series
of saturated fatty acids from 6 to 12 carbons long. Several
trends in the data are immediately obvious. First, the
number of DIPSI cycles to transfer magnetization from Hb
to Hmethyl depends linearly on the number of carbon atoms
separating the two positions. This is shown in Fig. 1d,
where the maximum slope is plotted against the number of
carbons in the fatty acid chain. Second, the transferred peak
intensity decreases as the chain length increases as the
isotropic mixing sequence distributes the initial magneti-
zation over all spins in the chain. This suggests that the
longer saturated fatty acids will be less sensitive than
shorter in this experiment. This will ultimately limit this
technique’s ability to measure long chain (C [ 12) and
very long chain (C [ 22) saturated fatty acids. In our
hands, fatty acids chains for C12:0 and C14:0 were
a
b
Fig. 5 ALCHIM of FAME
analytical reference mix.
a Hmethyl-1 (0.885 ppm) to
Hallylic transfer function of
FAME-RM2 as well as the best
fit model and those of linoleic,
palmitoleic, and oleic acids.
b Probability distributions of the
unsaturated fatty acid
distributions determined from
the data modeling. Pink regions
are 95 % confidence intervals
J Biomol NMR (2014) 59:161–173 169
123
ExciteMeasure
0 7550250.0
1.0
1.5
S/S
0Number of DIPSI cycles
0.5
Mouse
Oleic
Palmitoleic
Model
HO2CCH2CH2(CH2)4CH2CH=CHCH2(CH2)nCH3
fpalmitoleic = 0.0502± 0.0011
Prf pa
lmito
leic
data
()
fpalmitoleic
0.0450 0.0475 0.0500 0.0525 0.0550
0.025
0.050
0.075
0.100
0.000
foleic = 0.227 ± 0.0051
foleic
Prf ol
eic
data
()
0.025
0.050
0.075
0.100
0.0000.20 0.21 0.22 0.23 0.24 0.25
ExciteMeasure
HO2CCH2CH2(CH2)4CH2CH=CHCH2CH=CHCH2(CH2)nCH3
Mouse
Linoleic
0.00
0.25
0.50
0.75
1.00
0 25 50 75
S/S
0
Number of DIPSI cycles
ExciteMeasure
HO2CCH2CH2(CH2)4CH2CH=CH(CH2CH=CH)mCH2(CH2)nCH3
Adipocytes
Oleic
Palmitoleic
Linoleic
0.00
0.25
0.50
0.75
1.00
0 25 50 75
S/S
0
Number of DIPSI cycles
a
b
c
d
Fig. 6 ALCHIM of neutral
mouse lipids. a Hmethyl to mono-
unsaturated Hallylic transfer
function of neutral mouse lipids.
Also shown are the transfer
functions of oleic and
palmitoleic acids and the best fit
model assuming the observed
transfer function is their linear
combination. b Probability
distributions of the fatty acid
fractions determined from
modeling of the data. Pink
regions are 95 % confidence
intervals. c Hmethyl to di-
unsaturated Hallylic transfer
function in mouse fat as well as
transfer functions of linoleic
acid. d Hmethyl to Hallylic transfer
function in mouse adipocytes as
well reference transfer
functions. Transfer functions
were normalized to maximum
170 J Biomol NMR (2014) 59:161–173
123
measurable but longer than that the signal-to-noise ratio
was significantly degraded. An additional issue with the
longer chain fatty acids is that the slope of the methyl
intensity with the number of DIPSI cycles decreases as the
chain length increases, making that rise more difficult to
detect. Short fatty acids also show stronger oscillations in
the methyl intensity. As the chain length becomes pro-
gressively longer, more frequencies are present leading to
smoother transfer behavior. These oscillations do act as
distinct fingerprints of the short fatty acids. These behav-
iors confirm the predictions of the simple chain model and
demonstrate that fatty acid chain length can be measured
with this technique.
By appropriately choosing the excitation and detection
sites in the fatty acid, it is possible to make their identifica-
tion. This is possible due to the linear behavior of the transfer
as well as NMR’s ability to site selectively excite and detect.
Thus to identify saturated fatty acids, it is sufficient to excite
at Hb and detect at Hmethyl. In unsaturated fatty acids, two
transfer curves must be measured so that the position of the
unsaturation can be specified from both ends of the fatty acid
chain. In this case, excitation is made at the Hb and the
Hmethyl with detection at Hallylic. As the Hallylic resonances in
mono- and di-unsaturated fatty acid occur at slightly differ-
ent shifts, 2.011 ppm versus 2.048 ppm, respectively, two
component mixtures of these unsaturated fatty acids can be
easily identified using this strategy; however, we have also
shown that fitting the integrals of the entire allylic region also
allows identification of different unsaturated fatty acids.
Vinylic protons, which only occur in multiply unsaturated
fatty acids can also be probed.
ALCHIM in mixtures
In cases where the chemical shift does not resolve different
components of a mixture, ALCHIM still permits analysis.
Figure 2 demonstrates that the observed transfer curves are
simple linear combinations of the components. This feature
allowed the identification and quantification of the four
lowest molecular mass saturated fatty acids in coconut oil,
Fig. 4a, b. The probability distributions for the determined
fractions of these fatty acids show that the method is most
sensitive to the shorter lipids. This is demonstrated by the
increased relative error in the determined fraction for the
longer chain fatty acids. Two factors lead to this decreased
precision: the longer chain fatty acids require deconvolu-
tion of the transfer functions of those shorter and the longer
fatty acids have a smaller effect on the observed peak
intensity as pointed out earlier. Despite this limitation, we
have demonstrated that ALCHIM can successfully measure
mixtures of saturated fatty acids with chain length 12
carbons or less. In unsaturated fatty acids, longer lipids can
be probed because transfer down the entire chain is
unnecessary as detection occurs in the center of the chain at
the allylic proton.
While most of the samples analyzed in this paper were
dissolved in deuterated chloroform, we have demonstrated
that even whole adipocytes can be probed with this
method. The linewidths of the 1H resonances in the adi-
pocyte sample were much broader than those in the chlo-
roform; however, resolution was sufficient to selectively
excite and detect the relevant sites in the lipid sidechains.
This did lead to additional complexity in probing unsatu-
rated fatty acids as the allylic peaks from mono- and di-
unsaturated fatty acids were now unresolved. It was found
that linoleic acid made the major contribution to the Hmethyl
to Hallylic transfer curve because linoleic acid has 3 less
carbons between these sites than oleic acid, the other major
component identified in the extracted samples. This once
again emphasizes that ALCHIM is most sensitive to shorter
transfers in mixtures.
The analysis of the FAME-RM2 analytical standard
sample demonstrated the power of this method in analyzing a
complex mixture using a combination of quantitative 1H
NMR spectroscopy and ALCHIM. From the integrals of the
methyl and allylic peaks, the sample was determined to
contain 87.9 % unsaturated fatty acids and 12.1 % saturated
fatty acids (actual 87.5 % unsaturated, 12.5 % saturated.) Of
the unsaturated fatty acids, 35.8 % is x-3 unsaturated (actual
34.0 %) while x-6 and x-9 are 31.3 ± 0.52 % (actual 36 %)
and 13.0 ± 3.5 % (actual 18 %), respectively. These values
are all within 5 % of the actual values.
Fat distributions in mouse adipose tissue
Agreeing with previous gas chromatography-based studies
(Tallman and Taylor 2003; Li et al. 2010), oleic and pal-
mitoleic acid were the principal mono-unsaturated lipids
identified in mouse adipose tissue using ALCHIM. Both Li
et al. and Tallman et al. reported roughly 4.5 and 30 % for
palmitoleic and oleic acid, respectively, in mouse adipose
tissue. These studies also identified linoleic acid as the
major PUFA, with its contribution about 35 % of the
analyzed lipids. By NMR, we observed similar numbers
with roughly 5, 23, and 30 % for palmitoleic, oleic, and
linoleic acid, respectively. While small variance exists
between the published GC and ALCHIM results, this is
likely due to differences in rodent diets, lipid extraction
method, and type of mouse used. Our study used exclu-
sively CD-1 female mice while the previous GC-based
analyses used all male C57BL6 mice. Despite these dif-
ferences, adipocyte-extracted lipid species and their con-
centrations identified using ALCHIM generally agree with
GC based measures.
J Biomol NMR (2014) 59:161–173 171
123
We have demonstrated a new use of the classic TOCSY
technique for probing the structure of fats by magnetic
resonance. This selective TOCSY experiment measures the
aliphatic chain length by the dynamics of the magnetization
transfer between the sites of interest. By comparing to a
library of transfer functions, ALCHIM provides both
qualitative and quantitative information about the compo-
sition of complex lipid samples and when combined with
existing methods provides a much more complete under-
standing of these systems. For instance, it can distinguish
x-6 and x-9 fatty acids in a mixture. Admittedly, ALCHIM
transfer functions need to be measured on each instrument
under the conditions used, but ALCHIM can be expected to
work even at the highest fields as the chemical shift range
of fatty acids is limited to the range 0.85 to 5.5 ppm. On a
1 GHz magnet this is only 4,700 Hz, which can be easily
recoupled using a DIPSI-2 sequence with an rf field
strength of 5,000 Hz. A great advantage of this method is
that it works under many different conditions: from low
viscosity solutions to high viscosity suspensions of whole
cells. Since the sequence relies on selective excitation,
contaminants are of little concern as long as they do not
overlap with both the excited and detected peaks even if
they are within the excitation bandwidth of the selective
pulse. When combined with High-Resolution Magic Angle
Spinning (HRMAS), this method will allow direct identi-
fication of fats in complex tissue samples. The method will
be applicable to many systems in addition to those studied
here, including micelles, bicelles, lipid nanoparticles, and
nanodisks.
Acknowledgments We would like to thank Stephen Meredith and
Shohei Koide for useful discussion and comments. This work was
supported by NIH R01-CA148814 (S.D. Conzen), DOD predoctoral
fellowship W81XWH-11-1-014901 (P.A. Volden) and by the Bio-
logical Sciences Division, the Office of Shared Research Facilities,
and the Department of Biochemistry and Molecular Biology (J.R.
Sachleben) at the University of Chicago.
References
AOAC (1995) Official methods of analysis of AOAC international.
AOAC International, Gaithersburg, MD
AOCS Lipid Library (2014) http://lipidlibrary.aocs.org/
Boslem E, Weir JM, MacIntosh G, Sue N, Cantley J, Meikle PJ,
Biden TJ (2013) Alteration of endoplasmic reticulum lipid rafts
contributes to lipotoxicity in pancreatic b-cells. J Biol Chem
288:26569–26582
Braunschweiler L, Ernst RR (1983) Coherence transfer by isotropic
mixing: application to proton correlation spectroscopy. J Magn
Reson 53:521–528
Camont L, Lhomme M, Rached F, Goff WL, Negre-Salvayre A,
Salvayre R, Calzada C, Lagarde M, Chapman MJ, Kontush A
(2013) Small, dense high-density lipoprotein-3 particles are
enriched in negatively charged phospholipids: relevance to
cellular cholesterol efflux, antioxidative, antithrombotic, anti-
inflammatory, and antiapoptotic functionalities. Arterioscler
Thromb Vasc Biol 33:2715–2723
Casado B, Affolter M, Kussmann M (2009) OMICS-rooted studies of
milk proteins, oligosaccharides and lipids. J Proteomics
73:196–208
Didangelos A, Stegemann C, Mayr M (2012) The-omics era:
proteomics and lipidomics in vascular research. Atherosclerosis
221:12–17
Ernst RR, Bodenhausen G, Wokaun A (1990) Principles of nuclear
magnetic resonance in one and two dimensions. International
series of monographs on chemistry. Clarendon Press, Oxford
Fedor D, Kelley DS (2009) Prevention of insulin resistance by n-3
polyunsaturated fatty acids. Curr Opin Clin Nutr Metab Care
12:138–146
Gelman A, Carlin JB, Stern HS, Rubin DB (2004) Bayesian data
analysis, 2nd edn. CRC Press, Boca Raton
Gonzalez-Covarrubias V (2013) Lipidomics in longevity and healthy
aging. Biogerontology 14:663–672
Gross RW, Han X (2007) Lipidomics in diabetes and the metabolic
syndrome. Methods Enzymol 433:73–90
Guillen MD, Ruiz A (2001) High resolution 1H nuclear magnetic
resonance in the study of edible oils and fats. Trends Food Sci
Tech 12:328–338
Kamphorst JJ, Cross JR, Fan J, de E Stanchina, Mathew R, White EP,
Thompson CB, Rabinowitz JD (2013) Hypoxic and Ras-
transformed cells support growth by scavenging unsaturated
fatty acids from lysophospholipids. Proc Natl Acad Sci USA
110:8882–8887
Kessler H, Oschkinat H, Griesinger C, Bermel W (1986) Transfor-
mation of homonuclear two-dimensional NMR techniques into
one-dimensional techniques using Gaussian pulses. J Magn
Reson 70:106–133
Kien CL, Bunn JY, Poynter ME, Stevens R, Bain J, Ikayeva O,
Fukagawa NK, Champagne CM, Crain KI, Koves TR, Muoio
DM (2013) A lipidomics analysis of the relationship between
dietary fatty acid composition and insulin sensitivity in young
adults. Diabetes 62:1054–1063
Kontush A, Chapman MJ (2010) Lipidomics as a tool for the study of
lipoprotein metabolism. Curr Atheroscler Rep 12:194–201
Kwan HY, Hu YM, Chan CL, Cao HH, Cheng CY, Pan SY, Tse KW,
Wu YC, Yu ZL, Fong WF (2013) Lipidomics identification of
metabolic biomarkers in chemically induced hypertriglyceri-
demic mice. J Proteome Res 12:1387–1398
Li M, Fu W, Li X-A (2010) Differential fatty acid profile in adipose
and non-adipose tissues in obese mice. Int J Clin Exp Med
3(4):303–307
Longobardi F, Sacco D, Casiello G, Ventrella A, Contessa A, Sacco A
(2012) Garganica kid goat meat: physico-chemical characteriza-
tion and nutritional impacts. J Food Compost Anal 28(2):107–113
Meikle PJ, Christopher MJ (2011) Lipidomics is providing new
insight into the metabolic syndrome and its sequelae. Curr Opin
Lipidol 22:210–215
Merched AJ, Chan L (2013) Nutrigenetics and nutrigenomics of
atherosclerosis. Curr Atheroscler Rep 15. doi:10.1007/s11883-
013-0328-6
O’Donnell VB, Maskrey B, Taylor GW (2009) Eicosanoids: gener-
ation and detection in mammalian cells. In: Larijani B et al. (eds)
Lipid signaling protocols. Humana Press, Totowa, N.J., pp 5–23.
doi:10.1007/978-1-60327-115-8_1
Rasmiena AA, Ng TW, Meikle PJ (2013) Metabolomics and
ischaemic heart disease. Clin Sci 124:289–306
Riccardi G, Giacco R, Rivellese AA (2004) Dietary fat, insulin
sensitivity and the metabolic syndrome. Clin Nutr 23:447–456
Rule GS, Hitchens TK (2006) Fundamentals of protein NMR
spectroscopy. Focus on structural biology. Springer, Dordrecht
172 J Biomol NMR (2014) 59:161–173
123
Sachleben JR (2006) Bayesian and information theory analysis of
MAS sideband patterns in spin 1/2 systems. J Magn Reson
183:123–133
Sbihi HM, Nehdi IA, Al-Resayes SI (2013) Characterization of Hachi
(Camelus dromedarius) fat extracted from the hump. Food Chem
139(1–4):649–654
Simonsen N, Pvt Veer, Strain JJ, Martin-Moreno JM, Huttunen JK,
Navajas JFC, Martin BC, Thamm M, Kardinaal AFM, Kok FJ,
Kohlmeier L (1998) Adipose tissue omega-3 and omega-6 fatty
acid content and breast cancer in the EURAMIC study. Am J
Epidemiol 147:342–352
Sivia DS (1996) Data analysis: a bayesian tutorial. Clarendon Press,
Oxford
Stahlman M, Pham HT, Adiels M, Mitchell TW, Blanksby SJ,
Fagerberg B, Ekroos K, Boren J (2012) Clinical dyslipidaemia is
associated with changes in the lipid composition and inflamma-
tory properties of apolipoprotein-B-containing lipoproteins from
women with type 2 diabetes. Diabetologia 55:1156–1166
Stonehouse J, Adell P, Keeler J, Shaka AJ (1994) Ultrahigh-quality
NOE spectra. J Am Chem Soc 116:6037–6038
Stott K, Stonehouse J, Keeler J, Hwang TL, Shaka AJ (1995)
Excitation sculpting in high-resolution nuclear magnetic reso-
nance spectroscopy: application to selective NOE experiments.
J Am Chem Soc 117:4199–4200
Tallman DL, Taylor CG (2003) Effects of dietary fat and zinc on
adiposity, serum leptin, and adipose fatty acid composition in
C57BL/6 J mice. J Nutr Biochem 14:17–23
Thiebaut ACM, Chajes V, Gerber M, Boutron-Rualt MC, Joulin V,
Lenoir G, Berrino F, Riboli E, Benichou J, Clavel-Chapelon F
(2009) Dietary intakes of omega-6 and omega-3 polyunsaturated
fatty acids and the risk of breast cancer. Int J Cancer 124:924–931
Thrippleton MJ, Keeler J (2003) Elimination of zero-quantum
interference in two-dimensional NMR spectra. Angew Chem
Int Ed 42:3938–3941
Van QN, Shaka AJ (1998) Improved cross peak detection in two-
dimensional proton NMR spectra using excitation sculpting.
J Magn Reson 132:154–158
Watson AD (2006) Thematic review series: systems biology
approaches to metabolic and cardiovascular disorders. J Lipid
Res 47:2101–2111
J Biomol NMR (2014) 59:161–173 173
123