Embed Size (px)
DESCRIPTION
Â
Citation preview
8 12121
3001.5 8
1.0
0
368
1.0 15
217
0
0
8
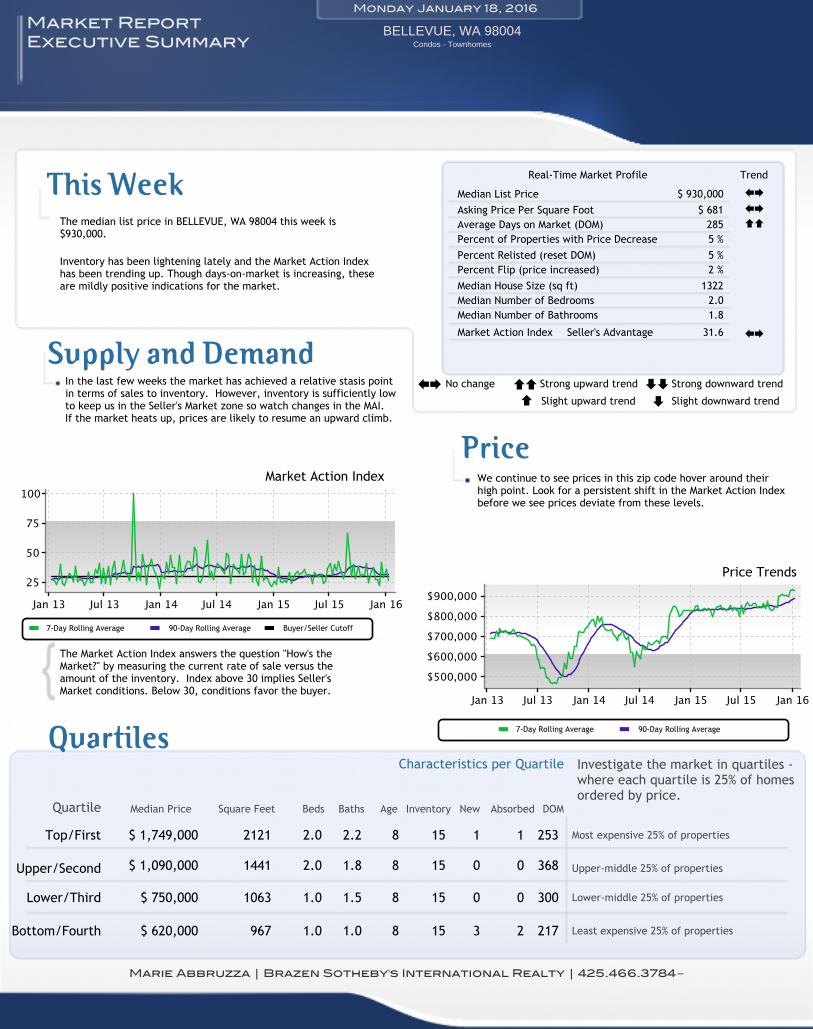
$ 750,000
3
1
15
2.2
01.8
967
15
$ 620,000
2.0
253
$ 1,090,000
2.0$ 1,749,000
8
2
1441
We continue to see prices in this zip code hover around theirhigh point. Look for a persistent shift in the Market Action Indexbefore we see prices deviate from these levels.
In the last few weeks the market has achieved a relative stasis pointin terms of sales to inventory. However, inventory is sufficiently lowto keep us in the Seller's Market zone so watch changes in the MAI.If the market heats up, prices are likely to resume an upward climb.
Inventory has been lightening lately and the Market Action Indexhas been trending up. Though days-on-market is increasing, theseare mildly positive indications for the market.
BELLEVUE, WA 98004Market ReportExecutive Summary
15
1063
1.0
Monday January 18, 2016
The median list price in BELLEVUE, WA 98004 this week is$930,000.
Investigate the market in quartiles -where each quartile is 25% of homesordered by price.
Most expensive 25% of properties
Upper-middle 25% of properties
Lower-middle 25% of properties
Least expensive 25% of properties
Quartile Median Price Beds Baths Age Inventory New Absorbed DOMSquare Feet
Marie Abbruzza | Brazen Sotheby's International Realty | 425.466.3784
No change Strong upward trend Strong downward trend
Slight upward trend Slight downward trend±+ == ≠≠
≠=
Powered by Altos Research LLC | www.altosresearch.com | Copyright ©2005-2014 Altos Research LLC
Condos - Townhomes
31.6
Percent Relisted (reset DOM)
1322
1.8
2 %
Median Number of Bathrooms
285
Median List Price
Average Days on Market (DOM)$ 681
Percent Flip (price increased)Median House Size (sq ft)
$ 930,000
5 %
2.0
Market Action Index
Median Number of Bedrooms
Asking Price Per Square Foot
5 %Percent of Properties with Price Decrease
Seller's Advantage
±+
±+
==
±+
Bottom/Fourth
Lower/Third
Upper/Second
Top/First
This Week
Supply and Demand
Real-Time Market Profile Trend
Price
Price Trends
Market Action Index
The Market Action Index answers the question "How's theMarket?" by measuring the current rate of sale versus theamount of the inventory. Index above 30 implies Seller'sMarket conditions. Below 30, conditions favor the buyer.
QuartilesCharacteristics per Quartile
90-Day Rolling Average7-Day Rolling Average Buyer/Seller Cutoff
90-Day Rolling Average7-Day Rolling Average
36 15503
963.9 8
4.0
3
102
4.0 10
44
1
1
0.50 - 1.0acre
40
$ 2,343,000
3
1
10
4.6
0.25 - 0.50acre
13.6
3070 0.25 - 0.50acre
10
$ 1,600,000
5.0
203
0.25 - 0.50acre$ 2,770,950
5.0$ 5,249,000
3
3
4130
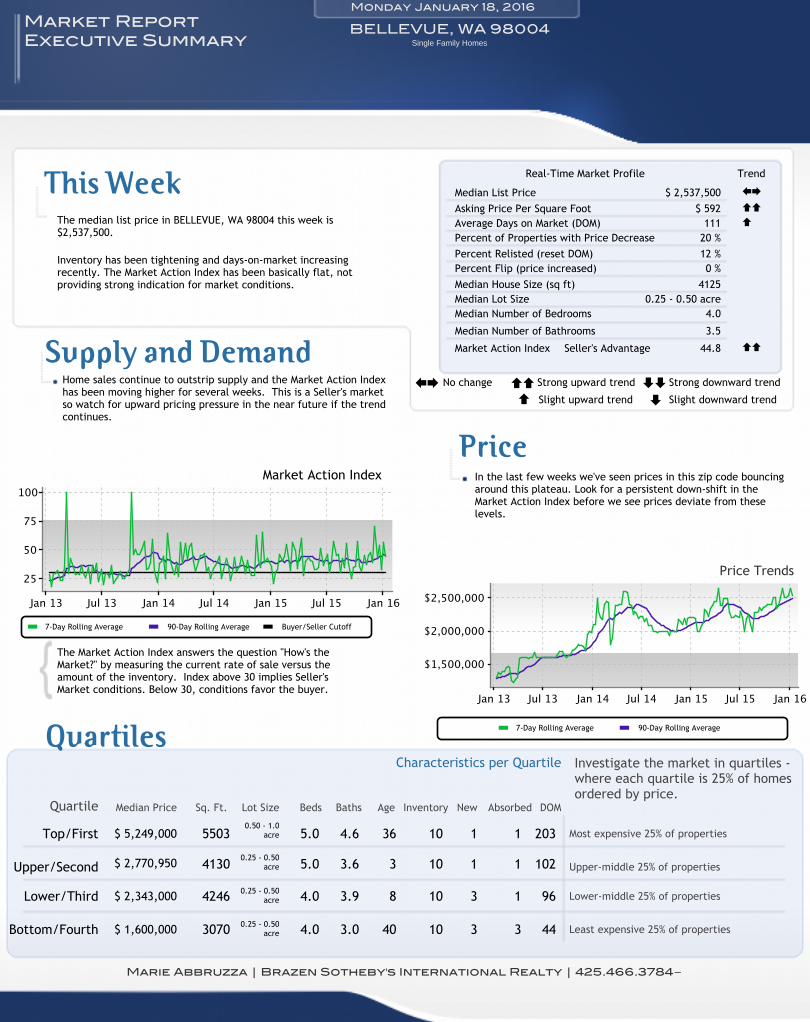
In the last few weeks we've seen prices in this zip code bouncingaround this plateau. Look for a persistent down-shift in theMarket Action Index before we see prices deviate from theselevels.
Home sales continue to outstrip supply and the Market Action Indexhas been moving higher for several weeks. This is a Seller's marketso watch for upward pricing pressure in the near future if the trendcontinues.
Inventory has been tightening and days-on-market increasingrecently. The Market Action Index has been basically flat, notproviding strong indication for market conditions.
BELLEVUE, WA 98004Market ReportExecutive Summary
10
4246
3.0
Monday January 18, 2016
The median list price in BELLEVUE, WA 98004 this week is$2,537,500.
Investigate the market in quartiles -where each quartile is 25% of homesordered by price.
Most expensive 25% of properties
Upper-middle 25% of properties
Lower-middle 25% of properties
Least expensive 25% of properties
Quartile Median Price Lot Size Beds Baths Age Inventory New Absorbed DOMSq. Ft.
Marie Abbruzza | Brazen Sotheby's International Realty | 425.466.3784
No change Strong upward trend Strong downward trend
Slight upward trend Slight downward trend±+ == ≠≠
≠=
Powered by Altos Research LLC | www.altosresearch.com | Copyright ©2005-2014 Altos Research LLC
Single Family Homes
Median Lot Size
44.8
Percent Relisted (reset DOM)
4125
3.5
0 %
Median Number of Bathrooms
111
Median List Price
Average Days on Market (DOM)$ 592
Percent Flip (price increased)
0.25 - 0.50 acreMedian House Size (sq ft)
$ 2,537,500
20 %
4.0
Market Action Index
Median Number of Bedrooms
Asking Price Per Square Foot
12 %Percent of Properties with Price Decrease
Seller's Advantage
±+
==
=
==
Bottom/Fourth
Lower/Third
Upper/Second
Top/First
This Week
Supply and Demand
Real-Time Market Profile Trend
Price
Price Trends
Market Action Index
The Market Action Index answers the question "How's theMarket?" by measuring the current rate of sale versus theamount of the inventory. Index above 30 implies Seller'sMarket conditions. Below 30, conditions favor the buyer.
QuartilesCharacteristics per Quartile
7-Day Rolling Average 90-Day Rolling Average Buyer/Seller Cutoff
7-Day Rolling Average 90-Day Rolling Average
8 12023
2281.5 8
2.0
2
358
1.0 21
82
0
1
37
$ 625,000
8
1
21
2.2
01.8
920
21
$ 230,000
2.0
242
$ 927,000
2.0$ 1,660,000
8
3
1311
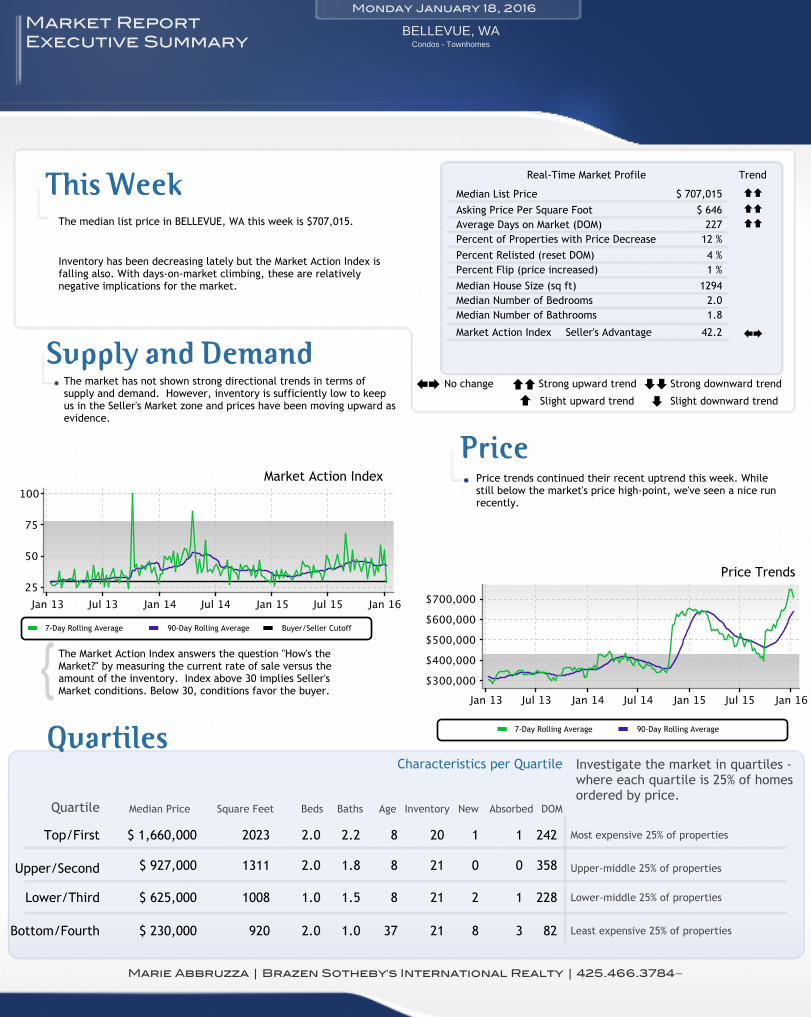
Price trends continued their recent uptrend this week. Whilestill below the market's price high-point, we've seen a nice runrecently.
The market has not shown strong directional trends in terms ofsupply and demand. However, inventory is sufficiently low to keepus in the Seller's Market zone and prices have been moving upward asevidence.
Inventory has been decreasing lately but the Market Action Index isfalling also. With days-on-market climbing, these are relativelynegative implications for the market.
BELLEVUE, WAMarket ReportExecutive Summary
20
1008
1.0
Monday January 18, 2016
The median list price in BELLEVUE, WA this week is $707,015.
Investigate the market in quartiles -where each quartile is 25% of homesordered by price.
Most expensive 25% of properties
Upper-middle 25% of properties
Lower-middle 25% of properties
Least expensive 25% of properties
Quartile Median Price Beds Baths Age Inventory New Absorbed DOMSquare Feet
Marie Abbruzza | Brazen Sotheby's International Realty | 425.466.3784
No change Strong upward trend Strong downward trend
Slight upward trend Slight downward trend±+ == ≠≠
≠=
Powered by Altos Research LLC | www.altosresearch.com | Copyright ©2005-2014 Altos Research LLC
Condos - Townhomes
42.2
Percent Relisted (reset DOM)
1294
1.8
1 %
Median Number of Bathrooms
227
Median List Price
Average Days on Market (DOM)$ 646
Percent Flip (price increased)Median House Size (sq ft)
$ 707,015
12 %
2.0
Market Action Index
Median Number of Bedrooms
Asking Price Per Square Foot
4 %Percent of Properties with Price Decrease
Seller's Advantage
==
==
==
±+
Bottom/Fourth
Lower/Third
Upper/Second
Top/First
This Week
Supply and Demand
Real-Time Market Profile Trend
Price
Price Trends
Market Action Index
The Market Action Index answers the question "How's theMarket?" by measuring the current rate of sale versus theamount of the inventory. Index above 30 implies Seller'sMarket conditions. Below 30, conditions favor the buyer.
QuartilesCharacteristics per Quartile
90-Day Rolling Average7-Day Rolling Average Buyer/Seller Cutoff
90-Day Rolling Average7-Day Rolling Average
12 25383
733.0 27
3.5
6
88
4.0 26
63
5
4
0.50 - 1.0acre
52
$ 1,149,900
9
2
27
4.6
0.25 - 0.50acre
34.0
1970 0.25 - 0.50acre
26
$ 600,000
5.0
164
0.25 - 0.50acre$ 2,225,998
5.0$ 3,690,000
2
7
4246
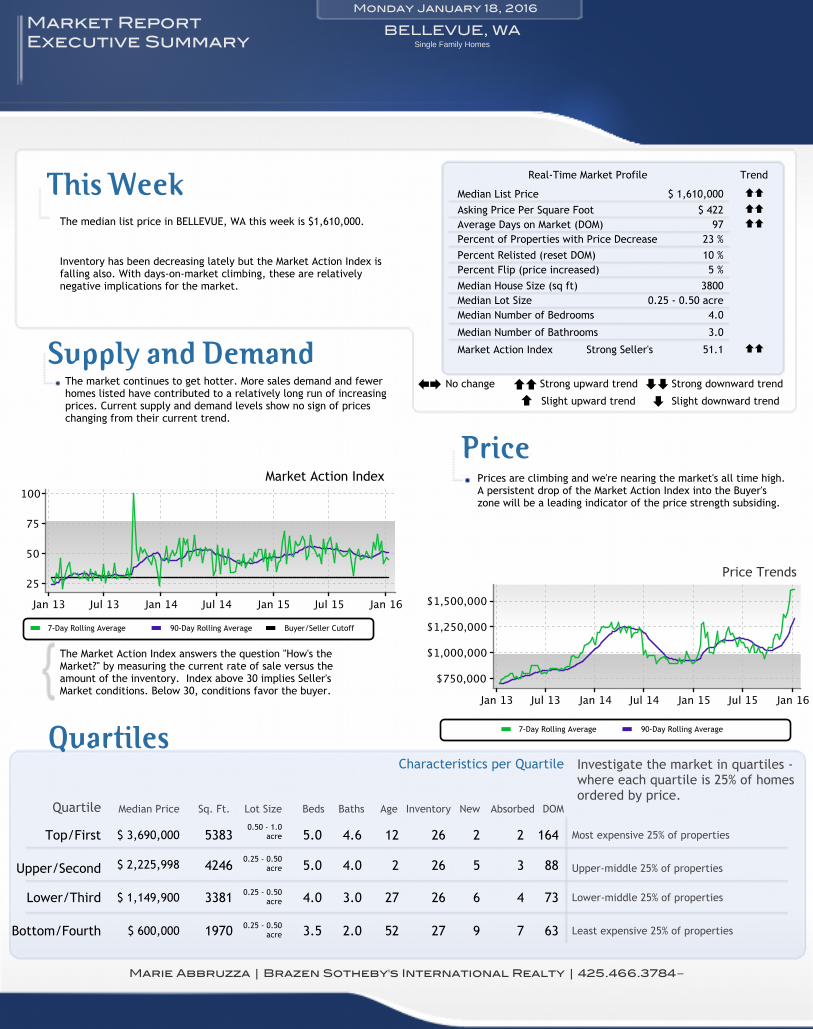
Prices are climbing and we're nearing the market's all time high.A persistent drop of the Market Action Index into the Buyer'szone will be a leading indicator of the price strength subsiding.
The market continues to get hotter. More sales demand and fewerhomes listed have contributed to a relatively long run of increasingprices. Current supply and demand levels show no sign of priceschanging from their current trend.
Inventory has been decreasing lately but the Market Action Index isfalling also. With days-on-market climbing, these are relativelynegative implications for the market.
BELLEVUE, WAMarket ReportExecutive Summary
26
3381
2.0
Monday January 18, 2016
The median list price in BELLEVUE, WA this week is $1,610,000.
Investigate the market in quartiles -where each quartile is 25% of homesordered by price.
Most expensive 25% of properties
Upper-middle 25% of properties
Lower-middle 25% of properties
Least expensive 25% of properties
Quartile Median Price Lot Size Beds Baths Age Inventory New Absorbed DOMSq. Ft.
Marie Abbruzza | Brazen Sotheby's International Realty | 425.466.3784
No change Strong upward trend Strong downward trend
Slight upward trend Slight downward trend±+ == ≠≠
≠=
Powered by Altos Research LLC | www.altosresearch.com | Copyright ©2005-2014 Altos Research LLC
Single Family Homes
Median Lot Size
51.1
Percent Relisted (reset DOM)
3800
3.0
5 %
Median Number of Bathrooms
97
Median List Price
Average Days on Market (DOM)$ 422
Percent Flip (price increased)
0.25 - 0.50 acreMedian House Size (sq ft)
$ 1,610,000
23 %
4.0
Market Action Index
Median Number of Bedrooms
Asking Price Per Square Foot
10 %Percent of Properties with Price Decrease
Strong Seller's
==
==
==
==
Bottom/Fourth
Lower/Third
Upper/Second
Top/First
This Week
Supply and Demand
Real-Time Market Profile Trend
Price
Price Trends
Market Action Index
The Market Action Index answers the question "How's theMarket?" by measuring the current rate of sale versus theamount of the inventory. Index above 30 implies Seller'sMarket conditions. Below 30, conditions favor the buyer.
QuartilesCharacteristics per Quartile
7-Day Rolling Average 90-Day Rolling Average Buyer/Seller Cutoff
7-Day Rolling Average 90-Day Rolling Average
1 32172
361.8 16
2.0
4
58
2.0 9
44
1
4
31
$ 335,000
3
1
9
3.5
12.8
932
9
$ 223,500
3.0
40
$ 520,000
4.0$ 648,995
1
2
1500
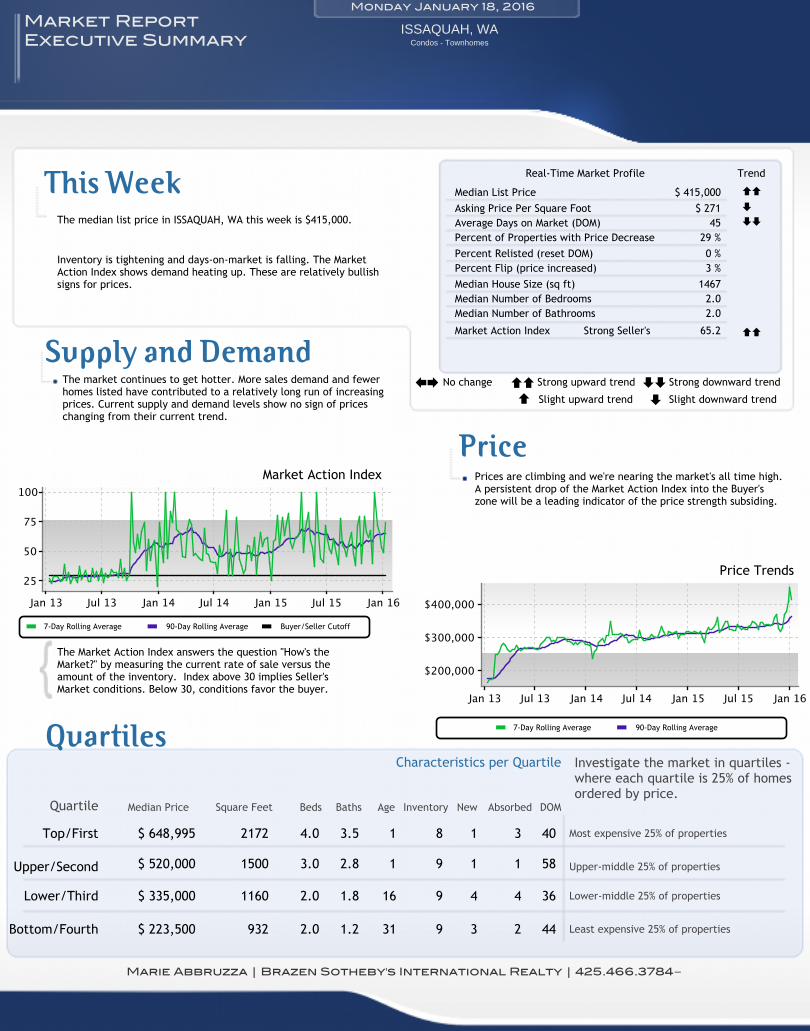
Prices are climbing and we're nearing the market's all time high.A persistent drop of the Market Action Index into the Buyer'szone will be a leading indicator of the price strength subsiding.
The market continues to get hotter. More sales demand and fewerhomes listed have contributed to a relatively long run of increasingprices. Current supply and demand levels show no sign of priceschanging from their current trend.
Inventory is tightening and days-on-market is falling. The MarketAction Index shows demand heating up. These are relatively bullishsigns for prices.
ISSAQUAH, WAMarket ReportExecutive Summary
8
1160
1.2
Monday January 18, 2016
The median list price in ISSAQUAH, WA this week is $415,000.
Investigate the market in quartiles -where each quartile is 25% of homesordered by price.
Most expensive 25% of properties
Upper-middle 25% of properties
Lower-middle 25% of properties
Least expensive 25% of properties
Quartile Median Price Beds Baths Age Inventory New Absorbed DOMSquare Feet
Marie Abbruzza | Brazen Sotheby's International Realty | 425.466.3784
No change Strong upward trend Strong downward trend
Slight upward trend Slight downward trend±+ == ≠≠
≠=
Powered by Altos Research LLC | www.altosresearch.com | Copyright ©2005-2014 Altos Research LLC
Condos - Townhomes
65.2
Percent Relisted (reset DOM)
1467
2.0
3 %
Median Number of Bathrooms
45
Median List Price
Average Days on Market (DOM)$ 271
Percent Flip (price increased)Median House Size (sq ft)
$ 415,000
29 %
2.0
Market Action Index
Median Number of Bedrooms
Asking Price Per Square Foot
0 %Percent of Properties with Price Decrease
Strong Seller's
==
≠
≠≠
==
Bottom/Fourth
Lower/Third
Upper/Second
Top/First
This Week
Supply and Demand
Real-Time Market Profile Trend
Price
Price Trends
Market Action Index
The Market Action Index answers the question "How's theMarket?" by measuring the current rate of sale versus theamount of the inventory. Index above 30 implies Seller'sMarket conditions. Below 30, conditions favor the buyer.
QuartilesCharacteristics per Quartile
90-Day Rolling Average7-Day Rolling Average Buyer/Seller Cutoff
90-Day Rolling Average7-Day Rolling Average
1 13811
983.0 1
3.0
1
92
4.0 13
180
2
3
4,501 -6,500 sqft
40
$ 799,000
3
1
13
3.5
Less than4,500 sqft
13.5
2020 0.50 - 1.0acre
13
$ 550,000
4.0
103
4,501 -6,500 sqft$ 999,999
4.0$ 1,258,000
1
4
3498
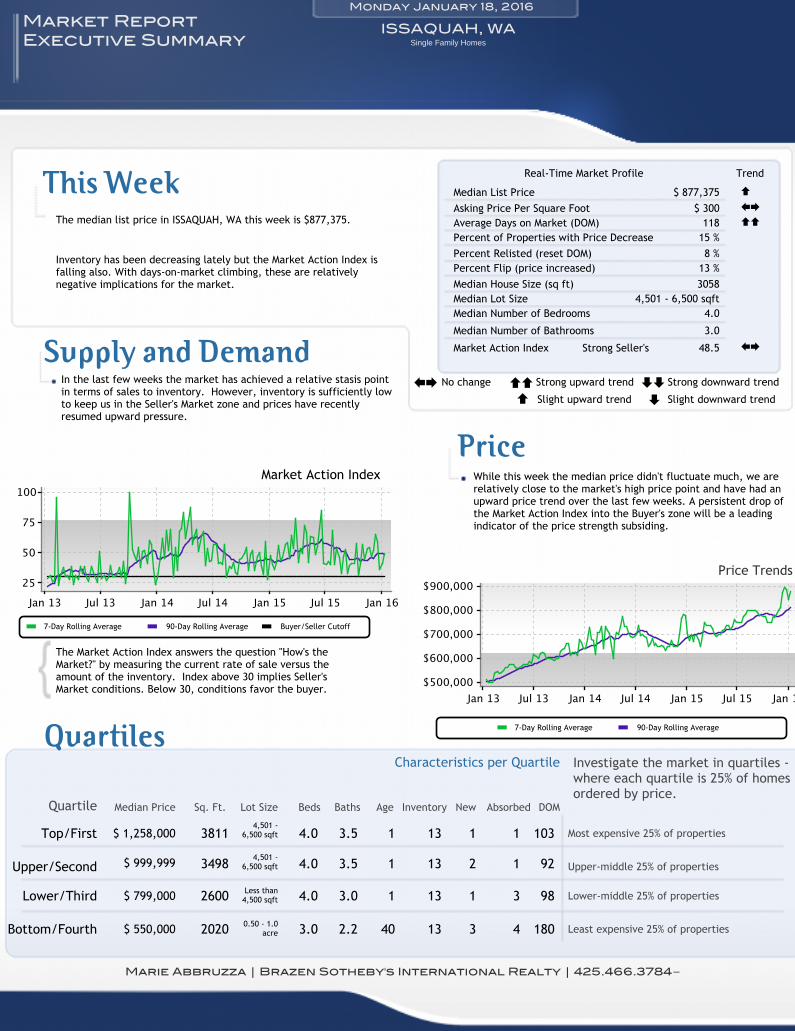
While this week the median price didn't fluctuate much, we arerelatively close to the market's high price point and have had anupward price trend over the last few weeks. A persistent drop ofthe Market Action Index into the Buyer's zone will be a leadingindicator of the price strength subsiding.
In the last few weeks the market has achieved a relative stasis pointin terms of sales to inventory. However, inventory is sufficiently lowto keep us in the Seller's Market zone and prices have recentlyresumed upward pressure.
Inventory has been decreasing lately but the Market Action Index isfalling also. With days-on-market climbing, these are relativelynegative implications for the market.
ISSAQUAH, WAMarket ReportExecutive Summary
13
2600
2.2
Monday January 18, 2016
The median list price in ISSAQUAH, WA this week is $877,375.
Investigate the market in quartiles -where each quartile is 25% of homesordered by price.
Most expensive 25% of properties
Upper-middle 25% of properties
Lower-middle 25% of properties
Least expensive 25% of properties
Quartile Median Price Lot Size Beds Baths Age Inventory New Absorbed DOMSq. Ft.
Marie Abbruzza | Brazen Sotheby's International Realty | 425.466.3784
No change Strong upward trend Strong downward trend
Slight upward trend Slight downward trend±+ == ≠≠
≠=
Powered by Altos Research LLC | www.altosresearch.com | Copyright ©2005-2014 Altos Research LLC
Single Family Homes
Median Lot Size
48.5
Percent Relisted (reset DOM)
3058
3.0
13 %
Median Number of Bathrooms
118
Median List Price
Average Days on Market (DOM)$ 300
Percent Flip (price increased)
4,501 - 6,500 sqftMedian House Size (sq ft)
$ 877,375
15 %
4.0
Market Action Index
Median Number of Bedrooms
Asking Price Per Square Foot
8 %Percent of Properties with Price Decrease
Strong Seller's
=
±+
==
±+
Bottom/Fourth
Lower/Third
Upper/Second
Top/First
This Week
Supply and Demand
Real-Time Market Profile Trend
Price
Price Trends
Market Action Index
The Market Action Index answers the question "How's theMarket?" by measuring the current rate of sale versus theamount of the inventory. Index above 30 implies Seller'sMarket conditions. Below 30, conditions favor the buyer.
QuartilesCharacteristics per Quartile
7-Day Rolling Average 90-Day Rolling Average Buyer/Seller Cutoff
7-Day Rolling Average 90-Day Rolling Average
30 03440
401.8 35
2.0
5
50
2.0 10
81
3
3
36
$ 382,500
1
0
10
3.0
12.0
936
9
$ 199,475
2.0
58
$ 749,000
3.0$ 1,499,950
16
2
1248
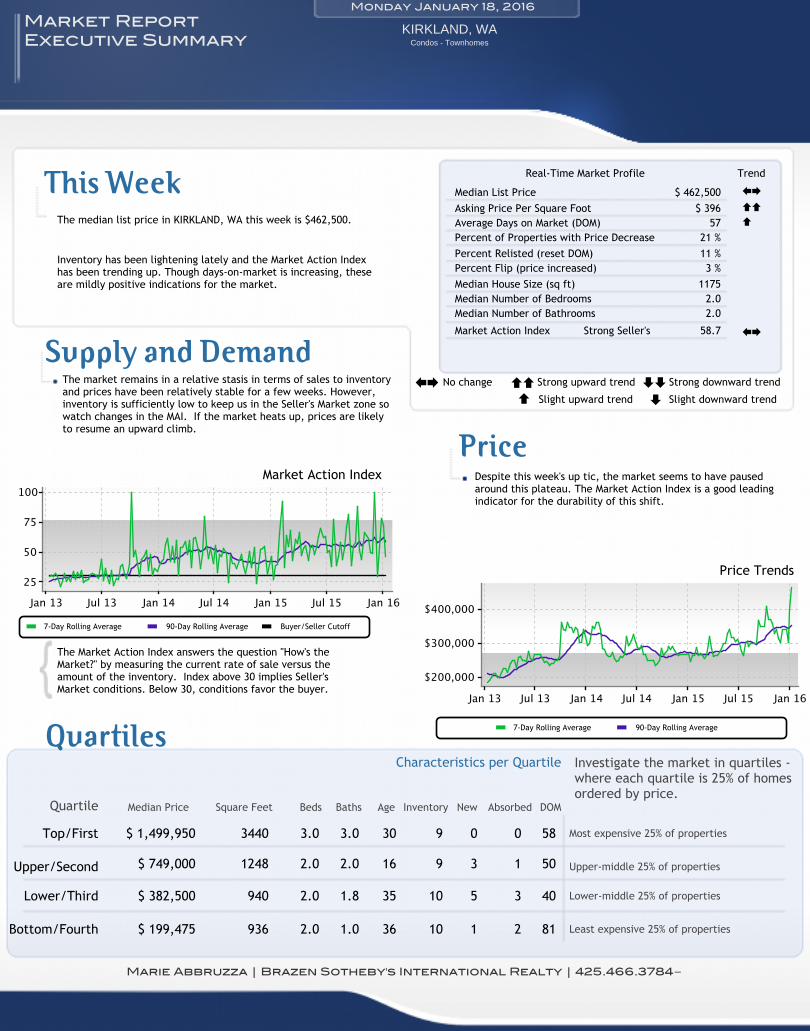
Despite this week's up tic, the market seems to have pausedaround this plateau. The Market Action Index is a good leadingindicator for the durability of this shift.
The market remains in a relative stasis in terms of sales to inventoryand prices have been relatively stable for a few weeks. However,inventory is sufficiently low to keep us in the Seller's Market zone sowatch changes in the MAI. If the market heats up, prices are likelyto resume an upward climb.
Inventory has been lightening lately and the Market Action Indexhas been trending up. Though days-on-market is increasing, theseare mildly positive indications for the market.
KIRKLAND, WAMarket ReportExecutive Summary
9
940
1.0
Monday January 18, 2016
The median list price in KIRKLAND, WA this week is $462,500.
Investigate the market in quartiles -where each quartile is 25% of homesordered by price.
Most expensive 25% of properties
Upper-middle 25% of properties
Lower-middle 25% of properties
Least expensive 25% of properties
Quartile Median Price Beds Baths Age Inventory New Absorbed DOMSquare Feet
Marie Abbruzza | Brazen Sotheby's International Realty | 425.466.3784
No change Strong upward trend Strong downward trend
Slight upward trend Slight downward trend±+ == ≠≠
≠=
Powered by Altos Research LLC | www.altosresearch.com | Copyright ©2005-2014 Altos Research LLC
Condos - Townhomes
58.7
Percent Relisted (reset DOM)
1175
2.0
3 %
Median Number of Bathrooms
57
Median List Price
Average Days on Market (DOM)$ 396
Percent Flip (price increased)Median House Size (sq ft)
$ 462,500
21 %
2.0
Market Action Index
Median Number of Bedrooms
Asking Price Per Square Foot
11 %Percent of Properties with Price Decrease
Strong Seller's
±+
==
=
±+
Bottom/Fourth
Lower/Third
Upper/Second
Top/First
This Week
Supply and Demand
Real-Time Market Profile Trend
Price
Price Trends
Market Action Index
The Market Action Index answers the question "How's theMarket?" by measuring the current rate of sale versus theamount of the inventory. Index above 30 implies Seller'sMarket conditions. Below 30, conditions favor the buyer.
QuartilesCharacteristics per Quartile
90-Day Rolling Average7-Day Rolling Average Buyer/Seller Cutoff
90-Day Rolling Average7-Day Rolling Average
10 04026
603.5 1
3.0
7
72
4.0 24
124
5
4
0.25 - 0.50acre
41
$ 899,925
9
5
24
3.5
4,501 -6,500 sqft
23.2
1820 8,001 -10,000 sqft
24
$ 608,750
4.0
122
8,001 -10,000 sqft$ 1,247,000
4.0$ 1,941,500
1
9
3570
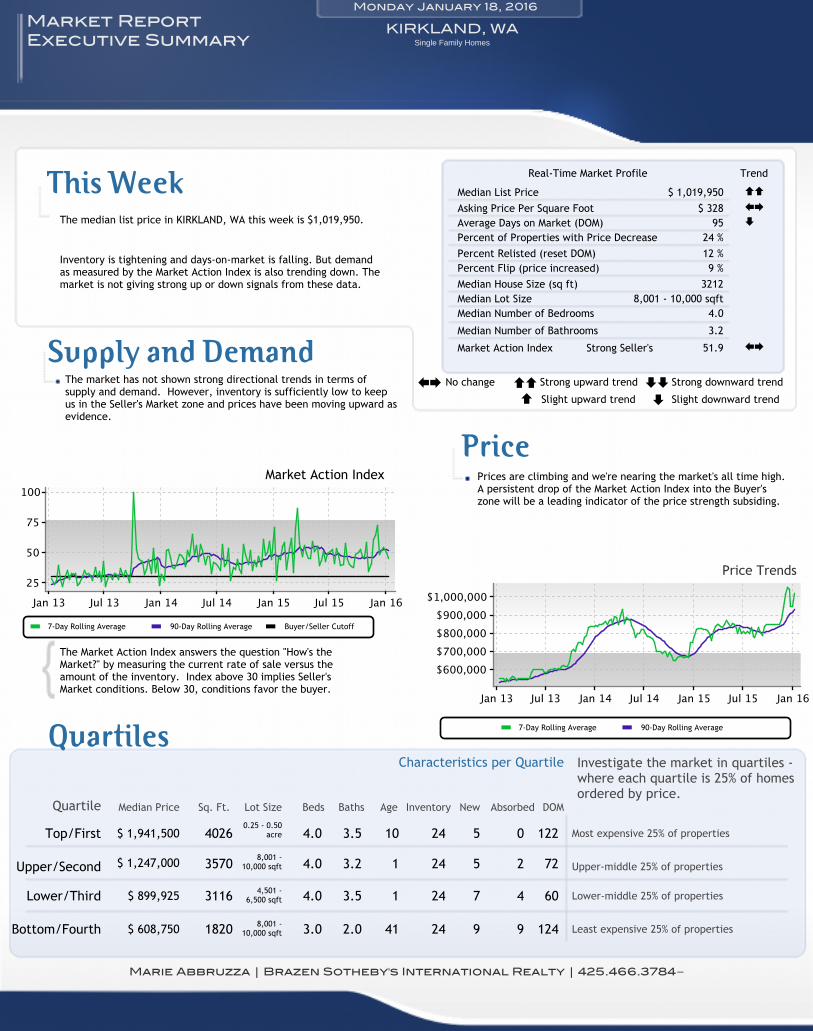
Prices are climbing and we're nearing the market's all time high.A persistent drop of the Market Action Index into the Buyer'szone will be a leading indicator of the price strength subsiding.
The market has not shown strong directional trends in terms ofsupply and demand. However, inventory is sufficiently low to keepus in the Seller's Market zone and prices have been moving upward asevidence.
Inventory is tightening and days-on-market is falling. But demandas measured by the Market Action Index is also trending down. Themarket is not giving strong up or down signals from these data.
KIRKLAND, WAMarket ReportExecutive Summary
24
3116
2.0
Monday January 18, 2016
The median list price in KIRKLAND, WA this week is $1,019,950.
Investigate the market in quartiles -where each quartile is 25% of homesordered by price.
Most expensive 25% of properties
Upper-middle 25% of properties
Lower-middle 25% of properties
Least expensive 25% of properties
Quartile Median Price Lot Size Beds Baths Age Inventory New Absorbed DOMSq. Ft.
Marie Abbruzza | Brazen Sotheby's International Realty | 425.466.3784
No change Strong upward trend Strong downward trend
Slight upward trend Slight downward trend±+ == ≠≠
≠=
Powered by Altos Research LLC | www.altosresearch.com | Copyright ©2005-2014 Altos Research LLC
Single Family Homes
Median Lot Size
51.9
Percent Relisted (reset DOM)
3212
3.2
9 %
Median Number of Bathrooms
95
Median List Price
Average Days on Market (DOM)$ 328
Percent Flip (price increased)
8,001 - 10,000 sqftMedian House Size (sq ft)
$ 1,019,950
24 %
4.0
Market Action Index
Median Number of Bedrooms
Asking Price Per Square Foot
12 %Percent of Properties with Price Decrease
Strong Seller's
==
±+
≠
±+
Bottom/Fourth
Lower/Third
Upper/Second
Top/First
This Week
Supply and Demand
Real-Time Market Profile Trend
Price
Price Trends
Market Action Index
The Market Action Index answers the question "How's theMarket?" by measuring the current rate of sale versus theamount of the inventory. Index above 30 implies Seller'sMarket conditions. Below 30, conditions favor the buyer.
QuartilesCharacteristics per Quartile
7-Day Rolling Average 90-Day Rolling Average Buyer/Seller Cutoff
7-Day Rolling Average 90-Day Rolling Average
20 09790
1163.2 36
4.0
0
203
5.0 5
92
0
0
1.0 - 2.5acres
10
$ 2,375,000
1
0
5
6.8
0.25 - 0.50acre
23.8
3400 0.25 - 0.50acre
5
$ 1,798,000
4.0
339
0.25 - 0.50acre$ 3,988,000
5.0$ 10,998,000
37
3
4580
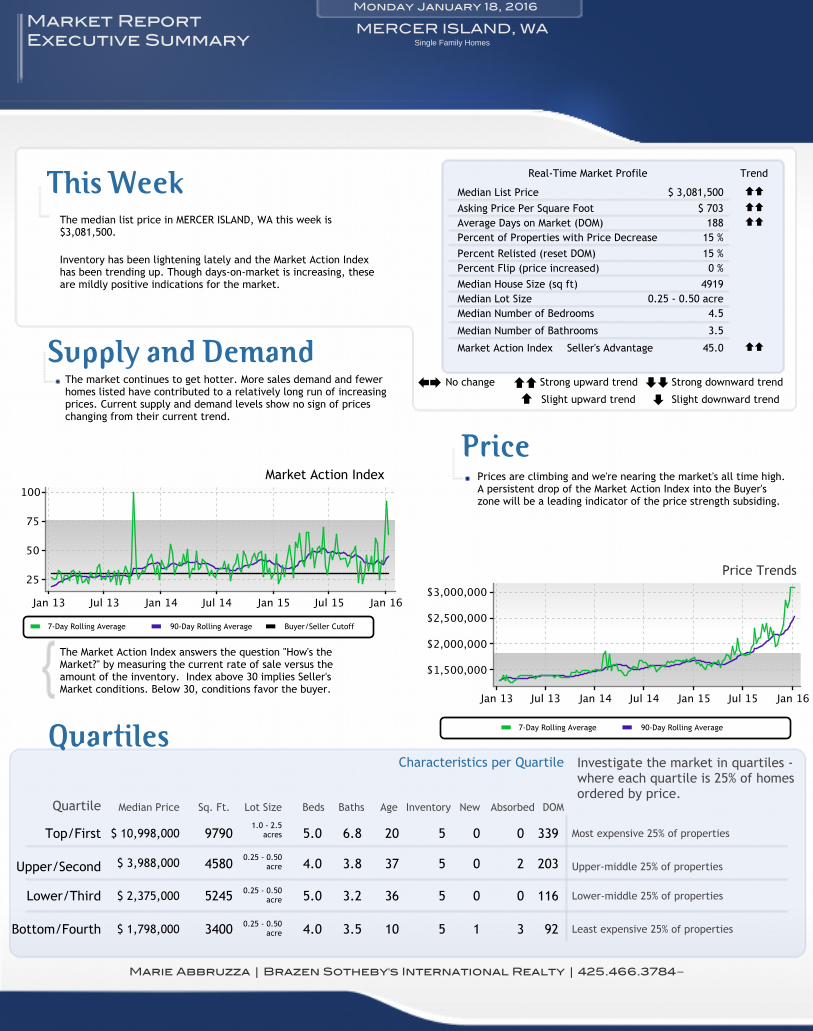
Prices are climbing and we're nearing the market's all time high.A persistent drop of the Market Action Index into the Buyer'szone will be a leading indicator of the price strength subsiding.
The market continues to get hotter. More sales demand and fewerhomes listed have contributed to a relatively long run of increasingprices. Current supply and demand levels show no sign of priceschanging from their current trend.
Inventory has been lightening lately and the Market Action Indexhas been trending up. Though days-on-market is increasing, theseare mildly positive indications for the market.
MERCER ISLAND, WAMarket ReportExecutive Summary
5
5245
3.5
Monday January 18, 2016
The median list price in MERCER ISLAND, WA this week is$3,081,500.
Investigate the market in quartiles -where each quartile is 25% of homesordered by price.
Most expensive 25% of properties
Upper-middle 25% of properties
Lower-middle 25% of properties
Least expensive 25% of properties
Quartile Median Price Lot Size Beds Baths Age Inventory New Absorbed DOMSq. Ft.
Marie Abbruzza | Brazen Sotheby's International Realty | 425.466.3784
No change Strong upward trend Strong downward trend
Slight upward trend Slight downward trend±+ == ≠≠
≠=
Powered by Altos Research LLC | www.altosresearch.com | Copyright ©2005-2014 Altos Research LLC
Single Family Homes
Median Lot Size
45.0
Percent Relisted (reset DOM)
4919
3.5
0 %
Median Number of Bathrooms
188
Median List Price
Average Days on Market (DOM)$ 703
Percent Flip (price increased)
0.25 - 0.50 acreMedian House Size (sq ft)
$ 3,081,500
15 %
4.5
Market Action Index
Median Number of Bedrooms
Asking Price Per Square Foot
15 %Percent of Properties with Price Decrease
Seller's Advantage
==
==
==
==
Bottom/Fourth
Lower/Third
Upper/Second
Top/First
This Week
Supply and Demand
Real-Time Market Profile Trend
Price
Price Trends
Market Action Index
The Market Action Index answers the question "How's theMarket?" by measuring the current rate of sale versus theamount of the inventory. Index above 30 implies Seller'sMarket conditions. Below 30, conditions favor the buyer.
QuartilesCharacteristics per Quartile
7-Day Rolling Average 90-Day Rolling Average Buyer/Seller Cutoff
7-Day Rolling Average 90-Day Rolling Average
6 12344
621.5 44
1.0
2
23
2.0 5
81
2
0
37
$ 255,000
2
3
5
2.8
02.2
825
4
$ 174,900
2.0
18
$ 392,000
3.0$ 667,000
14
1
1272
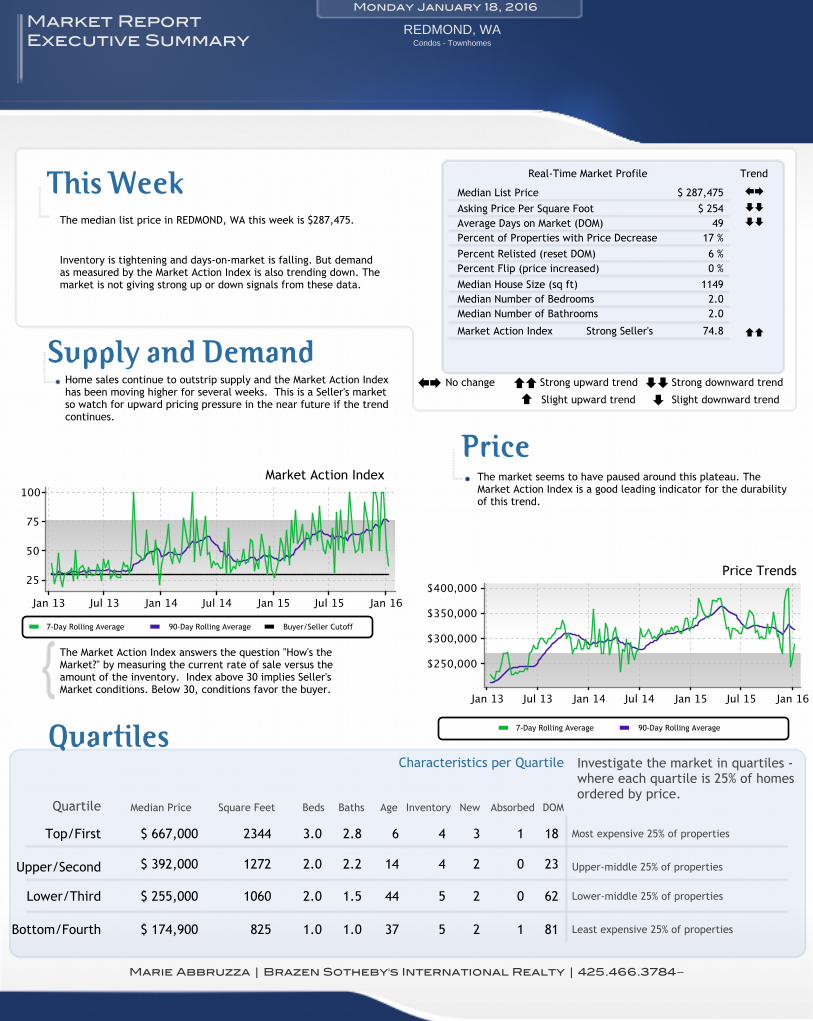
The market seems to have paused around this plateau. TheMarket Action Index is a good leading indicator for the durabilityof this trend.
Home sales continue to outstrip supply and the Market Action Indexhas been moving higher for several weeks. This is a Seller's marketso watch for upward pricing pressure in the near future if the trendcontinues.
Inventory is tightening and days-on-market is falling. But demandas measured by the Market Action Index is also trending down. Themarket is not giving strong up or down signals from these data.
REDMOND, WAMarket ReportExecutive Summary
4
1060
1.0
Monday January 18, 2016
The median list price in REDMOND, WA this week is $287,475.
Investigate the market in quartiles -where each quartile is 25% of homesordered by price.
Most expensive 25% of properties
Upper-middle 25% of properties
Lower-middle 25% of properties
Least expensive 25% of properties
Quartile Median Price Beds Baths Age Inventory New Absorbed DOMSquare Feet
Marie Abbruzza | Brazen Sotheby's International Realty | 425.466.3784
No change Strong upward trend Strong downward trend
Slight upward trend Slight downward trend±+ == ≠≠
≠=
Powered by Altos Research LLC | www.altosresearch.com | Copyright ©2005-2014 Altos Research LLC
Condos - Townhomes
74.8
Percent Relisted (reset DOM)
1149
2.0
0 %
Median Number of Bathrooms
49
Median List Price
Average Days on Market (DOM)$ 254
Percent Flip (price increased)Median House Size (sq ft)
$ 287,475
17 %
2.0
Market Action Index
Median Number of Bedrooms
Asking Price Per Square Foot
6 %Percent of Properties with Price Decrease
Strong Seller's
±+
≠≠
≠≠
==
Bottom/Fourth
Lower/Third
Upper/Second
Top/First
This Week
Supply and Demand
Real-Time Market Profile Trend
Price
Price Trends
Market Action Index
The Market Action Index answers the question "How's theMarket?" by measuring the current rate of sale versus theamount of the inventory. Index above 30 implies Seller'sMarket conditions. Below 30, conditions favor the buyer.
QuartilesCharacteristics per Quartile
90-Day Rolling Average7-Day Rolling Average Buyer/Seller Cutoff
90-Day Rolling Average7-Day Rolling Average
1 54146
252.5 11
3.0
8
40
4.0 17
44
4
6
8,001 -10,000 sqft
31
$ 800,000
4
5
17
3.5
8,001 -10,000 sqft
43.5
1640 8,001 -10,000 sqft
17
$ 489,000
5.0
89
6,501 -8,000 sqft$ 972,900
4.0$ 1,389,990
0
2
3477
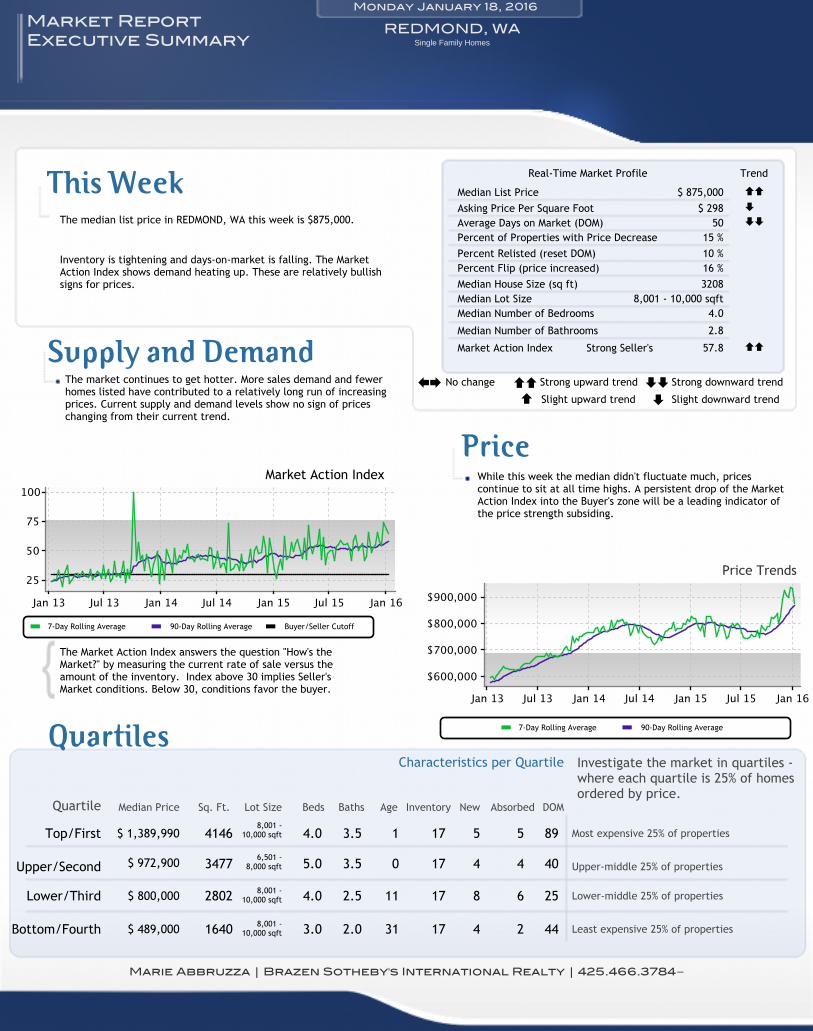
While this week the median didn't fluctuate much, pricescontinue to sit at all time highs. A persistent drop of the MarketAction Index into the Buyer's zone will be a leading indicator ofthe price strength subsiding.
The market continues to get hotter. More sales demand and fewerhomes listed have contributed to a relatively long run of increasingprices. Current supply and demand levels show no sign of priceschanging from their current trend.
Inventory is tightening and days-on-market is falling. The MarketAction Index shows demand heating up. These are relatively bullishsigns for prices.
REDMOND, WAMarket ReportExecutive Summary
17
2802
2.0
Monday January 18, 2016
The median list price in REDMOND, WA this week is $875,000.
Investigate the market in quartiles -where each quartile is 25% of homesordered by price.
Most expensive 25% of properties
Upper-middle 25% of properties
Lower-middle 25% of properties
Least expensive 25% of properties
Quartile Median Price Lot Size Beds Baths Age Inventory New Absorbed DOMSq. Ft.
Marie Abbruzza | Brazen Sotheby's International Realty | 425.466.3784
No change Strong upward trend Strong downward trend
Slight upward trend Slight downward trend±+ == ≠≠
≠=
Powered by Altos Research LLC | www.altosresearch.com | Copyright ©2005-2014 Altos Research LLC
Single Family Homes
Median Lot Size
57.8
Percent Relisted (reset DOM)
3208
2.8
16 %
Median Number of Bathrooms
50
Median List Price
Average Days on Market (DOM)$ 298
Percent Flip (price increased)
8,001 - 10,000 sqftMedian House Size (sq ft)
$ 875,000
15 %
4.0
Market Action Index
Median Number of Bedrooms
Asking Price Per Square Foot
10 %Percent of Properties with Price Decrease
Strong Seller's
==
≠
≠≠
==
Bottom/Fourth
Lower/Third
Upper/Second
Top/First
This Week
Supply and Demand
Real-Time Market Profile Trend
Price
Price Trends
Market Action Index
The Market Action Index answers the question "How's theMarket?" by measuring the current rate of sale versus theamount of the inventory. Index above 30 implies Seller'sMarket conditions. Below 30, conditions favor the buyer.
QuartilesCharacteristics per Quartile
7-Day Rolling Average 90-Day Rolling Average Buyer/Seller Cutoff
7-Day Rolling Average 90-Day Rolling Average
0 01888
02.6 16
1.5
2
4
2.5 2
91
1
1
16
$ 382,225
0
0
2
2.8
12.6
896
2
$ 226,250
2.5
21
$ 454,950
2.0$ 559,950
2
0
1556
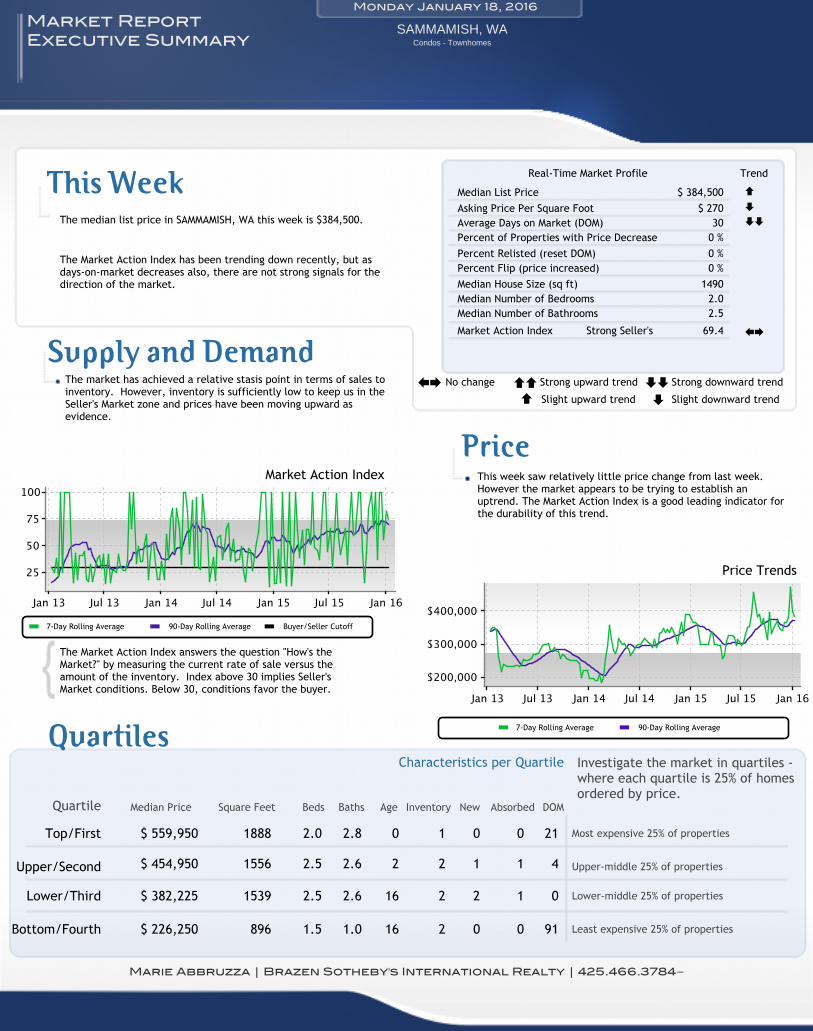
This week saw relatively little price change from last week.However the market appears to be trying to establish anuptrend. The Market Action Index is a good leading indicator forthe durability of this trend.
The market has achieved a relative stasis point in terms of sales toinventory. However, inventory is sufficiently low to keep us in theSeller's Market zone and prices have been moving upward asevidence.
The Market Action Index has been trending down recently, but asdays-on-market decreases also, there are not strong signals for thedirection of the market.
SAMMAMISH, WAMarket ReportExecutive Summary
1
1539
1.0
Monday January 18, 2016
The median list price in SAMMAMISH, WA this week is $384,500.
Investigate the market in quartiles -where each quartile is 25% of homesordered by price.
Most expensive 25% of properties
Upper-middle 25% of properties
Lower-middle 25% of properties
Least expensive 25% of properties
Quartile Median Price Beds Baths Age Inventory New Absorbed DOMSquare Feet
Marie Abbruzza | Brazen Sotheby's International Realty | 425.466.3784
No change Strong upward trend Strong downward trend
Slight upward trend Slight downward trend±+ == ≠≠
≠=
Powered by Altos Research LLC | www.altosresearch.com | Copyright ©2005-2014 Altos Research LLC
Condos - Townhomes
69.4
Percent Relisted (reset DOM)
1490
2.5
0 %
Median Number of Bathrooms
30
Median List Price
Average Days on Market (DOM)$ 270
Percent Flip (price increased)Median House Size (sq ft)
$ 384,500
0 %
2.0
Market Action Index
Median Number of Bedrooms
Asking Price Per Square Foot
0 %Percent of Properties with Price Decrease
Strong Seller's
=
≠
≠≠
±+
Bottom/Fourth
Lower/Third
Upper/Second
Top/First
This Week
Supply and Demand
Real-Time Market Profile Trend
Price
Price Trends
Market Action Index
The Market Action Index answers the question "How's theMarket?" by measuring the current rate of sale versus theamount of the inventory. Index above 30 implies Seller'sMarket conditions. Below 30, conditions favor the buyer.
QuartilesCharacteristics per Quartile
90-Day Rolling Average7-Day Rolling Average Buyer/Seller Cutoff
90-Day Rolling Average7-Day Rolling Average
8 34184
882.6 1
4.0
4
109
4.0 14
42
2
4
0.50 - 1.0acre
30
$ 809,972
5
2
14
4.2
4,501 -6,500 sqft
12.8
2415 6,501 -8,000 sqft
14
$ 709,501
4.0
101
4,501 -6,500 sqft$ 939,970
5.0$ 1,330,000
1
4
3502
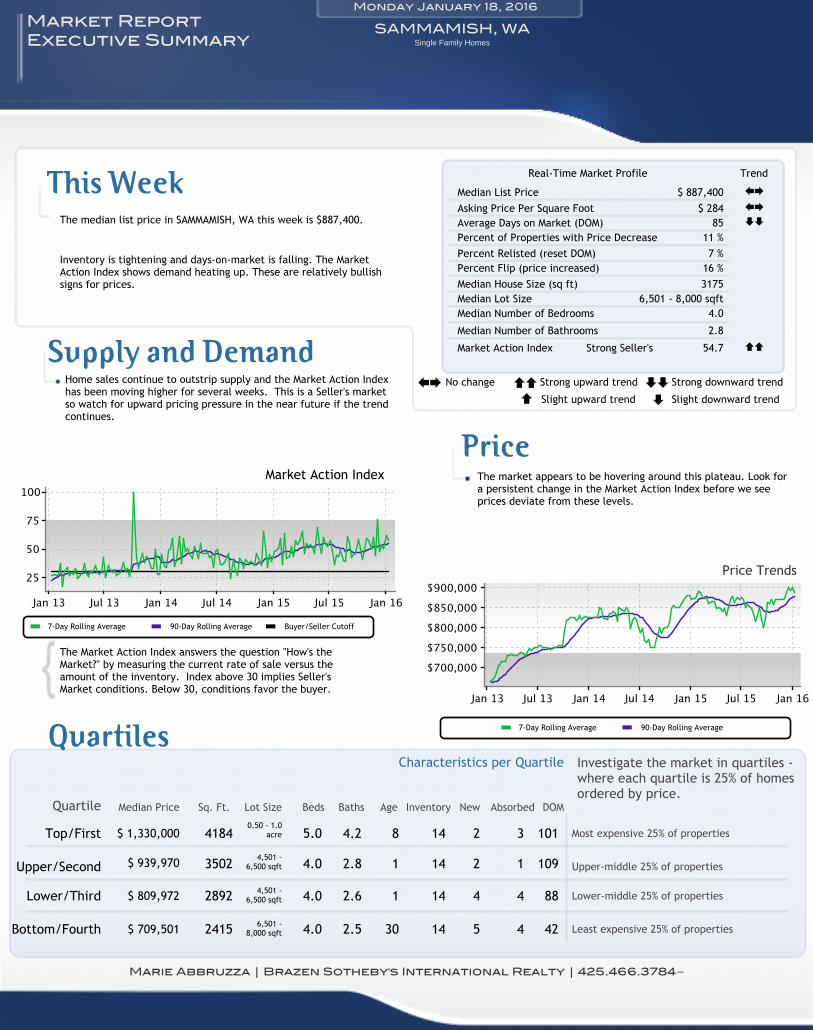
The market appears to be hovering around this plateau. Look fora persistent change in the Market Action Index before we seeprices deviate from these levels.
Home sales continue to outstrip supply and the Market Action Indexhas been moving higher for several weeks. This is a Seller's marketso watch for upward pricing pressure in the near future if the trendcontinues.
Inventory is tightening and days-on-market is falling. The MarketAction Index shows demand heating up. These are relatively bullishsigns for prices.
SAMMAMISH, WAMarket ReportExecutive Summary
14
2892
2.5
Monday January 18, 2016
The median list price in SAMMAMISH, WA this week is $887,400.
Investigate the market in quartiles -where each quartile is 25% of homesordered by price.
Most expensive 25% of properties
Upper-middle 25% of properties
Lower-middle 25% of properties
Least expensive 25% of properties
Quartile Median Price Lot Size Beds Baths Age Inventory New Absorbed DOMSq. Ft.
Marie Abbruzza | Brazen Sotheby's International Realty | 425.466.3784
No change Strong upward trend Strong downward trend
Slight upward trend Slight downward trend±+ == ≠≠
≠=
Powered by Altos Research LLC | www.altosresearch.com | Copyright ©2005-2014 Altos Research LLC
Single Family Homes
Median Lot Size
54.7
Percent Relisted (reset DOM)
3175
2.8
16 %
Median Number of Bathrooms
85
Median List Price
Average Days on Market (DOM)$ 284
Percent Flip (price increased)
6,501 - 8,000 sqftMedian House Size (sq ft)
$ 887,400
11 %
4.0
Market Action Index
Median Number of Bedrooms
Asking Price Per Square Foot
7 %Percent of Properties with Price Decrease
Strong Seller's
±+
±+
≠≠
==
Bottom/Fourth
Lower/Third
Upper/Second
Top/First
This Week
Supply and Demand
Real-Time Market Profile Trend
Price
Price Trends
Market Action Index
The Market Action Index answers the question "How's theMarket?" by measuring the current rate of sale versus theamount of the inventory. Index above 30 implies Seller'sMarket conditions. Below 30, conditions favor the buyer.
QuartilesCharacteristics per Quartile
7-Day Rolling Average 90-Day Rolling Average Buyer/Seller Cutoff
7-Day Rolling Average 90-Day Rolling Average
15 51964
551.5 15
2.0
25
91
2.0 86
55
18
18
36
$ 425,000
27
6
86
2.0
81.8
877
86
$ 225,000
2.0
163
$ 627,475
2.0$ 1,091,500
2
16
1382
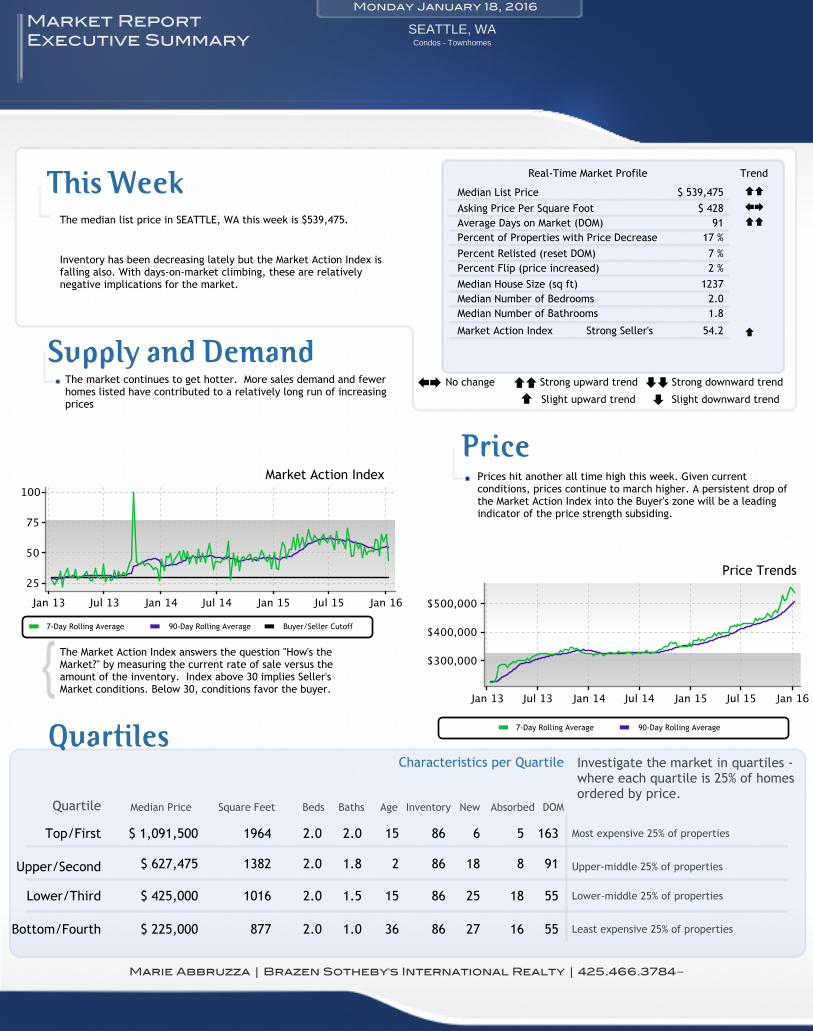
Prices hit another all time high this week. Given currentconditions, prices continue to march higher. A persistent drop ofthe Market Action Index into the Buyer's zone will be a leadingindicator of the price strength subsiding.
The market continues to get hotter. More sales demand and fewerhomes listed have contributed to a relatively long run of increasingprices
Inventory has been decreasing lately but the Market Action Index isfalling also. With days-on-market climbing, these are relativelynegative implications for the market.
SEATTLE, WAMarket ReportExecutive Summary
86
1016
1.0
Monday January 18, 2016
The median list price in SEATTLE, WA this week is $539,475.
Investigate the market in quartiles -where each quartile is 25% of homesordered by price.
Most expensive 25% of properties
Upper-middle 25% of properties
Lower-middle 25% of properties
Least expensive 25% of properties
Quartile Median Price Beds Baths Age Inventory New Absorbed DOMSquare Feet
Marie Abbruzza | Brazen Sotheby's International Realty | 425.466.3784
No change Strong upward trend Strong downward trend
Slight upward trend Slight downward trend±+ == ≠≠
≠=
Powered by Altos Research LLC | www.altosresearch.com | Copyright ©2005-2014 Altos Research LLC
Condos - Townhomes
54.2
Percent Relisted (reset DOM)
1237
1.8
2 %
Median Number of Bathrooms
91
Median List Price
Average Days on Market (DOM)$ 428
Percent Flip (price increased)Median House Size (sq ft)
$ 539,475
17 %
2.0
Market Action Index
Median Number of Bedrooms
Asking Price Per Square Foot
7 %Percent of Properties with Price Decrease
Strong Seller's
==
±+
==
=
Bottom/Fourth
Lower/Third
Upper/Second
Top/First
This Week
Supply and Demand
Real-Time Market Profile Trend
Price
Price Trends
Market Action Index
The Market Action Index answers the question "How's theMarket?" by measuring the current rate of sale versus theamount of the inventory. Index above 30 implies Seller'sMarket conditions. Below 30, conditions favor the buyer.
QuartilesCharacteristics per Quartile
90-Day Rolling Average7-Day Rolling Average Buyer/Seller Cutoff
90-Day Rolling Average7-Day Rolling Average
32 103867
662.0 60
3.0
39
74
4.0 148
67
42
21
8,001 -10,000 sqft
63
$ 460,000
40
18
148
3.4
6,501 -8,000 sqft
162.5
1360 6,501 -8,000 sqft
148
$ 289,000
4.0
151
6,501 -8,000 sqft$ 725,000
4.0$ 1,625,000
54
31
2460
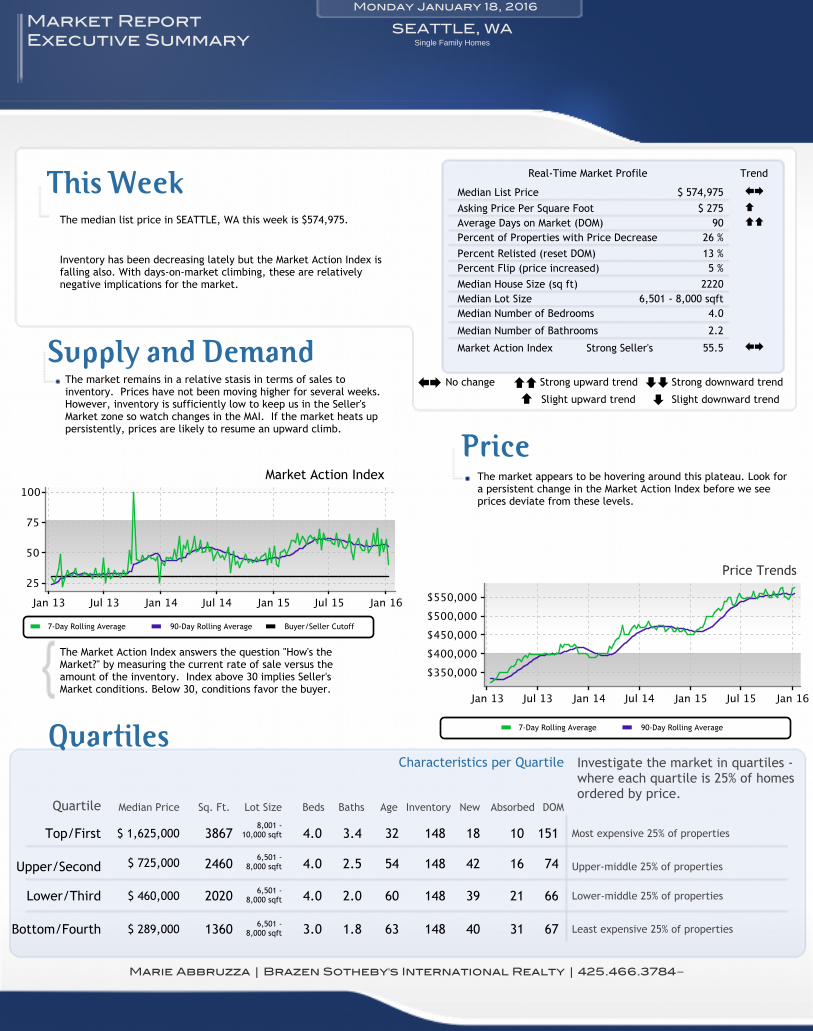
The market appears to be hovering around this plateau. Look fora persistent change in the Market Action Index before we seeprices deviate from these levels.
The market remains in a relative stasis in terms of sales toinventory. Prices have not been moving higher for several weeks.However, inventory is sufficiently low to keep us in the Seller'sMarket zone so watch changes in the MAI. If the market heats uppersistently, prices are likely to resume an upward climb.
Inventory has been decreasing lately but the Market Action Index isfalling also. With days-on-market climbing, these are relativelynegative implications for the market.
SEATTLE, WAMarket ReportExecutive Summary
148
2020
1.8
Monday January 18, 2016
The median list price in SEATTLE, WA this week is $574,975.
Investigate the market in quartiles -where each quartile is 25% of homesordered by price.
Most expensive 25% of properties
Upper-middle 25% of properties
Lower-middle 25% of properties
Least expensive 25% of properties
Quartile Median Price Lot Size Beds Baths Age Inventory New Absorbed DOMSq. Ft.
Marie Abbruzza | Brazen Sotheby's International Realty | 425.466.3784
No change Strong upward trend Strong downward trend
Slight upward trend Slight downward trend±+ == ≠≠
≠=
Powered by Altos Research LLC | www.altosresearch.com | Copyright ©2005-2014 Altos Research LLC
Single Family Homes
Median Lot Size
55.5
Percent Relisted (reset DOM)
2220
2.2
5 %
Median Number of Bathrooms
90
Median List Price
Average Days on Market (DOM)$ 275
Percent Flip (price increased)
6,501 - 8,000 sqftMedian House Size (sq ft)
$ 574,975
26 %
4.0
Market Action Index
Median Number of Bedrooms
Asking Price Per Square Foot
13 %Percent of Properties with Price Decrease
Strong Seller's
±+
=
==
±+
Bottom/Fourth
Lower/Third
Upper/Second
Top/First
This Week
Supply and Demand
Real-Time Market Profile Trend
Price
Price Trends
Market Action Index
The Market Action Index answers the question "How's theMarket?" by measuring the current rate of sale versus theamount of the inventory. Index above 30 implies Seller'sMarket conditions. Below 30, conditions favor the buyer.
QuartilesCharacteristics per Quartile
7-Day Rolling Average 90-Day Rolling Average Buyer/Seller Cutoff
7-Day Rolling Average 90-Day Rolling Average
20 04872
952.8 11
3.5
3
78
4.0 13
94
0
2
2.5 - 5.0acres
39
$ 799,990
1
3
13
4.2
0.25 - 0.50acre
12.6
1980 0.50 - 1.0acre
12
$ 375,000
4.0
141
1.0 - 2.5acres$ 877,495
4.0$ 1,589,950
25
0
3489
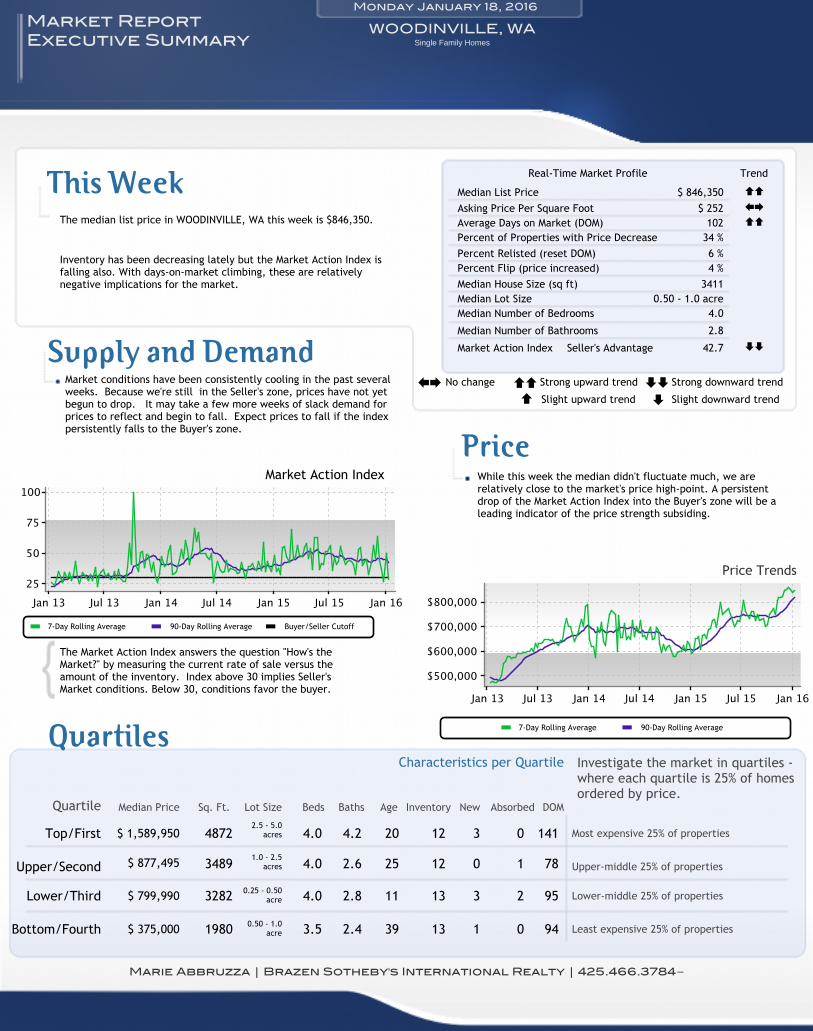
While this week the median didn't fluctuate much, we arerelatively close to the market's price high-point. A persistentdrop of the Market Action Index into the Buyer's zone will be aleading indicator of the price strength subsiding.
Market conditions have been consistently cooling in the past severalweeks. Because we're still in the Seller's zone, prices have not yetbegun to drop. It may take a few more weeks of slack demand forprices to reflect and begin to fall. Expect prices to fall if the indexpersistently falls to the Buyer's zone.
Inventory has been decreasing lately but the Market Action Index isfalling also. With days-on-market climbing, these are relativelynegative implications for the market.
WOODINVILLE, WAMarket ReportExecutive Summary
12
3282
2.4
Monday January 18, 2016
The median list price in WOODINVILLE, WA this week is $846,350.
Investigate the market in quartiles -where each quartile is 25% of homesordered by price.
Most expensive 25% of properties
Upper-middle 25% of properties
Lower-middle 25% of properties
Least expensive 25% of properties
Quartile Median Price Lot Size Beds Baths Age Inventory New Absorbed DOMSq. Ft.
Marie Abbruzza | Brazen Sotheby's International Realty | 425.466.3784
No change Strong upward trend Strong downward trend
Slight upward trend Slight downward trend±+ == ≠≠
≠=
Powered by Altos Research LLC | www.altosresearch.com | Copyright ©2005-2014 Altos Research LLC
Single Family Homes
Median Lot Size
42.7
Percent Relisted (reset DOM)
3411
2.8
4 %
Median Number of Bathrooms
102
Median List Price
Average Days on Market (DOM)$ 252
Percent Flip (price increased)
0.50 - 1.0 acreMedian House Size (sq ft)
$ 846,350
34 %
4.0
Market Action Index
Median Number of Bedrooms
Asking Price Per Square Foot
6 %Percent of Properties with Price Decrease
Seller's Advantage
==
±+
==
≠≠
Bottom/Fourth
Lower/Third
Upper/Second
Top/First
This Week
Supply and Demand
Real-Time Market Profile Trend
Price
Price Trends
Market Action Index
The Market Action Index answers the question "How's theMarket?" by measuring the current rate of sale versus theamount of the inventory. Index above 30 implies Seller'sMarket conditions. Below 30, conditions favor the buyer.
QuartilesCharacteristics per Quartile
7-Day Rolling Average 90-Day Rolling Average Buyer/Seller Cutoff
7-Day Rolling Average 90-Day Rolling Average