Embed Size (px)
Citation preview
All Colleges Basic Skills Report
2013 - 2018
Prepared by: SDCCD Office of Institutional Research and Planning
July 2018
Table of Contents Overview of the Basic Skills Report 2018 ....................................................................................1
Listing of Basic Skills Courses Included in the Basic Skills Report 2018 ....................................2
Placement Levels and Corresponding Outcomes ..........................................................................3
Part I: Placement of First-Time Students ......................................................................................4
Subject Placement Trends .................................................................................................6
Part II: Term Enrollments ..............................................................................................................7
Course Enrollments ...........................................................................................................9
Subject Enrollments by Ethnicity ......................................................................................11
Part III: Persistence .......................................................................................................................12
Overall Persistence ............................................................................................................14
Persistence by Gender .......................................................................................................14
Persistence by Ethnicity ....................................................................................................15
Persistence by Age ............................................................................................................15
Part IV: Student Outcomes: Retention and Success ......................................................................16
Course Retention Rates .....................................................................................................18
Subject Retention Rates by Ethnicity ................................................................................19
Course Success Rates ........................................................................................................20
Subject Success Rates by Ethnicity ...................................................................................21
Overview of the Basic Skills Report
This report on students enrolled in Basic Skills courses provides information for the college Basic
Skills committees, faculty, student support staff, college leaders, and managers. The information in
the report is useful for program and services planning and improvement decisions by the colleges.
The report contains information on Basic Skills student placement, enrollment, persistence, and
student outcomes (i.e., retention and success). The key questions that this report will serve to answer
are:
1. What proportion of incoming students place into Basic Skills courses?
2. How has the number of enrollments in Basic Skills courses changed over the past five years?
3. What is the persistence rate of students in Basic Skills courses?
4. How well do students perform in their Basic Skills courses?
Whenever possible, these research questions are examined with respect to ethnicity, as well as
longitudinal trends, and benchmarked for comparison purposes.
The target group of students for this report is consistent with the Basic Skills definition provided by
the California Community College Chancellor’s Office as of 2007/08:
Basic skills courses are those courses in reading, writing, math, computation, learning skills,
study skills, and English as a Second Language, which are designated by the community
college district as non-transferrable and non-degree applicable courses.
For the San Diego Community College District (SDCCD), this includes English 031, 042, 043,
047A, 048, 049, and LCOM101; Math 034A, 038, 046, and 047A; and all ESOL courses.
For benchmarking purposes, the college-level reports include five-year averages and may be
compared with the All Colleges data. The All Colleges data include Basic Skills courses from all
three colleges (City, Mesa, and Miramar), and may be used as a point of reference for each college.
_______________________________________________________________________________All Colleges Basic Skills Report 2018
SDCCD Office of Institutional Research and Planning 1
Listing of Basic Skills Courses Included in the Basic Skills Report
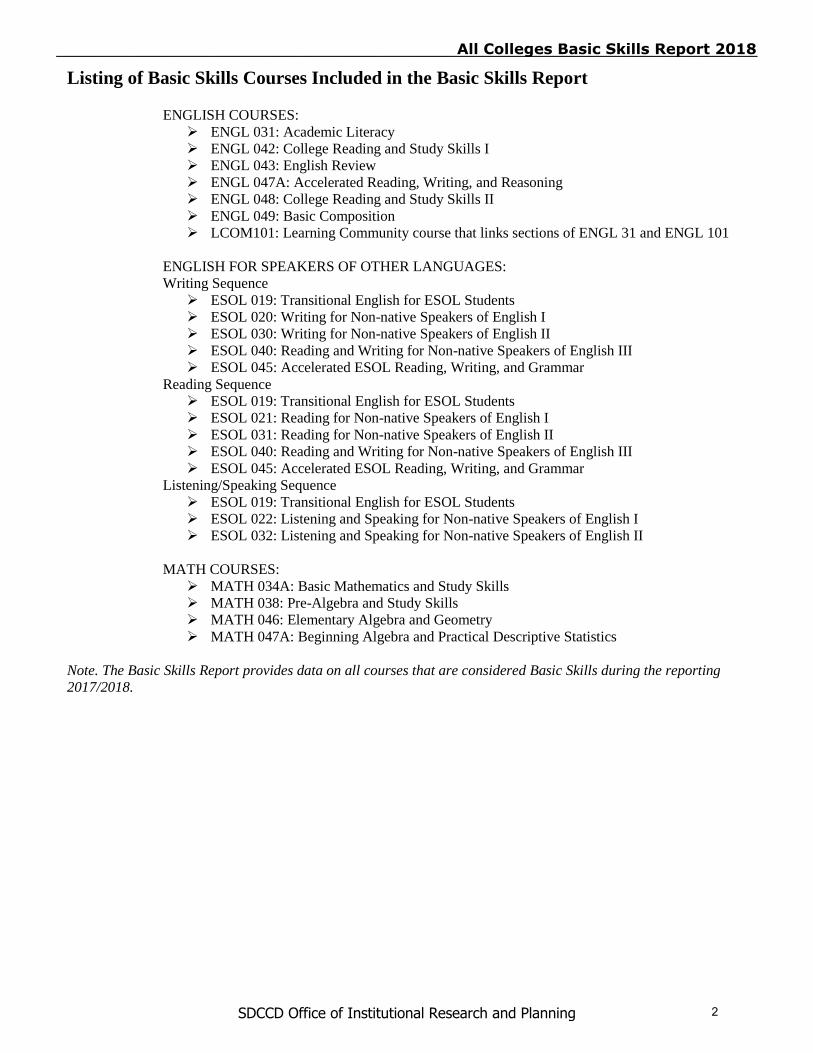
ENGLISH COURSES:
ENGL 031: Academic Literacy
ENGL 042: College Reading and Study Skills I
ENGL 043: English Review
ENGL 047A: Accelerated Reading, Writing, and Reasoning
ENGL 048: College Reading and Study Skills II
ENGL 049: Basic Composition
LCOM101: Learning Community course that links sections of ENGL 31 and ENGL 101
ENGLISH FOR SPEAKERS OF OTHER LANGUAGES:
Writing Sequence
ESOL 019: Transitional English for ESOL Students
ESOL 020: Writing for Non-native Speakers of English I
ESOL 030: Writing for Non-native Speakers of English II
ESOL 040: Reading and Writing for Non-native Speakers of English III
ESOL 045: Accelerated ESOL Reading, Writing, and Grammar
Reading Sequence
ESOL 019: Transitional English for ESOL Students
ESOL 021: Reading for Non-native Speakers of English I
ESOL 031: Reading for Non-native Speakers of English II
ESOL 040: Reading and Writing for Non-native Speakers of English III
ESOL 045: Accelerated ESOL Reading, Writing, and Grammar
Listening/Speaking Sequence
ESOL 019: Transitional English for ESOL Students
ESOL 022: Listening and Speaking for Non-native Speakers of English I
ESOL 032: Listening and Speaking for Non-native Speakers of English II
MATH COURSES:
MATH 034A: Basic Mathematics and Study Skills
MATH 038: Pre-Algebra and Study Skills
MATH 046: Elementary Algebra and Geometry
MATH 047A: Beginning Algebra and Practical Descriptive Statistics
Note. The Basic Skills Report provides data on all courses that are considered Basic Skills during the reporting
2017/2018.
_______________________________________________________________________________All Colleges Basic Skills Report 2018
SDCCD Office of Institutional Research and Planning 2
Placement Levels and Corresponding Outcomes
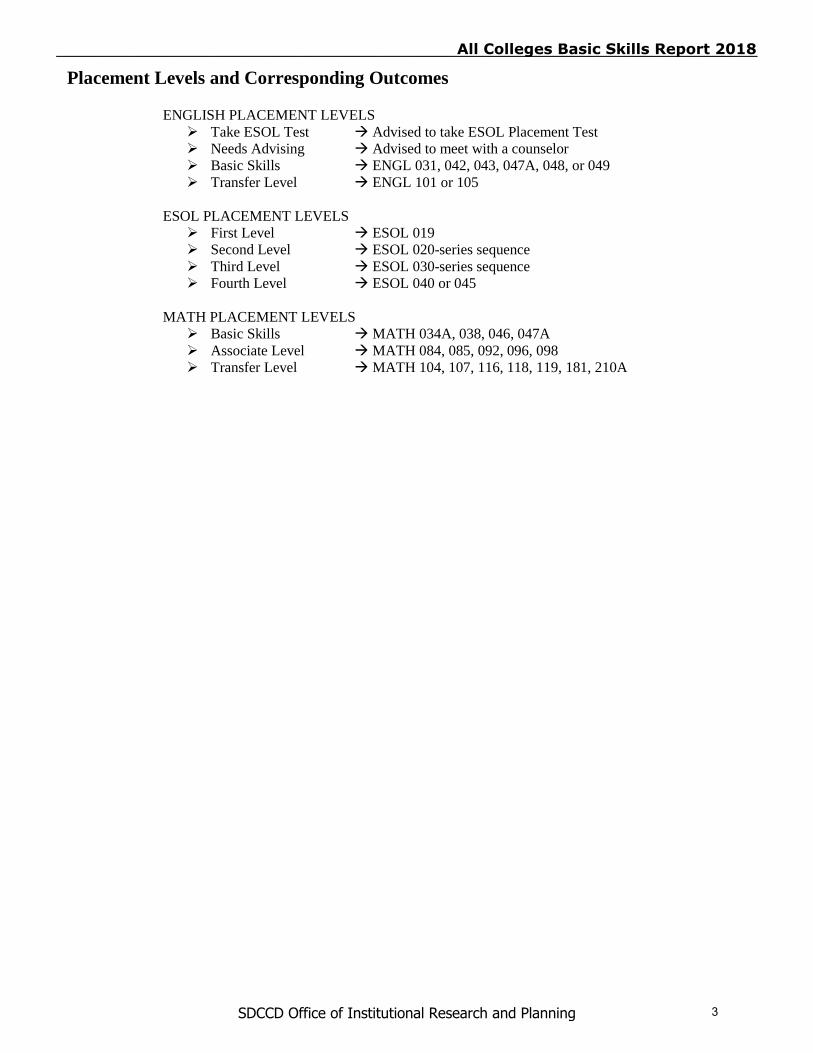
ENGLISH PLACEMENT LEVELS
Take ESOL Test Advised to take ESOL Placement Test
Needs Advising Advised to meet with a counselor
Basic Skills ENGL 031, 042, 043, 047A, 048, or 049
Transfer Level ENGL 101 or 105
ESOL PLACEMENT LEVELS
First Level ESOL 019
Second Level ESOL 020-series sequence
Third Level ESOL 030-series sequence
Fourth Level ESOL 040 or 045
MATH PLACEMENT LEVELS
Basic Skills MATH 034A, 038, 046, 047A
Associate Level MATH 084, 085, 092, 096, 098
Transfer Level MATH 104, 107, 116, 118, 119, 181, 210A
_______________________________________________________________________________All Colleges Basic Skills Report 2018
SDCCD Office of Institutional Research and Planning 3

Placement of First-Time Students
4
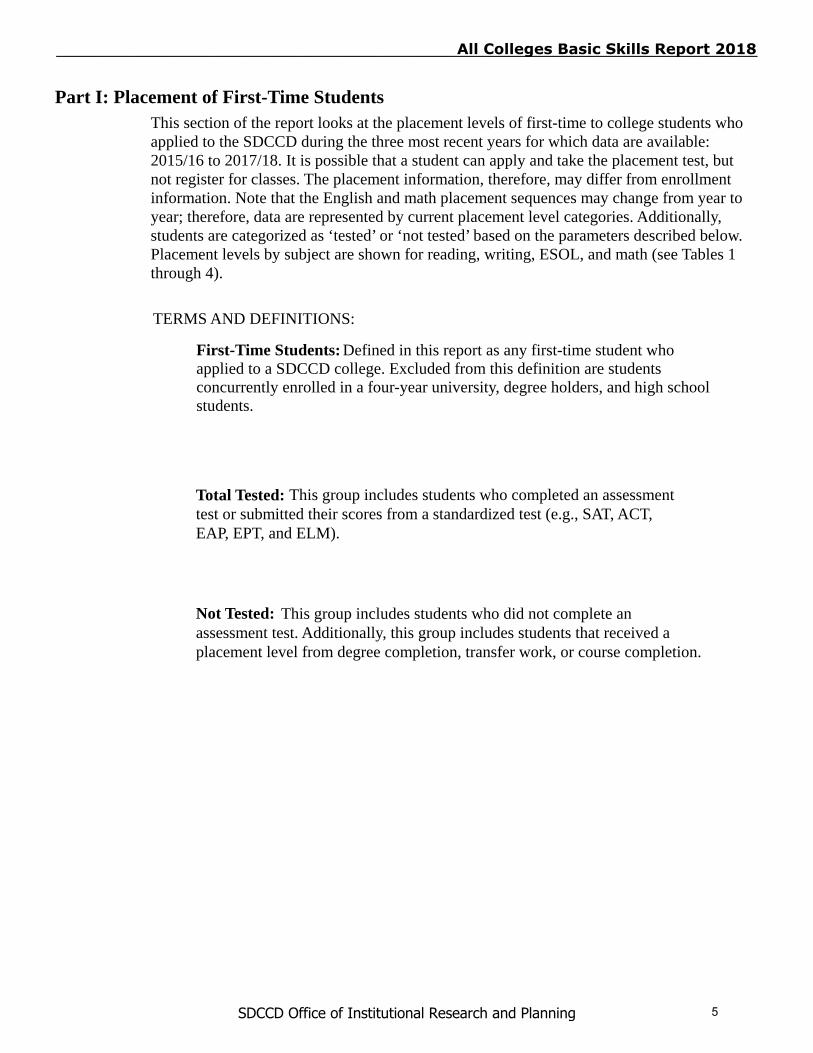
This group includes students who did not complete an assessment test. Additionally, this group includes students that received a placement level from degree completion, transfer work, or course completion.
Part I: Placement of First-Time StudentsThis section of the report looks at the placement levels of first-time to college students who applied to the SDCCD during the three most recent years for which data are available: 2015/16 to 2017/18. It is possible that a student can apply and take the placement test, but not register for classes. The placement information, therefore, may differ from enrollment information. Note that the English and math placement sequences may change from year to year; therefore, data are represented by current placement level categories. Additionally, students are categorized as ‘tested’ or ‘not tested’ based on the parameters described below. Placement levels by subject are shown for reading, writing, ESOL, and math (see Tables 1 through 4).
TERMS AND DEFINITIONS:
Defined in this report as any first-time student who applied to a SDCCD college. Excluded from this definition are students concurrently enrolled in a four-year university, degree holders, and high school students.
First-Time Students:
Total Tested: This group includes students who completed an assessment test or submitted their scores from a standardized test (e.g., SAT, ACT, EAP, EPT, and ELM).
Not Tested:
_______________________________________________________________________________All Colleges Basic Skills Report 2018
SDCCD Office of Institutional Research and Planning 5
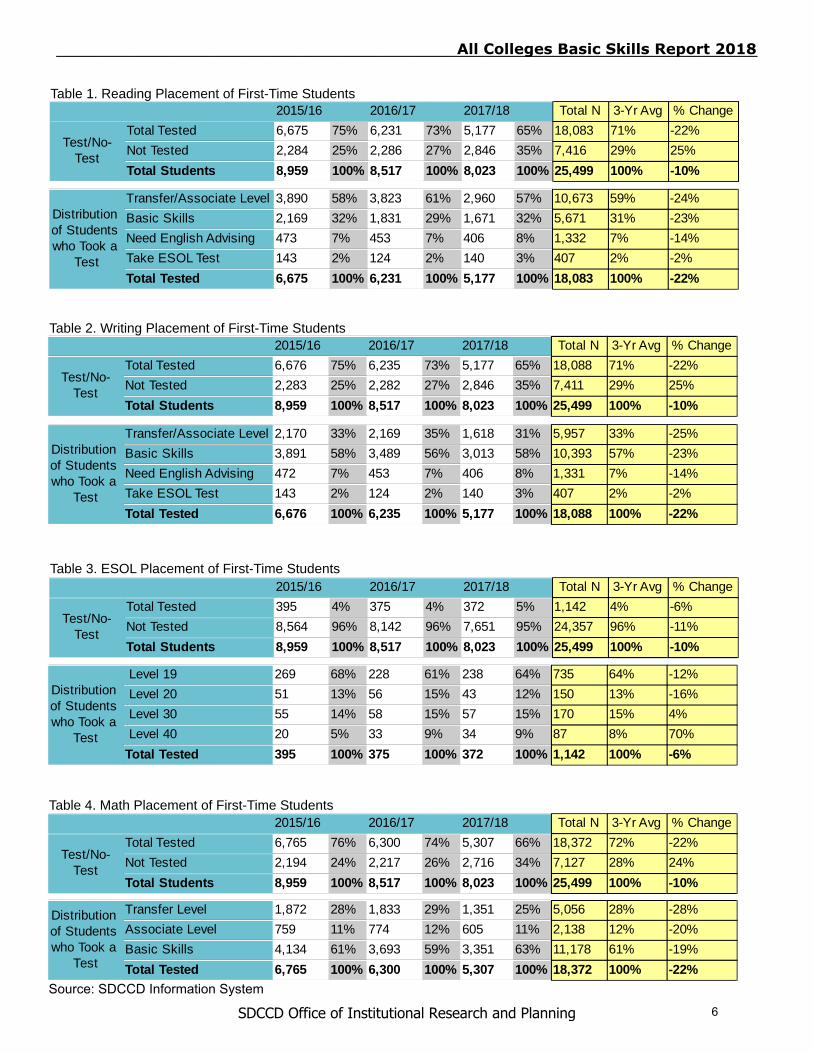
Table 1. Reading Placement of First-Time Students
Space Read_Orig1 2015/16 2015/12016/17 2016/12017/18 2017/1 Total N 3-Yr Avg % Change
Distribution of Students who Took a
Test
Transfer/Associate Level
Basic Skills
Need English Advising
Take ESOL Test
Total Tested
3,890 58% 3,823 61% 2,960 57% 10,673 59% -24%
2,169 32% 1,831 29% 1,671 32% 5,671 31% -23%
473 7% 453 7% 406 8% 1,332 7% -14%
143 2% 124 2% 140 3% 407 2% -2%
6,675 100% 6,231 100% 5,177 100% 18,083 100% -22%
Table 2. Writing Placement of First-Time Students
Space Writ_Orig1 2015/16 2015/12016/17 2016/12017/18 2017/1 Total N 3-Yr Avg % Change
Distribution of Students who Took a
Test
Transfer/Associate Level
Basic Skills
Need English Advising
Take ESOL Test
Total Tested
2,170 33% 2,169 35% 1,618 31% 5,957 33% -25%
3,891 58% 3,489 56% 3,013 58% 10,393 57% -23%
472 7% 453 7% 406 8% 1,331 7% -14%
143 2% 124 2% 140 3% 407 2% -2%
6,676 100% 6,235 100% 5,177 100% 18,088 100% -22%
Table 3. ESOL Placement of First-Time Students
Space Esol_Orig1 2015/16 2015/12016/17 2016/12017/18 2017/1 Total N 3-Yr Avg % Change
Distribution of Students who Took a
Test
Level 19
Level 20
Level 30
Level 40
Total Tested
269 68% 228 61% 238 64% 735 64% -12%
51 13% 56 15% 43 12% 150 13% -16%
55 14% 58 15% 57 15% 170 15% 4%
20 5% 33 9% 34 9% 87 8% 70%
395 100% 375 100% 372 100% 1,142 100% -6%
Space Math_Orig1 2015/16 2015/12016/17 2016/12017/18 2017/1 Total N 3-Yr Avg % Change
Distribution of Students who Took a
Test
Transfer Level
Associate Level
Basic Skills
Total Tested
1,872 28% 1,833 29% 1,351 25% 5,056 28% -28%
759 11% 774 12% 605 11% 2,138 12% -20%
4,134 61% 3,693 59% 3,351 63% 11,178 61% -19%
6,765 100% 6,300 100% 5,307 100% 18,372 100% -22%
Table 4. Math Placement of First-Time Students
Space Read_Orig2 2015/16 2015/12016/17 2016/12017/18 2017/1 Total N 3-Yr Avg % Change
Test/No-Test
Total Tested
Not Tested
Total Students
6,675 75% 6,231 73% 5,177 65% 18,083 71% -22%
2,284 25% 2,286 27% 2,846 35% 7,416 29% 25%
8,959 100% 8,517 100% 8,023 100% 25,499 100% -10%
Space Writ_Orig2 2015/16 2015/12016/17 2016/12017/18 2017/1 Total N 3-Yr Avg % Change
Test/No-Test
Total Tested
Not Tested
Total Students
6,676 75% 6,235 73% 5,177 65% 18,088 71% -22%
2,283 25% 2,282 27% 2,846 35% 7,411 29% 25%
8,959 100% 8,517 100% 8,023 100% 25,499 100% -10%
Space Esol_Orig2 2015/16 2015/12016/17 2016/12017/18 2017/1 Total N 3-Yr Avg % Change
Test/No-Test
Total Tested
Not Tested
Total Students
395 4% 375 4% 372 5% 1,142 4% -6%
8,564 96% 8,142 96% 7,651 95% 24,357 96% -11%
8,959 100% 8,517 100% 8,023 100% 25,499 100% -10%
Space Math_Orig2 2015/16 2015/12016/17 2016/12017/18 2017/1 Total N 3-Yr Avg % Change
Test/No-Test
Total Tested
Not Tested
Total Students
6,765 76% 6,300 74% 5,307 66% 18,372 72% -22%
2,194 24% 2,217 26% 2,716 34% 7,127 28% 24%
8,959 100% 8,517 100% 8,023 100% 25,499 100% -10%
_______________________________________________________________________________All Colleges Basic Skills Report 2018
SDCCD Office of Institutional Research and Planning 6
Source: SDCCD Information System

Term Enrollments
7
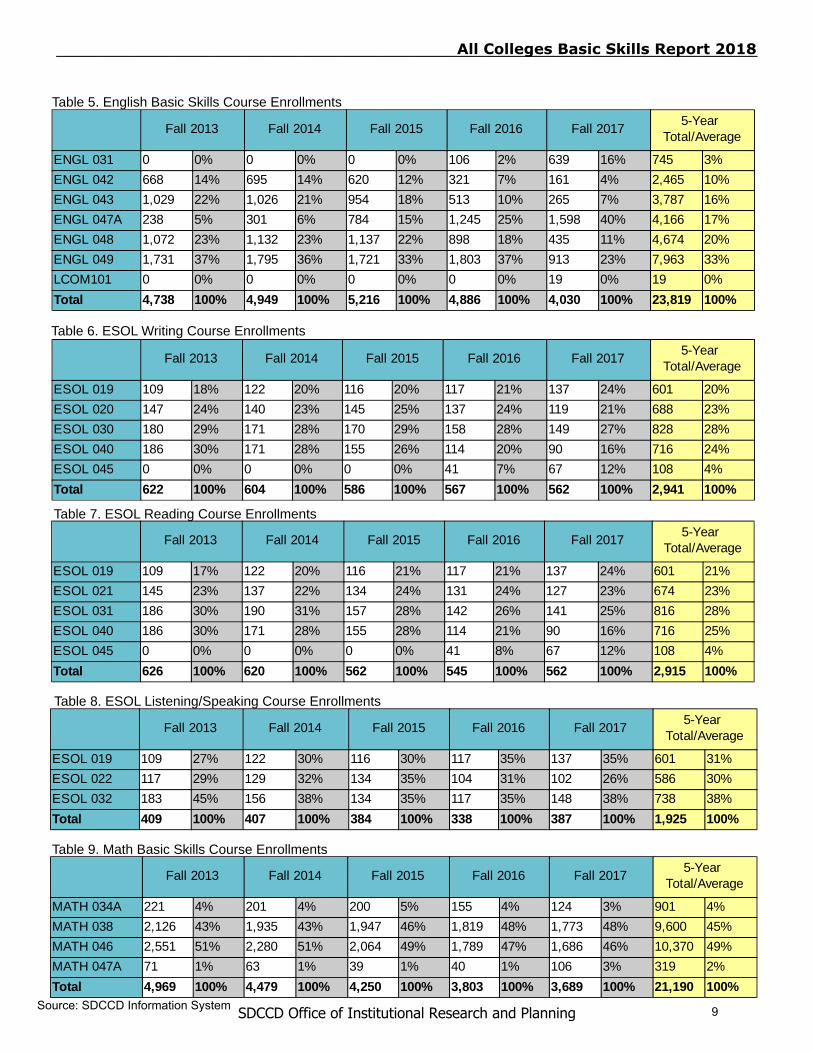
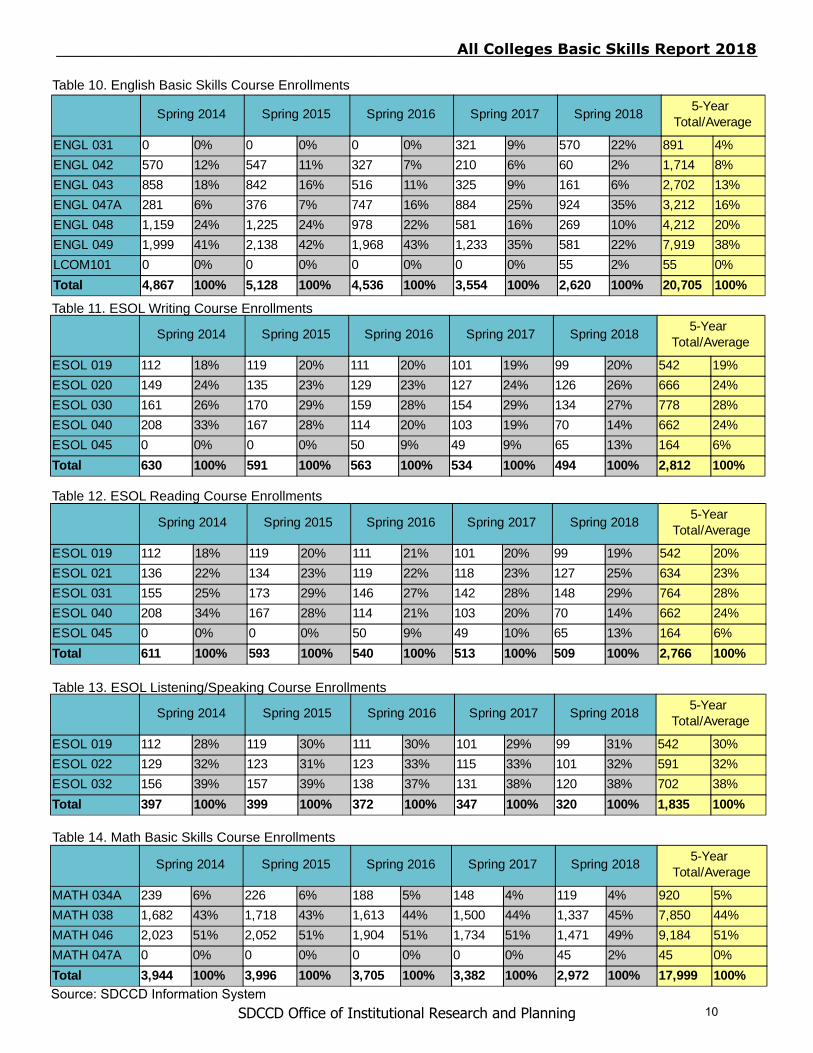
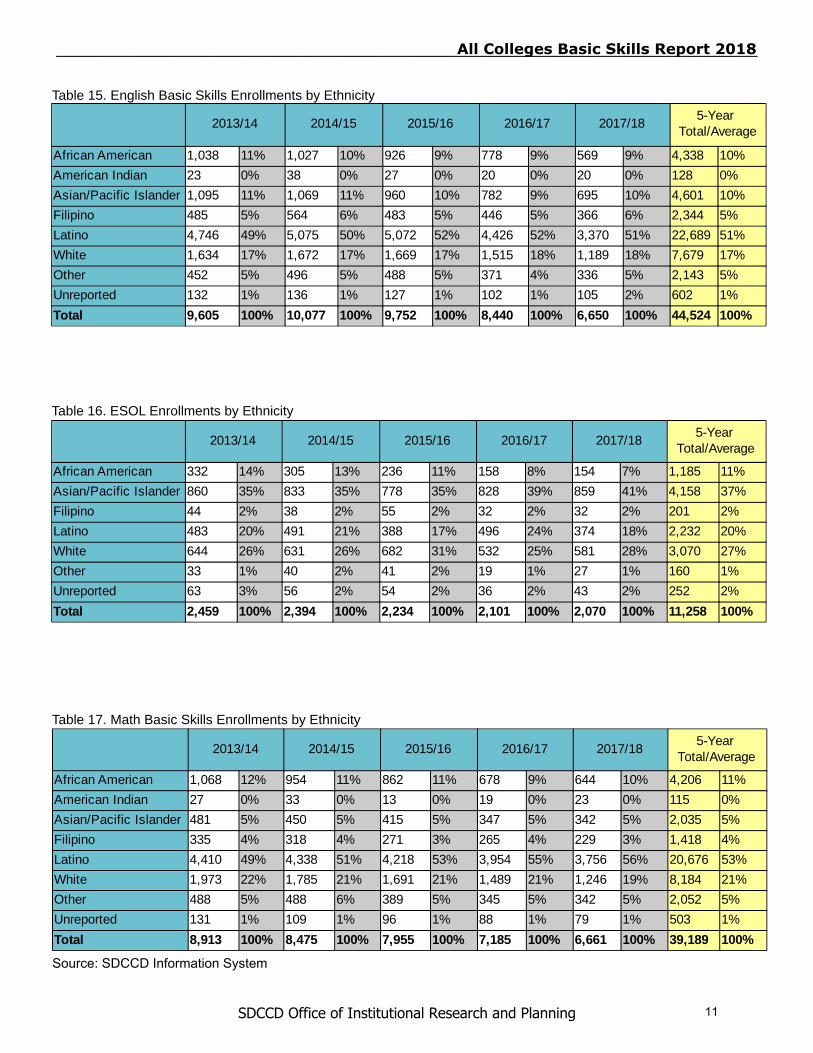
This section of the report summarizes enrollments in Basic Skills courses during the fall and spring terms of the five most recent years for which data are available: Fall 2013 to Spring 2018. Enrollments are shown by subject for each course, with fall and spring terms reported separately (see Tables 5 through 14). Enrollments are also displayed in tabular form for each subject by ethnicity (see Tables 15 through 17).
Part II: Term Enrollments
_______________________________________________________________________________All Colleges Basic Skills Report 2018
SDCCD Office of Institutional Research and Planning 8
BS_subnumFall 2013 Fall 2014 Fall 2015 Fall 2016 Fall 2017
5-Year Total/Average
ENGL 031
ENGL 042
ENGL 043
ENGL 047A
ENGL 048
ENGL 049
LCOM101
Total
0 0% 0 0% 0 0% 106 2% 639 16% 745 3%
668 14% 695 14% 620 12% 321 7% 161 4% 2,465 10%
1,029 22% 1,026 21% 954 18% 513 10% 265 7% 3,787 16%
238 5% 301 6% 784 15% 1,245 25% 1,598 40% 4,166 17%
1,072 23% 1,132 23% 1,137 22% 898 18% 435 11% 4,674 20%
1,731 37% 1,795 36% 1,721 33% 1,803 37% 913 23% 7,963 33%
0 0% 0 0% 0 0% 0 0% 19 0% 19 0%
4,738 100% 4,949 100% 5,216 100% 4,886 100% 4,030 100% 23,819 100%
BS_subnumFall 2013 Fall 2014 Fall 2015 Fall 2016 Fall 2017
5-Year Total/Average
ESOL 019
ESOL 020
ESOL 030
ESOL 040
ESOL 045
Total
109 18% 122 20% 116 20% 117 21% 137 24% 601 20%
147 24% 140 23% 145 25% 137 24% 119 21% 688 23%
180 29% 171 28% 170 29% 158 28% 149 27% 828 28%
186 30% 171 28% 155 26% 114 20% 90 16% 716 24%
0 0% 0 0% 0 0% 41 7% 67 12% 108 4%
622 100% 604 100% 586 100% 567 100% 562 100% 2,941 100%
BS_subnumFall 2013 Fall 2014 Fall 2015 Fall 2016 Fall 2017
5-Year Total/Average
ESOL 019
ESOL 021
ESOL 031
ESOL 040
ESOL 045
Total
109 17% 122 20% 116 21% 117 21% 137 24% 601 21%
145 23% 137 22% 134 24% 131 24% 127 23% 674 23%
186 30% 190 31% 157 28% 142 26% 141 25% 816 28%
186 30% 171 28% 155 28% 114 21% 90 16% 716 25%
0 0% 0 0% 0 0% 41 8% 67 12% 108 4%
626 100% 620 100% 562 100% 545 100% 562 100% 2,915 100%
BS_subnumFall 2013 Fall 2014 Fall 2015 Fall 2016 Fall 2017
5-Year Total/Average
ESOL 019
ESOL 022
ESOL 032
Total
109 27% 122 30% 116 30% 117 35% 137 35% 601 31%
117 29% 129 32% 134 35% 104 31% 102 26% 586 30%
183 45% 156 38% 134 35% 117 35% 148 38% 738 38%
409 100% 407 100% 384 100% 338 100% 387 100% 1,925 100%
BS_subnumFall 2013 Fall 2014 Fall 2015 Fall 2016 Fall 2017
5-Year Total/Average
MATH 034A
MATH 038
MATH 046
MATH 047A
Total
221 4% 201 4% 200 5% 155 4% 124 3% 901 4%
2,126 43% 1,935 43% 1,947 46% 1,819 48% 1,773 48% 9,600 45%
2,551 51% 2,280 51% 2,064 49% 1,789 47% 1,686 46% 10,370 49%
71 1% 63 1% 39 1% 40 1% 106 3% 319 2%
4,969 100% 4,479 100% 4,250 100% 3,803 100% 3,689 100% 21,190 100%
Table 5. English Basic Skills Course Enrollments
Table 6. ESOL Writing Course Enrollments
Table 7. ESOL Reading Course Enrollments
Table 8. ESOL Listening/Speaking Course Enrollments
Table 9. Math Basic Skills Course Enrollments
_______________________________________________________________________________All Colleges Basic Skills Report 2018
SDCCD Office of Institutional Research and Planning 9Source: SDCCD Information System
BS_subnumSpring 2014 Spring 2015 Spring 2016 Spring 2017 Spring 2018
5-Year Total/Average
ENGL 031
ENGL 042
ENGL 043
ENGL 047A
ENGL 048
ENGL 049
LCOM101
Total
0 0% 0 0% 0 0% 321 9% 570 22% 891 4%
570 12% 547 11% 327 7% 210 6% 60 2% 1,714 8%
858 18% 842 16% 516 11% 325 9% 161 6% 2,702 13%
281 6% 376 7% 747 16% 884 25% 924 35% 3,212 16%
1,159 24% 1,225 24% 978 22% 581 16% 269 10% 4,212 20%
1,999 41% 2,138 42% 1,968 43% 1,233 35% 581 22% 7,919 38%
0 0% 0 0% 0 0% 0 0% 55 2% 55 0%
4,867 100% 5,128 100% 4,536 100% 3,554 100% 2,620 100% 20,705 100%
BS_subnumSpring 2014 Spring 2015 Spring 2016 Spring 2017 Spring 2018
5-Year Total/Average
ESOL 019
ESOL 020
ESOL 030
ESOL 040
ESOL 045
Total
112 18% 119 20% 111 20% 101 19% 99 20% 542 19%
149 24% 135 23% 129 23% 127 24% 126 26% 666 24%
161 26% 170 29% 159 28% 154 29% 134 27% 778 28%
208 33% 167 28% 114 20% 103 19% 70 14% 662 24%
0 0% 0 0% 50 9% 49 9% 65 13% 164 6%
630 100% 591 100% 563 100% 534 100% 494 100% 2,812 100%
BS_subnumSpring 2014 Spring 2015 Spring 2016 Spring 2017 Spring 2018
5-Year Total/Average
ESOL 019
ESOL 021
ESOL 031
ESOL 040
ESOL 045
Total
112 18% 119 20% 111 21% 101 20% 99 19% 542 20%
136 22% 134 23% 119 22% 118 23% 127 25% 634 23%
155 25% 173 29% 146 27% 142 28% 148 29% 764 28%
208 34% 167 28% 114 21% 103 20% 70 14% 662 24%
0 0% 0 0% 50 9% 49 10% 65 13% 164 6%
611 100% 593 100% 540 100% 513 100% 509 100% 2,766 100%
BS_subnumSpring 2014 Spring 2015 Spring 2016 Spring 2017 Spring 2018
5-Year Total/Average
ESOL 019
ESOL 022
ESOL 032
Total
112 28% 119 30% 111 30% 101 29% 99 31% 542 30%
129 32% 123 31% 123 33% 115 33% 101 32% 591 32%
156 39% 157 39% 138 37% 131 38% 120 38% 702 38%
397 100% 399 100% 372 100% 347 100% 320 100% 1,835 100%
BS_subnumSpring 2014 Spring 2015 Spring 2016 Spring 2017 Spring 2018
5-Year Total/Average
MATH 034A
MATH 038
MATH 046
MATH 047A
Total
239 6% 226 6% 188 5% 148 4% 119 4% 920 5%
1,682 43% 1,718 43% 1,613 44% 1,500 44% 1,337 45% 7,850 44%
2,023 51% 2,052 51% 1,904 51% 1,734 51% 1,471 49% 9,184 51%
0 0% 0 0% 0 0% 0 0% 45 2% 45 0%
3,944 100% 3,996 100% 3,705 100% 3,382 100% 2,972 100% 17,999 100%
Table 10. English Basic Skills Course Enrollments
Table 11. ESOL Writing Course Enrollments
Table 12. ESOL Reading Course Enrollments
Table 13. ESOL Listening/Speaking Course Enrollments
Table 14. Math Basic Skills Course Enrollments
_______________________________________________________________________________All Colleges Basic Skills Report 2018
SDCCD Office of Institutional Research and Planning 10Source: SDCCD Information System
ENGL_ethnicity2013/14 2014/15 2015/16 2016/17 2017/18
5-Year Total/Average
African American
American Indian
Asian/Pacific Islander
Filipino
Latino
White
Other
Unreported
Total
1,038 11% 1,027 10% 926 9% 778 9% 569 9% 4,338 10%
23 0% 38 0% 27 0% 20 0% 20 0% 128 0%
1,095 11% 1,069 11% 960 10% 782 9% 695 10% 4,601 10%
485 5% 564 6% 483 5% 446 5% 366 6% 2,344 5%
4,746 49% 5,075 50% 5,072 52% 4,426 52% 3,370 51% 22,689 51%
1,634 17% 1,672 17% 1,669 17% 1,515 18% 1,189 18% 7,679 17%
452 5% 496 5% 488 5% 371 4% 336 5% 2,143 5%
132 1% 136 1% 127 1% 102 1% 105 2% 602 1%
9,605 100% 10,077 100% 9,752 100% 8,440 100% 6,650 100% 44,524 100%
ESOL_ethnicity2013/14 2014/15 2015/16 2016/17 2017/18
5-Year Total/Average
African American
Asian/Pacific Islander
Filipino
Latino
White
Other
Unreported
Total
332 14% 305 13% 236 11% 158 8% 154 7% 1,185 11%
860 35% 833 35% 778 35% 828 39% 859 41% 4,158 37%
44 2% 38 2% 55 2% 32 2% 32 2% 201 2%
483 20% 491 21% 388 17% 496 24% 374 18% 2,232 20%
644 26% 631 26% 682 31% 532 25% 581 28% 3,070 27%
33 1% 40 2% 41 2% 19 1% 27 1% 160 1%
63 3% 56 2% 54 2% 36 2% 43 2% 252 2%
2,459 100% 2,394 100% 2,234 100% 2,101 100% 2,070 100% 11,258 100%
MATH_ethnicity2013/14 2014/15 2015/16 2016/17 2017/18
5-Year Total/Average
African American
American Indian
Asian/Pacific Islander
Filipino
Latino
White
Other
Unreported
Total
1,068 12% 954 11% 862 11% 678 9% 644 10% 4,206 11%
27 0% 33 0% 13 0% 19 0% 23 0% 115 0%
481 5% 450 5% 415 5% 347 5% 342 5% 2,035 5%
335 4% 318 4% 271 3% 265 4% 229 3% 1,418 4%
4,410 49% 4,338 51% 4,218 53% 3,954 55% 3,756 56% 20,676 53%
1,973 22% 1,785 21% 1,691 21% 1,489 21% 1,246 19% 8,184 21%
488 5% 488 6% 389 5% 345 5% 342 5% 2,052 5%
131 1% 109 1% 96 1% 88 1% 79 1% 503 1%
8,913 100% 8,475 100% 7,955 100% 7,185 100% 6,661 100% 39,189 100%
Table 15. English Basic Skills Enrollments by Ethnicity
Table 16. ESOL Enrollments by Ethnicity
Table 17. Math Basic Skills Enrollments by Ethnicity
_______________________________________________________________________________All Colleges Basic Skills Report 2018
SDCCD Office of Institutional Research and Planning 11
Source: SDCCD Information System

Persistence
12
Part III: Persistence
This section of the report looks at the persistence rates of students who enrolled in Basic Skills courses during the five most recent fall terms for which data are available: Fall 2012 to Fall 2017. Overall term and annual persistence rates are displayed (see Table 18). Annual persistence is also reported by gender, ethnicity, and age (Tables 19 through 21).
TERMS AND DEFINITIONS:
The percentage of official census enrolled students in a fall term who received a grade notation of A, B, C, D, F, P, NP, I or RD and who enrolled in at least one course in the subsequent spring term and received a grade notation of A, B, C, D, F, P, NP, I, or RD. SDSU and UCSD-only students and sections are excluded. Intersession, tutoring, in-service, and cancelled classes are excluded.
Term Persistence:
Annual Persistence: The percentage of official census enrolled students in a fall term who received a grade notation of A, B, C, D, F, P, NP, I, or RD and who enrolled in at least one course in the subsequent spring and fall terms and received a grade notation of A, B, C, D, F, P, NP, I, or RD in each term. SDSU and UCSD-only students and sections are excluded. Intersession, tutoring, in-service, and cancelled classes are excluded.
_______________________________________________________________________________All Colleges Basic Skills Report 2018
SDCCD Office of Institutional Research and Planning 13
CohortFall Enrolled
Cohort
Term Persistence
Counts
Term Persistence
Rates
Annual Persistence
Counts
Annual Persistence
Rates
Fall 2012
Fall 2013
Fall 2014
Fall 2015
Fall 2016
Fall 2017
Total/Average
6,976 5,502 79% 4,120 59%
6,886 5,435 79% 3,982 58%
6,565 5,187 79% 3,816 58%
6,673 5,214 78% 3,762 56%
6,323 4,844 77% 3,494 55%
5,980 4,611 77% 0 ---
39,403 30,793 78% 19,174 57%
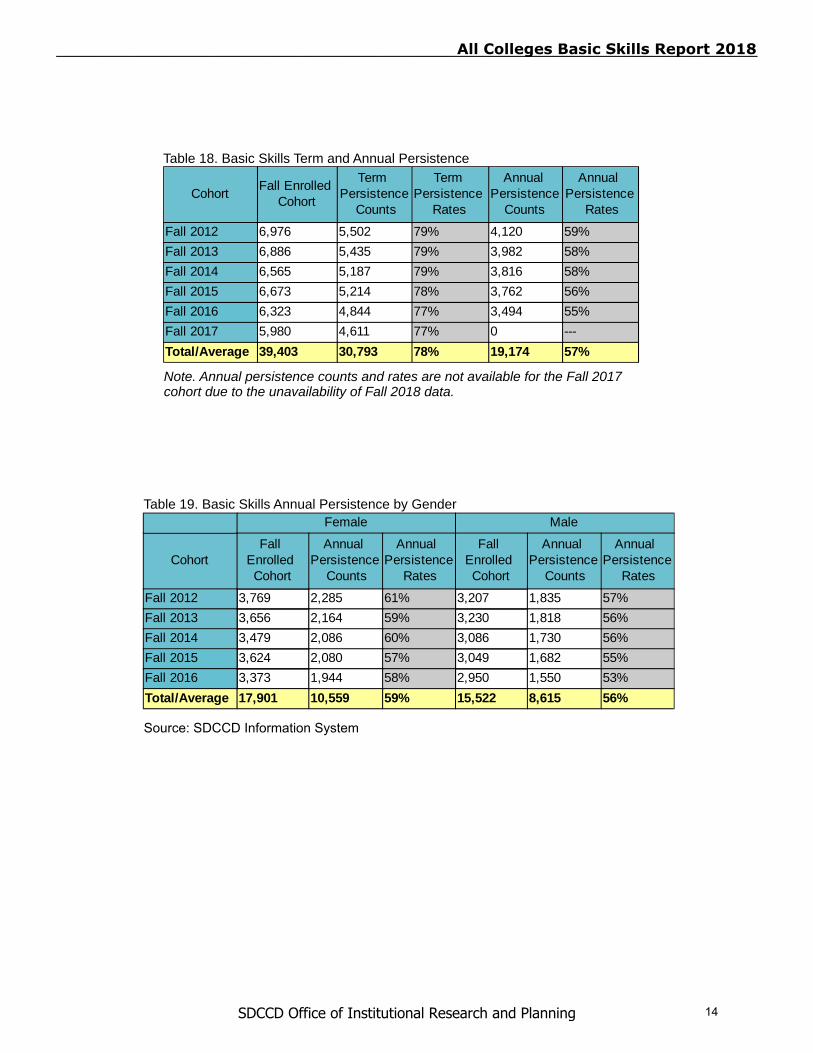
Table 18. Basic Skills Term and Annual Persistence
Note. Annual persistence counts and rates are not available for the Fall 2017 cohort due to the unavailability of Fall 2018 data.
Cohort
Gender Female Male
Fall Enrolled Cohort
Annual Persistence
Counts
Annual Persistence
Rates
Fall Enrolled Cohort
Annual Persistence
Counts
Annual Persistence
Rates
Fall 2012
Fall 2013
Fall 2014
Fall 2015
Fall 2016
Total/Average
3,769 2,285 61% 3,207 1,835 57%
3,656 2,164 59% 3,230 1,818 56%
3,479 2,086 60% 3,086 1,730 56%
3,624 2,080 57% 3,049 1,682 55%
3,373 1,944 58% 2,950 1,550 53%
17,901 10,559 59% 15,522 8,615 56%
Table 19. Basic Skills Annual Persistence by Gender
_______________________________________________________________________________All Colleges Basic Skills Report 2018
SDCCD Office of Institutional Research and Planning 14
Source: SDCCD Information System
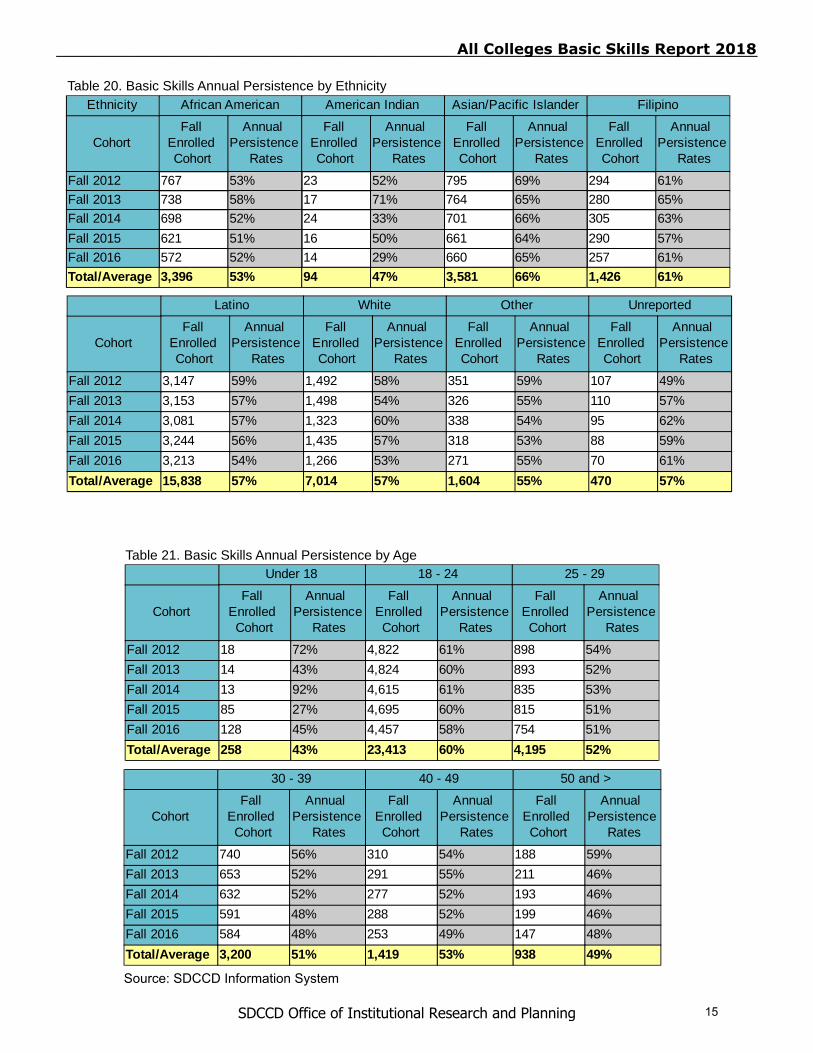
Table 20. Basic Skills Annual Persistence by Ethnicity
Cohort
Ethnicity African American American Indian Asian/Pacific Islander Filipino
Fall Enrolled Cohort
Annual Persistence
Rates
Fall Enrolled Cohort
Annual Persistence
Rates
Fall Enrolled Cohort
Annual Persistence
Rates
Fall Enrolled Cohort
Annual Persistence
Rates
Fall 2012
Fall 2013
Fall 2014
Fall 2015
Fall 2016
Total/Average
767 53% 23 52% 795 69% 294 61%
738 58% 17 71% 764 65% 280 65%
698 52% 24 33% 701 66% 305 63%
621 51% 16 50% 661 64% 290 57%
572 52% 14 29% 660 65% 257 61%
3,396 53% 94 47% 3,581 66% 1,426 61%
Cohort
Ethnicity Latino White Other Unreported
Fall Enrolled Cohort
Annual Persistence
Rates
Fall Enrolled Cohort
Annual Persistence
Rates
Fall Enrolled Cohort
Annual Persistence
Rates
Fall Enrolled Cohort
Annual Persistence
Rates
Fall 2012
Fall 2013
Fall 2014
Fall 2015
Fall 2016
Total/Average
3,147 59% 1,492 58% 351 59% 107 49%
3,153 57% 1,498 54% 326 55% 110 57%
3,081 57% 1,323 60% 338 54% 95 62%
3,244 56% 1,435 57% 318 53% 88 59%
3,213 54% 1,266 53% 271 55% 70 61%
15,838 57% 7,014 57% 1,604 55% 470 57%
Cohort
Agepro Under 18 18 - 24 25 - 29
Fall Enrolled Cohort
Annual Persistence
Rates
Fall Enrolled Cohort
Annual Persistence
Rates
Fall Enrolled Cohort
Annual Persistence
Rates
Fall 2012
Fall 2013
Fall 2014
Fall 2015
Fall 2016
Total/Average
18 72% 4,822 61% 898 54%
14 43% 4,824 60% 893 52%
13 92% 4,615 61% 835 53%
85 27% 4,695 60% 815 51%
128 45% 4,457 58% 754 51%
258 43% 23,413 60% 4,195 52%
Cohort
Agepro 30 - 39 40 - 49 50 and >
Fall Enrolled Cohort
Annual Persistence
Rates
Fall Enrolled Cohort
Annual Persistence
Rates
Fall Enrolled Cohort
Annual Persistence
Rates
Fall 2012
Fall 2013
Fall 2014
Fall 2015
Fall 2016
Total/Average
740 56% 310 54% 188 59%
653 52% 291 55% 211 46%
632 52% 277 52% 193 46%
591 48% 288 52% 199 46%
584 48% 253 49% 147 48%
3,200 51% 1,419 53% 938 49%
Table 21. Basic Skills Annual Persistence by Age
_______________________________________________________________________________All Colleges Basic Skills Report 2018
SDCCD Office of Institutional Research and Planning 15
Source: SDCCD Information System

Student Outcomes
16
Part IV: Student Outcomes: Retention and SuccessThis section of the report examines retention and success annually for the five most recent years for which data are available: 2013/14 through 2017/18. Five-year trends in retention rates are shown by year for each Basic Skills course and for each subject by ethnicity (see Tables 22 through 29). Similarly, five-year trends in success rates are presented by term for each course and for each subject by ethnicity (see Tables 30 through 37).
TERMS AND DEFINITIONS: The percentage of students who complete a course out of the total course enrollments. The retention rate is calculated by dividing the numerator by the denominator and multiplying by 100. Numerator = Number of students who received any grade notation except W (Withdrawal) and Denominator = Total number of valid enrollments as of official census.
Retention Rates:
Success Rates: The percentage of students who successfully complete a course out of the total course enrollments. The success rate is calculated by dividing the numerator by the denominator and multiplying by 100. Numerator = Number of students who receive grade notations A, B, C, or P and Denominator = Total number of valid enrollments as of official census.
_______________________________________________________________________________All Colleges Basic Skills Report 2018
SDCCD Office of Institutional Research and Planning 17
BS_subnum 2013/14 2014/15 2015/16 2016/17 2017/18 5-Year Average
ENGL 031
ENGL 042
ENGL 043
ENGL 047A
ENGL 048
ENGL 049
LCOM 101
Total
--- --- --- 91% 90% 90%
87% 87% 85% 85% 90% 87%
87% 87% 86% 86% 86% 87%
86% 90% 89% 87% 89% 89%
90% 87% 88% 83% 84% 87%
88% 87% 86% 85% 83% 86%
--- --- --- --- 85% 85%
88% 87% 87% 86% 87% 87%
BS_subnum 2013/14 2014/15 2015/16 2016/17 2017/18 5-Year Average
ESOL 019
ESOL 020
ESOL 030
ESOL 040
ESOL 045
Total
92% 92% 90% 94% 90% 92%
96% 91% 95% 97% 93% 95%
92% 94% 93% 94% 94% 93%
93% 90% 90% 91% 94% 91%
--- --- 88% 92% 96% 93%
93% 92% 92% 94% 93% 93%
BS_subnum 2013/14 2014/15 2015/16 2016/17 2017/18 5-Year Average
ESOL 019
ESOL 021
ESOL 031
ESOL 040
ESOL 045
Total
92% 92% 90% 94% 90% 92%
94% 93% 94% 93% 93% 93%
90% 90% 93% 92% 94% 92%
93% 90% 90% 91% 94% 91%
--- --- 88% 92% 96% 93%
92% 91% 92% 93% 93% 92%
BS_subnum 2013/14 2014/15 2015/16 2016/17 2017/18 5-Year Average
ESOL 019
ESOL 022
ESOL 032
Total
92% 92% 90% 94% 90% 92%
94% 92% 95% 95% 91% 93%
96% 94% 94% 94% 96% 95%
94% 93% 93% 94% 93% 93%
BS_subnum 2013/14 2014/15 2015/16 2016/17 2017/18 5-Year Average
MATH 034A
MATH 038
MATH 046
MATH 047A
Total
88% 81% 81% 86% 83% 84%
82% 83% 85% 84% 86% 84%
81% 80% 83% 82% 82% 82%
86% 89% 92% 90% 91% 90%
82% 82% 84% 83% 84% 83%
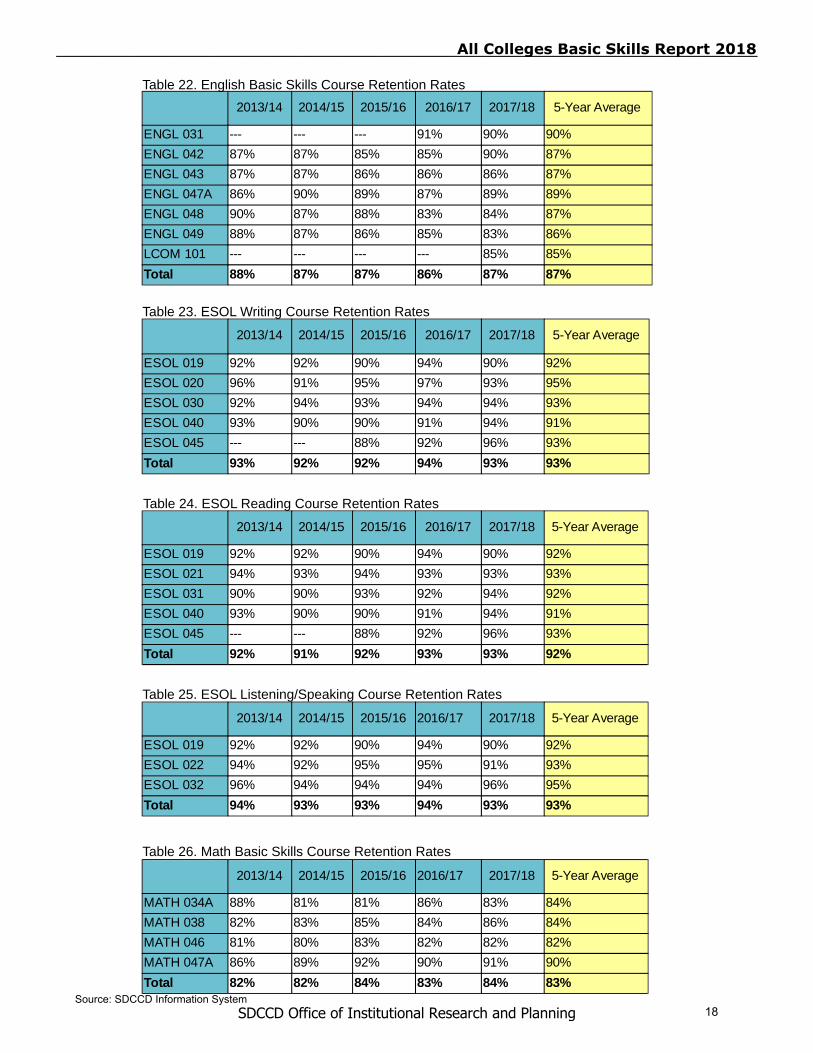
Table 22. English Basic Skills Course Retention Rates
Table 23. ESOL Writing Course Retention Rates
Table 24. ESOL Reading Course Retention Rates
Table 25. ESOL Listening/Speaking Course Retention Rates
Table 26. Math Basic Skills Course Retention Rates
_______________________________________________________________________________All Colleges Basic Skills Report 2018
SDCCD Office of Institutional Research and Planning 18Source: SDCCD Information System
Ethnicity 2013/14 2014/15 2015/16 2016/17 2017/18 5-Year Average
African American
American Indian
Asian/Pacific Islander
Filipino
Latino
White
Other
Unreported
Total
85% 87% 83% 84% 86% 85%
74% 87% 93% 95% 90% 88%
89% 91% 89% 90% 89% 90%
93% 90% 90% 84% 90% 89%
88% 87% 86% 85% 87% 87%
89% 87% 89% 86% 88% 88%
88% 85% 87% 83% 86% 86%
89% 89% 91% 85% 86% 88%
88% 87% 87% 86% 87% 87%
Ethnicity 2013/14 2014/15 2015/16 2016/17 2017/18 5-Year Average
African American
Asian/Pacific Islander
Filipino
Latino
White
Other
Unreported
Total
95% 92% 97% 94% 92% 94%
92% 92% 93% 95% 95% 93%
98% 87% 100% 94% 97% 96%
93% 92% 91% 95% 92% 93%
95% 92% 92% 92% 92% 92%
97% 93% 93% 89% 96% 94%
95% 86% 98% 83% 86% 90%
93% 92% 93% 94% 93% 93%
Ethnicity 2013/14 2014/15 2015/16 2016/17 2017/18 5-Year Average
African American
American Indian
Asian/Pacific Islander
Filipino
Latino
White
Other
Unreported
Total
78% 76% 79% 79% 81% 79%
81% 88% 85% 74% 91% 84%
85% 83% 86% 85% 84% 85%
86% 85% 85% 82% 90% 85%
82% 81% 83% 82% 84% 83%
82% 86% 86% 86% 83% 85%
78% 78% 85% 85% 86% 82%
86% 84% 89% 83% 84% 85%
82% 82% 84% 83% 84% 83%
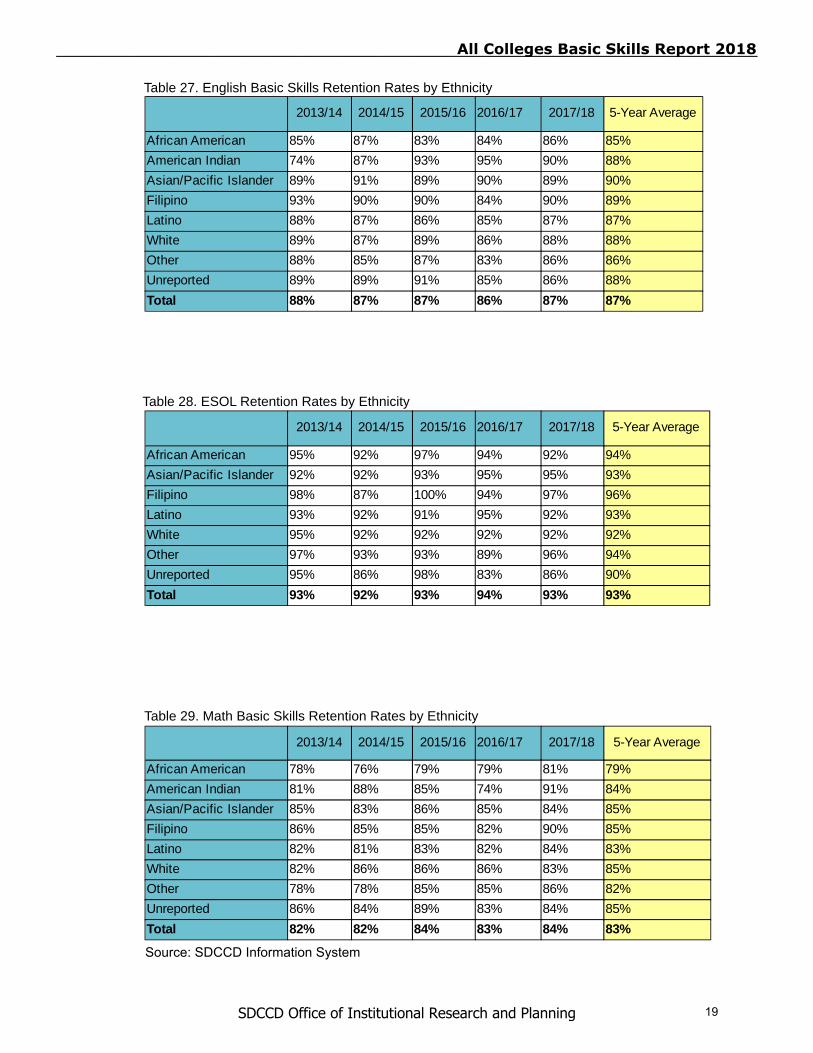
Table 27. English Basic Skills Retention Rates by Ethnicity
Table 28. ESOL Retention Rates by Ethnicity
Table 29. Math Basic Skills Retention Rates by Ethnicity
_______________________________________________________________________________All Colleges Basic Skills Report 2018
SDCCD Office of Institutional Research and Planning 19
Source: SDCCD Information System
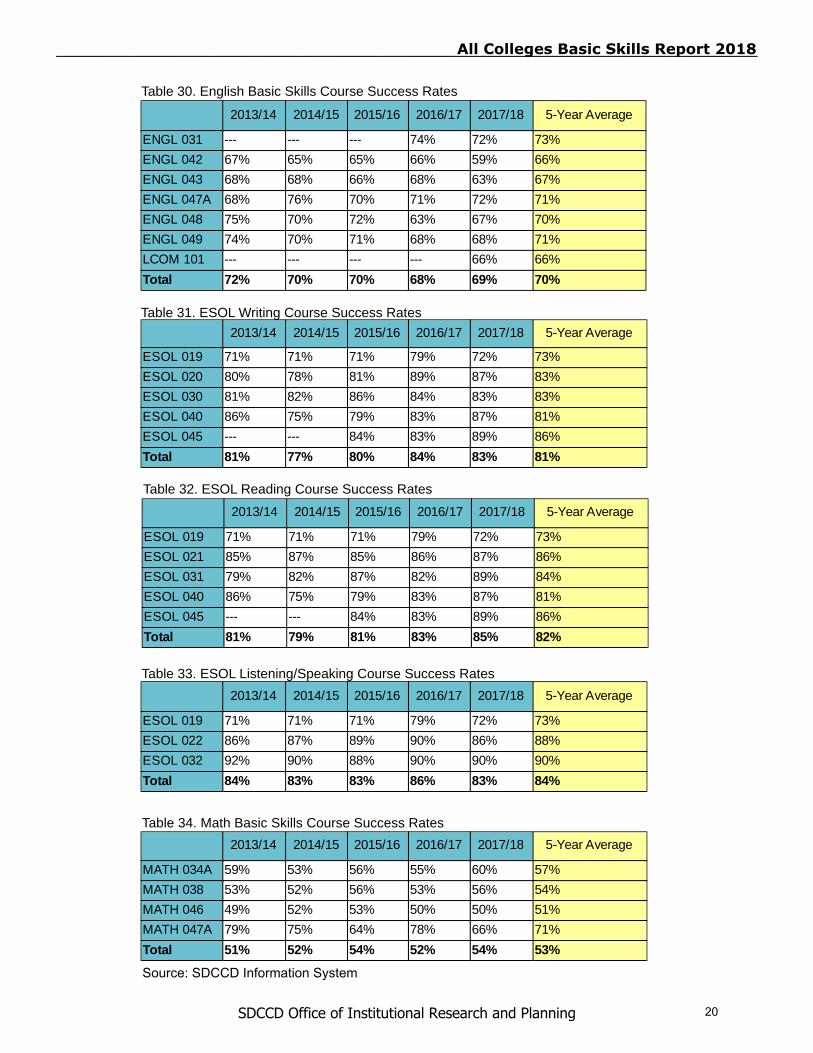
BS_subnum 2013/14 2014/15 2015/16 2016/17 2017/18 5-Year Average
ENGL 031
ENGL 042
ENGL 043
ENGL 047A
ENGL 048
ENGL 049
LCOM 101
Total
--- --- --- 74% 72% 73%
67% 65% 65% 66% 59% 66%
68% 68% 66% 68% 63% 67%
68% 76% 70% 71% 72% 71%
75% 70% 72% 63% 67% 70%
74% 70% 71% 68% 68% 71%
--- --- --- --- 66% 66%
72% 70% 70% 68% 69% 70%
BS_subnum 2013/14 2014/15 2015/16 2016/17 2017/18 5-Year Average
ESOL 019
ESOL 020
ESOL 030
ESOL 040
ESOL 045
Total
71% 71% 71% 79% 72% 73%
80% 78% 81% 89% 87% 83%
81% 82% 86% 84% 83% 83%
86% 75% 79% 83% 87% 81%
--- --- 84% 83% 89% 86%
81% 77% 80% 84% 83% 81%
BS_subnum 2013/14 2014/15 2015/16 2016/17 2017/18 5-Year Average
ESOL 019
ESOL 021
ESOL 031
ESOL 040
ESOL 045
Total
71% 71% 71% 79% 72% 73%
85% 87% 85% 86% 87% 86%
79% 82% 87% 82% 89% 84%
86% 75% 79% 83% 87% 81%
--- --- 84% 83% 89% 86%
81% 79% 81% 83% 85% 82%
BS_subnum 2013/14 2014/15 2015/16 2016/17 2017/18 5-Year Average
ESOL 019
ESOL 022
ESOL 032
Total
71% 71% 71% 79% 72% 73%
86% 87% 89% 90% 86% 88%
92% 90% 88% 90% 90% 90%
84% 83% 83% 86% 83% 84%
BS_subnum 2013/14 2014/15 2015/16 2016/17 2017/18 5-Year Average
MATH 034A
MATH 038
MATH 046
MATH 047A
Total
59% 53% 56% 55% 60% 57%
53% 52% 56% 53% 56% 54%
49% 52% 53% 50% 50% 51%
79% 75% 64% 78% 66% 71%
51% 52% 54% 52% 54% 53%
Table 30. English Basic Skills Course Success Rates
Table 31. ESOL Writing Course Success Rates
Table 32. ESOL Reading Course Success Rates
Table 33. ESOL Listening/Speaking Course Success Rates
Table 34. Math Basic Skills Course Success Rates
_______________________________________________________________________________All Colleges Basic Skills Report 2018
SDCCD Office of Institutional Research and Planning 20
Source: SDCCD Information System
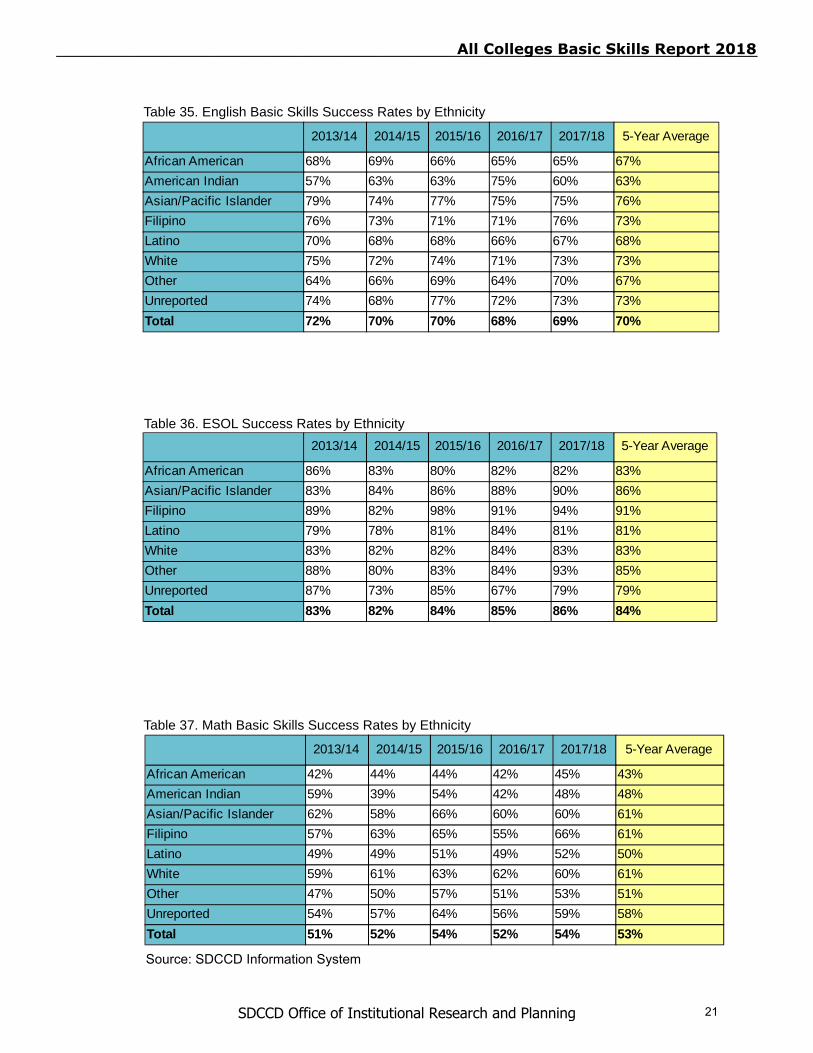
Ethnicity 2013/14 2014/15 2015/16 2016/17 2017/18 5-Year Average
African American
American Indian
Asian/Pacific Islander
Filipino
Latino
White
Other
Unreported
Total
68% 69% 66% 65% 65% 67%
57% 63% 63% 75% 60% 63%
79% 74% 77% 75% 75% 76%
76% 73% 71% 71% 76% 73%
70% 68% 68% 66% 67% 68%
75% 72% 74% 71% 73% 73%
64% 66% 69% 64% 70% 67%
74% 68% 77% 72% 73% 73%
72% 70% 70% 68% 69% 70%
Ethnicity 2013/14 2014/15 2015/16 2016/17 2017/18 5-Year Average
African American
Asian/Pacific Islander
Filipino
Latino
White
Other
Unreported
Total
86% 83% 80% 82% 82% 83%
83% 84% 86% 88% 90% 86%
89% 82% 98% 91% 94% 91%
79% 78% 81% 84% 81% 81%
83% 82% 82% 84% 83% 83%
88% 80% 83% 84% 93% 85%
87% 73% 85% 67% 79% 79%
83% 82% 84% 85% 86% 84%
Ethnicity 2013/14 2014/15 2015/16 2016/17 2017/18 5-Year Average
African American
American Indian
Asian/Pacific Islander
Filipino
Latino
White
Other
Unreported
Total
42% 44% 44% 42% 45% 43%
59% 39% 54% 42% 48% 48%
62% 58% 66% 60% 60% 61%
57% 63% 65% 55% 66% 61%
49% 49% 51% 49% 52% 50%
59% 61% 63% 62% 60% 61%
47% 50% 57% 51% 53% 51%
54% 57% 64% 56% 59% 58%
51% 52% 54% 52% 54% 53%
Table 35. English Basic Skills Success Rates by Ethnicity
Table 36. ESOL Success Rates by Ethnicity
Table 37. Math Basic Skills Success Rates by Ethnicity
_______________________________________________________________________________All Colleges Basic Skills Report 2018
SDCCD Office of Institutional Research and Planning 21
Source: SDCCD Information System