Embed Size (px)
Citation preview
All day. Every day.
Annual Report 2005
Contents
Chairman’s Report 2
Group Managing Director’s Review of Operations 4
Key Business Drivers 8
CCA at a Glance 14
Business Review 16
Five Year Financial Performance Summary 21
Corporate Social Responsibilities Report 22
CCA People 26
Senior Management 29
Board of Directors 30
Corporate Governance 32
Financial and Statutory Reports 37
Shareholder Information 121
Glossary 123
Company Directories 124
Calendar of Events 2006 125
AGMAnnual General Meeting will be held on Wednesday, 3 May 2006 at 2pm at the City Recital Hall, Angel Place(Pitt Street entrance), Sydney.
In 2005, Coca-Cola Amatil (CCA) delivered another strong result with its fifth consecutive year of double-digitnet profit growth. This has been achieved by continuing to focus on innovation and expansion of the brandportfolio, increasing the availability of products whilestriving to become the supplier of choice every time to ourcustomers. In doing so, CCA is able to refresh, energise and hydrate our consumers - all day every day.
2 Coca-Cola Amatil 2005 Annual Report
Chairman’s Report
In 2005, Coca-Cola Amatil delivered another strong result with its fifth consecutive year of double-digit net profit growth. Over the past four years, CCA has delivered average earnings per share growth of 14.4%1,2 per annum (before significant items), underpinning the 22.5%1 per annum average increase in dividends paid to shareholders.
CCA delivered a record net profit this year of $320.5 million, up 16.8% on last year. Total salesrevenue grew 15.6% to$3,987.5 million and earningsbefore interest and tax(before significant items)grew 10.1% to $570.6 million.This was a strong financialresult, providing a solid basefor future growth and wasachieved against thebackdrop of more difficulttrading conditions acrossmost regions.
Highlights for the yearincluded the continuedstrength of the Australianbeverage earnings result with margins growing from21.2% to 21.4% in a yearcharacterised by higher cost of goods sold (COGS)and a softer consumerenvironment. The Indonesia
and Papua New Guinea(PNG) business delivered anoutstanding result withearnings growth of 32.4% as it continued to build onthe gains made in 2004.This year also included a 10 month contribution fromSPC Ardmona, acquired in February 2005 whichperformed as expected.
Details of CCA’s 2005performance and commentson future prospects areincluded in the reports thatfollow. I encourage you toread these reports.
DividendThis strong financialperformance, combined withthe confidence that CCA willcontinue to grow, enabledthe Board to increase thefinal dividend to 17.5 cents a share, fully franked. This
gives a total fully frankeddividend for the year of 31.5 cents a share, a 12.5%increase on last year,representing a payout ratio of 73.5% of net profit.
Board changesIn August 2005, the Boardwelcomed Irial Finan as aNon-Executive Director.Irial is President, BottlingInvestments for The Coca-Cola Company (TCCC)and serves on the boards ofdirectors of Coca-ColaEnterprises (CCE), Coca-ColaFEMSA, Coca-Cola HellenicBottling Company and theSupervisory Board of CCEAG. He has spent 24 yearsworking within the Coca-Cola system and brings to CCA a wealth ofexperience from both theperspective of a Coke bottlerand the brand owner.
David Gonski, AOChairman
Year ended 31 December 20052005 2004 Change
Revenue from Sales of Beverages and Food ($ million) 3,987.5 3,450.1 15.6 %
Earnings Before Interest and Tax, before Significant Items ($ million) 570.6 518.3 10.1 %
EBIT Margin (%) 14.3 15.0 -0.7pts
Net Profit, before Significant Items ($ million) 320.5 274.3 16.8 %
Net Profit ($ million) 320.5 276.6 15.9 %
Operating Cash Flow ($ million) 435.2 381.0 14.2 %
Return on Average Capital Employed (%) 17.5 21.6 -4.1pts
Total Capital Employed ($ million) 3,557.5 2,469.3 44.1 %
Net Debt to Book Equity (%) 149.7 164.8 -15.1pts
Capital Expenditure to Revenue (%) 7.4 6.1 1.3pts
Earnings per Share, before Significant Items (cents) 43.3 39.0 11.0 %
Earnings per Share (cents) 43.3 39.3 10.2 %
Dividends per Share (cents) 31.5 28.0 12.5 %
Coca-Cola Amatil 2005 Annual Report 3
Irial replaced HenrySchimberg who, as one of TCCC’s nominees on the Board, retired in August 2005 after serving as a Non-Executive Director.The Board records its sincereappreciation of the valuablecontribution made by Henryover the past five years.
Corporate governanceCCA has an ongoingcommitment to transparencyand good corporategovernance. This AnnualReport includes a number of statements on the robustcorporate governancestructure and riskmanagement frameworkprevailing throughout CCA.CCA has always maintaineda high level of corporategovernance and we continueto refine our practices in thisarea each year.
The Coca-ColaCompanyThe Board is pleased withthe strengthening of therelationship between CCAand TCCC. TCCC holds 32% of the shares in CCA,and nominates two Non-Executive Directors ofthe current eight memberBoard. CCA’s Related PartyCommittee, comprising theIndependent Directors,reviewed all materialtransactions between CCAand TCCC in 2005 and is animportant forum for dealingwith governance issues.
Corporate socialresponsibilityCCA strongly supports socialand environmental activitiesthrough its community andenvironmental programs.These programs help tosustain business performanceby strengthening thecommunities in which weoperate, improving businessefficiency and developingrelationships withstakeholders, and ultimatelyleading to increasedshareholder returns.
EmployeesOne of the underlyingstrengths of the Group is thequality of its people. Theircommitment to CCA’s corevalues underpins theexcellent results achieved thisyear. On behalf of the Board,I would like to thank allemployees for their specialefforts and contributions in 2005.
David Gonski, AO
Net Profit2
$ million
0504030201150
300
450
600
570.
6
518.
3
470.
0
421.
9
372.
3
050403020170
140
210
280
350
320.
5
274.
3
238.
8
205.
5
171.
1
05040302010
5
10
15
20
25
17.5
21.6
10.2
8.8
7.6
05040302010
7
14
21
28
35
31.5
28.0
23.0
18.5
14.0
EBIT increased by 10.1% to $570.6 million in 2005 and has grown at an average of11.3%1 per annum since 2001. (continuing businesses only and before significant items)
Net profit grew 16.8% to $320.5 million in 2005 and hasgrown at an average of 17.0%1
per annum since 2001.(continuing businesses only and before significant items)
ROCE of 17.5% in 2005 reflectsthe first time inclusion of SPC Ardmona, acquired inFebruary 2005.(continuing businesses only and before significant items)
Annual dividends per share havegrown by 125% since 2001, or anaverage of 22.5%1 per annum.
Earnings Before Interestand Tax2 $ million
Return on CapitalEmployed2 %
Dividends per ShareCents
1 Compound annual growth rate.
2 Includes financial information prepared under Australian equivalents to International Financial Reporting Standards (AIFRS) for 2005 and 2004,and information prepared under the previous framework of Australian Accounting Standards (AGAAP) for years prior to 2004.
4 Coca-Cola Amatil 2005 Annual Report
Group Managing Director’s Review of Operations
At CCA, we ultimately judge our success by how well we grow the revenueand profits of our customers, confident that this commitment will provide arobust platform for us to continuously innovate our product range, maintainour category leadership positions and in turn grow our profitability.
In 2005, we were again ableto achieve a strong financialoutcome for the year bybalancing market shareobjectives with volume andpricing realisation and costmanagement discipline.
Strong gains were madeacross the Group in theexecution of the Company’skey business drivers whichhas led to further increases in revenue generated fromsources other than carbonatedbeverages. We commencedbusiness in 2005 with over80,000 new customers, over45,000 new cold drink coolerswere placed and our customerservice initiatives again sawthe Company win manyawards for service excellence.
By the successful execution ofthis customer focused strategy,earnings per share (ongoing
business and before significantitems) has increased at acompound annual growth rate of 14.4% since 2001 anddividends per share haveincreased by 125%, or anaverage of 22.5% per annum.
To maintain this momentum,we shall continue to target the creation of a perfectlymerchandised beveragelandscape in every outlet.New product development,cold drink cooler placementsand the expansion of ournon-carbonated beverageportfolio remain corepriorities. The execution ofthese priorities will allow us toexpand the size and value ofour relationship with both thecustomer and the consumer,by providing the right productin the right package, deliveredthrough the right channel atthe right price, for the rightoccasions.
2005 reviewIn 2005, CCA continued todeliver on its commitment to consistently improve itsfinancial returns, deliveringits fifth consecutive year of double-digit net profitgrowth.
• Net profit, beforesignificant items, increased16.8% to $320.5 million.
• Earnings per share, beforesignificant items, increased11.0% to 43.3 cents.
• Operating cash flowincreased 14.2% to $435.2 million.
• Dividends per shareincreased 12.5% to 31.5 cents, 100% franked.
Terry DavisGroup Managing Director
Broadening our business base
2001
Sale of Coca-Cola BottlersPhilippines in April.
Fanta flavour range launchedin Australia and New Zealand.
The launch of the space saving‘fridge mate’ multi-can pack.
CCA has expanded its product offering in beveragesand food by growing its business organically as wellas by acquiring businesses that can build our brandportfolio or improve our manufacturing anddistribution capability. Over the past five years, CCAhas invested around $950 million on 10 acquisitions,across Australia, New Zealand and Indonesia, whileraising over $2.4 billion in consideration from thesale of assets.
Coca-Cola Amatil 2005 Annual Report 5
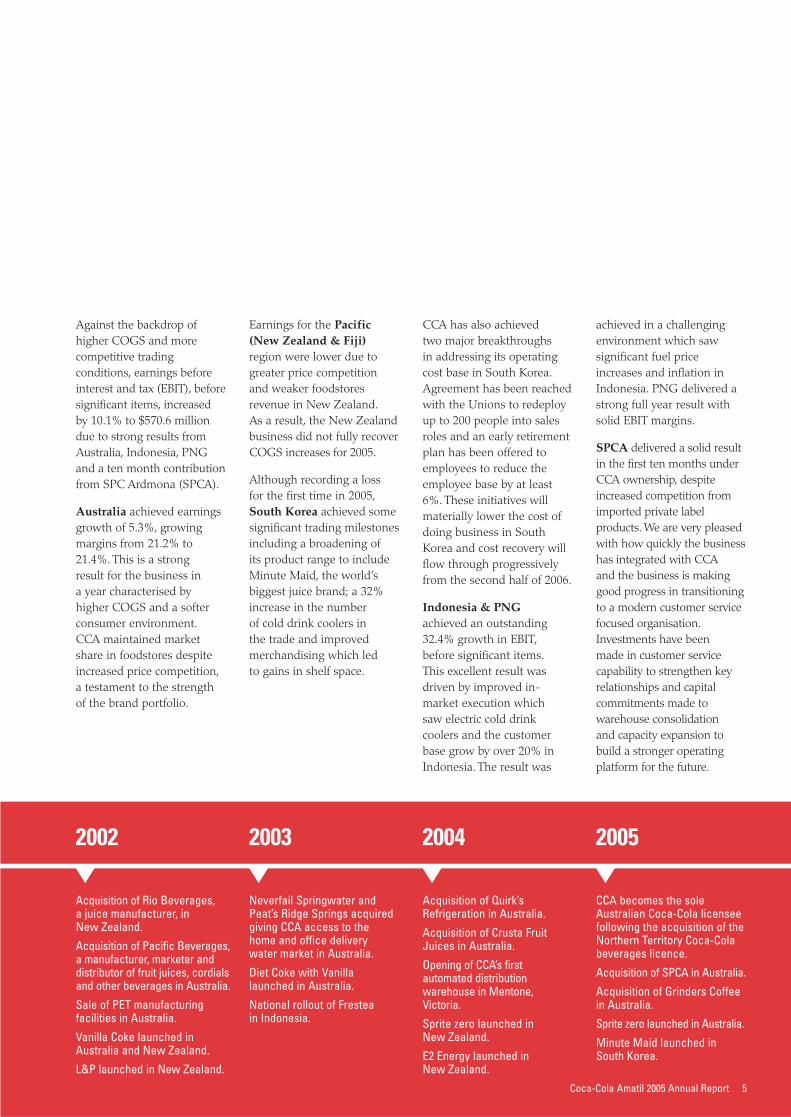
Against the backdrop ofhigher COGS and morecompetitive tradingconditions, earnings beforeinterest and tax (EBIT), beforesignificant items, increased by 10.1% to $570.6 milliondue to strong results fromAustralia, Indonesia, PNGand a ten month contributionfrom SPC Ardmona (SPCA).
Australia achieved earningsgrowth of 5.3%, growingmargins from 21.2% to21.4%. This is a strong result for the business in a year characterised byhigher COGS and a softerconsumer environment.CCA maintained marketshare in foodstores despiteincreased price competition,a testament to the strengthof the brand portfolio.
Earnings for the Pacific(New Zealand & Fiji)region were lower due togreater price competition and weaker foodstoresrevenue in New Zealand.As a result, the New Zealandbusiness did not fully recoverCOGS increases for 2005.
Although recording a loss for the first time in 2005,South Korea achieved somesignificant trading milestonesincluding a broadening of its product range to includeMinute Maid, the world’sbiggest juice brand; a 32%increase in the number of cold drink coolers in the trade and improvedmerchandising which led to gains in shelf space.
CCA has also achieved two major breakthroughs in addressing its operatingcost base in South Korea.Agreement has been reachedwith the Unions to redeployup to 200 people into salesroles and an early retirement plan has been offered toemployees to reduce theemployee base by at least6%. These initiatives willmaterially lower the cost ofdoing business in SouthKorea and cost recovery willflow through progressivelyfrom the second half of 2006.
Indonesia & PNGachieved an outstanding32.4% growth in EBIT,before significant items.This excellent result wasdriven by improved in-market execution which saw electric cold drinkcoolers and the customerbase grow by over 20% inIndonesia. The result was
achieved in a challengingenvironment which sawsignificant fuel priceincreases and inflation inIndonesia. PNG delivered astrong full year result withsolid EBIT margins.
SPCA delivered a solid resultin the first ten months underCCA ownership, despiteincreased competition fromimported private labelproducts. We are very pleasedwith how quickly the businesshas integrated with CCA and the business is makinggood progress in transitioningto a modern customer servicefocused organisation.Investments have been made in customer servicecapability to strengthen keyrelationships and capitalcommitments made towarehouse consolidation and capacity expansion tobuild a stronger operatingplatform for the future.
2002 20042003 2005
Acquisition of Rio Beverages, a juice manufacturer, in New Zealand.
Acquisition of Pacific Beverages,a manufacturer, marketer anddistributor of fruit juices, cordialsand other beverages in Australia.
Sale of PET manufacturingfacilities in Australia.
Vanilla Coke launched inAustralia and New Zealand.
L&P launched in New Zealand.
Neverfail Springwater andPeat’s Ridge Springs acquiredgiving CCA access to thehome and office deliverywater market in Australia.
Diet Coke with Vanillalaunched in Australia.
National rollout of Frestea in Indonesia.
Acquisition of Quirk’sRefrigeration in Australia.
Acquisition of Crusta FruitJuices in Australia.
Opening of CCA’s firstautomated distributionwarehouse in Mentone,Victoria.
Sprite zero launched in New Zealand.
E2 Energy launched in New Zealand.
CCA becomes the soleAustralian Coca-Cola licenseefollowing the acquisition of theNorthern Territory Coca-Colabeverages licence.
Acquisition of SPCA in Australia.
Acquisition of Grinders Coffeein Australia.
Sprite zero launched in Australia.
Minute Maid launched inSouth Korea.

6 Coca-Cola Amatil 2005 Annual Report
Group Managing Director’s Review of Operations continued
Launch of Coca-Cola zeroIn January 2006, CCAAustralia undertook itsbiggest ever product launch.Coca-Cola zero, with the realtaste of Coca-Cola and zerosugar, is a significant initiativeby the Coca-Cola system tomeet consumer demand forlower calorie beverages.
TCCC and CCA’s $18 millionlaunch campaign included anunprecedented integratedmedia program, acceleratedcooler placements andextensive in-fieldmerchandising.
In mid January, a 1,000 strongMarket Impact Team (MIT)joined CCA’s sales force for a two week intensivemerchandising effort. TheMIT consisted of local CCAemployees redeployed fromnon-sales roles and 198international employees from 42 countries within the Coca-Cola system.
Customer and consumerresponse to the launch has been overwhelming,far exceeding expectations.The first five week period of scan data indicated thatthe total cola category grew by more than 20% infoodstores, with Coca-Colabrands up significantly.In the first two months of the year, Coca-Cola zero,
combined with a solidsummer season, has resultedin Australian volumesgrowing by more than 10%.
Coca-Cola zero is expected tobecome a significant productwithin CCA’s brand portfolioand was launched into New Zealand in February.
Capital managementCCA’s priorities for using its cash flow are to reinvest in value-adding growthopportunities and to pay out a high portion of profits toshareholders as dividends.
The most significant use ofcash over the next three yearswill be in the construction ofautomated warehouses inSydney and Auckland for atotal cost of $250 million.
The success of CCA’s firstautomated warehouse inMentone in Victoria underpinsour confidence that theseinvestments will materiallyimprove customer servicelevels while generating costsavings for CCA.
CCA’s cold drink coolerrollout continued in 2005.CCA deployed over 45,000coolers at a cost of $74 millionand the business will spend asimilar amount in 2006.
CCA is committed tomaintaining the highdividend payout ratio.The current payout ratio of73.5% of net profit is withinthe target payout range of70% to 80%.
CCA’s expansion into non-carbonated beverages and food
200520010
25
50
75
100%
95%71%
20%
9%5%Carbonated soft drinks
Non-carbonated beverages
Food
By broadening the product offering, CCA has grown its non-carbonated beverage business intobottled water, juice, sports drinks, ready-to-drink teaand with the acquisition of SPC Ardmona, CCA hasentered the ready-to-eat deciduous fruit category.Since 2001, revenue generated from non-carbonatedbeverages and food has grown from 5% to 29% of totalrevenue in 2005. Combined with strong cost discipline,EBIT margins have grown from 11.4% to 14.3%.
Revenue split
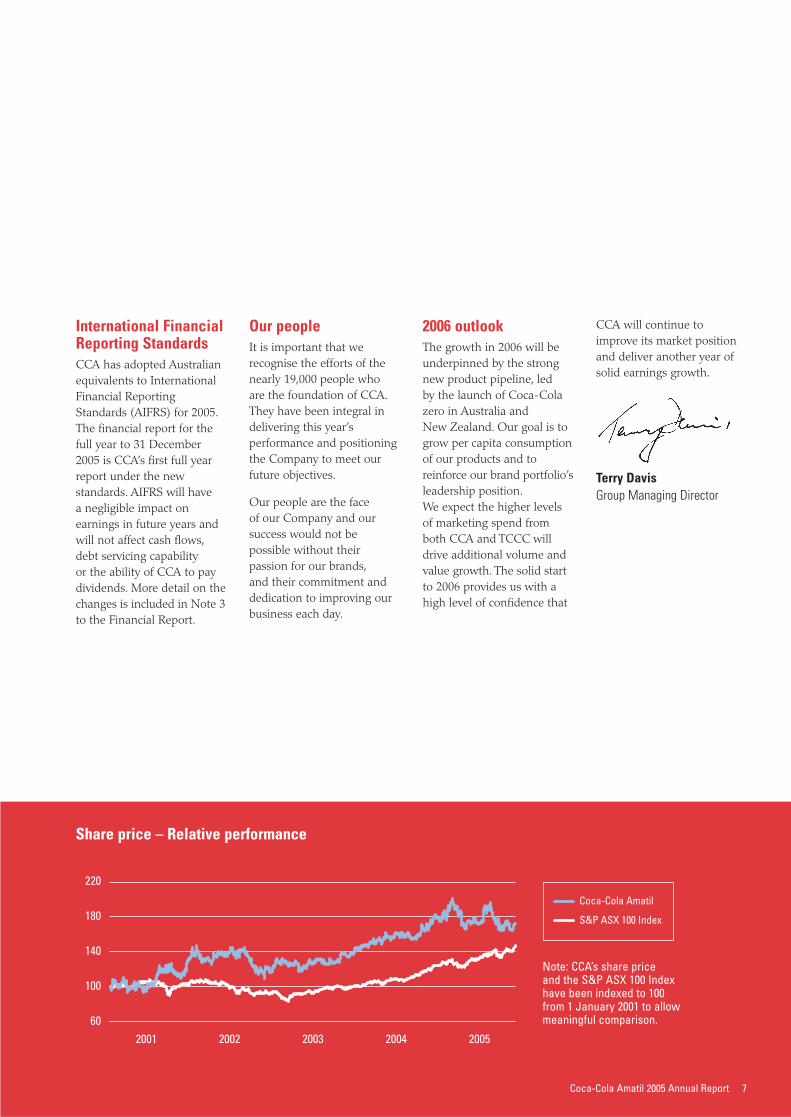
Share price – Relative performance
Coca-Cola Amatil 2005 Annual Report 7
International FinancialReporting Standards CCA has adopted Australianequivalents to InternationalFinancial ReportingStandards (AIFRS) for 2005.The financial report for thefull year to 31 December2005 is CCA’s first full yearreport under the newstandards. AIFRS will have a negligible impact onearnings in future years andwill not affect cash flows,debt servicing capability or the ability of CCA to paydividends. More detail on thechanges is included in Note 3to the Financial Report.
Our peopleIt is important that werecognise the efforts of thenearly 19,000 people who are the foundation of CCA.They have been integral indelivering this year’sperformance and positioningthe Company to meet ourfuture objectives.
Our people are the face of our Company and oursuccess would not bepossible without theirpassion for our brands,and their commitment anddedication to improving ourbusiness each day.
2006 outlookThe growth in 2006 will beunderpinned by the strongnew product pipeline, led by the launch of Coca-Colazero in Australia and New Zealand. Our goal is togrow per capita consumptionof our products and toreinforce our brand portfolio’sleadership position.We expect the higher levelsof marketing spend fromboth CCA and TCCC willdrive additional volume andvalue growth. The solid startto 2006 provides us with ahigh level of confidence that
CCA will continue toimprove its market positionand deliver another year ofsolid earnings growth.
Terry DavisGroup Managing Director
60
100
140
180
220
2001 2002 2003 2004 2005
Coca-Cola Amatil
S&P ASX 100 Index
Note: CCA’s share price and the S&P ASX 100 Indexhave been indexed to 100from 1 January 2001 to allowmeaningful comparison.
8 Coca-Cola Amatil 2005 Annual Report
Key BusinessDrivers
The organisation remains focused on growing per capita consumptionof its beverage and food brands in each of its markets. To achieve thisoutcome, CCA concentrates on the successful execution of five keybusiness drivers:
Product and package innovation
Non-carbonated beverage and food growth
Expanding the availability of CCA products into new outlets
Customer service enhancement
Revenue management and cost discipline
12
345
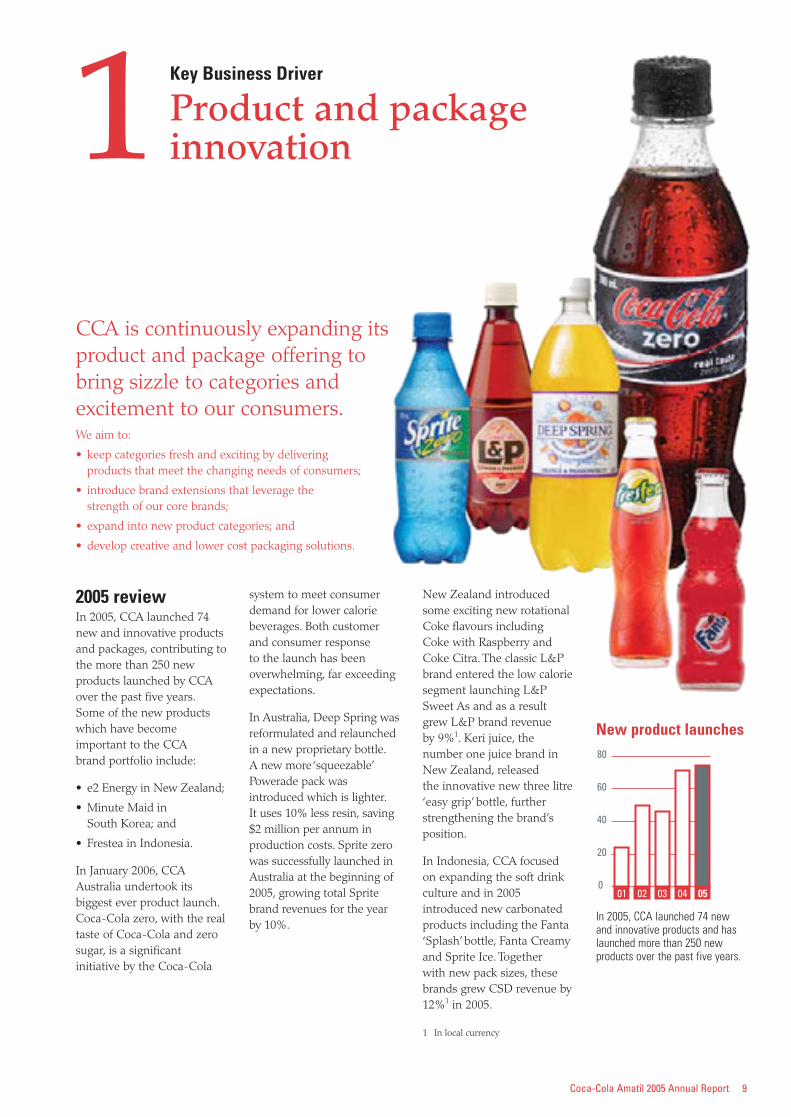
New product launches
2005 review In 2005, CCA launched 74new and innovative productsand packages, contributing tothe more than 250 newproducts launched by CCAover the past five years.Some of the new productswhich have becomeimportant to the CCA brand portfolio include:
• e2 Energy in New Zealand;
• Minute Maid in South Korea; and
• Frestea in Indonesia.
In January 2006, CCAAustralia undertook itsbiggest ever product launch.Coca-Cola zero, with the realtaste of Coca-Cola and zerosugar, is a significantinitiative by the Coca-Cola
system to meet consumerdemand for lower caloriebeverages. Both customerand consumer response to the launch has beenoverwhelming, far exceedingexpectations.
In Australia, Deep Spring wasreformulated and relaunchedin a new proprietary bottle.A new more ‘squeezable’Powerade pack wasintroduced which is lighter.It uses 10% less resin, saving$2 million per annum inproduction costs. Sprite zerowas successfully launched inAustralia at the beginning of2005, growing total Spritebrand revenues for the yearby 10%.
New Zealand introducedsome exciting new rotationalCoke flavours includingCoke with Raspberry andCoke Citra. The classic L&Pbrand entered the low caloriesegment launching L&PSweet As and as a resultgrew L&P brand revenue by 9%1. Keri juice, thenumber one juice brand inNew Zealand, released the innovative new three litre‘easy grip’ bottle, furtherstrengthening the brand’sposition.
In Indonesia, CCA focusedon expanding the soft drinkculture and in 2005introduced new carbonatedproducts including the Fanta‘Splash’ bottle, Fanta Creamyand Sprite Ice. Together with new pack sizes, thesebrands grew CSD revenue by12%1 in 2005.
1 In local currency
Coca-Cola Amatil 2005 Annual Report 9
CCA is continuously expanding itsproduct and package offering tobring sizzle to categories andexcitement to our consumers.We aim to:
• keep categories fresh and exciting by delivering products that meet the changing needs of consumers;
• introduce brand extensions that leverage the strength of our core brands;
• expand into new product categories; and
• develop creative and lower cost packaging solutions.
Coca-Cola Amatil 2005 Annual Report 9
1 Key Business Driver
Product and package innovation
05040302010
20
40
60
80
In 2005, CCA launched 74 newand innovative products and haslaunched more than 250 newproducts over the past five years.
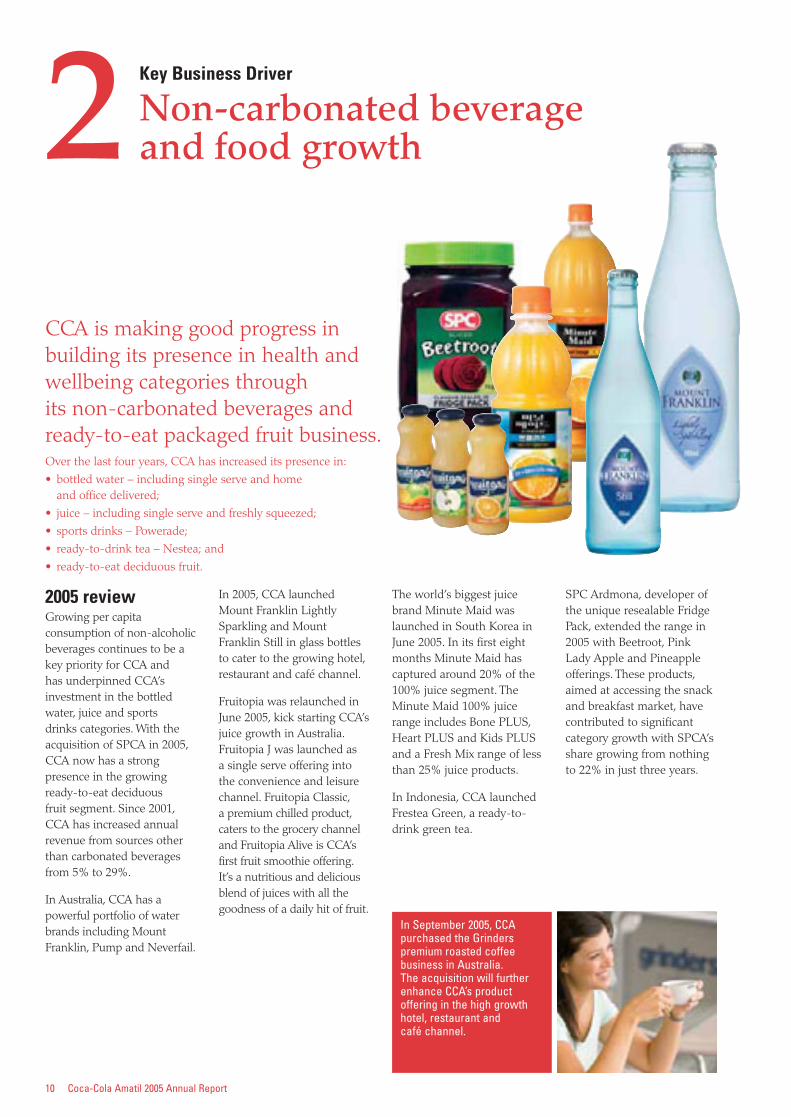
In September 2005, CCApurchased the Grinderspremium roasted coffeebusiness in Australia. The acquisition will furtherenhance CCA’s productoffering in the high growthhotel, restaurant and café channel.
10 Coca-Cola Amatil 2005 Annual Report
2 Key Business Driver
Non-carbonated beverage and food growth
CCA is making good progress inbuilding its presence in health andwellbeing categories through its non-carbonated beverages andready-to-eat packaged fruit business.Over the last four years, CCA has increased its presence in:
• bottled water – including single serve and home and office delivered;
• juice – including single serve and freshly squeezed;
• sports drinks – Powerade;
• ready-to-drink tea – Nestea; and
• ready-to-eat deciduous fruit.
2005 reviewGrowing per capitaconsumption of non-alcoholicbeverages continues to be akey priority for CCA and has underpinned CCA’sinvestment in the bottledwater, juice and sports drinks categories. With theacquisition of SPCA in 2005,CCA now has a strongpresence in the growingready-to-eat deciduous fruit segment. Since 2001,CCA has increased annualrevenue from sources otherthan carbonated beverages from 5% to 29%.
In Australia, CCA has apowerful portfolio of waterbrands including MountFranklin, Pump and Neverfail.
In 2005, CCA launchedMount Franklin LightlySparkling and MountFranklin Still in glass bottlesto cater to the growing hotel,restaurant and café channel.
Fruitopia was relaunched inJune 2005, kick starting CCA’sjuice growth in Australia.Fruitopia J was launched as a single serve offering intothe convenience and leisurechannel. Fruitopia Classic,a premium chilled product,caters to the grocery channeland Fruitopia Alive is CCA’sfirst fruit smoothie offering.It’s a nutritious and deliciousblend of juices with all thegoodness of a daily hit of fruit.
The world’s biggest juicebrand Minute Maid waslaunched in South Korea inJune 2005. In its first eightmonths Minute Maid hascaptured around 20% of the100% juice segment. TheMinute Maid 100% juicerange includes Bone PLUS,Heart PLUS and Kids PLUSand a Fresh Mix range of lessthan 25% juice products.
In Indonesia, CCA launchedFrestea Green, a ready-to-drink green tea.
SPC Ardmona, developer ofthe unique resealable FridgePack, extended the range in2005 with Beetroot, PinkLady Apple and Pineappleofferings. These products,aimed at accessing the snackand breakfast market, havecontributed to significantcategory growth with SPCA’sshare growing from nothingto 22% in just three years.
Coca-Cola Amatil 2005 Annual Report 11
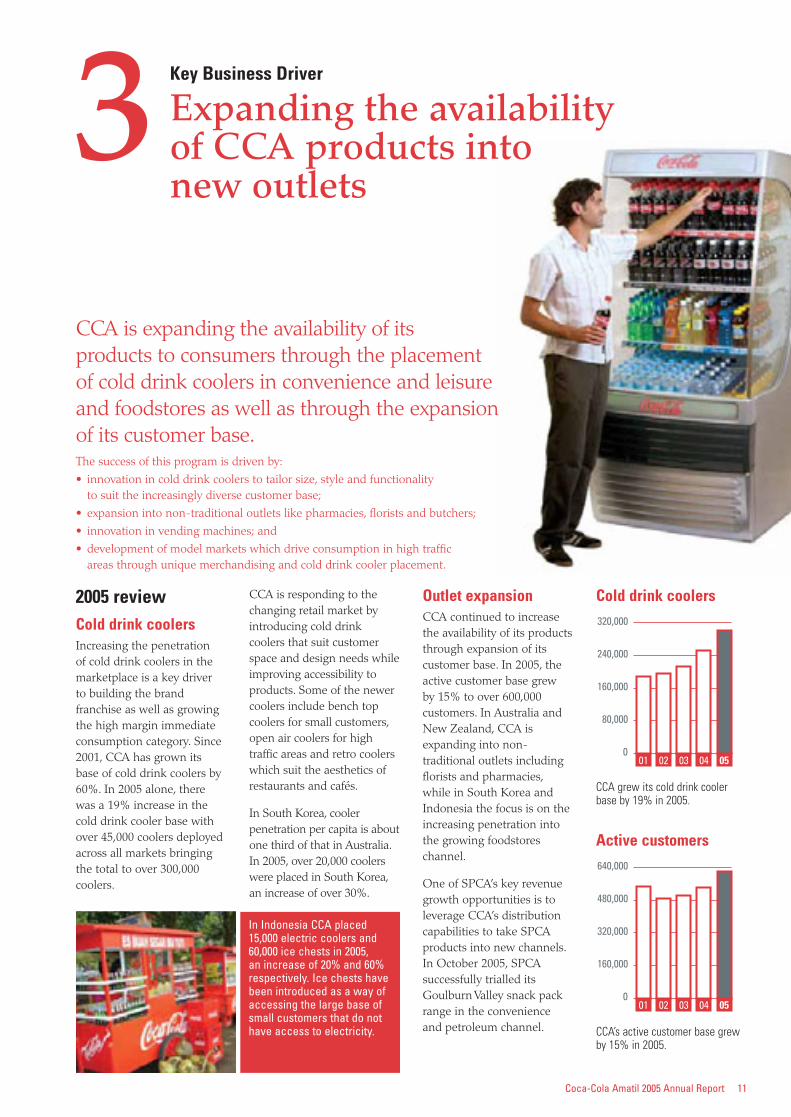
3CCA is expanding the availability of its products to consumers through the placement of cold drink coolers in convenience and leisure and foodstores as well as through the expansion of its customer base.The success of this program is driven by:
• innovation in cold drink coolers to tailor size, style and functionality to suit the increasingly diverse customer base;
• expansion into non-traditional outlets like pharmacies, florists and butchers;
• innovation in vending machines; and
• development of model markets which drive consumption in high traffic areas through unique merchandising and cold drink cooler placement.
2005 reviewCold drink coolersIncreasing the penetration of cold drink coolers in themarketplace is a key driver to building the brandfranchise as well as growingthe high margin immediateconsumption category. Since2001, CCA has grown itsbase of cold drink coolers by60%. In 2005 alone, therewas a 19% increase in thecold drink cooler base withover 45,000 coolers deployedacross all markets bringingthe total to over 300,000coolers.
CCA is responding to thechanging retail market byintroducing cold drinkcoolers that suit customerspace and design needs whileimproving accessibility toproducts. Some of the newercoolers include bench topcoolers for small customers,open air coolers for hightraffic areas and retro coolerswhich suit the aesthetics ofrestaurants and cafés.
In South Korea, coolerpenetration per capita is aboutone third of that in Australia.In 2005, over 20,000 coolerswere placed in South Korea,an increase of over 30%.
Outlet expansionCCA continued to increasethe availability of its productsthrough expansion of itscustomer base. In 2005, theactive customer base grew by 15% to over 600,000customers. In Australia andNew Zealand, CCA isexpanding into non-traditional outlets includingflorists and pharmacies,while in South Korea andIndonesia the focus is on theincreasing penetration intothe growing foodstoreschannel.
One of SPCA’s key revenuegrowth opportunities is toleverage CCA’s distributioncapabilities to take SPCAproducts into new channels.In October 2005, SPCAsuccessfully trialled itsGoulburn Valley snack packrange in the convenience and petroleum channel.
Cold drink coolers
CCA grew its cold drink coolerbase by 19% in 2005.
05040302010
80,000
160,000
240,000
320,000
Active customers
CCA’s active customer base grewby 15% in 2005.
05040302010
160,000
320,000
480,000
640,000
Key Business Driver
Expanding the availability of CCA products into new outlets
In Indonesia CCA placed15,000 electric coolers and60,000 ice chests in 2005, an increase of 20% and 60%respectively. Ice chests havebeen introduced as a way ofaccessing the large base ofsmall customers that do nothave access to electricity.
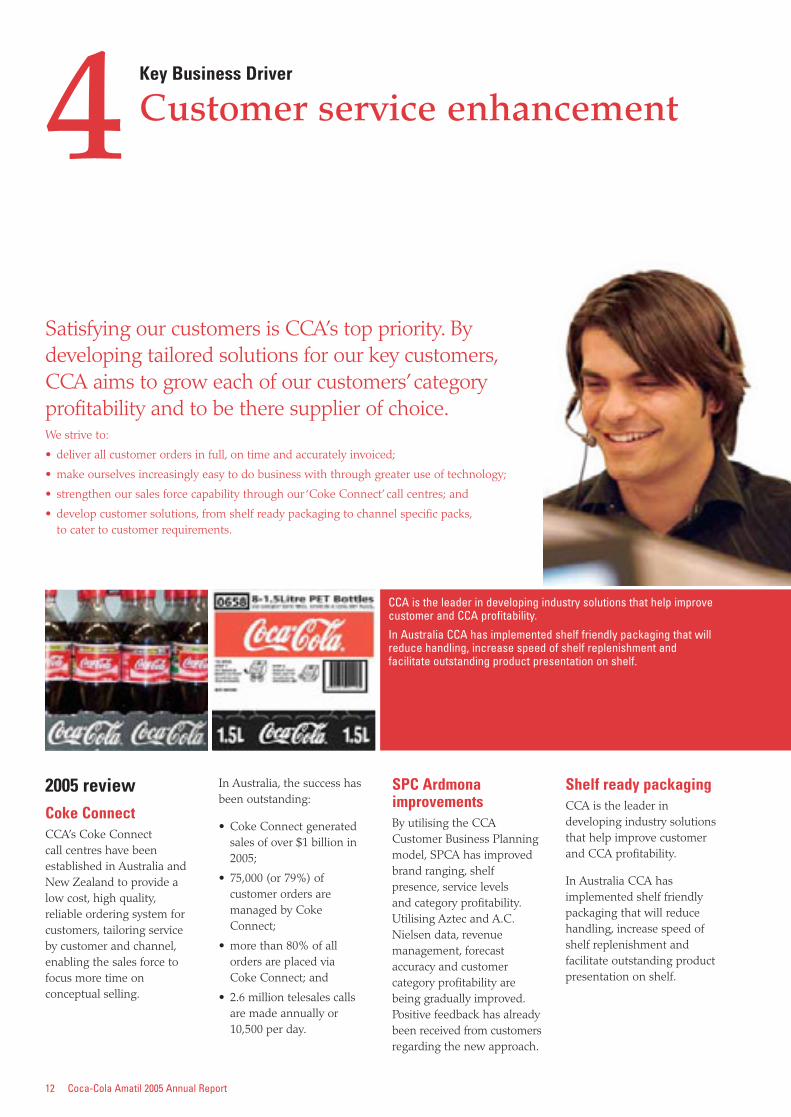
CCA is the leader in developing industry solutions that help improve customer and CCA profitability.
In Australia CCA has implemented shelf friendly packaging that will reduce handling, increase speed of shelf replenishment and facilitate outstanding product presentation on shelf.
2005 review Coke ConnectCCA’s Coke Connect call centres have beenestablished in Australia andNew Zealand to provide alow cost, high quality,reliable ordering system forcustomers, tailoring serviceby customer and channel,enabling the sales force tofocus more time onconceptual selling.
In Australia, the success hasbeen outstanding:
• Coke Connect generatedsales of over $1 billion in2005;
• 75,000 (or 79%) ofcustomer orders aremanaged by CokeConnect;
• more than 80% of allorders are placed via Coke Connect; and
• 2.6 million telesales callsare made annually or10,500 per day.
SPC ArdmonaimprovementsBy utilising the CCACustomer Business Planningmodel, SPCA has improvedbrand ranging, shelfpresence, service levels and category profitability.Utilising Aztec and A.C.Nielsen data, revenuemanagement, forecastaccuracy and customercategory profitability arebeing gradually improved.Positive feedback has alreadybeen received from customersregarding the new approach.
Shelf ready packagingCCA is the leader indeveloping industry solutionsthat help improve customerand CCA profitability.
In Australia CCA hasimplemented shelf friendlypackaging that will reducehandling, increase speed ofshelf replenishment andfacilitate outstanding productpresentation on shelf.
12 Coca-Cola Amatil 2005 Annual Report
4 Key Business Driver
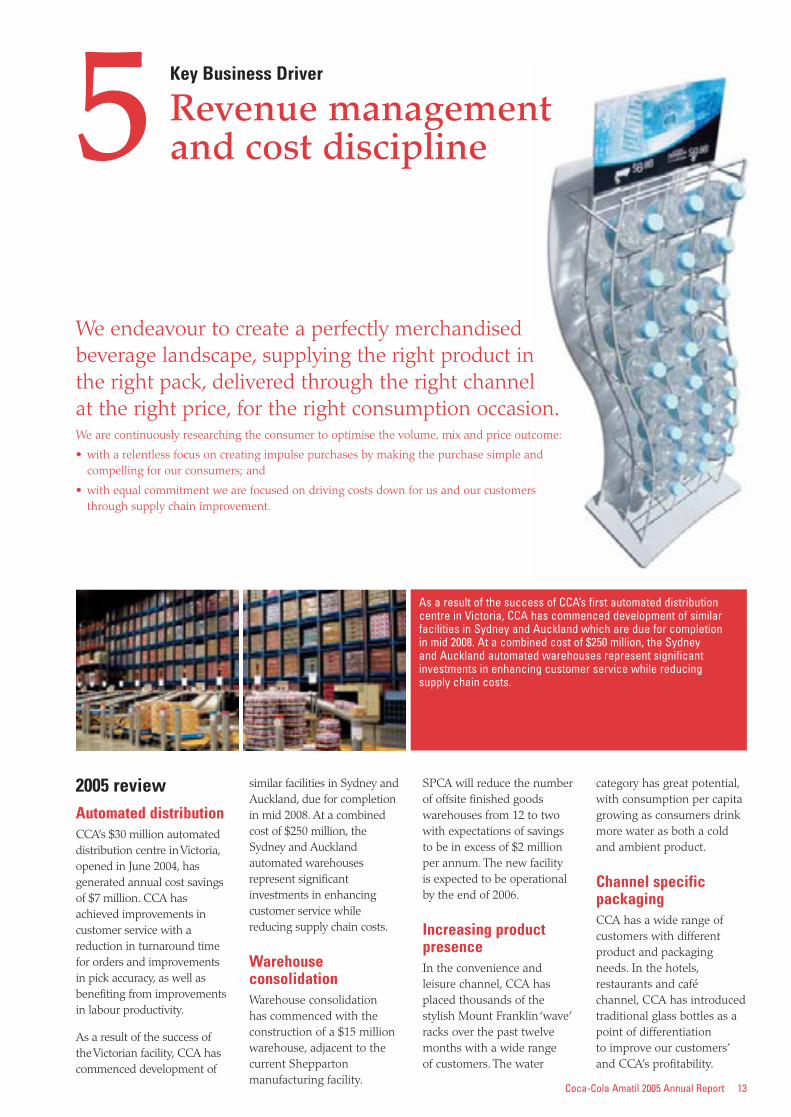
Customer service enhancement
Satisfying our customers is CCA’s top priority. Bydeveloping tailored solutions for our key customers,CCA aims to grow each of our customers’categoryprofitability and to be there supplier of choice.We strive to:
• deliver all customer orders in full, on time and accurately invoiced;
• make ourselves increasingly easy to do business with through greater use of technology;
• strengthen our sales force capability through our ‘Coke Connect’ call centres; and
• develop customer solutions, from shelf ready packaging to channel specific packs,to cater to customer requirements.
5 Key Business Driver
Revenue management and cost discipline
Coca-Cola Amatil 2005 Annual Report 13
We endeavour to create a perfectly merchandisedbeverage landscape, supplying the right product inthe right pack, delivered through the right channel at the right price, for the right consumption occasion.We are continuously researching the consumer to optimise the volume, mix and price outcome:
• with a relentless focus on creating impulse purchases by making the purchase simple andcompelling for our consumers; and
• with equal commitment we are focused on driving costs down for us and our customersthrough supply chain improvement.
2005 review Automated distributionCCA’s $30 million automateddistribution centre in Victoria,opened in June 2004, hasgenerated annual cost savingsof $7 million. CCA hasachieved improvements incustomer service with areduction in turnaround timefor orders and improvementsin pick accuracy, as well asbenefiting from improvementsin labour productivity.
As a result of the success ofthe Victorian facility, CCA hascommenced development of
similar facilities in Sydney andAuckland, due for completionin mid 2008. At a combinedcost of $250 million, theSydney and Aucklandautomated warehousesrepresent significantinvestments in enhancingcustomer service whilereducing supply chain costs.
WarehouseconsolidationWarehouse consolidation has commenced with theconstruction of a $15 millionwarehouse, adjacent to thecurrent Sheppartonmanufacturing facility.
SPCA will reduce the numberof offsite finished goodswarehouses from 12 to twowith expectations of savingsto be in excess of $2 millionper annum. The new facilityis expected to be operationalby the end of 2006.
Increasing productpresenceIn the convenience andleisure channel, CCA hasplaced thousands of thestylish Mount Franklin ‘wave’racks over the past twelvemonths with a wide range of customers. The water
category has great potential,with consumption per capitagrowing as consumers drinkmore water as both a coldand ambient product.
Channel specificpackagingCCA has a wide range ofcustomers with differentproduct and packagingneeds. In the hotels,restaurants and café channel, CCA has introducedtraditional glass bottles as apoint of differentiation to improve our customers’and CCA’s profitability.
As a result of the success of CCA’s first automated distributioncentre in Victoria, CCA has commenced development of similarfacilities in Sydney and Auckland which are due for completion in mid 2008. At a combined cost of $250 million, the Sydney and Auckland automated warehouses represent significantinvestments in enhancing customer service while reducing supply chain costs.
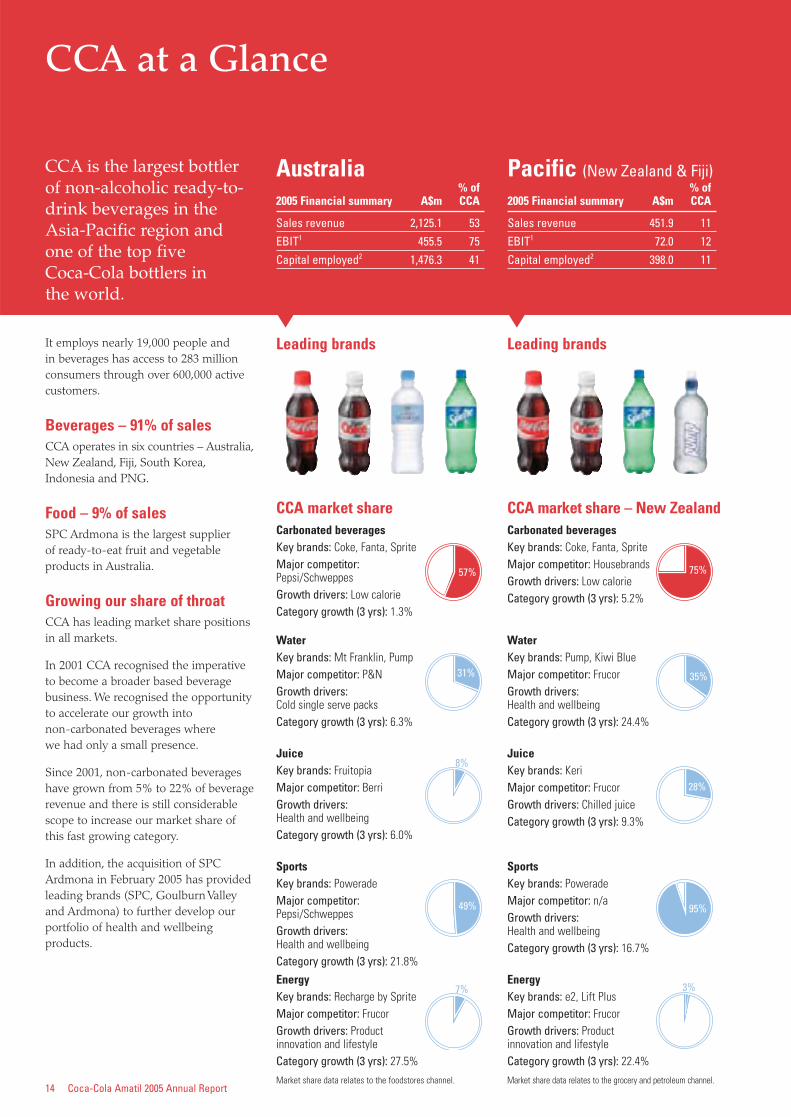
CCA market shareCarbonated beveragesKey brands: Coke, Fanta, SpriteMajor competitor:Pepsi/SchweppesGrowth drivers: Low calorieCategory growth (3 yrs): 1.3%
SportsKey brands: PoweradeMajor competitor:Pepsi/SchweppesGrowth drivers:Health and wellbeingCategory growth (3 yrs): 21.8%
WaterKey brands: Mt Franklin, PumpMajor competitor: P&NGrowth drivers:Cold single serve packsCategory growth (3 yrs): 6.3%
EnergyKey brands: Recharge by SpriteMajor competitor: FrucorGrowth drivers: Productinnovation and lifestyleCategory growth (3 yrs): 27.5%
Market share data relates to the foodstores channel.
JuiceKey brands: FruitopiaMajor competitor: BerriGrowth drivers:Health and wellbeingCategory growth (3 yrs): 6.0%
CCA market share – New ZealandCarbonated beveragesKey brands: Coke, Fanta, SpriteMajor competitor: HousebrandsGrowth drivers: Low calorieCategory growth (3 yrs): 5.2%
SportsKey brands: PoweradeMajor competitor: n/aGrowth drivers:Health and wellbeingCategory growth (3 yrs): 16.7%
WaterKey brands: Pump, Kiwi BlueMajor competitor: FrucorGrowth drivers:Health and wellbeingCategory growth (3 yrs): 24.4%
EnergyKey brands: e2, Lift PlusMajor competitor: FrucorGrowth drivers: Productinnovation and lifestyleCategory growth (3 yrs): 22.4%
Market share data relates to the grocery and petroleum channel.
JuiceKey brands: KeriMajor competitor: FrucorGrowth drivers: Chilled juiceCategory growth (3 yrs): 9.3%
14 Coca-Cola Amatil 2005 Annual Report
CCA at a Glance
CCA is the largest bottlerof non-alcoholic ready-to-drink beverages in theAsia-Pacific region andone of the top five Coca-Cola bottlers in the world.
Australia% of
2005 Financial summary A$m CCA
Sales revenue 2,125.1 53EBIT1 455.5 75Capital employed2 1,476.3 41
Pacific (New Zealand & Fiji)% of
2005 Financial summary A$m CCA
Sales revenue 451.9 11EBIT1 72.0 12Capital employed2 398.0 11
It employs nearly 19,000 people and in beverages has access to 283 millionconsumers through over 600,000 activecustomers.
Beverages – 91% of salesCCA operates in six countries – Australia,New Zealand, Fiji, South Korea,Indonesia and PNG.
Food – 9% of salesSPC Ardmona is the largest supplier of ready-to-eat fruit and vegetableproducts in Australia.
Growing our share of throatCCA has leading market share positionsin all markets.
In 2001 CCA recognised the imperativeto become a broader based beveragebusiness. We recognised the opportunityto accelerate our growth into non-carbonated beverages where we had only a small presence.
Since 2001, non-carbonated beverageshave grown from 5% to 22% of beveragerevenue and there is still considerablescope to increase our market share ofthis fast growing category.
In addition, the acquisition of SPCArdmona in February 2005 has providedleading brands (SPC, Goulburn Valleyand Ardmona) to further develop ourportfolio of health and wellbeingproducts.
Leading brands Leading brands
57%
31%
8%
49%
7%
75%
35%
28%
95%
3%
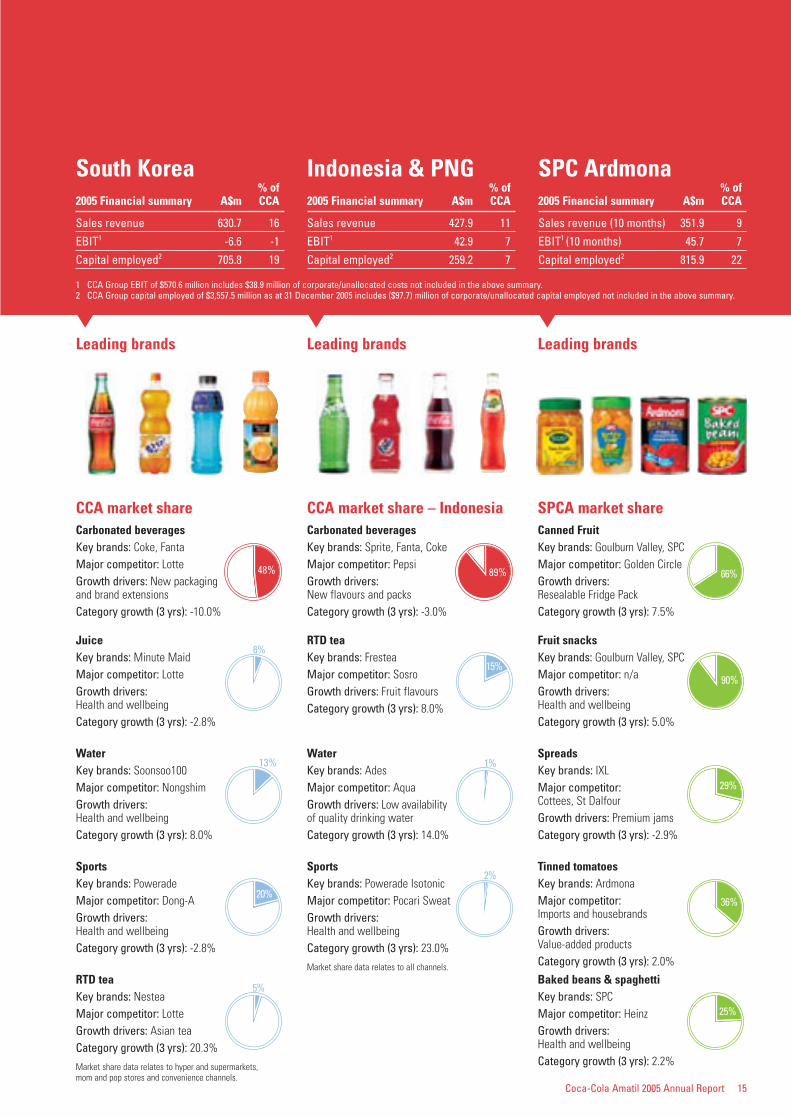
CCA market share – IndonesiaCarbonated beveragesKey brands: Sprite, Fanta, CokeMajor competitor: PepsiGrowth drivers:New flavours and packsCategory growth (3 yrs): -3.0%
SportsKey brands: Powerade IsotonicMajor competitor: Pocari SweatGrowth drivers:Health and wellbeingCategory growth (3 yrs): 23.0%
Market share data relates to all channels.
RTD teaKey brands: FresteaMajor competitor: SosroGrowth drivers: Fruit flavoursCategory growth (3 yrs): 8.0%
WaterKey brands: AdesMajor competitor: AquaGrowth drivers: Low availabilityof quality drinking waterCategory growth (3 yrs): 14.0%
SPCA market shareCanned FruitKey brands: Goulburn Valley, SPCMajor competitor: Golden CircleGrowth drivers:Resealable Fridge PackCategory growth (3 yrs): 7.5%
Tinned tomatoesKey brands: ArdmonaMajor competitor:Imports and housebrandsGrowth drivers:Value-added productsCategory growth (3 yrs): 2.0%
Fruit snacksKey brands: Goulburn Valley, SPCMajor competitor: n/aGrowth drivers:Health and wellbeingCategory growth (3 yrs): 5.0%
Baked beans & spaghettiKey brands: SPCMajor competitor: HeinzGrowth drivers:Health and wellbeingCategory growth (3 yrs): 2.2%
SpreadsKey brands: IXLMajor competitor:Cottees, St DalfourGrowth drivers: Premium jamsCategory growth (3 yrs): -2.9%
Coca-Cola Amatil 2005 Annual Report 15
South Korea% of
2005 Financial summary A$m CCA
Sales revenue 630.7 16EBIT1 -6.6 -1Capital employed2 705.8 19
Indonesia & PNG% of
2005 Financial summary A$m CCA
Sales revenue 427.9 11EBIT1 42.9 7Capital employed2 259.2 7
SPC Ardmona% of
2005 Financial summary A$m CCA
Sales revenue (10 months) 351.9 9EBIT1 (10 months) 45.7 7Capital employed2 815.9 22
Leading brands Leading brands Leading brands
CCA market shareCarbonated beveragesKey brands: Coke, FantaMajor competitor: LotteGrowth drivers: New packagingand brand extensionsCategory growth (3 yrs): -10.0%
SportsKey brands: PoweradeMajor competitor: Dong-AGrowth drivers:Health and wellbeingCategory growth (3 yrs): -2.8%
JuiceKey brands: Minute MaidMajor competitor: LotteGrowth drivers:Health and wellbeingCategory growth (3 yrs): -2.8%
RTD teaKey brands: NesteaMajor competitor: LotteGrowth drivers: Asian teaCategory growth (3 yrs): 20.3%
Market share data relates to hyper and supermarkets, mom and pop stores and convenience channels.
WaterKey brands: Soonsoo100Major competitor: NongshimGrowth drivers:Health and wellbeingCategory growth (3 yrs): 8.0%
48%
6%
13%
20%
5%
89%
15%
1%
2%
66%
90%
29%
36%
25%
1 CCA Group EBIT of $570.6 million includes $38.9 million of corporate/unallocated costs not included in the above summary.2 CCA Group capital employed of $3,557.5 million as at 31 December 2005 includes ($97.7) million of corporate/unallocated capital employed not included in the above summary.
16 Coca-Cola Amatil 2005 Annual Report
Business Review
2005 overviewThe Australian businessachieved EBIT growth of5.3% on revenue growth of4.1%. This is a solid result ina non-alcoholic ready-to-drink (NARTD) beveragemarket that experiencedsofter demand, due to higherfuel prices and generallylower consumer spending.Increases in commoditycosts, including PET resin,aluminium and sugar, wererecovered through higherpricing and other revenuemanagement initiatives.
CCA continued todemonstrate the strength of its brand portfolio,
maintaining its market sharein foodstores in 2005.CCA’s pricing discipline and category leadershipstrategy continue to deliver a sustainable platform forgrowing customer andconsumer relationships.
HighlightsProduct & package innovation:Major CSD launches for 2005included Sprite zero andCoke with Lime. Sprite zerohas been a great success,growing total Sprite revenueby 10%. CSD brands againdelivered positive revenuegrowth, led by diet CSDs,
with diet Coke growing morethan 8%. The diet categoryhas delivered 10% revenuegrowth per annum over the past three years asconsumers shift to lowercalorie beverage options. Thelaunch of Coca-Cola zero inJanuary 2006 has given asignificant boost to CCA’slow calorie CSD portfolio.
Non-carbonated beveragesexpansion: CCA’s non-carbonated beveragesdelivered another solid yearof growth, accounting forover 20% of CCA’s Australianrevenue. Growth was led bywater, with Mount Franklinand Pump both growingrevenue around 15% in 2005.Fruitopia J, Classic and
Alive (launched mid 2005)contributed 3 million unitcases of additional volume.
Cold drink cooler placement:CCA’s cooler placementprogram continues to drivestrong performances in boththe convenience and leisureand foodstores channels, witha 12% net increase in colddrink coolers in the year.
Outlet expansion: Retailcustomer numbers grew,in net terms, by almost 4%.This growth has beenachieved from a focus onranging our products in non-traditional outletsincluding pharmacies andnewsagents and by growingthe hotel, restaurant and café channel.
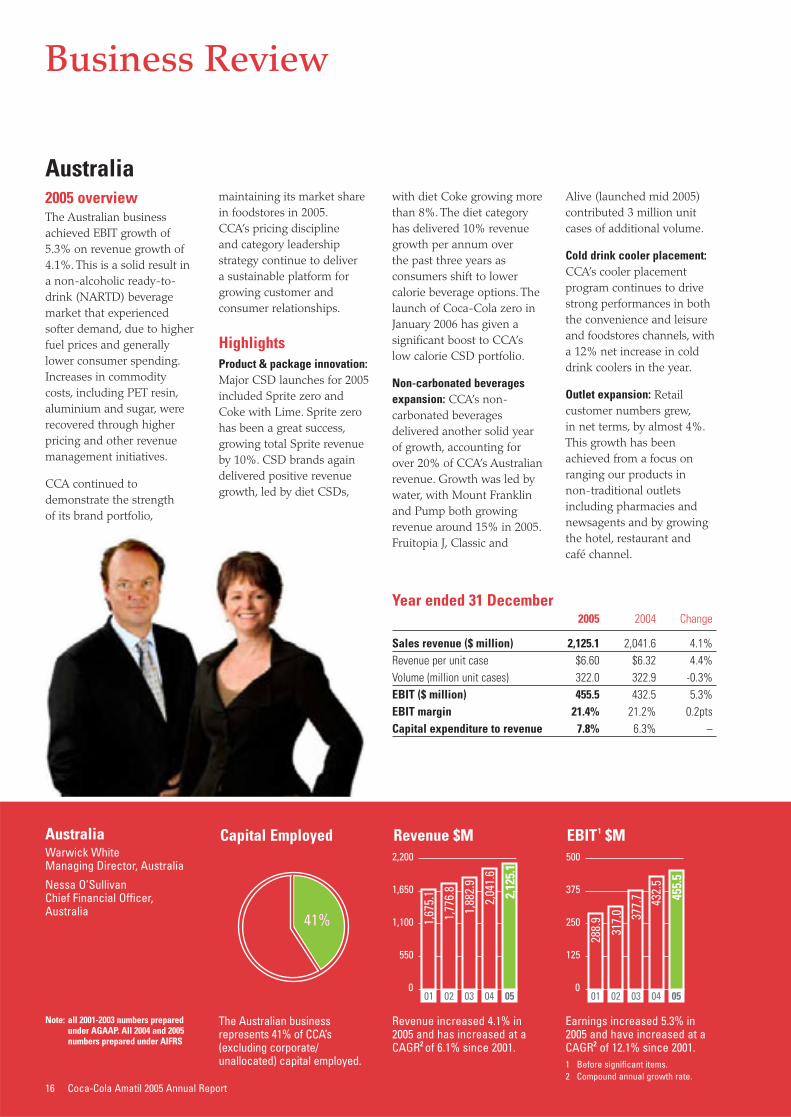
Year ended 31 December2005 2004 Change
Sales revenue ($ million) 2,125.1 2,041.6 4.1%Revenue per unit case $6.60 $6.32 4.4%Volume (million unit cases) 322.0 322.9 -0.3%EBIT ($ million) 455.5 432.5 5.3%EBIT margin 21.4% 21.2% 0.2ptsCapital expenditure to revenue 7.8% 6.3% –
The Australian businessrepresents 41% of CCA’s(excluding corporate/unallocated) capital employed.
Note: all 2001-2003 numbers preparedunder AGAAP. All 2004 and 2005numbers prepared under AIFRS
05040302010
550
1,100
1,650
2,200
2,12
5.1
2,04
1.6
1,88
2.9
1,77
6.8
1,67
5.1
05040302010
125
250
375
500
455.
5
432.
5
377.
7
317.
0
288.
9
Revenue increased 4.1% in2005 and has increased at aCAGR2 of 6.1% since 2001.
Earnings increased 5.3% in2005 and have increased at aCAGR2 of 12.1% since 2001.
AustraliaWarwick WhiteManaging Director, Australia
Nessa O’SullivanChief Financial Officer,Australia
Capital Employed Revenue $M EBIT1 $M
41%41%
Australia
1 Before significant items.2 Compound annual growth rate.
Coca-Cola Amatil 2005 Annual Report 17
Year ended 31 December2005 2004 Change
Sales revenue ($ million) 451.9 427.2 5.8%Revenue per unit case $6.73 $6.31 6.7%Volume (million unit cases) 67.1 67.7 -0.9%EBIT ($ million) 72.0 81.9 -12.1%EBIT margin 15.9% 19.2% -3.3ptsCapital expenditure to revenue 5.8% 5.4% –
Note: all 2001-2003 numbers preparedunder AGAAP. All 2004 and 2005numbers prepared under AIFRS
The Pacific region represents11% of CCA’s (excludingcorporate/unallocated)capital employed.
05040302010
115
230
345
460
451.
9
427.
2
411.
1
322.
2
271.
8
05040302010
30
60
90
72.081
.9
75.9
55.7
40.6
Revenue increased 5.8% in2005 and has increased at aCAGR2 of 13.6% since 2001.
Earnings decreased 12.1% in2005 but have increased at aCAGR2 of 15.4% since 2001.
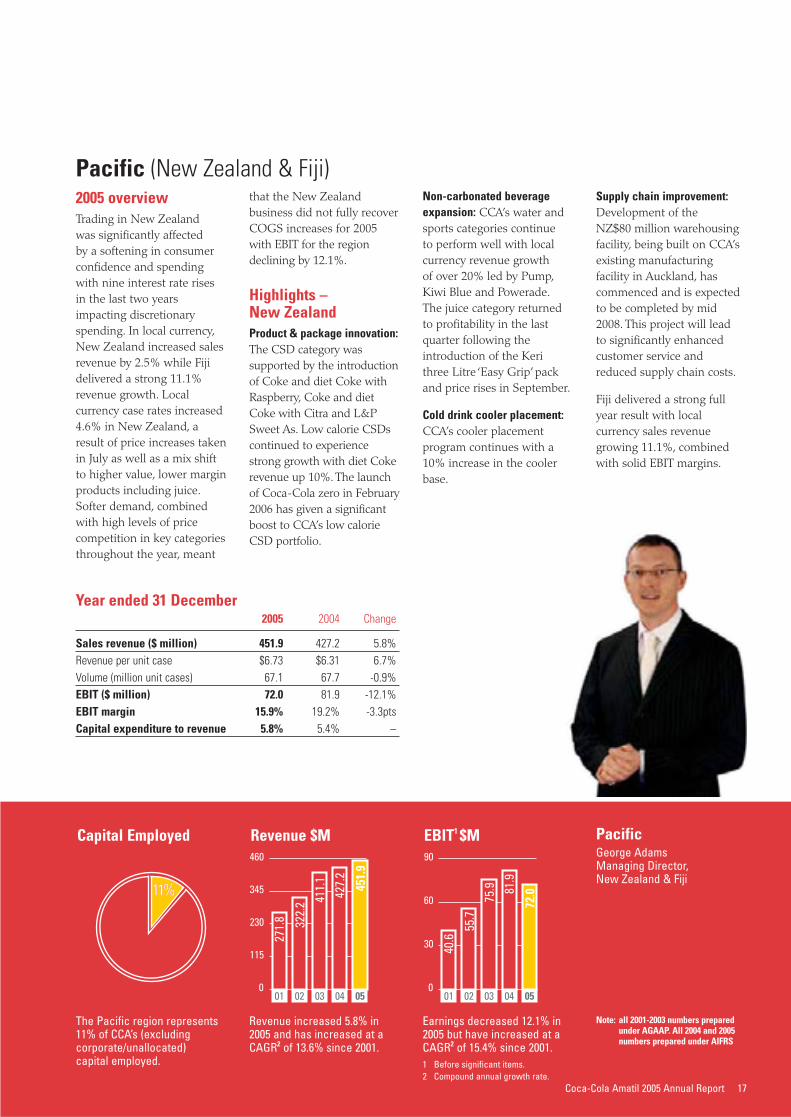
PacificGeorge AdamsManaging Director,New Zealand & Fiji
Capital Employed Revenue $M EBIT1 $M
11%11%
2005 overviewTrading in New Zealand was significantly affected by a softening in consumerconfidence and spendingwith nine interest rate risesin the last two yearsimpacting discretionaryspending. In local currency,New Zealand increased salesrevenue by 2.5% while Fijidelivered a strong 11.1%revenue growth. Localcurrency case rates increased4.6% in New Zealand, aresult of price increases takenin July as well as a mix shiftto higher value, lower marginproducts including juice.Softer demand, combinedwith high levels of pricecompetition in key categoriesthroughout the year, meant
that the New Zealandbusiness did not fully recoverCOGS increases for 2005with EBIT for the regiondeclining by 12.1%.
Highlights – New ZealandProduct & package innovation:The CSD category wassupported by the introductionof Coke and diet Coke withRaspberry, Coke and dietCoke with Citra and L&PSweet As. Low calorie CSDscontinued to experiencestrong growth with diet Cokerevenue up 10%. The launchof Coca-Cola zero in February2006 has given a significantboost to CCA’s low calorieCSD portfolio.
Non-carbonated beverageexpansion: CCA’s water andsports categories continue to perform well with localcurrency revenue growth of over 20% led by Pump,Kiwi Blue and Powerade.The juice category returnedto profitability in the lastquarter following theintroduction of the Keri three Litre ‘Easy Grip’ packand price rises in September.
Cold drink cooler placement:CCA’s cooler placementprogram continues with a10% increase in the coolerbase.
Supply chain improvement:Development of the NZ$80 million warehousingfacility, being built on CCA’sexisting manufacturingfacility in Auckland, hascommenced and is expectedto be completed by mid2008. This project will lead to significantly enhancedcustomer service andreduced supply chain costs.
Fiji delivered a strong fullyear result with localcurrency sales revenuegrowing 11.1%, combinedwith solid EBIT margins.
Pacific (New Zealand & Fiji)
1 Before significant items.2 Compound annual growth rate.
18 Coca-Cola Amatil 2005 Annual Report
Business Review continued
Year ended 31 December2005 2004 Change
Sales revenue ($ million) 630.7 561.5 12.3%Revenue per unit case $5.01 $4.58 9.4%Volume (million unit cases) 126.0 122.7 2.7%EBIT ($ million)1 -6.6 4.6 –EBIT margin1 -1.0% 0.8% -1.8ptsCapital expenditure to revenue 6.7% 6.2% –
The South Korean businessrepresents 19% of CCA’s(excluding corporate/unallocated) capital employed.
05040302010
220
440
660
880
630.
7
561.
5
612.
5
837.
5
844.
5
0504030201
0
20
40
60
80
-6.64.
614.2
62.0
35.3
Revenue increased 12.3% to$630.7 million in 2005.
Earnings decreased by $11.2 million in 2005. 1 Before significant items.
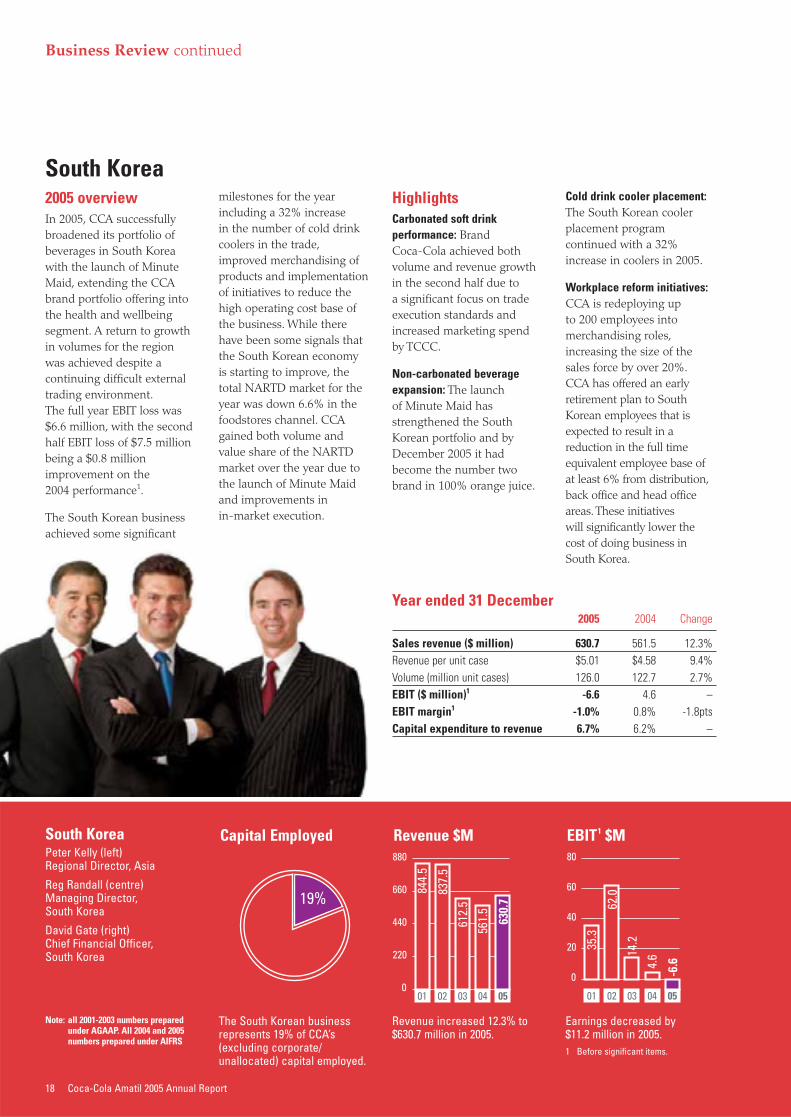
South KoreaPeter Kelly (left)Regional Director, Asia
Reg Randall (centre)Managing Director, South Korea
David Gate (right)Chief Financial Officer, South Korea
Capital Employed Revenue $M EBIT1 $M
19%
2005 overviewIn 2005, CCA successfullybroadened its portfolio ofbeverages in South Koreawith the launch of MinuteMaid, extending the CCAbrand portfolio offering intothe health and wellbeingsegment. A return to growthin volumes for the regionwas achieved despite acontinuing difficult externaltrading environment.The full year EBIT loss was$6.6 million, with the secondhalf EBIT loss of $7.5 millionbeing a $0.8 millionimprovement on the 2004 performance1.
The South Korean businessachieved some significant
milestones for the yearincluding a 32% increase in the number of cold drinkcoolers in the trade,improved merchandising ofproducts and implementationof initiatives to reduce thehigh operating cost base ofthe business. While therehave been some signals thatthe South Korean economyis starting to improve, thetotal NARTD market for theyear was down 6.6% in thefoodstores channel. CCAgained both volume andvalue share of the NARTDmarket over the year due tothe launch of Minute Maidand improvements in in-market execution.
HighlightsCarbonated soft drinkperformance: Brand Coca-Cola achieved bothvolume and revenue growthin the second half due to a significant focus on tradeexecution standards andincreased marketing spendby TCCC.
Non-carbonated beverageexpansion: The launch of Minute Maid hasstrengthened the SouthKorean portfolio and byDecember 2005 it hadbecome the number twobrand in 100% orange juice.
Cold drink cooler placement:The South Korean coolerplacement programcontinued with a 32%increase in coolers in 2005.
Workplace reform initiatives:CCA is redeploying up to 200 employees intomerchandising roles,increasing the size of thesales force by over 20%.CCA has offered an earlyretirement plan to SouthKorean employees that isexpected to result in areduction in the full timeequivalent employee base ofat least 6% from distribution,back office and head officeareas. These initiatives will significantly lower thecost of doing business in South Korea.
South Korea
Note: all 2001-2003 numbers preparedunder AGAAP. All 2004 and 2005numbers prepared under AIFRS
Coca-Cola Amatil 2005 Annual Report 19
Year ended 31 December2005 2004 Change
Sales revenue ($ million) 427.9 419.8 1.9%Revenue per unit case $3.45 $3.71 -7.0%Volume (million unit cases) 124.0 113.1 9.6%EBIT ($ million)1 42.9 32.4 32.4%EBIT margin1 10.0% 7.7% 2.3ptsCapital expenditure to revenue 9.0% 6.1% –
Indonesia & PNG represent 7% of CCA’s (excludingcorporate/unallocated)capital employed.
05040302010
100
200
300
400
500
427.
9
419.
8
450.
6496.
1
479.
6
05040302010
10
20
30
40
50
42.9
32.4
28.5
28.8
49.8
Revenue increased 1.9% to$427.9 million in 2005.
Earnings increased 32.4% in2005 and have increased at aCAGR2 of 14.2% since 2002.
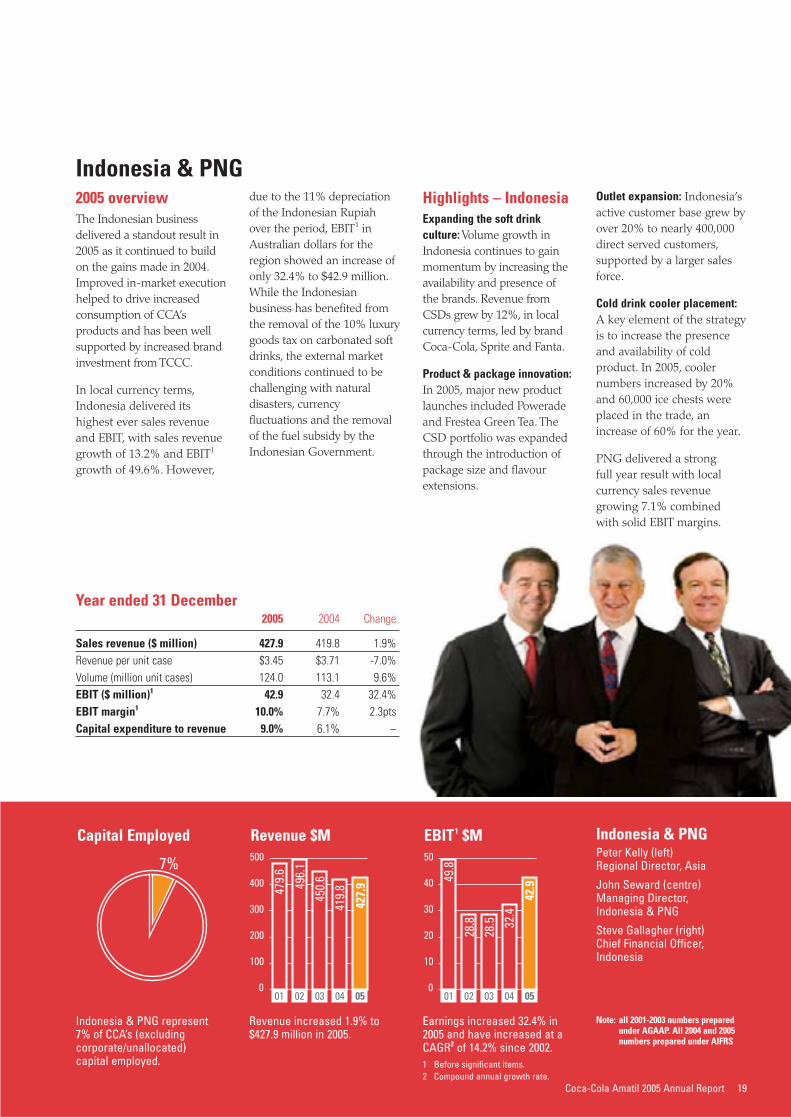
Indonesia & PNGPeter Kelly (left)Regional Director, Asia
John Seward (centre)Managing Director, Indonesia & PNG
Steve Gallagher (right)Chief Financial Officer,Indonesia
Capital Employed Revenue $M EBIT1 $M
7%
2005 overviewThe Indonesian businessdelivered a standout result in2005 as it continued to buildon the gains made in 2004.Improved in-market executionhelped to drive increasedconsumption of CCA’sproducts and has been wellsupported by increased brandinvestment from TCCC.
In local currency terms,Indonesia delivered itshighest ever sales revenueand EBIT, with sales revenuegrowth of 13.2% and EBIT1
growth of 49.6%. However,
due to the 11% depreciationof the Indonesian Rupiahover the period, EBIT1 inAustralian dollars for theregion showed an increase ofonly 32.4% to $42.9 million.While the Indonesianbusiness has benefited fromthe removal of the 10% luxurygoods tax on carbonated softdrinks, the external marketconditions continued to bechallenging with naturaldisasters, currencyfluctuations and the removalof the fuel subsidy by theIndonesian Government.
Highlights – IndonesiaExpanding the soft drinkculture: Volume growth inIndonesia continues to gainmomentum by increasing theavailability and presence ofthe brands. Revenue fromCSDs grew by 12%, in localcurrency terms, led by brandCoca-Cola, Sprite and Fanta.
Product & package innovation:In 2005, major new productlaunches included Poweradeand Frestea Green Tea. TheCSD portfolio was expandedthrough the introduction ofpackage size and flavourextensions.
Outlet expansion: Indonesia’sactive customer base grew byover 20% to nearly 400,000direct served customers,supported by a larger salesforce.
Cold drink cooler placement:A key element of the strategyis to increase the presenceand availability of coldproduct. In 2005, coolernumbers increased by 20%and 60,000 ice chests wereplaced in the trade, anincrease of 60% for the year.
PNG delivered a strong full year result with localcurrency sales revenuegrowing 7.1% combined with solid EBIT margins.
Indonesia & PNG
1 Before significant items.2 Compound annual growth rate.
Note: all 2001-2003 numbers preparedunder AGAAP. All 2004 and 2005numbers prepared under AIFRS
20 Coca-Cola Amatil 2005 Annual Report
Business Review continued
Year ended 31 December2005 2004 Change
(10 months)
Sales revenue ($ million) 351.9 – –EBIT ($ million) 45.7 – –EBIT margin 13.0% – –Capital expenditure to revenue 6.2% – –
SPC Ardmona represents 22%of CCA’s (excluding corporate/unallocated) capital employed.
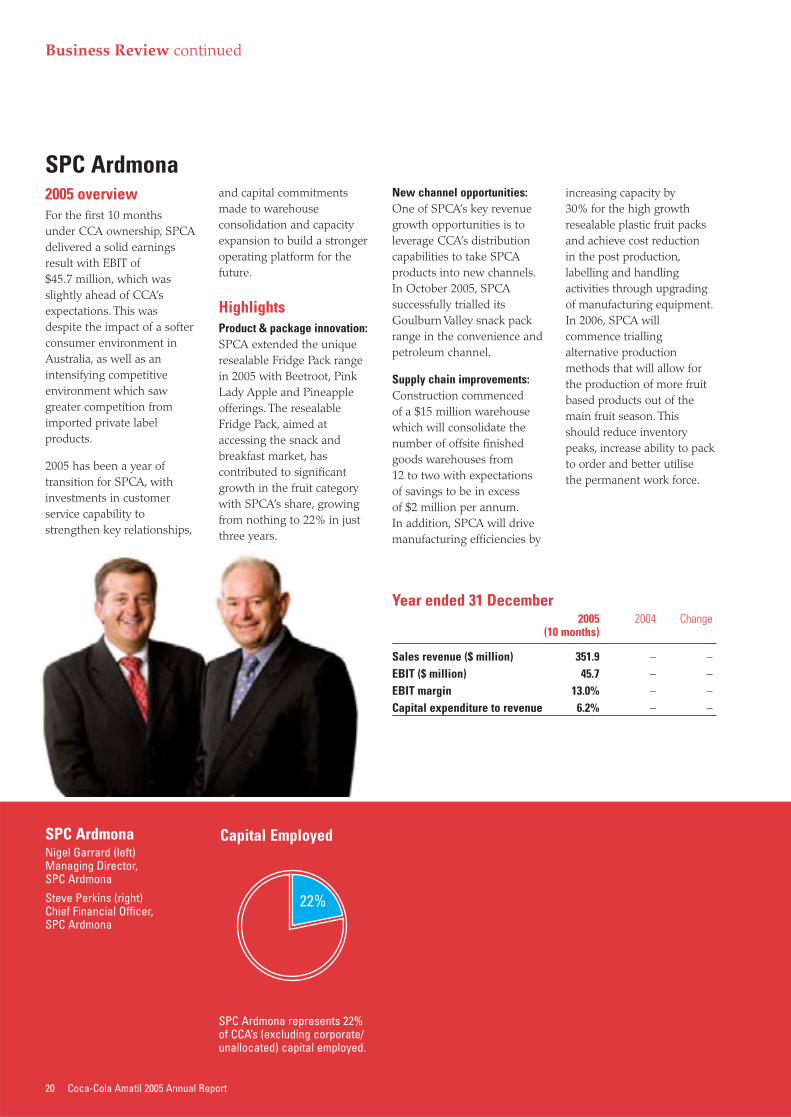
SPC ArdmonaNigel Garrard (left)Managing Director, SPC Ardmona
Steve Perkins (right)Chief Financial Officer,SPC Ardmona
Capital Employed
22%
2005 overviewFor the first 10 months under CCA ownership, SPCAdelivered a solid earningsresult with EBIT of $45.7 million, which wasslightly ahead of CCA’sexpectations. This wasdespite the impact of a softerconsumer environment inAustralia, as well as anintensifying competitiveenvironment which sawgreater competition fromimported private labelproducts.
2005 has been a year oftransition for SPCA, withinvestments in customerservice capability tostrengthen key relationships,
and capital commitmentsmade to warehouseconsolidation and capacityexpansion to build a strongeroperating platform for thefuture.
HighlightsProduct & package innovation:SPCA extended the uniqueresealable Fridge Pack rangein 2005 with Beetroot, PinkLady Apple and Pineappleofferings. The resealableFridge Pack, aimed ataccessing the snack andbreakfast market, hascontributed to significantgrowth in the fruit categorywith SPCA’s share, growingfrom nothing to 22% in justthree years.
New channel opportunities:One of SPCA’s key revenuegrowth opportunities is toleverage CCA’s distributioncapabilities to take SPCAproducts into new channels.In October 2005, SPCAsuccessfully trialled itsGoulburn Valley snack packrange in the convenience andpetroleum channel.
Supply chain improvements:Construction commenced of a $15 million warehousewhich will consolidate thenumber of offsite finishedgoods warehouses from 12 to two with expectations of savings to be in excess of $2 million per annum.In addition, SPCA will drivemanufacturing efficiencies by
increasing capacity by 30% for the high growth resealable plastic fruit packsand achieve cost reduction in the post production,labelling and handlingactivities through upgradingof manufacturing equipment.In 2006, SPCA willcommence triallingalternative productionmethods that will allow forthe production of more fruitbased products out of themain fruit season. Thisshould reduce inventorypeaks, increase ability to packto order and better utilise the permanent work force.
SPC Ardmona
Coca-Cola Amatil 2005 Annual Report 21
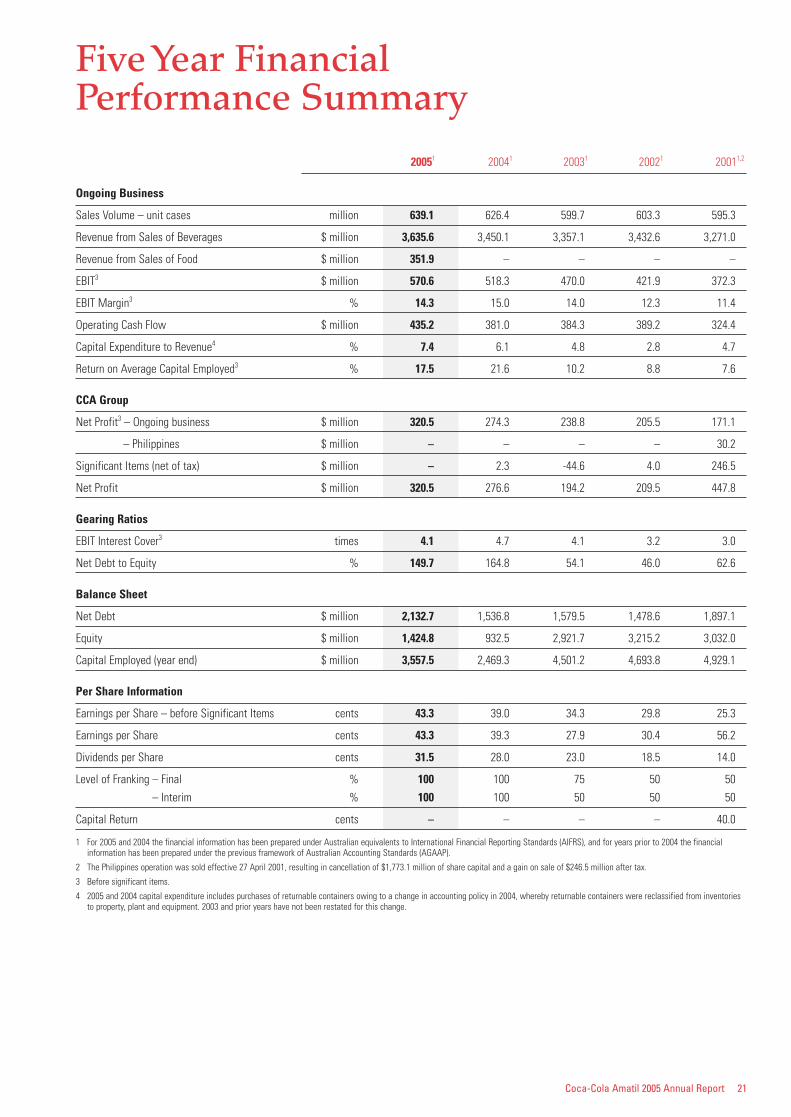
Five Year Financial Performance Summary
20051 20041 20031 20021 20011,2
Ongoing Business
Sales Volume – unit cases million 639.1 626.4 599.7 603.3 595.3
Revenue from Sales of Beverages $ million 3,635.6 3,450.1 3,357.1 3,432.6 3,271.0
Revenue from Sales of Food $ million 351.9 – – – –
EBIT3 $ million 570.6 518.3 470.0 421.9 372.3
EBIT Margin3 % 14.3 15.0 14.0 12.3 11.4
Operating Cash Flow $ million 435.2 381.0 384.3 389.2 324.4
Capital Expenditure to Revenue4 % 7.4 6.1 4.8 2.8 4.7
Return on Average Capital Employed3 % 17.5 21.6 10.2 8.8 7.6
CCA Group
Net Profit3 – Ongoing business $ million 320.5 274.3 238.8 205.5 171.1
– Philippines $ million – – – – 30.2
Significant Items (net of tax) $ million – 2.3 -44.6 4.0 246.5
Net Profit $ million 320.5 276.6 194.2 209.5 447.8
Gearing Ratios
EBIT Interest Cover3 times 4.1 4.7 4.1 3.2 3.0
Net Debt to Equity % 149.7 164.8 54.1 46.0 62.6
Balance Sheet
Net Debt $ million 2,132.7 1,536.8 1,579.5 1,478.6 1,897.1
Equity $ million 1,424.8 932.5 2,921.7 3,215.2 3,032.0
Capital Employed (year end) $ million 3,557.5 2,469.3 4,501.2 4,693.8 4,929.1
Per Share Information
Earnings per Share – before Significant Items cents 43.3 39.0 34.3 29.8 25.3
Earnings per Share cents 43.3 39.3 27.9 30.4 56.2
Dividends per Share cents 31.5 28.0 23.0 18.5 14.0
Level of Franking – Final % 100 100 75 50 50
– Interim % 100 100 50 50 50
Capital Return cents – – – – 40.0
1 For 2005 and 2004 the financial information has been prepared under Australian equivalents to International Financial Reporting Standards (AIFRS), and for years prior to 2004 the financialinformation has been prepared under the previous framework of Australian Accounting Standards (AGAAP).
2 The Philippines operation was sold effective 27 April 2001, resulting in cancellation of $1,773.1 million of share capital and a gain on sale of $246.5 million after tax.
3 Before significant items.
4 2005 and 2004 capital expenditure includes purchases of returnable containers owing to a change in accounting policy in 2004, whereby returnable containers were reclassified from inventoriesto property, plant and equipment. 2003 and prior years have not been restated for this change.
22 Coca-Cola Amatil 2005 Annual Report
Corporate Social Responsibilities Report
Across our six markets, CCA operates as a local business united with each local area through employees, customers, consumers andneighbours and government and community groups.
As a business, CCA activelysupports its localcommunities through:
• providing directemployment in the regionand ensuring employeesdevelop skills in safeworkplaces;
• using local materials andsuppliers wherever practicalto aid the development ofthat location; and
• providing a profitableconsumer product thatassists our customers’businesses to grow.
Providing support to socialand environmental activitiesis firmly entrenched in CCA’sbusiness plans. The creationof profits enables CCA toexpand our community andenvironmental programs. Inturn, these programs help to
sustain business performanceby strengthening localeconomies, improvingbusiness efficiency anddeveloping relationships withstakeholders, ultimatelyleading to increasedshareholder returns.
Our communityAcross six geographiclocations, CCA providessupport to establishedprograms while alsosupporting new, innovativeprograms that focus on socialissues which benefit localcommunities.
In Australia, Indonesia andSouth Korea, this support is channelled throughFoundations jointly fundedby CCA and TCCC. Manyprograms supported through
these Foundations are basedon the promotion of healthyactive lifestyles in youngpeople and empoweringthem through education.
In 2005, CCA Indonesiacontinued to assist inrebuilding efforts after the 2004 Boxing Day Tsunami. Support throughThe Coca-Cola IndonesiaFoundation (CCIF) includes the allocation of AUD 1 million to be spentacross 2005-06 on revitalizingsmall businesses within Aceh. To date, AUD 500,000 has been disbursed to 250entrepreneurs in the form of kiosks, ice chests, workingcapital and other assistance to support their businesses.
Coca-Cola Indonesia’sLearning Centre Programreceived a CSR Award fromthe Asian Institute ofManagement for assistancewhich has helped transformpublic libraries into LearningCentres. Since 2000, theProgram has developed 24 Learning Centres across14 provinces.
In 2005, CCA in South Koreasupported local events suchas the 9th InterdisciplinaryCongress on Women andFood Bank’s Food DonationDay, with Foundationsupport channelled to 16 underprivileged groupsincluding orphanages andfacilities for the disabled and elderly.
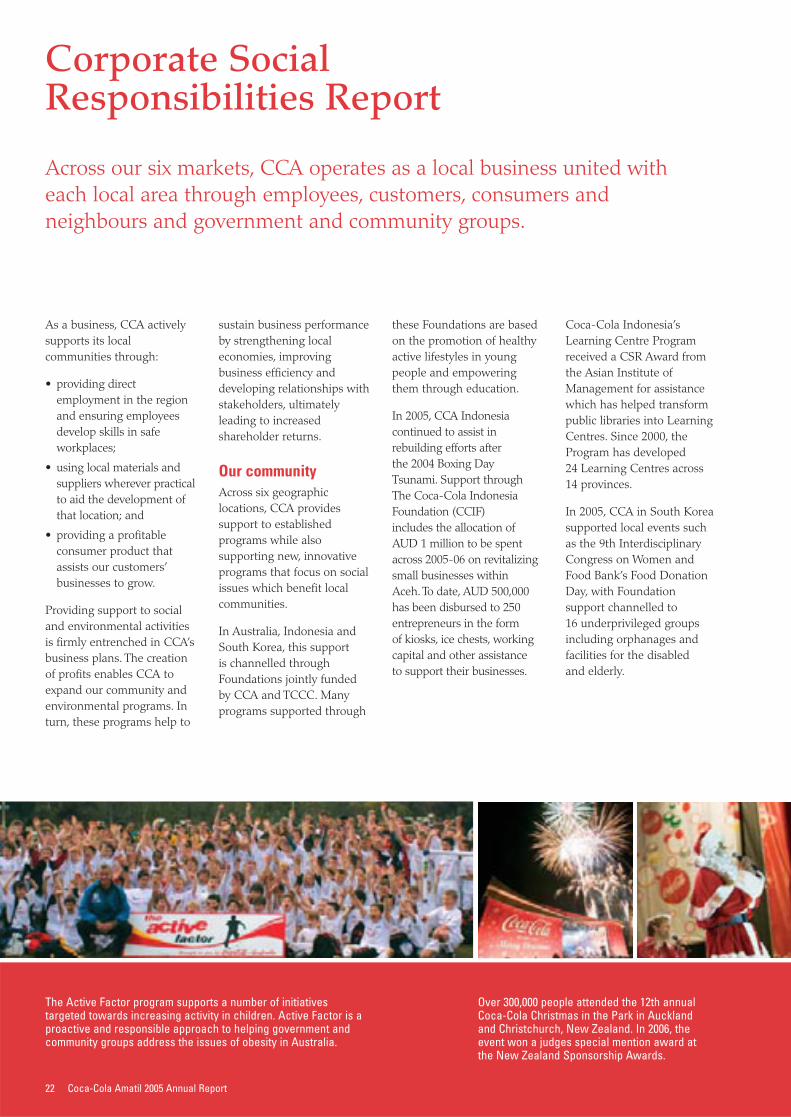
The Active Factor program supports a number of initiativestargeted towards increasing activity in children. Active Factor is aproactive and responsible approach to helping government andcommunity groups address the issues of obesity in Australia.
Over 300,000 people attended the 12th annualCoca-Cola Christmas in the Park in Auckland and Christchurch, New Zealand. In 2006, theevent won a judges special mention award at the New Zealand Sponsorship Awards.
Coca-Cola Amatil 2005 Annual Report 23
New Zealand, PNG and Fijifocused their 2005 activitieson a range of communityprograms.
In New Zealand, CCAcontinued its support ofcommunity and non-profitorganisations includingYouthline and Out of School Care and Recreation(OSCAR). In partnershipwith OSCAR, the Coca-Colasystem supports activelifestyles through theunbranded ‘Go Kids!’program, with up to 11,000children participating each day.
In 2005, Australia allocatedapproximately AUD 1 millionthrough the Coca-ColaAustralia Foundation. Fundswere allocated to innovativeprograms focused ondisadvantaged youth as well
as programs which deliverthe capacity to touch andchange lives.
Examples of the programssupported in 2005 include:
• Australian Literacy andNumeracy Foundation’s‘Remote Schools Project’which provided accreditedliteracy course work toEnglish teachers andIndigenous non-teachersin remote, isolated orcountry schools;
• The Barnardos Australia‘Parenting Skills Program’which is aimed atdeveloping a unique skills-based parentingprogram for the family oftroubled adolescents; and
• Beyond Empathy’s‘Pathways’ mentoringstrategy which is aimed atproviding disadvantaged
young people withleadership skills toestablish and manage artsprojects within their owncommunities, to effectchange and eventuallybreak the welfare cycle.
Health and wellbeingCCA is aware of thecommunity concern andongoing public discussionover the impact that lessactive lifestyles are having onour physical health. CCA istaking a leadership positionin the debate and developinga wide-ranging approach tothe issue:
• we are expanding ourbeverage range to providechoice for everyone –carbonated beveragescontaining sugar, lowcalorie beverages, water,plain and flavoured
mineral waters, fruit juices,sports drinks, iced tea andcoffee. Our fruit andvegetable productioncompany, SPC Ardmona,makes a large range ofhealthy fruit snacks;
• we actively supportprograms designed toencourage young people to be more physicallyactive; and
• we engage in responsiblemarketing practicesparticularly in regard tochildren – we do not aimor direct any marketingactivity to children under12, and since 2004,we have voluntarilywithdrawn our carbonatedbeverages containing sugarfrom primary schools inAustralia and NewZealand for consumptionby students.
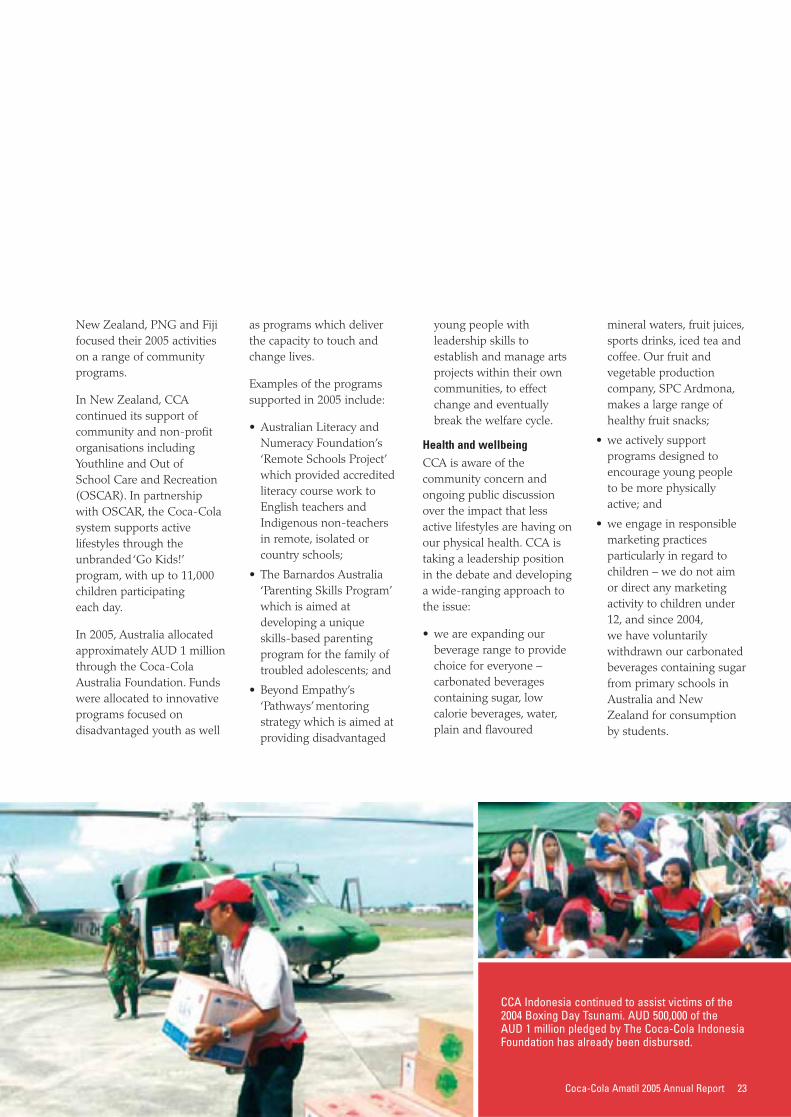
CCA Indonesia continued to assist victims of the2004 Boxing Day Tsunami. AUD 500,000 of the AUD 1 million pledged by The Coca-Cola IndonesiaFoundation has already been disbursed.
24 Coca-Cola Amatil 2005 Annual Report
Corporate Social Responsibilities Report continued
Our environmentCCA is committed tounderstanding andminimising any adverseenvironmental impacts of our beverage and foodmanufacturing activities,recognising the key areas of impact are water andenergy use, and postconsumer waste.
Our key beverage operationsacross Australia, NewZealand, South Korea and Indonesia have certifiedISO14001 environmentalmanagement systems inplace, ensuring risksassociated with ourmanufacturing processes are identified andappropriately managed.
Saving water/reducing wasteAdvanced data collectionprocesses enable us to track our environmentalperformance within the keyareas of water and energyuse and waste, and identifyopportunities for furtherimprovement. For beveragemanufacturing, CCAmeasures the amount ofwater and energy used in theproduction of one litre of finished beverage. 2005saw Australian beverageoperations further embracewater conservation with theimplementation of watersavings initiatives resulting in a 4% reduction in wateruse per finished beveragelitre. This equates to a directwater saving of over 95 million litres.
Improvements in wastemanagement across ourAustralian beverageoperations have also seen anincrease in onsite recyclingrates, bringing the currentrate to 77% diversion fromlandfill. In New Zealand,CCA currently recycles 86%of all its solid waste and isconstantly looking for newand innovative ways toreduce waste.
Better packagingCCA’s commitment to wastereduction and best practicein manufacturing alsoextends to our continuedinvolvement in nationallybased packaging initiatives.
We recognise that as amanufacturer of fast-movingconsumer goods, we have arole to play in reducing theenvironmental impact of ourpackaging on the community.CCA’s methodology foraddressing this issue variesacross our geographiclocations due to variations inpackaging, reprocessing andcollection facilities.
The New Zealand businesshas joined forces withindustry, government, andwaste management non-government organisations as active members of the2004 Packaging Accord andthe Government-led LitterAlliance. The Accord hasstretch recycling targets forpaper (55%), aluminium(65%), glass (55%), plastic(23%) and steel (43%) to be
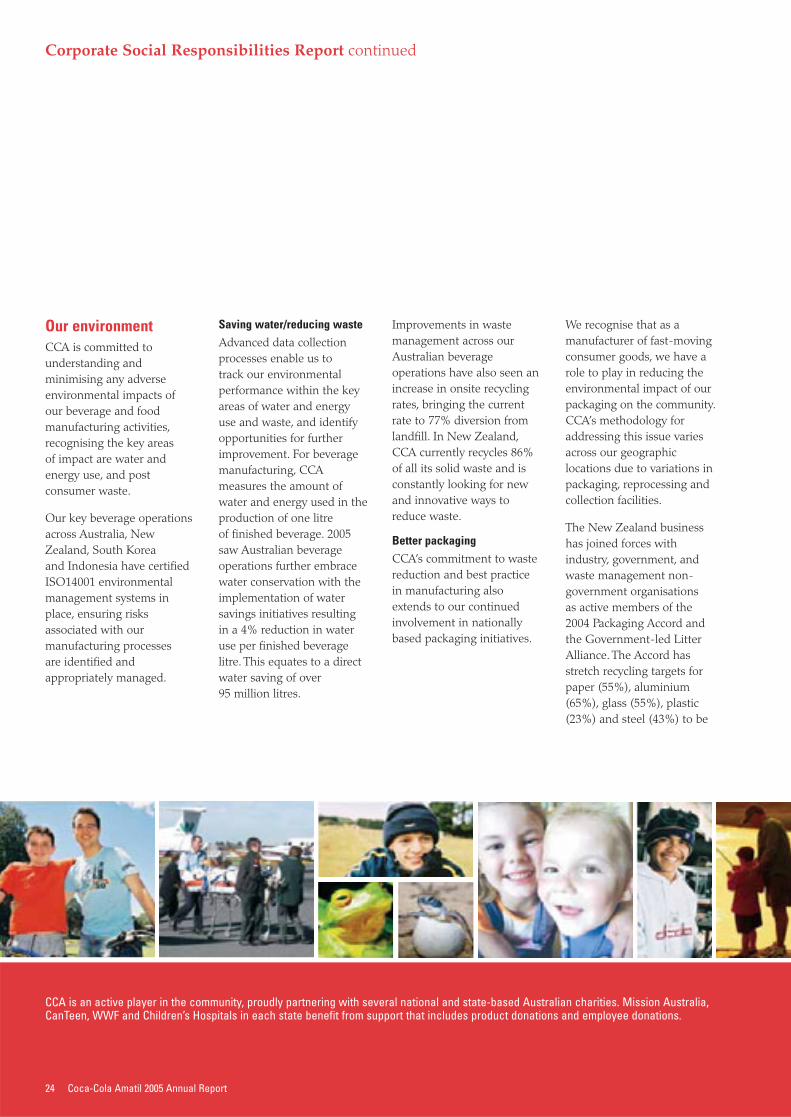
CCA is an active player in the community, proudly partnering with several national and state-based Australian charities. Mission Australia,CanTeen, WWF and Children’s Hospitals in each state benefit from support that includes product donations and employee donations.
Coca-Cola Amatil 2005 Annual Report 25
reached by 2008. CCA playeda pivotal role in the industrygroup that solved the glasscollection crisis that almosttoppled kerbside collection in New Zealand.
The New Zealand businesshas also established abeverage industry actiongroup (EBAG) to address and achieve the targets setunder the Packaging Accord.Achievements of this groupto date include membercompanies ensuring all theirpackaging is recyclable anddevelopment of nationalevent recycling guidelines.These have been successfullytrialled at Coca-ColaChristmas in the Park inAuckland and Christchurch.
CCA, with the support of theMinister of Environment andEBAG, launched the firstindustry-led public placerecycling trial in Botany,Auckland.
In Australia, CCA continuesits involvement in theNational PackagingCovenant (NPC), throughinitiatives undertakenthroughout our operationsand within the publicdomain. The co-regulatoryagreement between industryand all spheres ofgovernment has set anoverall recycling target of65% for achievement by2010. CCA will play an activerole in contributing to theachievement of this target.Implementation of the
Environmental Code ofPractice for Packagingdemonstrates ourcommitment to theprinciples of shared product stewardship.
Helping consumers recycleIn 2004, CCA Australiacommenced a five yearstrategy working with localgovernment and authoritiesto increase the recovery ofpackaging for our productsconsumed away from thehome. CCA’s Public PlaceRecycling program continuesto grow in strength andimpact since its launch in December 2004 andinitiatives established in 2005include targeted recyclingprograms at Taronga ParkZoo and Thredbo AlpineVillage in New South Wales.
SPCA has a renewed focuson environmentalperformance, with targetedreductions in water andenergy consumption, andsolid waste reduction to take effect in 2006.
Changes in packaging designhave resulted in a number of packaging modifications,including reduction in canheight which has saved morethan 100 tonnes of steel.SPCA is also exploringpartnership programs withinits local communities whichpromote public placerecycling and education toreinforce more sustainablewaste behaviours.
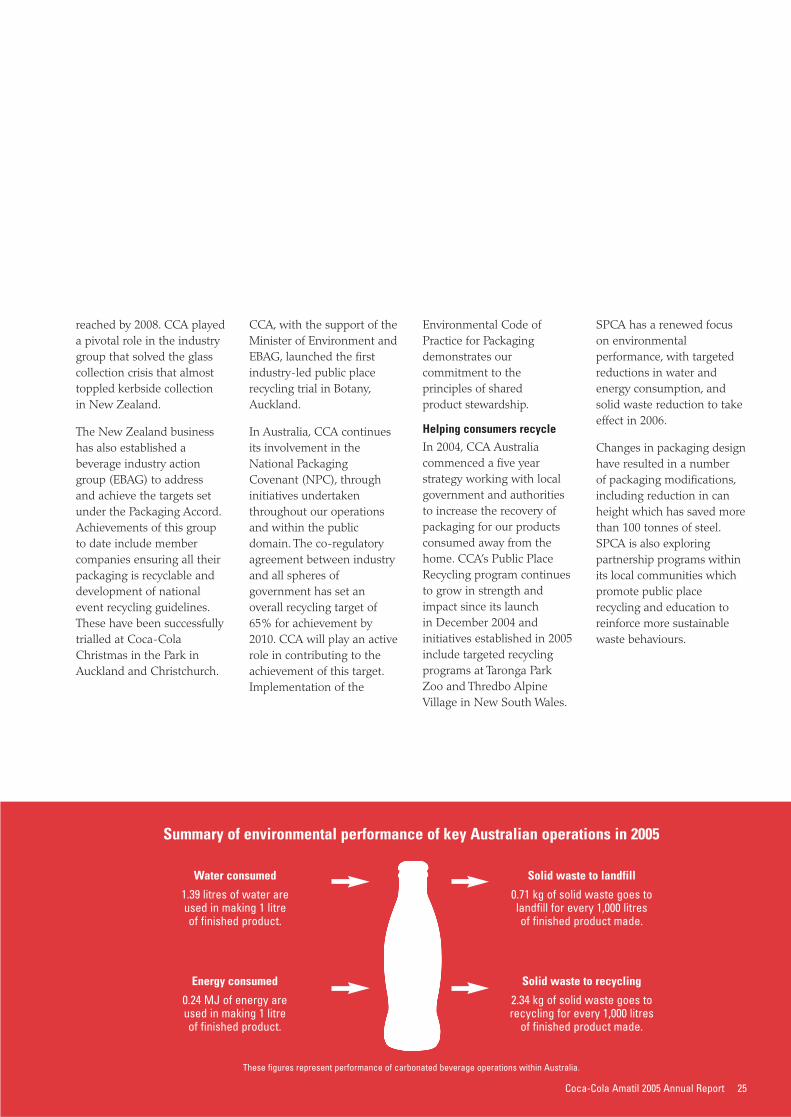
Summary of environmental performance of key Australian operations in 2005
Water consumed
1.39 litres of water are used in making 1 litre of finished product.
Solid waste to landfill
0.71 kg of solid waste goes tolandfill for every 1,000 litres of finished product made.
Energy consumed
0.24 MJ of energy are used in making 1 litre of finished product.
Solid waste to recycling
2.34 kg of solid waste goes torecycling for every 1,000 litres
of finished product made.
These figures represent performance of carbonated beverage operations within Australia.
Being the market leader hasanother upside – it meanswe attract the best people towork for us.
As well, we actively seek thebest. Our talent search anddevelopment programs arefocused on finding peoplewho are comfortablechallenging the status quoand who can create andexecute innovative solutionsfor our customers.
Our remuneration programshave been progressivelychanged to reward individualand team performances.This in turn has createdstrong internal competitionfor promotion.
A key focus for 2005 has been to improve theleadership capability acrossall levels of management.The Company has rolled outcomprehensive leadershipprograms across the Group.
A successful strategy in thepast 12 months has been thetransfer of key managementfrom CCA into our newbusinesses. In 2005, weacquired SPC Ardmona and Grinders coffee and bothorganisations, like Neverfailwhich we acquired in 2003,have benefited from seniormanagers transferring fromCCA Beverages into salesand finance functions.These managers and theirexisting teams have had animmediate impact on therelationship with our
customers – planning hasbeen improved, growthinitiatives are beingdeveloped and at SPCA therehas been a positive change in the in-store positioning of products.
CCA’s leadership programshave enjoyed particularsuccess in businesses inIndonesia, South Korea,PNG and Fiji. In Indonesia,for example, a key initiativefor developing leaders of the future was the NationalGraduate Training Program,where 53 universitygraduates were selected from 1900 applicants acrossIndonesia to take part in anintensive 10 month program.
Those participants whograduate in May 2006 will beplaced in leadership rolesacross the country.
In New Zealand and South Korea, ’Coke Uni’was launched – a staff
development program whichincluded comprehensiveleadership training and salesskills. In New Zealand, the‘Leading the Way’ program,which used externalexecutive coaches, won the International CoachFederation AustralasianOrganisational Award.
Below: The Mentone DistributionCentre employees who contributedto CCA winning the prestigiousComino Trophy. From left to right:Jenny Hall, Process ImprovementCo-ordinatorSimon Wilkins, ProcessImprovement Manager Tracey Wagner, who manages the Mentone Distribution Centre
26 Coca-Cola Amatil 2005 Annual Report
CCA People
We make and sell some of the most loved consumer brands in the world.In Australia, for example, brand Coca-Cola is placed in more shoppingtrolleys than any other grocery product – it’s been number one for arecord 13 years in a row.
Awards
2005 Australian Packaging Awards
Silver Award in the ‘ConsumerAcceptability’ category for SPCBrekky Fruit range.
Foodbank Award for Innovationfor Share A Can contribution
Every Drop Counts programwith Sydney Water
CCA New South Wales wasawarded the highest honourduring the Sydney WaterAnnual Water ConservationAwards (10 November 2005),with the Sustainable BusinessPractices and ProcessesAward. This award reflects theongoing water savings as wellas a business commitment toresponsible water usemanagement.
Comino Trophy for Storage and Handling of Materials For significant achievement inthe techniques and technologyof materials handling andstorage throughout the supply chain.
Improvements, innovation andorganisational impacts in rawmaterials, manufacturing,distribution, fulfilment,shipping, freight forwarding,wholesale and retailoperations.
SPC Ardmona Australian Beverages
CCA recognises that the keyto our success is to attractand retain the best people,and we are developing arange of new and innovativeplans to deliver moreflexibility in the workplace.
We recognise the importanceand value of a balanced anddiverse workforce, with agood mix of men andwomen from different agegroups right across theexperience spectrum.
In Australia, our people canpurchase additional annualleave, which has been verywell received. As well, thereare programs to helpworking parents, includingthe provision of childcareduring school holidays.
New Zealand Beverages
Coca-Cola Amatil 2005 Annual Report 27
Below: New Zealand managers whoparticipated in ‘Leading the Way’ in June 2005. From left to right:Sally Doherty, OD ManagerHamish Wright, BusinessDevelopment Manager HoReCaBrendan Lindsay, National Channel Development ManagerKim Dorling, Supply ChainPerformance ManagerGraeme Urbahn, PutaruruManufacturing ManagerKylla Peterson, Supply PlanningManagerColin Satele, Business Development ManagerMarc Brokenshire, Market Manager C&L
Kiwi Blue dressed to impressA stylish bottle andcontemporary logo designhanded the silver medal toKiwi Blue Pure Spring Water atthe 2005 Summit CreativeAwards in Portland, Oregon.
Coke cleans up New Zealand Beverage AwardsThe second annual NZJBABeverage Awards were held inAuckland on 7 October 2005,where 56 products wereentered.
CCA and TCCC topped the fieldin the following categories:
Water still or sparkling:Kiwi Blue Still Spring Water
Reconstituted fruit juice:Keri Crush Tropical
Diet/light: L&P Sweet As
Carbonated beverages:Coca-Cola Raspberry
Energy/lifestyle: e2 EnergyCitrus Kick
Packaging award: Kiwi BlueStill Spring Water 600mL PET
28 Coca-Cola Amatil 2005 Annual Report
CCA People continued
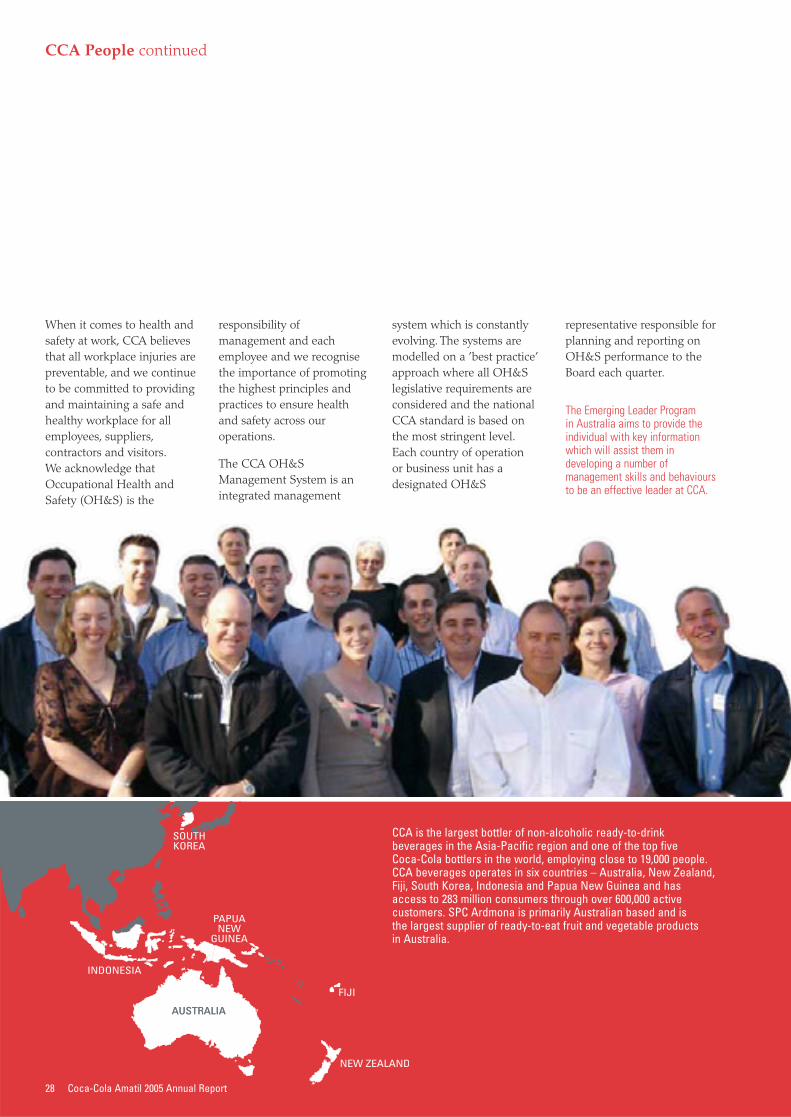
CCA is the largest bottler of non-alcoholic ready-to-drinkbeverages in the Asia-Pacific region and one of the top five Coca-Cola bottlers in the world, employing close to 19,000 people.CCA beverages operates in six countries – Australia, New Zealand,Fiji, South Korea, Indonesia and Papua New Guinea and hasaccess to 283 million consumers through over 600,000 activecustomers. SPC Ardmona is primarily Australian based and is the largest supplier of ready-to-eat fruit and vegetable products in Australia.
When it comes to health andsafety at work, CCA believesthat all workplace injuries arepreventable, and we continueto be committed to providingand maintaining a safe andhealthy workplace for allemployees, suppliers,contractors and visitors.We acknowledge thatOccupational Health andSafety (OH&S) is the
responsibility ofmanagement and eachemployee and we recognisethe importance of promotingthe highest principles andpractices to ensure healthand safety across ouroperations.
The CCA OH&SManagement System is anintegrated management
system which is constantlyevolving. The systems aremodelled on a ’best practice’approach where all OH&Slegislative requirements areconsidered and the nationalCCA standard is based onthe most stringent level.Each country of operation or business unit has adesignated OH&S
representative responsible forplanning and reporting onOH&S performance to theBoard each quarter.
The Emerging Leader Program in Australia aims to provide theindividual with key informationwhich will assist them indeveloping a number ofmanagement skills and behavioursto be an effective leader at CCA.
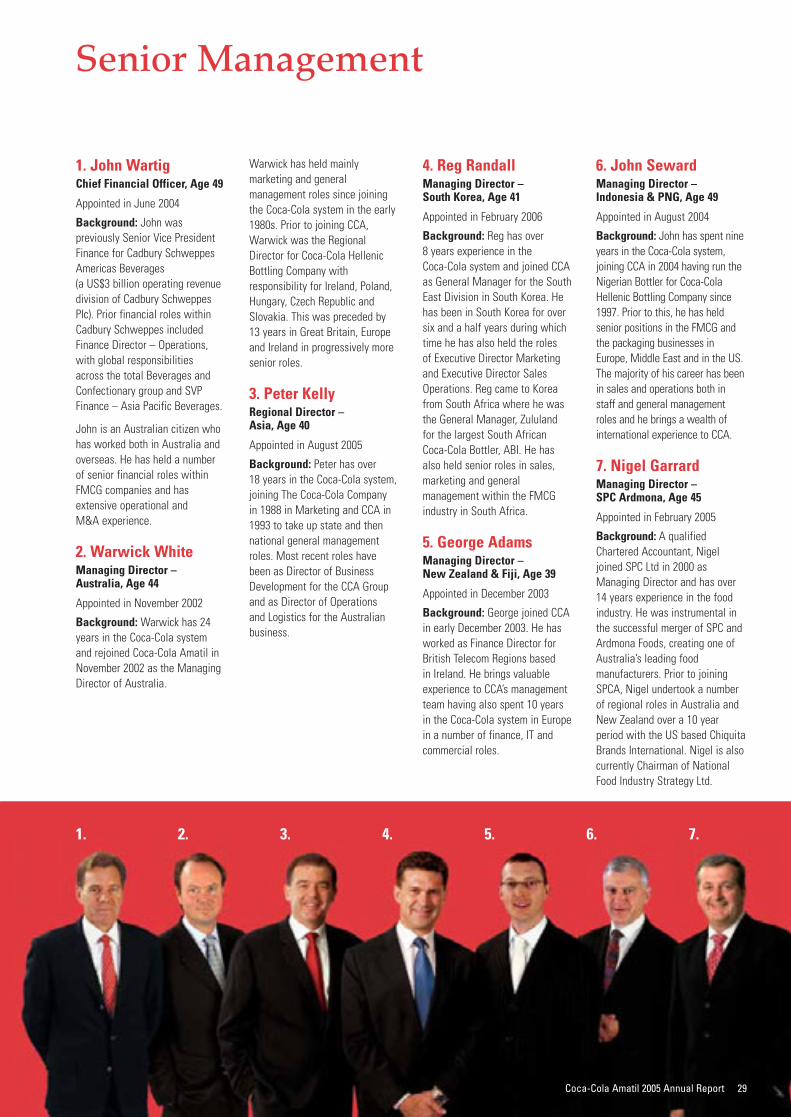
1. 2. 3. 4. 5. 6. 7.
Coca-Cola Amatil 2005 Annual Report 29
Senior Management
1. John WartigChief Financial Officer, Age 49
Appointed in June 2004
Background: John waspreviously Senior Vice PresidentFinance for Cadbury SchweppesAmericas Beverages (a US$3 billion operating revenuedivision of Cadbury SchweppesPlc). Prior financial roles withinCadbury Schweppes includedFinance Director – Operations,with global responsibilities across the total Beverages andConfectionary group and SVPFinance – Asia Pacific Beverages.
John is an Australian citizen whohas worked both in Australia andoverseas. He has held a numberof senior financial roles withinFMCG companies and hasextensive operational and M&A experience.
2. Warwick WhiteManaging Director –Australia, Age 44
Appointed in November 2002
Background: Warwick has 24years in the Coca-Cola system and rejoined Coca-Cola Amatil inNovember 2002 as the ManagingDirector of Australia.
Warwick has held mainlymarketing and generalmanagement roles since joiningthe Coca-Cola system in the early1980s. Prior to joining CCA,Warwick was the RegionalDirector for Coca-Cola HellenicBottling Company withresponsibility for Ireland, Poland,Hungary, Czech Republic andSlovakia. This was preceded by 13 years in Great Britain, Europeand Ireland in progressively more senior roles.
3. Peter KellyRegional Director – Asia, Age 40
Appointed in August 2005
Background: Peter has over 18 years in the Coca-Cola system,joining The Coca-Cola Company in 1988 in Marketing and CCA in1993 to take up state and thennational general managementroles. Most recent roles havebeen as Director of BusinessDevelopment for the CCA Groupand as Director of Operations and Logistics for the Australianbusiness.
4. Reg RandallManaging Director – South Korea, Age 41
Appointed in February 2006
Background: Reg has over 8 years experience in the Coca-Cola system and joined CCAas General Manager for the SouthEast Division in South Korea. Hehas been in South Korea for oversix and a half years during whichtime he has also held the roles of Executive Director Marketingand Executive Director SalesOperations. Reg came to Koreafrom South Africa where he wasthe General Manager, Zululand for the largest South AfricanCoca-Cola Bottler, ABI. He hasalso held senior roles in sales,marketing and generalmanagement within the FMCGindustry in South Africa.
5. George AdamsManaging Director – New Zealand & Fiji, Age 39
Appointed in December 2003
Background: George joined CCAin early December 2003. He hasworked as Finance Director forBritish Telecom Regions based in Ireland. He brings valuableexperience to CCA’s managementteam having also spent 10 yearsin the Coca-Cola system in Europein a number of finance, IT andcommercial roles.
6. John Seward Managing Director –Indonesia & PNG, Age 49
Appointed in August 2004
Background: John has spent nineyears in the Coca-Cola system,joining CCA in 2004 having run theNigerian Bottler for Coca-ColaHellenic Bottling Company since1997. Prior to this, he has heldsenior positions in the FMCG andthe packaging businesses inEurope, Middle East and in the US.The majority of his career has beenin sales and operations both instaff and general managementroles and he brings a wealth ofinternational experience to CCA.
7. Nigel GarrardManaging Director – SPC Ardmona, Age 45
Appointed in February 2005
Background: A qualifiedChartered Accountant, Nigeljoined SPC Ltd in 2000 asManaging Director and has over14 years experience in the foodindustry. He was instrumental inthe successful merger of SPC andArdmona Foods, creating one ofAustralia’s leading foodmanufacturers. Prior to joiningSPCA, Nigel undertook a numberof regional roles in Australia andNew Zealand over a 10 yearperiod with the US based ChiquitaBrands International. Nigel is alsocurrently Chairman of NationalFood Industry Strategy Ltd.
30 Coca-Cola Amatil 2005 Annual Report
Board of Directors
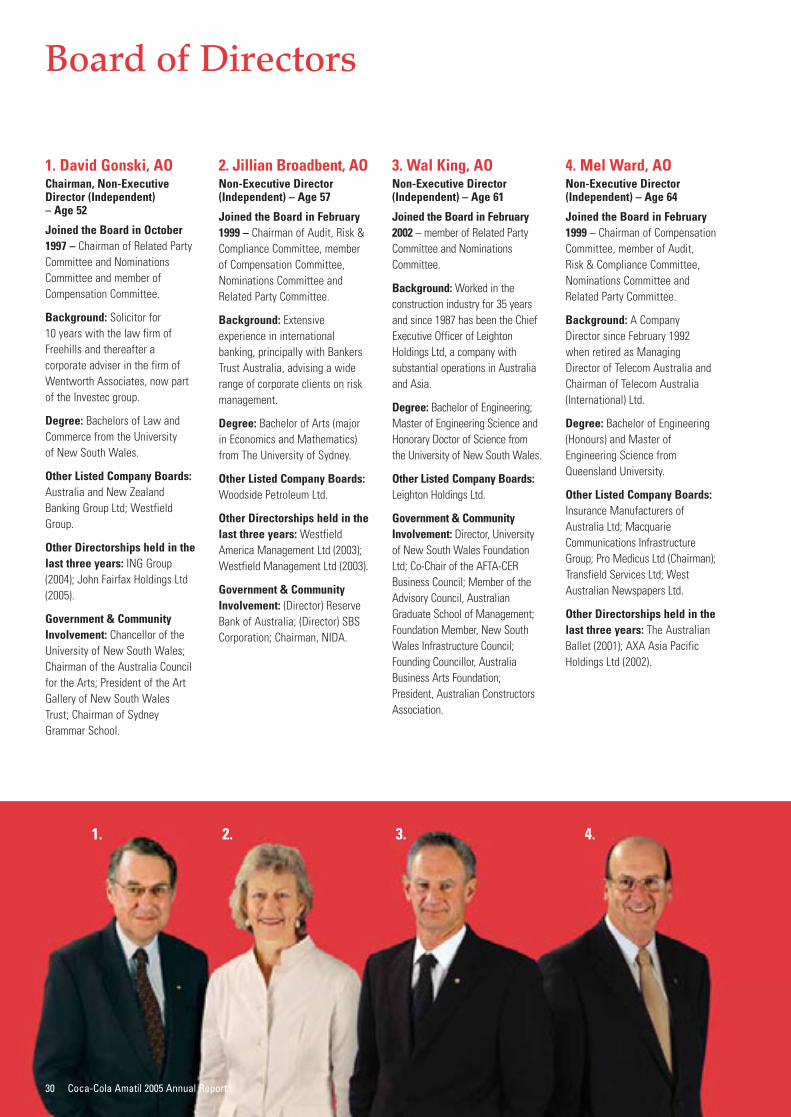
1. David Gonski, AOChairman, Non-ExecutiveDirector (Independent) – Age 52
Joined the Board in October1997 – Chairman of Related PartyCommittee and NominationsCommittee and member ofCompensation Committee.
Background: Solicitor for 10 years with the law firm ofFreehills and thereafter acorporate adviser in the firm ofWentworth Associates, now partof the Investec group.
Degree: Bachelors of Law andCommerce from the University of New South Wales.
Other Listed Company Boards:Australia and New ZealandBanking Group Ltd; WestfieldGroup.
Other Directorships held in thelast three years: ING Group(2004); John Fairfax Holdings Ltd(2005).
Government & CommunityInvolvement: Chancellor of theUniversity of New South Wales;Chairman of the Australia Councilfor the Arts; President of the ArtGallery of New South WalesTrust; Chairman of SydneyGrammar School.
2. Jillian Broadbent, AONon-Executive Director(Independent) – Age 57
Joined the Board in February1999 – Chairman of Audit, Risk &Compliance Committee, memberof Compensation Committee,Nominations Committee andRelated Party Committee.
Background: Extensiveexperience in internationalbanking, principally with BankersTrust Australia, advising a widerange of corporate clients on riskmanagement.
Degree: Bachelor of Arts (majorin Economics and Mathematics)from The University of Sydney.
Other Listed Company Boards:Woodside Petroleum Ltd.
Other Directorships held in thelast three years: WestfieldAmerica Management Ltd (2003);Westfield Management Ltd (2003).
Government & CommunityInvolvement: (Director) ReserveBank of Australia; (Director) SBSCorporation; Chairman, NIDA.
3. Wal King, AONon-Executive Director(Independent) – Age 61
Joined the Board in February2002 – member of Related PartyCommittee and NominationsCommittee.
Background: Worked in theconstruction industry for 35 yearsand since 1987 has been the ChiefExecutive Officer of LeightonHoldings Ltd, a company withsubstantial operations in Australiaand Asia.
Degree: Bachelor of Engineering;Master of Engineering Science andHonorary Doctor of Science fromthe University of New South Wales.
Other Listed Company Boards:Leighton Holdings Ltd.
Government & CommunityInvolvement: Director, Universityof New South Wales FoundationLtd; Co-Chair of the AFTA-CERBusiness Council; Member of theAdvisory Council, AustralianGraduate School of Management;Foundation Member, New SouthWales Infrastructure Council;Founding Councillor, AustraliaBusiness Arts Foundation;President, Australian ConstructorsAssociation.
4. Mel Ward, AONon-Executive Director(Independent) – Age 64
Joined the Board in February1999 – Chairman of CompensationCommittee, member of Audit, Risk & Compliance Committee,Nominations Committee andRelated Party Committee.
Background: A CompanyDirector since February 1992when retired as ManagingDirector of Telecom Australia andChairman of Telecom Australia(International) Ltd.
Degree: Bachelor of Engineering(Honours) and Master ofEngineering Science fromQueensland University.
Other Listed Company Boards:Insurance Manufacturers ofAustralia Ltd; MacquarieCommunications InfrastructureGroup; Pro Medicus Ltd (Chairman);Transfield Services Ltd; WestAustralian Newspapers Ltd.
Other Directorships held in thelast three years: The AustralianBallet (2001); AXA Asia PacificHoldings Ltd (2002).
1. 2. 3. 4.
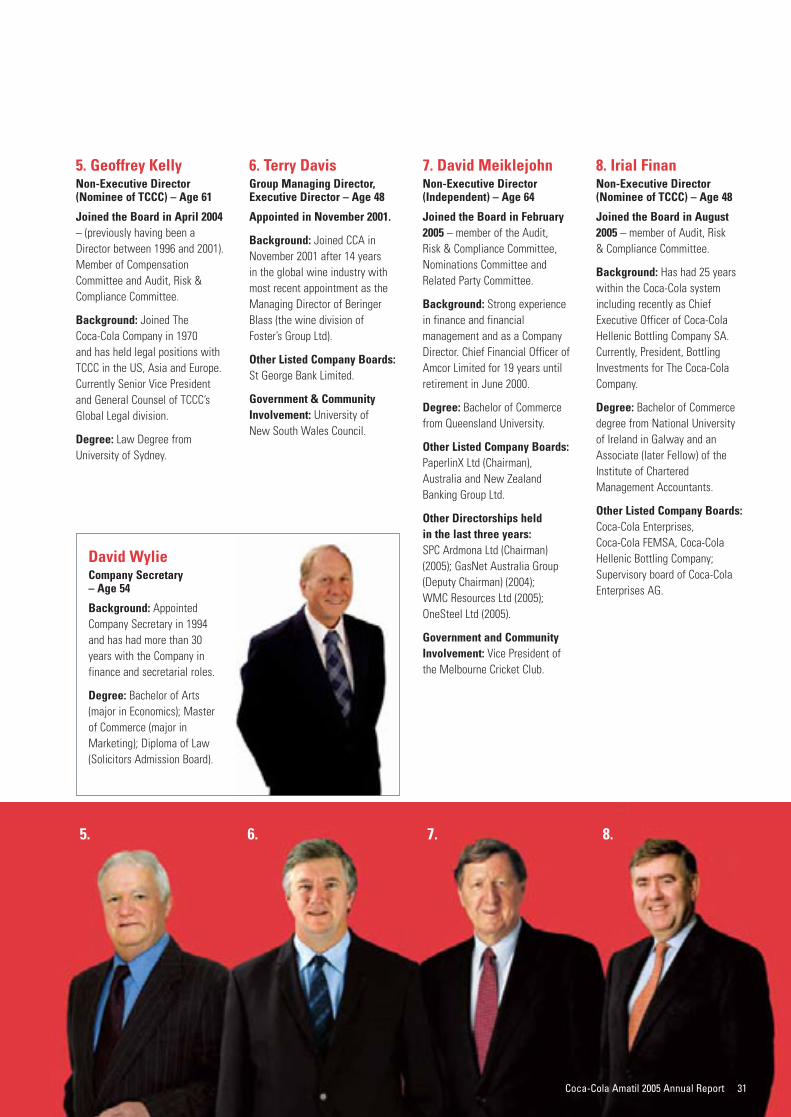
5. Geoffrey KellyNon-Executive Director(Nominee of TCCC) – Age 61
Joined the Board in April 2004– (previously having been aDirector between 1996 and 2001).Member of CompensationCommittee and Audit, Risk &Compliance Committee.
Background: Joined The Coca-Cola Company in 1970 and has held legal positions withTCCC in the US, Asia and Europe.Currently Senior Vice Presidentand General Counsel of TCCC’sGlobal Legal division.
Degree: Law Degree fromUniversity of Sydney.
6. Terry DavisGroup Managing Director,Executive Director – Age 48
Appointed in November 2001.
Background: Joined CCA inNovember 2001 after 14 years in the global wine industry withmost recent appointment as theManaging Director of BeringerBlass (the wine division of Foster’s Group Ltd).
Other Listed Company Boards:St George Bank Limited.
Government & CommunityInvolvement: University of New South Wales Council.
7. David MeiklejohnNon-Executive Director(Independent) – Age 64
Joined the Board in February2005 – member of the Audit, Risk & Compliance Committee,Nominations Committee andRelated Party Committee.
Background: Strong experiencein finance and financialmanagement and as a CompanyDirector. Chief Financial Officer ofAmcor Limited for 19 years untilretirement in June 2000.
Degree: Bachelor of Commercefrom Queensland University.
Other Listed Company Boards:PaperlinX Ltd (Chairman),Australia and New ZealandBanking Group Ltd.
Other Directorships held in the last three years:SPC Ardmona Ltd (Chairman)(2005); GasNet Australia Group(Deputy Chairman) (2004); WMC Resources Ltd (2005);OneSteel Ltd (2005).
Government and CommunityInvolvement: Vice President ofthe Melbourne Cricket Club.
8. Irial FinanNon-Executive Director (Nominee of TCCC) – Age 48
Joined the Board in August2005 – member of Audit, Risk & Compliance Committee.
Background: Has had 25 yearswithin the Coca-Cola systemincluding recently as ChiefExecutive Officer of Coca-ColaHellenic Bottling Company SA.Currently, President, BottlingInvestments for The Coca-ColaCompany.
Degree: Bachelor of Commercedegree from National University of Ireland in Galway and anAssociate (later Fellow) of theInstitute of CharteredManagement Accountants.
Other Listed Company Boards:Coca-Cola Enterprises, Coca-Cola FEMSA, Coca-ColaHellenic Bottling Company;Supervisory board of Coca-ColaEnterprises AG.
Coca-Cola Amatil 2005 Annual Report 31
5. 6. 7. 8.
David WylieCompany Secretary – Age 54
Background: AppointedCompany Secretary in 1994and has had more than 30years with the Company infinance and secretarial roles.
Degree: Bachelor of Arts(major in Economics); Masterof Commerce (major inMarketing); Diploma of Law(Solicitors Admission Board).
32 Coca-Cola Amatil 2005 Annual Report
Corporate Governance
At Coca-Cola Amatil (CCA), the Board of Directors is committed toachieving best practice in the area of corporate governance and businessconduct. This Corporate Governance Statement outlines the maincorporate governance principles and practices followed by CCA.
ShareholdersThe rights of CCA’s shareholdersare detailed in CCA’s Constitution.Those rights include electing the members of the Board. Inaddition, shareholders have theright to vote on important matterswhich have an impact on CCA.
To allow shareholders toeffectively exercise these rights,the Board is committed toimproving the communication to shareholders of high quality,relevant and useful information ina timely manner. CCA has adoptedthe following communicationframework:
• an ongoing communicationprogram – regular,comprehensive and publiclyavailable disclosures to beundertaken covering importanttopics including performanceand governance issues;
• contact information – contactdetails for the InvestorRelations department andCompany Secretary areprovided to facilitate andencourage communication;
• communication responsibilities– identification of the itemsthat are appropriate for Boardcomment and those formanagement comment;
• communication policy – a publicly disclosed policy that covers all forms ofcommunication, includingmeetings, telephone calls,email and other writtencommunications; and
• policy review – regular Boardreview to ensure adherence to the communication policy.
Communication policyCCA’s communication policy (a copy is available on theCompany website atwww.ccamatil.com/disclosurePolicy.asp) requires thatshareholders be informed aboutstrategic objectives and majordevelopments. CCA is committedto keeping shareholders informedand improving accessibility toshareholders through:
• Australian Stock Exchange(ASX) announcements;
• company publications (includingthe Annual Report andShareholder News);
• the Annual General Meeting(and its webcasting);
• the Company website(www.ccamatil.com);
• the investor contact number (61 2 9259 6159); and
• a suggestion box on the website.
The following principles,consistent with the continuousdisclosure obligations under ASX Listing Rules, govern CCA’s communication:
• CCA will immediately issue toASX any information that areasonable person would expectto have a material effect on theprice or value of CCA’s securities;
• only authorised spokespersonscan communicate on behalf ofthe Company with shareholders,the media or the investmentcommunity;
• CCA’s Disclosure Committeemanages the day-to-daycontinuous disclosure issuesand operates flexibly andinformally. It is responsible for
compliance, coordinatingdisclosure and educatingemployees about CCA’scommunication policy; and
• all material information issuedto ASX, the Annual Reports, fullyear and half year results andpresentation material given toanalysts is published on CCA’swebsite (www.ccamatil.com).Any person wishing to receiveadvice by email of CCA’s ASXannouncements can register atwww.ccamatil.com.
The Company Secretary is theprimary person responsible forcommunication with ASX. In the absence of the CompanySecretary, the Investor RelationsManager is the contact.
CCA’s shareholders areencouraged to make their viewsknown to the Company and todirectly raise matters of concern.From time to time, CCA requestsmeetings with its shareholdersand shareholder interest groups to share views on matters ofinterest. The views of thoseparties are shared with the Boardon a regular basis, both by theChairman and management.
Annual GeneralMeetingShareholders are encouraged to attend CCA’s Annual GeneralMeeting and use this opportunityto ask questions. The AnnualGeneral Meeting will remain themain opportunity each year for themajority of ordinary shareholdersto comment and to question CCA’sBoard and management.
CCA is committed to improvingthe efficiency of its AnnualGeneral Meetings and encouragesparticipation of shareholdersthrough:
• the prior collection ofshareholder questions foranswering during the meeting.Questions can be submittedeither by completing therelevant form accompanyingthe notice of meeting or by emailing CCA [email protected]. Questions thathave been lodged, and theiranswers, are posted on theCompany website at the FAQ section;
• providing a process to ensurethat shareholders areconsiderate of each other’sright to participate;
• providing an opportunity aftereach Annual General Meetingto discuss matters with theBoard and management; and
• webcasting the proceeding forshareholders unable to attendin person. A copy of thespeeches delivered at themeeting are posted to thewebsite after delivery.
Further, the external auditorattends the Annual GeneralMeeting and is available toanswer shareholder questionsabout the conduct of the audit and the preparation and contentof the auditor’s report.
Coca-Cola Amatil 2005 Annual Report 33
Board of Directors – role andresponsibilitiesThe Board representsshareholders and has the ultimateresponsibility for managing CCA’s business and affairs to thehighest standards of corporategovernance and business conduct.The Board operates on theprinciple that all significantmatters are dealt with by the full Board and has specificallyreserved the following matters for its decisions:
• the strategic direction of the Company;
• approving budgets and otherperformance indicators,reviewing performance againstthem and initiating correctiveaction when required;
• ensuring that there areadequate structures to provide for compliance with applicable laws;
• ensuring that there areadequate systems andprocedures to identify, assess and manage risks;
• ensuring that there areappropriate policies in placeand systems to ensurecompliance;
• monitoring the Board structureand composition;
• appointing the Group ManagingDirector (MD) and evaluatinghis or her ongoing performanceagainst predetermined criteria;
• approving the remuneration of the MD and remunerationpolicy and succession plans for the MD and seniormanagement;
• ensuring that there is anappropriate focus on theinterests of all stakeholders;and
• representing the interests ofand being accountable to theCompany’s shareholders.
To assist in its deliberations, the Board has established anumber of committees which,apart from routine matters, actprimarily in a review or advisorycapacity. The delegation of such responsibilities to thosecommittees will only occurprovided that sufficient systemsare in place to ensure that the Board is meeting itsresponsibilities. The responsibilityfor implementing the approvedbusiness plans and for the day-to-day operations of CCA is delegated to the MD who, with the management team, is accountable to the Board.
Board of Directors – compositionThe composition of the Board isbased on the following factors:
• the Chairman is a Non-Executive Director and independent from The Coca-Cola Company;
• the MD is the ExecutiveDirector;
• The Coca-Cola Company hasnominated two Non-ExecutiveDirectors (currently GeoffreyKelly and Irial Finan);
• the majority of the Non-Executive Directors areindependent;
• one third of the Board (otherthan the MD) is required toretire at each Annual GeneralMeeting and may stand for re-election. The Directors toretire shall be those who havebeen longest in office sincetheir last election;
• a Director who has beenappointed by the Board to fill acasual vacancy is required tobe considered for re-election bythe shareholders at the nextAnnual General Meeting.
As of the date of this AnnualReport, the Board is comprised ofthe following eight members:
– David Gonski, AO (Chairman)Independent Director
– Jillian Broadbent, AOIndependent Director
– Wal King, AO Independent Director
– David MeiklejohnIndependent Director
– Mel Ward, AOIndependent Director
– Irial FinanNon-Executive Director*
– Geoffrey Kelly Non-Executive Director*
– Terry Davis Executive Director
* nominated by The Coca-Cola Company
Directors –independenceA Director is consideredindependent provided they arefree of any business or otherrelationship with CCA or a relatedparty, which could reasonably beperceived to materially interferewith the exercise of theirunfettered and independentjudgement. A related party for this purpose would include The Coca-Cola Company.
When a potential conflict ofinterest arises, the Directorconcerned withdraws from theBoard meeting while such mattersare considered. Accordingly, theDirector concerned takes no partin discussions nor exercises anyinfluence over the Board if apotential conflict of interestexists. Transactions with TheCoca-Cola Company are reviewedby the Related Party Committee.Related party transactions aredisclosed in Note 37 to thefinancial statements.
Directors – selectionThe composition of the Board isconsidered regularly by theNominations Committee and anyrecommendations presented tothe full Board. The review ensuresthat the Board has available anappropriate mix of abilities andexperience to serve the interestsof all shareholders.
The process of appointing aDirector is that, when a vacancyexists or is expected, theNominations Committee identifiescandidates with the appropriateexpertise and experience. TheBoard reviews the candidates andthe most suitable person is eitherappointed by the Board and comesup for re-election at the nextAnnual General Meeting or isrecommended to shareholders for election at the shareholdermeeting.
CCA also encourages itsshareholders to nominate personsof suitable skills and experiencefor Board positions. The websitecontains a nomination form andany nomination, made in goodfaith, will be considered by theNominations Committee.
Directors – inductionand trainingOn appointment, each Non-Executive Director is requiredto acknowledge the terms ofappointment as set out in theirletter of appointment. Theappointment letter covers, interalia, the term of appointment,duties, remuneration andexpenses, rights of access toinformation, other directorships,dealing in CCA’s shares andtermination.
On appointment, each Director is provided with the Company’spolicies and briefed on thecontent by the CompanySecretary. Directors haveavailable to them a series oftraining programs, covering suchtopics as the Board’s role, Boardcomposition and conduct, risksand responsibilities of companydirectors, to ensure that they arefully informed on currentgovernance issues.
34 Coca-Cola Amatil 2005 Annual Report
Corporate Governance continued
Directors –performance reviewA review of Directors’performance is undertaken atleast every two years and if amajority of Directors consider a Director’s performance fallsbelow the predetermined criteriarequired, then a resolution will beput to shareholders to vote on theresignation of that Director at thenext Annual General Meeting.
The next performance review shallbe undertaken in 2007.
Directors – shareownership anddealingsUnder the terms of the Non-Executive Directors’ SharePlan, a minimum of 25% (and upto 100%) of CCA Directors’ basefees are salary sacrificed by eachDirector. An amount equivalent tothe fees sacrificed is contributedto the Non-Executive Directors’Share Plan for the benefit of thatDirector. Details of all holdings byDirectors in the Company are setout in the Directors’ Report onpage 38.
Directors are subject to theCorporations Act 2001 whichrestricts their buying, selling orsubscribing for securities in CCA ifthey are in possession of insideinformation. The Board has alsoadopted a formal policy for sharedealings by Directors and seniormanagement. Except for sharespurchased on the first businessday of each month under the Non-Executive Directors’ SharePlan, the policy allows for thebuying and selling of CCA sharesonly during the four week periodsfollowing the release of the fullyear and half year results and theAnnual General Meeting, unlessexceptional circumstances apply.The policy prohibits speculativetransactions involving CCA sharesand reinforces the prohibition oninsider trading contained in theCorporations Act 2001.
Independentprofessional adviceFor the purposes of the properperformance of their duties,Directors are entitled to seekindependent professional adviceat CCA’s expense. Before doing so, a Director must notify theChairman (or the MD in theChairman’s absence) and mustmake a copy of the adviceavailable to all Directors.
Risk managementIn addition to the riskmanagement duties of the Audit,Risk & Compliance Committee,the Board has retainedresponsibility for approving thestrategic direction of CCA andensuring the maintenance of thehighest standards of quality. Thisextends beyond product quality toencompass all ways in whichCCA’s reputation and its productsare measured. The Board monitorsthis responsibility through thereceipt of regular risk assessmentreports and managementpresentations.
The Audit, Risk & ComplianceCommittee reviews reports bymembers of the managementteam (and independent advisers,where appropriate) during theyear and, where appropriate,makes recommendations to theBoard in respect of:
• overall business risk in CCA’scountries of operation;
• treasury risk (including currencyand borrowing risks);
• procurement;• insurance;• taxation;• litigation; and• other matters as it deems
appropriate.
The Committee also reviews and, where appropriate, makesrecommendations to the Board inrespect of policies relating to theabove matters. This includesensuring that CCA has systems
that identify, assess, monitor andmanage risk. The internal andexternal audit functions alsoreview CCA’s risk assessment andmanagement. The internal andexternal audit functions areseparate and independent of each other.
Ethical standardsThe Board recognises the need toobserve the highest standards ofcorporate practice and businessconduct. To this end, CCA hasestablished a formal Code ofConduct, which requiresmanagement and employees toadopt high ethical standards in all of CCA’s activities.
The Audit, Risk & ComplianceCommittee is responsible forensuring an effective complianceprogram exists to ensurecompliance with the requirementsas established in the Code ofConduct.
The Code contains procedures for identifying and reporting anydepartures from the requiredstandards. CCA has alsoestablished a system fordistribution of the Code atappropriate intervals toemployees and for them toacknowledge its receipt.
The Code sets standards ofbehaviour expected from everyonewho performs work for CCA –Directors, employees andindividual contractors. It is alsoexpected that CCA’s suppliers willenforce a similar set of standardswith their employees.
Board CommitteesTo assist in its deliberations, theBoard has established a numberof committees which, apart fromroutine matters, act primarily in areview or advisory capacity.
Audit, Risk &Compliance CommitteeCurrent composition: Four Non-Executive Directors (the Chairman,MD and Chief Financial Officer(CFO) attend meetings by invitation).
Purpose: Audit – reviews theauditor’s performance, theprofessional independence of theauditor, audit policies, proceduresand reports, as a direct linkbetween the Board and theauditor. Financial Statements –reviews CCA’s financialstatements, the effectiveness andcompliance with accountingpolicies and standards andadequacy of disclosures. RiskManagement – reviews policiesand reports on all major categoriesof risk including, but not limited to,overall business risk in CCA’soperations, treasury risk (includingcurrency and borrowing risks),procurement, insurance, taxationand litigation. Compliance –ensures an effective complianceprogram covering, but not limitedto, CCA’s statutory obligations(including occupational health andsafety laws, environmental laws,product safety laws and tradepractices laws) and formal writtenpolicies (including treasury policy,procurement policy, code ofconduct and the policy on dealingin CCA’s securities).
CompensationCommitteeCurrent composition: Four Non-Executive Directors (MDattends by invitation). A majorityof members must be IndependentNon-Executive Directors.
Purpose: The review of mattersrelating to the remuneration ofthe Executive Director and seniormanagement, as well as seniormanagement succession planning.The Committee obtains advicefrom external remunerationconsultants to ensure that CCA’sremuneration practices are in linewith market conditions.
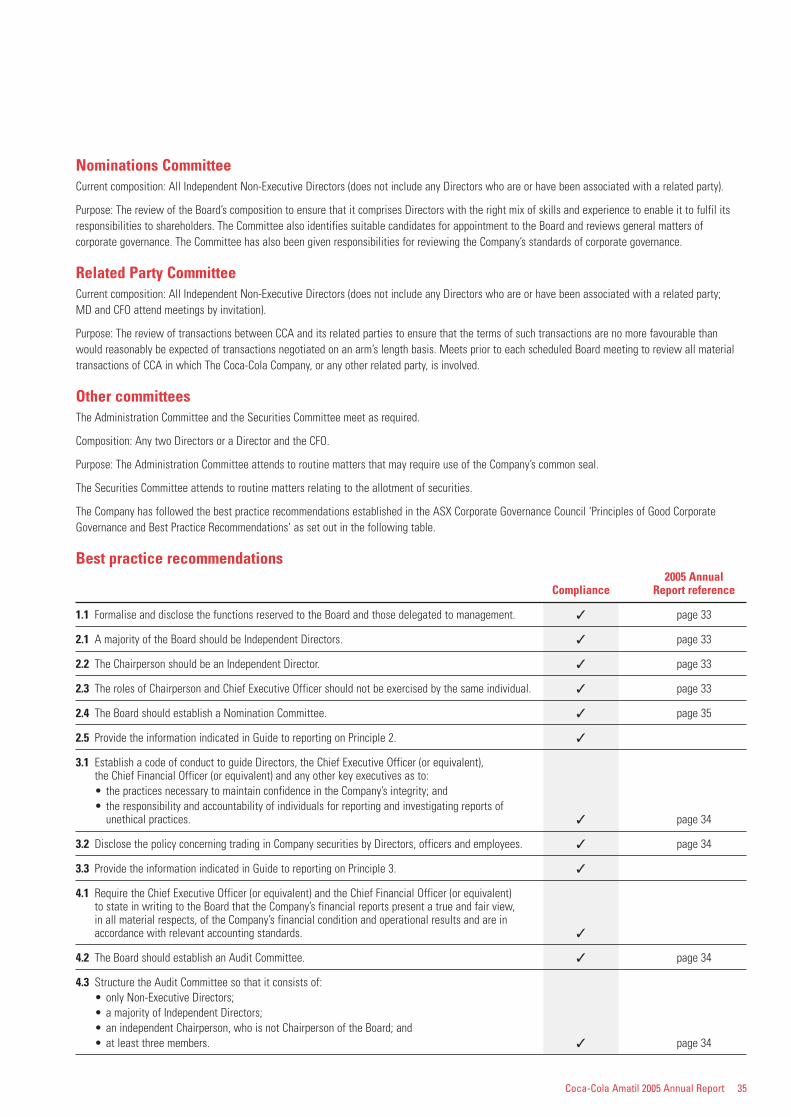
Coca-Cola Amatil 2005 Annual Report 35
Nominations CommitteeCurrent composition: All Independent Non-Executive Directors (does not include any Directors who are or have been associated with a related party).
Purpose: The review of the Board’s composition to ensure that it comprises Directors with the right mix of skills and experience to enable it to fulfil itsresponsibilities to shareholders. The Committee also identifies suitable candidates for appointment to the Board and reviews general matters ofcorporate governance. The Committee has also been given responsibilities for reviewing the Company’s standards of corporate governance.
Related Party CommitteeCurrent composition: All Independent Non-Executive Directors (does not include any Directors who are or have been associated with a related party; MD and CFO attend meetings by invitation).
Purpose: The review of transactions between CCA and its related parties to ensure that the terms of such transactions are no more favourable thanwould reasonably be expected of transactions negotiated on an arm’s length basis. Meets prior to each scheduled Board meeting to review all materialtransactions of CCA in which The Coca-Cola Company, or any other related party, is involved.
Other committeesThe Administration Committee and the Securities Committee meet as required.
Composition: Any two Directors or a Director and the CFO.
Purpose: The Administration Committee attends to routine matters that may require use of the Company’s common seal.
The Securities Committee attends to routine matters relating to the allotment of securities.
The Company has followed the best practice recommendations established in the ASX Corporate Governance Council ‘Principles of Good CorporateGovernance and Best Practice Recommendations’ as set out in the following table.
Best practice recommendations2005 Annual
Compliance Report reference
1.1 Formalise and disclose the functions reserved to the Board and those delegated to management. ✓ page 33
2.1 A majority of the Board should be Independent Directors. ✓ page 33
2.2 The Chairperson should be an Independent Director. ✓ page 33
2.3 The roles of Chairperson and Chief Executive Officer should not be exercised by the same individual. ✓ page 33
2.4 The Board should establish a Nomination Committee. ✓ page 35
2.5 Provide the information indicated in Guide to reporting on Principle 2. ✓
3.1 Establish a code of conduct to guide Directors, the Chief Executive Officer (or equivalent), the Chief Financial Officer (or equivalent) and any other key executives as to:• the practices necessary to maintain confidence in the Company’s integrity; and• the responsibility and accountability of individuals for reporting and investigating reports of
unethical practices. ✓ page 34
3.2 Disclose the policy concerning trading in Company securities by Directors, officers and employees. ✓ page 34
3.3 Provide the information indicated in Guide to reporting on Principle 3. ✓
4.1 Require the Chief Executive Officer (or equivalent) and the Chief Financial Officer (or equivalent) to state in writing to the Board that the Company’s financial reports present a true and fair view, in all material respects, of the Company’s financial condition and operational results and are in accordance with relevant accounting standards. ✓
4.2 The Board should establish an Audit Committee. ✓ page 34
4.3 Structure the Audit Committee so that it consists of:• only Non-Executive Directors;• a majority of Independent Directors;• an independent Chairperson, who is not Chairperson of the Board; and• at least three members. ✓ page 34
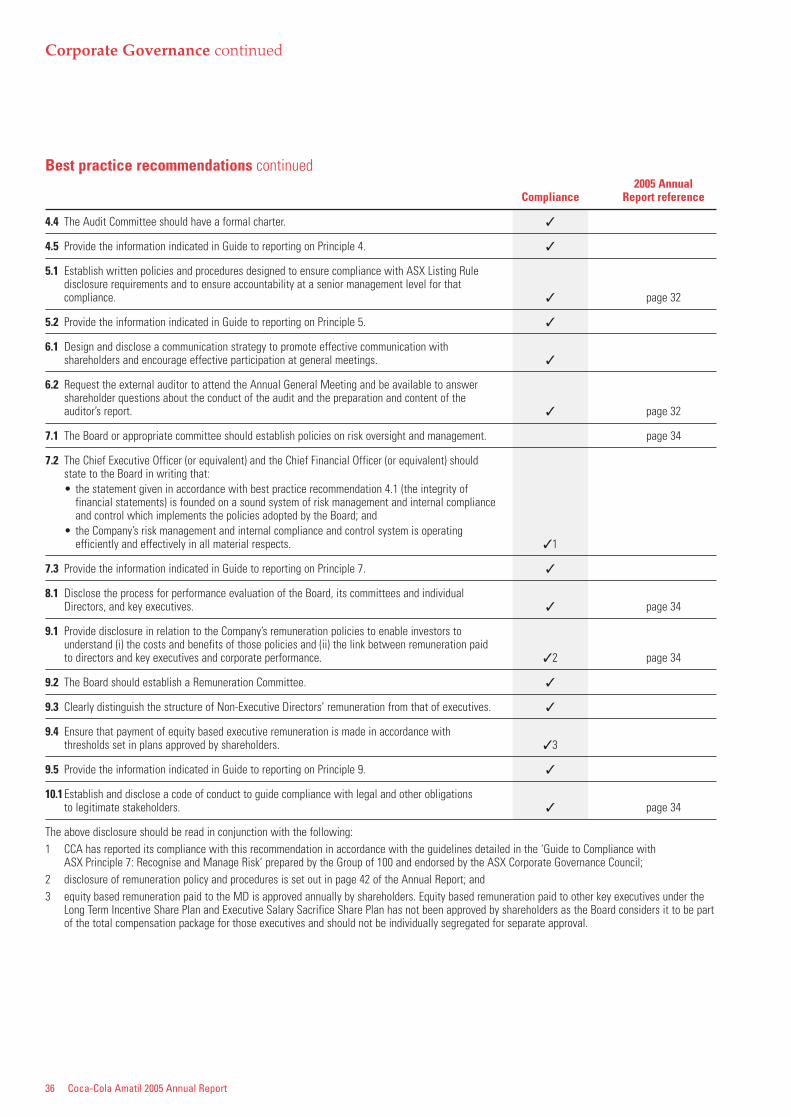
36 Coca-Cola Amatil 2005 Annual Report
Corporate Governance continued
Best practice recommendations continued2005 Annual
Compliance Report reference
4.4 The Audit Committee should have a formal charter. ✓
4.5 Provide the information indicated in Guide to reporting on Principle 4. ✓
5.1 Establish written policies and procedures designed to ensure compliance with ASX Listing Rule disclosure requirements and to ensure accountability at a senior management level for that compliance. ✓ page 32
5.2 Provide the information indicated in Guide to reporting on Principle 5. ✓
6.1 Design and disclose a communication strategy to promote effective communication with shareholders and encourage effective participation at general meetings. ✓
6.2 Request the external auditor to attend the Annual General Meeting and be available to answer shareholder questions about the conduct of the audit and the preparation and content of the auditor’s report. ✓ page 32
7.1 The Board or appropriate committee should establish policies on risk oversight and management. page 34
7.2 The Chief Executive Officer (or equivalent) and the Chief Financial Officer (or equivalent) should state to the Board in writing that:• the statement given in accordance with best practice recommendation 4.1 (the integrity of
financial statements) is founded on a sound system of risk management and internal compliance and control which implements the policies adopted by the Board; and
• the Company’s risk management and internal compliance and control system is operating efficiently and effectively in all material respects. ✓1
7.3 Provide the information indicated in Guide to reporting on Principle 7. ✓
8.1 Disclose the process for performance evaluation of the Board, its committees and individual Directors, and key executives. ✓ page 34
9.1 Provide disclosure in relation to the Company’s remuneration policies to enable investors to understand (i) the costs and benefits of those policies and (ii) the link between remuneration paid to directors and key executives and corporate performance. ✓2 page 34
9.2 The Board should establish a Remuneration Committee. ✓
9.3 Clearly distinguish the structure of Non-Executive Directors’ remuneration from that of executives. ✓
9.4 Ensure that payment of equity based executive remuneration is made in accordance with thresholds set in plans approved by shareholders. ✓3
9.5 Provide the information indicated in Guide to reporting on Principle 9. ✓
10.1Establish and disclose a code of conduct to guide compliance with legal and other obligations to legitimate stakeholders. ✓ page 34
The above disclosure should be read in conjunction with the following:1 CCA has reported its compliance with this recommendation in accordance with the guidelines detailed in the ‘Guide to Compliance with
ASX Principle 7: Recognise and Manage Risk’ prepared by the Group of 100 and endorsed by the ASX Corporate Governance Council;2 disclosure of remuneration policy and procedures is set out in page 42 of the Annual Report; and3 equity based remuneration paid to the MD is approved annually by shareholders. Equity based remuneration paid to other key executives under the
Long Term Incentive Share Plan and Executive Salary Sacrifice Share Plan has not been approved by shareholders as the Board considers it to be partof the total compensation package for those executives and should not be individually segregated for separate approval.
Coca-Cola Amatil 2005 Annual Report 37
Financial and Statutory ReportsCoca-Cola Amatil Limited and its controlled entitiesFor the financial year ended 31 December 2005
ContentsDirectors’ Report 38Financial Report 61
Income Statements 61Balance Sheets 62Cash Flow Statements 63Statements of Changes in Equity 64Notes to the Financial Statements 66
1. Basis of Financial Report Preparation 662. Summary of Significant Accounting Policies 663. Impact of Adoption of AIFRS 704. Financial Reporting by Business and Geographic Segments 745. Revenues 766. Expenses and Income Statement Disclosures 767. Income Tax Expense/(Benefit) 788. Cash Assets 799. Trade and Other Receivables 8010. Inventories 8011. Non-current Assets Held for Sale 8112. Investments in Securities 8113. Investments in Bottlers’ Agreements 8214. Property, Plant and Equipment 8315. Intangible Assets 8516. Impairment Testing of Indefinite Lived Intangible Assets 8617. Trade and Other Payables 8718. Interest Bearing Liabilities 8719. Provisions 8820. Deferred Income Tax Assets and Liabilities 8821. Defined Benefit Superannuation Plan Asset and Liability 9022. Share Capital 9423. Shares Held by Equity Compensation Plans 9524. Reserves 9525. Employee Ownership Plans 9726. Dividends 10027. Earnings Per Share (EPS) 10028. Commitments 10129. Contingencies 10130. Auditors’ Remuneration 10231. Investments in Controlled Entities 10332. Changes in Composition of Entity 10433. Key Management Personnel Disclosures 10634. Derivatives and Net Debt Reconciliation 11035. Financing Facilities 11036. Financial Risk Management 11137. Related Parties 11638. Deed of Cross Guarantee 11739. Events after the Balance Date 118
Directors’ Declaration 119Independent Audit Report 120
38 Coca-Cola Amatil 2005 Annual Report
Directors’ ReportCoca-Cola Amatil LimitedFor the financial year ended 31 December 2005
The Directors submit hereunder their Report on Coca-Cola Amatil Limited (Company, CCA or CCA Entity) and its controlled entities (Group or CCA Group)for the financial year ended 31 December 2005.
Names and particulars of DirectorsThe names of the Directors of Coca-Cola Amatil Limited in office during the financial year and until the date of this Report and the beneficial interest ofeach Director in the share capital of the Company are detailed below –
Non- ExecutiveLong Term executive Salary
Ordinary Incentive Directors’ Sacrificeshares Share Plan1 Share Plan1 Share Plan1
No. No. No. No.
Directors in office at the date of this ReportDavid Michael Gonski, AO 41,454 – 105,989 –Jillian Rosemary Broadbent, AO 1,011 – 10,687 –Terry James Davis 163,229 269,892 – 73,493Irial Finan Appointed 9 August 2005 – – 1,833 –Geoffrey James Kelly 1,301 – 6,370 –Wallace Macarthur King, AO 1,200 – 17,665 –David Edward Meiklejohn Appointed 25 February 2005 5,715 – 3,412 –Melvyn Keith Ward, AO 1,507 – 10,599 –Former DirectorHenry Aaron Schimberg Resigned 9 August 2005
1 Beneficial interest held subject to conditions of the Plan.
Particulars of the qualifications, other directorships, experience and special responsibilities of each Director are set out on pages 30 and 31 of the Annual Report.
DividendsRate per Franking
share per share Amount Date paid or¢ ¢ $M payable
Final dividend declared but not paid on ordinary shares (not recognised as a liability) 17.5 17.5 130.9 3 April 2006
Dividends paid in the year –Final dividend on ordinary shares for 2004 15.5 15.5 109.9 1 April 2005Interim dividend on ordinary shares for 2005 14.0 14.0 104.6 3 October 2005
Corporate informationCoca-Cola Amatil Limited is a company limited by shares that is incorporated and domiciled in Australia. The Company does not have a parent entity. The address of the registered office of the Company is set out on page 124 of the Annual Report.
EmployeesThe Group had 18,872 employees as at 31 December 2005 (2004: 16,845).
Coca-Cola Amatil 2005 Annual Report 39
Operating andfinancial reviewPrincipal activities and operationsThe principal activities of the Group during the course of the financial year ended 31 December 2005 were –
• the manufacture, distributionand marketing of carbonatedsoft drinks, still and mineralwaters, fruit juices and otheralcohol-free beverages;
• from September 2005, CCA’sbeverage segment alsoincludes the Grinders Coffeebusiness; and
• the processing and marketingof fruit, vegetables and otherfood products.
Its principal operations were inAustralia, Pacific (New Zealandand Fiji), South Korea, Indonesiaand Papua New Guinea.
Financial resultsThe Group achieved a double digitincrease in net profit attributableto members of the Company,which grew 15.9 percent to$320.5 million for the year to 31 December 2005, compared to $276.6 million in 2004.
The Group’s revenue from sale ofbeverages and food for thefinancial year was $3,987.5 millioncompared with $3,450.1 million for2004. Earnings before interest andtax (EBIT) increased 10.0 percentto $570.6 million, compared to$518.7 million in 2004.
The Group’s net finance costs for the financial year were $140.5 million, up from $111.0 million in 2004 mainly due to increased debt levelsresulting from debt issued as part of the SPC Ardmona Ltdacquisition.
Operating cash flow increased by 14.2 percent to $435.2 millioncompared with $381.0 million in 2004.
Review of operationsThe EBIT contribution from each operating segment was as follows –
• Australian beverage businessEBIT increased by 5.3 percentto $455.5 million, comparedwith $432.5 million in 2004;
• Pacific business, comprisingNew Zealand and Fiji,contributed $72.0 million,compared with $81.9 million in 2004;
• South Korea’s EBIT was a lossof $6.6 million, compared to aprofit of $11.3 million in 2004;
• Indonesia & PNG contributed$42.9 million, compared to$26.1 million in 2004;
• SPC Ardmona Ltd and itscontrolled entities (SPCA)contributed EBIT of $45.7 million for the periodsince acquisition on 25 February 2005; and
• Corporate and unallocatedcosts before interest and taxwere $38.9 million comparedwith $33.1 million in 2004.
Further details of the operationsof the Group during the financialyear are set out on pages 2 to 36of the Annual Report.
Significant changesOn 25 February 2005 the Group successfully acquired SPC Ardmona Ltd for a totalconsideration of $523.5 million.This acquisition significantlybroadens the Group’s brandportfolio in the high growth healthand well-being segment.
Other acquisitions during the yearcomprised –
1. Northern Territory Coca-Colabottling agreement and relatedassets for a total considerationof $29.6 million;
2. Grinders Coffee business and related assets; and
3. CCA Indonesia outside equity interest for a totalconsideration of $30.0 million.
In the opinion of the Directors,there have been no othersignificant changes in the Group’sstate of affairs or principalactivities during the twelvemonths to 31 December 2005.
Future developmentsThe Group remains focussed ondriving per capita consumptiongrowth through the execution ofthe five core business drivers.These are –
1. Product and packageinnovation;
2. Non-carbonated beverage andfood growth;
3. Expanding the availability ofCCA products into new outlets;
4. Customer service enhancement;and
5. Revenue management and costdiscipline.
While the Company continues tomeet its obligations in respect ofcontinuous disclosure, furtherinformation of likelydevelopments, business strategiesand prospects has not beenincluded here because, in theopinion of the Directors, suchdisclosure would unreasonablyprejudice the interests of theGroup.
Environmental regulation and performanceManagement of environmentalissues is a core component ofoperational management withinthe Group’s businesses. The Groupis committed to understandingand minimising any adverseenvironmental impacts of itsbeverage and food manufacturingactivities, recognising that the keyareas of environmental impact arewater use, energy use and postsale to consumer waste.
Group policy is to ensure allenvironmental laws and permitconditions are observed. TheGroup monitors its environmentalissues at an operational level,overlaid with a compliance systemoverseen by the Audit, Risk &Compliance Committee. Althoughthe Group’s various operationsinvolve relatively low inherentenvironmental risks, matters ofnon-compliance are identifiedfrom time to time and arecorrected as part of routinemanagement, and typicallynotified to the appropriateregulatory authority.
Further information on the Group’senvironmental performance canbe found on pages 24 and 25 ofthe Annual Report.
40 Coca-Cola Amatil 2005 Annual Report
Directors’ Report continued
Coca-Cola Amatil LimitedFor the financial year ended 31 December 2005
Directors’ meetingsThe number of Directors’ meetings (including meetings of Committees of Directors) and the number of meetings attended by each of the Directors of theCompany during the financial year are detailed below –
Audit, Risk &Board of Compliance Compensation Related Party Nominations OtherDirectors Committee2 Committee3 Committee4 Committee5 Committees6
Meetings No. of Meetings No. of Meetings No. of Meetings No. of Meetings No. of No. ofheld while meetings held while meetings held while meetings held while meetings held while meetings meetingsa Director attended a member attended a member attended a member attended a member attended attended
Directors in office at the end of the financial yearD.M. Gonski, AO 7 7 – – 4 4 7 7 1 1 –J.R. Broadbent, AO 7 7 4 4 4 4 7 7 1 1 –T.J. Davis 7 7 – – 1 1 – – – – 22I. Finan1 2 1 1 – – – – – – – –G.J. Kelly1 7 6 3 3 2 1 – – – – –W.M. King, AO 7 7 – – – – 7 7 1 1 –D.E. Meiklejohn 5 5 2 2 – – 6 6 1 1 –M.K. Ward, AO 7 7 4 4 4 4 7 7 1 1 1Former DirectorH.A. Schimberg1 5 5 – – 3 3 – – – – –
1 Non-residents of Australia.
2 This Committee reviews matters relevant to control systems so as to effectively safeguard the Company’s assets, accounting records held to comply with statutory requirements and otherfinancial information. It consists of non-executive Directors. Refer to the Corporate Governance section on pages 32 to 36 of the Annual Report for further details on this and other Committees.
3 This Committee reviews matters relevant to the remuneration of executive Directors and senior Company executives. It consists of four non-executive Directors and until March 2005 included theGroup Managing Director (in relation to remuneration matters other than those relating to the Group Managing Director’s remuneration).
4 This Committee reviews agreements and business transactions with related parties. It consists of all non-executive Directors who are not associated with a related party.
5 This Committee reviews the composition of the Board, including identifying suitable candidates for appointment to the Board and reviews general matters of corporate governance. It consists ofall independent non-executive Directors.
6 Committees were created to attend to allotments of securities and administrative matters on behalf of the Board. A quorum for these Committees is any two Directors, or any one Director andthe Chief Financial Officer.
Committee membershipAs at the date of this Report, the Company had an Audit, Risk & Compliance Committee, Compensation Committee, Related Party Committee andNominations Committee of the Board of Directors.
Members acting on the committees of the Board during the year were –
Audit, Risk & Compliance Compensation Related Party Nominations
J.R. Broadbent, AO1 D.M. Gonski, AO D.M. Gonski, AO1 D.M. Gonski, AO1
I. Finan J.R. Broadbent, AO J.R. Broadbent, AO J.R. Broadbent, AOG.J. Kelly T.J. Davis W.M. King, AO W.M. King, AOD.E. Meiklejohn G.J. Kelly2 D.E. Meiklejohn D.E. MeiklejohnM.K. Ward, AO H.A. Schimberg M.K. Ward, AO M.K. Ward, AO
M.K. Ward, AO1
1 Chairman of the relevant committee.
2 Mr Kelly replaced Mr Schimberg as The Coca-Cola Company’s representative on the Compensation Committee.
Directors’ and officers’ liability insuranceThe Company has paid the premium for Directors’ and officers’ liability insurance in respect of Directors and executive officers of the Company and itscontrolled entities as permitted by the Corporations Act 2001. The terms of the policy prohibit disclosure of details of the insurance cover and premium.
Coca-Cola Amatil 2005 Annual Report 41
Remuneration reportThis report outlines theremuneration arrangements forDirectors and senior executives of the Company and providesdisclosures in accordance with the remuneration reportingrequirements of the CorporationsAct 2001 including therequirements of the CorporateLaw and Economic ReformProgram and AASB 124 “RelatedParty Disclosures”. Theinformation contained in thisreport has been audited.
The remuneration arrangementsdetailed in this report are for allkey management personnel inaccordance with AASB 124 andincluding CCA’s non-executiveDirectors and CCA’s only executiveDirector, being the GroupManaging Director.
Compensation Committeea) Function
The Compensation Committee is aCommittee of the Board ofDirectors. Its functions are toreview –
• issues relating to theremuneration of CCA’s GroupManaging Director, seniorexecutives and non-executiveDirectors;
• senior executives successionplanning; and
• general matters ofremuneration and successionplanning.
b) Membership
The Committee is comprised offour non-executive Directors. The CCA Board will appoint theChairman of the Committee.
c) Meetings
The Committee will meet at aminimum of three times per year.The normal meeting schedule willbe four meetings per year, beingin February, June, August andDecember. The Committee can
also meet on such other occasionsas deemed necessary by theChairman. A quorum for meetingswill be two members. CCA’s GroupManaging Director, HumanResources Director andRemuneration Manager will be in attendance for the meetings. The Chairman of the Committeewill report the findings andrecommendations of theCommittee to the Board at its next meeting.
d) Responsibilities
RemunerationOn an annual basis, theCommittee will –
• obtain data from externalremuneration sources to ensurethe Company’s remunerationpractices are in line withmarket conditions;
• review the Group ManagingDirector’s remunerationpackage, incentive paymentsand termination arrangementsand where appropriate makerecommendations to the Board;
• review and approve all materialremuneration components ofsenior executive remunerationpackages and incentivepayments (at CCA job grade Cand above);
• review country retirement plans;• review and approve senior
executive variable incentiveplan rules and participation forthe forthcoming year (bothannual cash plans and the LongTerm Incentive Share Plan); and
• review and where appropriatemake recommendations to theBoard for changes to non-executive Directorremuneration.
The Committee also reviews anyappointments, terminations andchanges to remuneration duringthe year for those seniorexecutives reporting directly tothe Group Managing Director.
Succession planning On at least an annual basis, the Committee will review thesuccession plans for the GroupManaging Director and seniorexecutives.
e) Authority
With respect to remuneration –
• for senior executives, theCommittee has the authority toapprove remuneration, policiesand procedures. Matters ofsignificant importance will bereferred to the Board; and
• recommendations on the GroupManaging Director and non-executive Director remunerationwill be referred to the Board.
With respect to successionplanning –
• for senior executives, theCommittee has the authority toapprove. Matters of significantimportance will be referred tothe Board; and
• recommendations on the GroupManaging Director successionplanning will be referred to theBoard.
Remuneration PolicyThe Committee is responsible forreviewing the nature and amountof the Group Managing Directorand senior executives’remuneration. In determining thecomposition and amount of theGroup Managing Director andsenior executives’ remuneration,the Committee applies theCompany’s Remuneration Policy inwhich the main principles andpractices are as follows –
• remuneration will becompetitively set to attract,motivate and retain top calibreexecutives;
• remuneration will incorporate,to a significant degree, variablepay for performance elements,both short term and long term,which will –
– link executive reward withthe strategic goals andperformance of the Group;
– align the interests ofexecutives with those ofshareholders;
– reward the Group ManagingDirector and seniorexecutives for Group,business unit (whereapplicable) and individualperformance againstappropriate benchmarks andtargets; and
– ensure total remuneration iscompetitive by marketstandards;
• remuneration will be reviewedannually by the CompensationCommittee through a processthat considers Group, businessunit and individualperformance. The Committeewill also consider pertinentadvice from externalconsultants on currentinternational and local marketpractices and will take accountof market comparisons forsimilar roles together with thelevel of responsibilities of theindividual;
• remuneration systems willcomplement and reinforce theCompany’s Code of Conductand succession planning; and
• remuneration and terms andconditions of employment willbe specified in an individualletter of employment andsigned by the executive and theCompany. The relationship ofremuneration, potential annualincentive and long termincentive payments isestablished for each level ofexecutive management by theCommittee. For executives, thepotential incentive payments asa proportion of total potentialremuneration increase withseniority and responsibility inthe organisation.
42 Coca-Cola Amatil 2005 Annual Report
Directors’ Report continued
Coca-Cola Amatil LimitedFor the financial year ended 31 December 2005
Remuneration reportcontinuedRemuneration structureThe Company’s remunerationstructure provides the flexibility todesign individual remunerationpackages for the Group ManagingDirector and executives based ontheir importance to the businessand their potential to impactbusiness performance.
The remuneration of the GroupManaging Director and executivescomprises fixed remuneration(includes both base salary andbenefits) and at risk remuneration.At risk remuneration includes bothshort and long term incentives.
The remuneration of non-executive Directors comprisesbase fees, Board Committee feesand superannuation guaranteewhere prescribed by law.
The Group Managing Director and senior executives’ totalremuneration is targeted at the75th percentile of comparablepositions in comparablecompanies, and this remunerationwill only be achieved if theindividual and Companyperformance targets are met.
The markets against which totalremuneration is benchmarked will vary by position and totalremuneration will bebenchmarked to companies thatare comparable to CCA. TheGroup Managing Director willcontinue to be benchmarkedagainst other Australian andwhere applicable internationalcompanies comparable to CCA.
The Company’s approach in recentyears is to move to have a greatercomponent of at risk remunerationfor executives and for seniorexecutives to have higher levelsof shareholding in CCA. At riskremuneration as a percentage oftotal remuneration may varydepending on the importance ofthe individual to the business and
their potential to impact onbusiness performance.
Total remuneration is made up of –
• fixed remuneration (base salary,benefits such assuperannuation); and
• at risk remuneration –– short term incentive; and– long term incentive.
a) Fixed remuneration
Fixed remuneration comprisesbase salary and benefits(including superannuation) andincludes any applicable fringebenefits tax reflecting CCA’s totalcost to the Company approach.The base remuneration isdetermined on an individual basis,considering the size and scope ofthe role, the importance of therole to the Company and thecompetitiveness of the role in themarket place.
Fixed remuneration also includesdeferred remuneration payableunder the terms of a serviceagreement, which is either a onceonly payment in cash or a onceonly award of CCA shares madeat the completion of a specifiedemployment period.
Fixed remuneration does not varyover the course of a year due toperformance. Remunerationpackages (including fixedcomponents of base salaries andbenefits and variable components)are reviewed annually, and thereare no guaranteed increases toany remuneration component.
The Committee considerspertinent advice from externalremuneration consultants on fixedremuneration (including basesalary) taking account ofinternational and local marketpractices and market comparisonsfor similar roles, together with the level of responsibility,performance and potential of the executive.
b) At risk remuneration
At risk remuneration comprisesboth short term (annual) and longterm incentives. The annualincentive and long term incentiveare an integral part of CCA’sapproach to competitiveperformance based remuneration.These at risk components of theGroup Managing Director andsenior executives’ remunerationare intended to ensure anappropriate proportion of theremuneration is linked to growthin shareholder value and theachievement of key operationaltargets. The Group ManagingDirector and senior executives’remuneration is linked toperformance through short andlong term incentives as follows –
Short Term Incentive Plan (STIP)The STIP provides the opportunityfor executives to earn an annualcash incentive that is subject tothe achievement of targets thatare set at the beginning of thefinancial year. The Board annuallyinvites the Group ManagingDirector and senior executives to participate in the STIP. Both on-target and maximum STIPamounts are set by reference to the external market of CCA’sappropriate peers. The incentivesare valued in the executive’sremuneration package at an on-target value, which assumes100% achievement of the targets.Company performance targets arereviewed and approved by theCommittee prior to the start of theyear and are clearly defined andmeasurable.
The STIP aims to provide a focuson key objectives for each year, toemphasise team performance andto identify and reward individualcontribution. Payments from theSTIP are determined based on theperformance of the Group orbusiness unit and individualperformance over the past year.
Group performance is based onachievement of volume and netoperating profit after tax (NOPAT)targets against budget. Businessunit performance is based onachievement of earnings beforeinterest and tax targets againstbudget and where relevant for thebusiness unit, achievement ofvolume targets against budget.These performance measureshave been selected as theydirectly align the executives’reward to the key performancedrivers of the Company. Individualperformance is based on theachievement of pre-determinedkey performance indicators.
The Committee reviews annuallythe ongoing appropriateness ofthe STIP, the Plan rules and thedegree of difficulty in meeting thetargets. At the completion of thefinancial year, the Committeerelies on audited financial resultsfor calculating payments inaccordance with the Plan rules.The Committee reviews the actualperformance against the targets,considers individual performanceand approves all incentivepayments for the past financialyear prior to payment being madein March of the followingfinancial year. The incentive ispaid in cash for all countries withthe exception of Australia, where10% of the incentive earned up totarget and 100% of any incentiveearned over target (up to amaximum of 120%) is required tobe sacrificed into CCA ordinaryshares. An executive can alsoelect to have up to a further 15%of the earned incentive sacrificedinto shares. Shares must remainin trust for twelve months, afterwhich a participant may withdrawthe shares.
Coca-Cola Amatil 2005 Annual Report 43
Remuneration reportcontinuedRemuneration structurecontinuedLong Term Incentive Share Plan (LTISP)The Board annually invites theGroup Managing Director andsenior executives to participate inthe performance based LTISP. TheLTISP was established in 2002,replacing both a long term cashincentive plan and subsequentlythe Executive Option Plan, whichhad no performance hurdles.
The LTISP creates a direct linkbetween the financialperformance of the Company, thevalue created for shareholdersand the reward earned by keyexecutives. In addition, the LTISPassists in retention of the seniorexecutives and provides amechanism for executives toincrease their holding of shares,ensuring better alignment withshareholders. Both threshold andmaximum LTISP amounts are setby reference to the externalmarket of CCA’s appropriate peergroup of companies.
The LTISP offers the executive aright to an ordinary share in theCompany, subject to theachievement of the applicableperformance conditions –
i) in respect of the 2002-2004 and 2003-2005 performanceperiods, the performancecondition is based on TotalShareholder Return (TSR)measured over a performanceperiod against a peer group ofcompanies. The TSR hurdle was selected as it is widelyaccepted as one of the betterindicators of shareholder valuecreation relative to othersimilar companies; and
ii) in respect of the 2004-2006 and 2005-2007 performanceperiods, half of the award issubject to a TSR measure andhalf of the award is subject tothe measurement ofachievement of average annualgrowth in NOPAT over theperiod. The NOPAT hurdle wasselected as it is a stretchingand “line of sight” hurdle forthe Plan participants, withachievement of the hurdledirectly correlating to improvedshareholder value. Indetermining whether theNOPAT hurdle has beenachieved, appropriateadjustments will be made formovements in the issuedcapital of the Companyresulting from the issue of newshares for acquisitions made bythe Company or capitalreconstructions such as buy-backs etc. Shares issued withrespect to the acquisition ofSPC Ardmona Ltd will give riseto a commensurate adjustmentin the calculation of theapplicable NOPAT hurdle underthe 2005-2007 plan.
At the completion of the relevantplan period, an external consultantundertakes the TSR calculations inaccordance with a pre-determinedTSR methodology and the Planrules. For those plans subject to aNOPAT performance measure, theCommittee relies on auditedfinancial results and the award ofshares is calculated in accordancewith the Plan rules. The Committeereviews the calculations andapproves all awards prior to theshares being awarded.
Further detail on the performanceconditions, peer groups, maximumawards and retesting is providedin the accompanying summary of
the terms and conditions of theLTISP on pages 44 to 47. If theexecutive ceases to be employedbefore the end of the performanceperiod by reason of death,disablement, retirement orredundancy, or for such otherreason determined by the Board,the following proportion of sharesoffered to the executive in respectof that performance period will beallocated subject to the Board’sdiscretion –
• where less than one-third ofthe performance period haselapsed, none of the shareswill be allocated; and
• if more than one-third of theperformance period haselapsed, the number of sharesto be allocated will be prorated over the performanceperiod and the performancecondition will apply at the dateof cessation of employment.
In the event of a change of controlof the Company prior to the end ofa performance period, thethreshold number of sharesoffered to the executive in respectof the performance period will beallocated to the executiveirrespective of whether theperformance condition has beensatisfied.
Once shares have been allocatedfollowing the achievement of theperformance conditions, thereremains a restriction on executivesdisposing of a portion of sharesallocated to them under the LTISPfor two years after allocation inaccordance with a prescribedscale. The restrictions on disposalwill cease if an executive ceasesemployment and may be waivedby the Board in specialcircumstances such as change ofcontrol or other events affectingthe issued capital of the Company.
Any awards under the LTISP aremade in accordance with the rulesof the LTISP. The shares areoffered to the executives at nocost. At the end of theperformance period and subject to the satisfaction of theperformance condition(s), anyshares allocated will be acquiredby the Plan trustee and under thePlan rules can either be acquiredby purchase of shares on theAustralian Stock Exchange (ASX)at the prevailing market price orby subscription for new shares atno cost to the executive. To date,all awards of shares earned byexecutives have been purchasedon market.
Under CCA’s Policy of Dealing inCCA Shares, Directors’ andexecutives are prohibited indealing in short term orspeculative trading in theCompany’s shares andtransactions in the derivativemarkets.
The movement of shares duringthe reporting period held directly,indirectly or beneficially, by theGroup Managing Director isdisclosed in Note 33 of thefinancial statements.
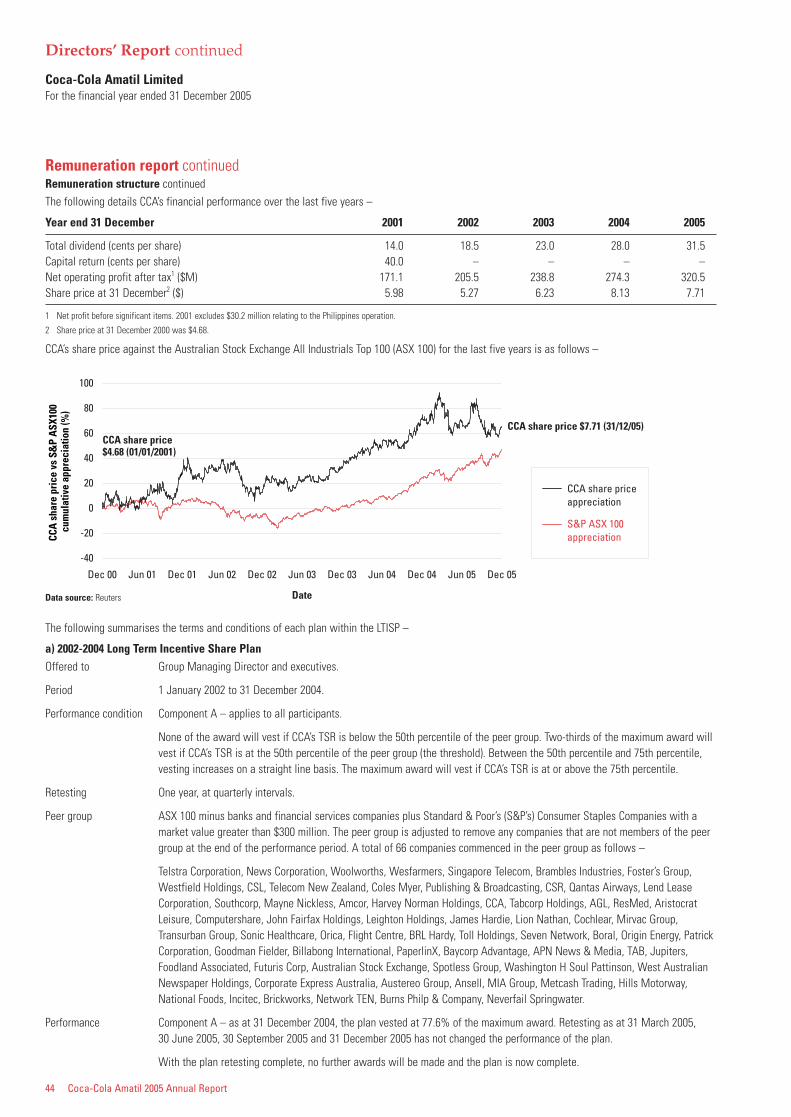
44 Coca-Cola Amatil 2005 Annual Report
Directors’ Report continued
Coca-Cola Amatil LimitedFor the financial year ended 31 December 2005
Remuneration report continuedRemuneration structure continuedThe following details CCA’s financial performance over the last five years –
Year end 31 December 2001 2002 2003 2004 2005
Total dividend (cents per share) 14.0 18.5 23.0 28.0 31.5Capital return (cents per share) 40.0 – – – –Net operating profit after tax1 ($M) 171.1 205.5 238.8 274.3 320.5Share price at 31 December2 ($) 5.98 5.27 6.23 8.13 7.71
1 Net profit before significant items. 2001 excludes $30.2 million relating to the Philippines operation.
2 Share price at 31 December 2000 was $4.68.
CCA’s share price against the Australian Stock Exchange All Industrials Top 100 (ASX 100) for the last five years is as follows –
The following summarises the terms and conditions of each plan within the LTISP –
a) 2002-2004 Long Term Incentive Share PlanOffered to Group Managing Director and executives.
Period 1 January 2002 to 31 December 2004.
Performance condition Component A – applies to all participants.
None of the award will vest if CCA’s TSR is below the 50th percentile of the peer group. Two-thirds of the maximum award willvest if CCA’s TSR is at the 50th percentile of the peer group (the threshold). Between the 50th percentile and 75th percentile,vesting increases on a straight line basis. The maximum award will vest if CCA’s TSR is at or above the 75th percentile.
Retesting One year, at quarterly intervals.
Peer group ASX 100 minus banks and financial services companies plus Standard & Poor’s (S&P’s) Consumer Staples Companies with amarket value greater than $300 million. The peer group is adjusted to remove any companies that are not members of the peergroup at the end of the performance period. A total of 66 companies commenced in the peer group as follows –
Telstra Corporation, News Corporation, Woolworths, Wesfarmers, Singapore Telecom, Brambles Industries, Foster’s Group,Westfield Holdings, CSL, Telecom New Zealand, Coles Myer, Publishing & Broadcasting, CSR, Qantas Airways, Lend LeaseCorporation, Southcorp, Mayne Nickless, Amcor, Harvey Norman Holdings, CCA, Tabcorp Holdings, AGL, ResMed, AristocratLeisure, Computershare, John Fairfax Holdings, Leighton Holdings, James Hardie, Lion Nathan, Cochlear, Mirvac Group,Transurban Group, Sonic Healthcare, Orica, Flight Centre, BRL Hardy, Toll Holdings, Seven Network, Boral, Origin Energy, PatrickCorporation, Goodman Fielder, Billabong International, PaperlinX, Baycorp Advantage, APN News & Media, TAB, Jupiters,Foodland Associated, Futuris Corp, Australian Stock Exchange, Spotless Group, Washington H Soul Pattinson, West AustralianNewspaper Holdings, Corporate Express Australia, Austereo Group, Ansell, MIA Group, Metcash Trading, Hills Motorway,National Foods, Incitec, Brickworks, Network TEN, Burns Philp & Company, Neverfail Springwater.
Performance Component A – as at 31 December 2004, the plan vested at 77.6% of the maximum award. Retesting as at 31 March 2005, 30 June 2005, 30 September 2005 and 31 December 2005 has not changed the performance of the plan.
With the plan retesting complete, no further awards will be made and the plan is now complete.
-40
-20
0
20
40
60
80
100
Dec 00 Jun 01 Dec 01 Jun 02 Dec 02
Date
Jun 03 Dec 03 Jun 04 Dec 04 Dec 05Jun 05
CCA
shar
e pr
ice
vs S
&P
ASX1
00
cum
ulat
ive
appr
ecia
tion
(%)
CCA share price $7.71 (31/12/05)CCA share price $4.68 (01/01/2001)
CCA share price appreciation
S&P ASX 100 appreciation
Data source: Reuters
Coca-Cola Amatil 2005 Annual Report 45
Remuneration report continuedRemuneration structure continuedb) 2003-2005 Long Term Incentive Share PlanOffered to Group Managing Director and executives.
Period 1 January 2003 to 31 December 2005.
Performance condition Component A – applies to all participants.
None of the award will vest if CCA’s TSR is below the 50th percentile of the peer group. Two-thirds of the maximum award willvest if CCA’s TSR is at the 50th percentile of the peer group (the threshold). Between the 50th percentile and 75th percentile,vesting increases on a straight line basis. The maximum award will vest if CCA’s TSR is at or above the 75th percentile.
Component B – not applicable.
Component C – applies only to Group Managing Director (for details refer to the section on the Group Managing Director’semployment contract).
Retesting One year, at quarterly intervals.
Peer group ASX 100 minus banks and financial services companies and mining and resources companies plus S&P’s GICS ConsumerStaples Companies with a market value greater than $300 million. The peer group is adjusted to remove any companies thatare not members of the peer group at the end of the performance period. A total of 59 companies commenced in the peer groupas follows –
Telstra Corporation, News Corporation, Woolworths, Wesfarmers, Brambles Industries, Foster’s Group, Westfield Holdings, CSL,Telecom New Zealand, Coles Myer, Publishing & Broadcasting, CSR, Qantas Airways, Lend Lease Corporation, Southcorp,Mayne Nickless, Amcor, Harvey Norman Holdings, CCA, Tabcorp Holdings, AGL, ResMed, Aristocrat Leisure, Computershare,John Fairfax Holdings, Leighton Holdings, James Hardie, Lion Nathan, Cochlear, Mirvac Group, Transurban Group, SonicHealthcare, Orica, BRL Hardy, Toll Holdings, Seven Network, Boral, Goodman Fielder, Billabong International, PaperlinX, APNNews & Media, TAB, Jupiters, Foodland Associated, Futuris Corp, Australian Stock Exchange, Western Australian NewspaperHoldings, Ansell, MIA Group, Metcash Trading, National Foods, Network TEN, Burns Philp & Company, BlueScope Steel, PatrickCorporation, AWB, OneSteel, McGuigan Simeon Wines, Ridley Corporation.
Performance Component A – as at 31 December 2005, CCA ranked at the 30th percentile in the peer group and the Component did not vestat this date.
Component C – at the end of the twelve month performance period, CCA ranked at the 52nd percentile in the peer group andthe Component vested at 100% of the maximum award.
c) 2004-2006 Long Term Incentive Share PlanOffered to Group Managing Director and executives.
Period 1 January 2004 to 31 December 2006.
Performance condition Two performance conditions exist, with half of the award subject to a TSR measure and half of the award subject to theachievement of average annual growth in NOPAT over the period.
Component A – applies to all participants.
None of the award will vest if CCA’s TSR is below the 50th percentile of the peer group. Two-thirds of the maximum award willvest if CCA’s TSR is at the 50th percentile of the peer group (the threshold). Between the 50th percentile and 75th percentile,vesting increases on a straight line basis. The maximum award will vest if CCA’s TSR is at or above the 75th percentile.
Component B – applies to all participants.
None of the award will be allocated unless the Company’s average growth in NOPAT is 10% per annum over the performanceperiod. If the Company’s average growth is 10% per annum over the performance period, two-thirds of the maximum award willvest (the threshold). Between 10% and 15% per annum average growth, vesting increases on a straight line basis. Themaximum award will vest if CCA’s average growth is at or above 15% per annum.
Component C – applies only to Group Managing Director (for details refer to the section on the Group Managing Director’semployment contract).
Retesting For the TSR performance measure, one year at quarterly intervals. There is no retesting of the NOPAT performance measure.
46 Coca-Cola Amatil 2005 Annual Report
Directors’ Report continued
Coca-Cola Amatil LimitedFor the financial year ended 31 December 2005
Remuneration report continuedRemuneration structure continuedc) 2004-2006 Long Term Incentive Share Plan continuedPeer group ASX 100 minus banks and financial services companies and mining and resources companies plus S&P’s GICS Consumer Staples
Companies with a market value greater than $300 million. The peer group is adjusted to remove any companies that are not membersof the peer group at the end of the performance period. A total of 58 companies commenced in the peer group as follows –
Telstra Corporation, News Corporation, Woolworths, Wesfarmers, Brambles Industries, Foster’s Group, Westfield Holdings, CSL,Telecom New Zealand, Coles Myer, Publishing & Broadcasting, CSR, Qantas Airways, Lend Lease Corporation, Southcorp,Mayne Nickless, Amcor, Harvey Norman Holdings, CCA, Tabcorp Holdings, AGL, ResMed, Aristocrat Leisure, Computershare,John Fairfax Holdings, Leighton Holdings, James Hardie, Lion Nathan, Cochlear, Mirvac Group, Transurban Group, SonicHealthcare, Orica, Toll Holdings, Boral, Billabong International, PaperlinX, APN News & Media, TAB, Foodland Associated,Futuris Corp, Australian Stock Exchange, Western Australian Newspaper Holdings, Ansell, Metcash Trading, National Foods,Network TEN, Burns Philp & Company, BlueScope Steel, Patrick Corporation, AWB, OneSteel, McGuigan Simeon Wines, RidleyCorporation, Rinker Group, Gunns, Sigma, Sims.
Performance Components A and B – as at 31 December 2005, for the TSR performance measure CCA ranked at the 22nd percentile and forthe NOPAT performance measure CCA averaged 14.65% growth per annum during the period.
Component C – at the end of the twelve month performance period for the TSR performance measure, CCA ranked at the 35thpercentile and for the NOPAT performance measure CCA achieved 16.4% growth per annum during the period, with the TSRportion of the Component not vesting and the NOPAT portion of the Component vesting at 50% of the maximum award.
d) 2005-2007 Long Term Incentive Share PlanOffered to Group Managing Director and executives.
Period 1 January 2005 to 31 December 2007.
Performance condition Two performance conditions exist, with half of the award subject to a TSR measure and half of the award subject to theachievement of average annual growth in NOPAT over the period.
Component A – applies to all participants.
None of the award will vest if CCA’s TSR is below the 50th percentile of the peer group. 58.824% of the maximum TSR awardwill vest if CCA’s TSR is at the 50th percentile of the peer group (the threshold). Between the 50th percentile and 70thpercentile, vesting increases on a straight line basis. 88.235% of the maximum TSR award will vest if CCA’s TSR is at the 70thpercentile of the peer group. Between the 70th percentile and 75th percentile, vesting increases on a straight line basis. Themaximum TSR award will vest if CCA’s TSR is at or above the 75th percentile.
Component B – applies to all participants.
None of the award will be allocated unless the Company’s average growth in NOPAT is 8% per annum over the performanceperiod. 47.058% of the maximum NOPAT award will vest if the Company’s average growth is 8% per annum. Between 8% and9% annual average growth, vesting increases on a straight line basis. 58.824% of the maximum NOPAT award will vest if theCompany’s average growth is 9% per annum (the threshold). Between 9% and 10% annual average growth, vesting increaseson a straight line basis. 70.588% of the maximum NOPAT award will vest if the Company’s average growth is 10% per annum.Between 10% and 15% annual average growth, vesting increases on a straight line basis. The maximum NOPAT award willvest if the Company’s average growth is at or above 15% per annum. In determining whether the NOPAT hurdle has beenachieved, appropriate adjustments will be made for movements in the issued capital of the Company resulting from the issue ofnew shares for acquisitions made by the Company or capital reconstructions such as buy-backs etc. Shares issued with respectto the acquisition of SPC Ardmona Ltd will give rise to a commensurate adjustment in the calculation of the applicable NOPAThurdle under the 2005-2007 plan.
Component C – applies only to Group Managing Director (for details refer to the section on the Group Managing Director’semployment contract).
Overall maximum award The combined number of shares to be awarded under the TSR performance measure together with those awarded under the NOPATperformance measure cannot exceed 88.235% of the combined maximum awards under each individual performance measure.
Exceptional performance If the TSR ranking exceeds the 70th percentile (subject to the SPC Ardmona Ltd adjustment detailed above) or if the averagegrowth in NOPAT exceeds 15% per annum, a minimum of 58.824% of the maximum award of both the shares allocated underthe TSR performance measure and the NOPAT performance measure will be awarded.
Retesting For the TSR performance measure, two years at quarterly intervals. There is no retesting of the NOPAT performance measure.
Coca-Cola Amatil 2005 Annual Report 47
Remuneration report continuedRemuneration structure continuedd) 2005-2007 Long Term Incentive Share Plan continuedPeer group ASX 100 minus banks and financial services companies and mining and resources companies plus S&P’s GICS Consumer
Staples Companies with a market value greater than $300 million. The peer group is adjusted to remove any companies thatare not members of the peer group at the end of the performance period, with 15 companies on the reserve list to replacethose, which are removed. A total of 61 companies commenced in the peer group as follows –
Telstra Corporation, News Corporation, Woolworths, Wesfarmers, Brambles Industries, Foster’s Group, CSL, Telecom NewZealand, Coles Myer, Publishing & Broadcasting, CSR, Qantas Airways, Lend Lease Corporation, Southcorp, Mayne Nickless,Amcor, Harvey Norman Holdings, CCA, Tabcorp Holdings, AGL, ResMed, Aristocrat Leisure, Computershare, John FairfaxHoldings, Leighton Holdings, James Hardie, Lion Nathan, Cochlear, Transurban Group, Sonic Healthcare, Orica, Toll Holdings,Boral, Billabong International, PaperlinX, APN News & Media, Foodland Associated, Futuris Corp, Western AustralianNewspaper Holdings, Ansell, Metcash Trading, National Foods, Network TEN, Burns Philp & Company, BlueScope Steel, PatrickCorporation, AWB, OneSteel, McGuigan Simeon Wines, Ridley Corporation, Rinker Group, Gunns, Sigma, Sims, DCA Group,Pacific Brands, ABB Grain, GrainCorp, SPC Ardmona, Select Harvests, Australian Agricultural Company.
Reserve list – WorleyParsons, Corporate Express Australia, Spotless Group, Smorgon Steel, Great Southern Plantations,Transfield Services, Ramsay Health Care, Southern Cross Broadcasting (Australia), David Jones, Adelaide Brighton, Coates Hire,GWA International, Baycorp Advantage, Austereo Group, FKP Property Group.
Performance Components A and B – as at 31 December 2005, for the TSR performance measure CCA ranked at the 35th percentile and forthe NOPAT performance measure CCA achieved 12.9% growth per annum during the period.
Component C – at the end of the twelve month performance period CCA achieved the performance detailed above, with theTSR portion of the Component not vesting and the NOPAT portion of the Component vesting at 49.7% of the maximum award.
Summary of employment contractsThe following are details of the employment contracts for key management personnel (excluding non-executive Directors) –
T.J. Davis – Group Managing DirectorEmployment period To 30 September 2009.
Remuneration package The on-target remuneration package is comprised of a 40% fixed component and a 60% variable component. The Committeereviews the remuneration package annually.
Benefits Superannuation, vehicle benefits, car-parking, leave loading and Company product.
Short Term Incentive Plan Ranges from on-target being 75% of base salary, up to a maximum award of 146% of base salary.
Long Term Incentive Mr Davis has the following allocations of shares –Share Plan
Component Maximum Vested amount Unvested (maximum)
2002-2004 LTISPA 154,500 119,892 –
2003-2005 LTISPA 174,750 – 174,750C 100,000 100,000 –
274,750 100,000 174,750
2004-2006 LTISPA and B 174,750 – 174,750
C 100,000 50,000 50,000
274,750 50,000 224,750
2005-2007 LTISPA 99,025 – 99,025B 99,025 – 99,025
Maximum of A and B 174,750 – 174,750C 150,000 74,500 75,500
324,750 74,500 250,250
48 Coca-Cola Amatil 2005 Annual Report
Directors’ Report continued
Coca-Cola Amatil LimitedFor the financial year ended 31 December 2005
Remuneration report continuedSummary of employment contracts continuedT.J. Davis – Group Managing Director continuedLong Term Incentive Component A – subject to the measurement of TSR. Component B – subject to the measurement of average annual growth inShare Plan continued NOPAT. Component C – as part of Mr Davis’ conditions of employment, it had been agreed that Mr Davis would be granted an
award of options under the Executive Option Plan annually on 12 November 2003 to 2006 inclusive. Subsequently, the Board determined not to issue further non-hurdle based options to executives and executive Directors under the Executive Option Plan,and as a consequence Component C was offered in lieu. For the 2003-2005 plan, all of the shares are subject to the same performance measure as Component A and for the 2004-2006 plan onwards, one-half of the shares are subject to the same performance measure as Component A and one-half of the shares are subject to the same performance measure as Component B.The performance measures will be tested twelve months after the commencement date of the performance period and if the performance measures have been achieved at that date, the shares will be allocated to Mr Davis. For the 2003-2005 and 2004-2006 LTISP, a maximum of 100% of the Component C award is allocated if the minimum or greater than the minimum performance measure is achieved. If the performance measures have not been achieved at the end of the twelve month period, the standard performance period applicable to the relevant LTISP will then apply.
Service agreement The service agreement commenced on 12 November 2001 and expires on 31 December 2008. If Mr Davis is employed by theCompany on 11 November 2006, he receives $1,000,000 (calculated as a deferred remuneration amount of $200,000 per annumfor the five years he has been employed with the Company), with one-fifth of this amount having been disclosed on an annualbasis. If Mr Davis is employed by the Company on 31 December 2007, he receives a further payment of $225,000 and oncompletion of his service agreement on 31 December 2008 he receives a final payment under the agreement of $225,000.
Termination If the Company terminates Mr Davis’ employment (for circumstances other than those related to fraud, dishonesty or seriousmisconduct) before 11 November 2006, he receives a service agreement payment of $1,450,000. If the Company terminates hisemployment after 11 November 2006 but before 31 December 2007, he receives a service agreement payment of $450,000 and ifhe is terminated after 31 December 2007 but before 31 December 2008, he receives a service agreement payment of $225,000.
In addition, if the Company terminates Mr Davis’ employment on or before 31 December 2006 (for circumstances other thanthose related to fraud, dishonesty or serious misconduct), he receives twenty four months of total remuneration (which isdefined as annual salary, any fringe benefits and an average annual STIP and LTISP that he received during the period of hisagreement). If the Company terminates his employment after 31 December 2006, he receives twenty four months of totalremuneration less the number of months worked after 31 December 2006.
Completion of Upon completion of the employment period at 30 September 2009, for those awards in the LTISP where the retesting has notemployment period completed, the Board will be able to allocate shares in circumstances where it would otherwise be unfair not to allocate
shares. For those awards where the three year performance period will not have completed, Mr Davis will be eligible for a pro rata award. Any annual and long service leave will be paid in accordance with the Company policy on payment of leave due to involuntary termination.
Notice period Mr Davis will be given not less than twelve months notice as to the Company’s intention to extend or not extend his service by Company agreement.
Resignation A minimum three months notice.
J.M. Wartig – Chief Financial OfficerLength of contract Open ended.
Remuneration package The on-target remuneration package is comprised of a 49% fixed component and a 51% variable component. The Committeereviews the remuneration package annually.
Benefits Superannuation, vehicle benefits, car-parking, Employees Share Plan and Company product.
Short Term Incentive Plan Ranges from on-target being 50% of fixed salary, up to a maximum award of 97.5% of fixed salary.
Long Term Incentive Mr Wartig has the following allocations of shares –Share Plan
Component Maximum Vested amount Unvested (maximum)
2004-2006 LTISP A and B 105,000 – 105,0002005-2007 LTISP A and B 105,000 – 105,000
For the 2005-2007 LTISP, the maximum TSR award is 59,500 shares and the maximum NOPAT award is 59,500 shares; however,the combined maximum of both awards is 105,000 shares.
Coca-Cola Amatil 2005 Annual Report 49
Remuneration report continuedSummary of employment contracts continuedJ.M. Wartig – Chief Financial Officer continuedService agreement The service agreement commenced on 21 June 2004 and expires on 21 June 2009. If Mr Wartig is employed by the Company on
21 June 2009, he receives $500,000 (calculated as a deferred remuneration amount of $100,000 per completed year of service forthe five years he has been employed with the Company), with one-fifth of this amount having been disclosed on an annual basis.
Termination If the Company terminates Mr Wartig’s employment (for circumstances other than those related to fraud, dishonesty or seriousmisconduct) before 21 June 2009, he receives a lump sum service agreement payment of $500,000 and in addition he receivesa maximum of twelve months of fixed remuneration (inclusive of both pay in lieu of notice and severance). This payment doesnot apply on expiry of the service agreement.
Resignation A minimum three months notice.
W.G. White – Managing Director, AustraliaLength of contract Open ended.
Remuneration package The on-target remuneration package is comprised of a 51% fixed component and a 49% variable component. The Committeereviews the remuneration package annually.
Benefits Superannuation, vehicle benefits, car-parking, leave loading, Employees Share Plan, club membership and Company product.
Short Term Incentive Plan Ranges from on-target being 50% of base salary, up to a maximum award of 97.5% of base salary.
Long Term Incentive Mr White has the following allocations of shares –Share Plan
Component Maximum Vested amount Unvested (maximum)
2002-2004 LTISP A 49,650 38,528 –2003-2005 LTISP A 95,275 – 95,2752004-2006 LTISP A and B 115,275 – 115,2752005-2007 LTISP A and B 115,275 – 115,275
For the 2005-2007 LTISP, the maximum TSR award is 65,323 shares and the maximum NOPAT award is 65,323 shares; however,the combined maximum of both awards is 115,275 shares.
Service agreement The service agreement commenced on 1 November 2002. Under Mr White’s original service agreement, he received a paymentof $350,000 on 1 November 2005 after three years of employment with the Company. The current service agreement expires on31 October 2009. If Mr White is employed by the Company on 31 October 2008, he receives 46,255 CCA shares, with one-thirdof this value disclosed on an annual basis. If Mr White is employed by the Company on 31 October 2009, he receives a further19,823 CCA shares. Mr White is entitled to receive the dividends on all of these shares prior to their vesting.
Termination If the Company terminates Mr White’s employment (for circumstances other than those related to fraud, dishonesty or seriousmisconduct) before 31 October 2008, he receives a service agreement award of 46,255 CCA shares. If the Company terminateshis employment after 31 October 2008 but before 31 October 2009, he receives a service agreement award of 19,823 shares. In addition, if the Company terminates Mr White’s employment before 31 October 2009 (for circumstances other than thoserelated to fraud, dishonesty or serious misconduct), he receives four months notice (or four months pay in lieu of notice) andtwelve months of fixed remuneration.
Notice period Mr White will be given not less than twelve months notice as to the Company’s intention to extend or not extend his service by Company agreement.
Resignation A minimum four months notice.
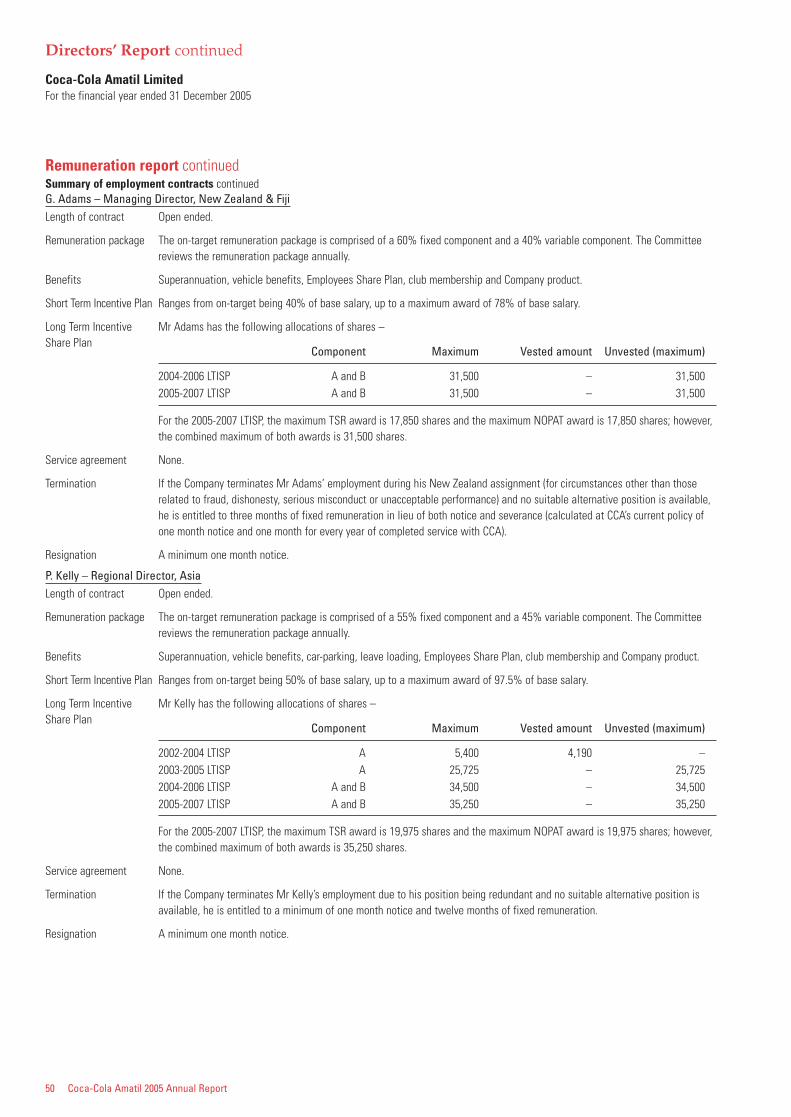
50 Coca-Cola Amatil 2005 Annual Report
Directors’ Report continued
Coca-Cola Amatil LimitedFor the financial year ended 31 December 2005
Remuneration report continuedSummary of employment contracts continuedG. Adams – Managing Director, New Zealand & FijiLength of contract Open ended.
Remuneration package The on-target remuneration package is comprised of a 60% fixed component and a 40% variable component. The Committeereviews the remuneration package annually.
Benefits Superannuation, vehicle benefits, Employees Share Plan, club membership and Company product.
Short Term Incentive Plan Ranges from on-target being 40% of base salary, up to a maximum award of 78% of base salary.
Long Term Incentive Mr Adams has the following allocations of shares –Share Plan
Component Maximum Vested amount Unvested (maximum)
2004-2006 LTISP A and B 31,500 – 31,5002005-2007 LTISP A and B 31,500 – 31,500
For the 2005-2007 LTISP, the maximum TSR award is 17,850 shares and the maximum NOPAT award is 17,850 shares; however,the combined maximum of both awards is 31,500 shares.
Service agreement None.
Termination If the Company terminates Mr Adams’ employment during his New Zealand assignment (for circumstances other than thoserelated to fraud, dishonesty, serious misconduct or unacceptable performance) and no suitable alternative position is available,he is entitled to three months of fixed remuneration in lieu of both notice and severance (calculated at CCA’s current policy ofone month notice and one month for every year of completed service with CCA).
Resignation A minimum one month notice.
P. Kelly – Regional Director, AsiaLength of contract Open ended.
Remuneration package The on-target remuneration package is comprised of a 55% fixed component and a 45% variable component. The Committeereviews the remuneration package annually.
Benefits Superannuation, vehicle benefits, car-parking, leave loading, Employees Share Plan, club membership and Company product.
Short Term Incentive Plan Ranges from on-target being 50% of base salary, up to a maximum award of 97.5% of base salary.
Long Term Incentive Mr Kelly has the following allocations of shares –Share Plan
Component Maximum Vested amount Unvested (maximum)
2002-2004 LTISP A 5,400 4,190 –2003-2005 LTISP A 25,725 – 25,7252004-2006 LTISP A and B 34,500 – 34,5002005-2007 LTISP A and B 35,250 – 35,250
For the 2005-2007 LTISP, the maximum TSR award is 19,975 shares and the maximum NOPAT award is 19,975 shares; however,the combined maximum of both awards is 35,250 shares.
Service agreement None.
Termination If the Company terminates Mr Kelly’s employment due to his position being redundant and no suitable alternative position isavailable, he is entitled to a minimum of one month notice and twelve months of fixed remuneration.
Resignation A minimum one month notice.
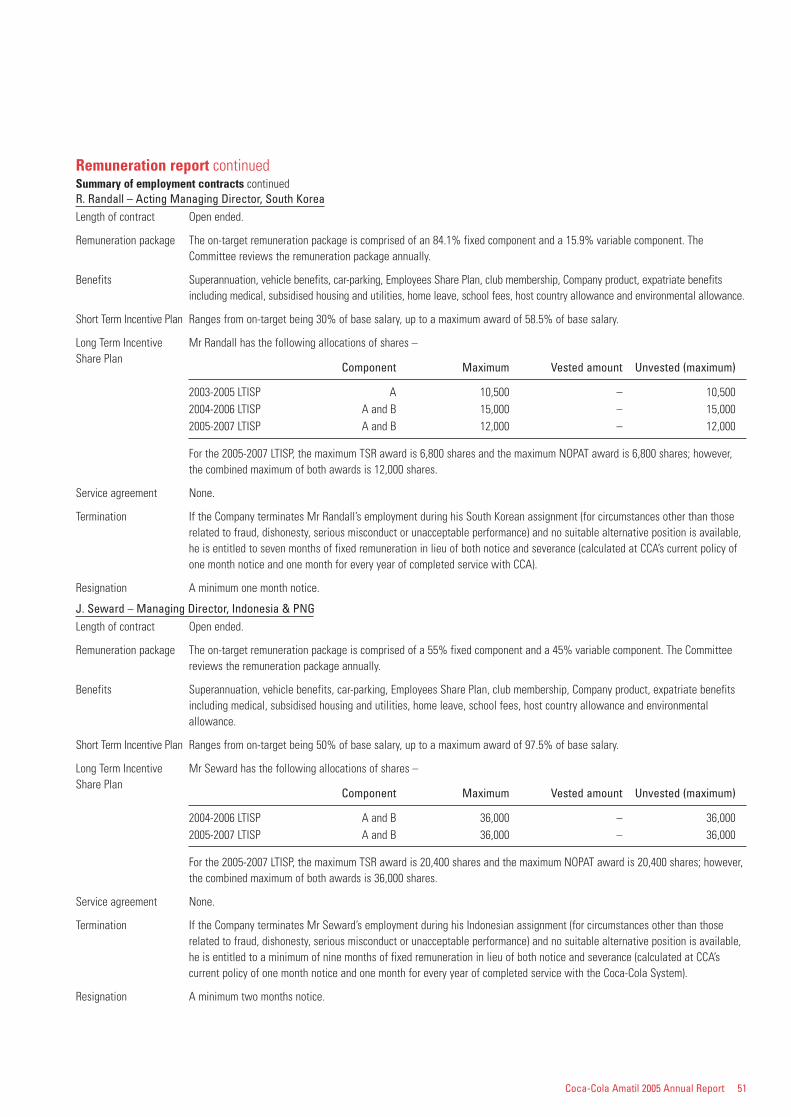
Coca-Cola Amatil 2005 Annual Report 51
Remuneration report continuedSummary of employment contracts continuedR. Randall – Acting Managing Director, South KoreaLength of contract Open ended.
Remuneration package The on-target remuneration package is comprised of an 84.1% fixed component and a 15.9% variable component. TheCommittee reviews the remuneration package annually.
Benefits Superannuation, vehicle benefits, car-parking, Employees Share Plan, club membership, Company product, expatriate benefitsincluding medical, subsidised housing and utilities, home leave, school fees, host country allowance and environmental allowance.
Short Term Incentive Plan Ranges from on-target being 30% of base salary, up to a maximum award of 58.5% of base salary.
Long Term Incentive Mr Randall has the following allocations of shares –Share Plan
Component Maximum Vested amount Unvested (maximum)
2003-2005 LTISP A 10,500 – 10,5002004-2006 LTISP A and B 15,000 – 15,0002005-2007 LTISP A and B 12,000 – 12,000
For the 2005-2007 LTISP, the maximum TSR award is 6,800 shares and the maximum NOPAT award is 6,800 shares; however,the combined maximum of both awards is 12,000 shares.
Service agreement None.
Termination If the Company terminates Mr Randall’s employment during his South Korean assignment (for circumstances other than thoserelated to fraud, dishonesty, serious misconduct or unacceptable performance) and no suitable alternative position is available,he is entitled to seven months of fixed remuneration in lieu of both notice and severance (calculated at CCA’s current policy ofone month notice and one month for every year of completed service with CCA).
Resignation A minimum one month notice.
J. Seward – Managing Director, Indonesia & PNGLength of contract Open ended.
Remuneration package The on-target remuneration package is comprised of a 55% fixed component and a 45% variable component. The Committeereviews the remuneration package annually.
Benefits Superannuation, vehicle benefits, car-parking, Employees Share Plan, club membership, Company product, expatriate benefitsincluding medical, subsidised housing and utilities, home leave, school fees, host country allowance and environmentalallowance.
Short Term Incentive Plan Ranges from on-target being 50% of base salary, up to a maximum award of 97.5% of base salary.
Long Term Incentive Mr Seward has the following allocations of shares –Share Plan
Component Maximum Vested amount Unvested (maximum)
2004-2006 LTISP A and B 36,000 – 36,0002005-2007 LTISP A and B 36,000 – 36,000
For the 2005-2007 LTISP, the maximum TSR award is 20,400 shares and the maximum NOPAT award is 20,400 shares; however,the combined maximum of both awards is 36,000 shares.
Service agreement None.
Termination If the Company terminates Mr Seward’s employment during his Indonesian assignment (for circumstances other than thoserelated to fraud, dishonesty, serious misconduct or unacceptable performance) and no suitable alternative position is available,he is entitled to a minimum of nine months of fixed remuneration in lieu of both notice and severance (calculated at CCA’scurrent policy of one month notice and one month for every year of completed service with the Coca-Cola System).
Resignation A minimum two months notice.
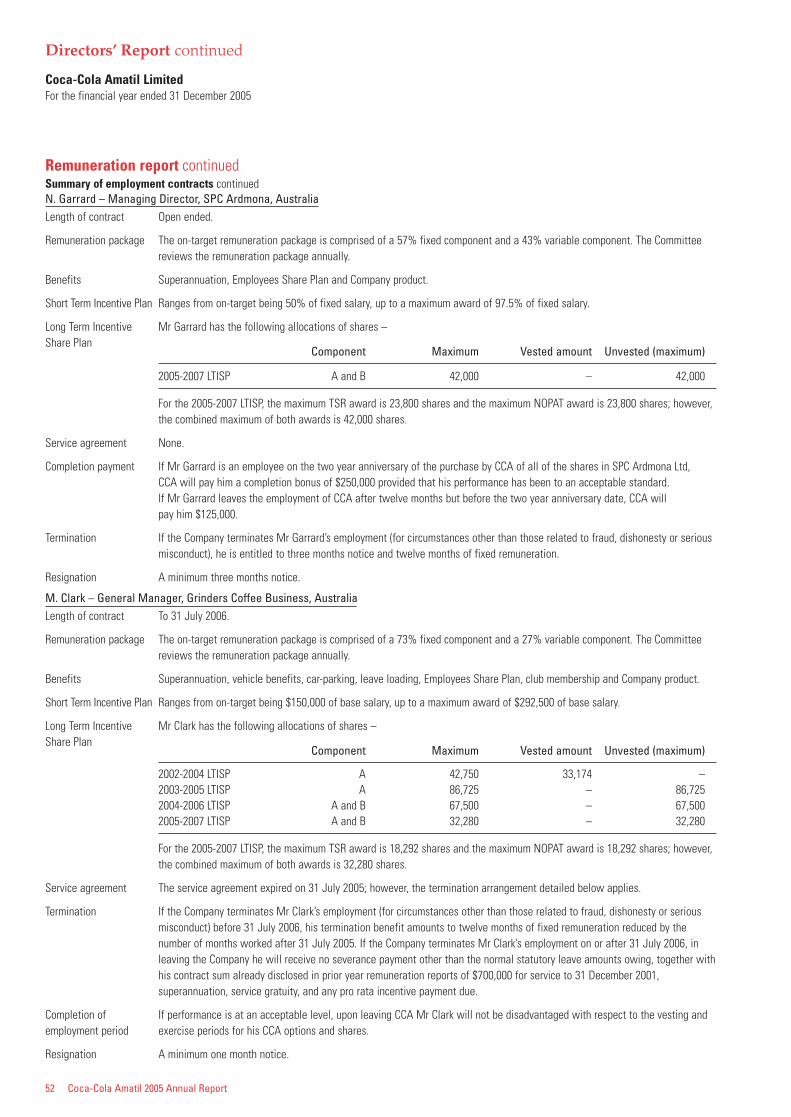
52 Coca-Cola Amatil 2005 Annual Report
Directors’ Report continued
Coca-Cola Amatil LimitedFor the financial year ended 31 December 2005
Remuneration report continuedSummary of employment contracts continuedN. Garrard – Managing Director, SPC Ardmona, AustraliaLength of contract Open ended.
Remuneration package The on-target remuneration package is comprised of a 57% fixed component and a 43% variable component. The Committeereviews the remuneration package annually.
Benefits Superannuation, Employees Share Plan and Company product.
Short Term Incentive Plan Ranges from on-target being 50% of fixed salary, up to a maximum award of 97.5% of fixed salary.
Long Term Incentive Mr Garrard has the following allocations of shares –Share Plan
Component Maximum Vested amount Unvested (maximum)
2005-2007 LTISP A and B 42,000 – 42,000
For the 2005-2007 LTISP, the maximum TSR award is 23,800 shares and the maximum NOPAT award is 23,800 shares; however,the combined maximum of both awards is 42,000 shares.
Service agreement None.
Completion payment If Mr Garrard is an employee on the two year anniversary of the purchase by CCA of all of the shares in SPC Ardmona Ltd, CCA will pay him a completion bonus of $250,000 provided that his performance has been to an acceptable standard. If Mr Garrard leaves the employment of CCA after twelve months but before the two year anniversary date, CCA will pay him $125,000.
Termination If the Company terminates Mr Garrard’s employment (for circumstances other than those related to fraud, dishonesty or seriousmisconduct), he is entitled to three months notice and twelve months of fixed remuneration.
Resignation A minimum three months notice.
M. Clark – General Manager, Grinders Coffee Business, AustraliaLength of contract To 31 July 2006.
Remuneration package The on-target remuneration package is comprised of a 73% fixed component and a 27% variable component. The Committeereviews the remuneration package annually.
Benefits Superannuation, vehicle benefits, car-parking, leave loading, Employees Share Plan, club membership and Company product.
Short Term Incentive Plan Ranges from on-target being $150,000 of base salary, up to a maximum award of $292,500 of base salary.
Long Term Incentive Mr Clark has the following allocations of shares –Share Plan
Component Maximum Vested amount Unvested (maximum)
2002-2004 LTISP A 42,750 33,174 –2003-2005 LTISP A 86,725 – 86,7252004-2006 LTISP A and B 67,500 – 67,5002005-2007 LTISP A and B 32,280 – 32,280
For the 2005-2007 LTISP, the maximum TSR award is 18,292 shares and the maximum NOPAT award is 18,292 shares; however,the combined maximum of both awards is 32,280 shares.
Service agreement The service agreement expired on 31 July 2005; however, the termination arrangement detailed below applies.
Termination If the Company terminates Mr Clark’s employment (for circumstances other than those related to fraud, dishonesty or seriousmisconduct) before 31 July 2006, his termination benefit amounts to twelve months of fixed remuneration reduced by thenumber of months worked after 31 July 2005. If the Company terminates Mr Clark’s employment on or after 31 July 2006, inleaving the Company he will receive no severance payment other than the normal statutory leave amounts owing, together withhis contract sum already disclosed in prior year remuneration reports of $700,000 for service to 31 December 2001,superannuation, service gratuity, and any pro rata incentive payment due.
Completion of If performance is at an acceptable level, upon leaving CCA Mr Clark will not be disadvantaged with respect to the vesting andemployment period exercise periods for his CCA options and shares.
Resignation A minimum one month notice.
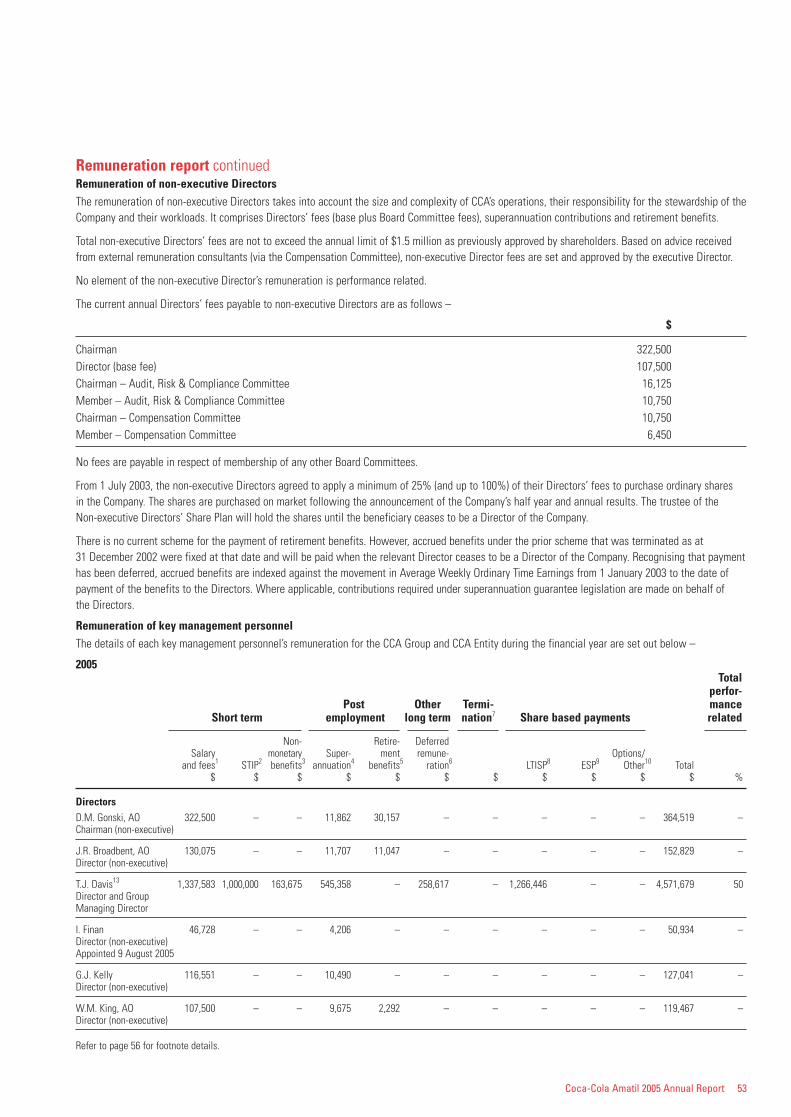
Coca-Cola Amatil 2005 Annual Report 53
Remuneration report continuedRemuneration of non-executive DirectorsThe remuneration of non-executive Directors takes into account the size and complexity of CCA’s operations, their responsibility for the stewardship of theCompany and their workloads. It comprises Directors’ fees (base plus Board Committee fees), superannuation contributions and retirement benefits.
Total non-executive Directors’ fees are not to exceed the annual limit of $1.5 million as previously approved by shareholders. Based on advice receivedfrom external remuneration consultants (via the Compensation Committee), non-executive Director fees are set and approved by the executive Director.
No element of the non-executive Director’s remuneration is performance related.
The current annual Directors’ fees payable to non-executive Directors are as follows –
$
Chairman 322,500Director (base fee) 107,500Chairman – Audit, Risk & Compliance Committee 16,125Member – Audit, Risk & Compliance Committee 10,750Chairman – Compensation Committee 10,750Member – Compensation Committee 6,450
No fees are payable in respect of membership of any other Board Committees.
From 1 July 2003, the non-executive Directors agreed to apply a minimum of 25% (and up to 100%) of their Directors’ fees to purchase ordinary shares in the Company. The shares are purchased on market following the announcement of the Company’s half year and annual results. The trustee of the Non-executive Directors’ Share Plan will hold the shares until the beneficiary ceases to be a Director of the Company.
There is no current scheme for the payment of retirement benefits. However, accrued benefits under the prior scheme that was terminated as at 31 December 2002 were fixed at that date and will be paid when the relevant Director ceases to be a Director of the Company. Recognising that paymenthas been deferred, accrued benefits are indexed against the movement in Average Weekly Ordinary Time Earnings from 1 January 2003 to the date ofpayment of the benefits to the Directors. Where applicable, contributions required under superannuation guarantee legislation are made on behalf of the Directors.
Remuneration of key management personnelThe details of each key management personnel’s remuneration for the CCA Group and CCA Entity during the financial year are set out below –
2005Total
perfor-Post Other Termi- mance
Short term employment long term nation7 Share based payments related
Non- Retire- DeferredSalary monetary Super- ment remune- Options/
and fees1 STIP2 benefits3 annuation4 benefits5 ration6 LTISP8 ESP9 Other10 Total$ $ $ $ $ $ $ $ $ $ $ %
DirectorsD.M. Gonski, AO 322,500 – – 11,862 30,157 – – – – – 364,519 –Chairman (non-executive)
J.R. Broadbent, AO 130,075 – – 11,707 11,047 – – – – – 152,829 –Director (non-executive)
T.J. Davis13 1,337,583 1,000,000 163,675 545,358 – 258,617 – 1,266,446 – – 4,571,679 50Director and Group Managing Director
I. Finan 46,728 – – 4,206 – – – – – – 50,934 –Director (non-executive)Appointed 9 August 2005
G.J. Kelly 116,551 – – 10,490 – – – – – – 127,041 –Director (non-executive)
W.M. King, AO 107,500 – – 9,675 2,292 – – – – – 119,467 –Director (non-executive)
Refer to page 56 for footnote details.
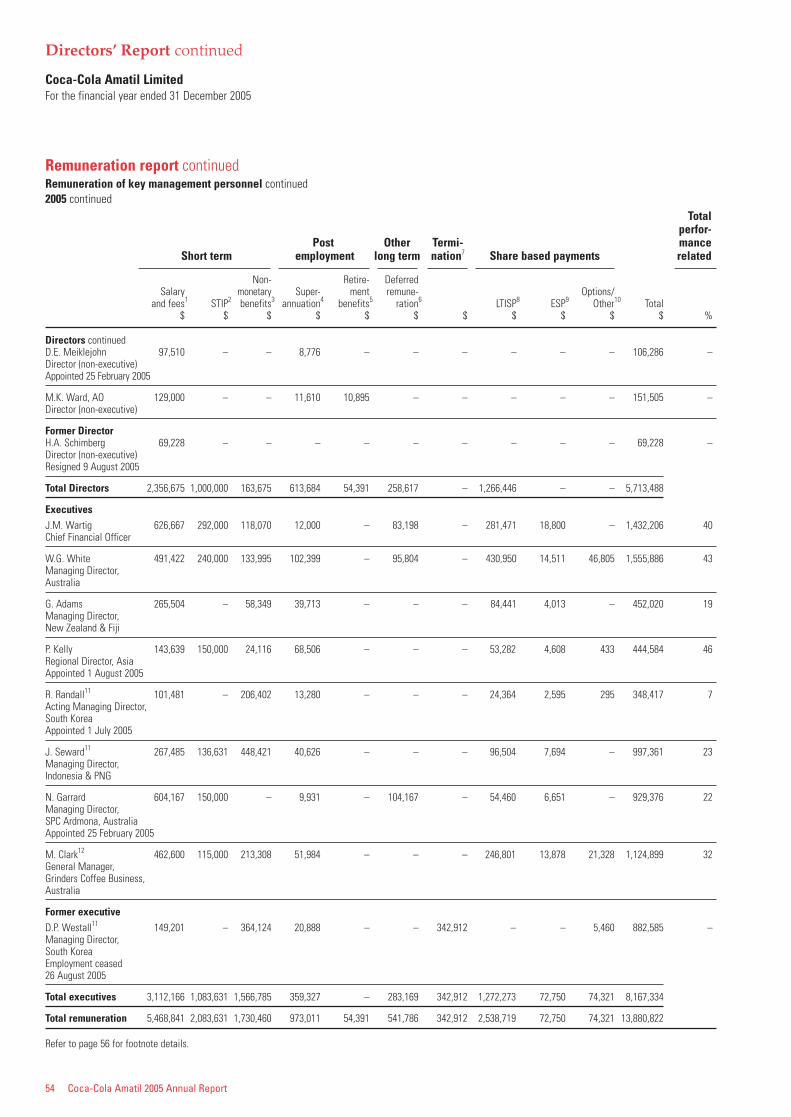
54 Coca-Cola Amatil 2005 Annual Report
Directors’ Report continued
Coca-Cola Amatil LimitedFor the financial year ended 31 December 2005
Remuneration report continuedRemuneration of key management personnel continued2005 continued
Totalperfor-
Post Other Termi- manceShort term employment long term nation7 Share based payments related
Non- Retire- DeferredSalary monetary Super- ment remune- Options/
and fees1 STIP2 benefits3 annuation4 benefits5 ration6 LTISP8 ESP9 Other10 Total$ $ $ $ $ $ $ $ $ $ $ %
Directors continuedD.E. Meiklejohn 97,510 – – 8,776 – – – – – – 106,286 –Director (non-executive)Appointed 25 February 2005
M.K. Ward, AO 129,000 – – 11,610 10,895 – – – – – 151,505 –Director (non-executive)
Former DirectorH.A. Schimberg 69,228 – – – – – – – – – 69,228 –Director (non-executive)Resigned 9 August 2005
Total Directors 2,356,675 1,000,000 163,675 613,684 54,391 258,617 – 1,266,446 – – 5,713,488
ExecutivesJ.M. Wartig 626,667 292,000 118,070 12,000 – 83,198 – 281,471 18,800 – 1,432,206 40Chief Financial Officer
W.G. White 491,422 240,000 133,995 102,399 – 95,804 – 430,950 14,511 46,805 1,555,886 43Managing Director, Australia
G. Adams 265,504 – 58,349 39,713 – – – 84,441 4,013 – 452,020 19Managing Director,New Zealand & Fiji
P. Kelly 143,639 150,000 24,116 68,506 – – – 53,282 4,608 433 444,584 46Regional Director, AsiaAppointed 1 August 2005
R. Randall11 101,481 – 206,402 13,280 – – – 24,364 2,595 295 348,417 7Acting Managing Director,South KoreaAppointed 1 July 2005
J. Seward11 267,485 136,631 448,421 40,626 – – – 96,504 7,694 – 997,361 23Managing Director,Indonesia & PNG
N. Garrard 604,167 150,000 – 9,931 – 104,167 – 54,460 6,651 – 929,376 22Managing Director,SPC Ardmona, AustraliaAppointed 25 February 2005
M. Clark12 462,600 115,000 213,308 51,984 – – – 246,801 13,878 21,328 1,124,899 32General Manager, Grinders Coffee Business, Australia
Former executiveD.P. Westall11 149,201 – 364,124 20,888 – – 342,912 – – 5,460 882,585 –Managing Director, South KoreaEmployment ceased 26 August 2005
Total executives 3,112,166 1,083,631 1,566,785 359,327 – 283,169 342,912 1,272,273 72,750 74,321 8,167,334
Total remuneration 5,468,841 2,083,631 1,730,460 973,011 54,391 541,786 342,912 2,538,719 72,750 74,321 13,880,822
Refer to page 56 for footnote details.
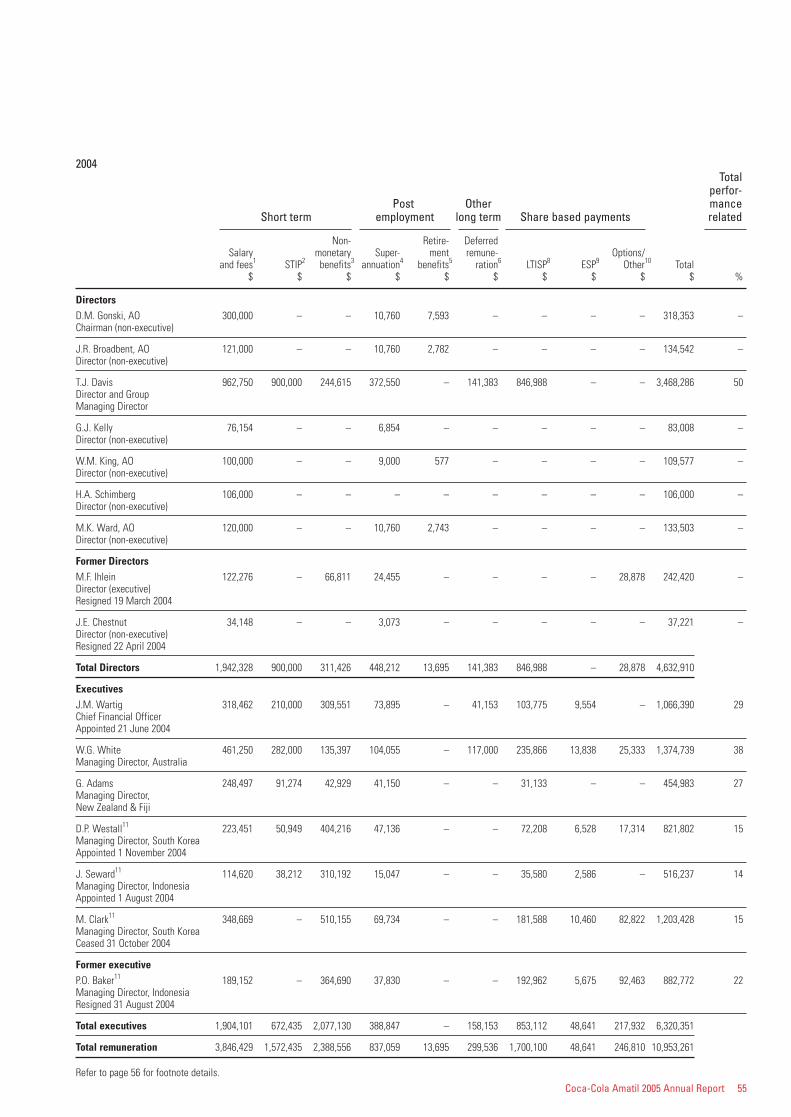
Coca-Cola Amatil 2005 Annual Report 55
2004Total
perfor-Post Other mance
Short term employment long term Share based payments related
Non- Retire- DeferredSalary monetary Super- ment remune- Options/
and fees1 STIP2 benefits3 annuation4 benefits5 ration6 LTISP8 ESP9 Other10 Total$ $ $ $ $ $ $ $ $ $ %
DirectorsD.M. Gonski, AO 300,000 – – 10,760 7,593 – – – – 318,353 –Chairman (non-executive)
J.R. Broadbent, AO 121,000 – – 10,760 2,782 – – – – 134,542 –Director (non-executive)
T.J. Davis 962,750 900,000 244,615 372,550 – 141,383 846,988 – – 3,468,286 50Director and Group Managing Director
G.J. Kelly 76,154 – – 6,854 – – – – – 83,008 –Director (non-executive)
W.M. King, AO 100,000 – – 9,000 577 – – – – 109,577 –Director (non-executive)
H.A. Schimberg 106,000 – – – – – – – – 106,000 –Director (non-executive)
M.K. Ward, AO 120,000 – – 10,760 2,743 – – – – 133,503 –Director (non-executive)
Former DirectorsM.F. Ihlein 122,276 – 66,811 24,455 – – – – 28,878 242,420 –Director (executive)Resigned 19 March 2004
J.E. Chestnut 34,148 – – 3,073 – – – – – 37,221 –Director (non-executive)Resigned 22 April 2004
Total Directors 1,942,328 900,000 311,426 448,212 13,695 141,383 846,988 – 28,878 4,632,910
ExecutivesJ.M. Wartig 318,462 210,000 309,551 73,895 – 41,153 103,775 9,554 – 1,066,390 29Chief Financial OfficerAppointed 21 June 2004
W.G. White 461,250 282,000 135,397 104,055 – 117,000 235,866 13,838 25,333 1,374,739 38Managing Director, Australia
G. Adams 248,497 91,274 42,929 41,150 – – 31,133 – – 454,983 27Managing Director, New Zealand & Fiji
D.P. Westall11 223,451 50,949 404,216 47,136 – – 72,208 6,528 17,314 821,802 15Managing Director, South KoreaAppointed 1 November 2004
J. Seward11 114,620 38,212 310,192 15,047 – – 35,580 2,586 – 516,237 14Managing Director, IndonesiaAppointed 1 August 2004
M. Clark11 348,669 – 510,155 69,734 – – 181,588 10,460 82,822 1,203,428 15Managing Director, South KoreaCeased 31 October 2004
Former executiveP.O. Baker11 189,152 – 364,690 37,830 – – 192,962 5,675 92,463 882,772 22Managing Director, IndonesiaResigned 31 August 2004
Total executives 1,904,101 672,435 2,077,130 388,847 – 158,153 853,112 48,641 217,932 6,320,351
Total remuneration 3,846,429 1,572,435 2,388,556 837,059 13,695 299,536 1,700,100 48,641 246,810 10,953,261
Refer to page 56 for footnote details.
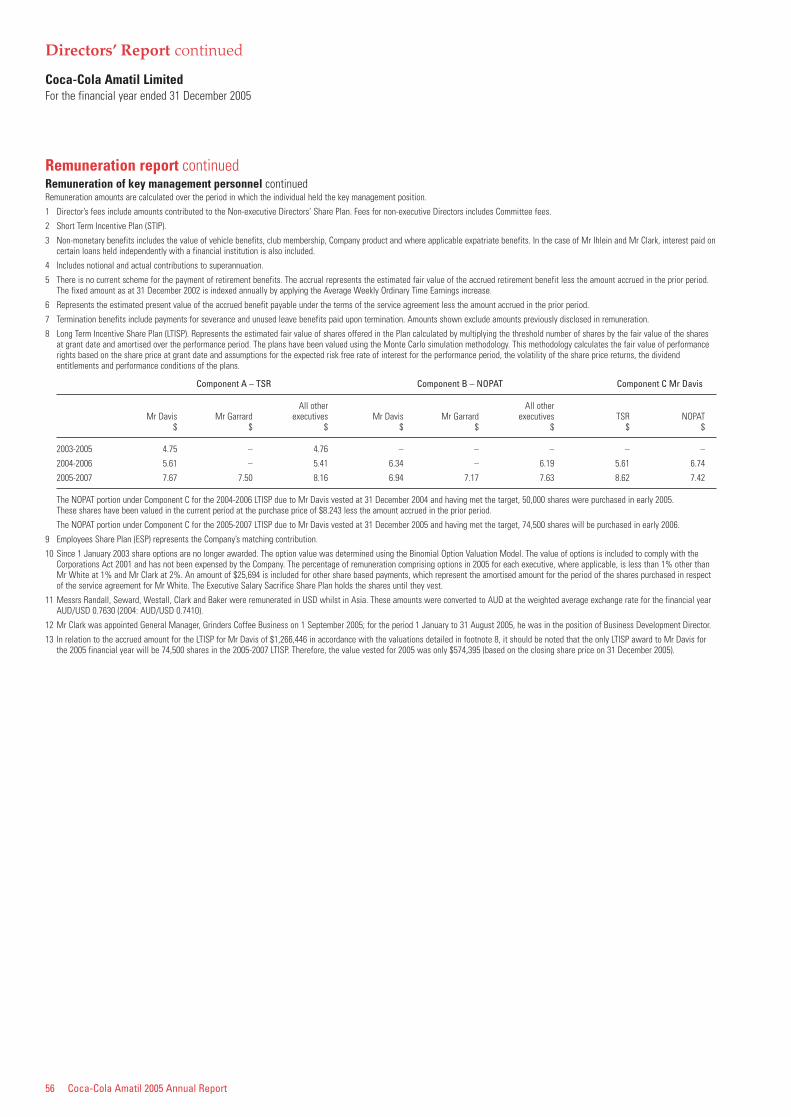
56 Coca-Cola Amatil 2005 Annual Report
Directors’ Report continued
Coca-Cola Amatil LimitedFor the financial year ended 31 December 2005
Remuneration report continuedRemuneration of key management personnel continuedRemuneration amounts are calculated over the period in which the individual held the key management position.
1 Director’s fees include amounts contributed to the Non-executive Directors’ Share Plan. Fees for non-executive Directors includes Committee fees.
2 Short Term Incentive Plan (STIP).
3 Non-monetary benefits includes the value of vehicle benefits, club membership, Company product and where applicable expatriate benefits. In the case of Mr Ihlein and Mr Clark, interest paid oncertain loans held independently with a financial institution is also included.
4 Includes notional and actual contributions to superannuation.
5 There is no current scheme for the payment of retirement benefits. The accrual represents the estimated fair value of the accrued retirement benefit less the amount accrued in the prior period.The fixed amount as at 31 December 2002 is indexed annually by applying the Average Weekly Ordinary Time Earnings increase.
6 Represents the estimated present value of the accrued benefit payable under the terms of the service agreement less the amount accrued in the prior period.
7 Termination benefits include payments for severance and unused leave benefits paid upon termination. Amounts shown exclude amounts previously disclosed in remuneration.
8 Long Term Incentive Share Plan (LTISP). Represents the estimated fair value of shares offered in the Plan calculated by multiplying the threshold number of shares by the fair value of the sharesat grant date and amortised over the performance period. The plans have been valued using the Monte Carlo simulation methodology. This methodology calculates the fair value of performancerights based on the share price at grant date and assumptions for the expected risk free rate of interest for the performance period, the volatility of the share price returns, the dividendentitlements and performance conditions of the plans.
Component A – TSR Component B – NOPAT Component C Mr Davis
All other All otherMr Davis Mr Garrard executives Mr Davis Mr Garrard executives TSR NOPAT
$ $ $ $ $ $ $ $
2003-2005 4.75 – 4.76 – – – – –
2004-2006 5.61 – 5.41 6.34 – 6.19 5.61 6.74
2005-2007 7.67 7.50 8.16 6.94 7.17 7.63 8.62 7.42
The NOPAT portion under Component C for the 2004-2006 LTISP due to Mr Davis vested at 31 December 2004 and having met the target, 50,000 shares were purchased in early 2005. These shares have been valued in the current period at the purchase price of $8.243 less the amount accrued in the prior period.
The NOPAT portion under Component C for the 2005-2007 LTISP due to Mr Davis vested at 31 December 2005 and having met the target, 74,500 shares will be purchased in early 2006.
9 Employees Share Plan (ESP) represents the Company’s matching contribution.
10 Since 1 January 2003 share options are no longer awarded. The option value was determined using the Binomial Option Valuation Model. The value of options is included to comply with theCorporations Act 2001 and has not been expensed by the Company. The percentage of remuneration comprising options in 2005 for each executive, where applicable, is less than 1% other thanMr White at 1% and Mr Clark at 2%. An amount of $25,694 is included for other share based payments, which represent the amortised amount for the period of the shares purchased in respectof the service agreement for Mr White. The Executive Salary Sacrifice Share Plan holds the shares until they vest.
11 Messrs Randall, Seward, Westall, Clark and Baker were remunerated in USD whilst in Asia. These amounts were converted to AUD at the weighted average exchange rate for the financial yearAUD/USD 0.7630 (2004: AUD/USD 0.7410).
12 Mr Clark was appointed General Manager, Grinders Coffee Business on 1 September 2005; for the period 1 January to 31 August 2005, he was in the position of Business Development Director.
13 In relation to the accrued amount for the LTISP for Mr Davis of $1,266,446 in accordance with the valuations detailed in footnote 8, it should be noted that the only LTISP award to Mr Davis forthe 2005 financial year will be 74,500 shares in the 2005-2007 LTISP. Therefore, the value vested for 2005 was only $574,395 (based on the closing share price on 31 December 2005).
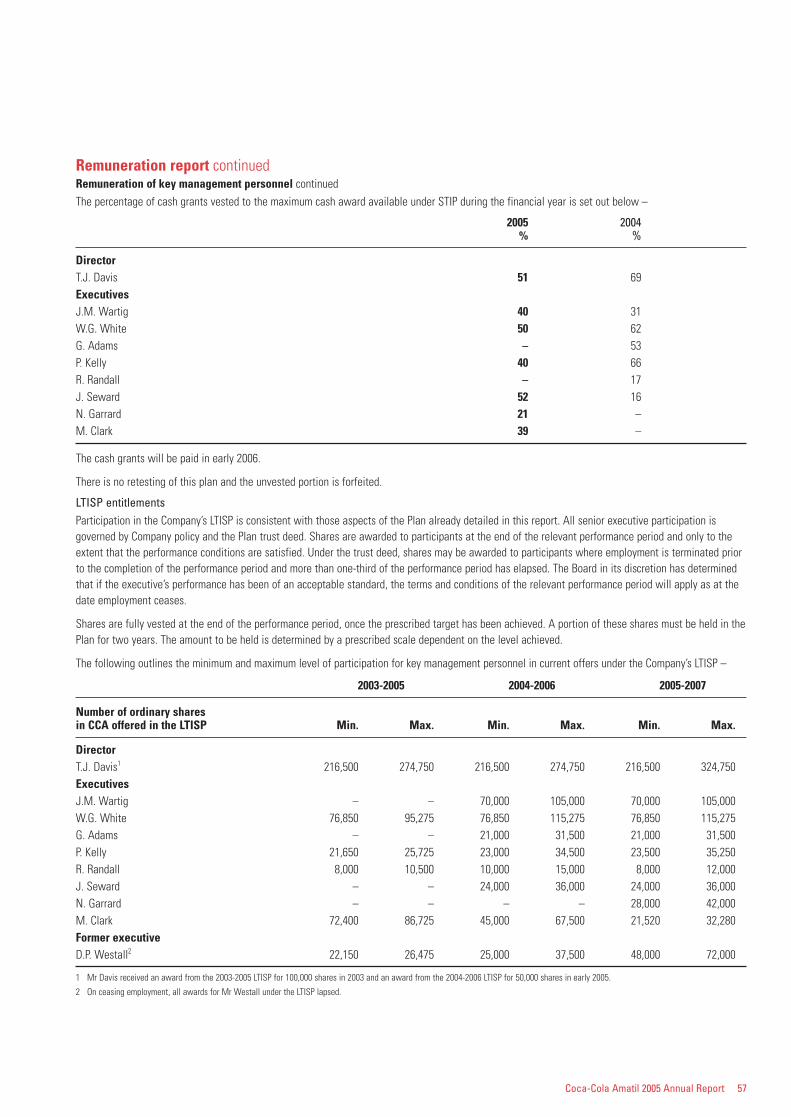
Coca-Cola Amatil 2005 Annual Report 57
Remuneration report continuedRemuneration of key management personnel continuedThe percentage of cash grants vested to the maximum cash award available under STIP during the financial year is set out below –
2005 2004% %
DirectorT.J. Davis 51 69ExecutivesJ.M. Wartig 40 31W.G. White 50 62G. Adams – 53P. Kelly 40 66R. Randall – 17J. Seward 52 16N. Garrard 21 –M. Clark 39 –
The cash grants will be paid in early 2006.
There is no retesting of this plan and the unvested portion is forfeited.
LTISP entitlementsParticipation in the Company’s LTISP is consistent with those aspects of the Plan already detailed in this report. All senior executive participation isgoverned by Company policy and the Plan trust deed. Shares are awarded to participants at the end of the relevant performance period and only to theextent that the performance conditions are satisfied. Under the trust deed, shares may be awarded to participants where employment is terminated priorto the completion of the performance period and more than one-third of the performance period has elapsed. The Board in its discretion has determinedthat if the executive’s performance has been of an acceptable standard, the terms and conditions of the relevant performance period will apply as at thedate employment ceases.
Shares are fully vested at the end of the performance period, once the prescribed target has been achieved. A portion of these shares must be held in thePlan for two years. The amount to be held is determined by a prescribed scale dependent on the level achieved.
The following outlines the minimum and maximum level of participation for key management personnel in current offers under the Company’s LTISP –
2003-2005 2004-2006 2005-2007
Number of ordinary shares in CCA offered in the LTISP Min. Max. Min. Max. Min. Max.
DirectorT.J. Davis1 216,500 274,750 216,500 274,750 216,500 324,750ExecutivesJ.M. Wartig – – 70,000 105,000 70,000 105,000W.G. White 76,850 95,275 76,850 115,275 76,850 115,275G. Adams – – 21,000 31,500 21,000 31,500P. Kelly 21,650 25,725 23,000 34,500 23,500 35,250R. Randall 8,000 10,500 10,000 15,000 8,000 12,000J. Seward – – 24,000 36,000 24,000 36,000N. Garrard – – – – 28,000 42,000M. Clark 72,400 86,725 45,000 67,500 21,520 32,280Former executiveD.P. Westall2 22,150 26,475 25,000 37,500 48,000 72,000
1 Mr Davis received an award from the 2003-2005 LTISP for 100,000 shares in 2003 and an award from the 2004-2006 LTISP for 50,000 shares in early 2005.
2 On ceasing employment, all awards for Mr Westall under the LTISP lapsed.
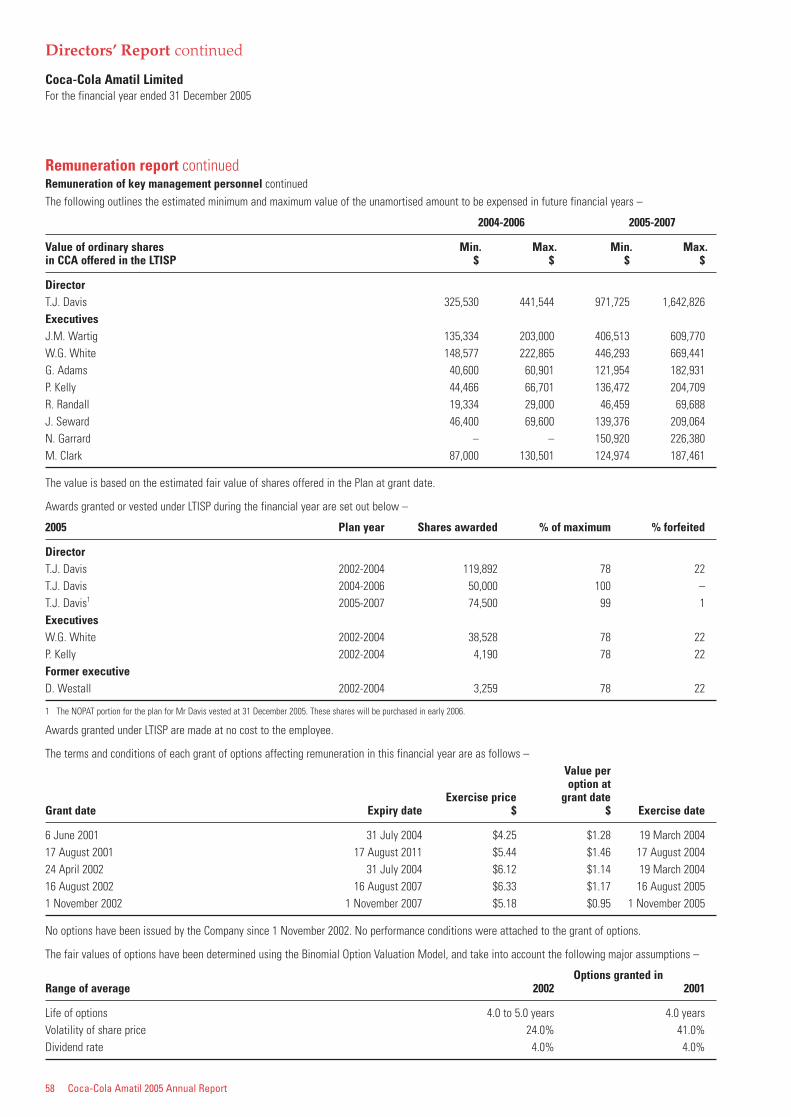
58 Coca-Cola Amatil 2005 Annual Report
Directors’ Report continued
Coca-Cola Amatil LimitedFor the financial year ended 31 December 2005
Remuneration report continuedRemuneration of key management personnel continuedThe following outlines the estimated minimum and maximum value of the unamortised amount to be expensed in future financial years –
2004-2006 2005-2007
Value of ordinary shares Min. Max. Min. Max.in CCA offered in the LTISP $ $ $ $
DirectorT.J. Davis 325,530 441,544 971,725 1,642,826ExecutivesJ.M. Wartig 135,334 203,000 406,513 609,770W.G. White 148,577 222,865 446,293 669,441G. Adams 40,600 60,901 121,954 182,931P. Kelly 44,466 66,701 136,472 204,709R. Randall 19,334 29,000 46,459 69,688J. Seward 46,400 69,600 139,376 209,064N. Garrard – – 150,920 226,380M. Clark 87,000 130,501 124,974 187,461
The value is based on the estimated fair value of shares offered in the Plan at grant date.
Awards granted or vested under LTISP during the financial year are set out below –
2005 Plan year Shares awarded % of maximum % forfeited
DirectorT.J. Davis 2002-2004 119,892 78 22T.J. Davis 2004-2006 50,000 100 –T.J. Davis1 2005-2007 74,500 99 1ExecutivesW.G. White 2002-2004 38,528 78 22P. Kelly 2002-2004 4,190 78 22Former executiveD. Westall 2002-2004 3,259 78 22
1 The NOPAT portion for the plan for Mr Davis vested at 31 December 2005. These shares will be purchased in early 2006.
Awards granted under LTISP are made at no cost to the employee.
The terms and conditions of each grant of options affecting remuneration in this financial year are as follows –Value peroption at
Exercise price grant dateGrant date Expiry date $ $ Exercise date
6 June 2001 31 July 2004 $4.25 $1.28 19 March 200417 August 2001 17 August 2011 $5.44 $1.46 17 August 200424 April 2002 31 July 2004 $6.12 $1.14 19 March 200416 August 2002 16 August 2007 $6.33 $1.17 16 August 20051 November 2002 1 November 2007 $5.18 $0.95 1 November 2005
No options have been issued by the Company since 1 November 2002. No performance conditions were attached to the grant of options.
The fair values of options have been determined using the Binomial Option Valuation Model, and take into account the following major assumptions –
Options granted inRange of average 2002 2001
Life of options 4.0 to 5.0 years 4.0 yearsVolatility of share price 24.0% 41.0%Dividend rate 4.0% 4.0%
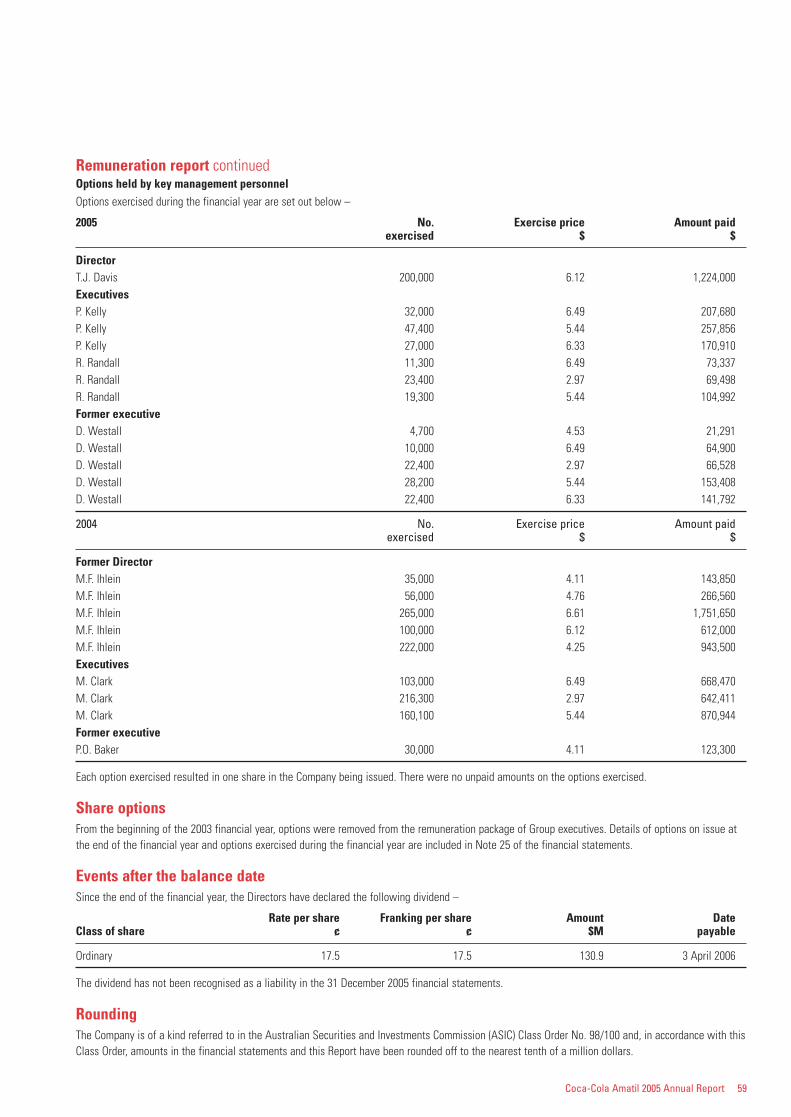
Coca-Cola Amatil 2005 Annual Report 59
Remuneration report continuedOptions held by key management personnelOptions exercised during the financial year are set out below –
2005 No. Exercise price Amount paidexercised $ $
DirectorT.J. Davis 200,000 6.12 1,224,000ExecutivesP. Kelly 32,000 6.49 207,680P. Kelly 47,400 5.44 257,856P. Kelly 27,000 6.33 170,910R. Randall 11,300 6.49 73,337R. Randall 23,400 2.97 69,498R. Randall 19,300 5.44 104,992Former executiveD. Westall 4,700 4.53 21,291D. Westall 10,000 6.49 64,900D. Westall 22,400 2.97 66,528D. Westall 28,200 5.44 153,408D. Westall 22,400 6.33 141,792
2004 No. Exercise price Amount paidexercised $ $
Former DirectorM.F. Ihlein 35,000 4.11 143,850M.F. Ihlein 56,000 4.76 266,560M.F. Ihlein 265,000 6.61 1,751,650M.F. Ihlein 100,000 6.12 612,000M.F. Ihlein 222,000 4.25 943,500ExecutivesM. Clark 103,000 6.49 668,470M. Clark 216,300 2.97 642,411M. Clark 160,100 5.44 870,944Former executiveP.O. Baker 30,000 4.11 123,300
Each option exercised resulted in one share in the Company being issued. There were no unpaid amounts on the options exercised.
Share optionsFrom the beginning of the 2003 financial year, options were removed from the remuneration package of Group executives. Details of options on issue atthe end of the financial year and options exercised during the financial year are included in Note 25 of the financial statements.
Events after the balance dateSince the end of the financial year, the Directors have declared the following dividend –
Rate per share Franking per share Amount DateClass of share ¢ ¢ $M payable
Ordinary 17.5 17.5 130.9 3 April 2006
The dividend has not been recognised as a liability in the 31 December 2005 financial statements.
RoundingThe Company is of a kind referred to in the Australian Securities and Investments Commission (ASIC) Class Order No. 98/100 and, in accordance with thisClass Order, amounts in the financial statements and this Report have been rounded off to the nearest tenth of a million dollars.
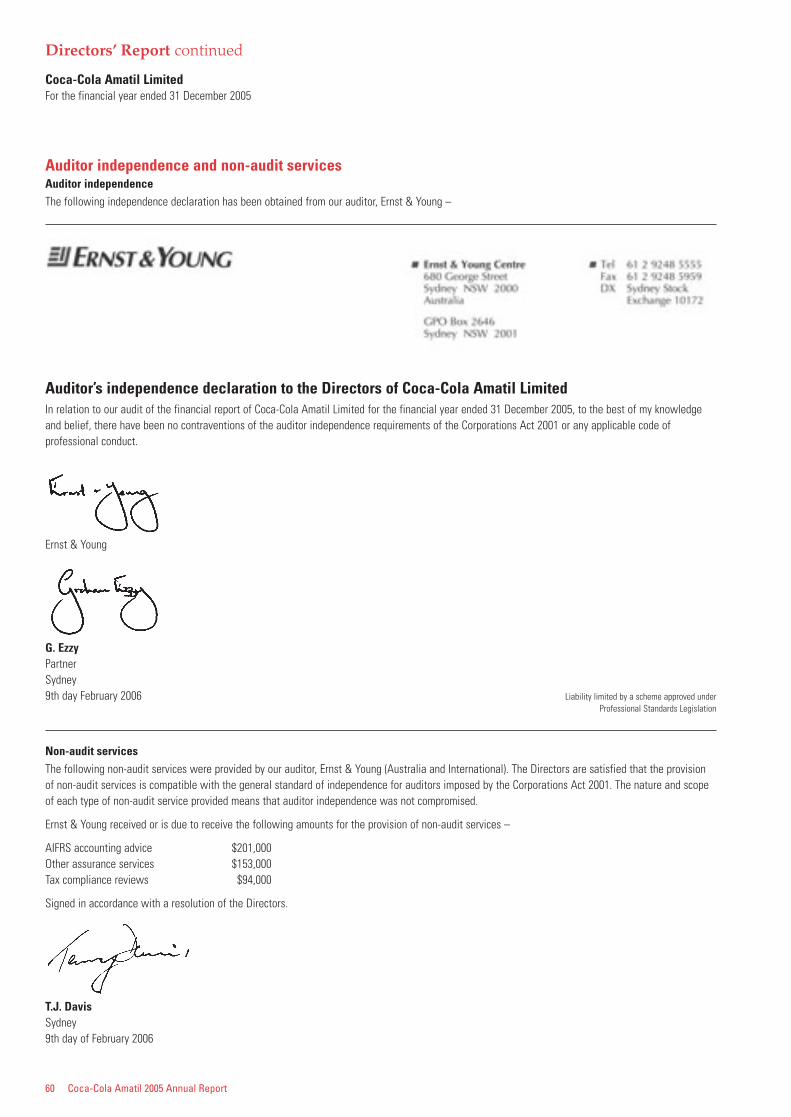
Auditor independence and non-audit servicesAuditor independenceThe following independence declaration has been obtained from our auditor, Ernst & Young –
Auditor’s independence declaration to the Directors of Coca-Cola Amatil LimitedIn relation to our audit of the financial report of Coca-Cola Amatil Limited for the financial year ended 31 December 2005, to the best of my knowledgeand belief, there have been no contraventions of the auditor independence requirements of the Corporations Act 2001 or any applicable code ofprofessional conduct.
Ernst & Young
G. EzzyPartnerSydney9th day February 2006 Liability limited by a scheme approved under
Professional Standards Legislation
Non-audit servicesThe following non-audit services were provided by our auditor, Ernst & Young (Australia and International). The Directors are satisfied that the provisionof non-audit services is compatible with the general standard of independence for auditors imposed by the Corporations Act 2001. The nature and scopeof each type of non-audit service provided means that auditor independence was not compromised.
Ernst & Young received or is due to receive the following amounts for the provision of non-audit services –
AIFRS accounting advice $201,000Other assurance services $153,000Tax compliance reviews $94,000
Signed in accordance with a resolution of the Directors.
T.J. DavisSydney9th day of February 2006
60 Coca-Cola Amatil 2005 Annual Report
Directors’ Report continued
Coca-Cola Amatil LimitedFor the financial year ended 31 December 2005
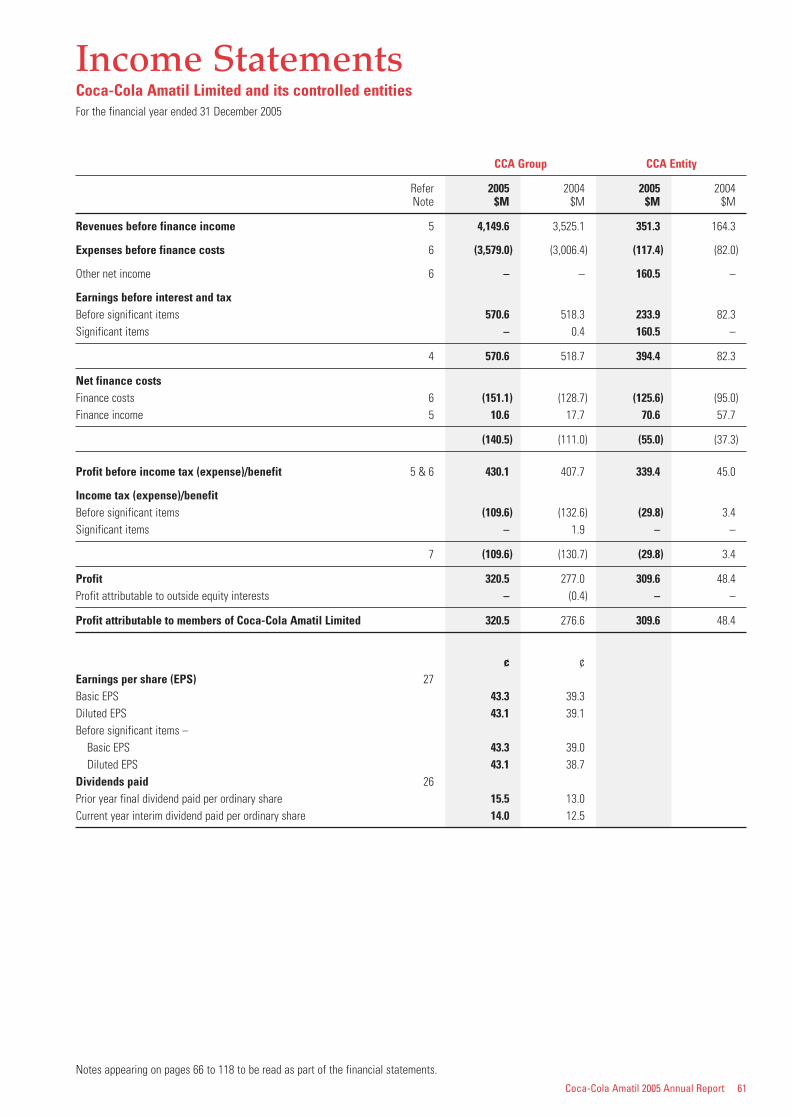
Coca-Cola Amatil 2005 Annual Report 61
Income Statements Coca-Cola Amatil Limited and its controlled entitiesFor the financial year ended 31 December 2005
CCA Group CCA Entity
Refer 2005 2004 2005 2004Note $M $M $M $M
Revenues before finance income 5 4,149.6 3,525.1 351.3 164.3
Expenses before finance costs 6 (3,579.0) (3,006.4) (117.4) (82.0)
Other net income 6 – – 160.5 –
Earnings before interest and taxBefore significant items 570.6 518.3 233.9 82.3Significant items – 0.4 160.5 –
4 570.6 518.7 394.4 82.3
Net finance costsFinance costs 6 (151.1) (128.7) (125.6) (95.0)Finance income 5 10.6 17.7 70.6 57.7
(140.5) (111.0) (55.0) (37.3)
Profit before income tax (expense)/benefit 5 & 6 430.1 407.7 339.4 45.0
Income tax (expense)/benefitBefore significant items (109.6) (132.6) (29.8) 3.4Significant items – 1.9 – –
7 (109.6) (130.7) (29.8) 3.4
Profit 320.5 277.0 309.6 48.4Profit attributable to outside equity interests – (0.4) – –
Profit attributable to members of Coca-Cola Amatil Limited 320.5 276.6 309.6 48.4
¢ ¢Earnings per share (EPS) 27Basic EPS 43.3 39.3Diluted EPS 43.1 39.1Before significant items –
Basic EPS 43.3 39.0Diluted EPS 43.1 38.7
Dividends paid 26Prior year final dividend paid per ordinary share 15.5 13.0Current year interim dividend paid per ordinary share 14.0 12.5
Notes appearing on pages 66 to 118 to be read as part of the financial statements.
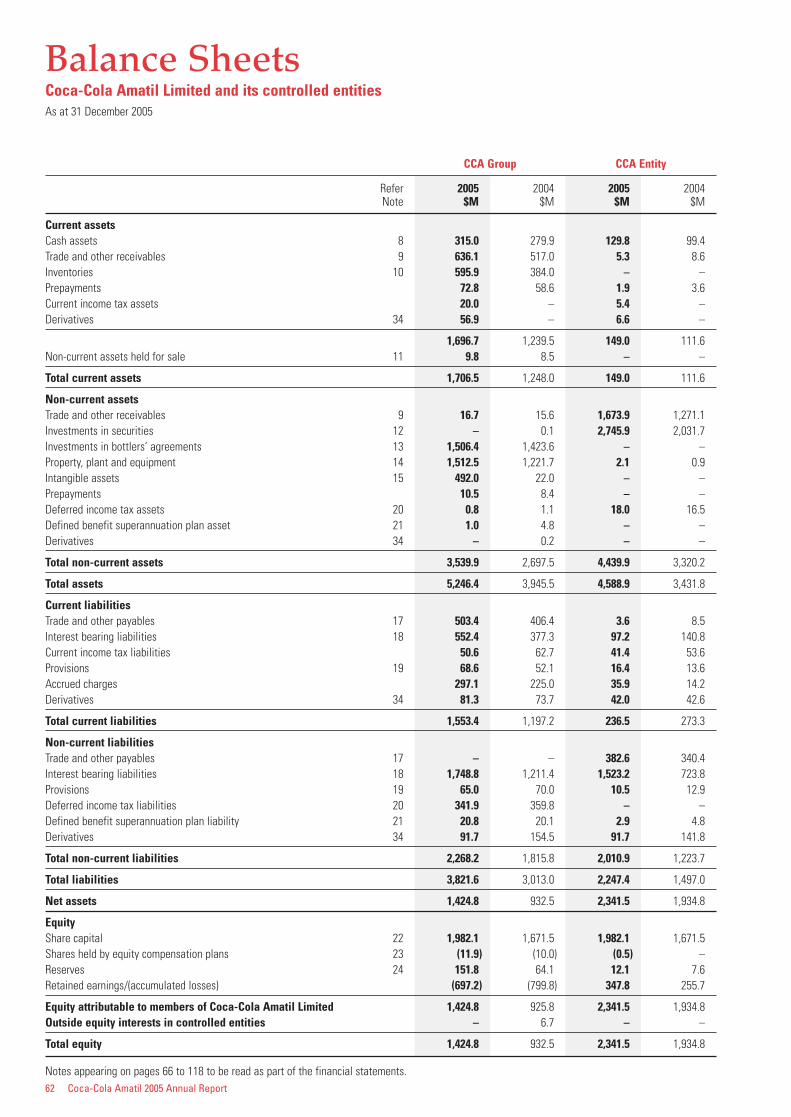
62 Coca-Cola Amatil 2005 Annual Report
Balance SheetsCoca-Cola Amatil Limited and its controlled entitiesAs at 31 December 2005
CCA Group CCA Entity
Refer 2005 2004 2005 2004Note $M $M $M $M
Current assetsCash assets 8 315.0 279.9 129.8 99.4Trade and other receivables 9 636.1 517.0 5.3 8.6Inventories 10 595.9 384.0 – –Prepayments 72.8 58.6 1.9 3.6Current income tax assets 20.0 – 5.4 –Derivatives 34 56.9 – 6.6 –
1,696.7 1,239.5 149.0 111.6Non-current assets held for sale 11 9.8 8.5 – –
Total current assets 1,706.5 1,248.0 149.0 111.6
Non-current assetsTrade and other receivables 9 16.7 15.6 1,673.9 1,271.1Investments in securities 12 – 0.1 2,745.9 2,031.7Investments in bottlers’ agreements 13 1,506.4 1,423.6 – –Property, plant and equipment 14 1,512.5 1,221.7 2.1 0.9Intangible assets 15 492.0 22.0 – –Prepayments 10.5 8.4 – –Deferred income tax assets 20 0.8 1.1 18.0 16.5Defined benefit superannuation plan asset 21 1.0 4.8 – –Derivatives 34 – 0.2 – –
Total non-current assets 3,539.9 2,697.5 4,439.9 3,320.2
Total assets 5,246.4 3,945.5 4,588.9 3,431.8
Current liabilitiesTrade and other payables 17 503.4 406.4 3.6 8.5Interest bearing liabilities 18 552.4 377.3 97.2 140.8Current income tax liabilities 50.6 62.7 41.4 53.6Provisions 19 68.6 52.1 16.4 13.6Accrued charges 297.1 225.0 35.9 14.2Derivatives 34 81.3 73.7 42.0 42.6
Total current liabilities 1,553.4 1,197.2 236.5 273.3
Non-current liabilitiesTrade and other payables 17 – – 382.6 340.4Interest bearing liabilities 18 1,748.8 1,211.4 1,523.2 723.8Provisions 19 65.0 70.0 10.5 12.9Deferred income tax liabilities 20 341.9 359.8 – –Defined benefit superannuation plan liability 21 20.8 20.1 2.9 4.8Derivatives 34 91.7 154.5 91.7 141.8
Total non-current liabilities 2,268.2 1,815.8 2,010.9 1,223.7
Total liabilities 3,821.6 3,013.0 2,247.4 1,497.0
Net assets 1,424.8 932.5 2,341.5 1,934.8
EquityShare capital 22 1,982.1 1,671.5 1,982.1 1,671.5Shares held by equity compensation plans 23 (11.9) (10.0) (0.5) –Reserves 24 151.8 64.1 12.1 7.6Retained earnings/(accumulated losses) (697.2) (799.8) 347.8 255.7
Equity attributable to members of Coca-Cola Amatil Limited 1,424.8 925.8 2,341.5 1,934.8Outside equity interests in controlled entities – 6.7 – –
Total equity 1,424.8 932.5 2,341.5 1,934.8
Notes appearing on pages 66 to 118 to be read as part of the financial statements.
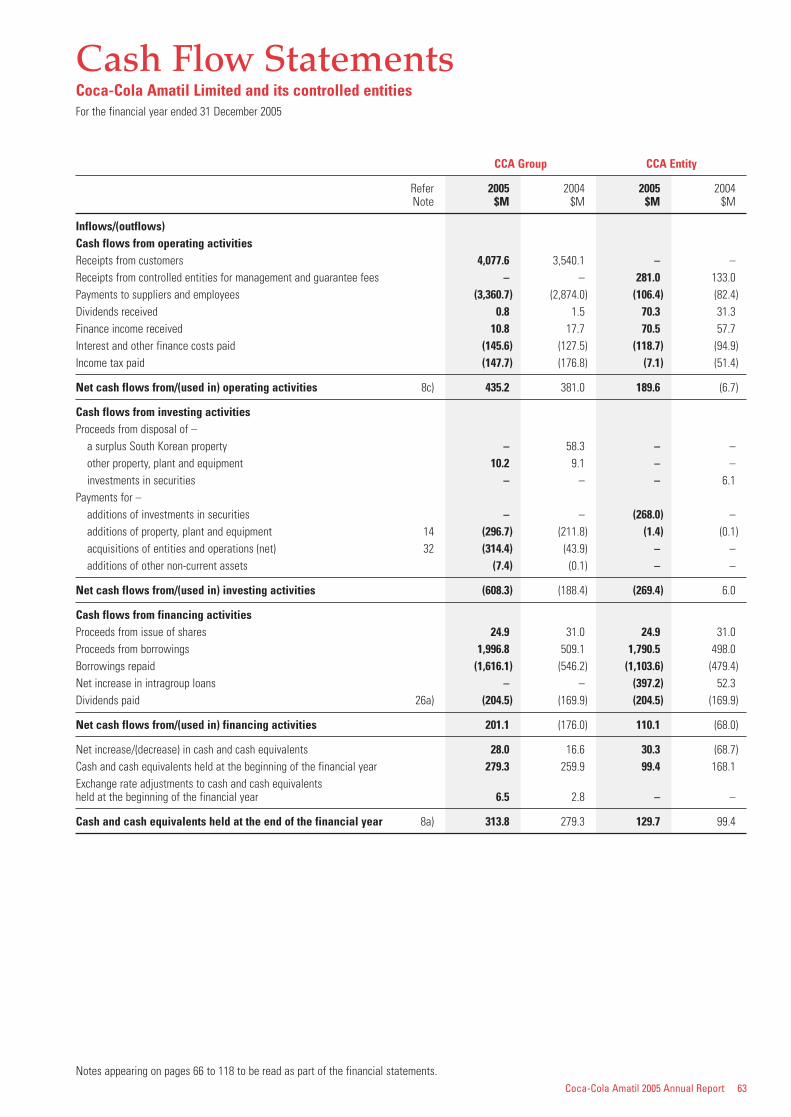
Coca-Cola Amatil 2005 Annual Report 63
Cash Flow StatementsCoca-Cola Amatil Limited and its controlled entitiesFor the financial year ended 31 December 2005
CCA Group CCA Entity
Refer 2005 2004 2005 2004Note $M $M $M $M
Inflows/(outflows)Cash flows from operating activitiesReceipts from customers 4,077.6 3,540.1 – –Receipts from controlled entities for management and guarantee fees – – 281.0 133.0Payments to suppliers and employees (3,360.7) (2,874.0) (106.4) (82.4)Dividends received 0.8 1.5 70.3 31.3Finance income received 10.8 17.7 70.5 57.7Interest and other finance costs paid (145.6) (127.5) (118.7) (94.9)Income tax paid (147.7) (176.8) (7.1) (51.4)
Net cash flows from/(used in) operating activities 8c) 435.2 381.0 189.6 (6.7)
Cash flows from investing activitiesProceeds from disposal of –
a surplus South Korean property – 58.3 – –other property, plant and equipment 10.2 9.1 – –investments in securities – – – 6.1
Payments for –additions of investments in securities – – (268.0) –additions of property, plant and equipment 14 (296.7) (211.8) (1.4) (0.1)acquisitions of entities and operations (net) 32 (314.4) (43.9) – –additions of other non-current assets (7.4) (0.1) – –
Net cash flows from/(used in) investing activities (608.3) (188.4) (269.4) 6.0
Cash flows from financing activitiesProceeds from issue of shares 24.9 31.0 24.9 31.0Proceeds from borrowings 1,996.8 509.1 1,790.5 498.0Borrowings repaid (1,616.1) (546.2) (1,103.6) (479.4)Net increase in intragroup loans – – (397.2) 52.3Dividends paid 26a) (204.5) (169.9) (204.5) (169.9)
Net cash flows from/(used in) financing activities 201.1 (176.0) 110.1 (68.0)
Net increase/(decrease) in cash and cash equivalents 28.0 16.6 30.3 (68.7)Cash and cash equivalents held at the beginning of the financial year 279.3 259.9 99.4 168.1Exchange rate adjustments to cash and cash equivalents held at the beginning of the financial year 6.5 2.8 – –
Cash and cash equivalents held at the end of the financial year 8a) 313.8 279.3 129.7 99.4
Notes appearing on pages 66 to 118 to be read as part of the financial statements.
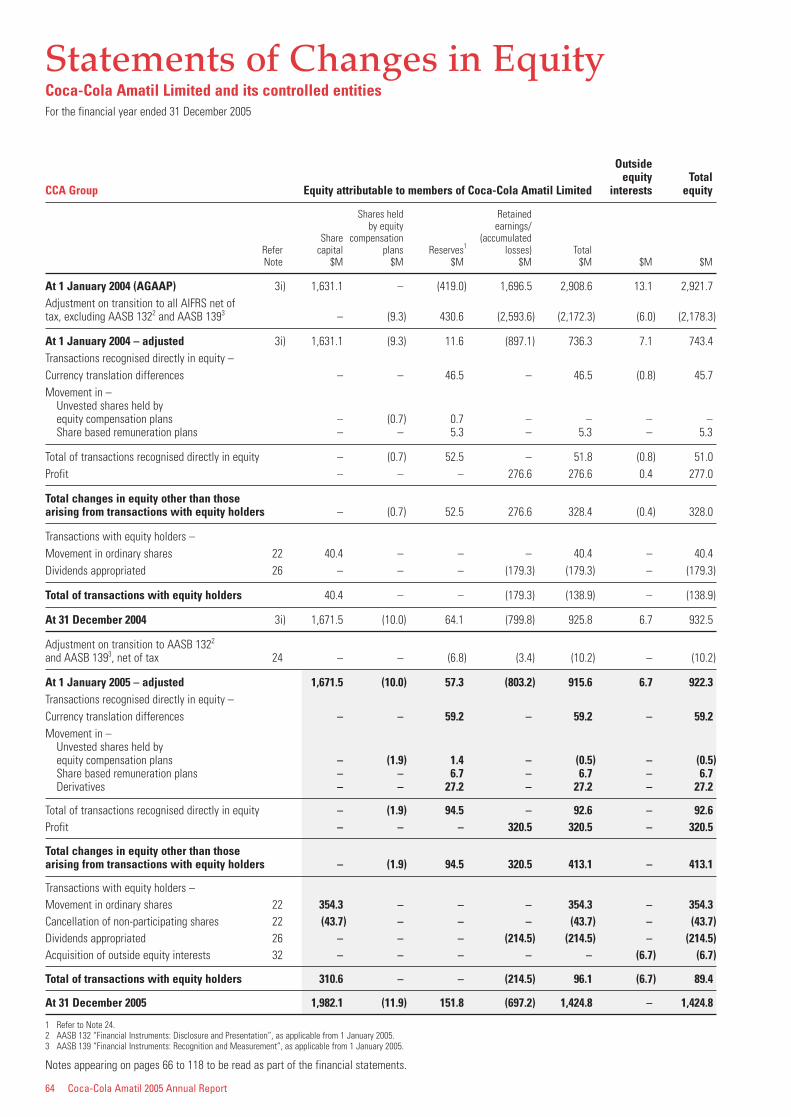
64 Coca-Cola Amatil 2005 Annual Report
Statements of Changes in EquityCoca-Cola Amatil Limited and its controlled entitiesFor the financial year ended 31 December 2005
Outsideequity Total
CCA Group Equity attributable to members of Coca-Cola Amatil Limited interests equity
Shares held Retainedby equity earnings/
Share compensation (accumulatedRefer capital plans Reserves1 losses) TotalNote $M $M $M $M $M $M $M
At 1 January 2004 (AGAAP) 3i) 1,631.1 – (419.0) 1,696.5 2,908.6 13.1 2,921.7Adjustment on transition to all AIFRS net of tax, excluding AASB 1322 and AASB 1393 – (9.3) 430.6 (2,593.6) (2,172.3) (6.0) (2,178.3)
At 1 January 2004 – adjusted 3i) 1,631.1 (9.3) 11.6 (897.1) 736.3 7.1 743.4Transactions recognised directly in equity –Currency translation differences – – 46.5 – 46.5 (0.8) 45.7Movement in –
Unvested shares held by equity compensation plans – (0.7) 0.7 – – – –Share based remuneration plans – – 5.3 – 5.3 – 5.3
Total of transactions recognised directly in equity – (0.7) 52.5 – 51.8 (0.8) 51.0Profit – – – 276.6 276.6 0.4 277.0
Total changes in equity other than those arising from transactions with equity holders – (0.7) 52.5 276.6 328.4 (0.4) 328.0
Transactions with equity holders –Movement in ordinary shares 22 40.4 – – – 40.4 – 40.4Dividends appropriated 26 – – – (179.3) (179.3) – (179.3)
Total of transactions with equity holders 40.4 – – (179.3) (138.9) – (138.9)
At 31 December 2004 3i) 1,671.5 (10.0) 64.1 (799.8) 925.8 6.7 932.5
Adjustment on transition to AASB 1322
and AASB 1393, net of tax 24 – – (6.8) (3.4) (10.2) – (10.2)
At 1 January 2005 – adjusted 1,671.5 (10.0) 57.3 (803.2) 915.6 6.7 922.3Transactions recognised directly in equity –Currency translation differences – – 59.2 – 59.2 – 59.2Movement in –
Unvested shares held by equity compensation plans – (1.9) 1.4 – (0.5) – (0.5)Share based remuneration plans – – 6.7 – 6.7 – 6.7Derivatives – – 27.2 – 27.2 – 27.2
Total of transactions recognised directly in equity – (1.9) 94.5 – 92.6 – 92.6Profit – – – 320.5 320.5 – 320.5
Total changes in equity other than those arising from transactions with equity holders – (1.9) 94.5 320.5 413.1 – 413.1
Transactions with equity holders –Movement in ordinary shares 22 354.3 – – – 354.3 – 354.3Cancellation of non-participating shares 22 (43.7) – – – (43.7) – (43.7)Dividends appropriated 26 – – – (214.5) (214.5) – (214.5)Acquisition of outside equity interests 32 – – – – – (6.7) (6.7)
Total of transactions with equity holders 310.6 – – (214.5) 96.1 (6.7) 89.4
At 31 December 2005 1,982.1 (11.9) 151.8 (697.2) 1,424.8 – 1,424.8
1 Refer to Note 24.2 AASB 132 “Financial Instruments: Disclosure and Presentation”, as applicable from 1 January 2005.3 AASB 139 “Financial Instruments: Recognition and Measurement”, as applicable from 1 January 2005.
Notes appearing on pages 66 to 118 to be read as part of the financial statements.
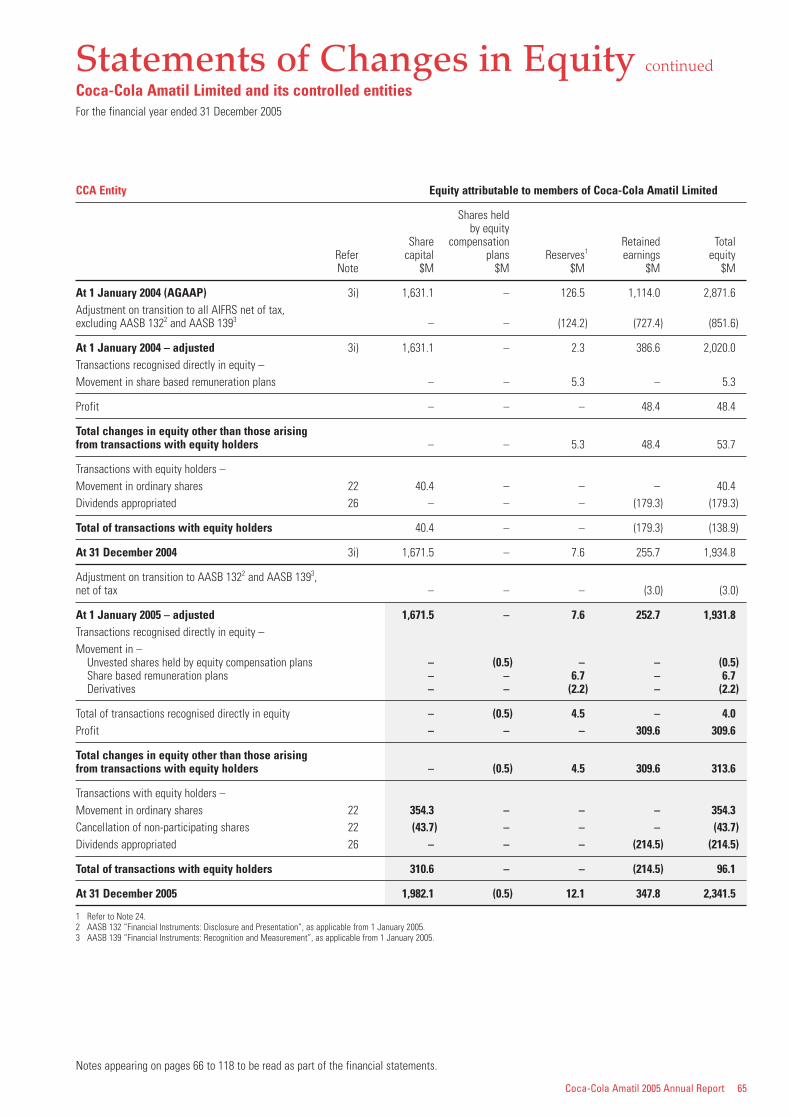
Coca-Cola Amatil 2005 Annual Report 65
Statements of Changes in Equity continued
Coca-Cola Amatil Limited and its controlled entitiesFor the financial year ended 31 December 2005
CCA Entity Equity attributable to members of Coca-Cola Amatil Limited
Shares heldby equity
Share compensation Retained TotalRefer capital plans Reserves1 earnings equityNote $M $M $M $M $M
At 1 January 2004 (AGAAP) 3i) 1,631.1 – 126.5 1,114.0 2,871.6Adjustment on transition to all AIFRS net of tax, excluding AASB 1322 and AASB 1393 – – (124.2) (727.4) (851.6)
At 1 January 2004 – adjusted 3i) 1,631.1 – 2.3 386.6 2,020.0Transactions recognised directly in equity – Movement in share based remuneration plans – – 5.3 – 5.3
Profit – – – 48.4 48.4
Total changes in equity other than those arising from transactions with equity holders – – 5.3 48.4 53.7
Transactions with equity holders –Movement in ordinary shares 22 40.4 – – – 40.4Dividends appropriated 26 – – – (179.3) (179.3)
Total of transactions with equity holders 40.4 – – (179.3) (138.9)
At 31 December 2004 3i) 1,671.5 – 7.6 255.7 1,934.8
Adjustment on transition to AASB 1322 and AASB 1393,net of tax – – – (3.0) (3.0)
At 1 January 2005 – adjusted 1,671.5 – 7.6 252.7 1,931.8Transactions recognised directly in equity –Movement in –
Unvested shares held by equity compensation plans – (0.5) – – (0.5)Share based remuneration plans – – 6.7 – 6.7Derivatives – – (2.2) – (2.2)
Total of transactions recognised directly in equity – (0.5) 4.5 – 4.0Profit – – – 309.6 309.6
Total changes in equity other than those arising from transactions with equity holders – (0.5) 4.5 309.6 313.6
Transactions with equity holders –Movement in ordinary shares 22 354.3 – – – 354.3Cancellation of non-participating shares 22 (43.7) – – – (43.7)Dividends appropriated 26 – – – (214.5) (214.5)
Total of transactions with equity holders 310.6 – – (214.5) 96.1
At 31 December 2005 1,982.1 (0.5) 12.1 347.8 2,341.5
1 Refer to Note 24.2 AASB 132 “Financial Instruments: Disclosure and Presentation”, as applicable from 1 January 2005.3 AASB 139 “Financial Instruments: Recognition and Measurement”, as applicable from 1 January 2005.
Notes appearing on pages 66 to 118 to be read as part of the financial statements.
66 Coca-Cola Amatil 2005 Annual Report
Notes to the Financial StatementsCoca-Cola Amatil Limited and its controlled entitiesFor the financial year ended 31 December 2005
1. Basis of FinancialReport PreparationThis financial report is a generalpurpose financial report which hasbeen prepared in accordance withthe requirements of theCorporations Act 2001 andAustralian Accounting Standards.
The financial report has beenprepared on the basis of historicalcost, except for derivativefinancial instruments which havebeen measured at fair value. Thecarrying values of recognisedassets and liabilities that arehedged with fair value hedges areadjusted to record changes in thefair values attributable to the risksthat are being hedged.
The financial report is presentedin Australian dollars and allvalues are rounded to the nearesttenth of a million dollars unlessotherwise stated under the optionavailable to the Company underASIC Class Order No. 98/100. TheCompany is an entity to which theclass order applies.
a) Transition to AIFRSi) Statement of complianceThe financial report complies withAustralian Accounting Standards,which include Australianequivalents to InternationalFinancial Reporting Standards(AIFRS). Compliance with AIFRSensures that the financial report,comprising the financialstatements and notes thereto,complies with InternationalFinancial Reporting Standards.
This is the first annual financialreport prepared based on AIFRSand comparatives for the financialyear ended 31 December 2004have been restated accordingly. A summary of the significantaccounting policies of the Groupunder AIFRS is disclosed in Note 2.
Reconciliations of –
• AIFRS equity as at 1 January2004 (the date of transition toAIFRS) and 31 December 2004;and
• AIFRS profit for the financialyear ended 31 December 2004,
to the balances reported in the 31 December 2004 financial reportprepared under the previousframework of Australianaccounting standards, referred toas Australian Generally AcceptedAccounting Principles (AGAAP),are detailed in Note 3.
ii) AASB 1 transitionalexemptionsThe Group has made the followingelections in relation to thetransitional exemptions allowedby AASB 1 “First-time Adoption ofAustralian Equivalents toInternational Financial ReportingStandards” –
• Business combinationsAASB 3 “Business Combinations”was not applied retrospectively topast business combinations thatoccurred before the date oftransition to AIFRS.
• Fair value of properties asdeemed cost
The Group has elected to carryproperties at the date of transitionto AIFRS at fair value, and usethat fair value as deemed cost.
• Employee benefitsThe Group has elected to recogniseall cumulative actuarial gains andlosses on the Group’s definedbenefit superannuation plans atthe date of transition to AIFRS, andapply the “corridor” approach toactuarial gains and losses posttransition (refer to the Earlyadoption section in Note 1a) iii).
• Cumulative translationdifferences
The Group has elected to resetthe foreign currency translationreserve to nil at the date oftransition to AIFRS.
• Share based paymenttransactions
AASB 2 “Share-based Payment” isapplied only to equity instrumentsgranted after 7 November 2002that had not vested on or before 1 January 2005.
• Exemption from therequirement to restatecomparative information forAASB 132 and AASB 139
The Group has elected to adoptthis exemption and has appliedAASB 132 “Financial Instruments:Disclosure and Presentation” andAASB 139 “Financial Instruments:Recognition and Measurement”from 1 January 2005.
iii) Early adoptionIn preparing the comparativefigures, the Group has elected toearly adopt AASB 119 “EmployeeBenefits” as issued in December2004. In adopting this standard,the Group has opted to take the“corridor” approach to accountingfor actuarial gains and losses inrelation to the Group’s definedbenefit superannuation plans.Refer to the accounting policy in Note 2s) Employee benefits –pensions and post retirementbenefits.
No other Australian AccountingStandards issued but not yeteffective have been early adopted.It is not considered early adoptionof these standards would have amaterial impact on the results ofthe Group.
b) Principles of consolidationThe consolidated financialstatements of the Group includethe parent entity, Coca-ColaAmatil Limited and its controlledentities. Controlled entitiesinclude special purpose entitiesover which the Group has thepower to govern financial andoperating policies.
The financial statements includethe information and results ofeach controlled entity from thedate on which the Companyobtains control and until suchtime as the Company ceases tocontrol the entity.
In preparing the consolidatedfinancial statements, the effectsof all transactions betweenentities in the Group have beeneliminated.
The financial statements ofcontrolled entities have beenprepared for the same reportingperiod as the parent entity, usingconsistent accounting policies.Adjustments have then beenmade to bring into line anydissimilar accounting policies thatmay exist across the Group.
c) Use of estimatesIn conforming with generallyaccepted accounting principles,the preparation of financialstatements for the Group requiresmanagement to make estimatesand assumptions that affect thereported amounts of assets,liabilities, revenues and expenses,and the disclosure of contingentassets and liabilities in thefinancial statements andaccompanying notes. Althoughthese estimates are based onmanagement’s knowledge ofcurrent events and actions thatmay be undertaken in the future,actual results may ultimatelydiffer from estimates.
2. Summary ofSignificant AccountingPoliciesThe accounting policies adoptedhave been applied consistentlythroughout the two reportingperiods contained in the financialreport with the exception of AASB132 “Financial Instruments:Disclosure and Presentation” andAASB 139 “Financial Instruments:Recognition and Measurement”which are only applicable from 1 January 2005.
a) RevenueRevenue is recognised to theextent that it is probable thateconomic benefits will flow to theGroup, at the point where a rightto consideration or compensationhas been established and wherethe amount of the revenue can bereliably measured. The followingspecific recognition criteria mustalso be met before revenue isrecognised –
Coca-Cola Amatil 2005 Annual Report 67
2. Summary ofSignificant AccountingPolicies continuedi) Sale of goods and materialsRevenue is recognised when thesignificant risks and rewards ofownership of the goods havepassed to the buyer and theamount of revenue can bemeasured reliably.
ii) Rendering of servicesRevenue from installation andmaintenance of equipment isrecognised when the serviceshave been performed and theamount can be measured reliably.
iii) InterestRevenue is recognised as theinterest accrues.
iv) DividendsRevenue is recognised when theshareholder’s right to receive thepayment is established.
v) Rental incomeRental income arising fromequipment hire is accounted forover the term of the rental contract.
Terms of trade in relation to creditsales are on a weighted averageof 30 days from the date ofinvoice. The Group operates in anumber of diverse markets, andaccordingly the terms of tradevary by country and business.
Revenue is recognised net of thediscounts, allowances andapplicable amounts of valueadded taxes such as theAustralian goods and services tax.
b) Earnings per share (EPS)Basic EPS is calculated as profitattributable to members of theCompany divided by the weightedaverage number of ordinary shares,adjusted for any bonus element.
Diluted EPS is calculated as profitattributable to members of theCompany divided by the weightedaverage number of ordinaryshares and dilutive potentialordinary shares, adjusted for any bonus element.
c) DividendsDividends are recognised when an obligation to pay a dividendarises, following declaration ofdividends by the Company’s Boardof Directors.
d) Foreign currencytranslationsTransactions in overseascurrencies are converted to theapplicable functional currency atthe rate of exchange ruling at thedate of each transaction. Foreigncurrency items in the balancesheets are converted at the rateof exchange ruling at balancedate. Exchange rate gains orlosses are brought to account indetermining the net profit or lossin the period in which they arise,as are exchange gains or lossesrelating to cross currency swaptransactions on monetary items.
Each entity in the Groupdetermines its own functionalcurrency and items included in the financial statements of eachentity are measured using thatfunctional currency.
The assets and liabilities offoreign controlled entities aretranslated by applying the rateruling at balance date and revenueand expense items are translatedat the average rate calculated for the period. The exchangedifferences arising on the re-translation are taken directly to equity in the foreign currencytranslation reserve. The foreigncurrency translation reserve for all foreign operations, throughadoption of an election on thedate of transition to AIFRS, wasdeemed to be zero. On disposal of a foreign controlled entity,accumulated exchange differencesare recognised in the incomestatements as a component of the gain or loss on disposal.
Both the functional andpresentational currency of Coca-Cola Amatil Limited and its Australian controlled entities is Australian dollars.
e) Cash and cash equivalentsCash and cash equivalentscomprise cash balances and highlyliquid investments with maturity ofthree months or less whenpurchased. For the purposes of thecash flow statements, cash andcash equivalents include cash onhand and in banks and investmentsin money market instruments, netof bank overdrafts.
f) Recoverability of trade and other receivablesA provision for doubtful debts israised where the collection of thefull amount of the debt is nolonger probable. Bad debts arewritten off to the incomestatements as incurred.
g) InventoriesInventories are stated at thelower of cost (including fixed andvariable factory overheads whereapplicable) and net realisablevalue. Cost is determined on thebasis of first-in-first-out, averageor standard, whichever is themost appropriate in each case.
Net realisable value is theestimated selling price in theordinary course of business, lessthe cost of completion and sellingexpenses.
Costs of inventories include thetransfer from equity of gains orlosses on qualifying cash flowhedges relating to inventorypurchases.
h) Investments in controlledentitiesShares in controlled entities, asrecorded in CCA Entity (Coca-ColaAmatil Limited) accounts, arecarried at cost.
i) Investments in bottlers’agreementsInvestments in bottlers’agreements are carried at cost.
Investments in bottlers’agreements are not amortised as they are considered to have an indefinite life but are testedannually for any impairment in the carrying amount.
j) Property, plant andequipmentProperty, plant and equipment isrecorded at cost. Subsequentexpenditure is added to thecarrying value of the asset when itis probable that future economicbenefits, in excess of the originalassessed standard of performanceof the existing asset, will flow tothe operation. All other subsequentexpenditure is expensed in theperiod in which it is incurred.
Property, plant and equipment,other than freehold land, isdepreciated or amortised on astraight line basis at various ratesdependent upon the estimatedaverage useful life for that assetto the Group. The estimateduseful lives of each class of assetare as follows –
Freehold and leasehold buildings 20 to 50 years
Plant and equipment 3 to 15 years
An item of property, plant andequipment is derecognised upondisposal or when no futureeconomic benefits are expected toarise from the continued use ofthe asset. Any gain or loss arisingon derecognition of the asset(calculated as the differencebetween the net disposalproceeds and the carrying amountof the item) is included in theincome statements in the financialyear the item is derecognised.
k) Leased assetsFinance leases are those whicheffectively transfer from the lessorto the lessee substantially all therisks and benefits incidental toownership of the leased property.There are no material financeleases within the Group.
Operating leases are those wherethe lessor effectively retainssubstantially all the risks andbenefits incidental to ownershipof the leased property.
Operating lease payments arecharged against profits as incurred.
68 Coca-Cola Amatil 2005 Annual Report
Notes to the Financial Statements continued
Coca-Cola Amatil Limited and its controlled entitiesFor the financial year ended 31 December 2005
2. Summary ofSignificant AccountingPolicies continuedl) Non-current assets held for sale A non-current asset is classifiedas held for sale if its carryingamount will be recoveredprincipally through a saletransaction rather than throughcontinuing use, and is measuredat the lower of its carryingamount and fair value less coststo sell. Non-current assets heldfor sale are not depreciated.
m) Intangible assetsIntangible assets acquiredseparately are capitalised at costand from a business combinationare capitalised at fair value as atthe date of acquisition. Followinginitial recognition, the cost modelis applied to each class ofintangible asset. The useful livesof these intangible assets areassessed to be either finite orindefinite. Where amortisation ischarged on assets with finitelives, this expense is taken to theincome statements, and chargedon a straight line basis.
Intangible assets, excludingsoftware development costs,created within the business are notcapitalised and costs taken to theincome statements when incurred.
Intangible assets with indefinitelives are tested for impairment atleast annually at the cashgenerating unit level. Useful livesare also examined on an annualbasis and adjustments, whereapplicable, are made on aprospective basis.
Software development costsincurred on an individual projectare carried forward when futurerecoverability can reasonably beassured. Following the initialrecognition of softwaredevelopment costs, the costmodel is applied requiring theasset to be carried at cost lessany accumulated amortisation andaccumulated impairment losses.
Any costs carried forward areamortised over the assets’ usefuleconomic lives.
The carrying value of softwaredevelopment costs is reviewed forimpairment annually when anasset is not in use or morefrequently when an indicator ofimpairment arises during areporting period indicating thatthe carrying value may not berecoverable.
Gains or losses arising fromderecognition of an intangibleasset are measured as thedifference between the netdisposal proceeds and thecarrying amount of the asset andare recognised in the incomestatements when the asset isderecognised.
The estimated useful lives ofexisting finite intangible assetsare as follows –
Customer lists 5 to 10 yearsBrand names 10 yearsIntellectual property 5 yearsSoftwaredevelopment costs 1 to 7 years
n) GoodwillGoodwill is the excess of the costof an acquisition over the fairvalue of the net assets acquired.Goodwill is not amortised but willbe tested annually or morefrequently if required, for anyimpairment in the carryingamount. Impairment is determinedby assessing the recoverableamount of the cash generatingunit to which the goodwill relates.
Goodwill arising on theacquisition of controlled entities is treated as an asset of thecontrolled entity. These balancesare denominated in the currencyof the controlled entity and aretranslated to Australian dollars ona consistent basis with the otherassets and liabilities held by thecontrolled entity.
o) Recoverable amount of assetsAt each reporting date, the Groupassesses whether there is anindication that an asset may beimpaired. Where an indicator ofimpairment exists or whereannual impairment testing for an asset is required, the Groupmakes a formal estimate of the recoverable amount. Animpairment loss is recognised forthe amount by which the carryingamount of an asset exceedsrecoverable amount, which isdefined as the higher of anassets’ fair value less costs to sellor value in use. For the purpose ofassessing impairment, assets aregrouped at the level for whichthere are separately identifiablecash flows.
An impairment loss is recognisedin the income statements.
p) Trade and other payablesLiabilities are brought to accountfor amounts payable in relation to goods received and servicesrendered, whether or not billed tothe Group at reporting date. Termsof trade in relation to payables areon a weighted average of 45 daysfrom the date of invoice. TheGroup operates in a number ofdiverse markets, and accordinglythe terms of trade vary by countryand business.
q) ProvisionsProvisions are recognised when the Group has a presentobligation as a result of a pastevent, and it is probable that anoutflow of economic benefits will be required to settle theobligation and a reliable estimatecan be made of the amount of the obligation. Where the Groupexpects a provision to bereimbursed, the reimbursement isrecognised as a separate assetbut only when the reimbursementis virtually certain. Wherematerial, the effect of the timevalue of money is taken intoaccount in measuring provisionsby discounting the expected future
cash flows at a rate whichreflects both the risks specific tothe liability, and current marketassessments of the time value ofmoney. Where discounting isapplied, increases in the balanceof provisions attributable to thepassage of time are recognised asan interest cost.
r) Employee benefitsProvision is made for employeebenefits accumulated as a resultof employees rendering servicesup to balance date includingrelated on-costs. The benefitsinclude wages and salaries,incentives, compensated absencesand other benefits, which arecharged against profits in theirrespective expense categorieswhen services are provided orbenefits vest with the employee.The provision for employeebenefits is measured at theremuneration rates expected to bepaid when the liability is settled.Benefits expected to be settledafter twelve months from thereporting date are measured atthe present value of the estimatedfuture cash outflows to be madein respect of services provided byemployees up to the reportingdate.
s) Employee benefits –pensions and post retirementbenefitsThe Group operates a number of defined benefit and definedcontribution superannuation plans.The defined benefit plans aremade up of both funded andunfunded plans. The assets offunded schemes are held inseparate trustee-administeredfunds and are financed bypayments from employees and/orthe relevant Group companies,after taking into account therecommendations of independentqualified actuaries.
For defined benefit plans, pensioncosts are assessed using theprojected unit credit method.
Coca-Cola Amatil 2005 Annual Report 69
2. Summary ofSignificant AccountingPolicies continuedUnder the “corridor” approach,actuarial gains and losses arerecognised as income or expense,when the cumulative unrecognisedactuarial gains or losses for eachindividual plan exceed 10% of thedefined benefit obligation or thefair value of plan assets, inaccordance with the valuationsmade by qualified actuaries. Thedefined benefit obligations aremeasured at the present value ofthe estimated future cash flowsusing interest rates on governmentbonds, which have terms tomaturity approximating the termsof the related liability. Actuarialgains and losses arising fromexperience adjustments or changesin assumptions are recognised overthe average remaining service livesof employees. Past service cost isrecognised immediately to theextent that the benefits are alreadyvested and otherwise amortisedover the average remaining servicelives of the employees.
The Group’s contributions made to defined contributionsuperannuation plans are chargedagainst profits as incurred.
t) Employee benefits – equity compensation plansNo expense is recognised inrespect of share options grantedbefore 7 November 2002 and/orvested before 1 January 2005. The shares are recognised whenthe options are exercised and theproceeds received are allocatedto share capital.
Employer contributions to theEmployees Share Plan are chargedas an employee benefits expenseover the vesting period. Anyamount of unvested shares heldby the trust are controlled by theGroup until they vest and arerecorded at cost in the balancesheets within equity as sharesheld by equity compensation plansuntil they vest. The amount
relating to the unvested obligationis recorded at balance date withinequity as an adjustment to theequity compensation reserve untilthey vest. No gain or loss isrecognised in the incomestatements on the purchase, sale,issue or cancellation of CCA’s ownequity instruments.
Shares granted under the LongTerm Incentive Share Plan aremeasured by reference to the fairvalue of the shares at the date atwhich they are granted. The fairvalue is determined by an externalvaluer using the Monte Carlosimulation methodology. The costof shares is charged as anemployee benefit expense overthe vesting period together with acorresponding increase in theequity compensation reserve,ending on the date on which therelevant employees becomeentitled to the award.
The cumulative expenserecognised for equity-settledtransactions at each reportingdate until vesting date reflects theextent to which the vesting periodhas expired and CCA’s bestestimate of the number of equityinstruments that will ultimatelyvest. No adjustment is made forthe likelihood of marketperformance conditions being metas the effect of these conditionsis included in the determination of fair value at grant date. Theincome statements charge orcredit for a period represents themovement in cumulative expenserecognised as at the beginningand end of that period.
No expense is recognised forawards that do not ultimatelyvest, except for awards wherevesting is only conditional upon a market condition.
u) Share capitalIssued and paid up capital isrecognised at the fair value of theconsideration received by theCompany, less transaction costs.
v) Income taxi) Current income taxCurrent income tax liability orasset represents amounts payableor receivable in relation to incometaxes attributable to taxableprofits of the current or priorfinancial years, less instalmentsof income tax paid.
ii) Deferred income taxDeferred income tax is providedfor using the liability method forall temporary differences arisingbetween the tax bases of assetsand liabilities and their carryingvalue for financial reportingpurposes. Tax rates enacted orsubstantively enacted at thebalance sheet date are used todetermine deferred income tax.
Deferred income tax assets arerecognised to the extent that it isprobable that future taxable profitwill be available against whichtemporary differences can beutilised.
Deferred income tax liabilities are recognised for all taxabletemporary differences, exceptwhere the deferred income taxliability arises from the initialrecognition of an asset or liabilityin a transaction, other than abusiness combination, and at thetime of the transaction affectsneither accounting profit nortaxable profit or loss.
Deferred income tax is providedon temporary differences arisingon investments in controlledentities, except where the timingof the reversal of temporarydifferences can be controlled andit is probable that the temporarydifference will not reverse in theforeseeable future.
Deferred income tax assets andliabilities are offset when thedeferred tax assets and liabilitiesare recorded in relation to aparticular jurisdiction.
Current and deferred income taxesrelating to transactions recorded
in equity are recorded in thematching class of equity.
w) Derivative financialinstrumentsThe Group enters into derivativetransactions, principally interestrate swaps and forward currencycontracts. The purpose is tomanage the interest rate andcurrency risks arising from theGroup’s operations and its sourcesof finance. Derivative transactionsare not entered into forspeculative purposes.
The main risks arising from theGroup’s financial instruments areinterest rate, liquidity, foreigncurrency, commodity and creditrisks.
For the year ended 31 December 2005All derivative financial instrumentsare initially recognised in thebalance sheets at cost and aresubsequently remeasured to theirfair value. Changes in the fairvalue of derivative financialinstruments are recognised eitherin the income statements or inequity depending on whether thederivative financial instrumentqualifies for hedge accounting, andif so, whether it qualifies as a fairvalue hedge or a cash flow hedge.
Changes in the fair values ofderivative financial instrumentsthat are designated and whichqualify as fair value hedges andare highly effective, are recordedin the income statements alongwith the portions of the changes inthe fair value of the hedged itemsthat related to the hedged risks.Changes in the fair values ofderivative financial instrumentsthat are designated and qualify ascash flow hedges, to the extentthat they are effective as hedges,are recorded in equity. The gainsand losses that are recognised inequity are transferred to theincome statements in the sameperiod in which the hedged itemaffects earnings.
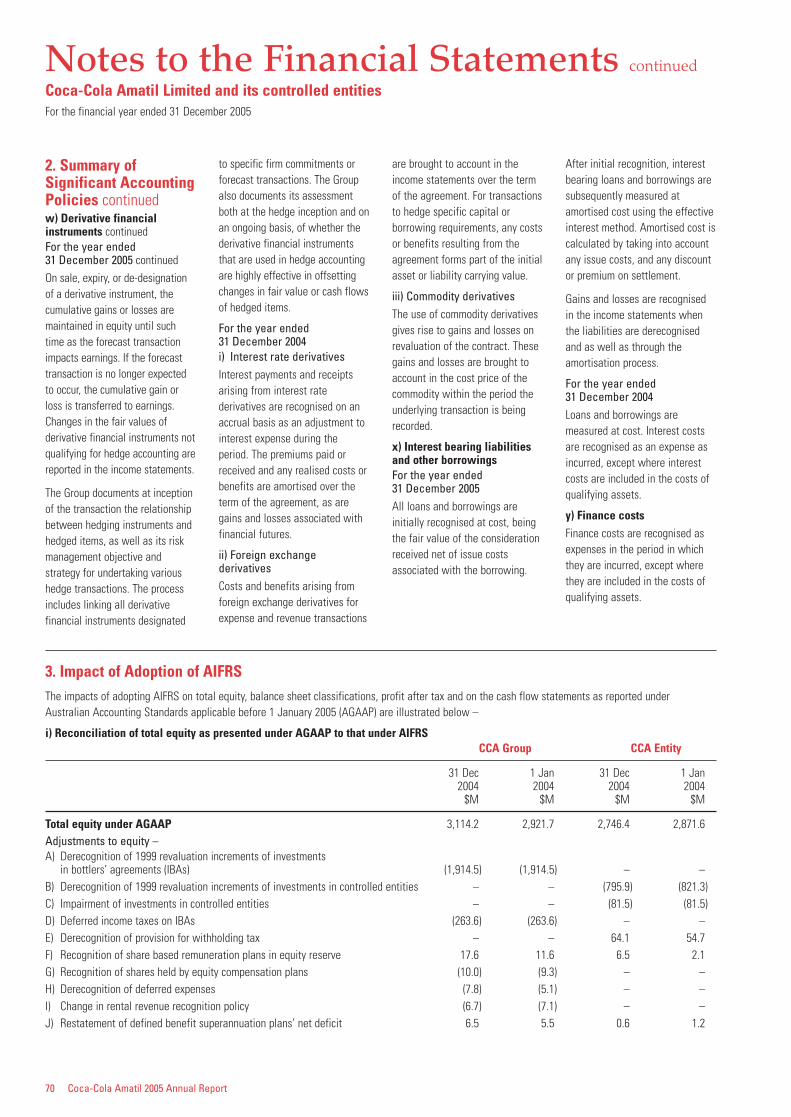
70 Coca-Cola Amatil 2005 Annual Report
Notes to the Financial Statements continued
Coca-Cola Amatil Limited and its controlled entitiesFor the financial year ended 31 December 2005
2. Summary ofSignificant AccountingPolicies continuedw) Derivative financialinstruments continuedFor the year ended 31 December 2005 continuedOn sale, expiry, or de-designationof a derivative instrument, thecumulative gains or losses aremaintained in equity until suchtime as the forecast transactionimpacts earnings. If the forecasttransaction is no longer expectedto occur, the cumulative gain orloss is transferred to earnings.Changes in the fair values ofderivative financial instruments notqualifying for hedge accounting arereported in the income statements.
The Group documents at inceptionof the transaction the relationshipbetween hedging instruments andhedged items, as well as its riskmanagement objective andstrategy for undertaking varioushedge transactions. The processincludes linking all derivativefinancial instruments designated
to specific firm commitments orforecast transactions. The Groupalso documents its assessmentboth at the hedge inception and onan ongoing basis, of whether thederivative financial instrumentsthat are used in hedge accountingare highly effective in offsettingchanges in fair value or cash flowsof hedged items.
For the year ended 31 December 2004i) Interest rate derivativesInterest payments and receiptsarising from interest ratederivatives are recognised on anaccrual basis as an adjustment tointerest expense during theperiod. The premiums paid orreceived and any realised costs orbenefits are amortised over theterm of the agreement, as aregains and losses associated withfinancial futures.
ii) Foreign exchangederivativesCosts and benefits arising fromforeign exchange derivatives forexpense and revenue transactions
are brought to account in theincome statements over the termof the agreement. For transactionsto hedge specific capital orborrowing requirements, any costsor benefits resulting from theagreement forms part of the initialasset or liability carrying value.
iii) Commodity derivativesThe use of commodity derivativesgives rise to gains and losses onrevaluation of the contract. Thesegains and losses are brought toaccount in the cost price of thecommodity within the period theunderlying transaction is beingrecorded.
x) Interest bearing liabilitiesand other borrowingsFor the year ended 31 December 2005All loans and borrowings areinitially recognised at cost, beingthe fair value of the considerationreceived net of issue costsassociated with the borrowing.
After initial recognition, interestbearing loans and borrowings aresubsequently measured atamortised cost using the effectiveinterest method. Amortised cost iscalculated by taking into accountany issue costs, and any discountor premium on settlement.
Gains and losses are recognisedin the income statements whenthe liabilities are derecognisedand as well as through theamortisation process.
For the year ended 31 December 2004Loans and borrowings aremeasured at cost. Interest costsare recognised as an expense asincurred, except where interestcosts are included in the costs ofqualifying assets.
y) Finance costs Finance costs are recognised asexpenses in the period in whichthey are incurred, except wherethey are included in the costs ofqualifying assets.
3. Impact of Adoption of AIFRSThe impacts of adopting AIFRS on total equity, balance sheet classifications, profit after tax and on the cash flow statements as reported underAustralian Accounting Standards applicable before 1 January 2005 (AGAAP) are illustrated below –
i) Reconciliation of total equity as presented under AGAAP to that under AIFRSCCA Group CCA Entity
31 Dec 1 Jan 31 Dec 1 Jan2004 2004 2004 2004
$M $M $M $M
Total equity under AGAAP 3,114.2 2,921.7 2,746.4 2,871.6Adjustments to equity –A) Derecognition of 1999 revaluation increments of investments
in bottlers’ agreements (IBAs) (1,914.5) (1,914.5) – –B) Derecognition of 1999 revaluation increments of investments in controlled entities – – (795.9) (821.3)C) Impairment of investments in controlled entities – – (81.5) (81.5)D) Deferred income taxes on IBAs (263.6) (263.6) – –E) Derecognition of provision for withholding tax – – 64.1 54.7F) Recognition of share based remuneration plans in equity reserve 17.6 11.6 6.5 2.1G) Recognition of shares held by equity compensation plans (10.0) (9.3) – –H) Derecognition of deferred expenses (7.8) (5.1) – –I) Change in rental revenue recognition policy (6.7) (7.1) – –J) Restatement of defined benefit superannuation plans’ net deficit 6.5 5.5 0.6 1.2
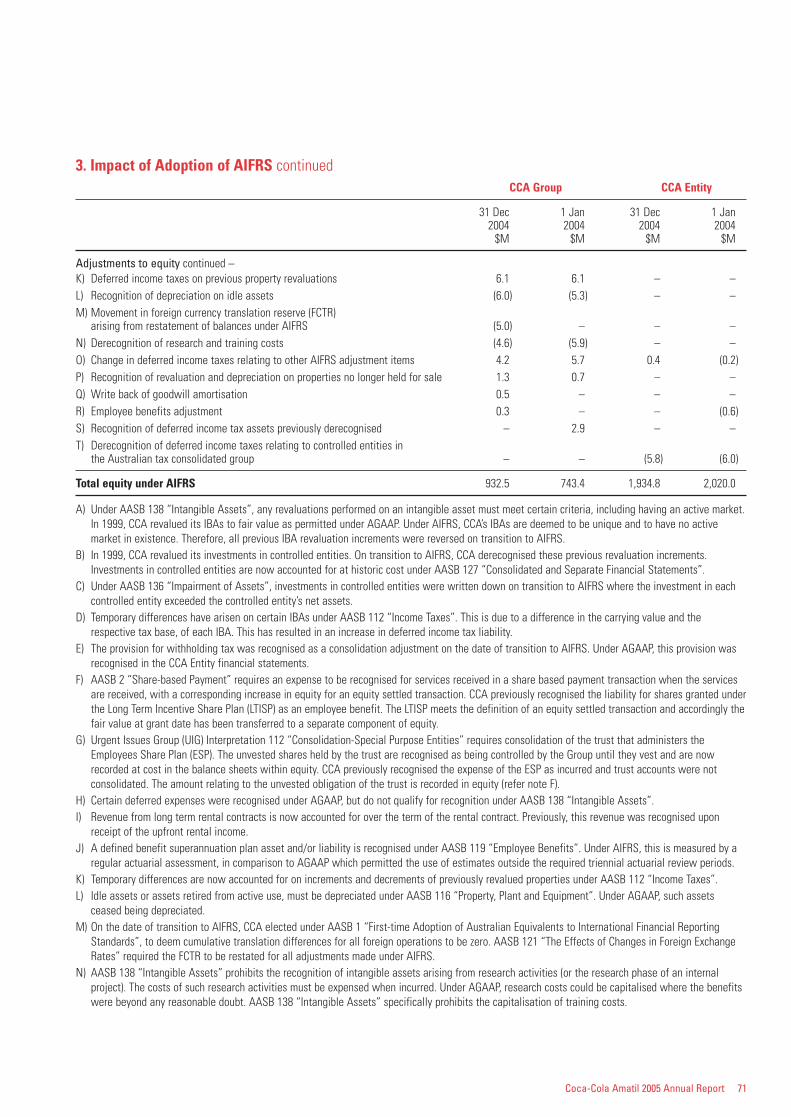
Coca-Cola Amatil 2005 Annual Report 71
3. Impact of Adoption of AIFRS continuedCCA Group CCA Entity
31 Dec 1 Jan 31 Dec 1 Jan2004 2004 2004 2004
$M $M $M $M
Adjustments to equity continued –K) Deferred income taxes on previous property revaluations 6.1 6.1 – –L) Recognition of depreciation on idle assets (6.0) (5.3) – –M) Movement in foreign currency translation reserve (FCTR)
arising from restatement of balances under AIFRS (5.0) – – –N) Derecognition of research and training costs (4.6) (5.9) – –O) Change in deferred income taxes relating to other AIFRS adjustment items 4.2 5.7 0.4 (0.2)P) Recognition of revaluation and depreciation on properties no longer held for sale 1.3 0.7 – –Q) Write back of goodwill amortisation 0.5 – – –R) Employee benefits adjustment 0.3 – – (0.6)S) Recognition of deferred income tax assets previously derecognised – 2.9 – –T) Derecognition of deferred income taxes relating to controlled entities in
the Australian tax consolidated group – – (5.8) (6.0)
Total equity under AIFRS 932.5 743.4 1,934.8 2,020.0
A) Under AASB 138 “Intangible Assets”, any revaluations performed on an intangible asset must meet certain criteria, including having an active market.In 1999, CCA revalued its IBAs to fair value as permitted under AGAAP. Under AIFRS, CCA’s IBAs are deemed to be unique and to have no activemarket in existence. Therefore, all previous IBA revaluation increments were reversed on transition to AIFRS.
B) In 1999, CCA revalued its investments in controlled entities. On transition to AIFRS, CCA derecognised these previous revaluation increments.Investments in controlled entities are now accounted for at historic cost under AASB 127 “Consolidated and Separate Financial Statements”.
C) Under AASB 136 “Impairment of Assets”, investments in controlled entities were written down on transition to AIFRS where the investment in eachcontrolled entity exceeded the controlled entity’s net assets.
D) Temporary differences have arisen on certain IBAs under AASB 112 “Income Taxes”. This is due to a difference in the carrying value and therespective tax base, of each IBA. This has resulted in an increase in deferred income tax liability.
E) The provision for withholding tax was recognised as a consolidation adjustment on the date of transition to AIFRS. Under AGAAP, this provision wasrecognised in the CCA Entity financial statements.
F) AASB 2 “Share-based Payment” requires an expense to be recognised for services received in a share based payment transaction when the servicesare received, with a corresponding increase in equity for an equity settled transaction. CCA previously recognised the liability for shares granted underthe Long Term Incentive Share Plan (LTISP) as an employee benefit. The LTISP meets the definition of an equity settled transaction and accordingly thefair value at grant date has been transferred to a separate component of equity.
G) Urgent Issues Group (UIG) Interpretation 112 “Consolidation-Special Purpose Entities” requires consolidation of the trust that administers theEmployees Share Plan (ESP). The unvested shares held by the trust are recognised as being controlled by the Group until they vest and are nowrecorded at cost in the balance sheets within equity. CCA previously recognised the expense of the ESP as incurred and trust accounts were notconsolidated. The amount relating to the unvested obligation of the trust is recorded in equity (refer note F).
H) Certain deferred expenses were recognised under AGAAP, but do not qualify for recognition under AASB 138 “Intangible Assets”.I) Revenue from long term rental contracts is now accounted for over the term of the rental contract. Previously, this revenue was recognised upon
receipt of the upfront rental income.J) A defined benefit superannuation plan asset and/or liability is recognised under AASB 119 “Employee Benefits”. Under AIFRS, this is measured by a
regular actuarial assessment, in comparison to AGAAP which permitted the use of estimates outside the required triennial actuarial review periods.K) Temporary differences are now accounted for on increments and decrements of previously revalued properties under AASB 112 “Income Taxes”.L) Idle assets or assets retired from active use, must be depreciated under AASB 116 “Property, Plant and Equipment”. Under AGAAP, such assets
ceased being depreciated.M) On the date of transition to AIFRS, CCA elected under AASB 1 “First-time Adoption of Australian Equivalents to International Financial Reporting
Standards”, to deem cumulative translation differences for all foreign operations to be zero. AASB 121 “The Effects of Changes in Foreign ExchangeRates” required the FCTR to be restated for all adjustments made under AIFRS.
N) AASB 138 “Intangible Assets” prohibits the recognition of intangible assets arising from research activities (or the research phase of an internalproject). The costs of such research activities must be expensed when incurred. Under AGAAP, research costs could be capitalised where the benefitswere beyond any reasonable doubt. AASB 138 “Intangible Assets” specifically prohibits the capitalisation of training costs.
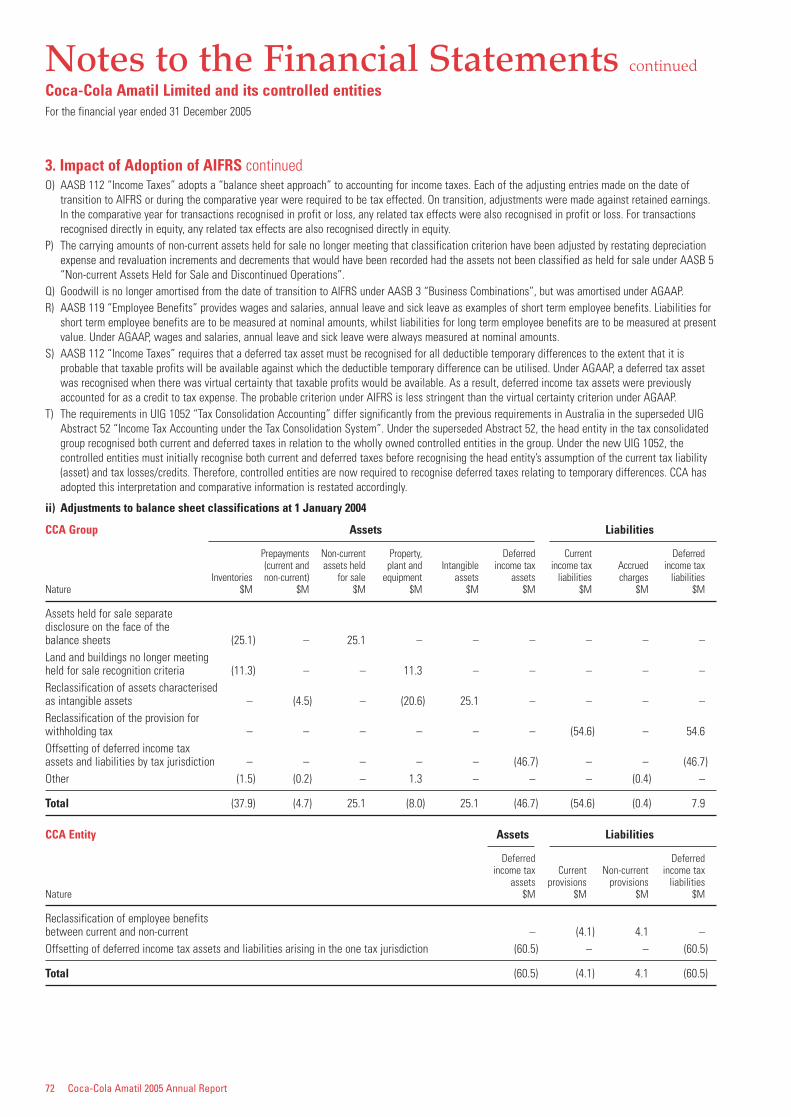
72 Coca-Cola Amatil 2005 Annual Report
Notes to the Financial Statements continued
Coca-Cola Amatil Limited and its controlled entitiesFor the financial year ended 31 December 2005
3. Impact of Adoption of AIFRS continuedO) AASB 112 “Income Taxes” adopts a “balance sheet approach” to accounting for income taxes. Each of the adjusting entries made on the date of
transition to AIFRS or during the comparative year were required to be tax effected. On transition, adjustments were made against retained earnings.In the comparative year for transactions recognised in profit or loss, any related tax effects were also recognised in profit or loss. For transactionsrecognised directly in equity, any related tax effects are also recognised directly in equity.
P) The carrying amounts of non-current assets held for sale no longer meeting that classification criterion have been adjusted by restating depreciationexpense and revaluation increments and decrements that would have been recorded had the assets not been classified as held for sale under AASB 5“Non-current Assets Held for Sale and Discontinued Operations”.
Q) Goodwill is no longer amortised from the date of transition to AIFRS under AASB 3 “Business Combinations”, but was amortised under AGAAP.R) AASB 119 “Employee Benefits” provides wages and salaries, annual leave and sick leave as examples of short term employee benefits. Liabilities for
short term employee benefits are to be measured at nominal amounts, whilst liabilities for long term employee benefits are to be measured at presentvalue. Under AGAAP, wages and salaries, annual leave and sick leave were always measured at nominal amounts.
S) AASB 112 “Income Taxes” requires that a deferred tax asset must be recognised for all deductible temporary differences to the extent that it isprobable that taxable profits will be available against which the deductible temporary difference can be utilised. Under AGAAP, a deferred tax assetwas recognised when there was virtual certainty that taxable profits would be available. As a result, deferred income tax assets were previouslyaccounted for as a credit to tax expense. The probable criterion under AIFRS is less stringent than the virtual certainty criterion under AGAAP.
T) The requirements in UIG 1052 “Tax Consolidation Accounting” differ significantly from the previous requirements in Australia in the superseded UIGAbstract 52 “Income Tax Accounting under the Tax Consolidation System”. Under the superseded Abstract 52, the head entity in the tax consolidatedgroup recognised both current and deferred taxes in relation to the wholly owned controlled entities in the group. Under the new UIG 1052, thecontrolled entities must initially recognise both current and deferred taxes before recognising the head entity’s assumption of the current tax liability(asset) and tax losses/credits. Therefore, controlled entities are now required to recognise deferred taxes relating to temporary differences. CCA hasadopted this interpretation and comparative information is restated accordingly.
ii) Adjustments to balance sheet classifications at 1 January 2004
CCA Group Assets Liabilities
Prepayments Non-current Property, Deferred Current Deferred(current and assets held plant and Intangible income tax income tax Accrued income tax
Inventories non-current) for sale equipment assets assets liabilities charges liabilitiesNature $M $M $M $M $M $M $M $M $M
Assets held for sale separate disclosure on the face of the balance sheets (25.1) – 25.1 – – – – – –Land and buildings no longer meetingheld for sale recognition criteria (11.3) – – 11.3 – – – – –Reclassification of assets characterised as intangible assets – (4.5) – (20.6) 25.1 – – – –Reclassification of the provision for withholding tax – – – – – – (54.6) – 54.6Offsetting of deferred income tax assets and liabilities by tax jurisdiction – – – – – (46.7) – – (46.7)Other (1.5) (0.2) – 1.3 – – – (0.4) –
Total (37.9) (4.7) 25.1 (8.0) 25.1 (46.7) (54.6) (0.4) 7.9
CCA Entity Assets Liabilities
Deferred Deferredincome tax Current Non-current income tax
assets provisions provisions liabilitiesNature $M $M $M $M
Reclassification of employee benefits between current and non-current – (4.1) 4.1 –Offsetting of deferred income tax assets and liabilities arising in the one tax jurisdiction (60.5) – – (60.5)
Total (60.5) (4.1) 4.1 (60.5)
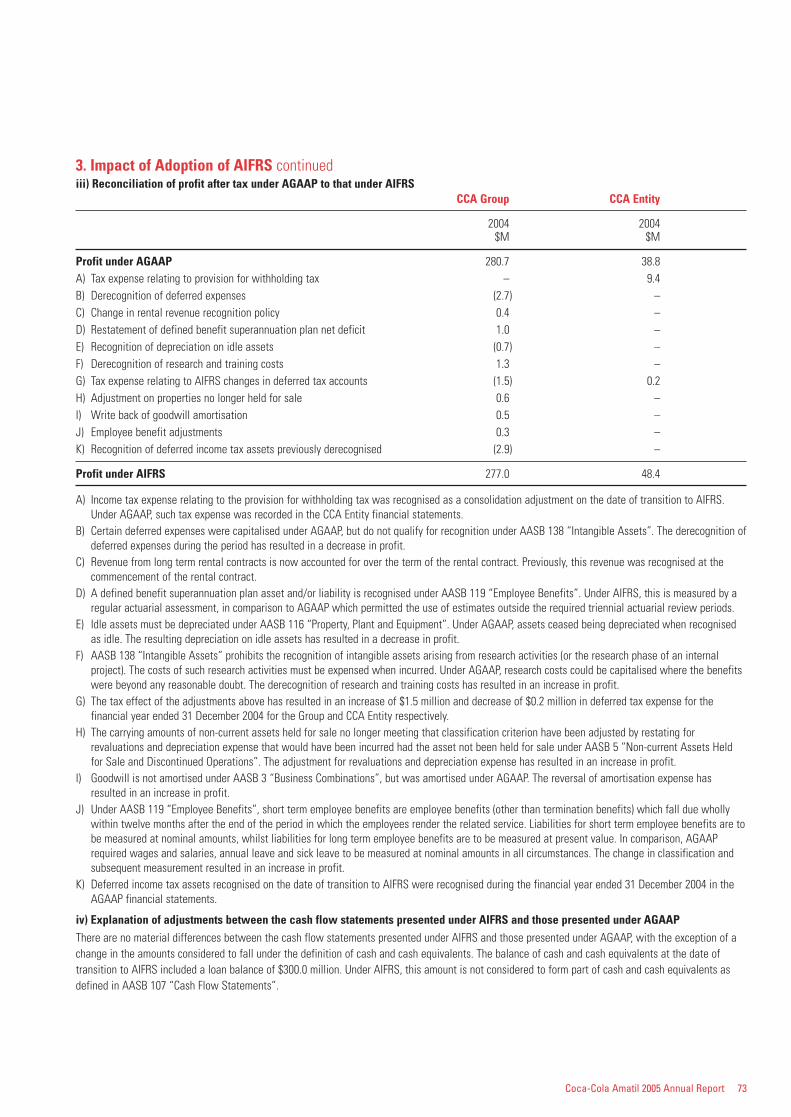
Coca-Cola Amatil 2005 Annual Report 73
3. Impact of Adoption of AIFRS continuediii) Reconciliation of profit after tax under AGAAP to that under AIFRS
CCA Group CCA Entity
2004 2004$M $M
Profit under AGAAP 280.7 38.8A) Tax expense relating to provision for withholding tax – 9.4B) Derecognition of deferred expenses (2.7) –C) Change in rental revenue recognition policy 0.4 –D) Restatement of defined benefit superannuation plan net deficit 1.0 –E) Recognition of depreciation on idle assets (0.7) –F) Derecognition of research and training costs 1.3 –G) Tax expense relating to AIFRS changes in deferred tax accounts (1.5) 0.2H) Adjustment on properties no longer held for sale 0.6 –I) Write back of goodwill amortisation 0.5 –J) Employee benefit adjustments 0.3 –K) Recognition of deferred income tax assets previously derecognised (2.9) –
Profit under AIFRS 277.0 48.4
A) Income tax expense relating to the provision for withholding tax was recognised as a consolidation adjustment on the date of transition to AIFRS.Under AGAAP, such tax expense was recorded in the CCA Entity financial statements.
B) Certain deferred expenses were capitalised under AGAAP, but do not qualify for recognition under AASB 138 “Intangible Assets”. The derecognition ofdeferred expenses during the period has resulted in a decrease in profit.
C) Revenue from long term rental contracts is now accounted for over the term of the rental contract. Previously, this revenue was recognised at thecommencement of the rental contract.
D) A defined benefit superannuation plan asset and/or liability is recognised under AASB 119 “Employee Benefits”. Under AIFRS, this is measured by aregular actuarial assessment, in comparison to AGAAP which permitted the use of estimates outside the required triennial actuarial review periods.
E) Idle assets must be depreciated under AASB 116 “Property, Plant and Equipment”. Under AGAAP, assets ceased being depreciated when recognisedas idle. The resulting depreciation on idle assets has resulted in a decrease in profit.
F) AASB 138 “Intangible Assets” prohibits the recognition of intangible assets arising from research activities (or the research phase of an internalproject). The costs of such research activities must be expensed when incurred. Under AGAAP, research costs could be capitalised where the benefitswere beyond any reasonable doubt. The derecognition of research and training costs has resulted in an increase in profit.
G) The tax effect of the adjustments above has resulted in an increase of $1.5 million and decrease of $0.2 million in deferred tax expense for thefinancial year ended 31 December 2004 for the Group and CCA Entity respectively.
H) The carrying amounts of non-current assets held for sale no longer meeting that classification criterion have been adjusted by restating forrevaluations and depreciation expense that would have been incurred had the asset not been held for sale under AASB 5 “Non-current Assets Heldfor Sale and Discontinued Operations”. The adjustment for revaluations and depreciation expense has resulted in an increase in profit.
I) Goodwill is not amortised under AASB 3 “Business Combinations”, but was amortised under AGAAP. The reversal of amortisation expense hasresulted in an increase in profit.
J) Under AASB 119 “Employee Benefits”, short term employee benefits are employee benefits (other than termination benefits) which fall due whollywithin twelve months after the end of the period in which the employees render the related service. Liabilities for short term employee benefits are tobe measured at nominal amounts, whilst liabilities for long term employee benefits are to be measured at present value. In comparison, AGAAPrequired wages and salaries, annual leave and sick leave to be measured at nominal amounts in all circumstances. The change in classification andsubsequent measurement resulted in an increase in profit.
K) Deferred income tax assets recognised on the date of transition to AIFRS were recognised during the financial year ended 31 December 2004 in theAGAAP financial statements.
iv) Explanation of adjustments between the cash flow statements presented under AIFRS and those presented under AGAAPThere are no material differences between the cash flow statements presented under AIFRS and those presented under AGAAP, with the exception of achange in the amounts considered to fall under the definition of cash and cash equivalents. The balance of cash and cash equivalents at the date oftransition to AIFRS included a loan balance of $300.0 million. Under AIFRS, this amount is not considered to form part of cash and cash equivalents asdefined in AASB 107 “Cash Flow Statements”.
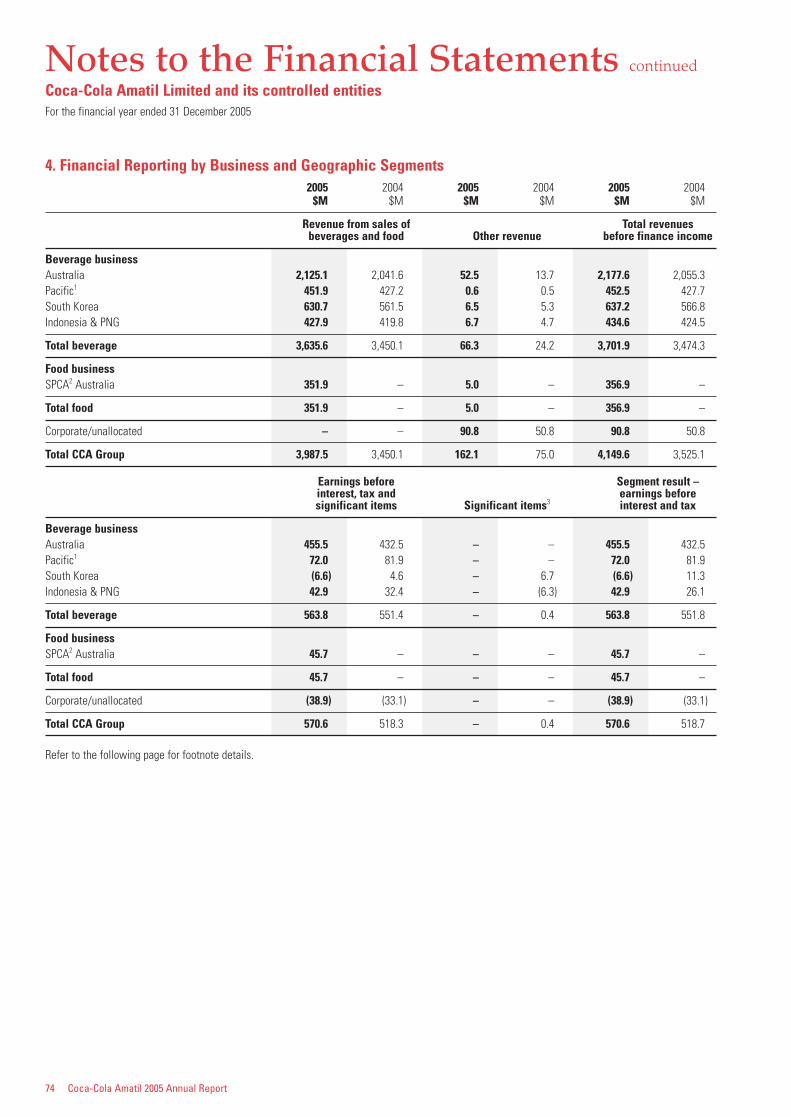
74 Coca-Cola Amatil 2005 Annual Report
Notes to the Financial Statements continued
Coca-Cola Amatil Limited and its controlled entitiesFor the financial year ended 31 December 2005
4. Financial Reporting by Business and Geographic Segments2005 2004 2005 2004 2005 2004
$M $M $M $M $M $M
Revenue from sales of Total revenuesbeverages and food Other revenue before finance income
Beverage businessAustralia 2,125.1 2,041.6 52.5 13.7 2,177.6 2,055.3Pacific1 451.9 427.2 0.6 0.5 452.5 427.7South Korea 630.7 561.5 6.5 5.3 637.2 566.8Indonesia & PNG 427.9 419.8 6.7 4.7 434.6 424.5
Total beverage 3,635.6 3,450.1 66.3 24.2 3,701.9 3,474.3
Food businessSPCA2 Australia 351.9 – 5.0 – 356.9 –
Total food 351.9 – 5.0 – 356.9 –
Corporate/unallocated – – 90.8 50.8 90.8 50.8
Total CCA Group 3,987.5 3,450.1 162.1 75.0 4,149.6 3,525.1
Earnings before Segment result –interest, tax and earnings beforesignificant items Significant items3 interest and tax
Beverage businessAustralia 455.5 432.5 – – 455.5 432.5Pacific1 72.0 81.9 – – 72.0 81.9South Korea (6.6) 4.6 – 6.7 (6.6) 11.3Indonesia & PNG 42.9 32.4 – (6.3) 42.9 26.1
Total beverage 563.8 551.4 – 0.4 563.8 551.8
Food businessSPCA2 Australia 45.7 – – – 45.7 –
Total food 45.7 – – – 45.7 –
Corporate/unallocated (38.9) (33.1) – – (38.9) (33.1)
Total CCA Group 570.6 518.3 – 0.4 570.6 518.7
Refer to the following page for footnote details.
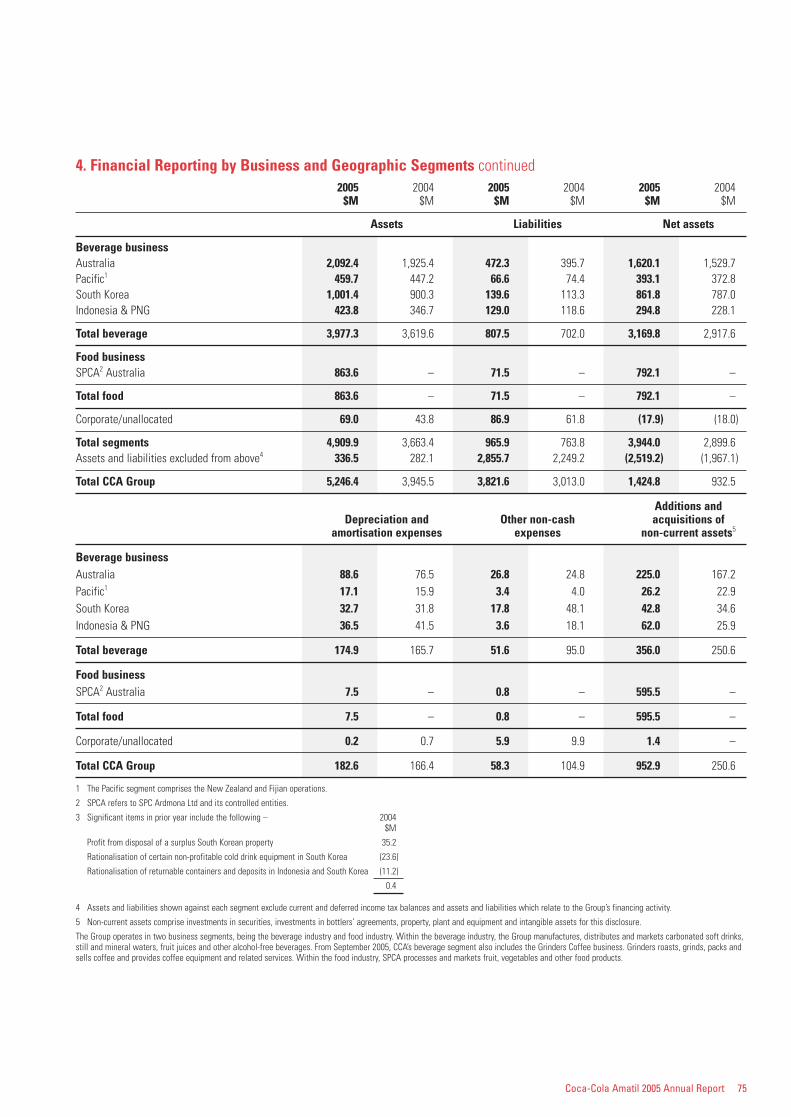
Coca-Cola Amatil 2005 Annual Report 75
4. Financial Reporting by Business and Geographic Segments continued2005 2004 2005 2004 2005 2004
$M $M $M $M $M $M
Assets Liabilities Net assets
Beverage businessAustralia 2,092.4 1,925.4 472.3 395.7 1,620.1 1,529.7Pacific1 459.7 447.2 66.6 74.4 393.1 372.8South Korea 1,001.4 900.3 139.6 113.3 861.8 787.0Indonesia & PNG 423.8 346.7 129.0 118.6 294.8 228.1
Total beverage 3,977.3 3,619.6 807.5 702.0 3,169.8 2,917.6
Food businessSPCA2 Australia 863.6 – 71.5 – 792.1 –
Total food 863.6 – 71.5 – 792.1 –
Corporate/unallocated 69.0 43.8 86.9 61.8 (17.9) (18.0)
Total segments 4,909.9 3,663.4 965.9 763.8 3,944.0 2,899.6Assets and liabilities excluded from above4 336.5 282.1 2,855.7 2,249.2 (2,519.2) (1,967.1)
Total CCA Group 5,246.4 3,945.5 3,821.6 3,013.0 1,424.8 932.5
Additions andDepreciation and Other non-cash acquisitions of
amortisation expenses expenses non-current assets5
Beverage businessAustralia 88.6 76.5 26.8 24.8 225.0 167.2Pacific1 17.1 15.9 3.4 4.0 26.2 22.9South Korea 32.7 31.8 17.8 48.1 42.8 34.6Indonesia & PNG 36.5 41.5 3.6 18.1 62.0 25.9
Total beverage 174.9 165.7 51.6 95.0 356.0 250.6
Food businessSPCA2 Australia 7.5 – 0.8 – 595.5 –
Total food 7.5 – 0.8 – 595.5 –
Corporate/unallocated 0.2 0.7 5.9 9.9 1.4 –
Total CCA Group 182.6 166.4 58.3 104.9 952.9 250.6
1 The Pacific segment comprises the New Zealand and Fijian operations.
2 SPCA refers to SPC Ardmona Ltd and its controlled entities.
3 Significant items in prior year include the following – 2004$M
Profit from disposal of a surplus South Korean property 35.2
Rationalisation of certain non-profitable cold drink equipment in South Korea (23.6)
Rationalisation of returnable containers and deposits in Indonesia and South Korea (11.2)
0.4
4 Assets and liabilities shown against each segment exclude current and deferred income tax balances and assets and liabilities which relate to the Group’s financing activity.
5 Non-current assets comprise investments in securities, investments in bottlers’ agreements, property, plant and equipment and intangible assets for this disclosure.
The Group operates in two business segments, being the beverage industry and food industry. Within the beverage industry, the Group manufactures, distributes and markets carbonated soft drinks,still and mineral waters, fruit juices and other alcohol-free beverages. From September 2005, CCA’s beverage segment also includes the Grinders Coffee business. Grinders roasts, grinds, packs andsells coffee and provides coffee equipment and related services. Within the food industry, SPCA processes and markets fruit, vegetables and other food products.
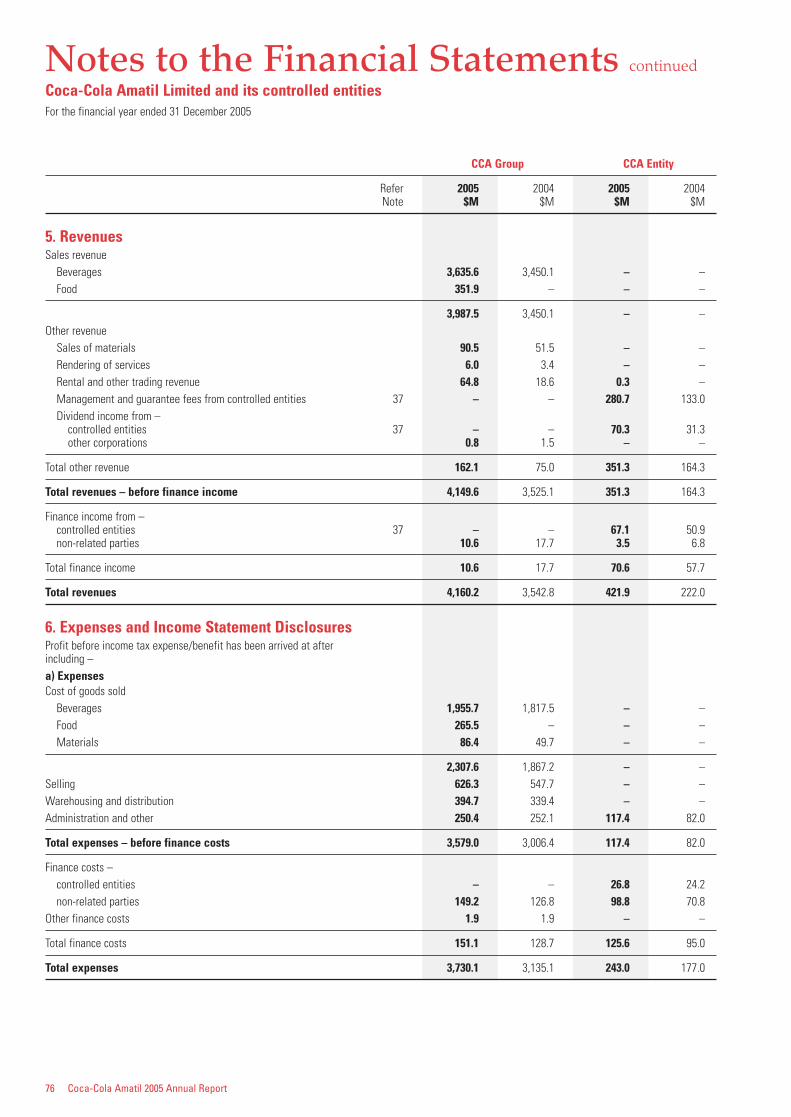
76 Coca-Cola Amatil 2005 Annual Report
Notes to the Financial Statements continued
Coca-Cola Amatil Limited and its controlled entitiesFor the financial year ended 31 December 2005
CCA Group CCA Entity
Refer 2005 2004 2005 2004Note $M $M $M $M
5. RevenuesSales revenue
Beverages 3,635.6 3,450.1 – –Food 351.9 – – –
3,987.5 3,450.1 – –Other revenue
Sales of materials 90.5 51.5 – –Rendering of services 6.0 3.4 – –Rental and other trading revenue 64.8 18.6 0.3 –Management and guarantee fees from controlled entities 37 – – 280.7 133.0Dividend income from –
controlled entities 37 – – 70.3 31.3other corporations 0.8 1.5 – –
Total other revenue 162.1 75.0 351.3 164.3
Total revenues – before finance income 4,149.6 3,525.1 351.3 164.3
Finance income from –controlled entities 37 – – 67.1 50.9non-related parties 10.6 17.7 3.5 6.8
Total finance income 10.6 17.7 70.6 57.7
Total revenues 4,160.2 3,542.8 421.9 222.0
6. Expenses and Income Statement DisclosuresProfit before income tax expense/benefit has been arrived at after including –a) ExpensesCost of goods sold
Beverages 1,955.7 1,817.5 – –Food 265.5 – – –Materials 86.4 49.7 – –
2,307.6 1,867.2 – –Selling 626.3 547.7 – –Warehousing and distribution 394.7 339.4 – –Administration and other 250.4 252.1 117.4 82.0
Total expenses – before finance costs 3,579.0 3,006.4 117.4 82.0
Finance costs –controlled entities – – 26.8 24.2non-related parties 149.2 126.8 98.8 70.8
Other finance costs 1.9 1.9 – –
Total finance costs 151.1 128.7 125.6 95.0
Total expenses 3,730.1 3,135.1 243.0 177.0
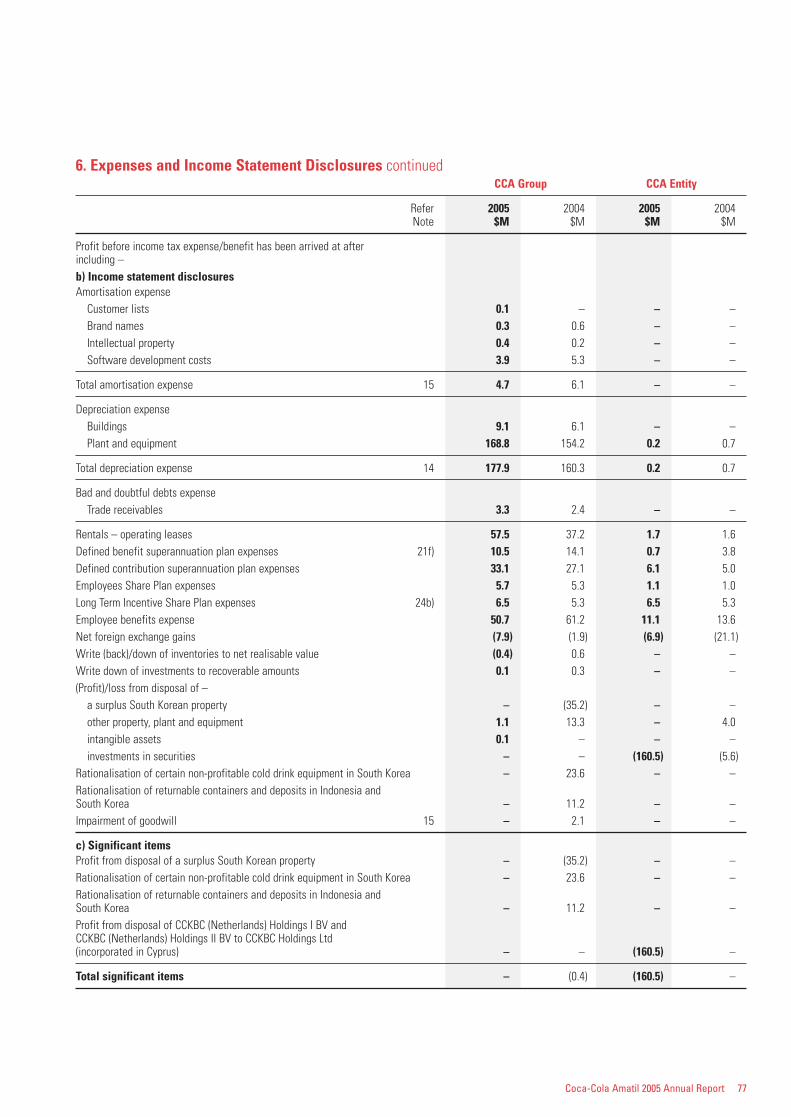
Coca-Cola Amatil 2005 Annual Report 77
6. Expenses and Income Statement Disclosures continuedCCA Group CCA Entity
Refer 2005 2004 2005 2004Note $M $M $M $M
Profit before income tax expense/benefit has been arrived at after including –b) Income statement disclosuresAmortisation expense
Customer lists 0.1 – – –Brand names 0.3 0.6 – –Intellectual property 0.4 0.2 – –Software development costs 3.9 5.3 – –
Total amortisation expense 15 4.7 6.1 – –
Depreciation expenseBuildings 9.1 6.1 – –Plant and equipment 168.8 154.2 0.2 0.7
Total depreciation expense 14 177.9 160.3 0.2 0.7
Bad and doubtful debts expenseTrade receivables 3.3 2.4 – –
Rentals – operating leases 57.5 37.2 1.7 1.6Defined benefit superannuation plan expenses 21f) 10.5 14.1 0.7 3.8Defined contribution superannuation plan expenses 33.1 27.1 6.1 5.0Employees Share Plan expenses 5.7 5.3 1.1 1.0Long Term Incentive Share Plan expenses 24b) 6.5 5.3 6.5 5.3Employee benefits expense 50.7 61.2 11.1 13.6Net foreign exchange gains (7.9) (1.9) (6.9) (21.1)Write (back)/down of inventories to net realisable value (0.4) 0.6 – –Write down of investments to recoverable amounts 0.1 0.3 – –(Profit)/loss from disposal of –
a surplus South Korean property – (35.2) – –other property, plant and equipment 1.1 13.3 – 4.0intangible assets 0.1 – – –investments in securities – – (160.5) (5.6)
Rationalisation of certain non-profitable cold drink equipment in South Korea – 23.6 – –Rationalisation of returnable containers and deposits in Indonesia and South Korea – 11.2 – –Impairment of goodwill 15 – 2.1 – –
c) Significant itemsProfit from disposal of a surplus South Korean property – (35.2) – –Rationalisation of certain non-profitable cold drink equipment in South Korea – 23.6 – –Rationalisation of returnable containers and deposits in Indonesia and South Korea – 11.2 – –Profit from disposal of CCKBC (Netherlands) Holdings I BV and CCKBC (Netherlands) Holdings II BV to CCKBC Holdings Ltd (incorporated in Cyprus) – – (160.5) –
Total significant items – (0.4) (160.5) –
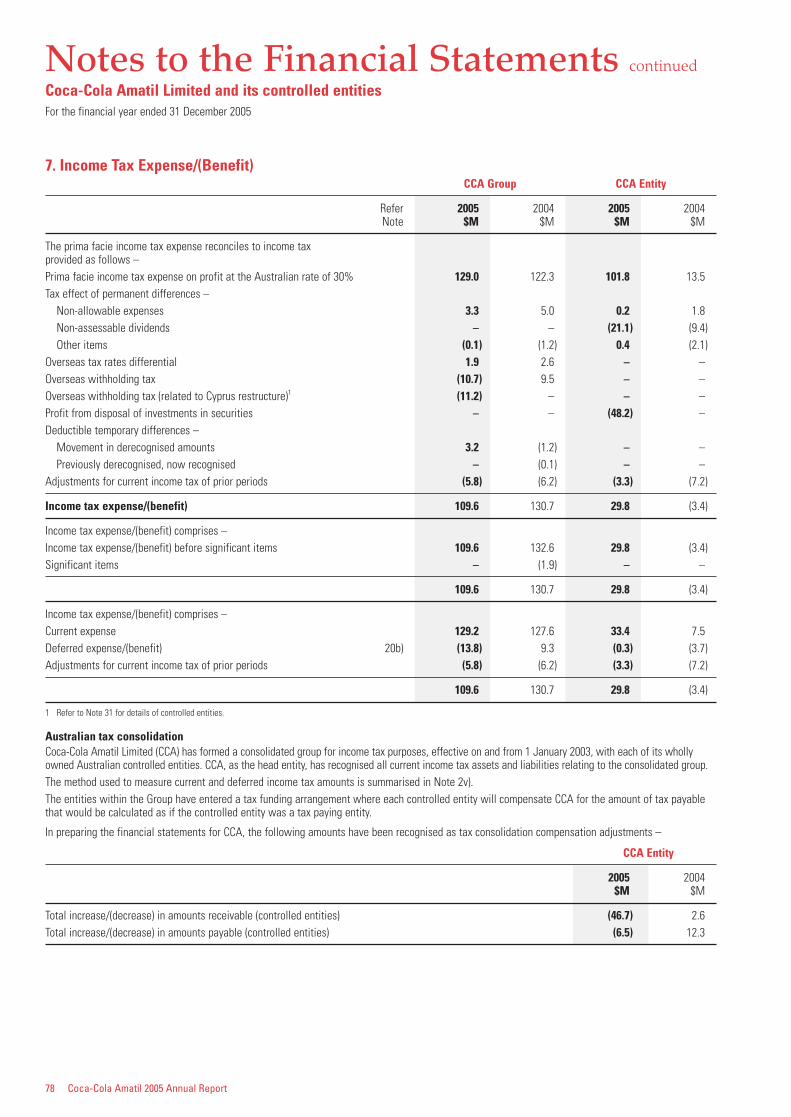
78 Coca-Cola Amatil 2005 Annual Report
Notes to the Financial Statements continued
Coca-Cola Amatil Limited and its controlled entitiesFor the financial year ended 31 December 2005
7. Income Tax Expense/(Benefit)CCA Group CCA Entity
Refer 2005 2004 2005 2004Note $M $M $M $M
The prima facie income tax expense reconciles to income tax provided as follows –Prima facie income tax expense on profit at the Australian rate of 30% 129.0 122.3 101.8 13.5Tax effect of permanent differences –
Non-allowable expenses 3.3 5.0 0.2 1.8Non-assessable dividends – – (21.1) (9.4)Other items (0.1) (1.2) 0.4 (2.1)
Overseas tax rates differential 1.9 2.6 – –Overseas withholding tax (10.7) 9.5 – –Overseas withholding tax (related to Cyprus restructure)1 (11.2) – – –Profit from disposal of investments in securities – – (48.2) –Deductible temporary differences –
Movement in derecognised amounts 3.2 (1.2) – –Previously derecognised, now recognised – (0.1) – –
Adjustments for current income tax of prior periods (5.8) (6.2) (3.3) (7.2)
Income tax expense/(benefit) 109.6 130.7 29.8 (3.4)
Income tax expense/(benefit) comprises –Income tax expense/(benefit) before significant items 109.6 132.6 29.8 (3.4)Significant items – (1.9) – –
109.6 130.7 29.8 (3.4)
Income tax expense/(benefit) comprises –Current expense 129.2 127.6 33.4 7.5Deferred expense/(benefit) 20b) (13.8) 9.3 (0.3) (3.7)Adjustments for current income tax of prior periods (5.8) (6.2) (3.3) (7.2)
109.6 130.7 29.8 (3.4)
1 Refer to Note 31 for details of controlled entities.
Australian tax consolidationCoca-Cola Amatil Limited (CCA) has formed a consolidated group for income tax purposes, effective on and from 1 January 2003, with each of its whollyowned Australian controlled entities. CCA, as the head entity, has recognised all current income tax assets and liabilities relating to the consolidated group.The method used to measure current and deferred income tax amounts is summarised in Note 2v).The entities within the Group have entered a tax funding arrangement where each controlled entity will compensate CCA for the amount of tax payablethat would be calculated as if the controlled entity was a tax paying entity.
In preparing the financial statements for CCA, the following amounts have been recognised as tax consolidation compensation adjustments –
CCA Entity
2005 2004$M $M
Total increase/(decrease) in amounts receivable (controlled entities) (46.7) 2.6Total increase/(decrease) in amounts payable (controlled entities) (6.5) 12.3
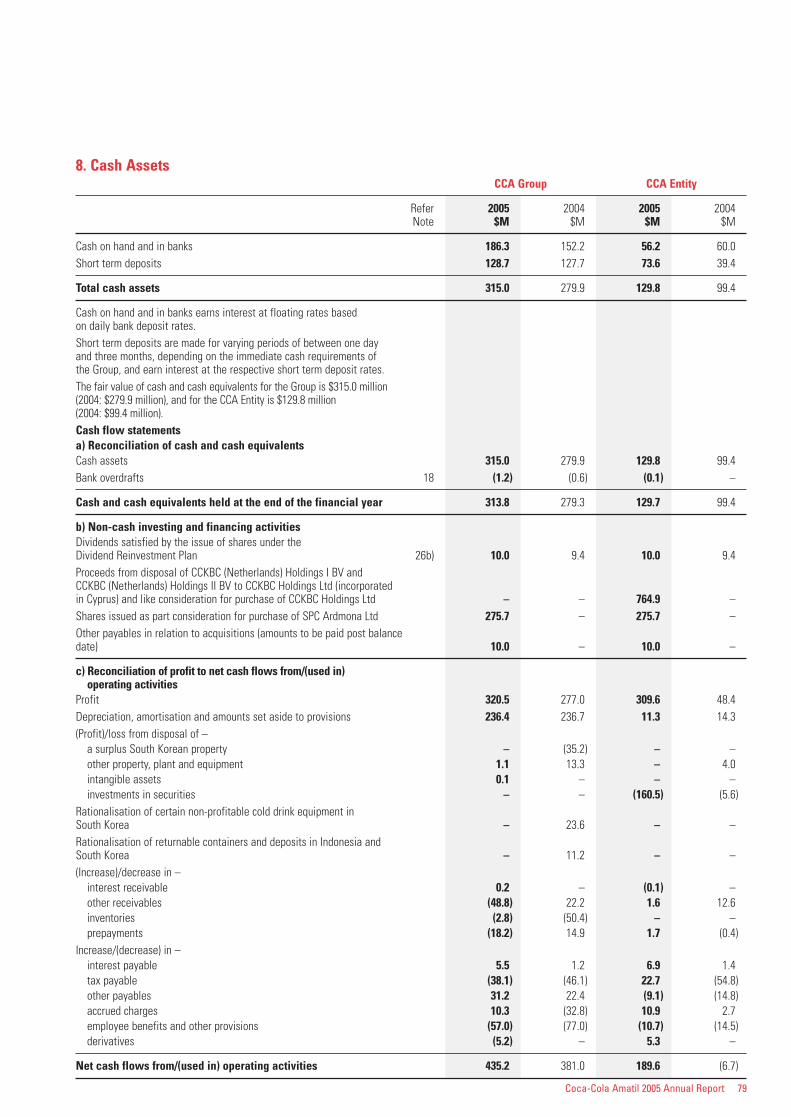
Coca-Cola Amatil 2005 Annual Report 79
8. Cash AssetsCCA Group CCA Entity
Refer 2005 2004 2005 2004Note $M $M $M $M
Cash on hand and in banks 186.3 152.2 56.2 60.0Short term deposits 128.7 127.7 73.6 39.4
Total cash assets 315.0 279.9 129.8 99.4
Cash on hand and in banks earns interest at floating rates based on daily bank deposit rates.Short term deposits are made for varying periods of between one day and three months, depending on the immediate cash requirements of the Group, and earn interest at the respective short term deposit rates.The fair value of cash and cash equivalents for the Group is $315.0 million (2004: $279.9 million), and for the CCA Entity is $129.8 million (2004: $99.4 million).Cash flow statementsa) Reconciliation of cash and cash equivalentsCash assets 315.0 279.9 129.8 99.4Bank overdrafts 18 (1.2) (0.6) (0.1) –
Cash and cash equivalents held at the end of the financial year 313.8 279.3 129.7 99.4
b) Non-cash investing and financing activitiesDividends satisfied by the issue of shares under the Dividend Reinvestment Plan 26b) 10.0 9.4 10.0 9.4Proceeds from disposal of CCKBC (Netherlands) Holdings I BV and CCKBC (Netherlands) Holdings II BV to CCKBC Holdings Ltd (incorporated in Cyprus) and like consideration for purchase of CCKBC Holdings Ltd – – 764.9 –Shares issued as part consideration for purchase of SPC Ardmona Ltd 275.7 – 275.7 –Other payables in relation to acquisitions (amounts to be paid post balance date) 10.0 – 10.0 –
c) Reconciliation of profit to net cash flows from/(used in) operating activities
Profit 320.5 277.0 309.6 48.4Depreciation, amortisation and amounts set aside to provisions 236.4 236.7 11.3 14.3(Profit)/loss from disposal of –
a surplus South Korean property – (35.2) – –other property, plant and equipment 1.1 13.3 – 4.0intangible assets 0.1 – – –investments in securities – – (160.5) (5.6)
Rationalisation of certain non-profitable cold drink equipment in South Korea – 23.6 – –Rationalisation of returnable containers and deposits in Indonesia and South Korea – 11.2 – –(Increase)/decrease in –
interest receivable 0.2 – (0.1) –other receivables (48.8) 22.2 1.6 12.6inventories (2.8) (50.4) – –prepayments (18.2) 14.9 1.7 (0.4)
Increase/(decrease) in –interest payable 5.5 1.2 6.9 1.4tax payable (38.1) (46.1) 22.7 (54.8)other payables 31.2 22.4 (9.1) (14.8)accrued charges 10.3 (32.8) 10.9 2.7employee benefits and other provisions (57.0) (77.0) (10.7) (14.5)derivatives (5.2) – 5.3 –
Net cash flows from/(used in) operating activities 435.2 381.0 189.6 (6.7)
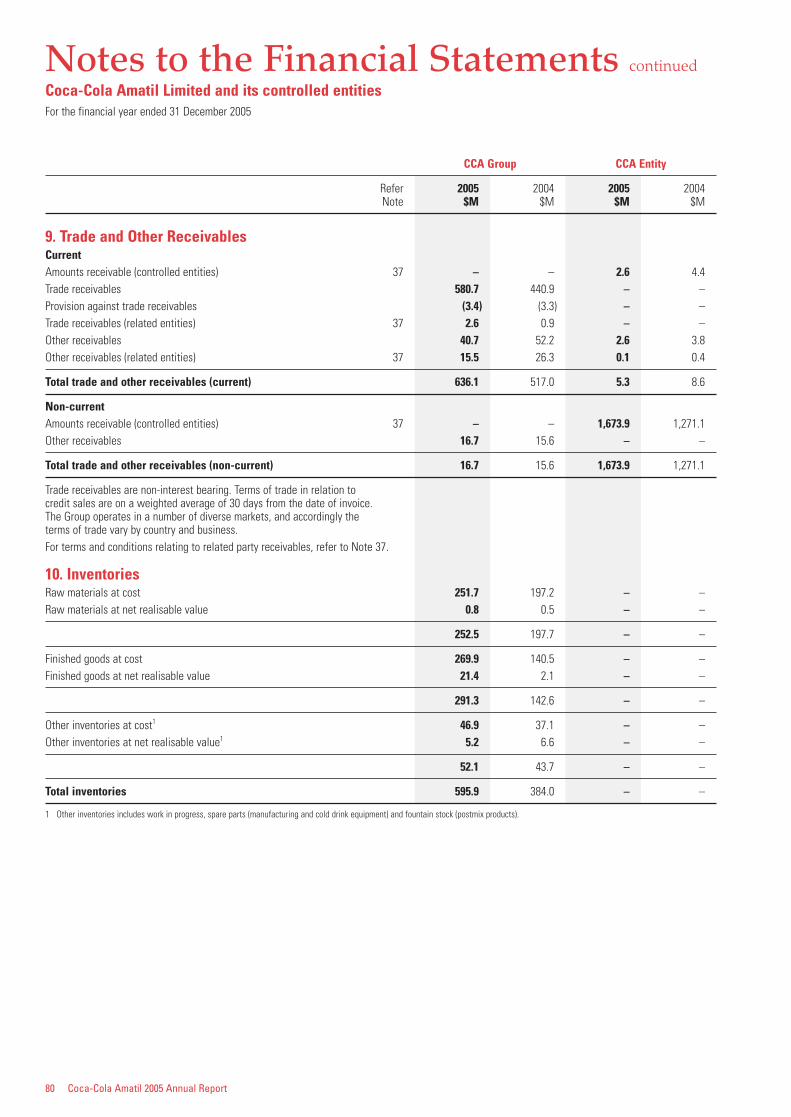
80 Coca-Cola Amatil 2005 Annual Report
Notes to the Financial Statements continued
Coca-Cola Amatil Limited and its controlled entitiesFor the financial year ended 31 December 2005
CCA Group CCA Entity
Refer 2005 2004 2005 2004Note $M $M $M $M
9. Trade and Other ReceivablesCurrentAmounts receivable (controlled entities) 37 – – 2.6 4.4Trade receivables 580.7 440.9 – –Provision against trade receivables (3.4) (3.3) – –Trade receivables (related entities) 37 2.6 0.9 – –Other receivables 40.7 52.2 2.6 3.8Other receivables (related entities) 37 15.5 26.3 0.1 0.4
Total trade and other receivables (current) 636.1 517.0 5.3 8.6
Non-currentAmounts receivable (controlled entities) 37 – – 1,673.9 1,271.1Other receivables 16.7 15.6 – –
Total trade and other receivables (non-current) 16.7 15.6 1,673.9 1,271.1
Trade receivables are non-interest bearing. Terms of trade in relation to credit sales are on a weighted average of 30 days from the date of invoice. The Group operates in a number of diverse markets, and accordingly the terms of trade vary by country and business.For terms and conditions relating to related party receivables, refer to Note 37.
10. InventoriesRaw materials at cost 251.7 197.2 – –Raw materials at net realisable value 0.8 0.5 – –
252.5 197.7 – –
Finished goods at cost 269.9 140.5 – –Finished goods at net realisable value 21.4 2.1 – –
291.3 142.6 – –
Other inventories at cost1 46.9 37.1 – –Other inventories at net realisable value1 5.2 6.6 – –
52.1 43.7 – –
Total inventories 595.9 384.0 – –
1 Other inventories includes work in progress, spare parts (manufacturing and cold drink equipment) and fountain stock (postmix products).
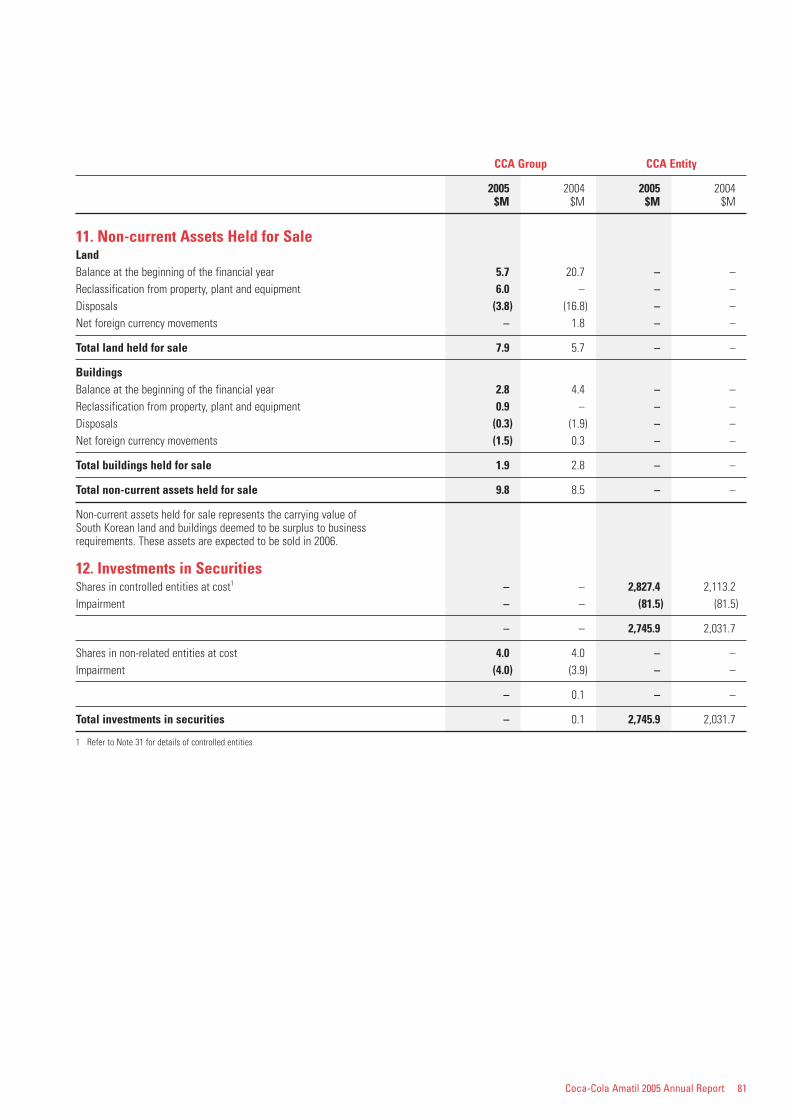
Coca-Cola Amatil 2005 Annual Report 81
CCA Group CCA Entity
2005 2004 2005 2004$M $M $M $M
11. Non-current Assets Held for SaleLandBalance at the beginning of the financial year 5.7 20.7 – –Reclassification from property, plant and equipment 6.0 – – –Disposals (3.8) (16.8) – –Net foreign currency movements – 1.8 – –
Total land held for sale 7.9 5.7 – –
BuildingsBalance at the beginning of the financial year 2.8 4.4 – –Reclassification from property, plant and equipment 0.9 – – –Disposals (0.3) (1.9) – –Net foreign currency movements (1.5) 0.3 – –
Total buildings held for sale 1.9 2.8 – –
Total non-current assets held for sale 9.8 8.5 – –
Non-current assets held for sale represents the carrying value of South Korean land and buildings deemed to be surplus to business requirements. These assets are expected to be sold in 2006.
12. Investments in SecuritiesShares in controlled entities at cost1 – – 2,827.4 2,113.2Impairment – – (81.5) (81.5)
– – 2,745.9 2,031.7
Shares in non-related entities at cost 4.0 4.0 – –Impairment (4.0) (3.9) – –
– 0.1 – –
Total investments in securities – 0.1 2,745.9 2,031.7
1 Refer to Note 31 for details of controlled entities
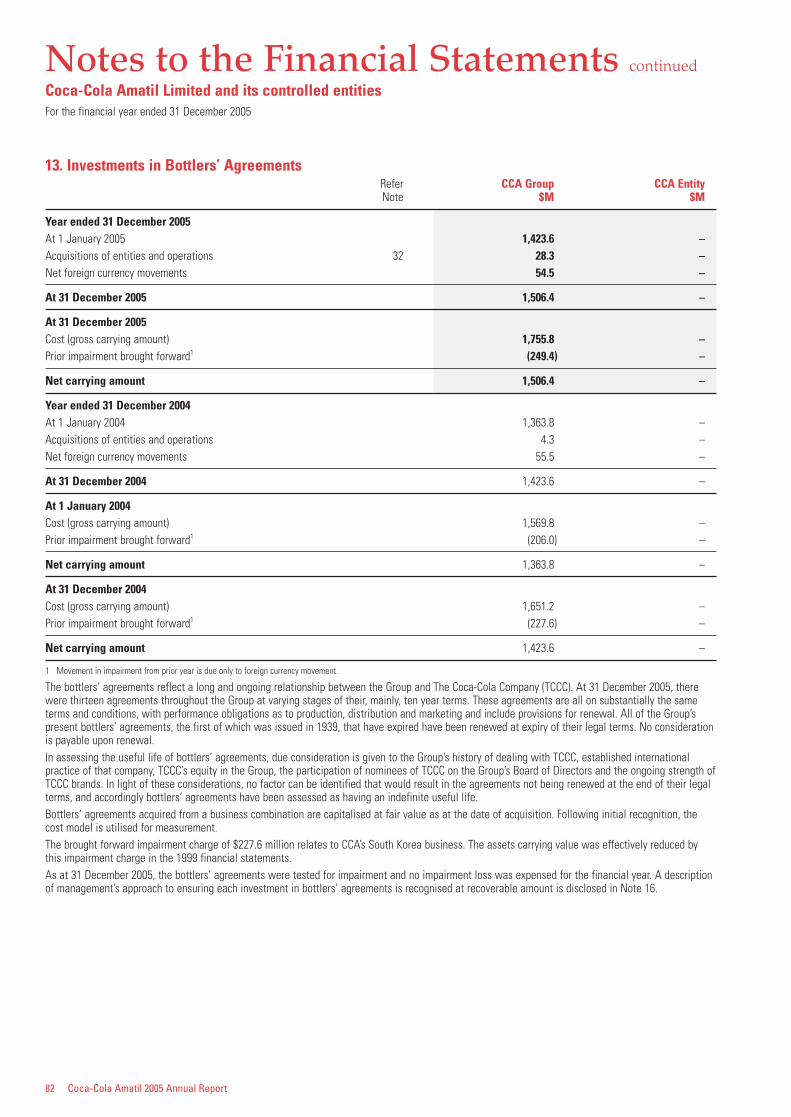
82 Coca-Cola Amatil 2005 Annual Report
Notes to the Financial Statements continued
Coca-Cola Amatil Limited and its controlled entitiesFor the financial year ended 31 December 2005
13. Investments in Bottlers’ AgreementsRefer CCA Group CCA EntityNote $M $M
Year ended 31 December 2005At 1 January 2005 1,423.6 –Acquisitions of entities and operations 32 28.3 –Net foreign currency movements 54.5 –
At 31 December 2005 1,506.4 –
At 31 December 2005Cost (gross carrying amount) 1,755.8 –Prior impairment brought forward1 (249.4) –
Net carrying amount 1,506.4 –
Year ended 31 December 2004At 1 January 2004 1,363.8 –Acquisitions of entities and operations 4.3 –Net foreign currency movements 55.5 –
At 31 December 2004 1,423.6 –
At 1 January 2004Cost (gross carrying amount) 1,569.8 –Prior impairment brought forward1 (206.0) –
Net carrying amount 1,363.8 –
At 31 December 2004Cost (gross carrying amount) 1,651.2 –Prior impairment brought forward1 (227.6) –
Net carrying amount 1,423.6 –
1 Movement in impairment from prior year is due only to foreign currency movement.
The bottlers’ agreements reflect a long and ongoing relationship between the Group and The Coca-Cola Company (TCCC). At 31 December 2005, therewere thirteen agreements throughout the Group at varying stages of their, mainly, ten year terms. These agreements are all on substantially the sameterms and conditions, with performance obligations as to production, distribution and marketing and include provisions for renewal. All of the Group’spresent bottlers’ agreements, the first of which was issued in 1939, that have expired have been renewed at expiry of their legal terms. No considerationis payable upon renewal.In assessing the useful life of bottlers’ agreements, due consideration is given to the Group’s history of dealing with TCCC, established internationalpractice of that company, TCCC’s equity in the Group, the participation of nominees of TCCC on the Group’s Board of Directors and the ongoing strength ofTCCC brands. In light of these considerations, no factor can be identified that would result in the agreements not being renewed at the end of their legalterms, and accordingly bottlers’ agreements have been assessed as having an indefinite useful life.Bottlers’ agreements acquired from a business combination are capitalised at fair value as at the date of acquisition. Following initial recognition, thecost model is utilised for measurement.The brought forward impairment charge of $227.6 million relates to CCA’s South Korea business. The assets carrying value was effectively reduced bythis impairment charge in the 1999 financial statements.As at 31 December 2005, the bottlers’ agreements were tested for impairment and no impairment loss was expensed for the financial year. A descriptionof management’s approach to ensuring each investment in bottlers’ agreements is recognised at recoverable amount is disclosed in Note 16.
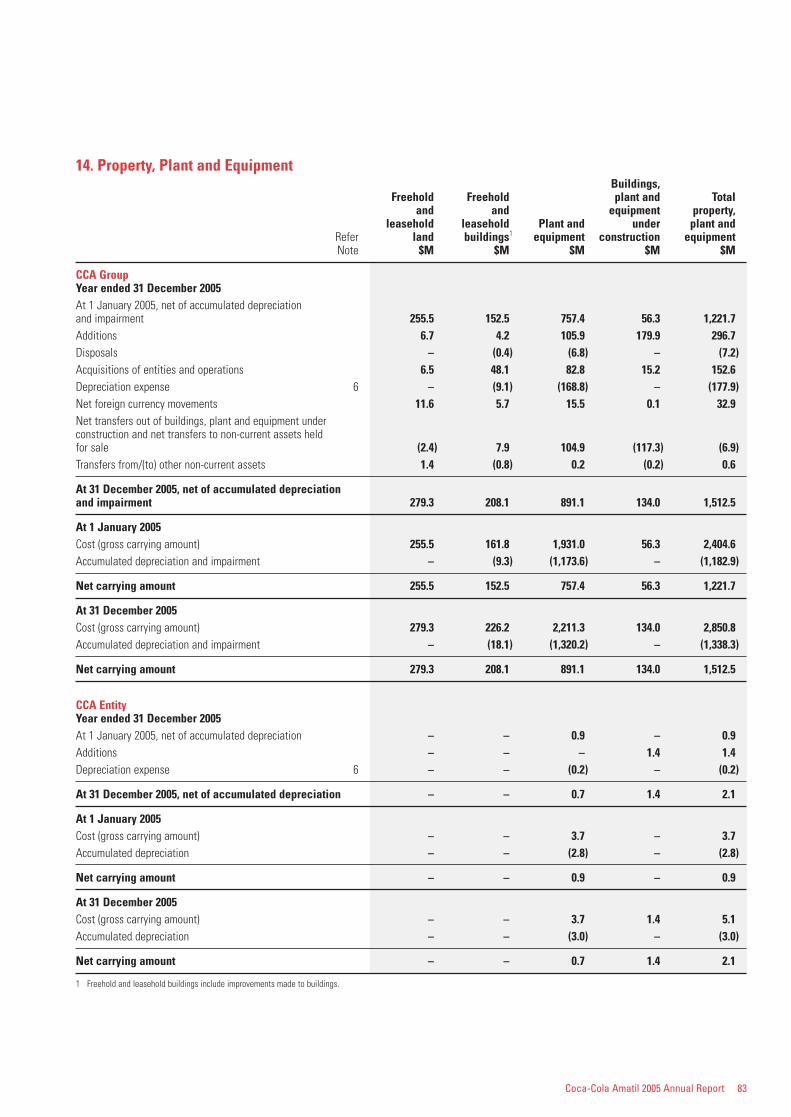
Coca-Cola Amatil 2005 Annual Report 83
14. Property, Plant and EquipmentBuildings,
Freehold Freehold plant and Totaland and equipment property,
leasehold leasehold Plant and under plant andRefer land buildings1 equipment construction equipmentNote $M $M $M $M $M
CCA GroupYear ended 31 December 2005At 1 January 2005, net of accumulated depreciation and impairment 255.5 152.5 757.4 56.3 1,221.7Additions 6.7 4.2 105.9 179.9 296.7Disposals – (0.4) (6.8) – (7.2)Acquisitions of entities and operations 6.5 48.1 82.8 15.2 152.6Depreciation expense 6 – (9.1) (168.8) – (177.9)Net foreign currency movements 11.6 5.7 15.5 0.1 32.9Net transfers out of buildings, plant and equipment under construction and net transfers to non-current assets held for sale (2.4) 7.9 104.9 (117.3) (6.9)Transfers from/(to) other non-current assets 1.4 (0.8) 0.2 (0.2) 0.6
At 31 December 2005, net of accumulated depreciation and impairment 279.3 208.1 891.1 134.0 1,512.5
At 1 January 2005Cost (gross carrying amount) 255.5 161.8 1,931.0 56.3 2,404.6Accumulated depreciation and impairment – (9.3) (1,173.6) – (1,182.9)
Net carrying amount 255.5 152.5 757.4 56.3 1,221.7
At 31 December 2005Cost (gross carrying amount) 279.3 226.2 2,211.3 134.0 2,850.8Accumulated depreciation and impairment – (18.1) (1,320.2) – (1,338.3)
Net carrying amount 279.3 208.1 891.1 134.0 1,512.5
CCA EntityYear ended 31 December 2005At 1 January 2005, net of accumulated depreciation – – 0.9 – 0.9Additions – – – 1.4 1.4Depreciation expense 6 – – (0.2) – (0.2)
At 31 December 2005, net of accumulated depreciation – – 0.7 1.4 2.1
At 1 January 2005Cost (gross carrying amount) – – 3.7 – 3.7Accumulated depreciation – – (2.8) – (2.8)
Net carrying amount – – 0.9 – 0.9
At 31 December 2005Cost (gross carrying amount) – – 3.7 1.4 5.1Accumulated depreciation – – (3.0) – (3.0)
Net carrying amount – – 0.7 1.4 2.1
1 Freehold and leasehold buildings include improvements made to buildings.
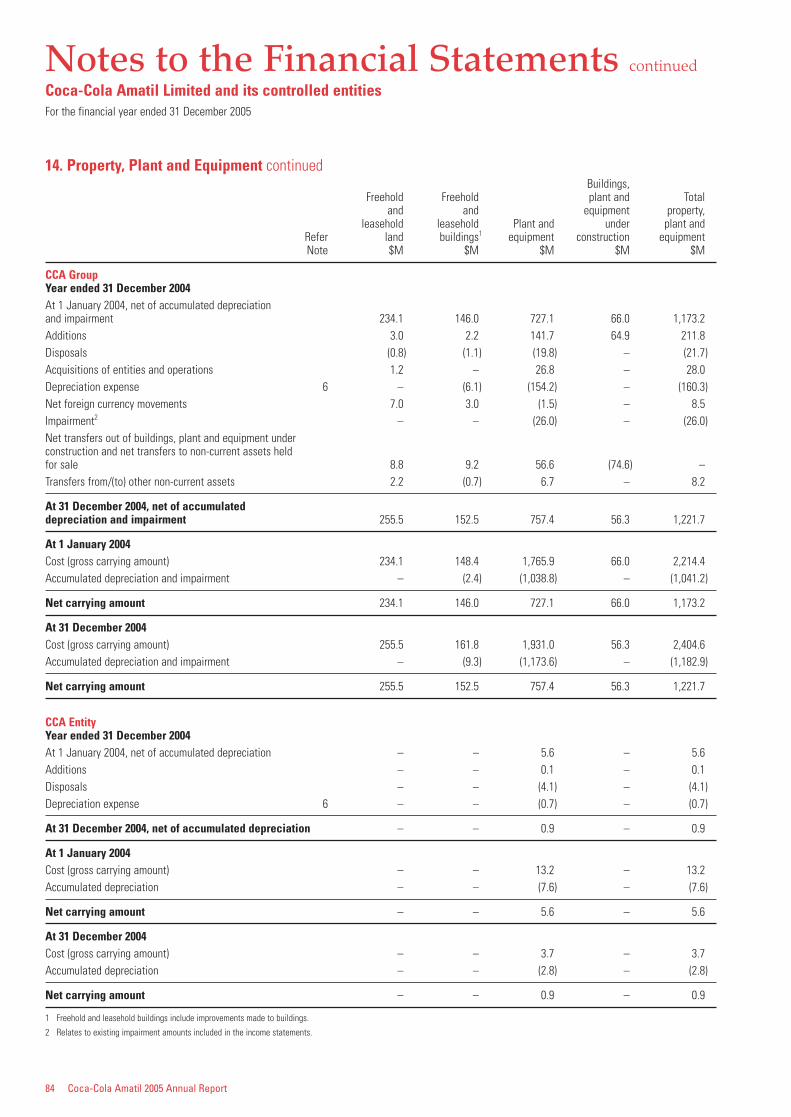
84 Coca-Cola Amatil 2005 Annual Report
Notes to the Financial Statements continued
Coca-Cola Amatil Limited and its controlled entitiesFor the financial year ended 31 December 2005
14. Property, Plant and Equipment continuedBuildings,
Freehold Freehold plant and Totaland and equipment property,
leasehold leasehold Plant and under plant andRefer land buildings1 equipment construction equipmentNote $M $M $M $M $M
CCA GroupYear ended 31 December 2004At 1 January 2004, net of accumulated depreciation and impairment 234.1 146.0 727.1 66.0 1,173.2Additions 3.0 2.2 141.7 64.9 211.8Disposals (0.8) (1.1) (19.8) – (21.7)Acquisitions of entities and operations 1.2 – 26.8 – 28.0Depreciation expense 6 – (6.1) (154.2) – (160.3)Net foreign currency movements 7.0 3.0 (1.5) – 8.5Impairment2 – – (26.0) – (26.0)Net transfers out of buildings, plant and equipment under construction and net transfers to non-current assets held for sale 8.8 9.2 56.6 (74.6) –Transfers from/(to) other non-current assets 2.2 (0.7) 6.7 – 8.2
At 31 December 2004, net of accumulated depreciation and impairment 255.5 152.5 757.4 56.3 1,221.7
At 1 January 2004Cost (gross carrying amount) 234.1 148.4 1,765.9 66.0 2,214.4Accumulated depreciation and impairment – (2.4) (1,038.8) – (1,041.2)
Net carrying amount 234.1 146.0 727.1 66.0 1,173.2
At 31 December 2004Cost (gross carrying amount) 255.5 161.8 1,931.0 56.3 2,404.6Accumulated depreciation and impairment – (9.3) (1,173.6) – (1,182.9)
Net carrying amount 255.5 152.5 757.4 56.3 1,221.7
CCA EntityYear ended 31 December 2004At 1 January 2004, net of accumulated depreciation – – 5.6 – 5.6Additions – – 0.1 – 0.1Disposals – – (4.1) – (4.1)Depreciation expense 6 – – (0.7) – (0.7)
At 31 December 2004, net of accumulated depreciation – – 0.9 – 0.9
At 1 January 2004Cost (gross carrying amount) – – 13.2 – 13.2Accumulated depreciation – – (7.6) – (7.6)
Net carrying amount – – 5.6 – 5.6
At 31 December 2004Cost (gross carrying amount) – – 3.7 – 3.7Accumulated depreciation – – (2.8) – (2.8)
Net carrying amount – – 0.9 – 0.9
1 Freehold and leasehold buildings include improvements made to buildings.
2 Relates to existing impairment amounts included in the income statements.
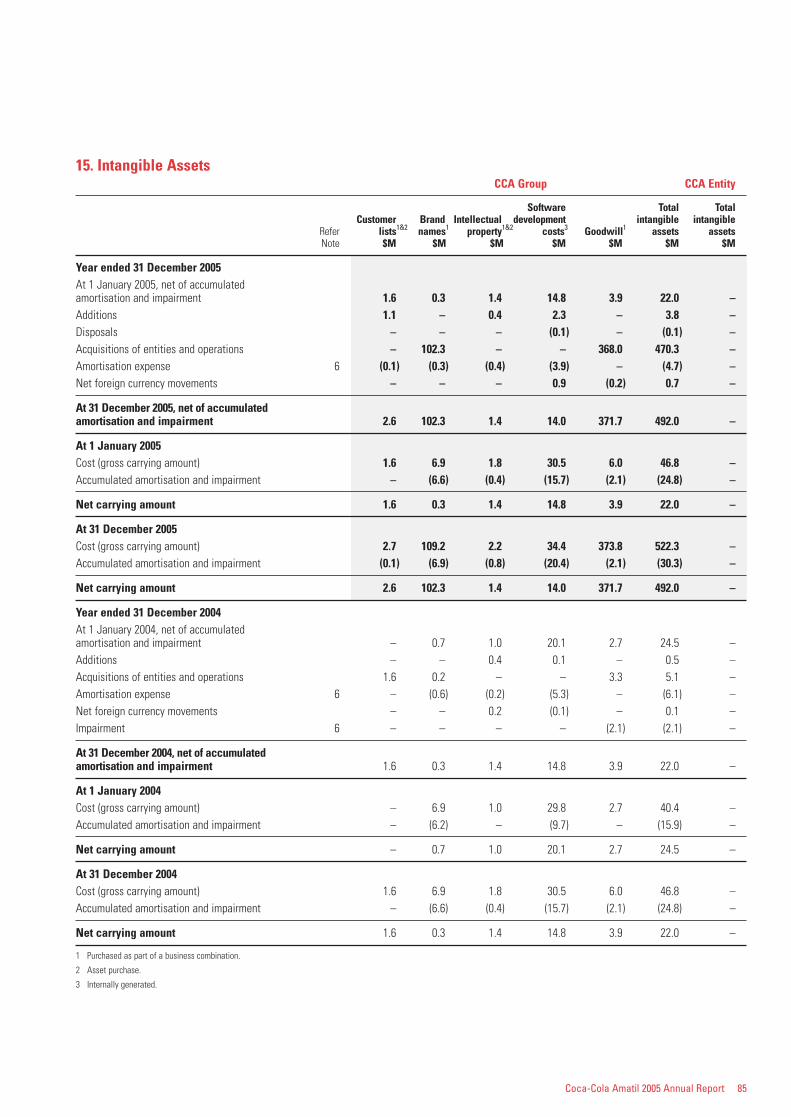
Coca-Cola Amatil 2005 Annual Report 85
15. Intangible AssetsCCA Group CCA Entity
Software Total TotalCustomer Brand Intellectual development intangible intangible
Refer lists1&2 names1 property1&2 costs3 Goodwill1 assets assetsNote $M $M $M $M $M $M $M
Year ended 31 December 2005At 1 January 2005, net of accumulated amortisation and impairment 1.6 0.3 1.4 14.8 3.9 22.0 –Additions 1.1 – 0.4 2.3 – 3.8 –Disposals – – – (0.1) – (0.1) –Acquisitions of entities and operations – 102.3 – – 368.0 470.3 –Amortisation expense 6 (0.1) (0.3) (0.4) (3.9) – (4.7) –Net foreign currency movements – – – 0.9 (0.2) 0.7 –
At 31 December 2005, net of accumulated amortisation and impairment 2.6 102.3 1.4 14.0 371.7 492.0 –
At 1 January 2005Cost (gross carrying amount) 1.6 6.9 1.8 30.5 6.0 46.8 –Accumulated amortisation and impairment – (6.6) (0.4) (15.7) (2.1) (24.8) –
Net carrying amount 1.6 0.3 1.4 14.8 3.9 22.0 –
At 31 December 2005Cost (gross carrying amount) 2.7 109.2 2.2 34.4 373.8 522.3 –Accumulated amortisation and impairment (0.1) (6.9) (0.8) (20.4) (2.1) (30.3) –
Net carrying amount 2.6 102.3 1.4 14.0 371.7 492.0 –
Year ended 31 December 2004At 1 January 2004, net of accumulated amortisation and impairment – 0.7 1.0 20.1 2.7 24.5 –Additions – – 0.4 0.1 – 0.5 –Acquisitions of entities and operations 1.6 0.2 – – 3.3 5.1 –Amortisation expense 6 – (0.6) (0.2) (5.3) – (6.1) –Net foreign currency movements – – 0.2 (0.1) – 0.1 –Impairment 6 – – – – (2.1) (2.1) –
At 31 December 2004, net of accumulatedamortisation and impairment 1.6 0.3 1.4 14.8 3.9 22.0 –
At 1 January 2004Cost (gross carrying amount) – 6.9 1.0 29.8 2.7 40.4 –Accumulated amortisation and impairment – (6.2) – (9.7) – (15.9) –
Net carrying amount – 0.7 1.0 20.1 2.7 24.5 –
At 31 December 2004Cost (gross carrying amount) 1.6 6.9 1.8 30.5 6.0 46.8 –Accumulated amortisation and impairment – (6.6) (0.4) (15.7) (2.1) (24.8) –
Net carrying amount 1.6 0.3 1.4 14.8 3.9 22.0 –
1 Purchased as part of a business combination.
2 Asset purchase.
3 Internally generated.
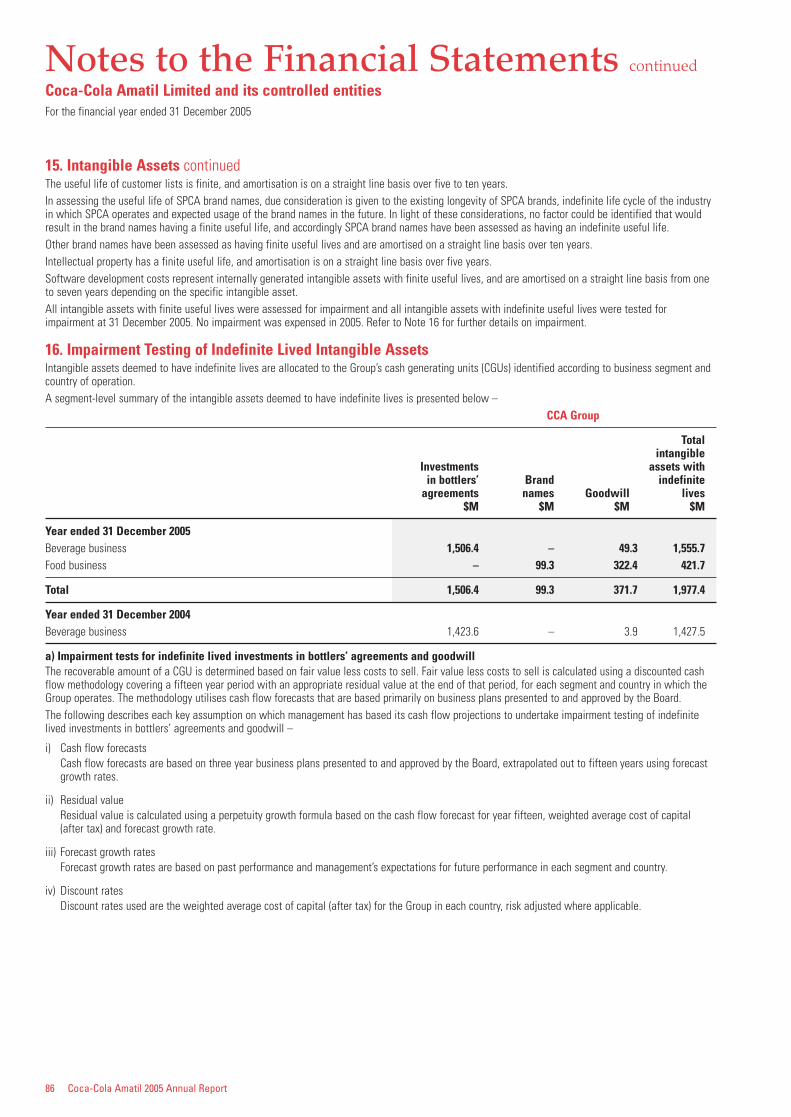
86 Coca-Cola Amatil 2005 Annual Report
Notes to the Financial Statements continued
Coca-Cola Amatil Limited and its controlled entitiesFor the financial year ended 31 December 2005
15. Intangible Assets continuedThe useful life of customer lists is finite, and amortisation is on a straight line basis over five to ten years.In assessing the useful life of SPCA brand names, due consideration is given to the existing longevity of SPCA brands, indefinite life cycle of the industryin which SPCA operates and expected usage of the brand names in the future. In light of these considerations, no factor could be identified that wouldresult in the brand names having a finite useful life, and accordingly SPCA brand names have been assessed as having an indefinite useful life.Other brand names have been assessed as having finite useful lives and are amortised on a straight line basis over ten years.Intellectual property has a finite useful life, and amortisation is on a straight line basis over five years.Software development costs represent internally generated intangible assets with finite useful lives, and are amortised on a straight line basis from oneto seven years depending on the specific intangible asset.All intangible assets with finite useful lives were assessed for impairment and all intangible assets with indefinite useful lives were tested forimpairment at 31 December 2005. No impairment was expensed in 2005. Refer to Note 16 for further details on impairment.
16. Impairment Testing of Indefinite Lived Intangible AssetsIntangible assets deemed to have indefinite lives are allocated to the Group’s cash generating units (CGUs) identified according to business segment andcountry of operation.A segment-level summary of the intangible assets deemed to have indefinite lives is presented below –
CCA Group
Totalintangible
Investments assets within bottlers’ Brand indefinite
agreements names Goodwill lives$M $M $M $M
Year ended 31 December 2005Beverage business 1,506.4 – 49.3 1,555.7Food business – 99.3 322.4 421.7
Total 1,506.4 99.3 371.7 1,977.4
Year ended 31 December 2004Beverage business 1,423.6 – 3.9 1,427.5
a) Impairment tests for indefinite lived investments in bottlers’ agreements and goodwillThe recoverable amount of a CGU is determined based on fair value less costs to sell. Fair value less costs to sell is calculated using a discounted cashflow methodology covering a fifteen year period with an appropriate residual value at the end of that period, for each segment and country in which theGroup operates. The methodology utilises cash flow forecasts that are based primarily on business plans presented to and approved by the Board.The following describes each key assumption on which management has based its cash flow projections to undertake impairment testing of indefinitelived investments in bottlers’ agreements and goodwill –
i) Cash flow forecastsCash flow forecasts are based on three year business plans presented to and approved by the Board, extrapolated out to fifteen years using forecastgrowth rates.
ii) Residual valueResidual value is calculated using a perpetuity growth formula based on the cash flow forecast for year fifteen, weighted average cost of capital(after tax) and forecast growth rate.
iii) Forecast growth ratesForecast growth rates are based on past performance and management’s expectations for future performance in each segment and country.
iv) Discount ratesDiscount rates used are the weighted average cost of capital (after tax) for the Group in each country, risk adjusted where applicable.
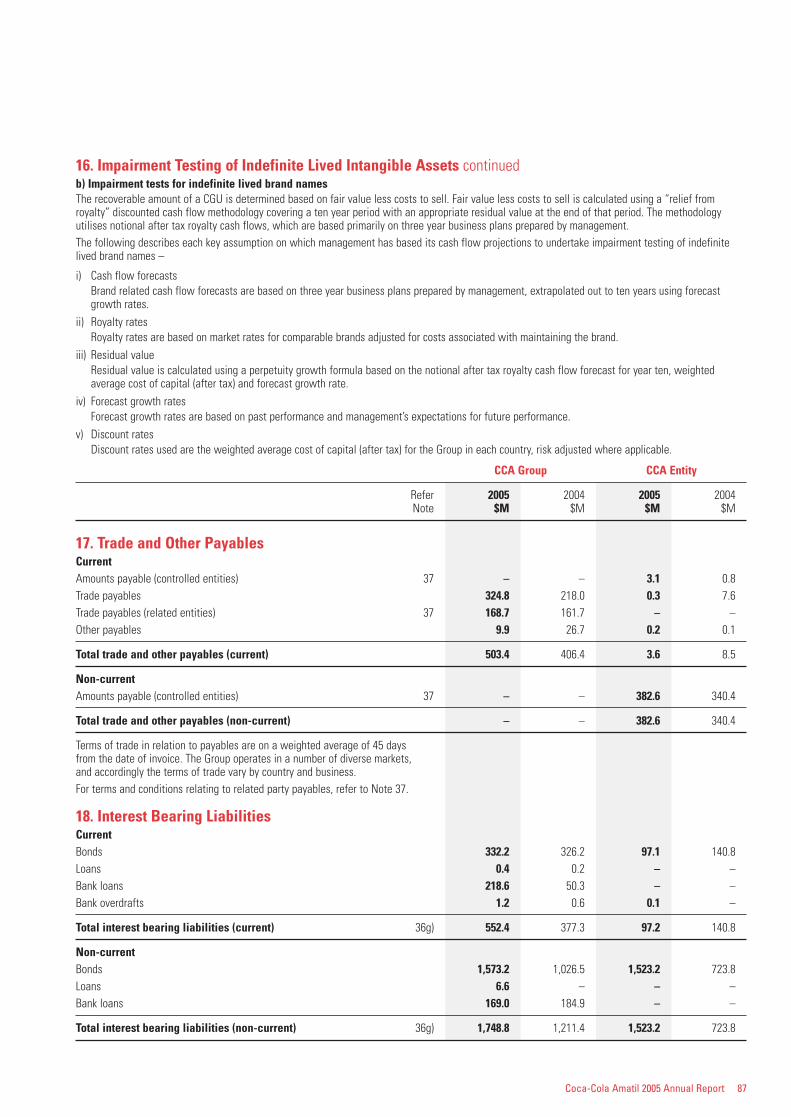
Coca-Cola Amatil 2005 Annual Report 87
16. Impairment Testing of Indefinite Lived Intangible Assets continuedb) Impairment tests for indefinite lived brand namesThe recoverable amount of a CGU is determined based on fair value less costs to sell. Fair value less costs to sell is calculated using a “relief fromroyalty” discounted cash flow methodology covering a ten year period with an appropriate residual value at the end of that period. The methodologyutilises notional after tax royalty cash flows, which are based primarily on three year business plans prepared by management.The following describes each key assumption on which management has based its cash flow projections to undertake impairment testing of indefinitelived brand names –
i) Cash flow forecastsBrand related cash flow forecasts are based on three year business plans prepared by management, extrapolated out to ten years using forecastgrowth rates.
ii) Royalty ratesRoyalty rates are based on market rates for comparable brands adjusted for costs associated with maintaining the brand.
iii) Residual valueResidual value is calculated using a perpetuity growth formula based on the notional after tax royalty cash flow forecast for year ten, weightedaverage cost of capital (after tax) and forecast growth rate.
iv) Forecast growth ratesForecast growth rates are based on past performance and management’s expectations for future performance.
v) Discount ratesDiscount rates used are the weighted average cost of capital (after tax) for the Group in each country, risk adjusted where applicable.
CCA Group CCA Entity
Refer 2005 2004 2005 2004Note $M $M $M $M
17. Trade and Other PayablesCurrentAmounts payable (controlled entities) 37 – – 3.1 0.8Trade payables 324.8 218.0 0.3 7.6Trade payables (related entities) 37 168.7 161.7 – –Other payables 9.9 26.7 0.2 0.1
Total trade and other payables (current) 503.4 406.4 3.6 8.5
Non-currentAmounts payable (controlled entities) 37 – – 382.6 340.4
Total trade and other payables (non-current) – – 382.6 340.4
Terms of trade in relation to payables are on a weighted average of 45 days from the date of invoice. The Group operates in a number of diverse markets, and accordingly the terms of trade vary by country and business.For terms and conditions relating to related party payables, refer to Note 37.
18. Interest Bearing LiabilitiesCurrentBonds 332.2 326.2 97.1 140.8Loans 0.4 0.2 – –Bank loans 218.6 50.3 – –Bank overdrafts 1.2 0.6 0.1 –
Total interest bearing liabilities (current) 36g) 552.4 377.3 97.2 140.8
Non-currentBonds 1,573.2 1,026.5 1,523.2 723.8Loans 6.6 – – –Bank loans 169.0 184.9 – –
Total interest bearing liabilities (non-current) 36g) 1,748.8 1,211.4 1,523.2 723.8
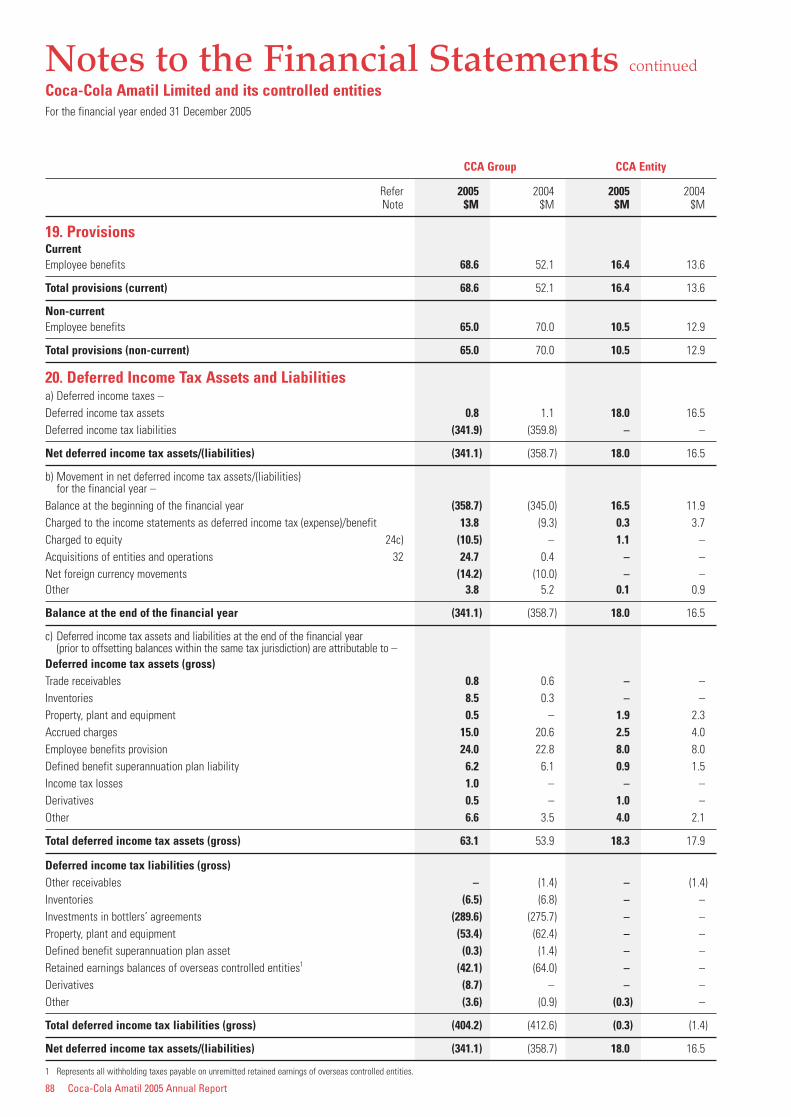
88 Coca-Cola Amatil 2005 Annual Report
Notes to the Financial Statements continued
Coca-Cola Amatil Limited and its controlled entitiesFor the financial year ended 31 December 2005
CCA Group CCA Entity
Refer 2005 2004 2005 2004Note $M $M $M $M
19. ProvisionsCurrentEmployee benefits 68.6 52.1 16.4 13.6
Total provisions (current) 68.6 52.1 16.4 13.6
Non-currentEmployee benefits 65.0 70.0 10.5 12.9
Total provisions (non-current) 65.0 70.0 10.5 12.9
20. Deferred Income Tax Assets and Liabilitiesa) Deferred income taxes –Deferred income tax assets 0.8 1.1 18.0 16.5Deferred income tax liabilities (341.9) (359.8) – –
Net deferred income tax assets/(liabilities) (341.1) (358.7) 18.0 16.5
b) Movement in net deferred income tax assets/(liabilities) for the financial year –
Balance at the beginning of the financial year (358.7) (345.0) 16.5 11.9Charged to the income statements as deferred income tax (expense)/benefit 13.8 (9.3) 0.3 3.7Charged to equity 24c) (10.5) – 1.1 –Acquisitions of entities and operations 32 24.7 0.4 – –Net foreign currency movements (14.2) (10.0) – –Other 3.8 5.2 0.1 0.9
Balance at the end of the financial year (341.1) (358.7) 18.0 16.5
c) Deferred income tax assets and liabilities at the end of the financial year (prior to offsetting balances within the same tax jurisdiction) are attributable to –
Deferred income tax assets (gross)Trade receivables 0.8 0.6 – –Inventories 8.5 0.3 – –Property, plant and equipment 0.5 – 1.9 2.3Accrued charges 15.0 20.6 2.5 4.0Employee benefits provision 24.0 22.8 8.0 8.0Defined benefit superannuation plan liability 6.2 6.1 0.9 1.5Income tax losses 1.0 – – –Derivatives 0.5 – 1.0 –Other 6.6 3.5 4.0 2.1
Total deferred income tax assets (gross) 63.1 53.9 18.3 17.9
Deferred income tax liabilities (gross)Other receivables – (1.4) – (1.4)Inventories (6.5) (6.8) – –Investments in bottlers’ agreements (289.6) (275.7) – –Property, plant and equipment (53.4) (62.4) – –Defined benefit superannuation plan asset (0.3) (1.4) – –Retained earnings balances of overseas controlled entities1 (42.1) (64.0) – –Derivatives (8.7) – – –Other (3.6) (0.9) (0.3) –
Total deferred income tax liabilities (gross) (404.2) (412.6) (0.3) (1.4)
Net deferred income tax assets/(liabilities) (341.1) (358.7) 18.0 16.5
1 Represents all withholding taxes payable on unremitted retained earnings of overseas controlled entities.
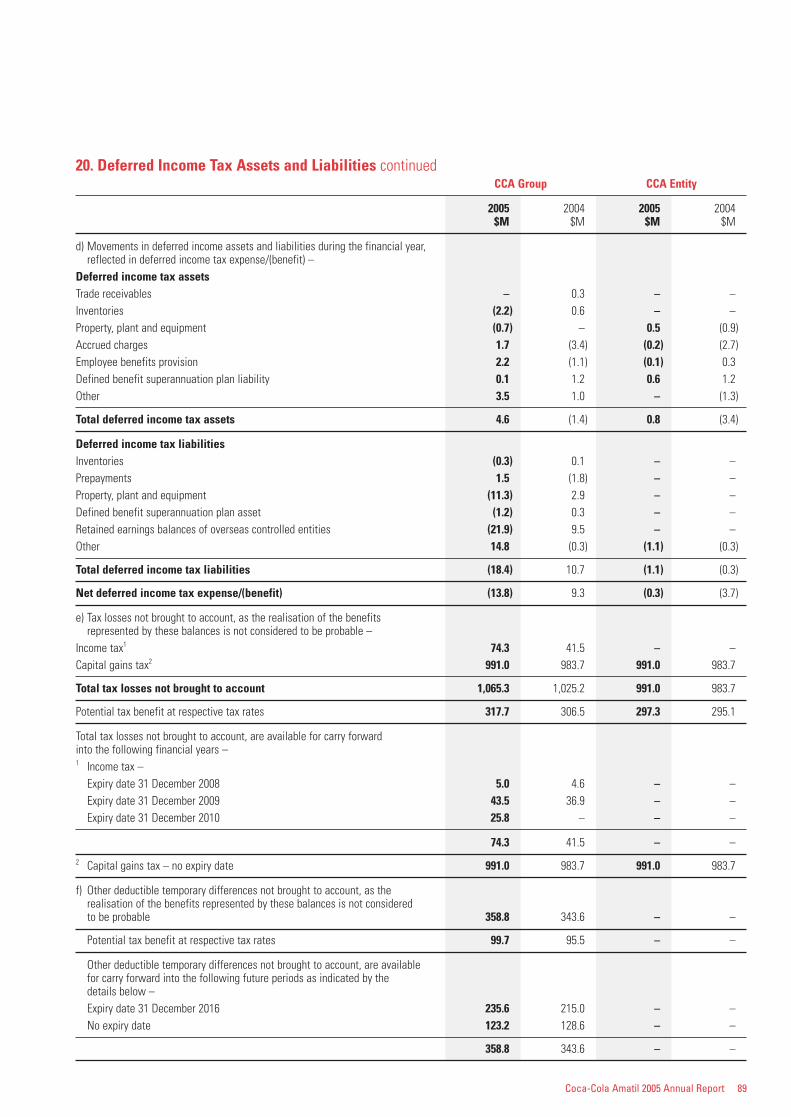
Coca-Cola Amatil 2005 Annual Report 89
20. Deferred Income Tax Assets and Liabilities continuedCCA Group CCA Entity
2005 2004 2005 2004$M $M $M $M
d) Movements in deferred income assets and liabilities during the financial year, reflected in deferred income tax expense/(benefit) –
Deferred income tax assetsTrade receivables – 0.3 – –Inventories (2.2) 0.6 – –Property, plant and equipment (0.7) – 0.5 (0.9)Accrued charges 1.7 (3.4) (0.2) (2.7)Employee benefits provision 2.2 (1.1) (0.1) 0.3Defined benefit superannuation plan liability 0.1 1.2 0.6 1.2Other 3.5 1.0 – (1.3)
Total deferred income tax assets 4.6 (1.4) 0.8 (3.4)
Deferred income tax liabilitiesInventories (0.3) 0.1 – –Prepayments 1.5 (1.8) – –Property, plant and equipment (11.3) 2.9 – –Defined benefit superannuation plan asset (1.2) 0.3 – –Retained earnings balances of overseas controlled entities (21.9) 9.5 – –Other 14.8 (0.3) (1.1) (0.3)
Total deferred income tax liabilities (18.4) 10.7 (1.1) (0.3)
Net deferred income tax expense/(benefit) (13.8) 9.3 (0.3) (3.7)
e) Tax losses not brought to account, as the realisation of the benefits represented by these balances is not considered to be probable –
Income tax1 74.3 41.5 – –Capital gains tax2 991.0 983.7 991.0 983.7
Total tax losses not brought to account 1,065.3 1,025.2 991.0 983.7
Potential tax benefit at respective tax rates 317.7 306.5 297.3 295.1
Total tax losses not brought to account, are available for carry forward into the following financial years –1 Income tax –
Expiry date 31 December 2008 5.0 4.6 – –Expiry date 31 December 2009 43.5 36.9 – –Expiry date 31 December 2010 25.8 – – –
74.3 41.5 – –
2 Capital gains tax – no expiry date 991.0 983.7 991.0 983.7
f) Other deductible temporary differences not brought to account, as the realisation of the benefits represented by these balances is not considered to be probable 358.8 343.6 – –
Potential tax benefit at respective tax rates 99.7 95.5 – –
Other deductible temporary differences not brought to account, are available for carry forward into the following future periods as indicated by the details below –Expiry date 31 December 2016 235.6 215.0 – –No expiry date 123.2 128.6 – –
358.8 343.6 – –
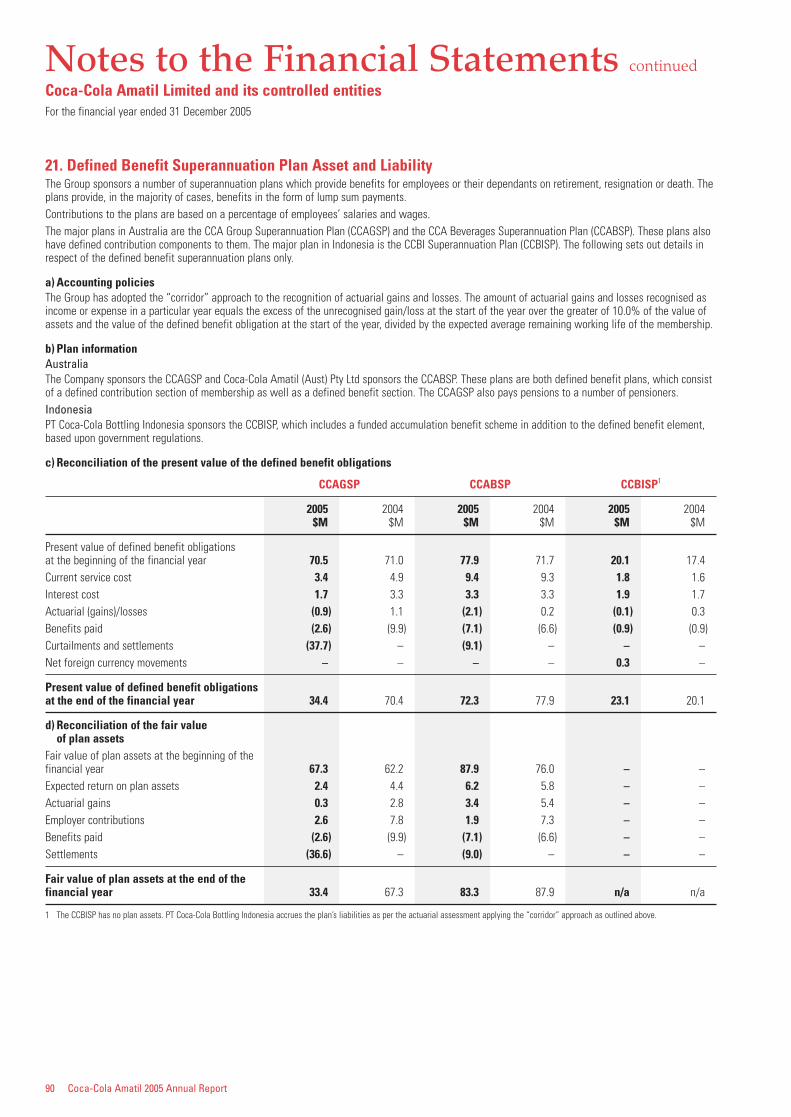
90 Coca-Cola Amatil 2005 Annual Report
Notes to the Financial Statements continued
Coca-Cola Amatil Limited and its controlled entitiesFor the financial year ended 31 December 2005
21. Defined Benefit Superannuation Plan Asset and LiabilityThe Group sponsors a number of superannuation plans which provide benefits for employees or their dependants on retirement, resignation or death. Theplans provide, in the majority of cases, benefits in the form of lump sum payments.Contributions to the plans are based on a percentage of employees’ salaries and wages.The major plans in Australia are the CCA Group Superannuation Plan (CCAGSP) and the CCA Beverages Superannuation Plan (CCABSP). These plans alsohave defined contribution components to them. The major plan in Indonesia is the CCBI Superannuation Plan (CCBISP). The following sets out details inrespect of the defined benefit superannuation plans only.
a) Accounting policiesThe Group has adopted the “corridor” approach to the recognition of actuarial gains and losses. The amount of actuarial gains and losses recognised asincome or expense in a particular year equals the excess of the unrecognised gain/loss at the start of the year over the greater of 10.0% of the value ofassets and the value of the defined benefit obligation at the start of the year, divided by the expected average remaining working life of the membership.
b) Plan informationAustraliaThe Company sponsors the CCAGSP and Coca-Cola Amatil (Aust) Pty Ltd sponsors the CCABSP. These plans are both defined benefit plans, which consistof a defined contribution section of membership as well as a defined benefit section. The CCAGSP also pays pensions to a number of pensioners.IndonesiaPT Coca-Cola Bottling Indonesia sponsors the CCBISP, which includes a funded accumulation benefit scheme in addition to the defined benefit element,based upon government regulations.
c) Reconciliation of the present value of the defined benefit obligations
CCAGSP CCABSP CCBISP1
2005 2004 2005 2004 2005 2004$M $M $M $M $M $M
Present value of defined benefit obligations at the beginning of the financial year 70.5 71.0 77.9 71.7 20.1 17.4Current service cost 3.4 4.9 9.4 9.3 1.8 1.6Interest cost 1.7 3.3 3.3 3.3 1.9 1.7Actuarial (gains)/losses (0.9) 1.1 (2.1) 0.2 (0.1) 0.3Benefits paid (2.6) (9.9) (7.1) (6.6) (0.9) (0.9)Curtailments and settlements (37.7) – (9.1) – – –Net foreign currency movements – – – – 0.3 –
Present value of defined benefit obligations at the end of the financial year 34.4 70.4 72.3 77.9 23.1 20.1
d) Reconciliation of the fair value of plan assets
Fair value of plan assets at the beginning of the financial year 67.3 62.2 87.9 76.0 – –Expected return on plan assets 2.4 4.4 6.2 5.8 – –Actuarial gains 0.3 2.8 3.4 5.4 – –Employer contributions 2.6 7.8 1.9 7.3 – –Benefits paid (2.6) (9.9) (7.1) (6.6) – –Settlements (36.6) – (9.0) – – –
Fair value of plan assets at the end of the financial year 33.4 67.3 83.3 87.9 n/a n/a
1 The CCBISP has no plan assets. PT Coca-Cola Bottling Indonesia accrues the plan’s liabilities as per the actuarial assessment applying the “corridor” approach as outlined above.
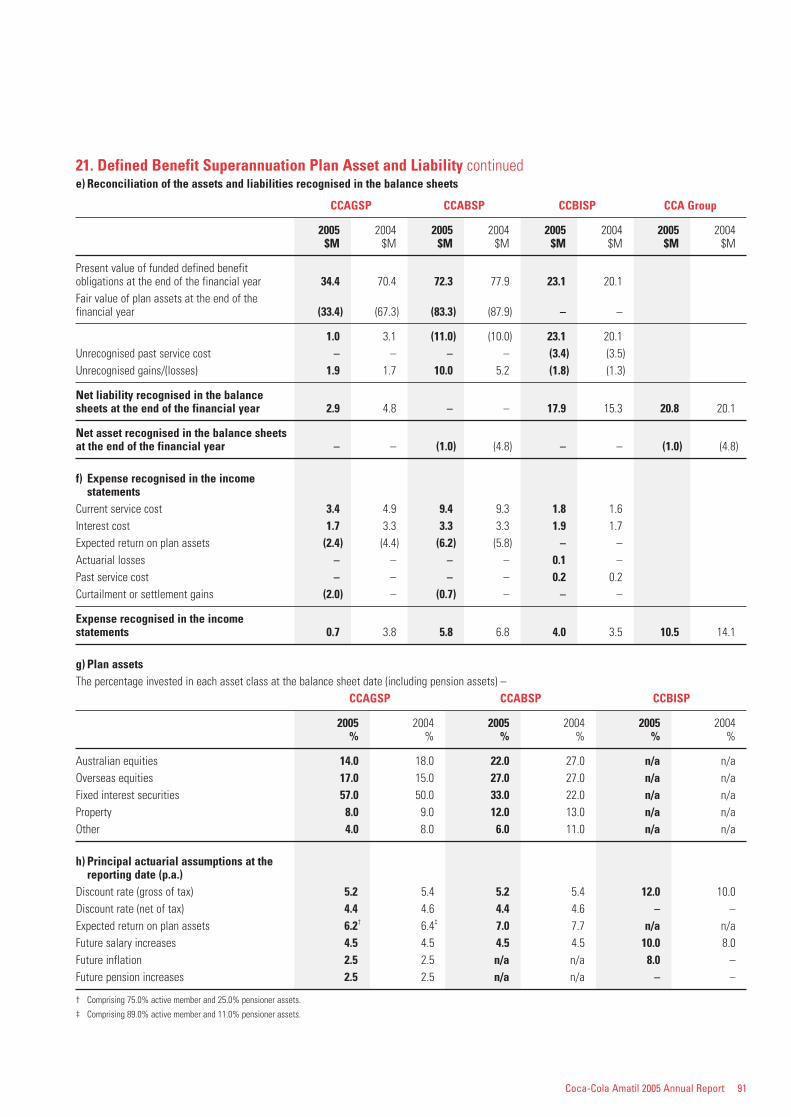
Coca-Cola Amatil 2005 Annual Report 91
21. Defined Benefit Superannuation Plan Asset and Liability continuede) Reconciliation of the assets and liabilities recognised in the balance sheets
CCAGSP CCABSP CCBISP CCA Group
2005 2004 2005 2004 2005 2004 2005 2004$M $M $M $M $M $M $M $M
Present value of funded defined benefit obligations at the end of the financial year 34.4 70.4 72.3 77.9 23.1 20.1Fair value of plan assets at the end of the financial year (33.4) (67.3) (83.3) (87.9) – –
1.0 3.1 (11.0) (10.0) 23.1 20.1Unrecognised past service cost – – – – (3.4) (3.5)Unrecognised gains/(losses) 1.9 1.7 10.0 5.2 (1.8) (1.3)
Net liability recognised in the balance sheets at the end of the financial year 2.9 4.8 – – 17.9 15.3 20.8 20.1
Net asset recognised in the balance sheets at the end of the financial year – – (1.0) (4.8) – – (1.0) (4.8)
f) Expense recognised in the income statements
Current service cost 3.4 4.9 9.4 9.3 1.8 1.6Interest cost 1.7 3.3 3.3 3.3 1.9 1.7Expected return on plan assets (2.4) (4.4) (6.2) (5.8) – –Actuarial losses – – – – 0.1 –Past service cost – – – – 0.2 0.2Curtailment or settlement gains (2.0) – (0.7) – – –
Expense recognised in the income statements 0.7 3.8 5.8 6.8 4.0 3.5 10.5 14.1
g) Plan assetsThe percentage invested in each asset class at the balance sheet date (including pension assets) –
CCAGSP CCABSP CCBISP
2005 2004 2005 2004 2005 2004% % % % % %
Australian equities 14.0 18.0 22.0 27.0 n/a n/aOverseas equities 17.0 15.0 27.0 27.0 n/a n/aFixed interest securities 57.0 50.0 33.0 22.0 n/a n/aProperty 8.0 9.0 12.0 13.0 n/a n/aOther 4.0 8.0 6.0 11.0 n/a n/a
h) Principal actuarial assumptions at the reporting date (p.a.)
Discount rate (gross of tax) 5.2 5.4 5.2 5.4 12.0 10.0Discount rate (net of tax) 4.4 4.6 4.4 4.6 – –Expected return on plan assets 6.2† 6.4‡ 7.0 7.7 n/a n/aFuture salary increases 4.5 4.5 4.5 4.5 10.0 8.0Future inflation 2.5 2.5 n/a n/a 8.0 –Future pension increases 2.5 2.5 n/a n/a – –
† Comprising 75.0% active member and 25.0% pensioner assets.
‡ Comprising 89.0% active member and 11.0% pensioner assets.
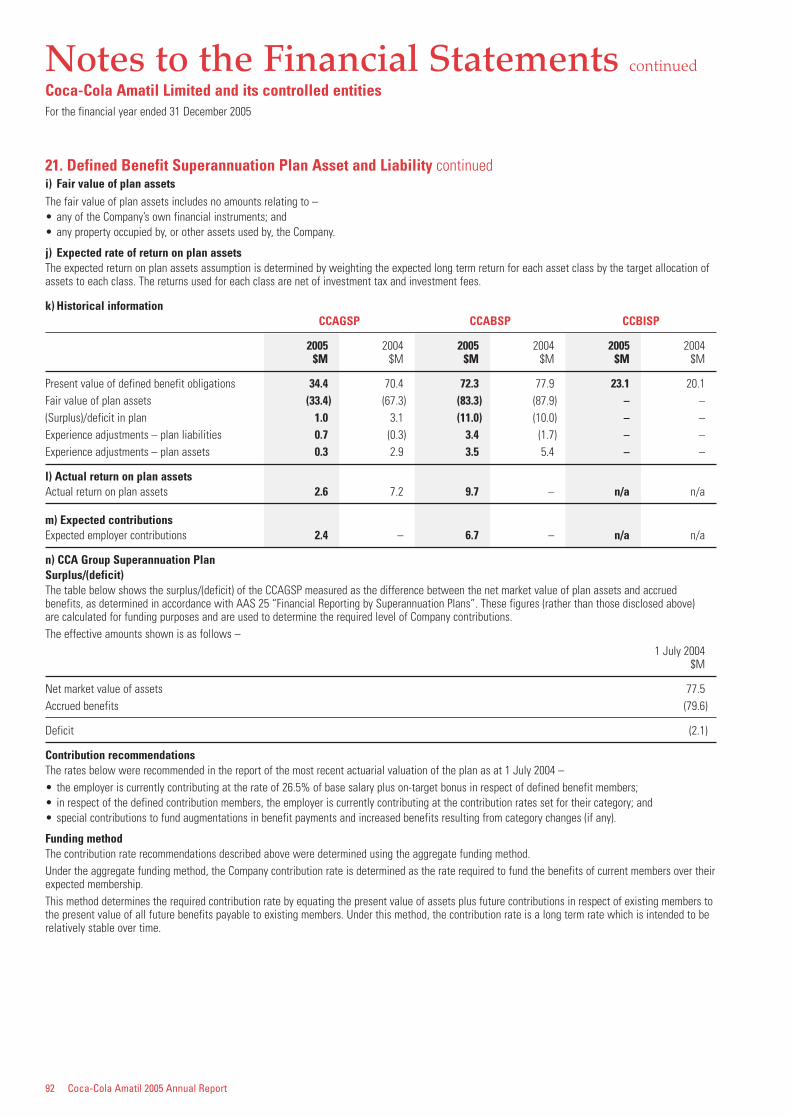
92 Coca-Cola Amatil 2005 Annual Report
Notes to the Financial Statements continued
Coca-Cola Amatil Limited and its controlled entitiesFor the financial year ended 31 December 2005
21. Defined Benefit Superannuation Plan Asset and Liability continuedi) Fair value of plan assetsThe fair value of plan assets includes no amounts relating to –• any of the Company’s own financial instruments; and• any property occupied by, or other assets used by, the Company.
j) Expected rate of return on plan assetsThe expected return on plan assets assumption is determined by weighting the expected long term return for each asset class by the target allocation ofassets to each class. The returns used for each class are net of investment tax and investment fees.
k) Historical informationCCAGSP CCABSP CCBISP
2005 2004 2005 2004 2005 2004$M $M $M $M $M $M
Present value of defined benefit obligations 34.4 70.4 72.3 77.9 23.1 20.1Fair value of plan assets (33.4) (67.3) (83.3) (87.9) – –(Surplus)/deficit in plan 1.0 3.1 (11.0) (10.0) – –Experience adjustments – plan liabilities 0.7 (0.3) 3.4 (1.7) – –Experience adjustments – plan assets 0.3 2.9 3.5 5.4 – –
l) Actual return on plan assetsActual return on plan assets 2.6 7.2 9.7 – n/a n/a
m) Expected contributionsExpected employer contributions 2.4 – 6.7 – n/a n/a
n) CCA Group Superannuation PlanSurplus/(deficit)The table below shows the surplus/(deficit) of the CCAGSP measured as the difference between the net market value of plan assets and accruedbenefits, as determined in accordance with AAS 25 “Financial Reporting by Superannuation Plans”. These figures (rather than those disclosed above) are calculated for funding purposes and are used to determine the required level of Company contributions.The effective amounts shown is as follows –
1 July 2004$M
Net market value of assets 77.5Accrued benefits (79.6)
Deficit (2.1)
Contribution recommendationsThe rates below were recommended in the report of the most recent actuarial valuation of the plan as at 1 July 2004 –• the employer is currently contributing at the rate of 26.5% of base salary plus on-target bonus in respect of defined benefit members;• in respect of the defined contribution members, the employer is currently contributing at the contribution rates set for their category; and• special contributions to fund augmentations in benefit payments and increased benefits resulting from category changes (if any).
Funding methodThe contribution rate recommendations described above were determined using the aggregate funding method.Under the aggregate funding method, the Company contribution rate is determined as the rate required to fund the benefits of current members over theirexpected membership.This method determines the required contribution rate by equating the present value of assets plus future contributions in respect of existing members tothe present value of all future benefits payable to existing members. Under this method, the contribution rate is a long term rate which is intended to berelatively stable over time.
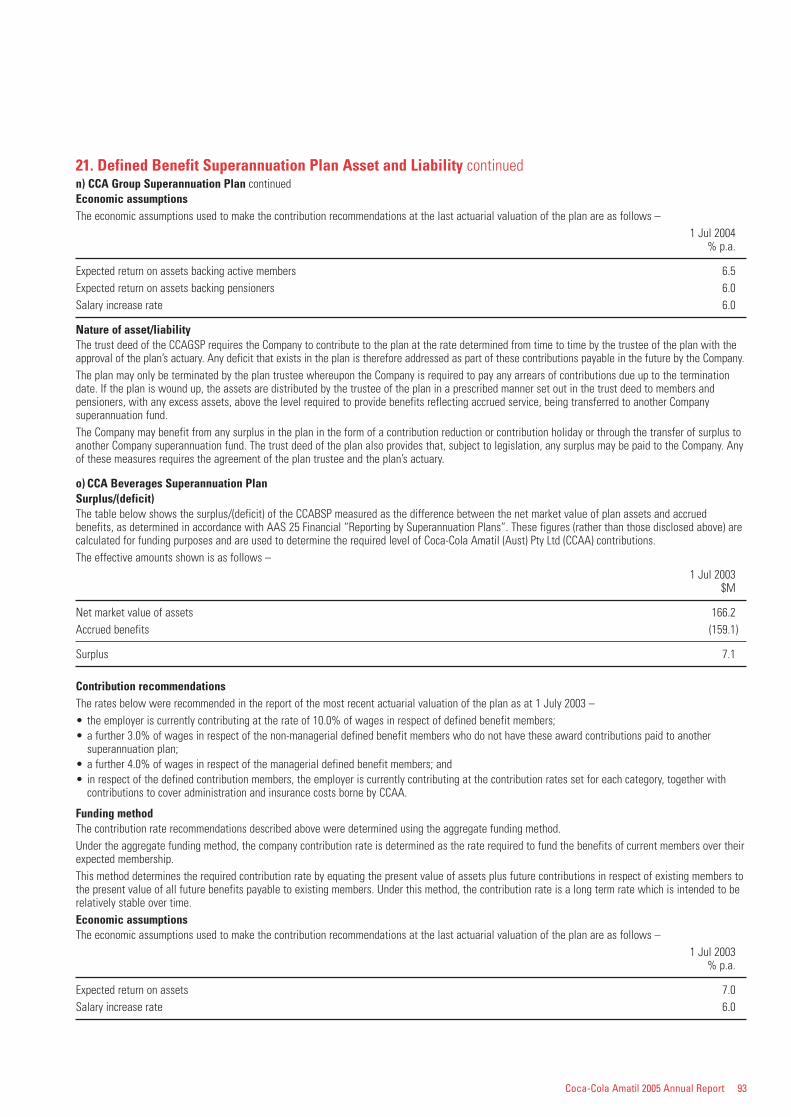
Coca-Cola Amatil 2005 Annual Report 93
21. Defined Benefit Superannuation Plan Asset and Liability continuedn) CCA Group Superannuation Plan continuedEconomic assumptionsThe economic assumptions used to make the contribution recommendations at the last actuarial valuation of the plan are as follows –
1 Jul 2004% p.a.
Expected return on assets backing active members 6.5Expected return on assets backing pensioners 6.0Salary increase rate 6.0
Nature of asset/liabilityThe trust deed of the CCAGSP requires the Company to contribute to the plan at the rate determined from time to time by the trustee of the plan with theapproval of the plan’s actuary. Any deficit that exists in the plan is therefore addressed as part of these contributions payable in the future by the Company.The plan may only be terminated by the plan trustee whereupon the Company is required to pay any arrears of contributions due up to the terminationdate. If the plan is wound up, the assets are distributed by the trustee of the plan in a prescribed manner set out in the trust deed to members andpensioners, with any excess assets, above the level required to provide benefits reflecting accrued service, being transferred to another Companysuperannuation fund.The Company may benefit from any surplus in the plan in the form of a contribution reduction or contribution holiday or through the transfer of surplus toanother Company superannuation fund. The trust deed of the plan also provides that, subject to legislation, any surplus may be paid to the Company. Anyof these measures requires the agreement of the plan trustee and the plan’s actuary.
o) CCA Beverages Superannuation PlanSurplus/(deficit)The table below shows the surplus/(deficit) of the CCABSP measured as the difference between the net market value of plan assets and accruedbenefits, as determined in accordance with AAS 25 Financial “Reporting by Superannuation Plans”. These figures (rather than those disclosed above) arecalculated for funding purposes and are used to determine the required level of Coca-Cola Amatil (Aust) Pty Ltd (CCAA) contributions.The effective amounts shown is as follows –
1 Jul 2003$M
Net market value of assets 166.2Accrued benefits (159.1)
Surplus 7.1
Contribution recommendationsThe rates below were recommended in the report of the most recent actuarial valuation of the plan as at 1 July 2003 –• the employer is currently contributing at the rate of 10.0% of wages in respect of defined benefit members;• a further 3.0% of wages in respect of the non-managerial defined benefit members who do not have these award contributions paid to another
superannuation plan;• a further 4.0% of wages in respect of the managerial defined benefit members; and• in respect of the defined contribution members, the employer is currently contributing at the contribution rates set for each category, together with
contributions to cover administration and insurance costs borne by CCAA.
Funding methodThe contribution rate recommendations described above were determined using the aggregate funding method.Under the aggregate funding method, the company contribution rate is determined as the rate required to fund the benefits of current members over theirexpected membership.This method determines the required contribution rate by equating the present value of assets plus future contributions in respect of existing members tothe present value of all future benefits payable to existing members. Under this method, the contribution rate is a long term rate which is intended to berelatively stable over time.Economic assumptionsThe economic assumptions used to make the contribution recommendations at the last actuarial valuation of the plan are as follows –
1 Jul 2003% p.a.
Expected return on assets 7.0Salary increase rate 6.0
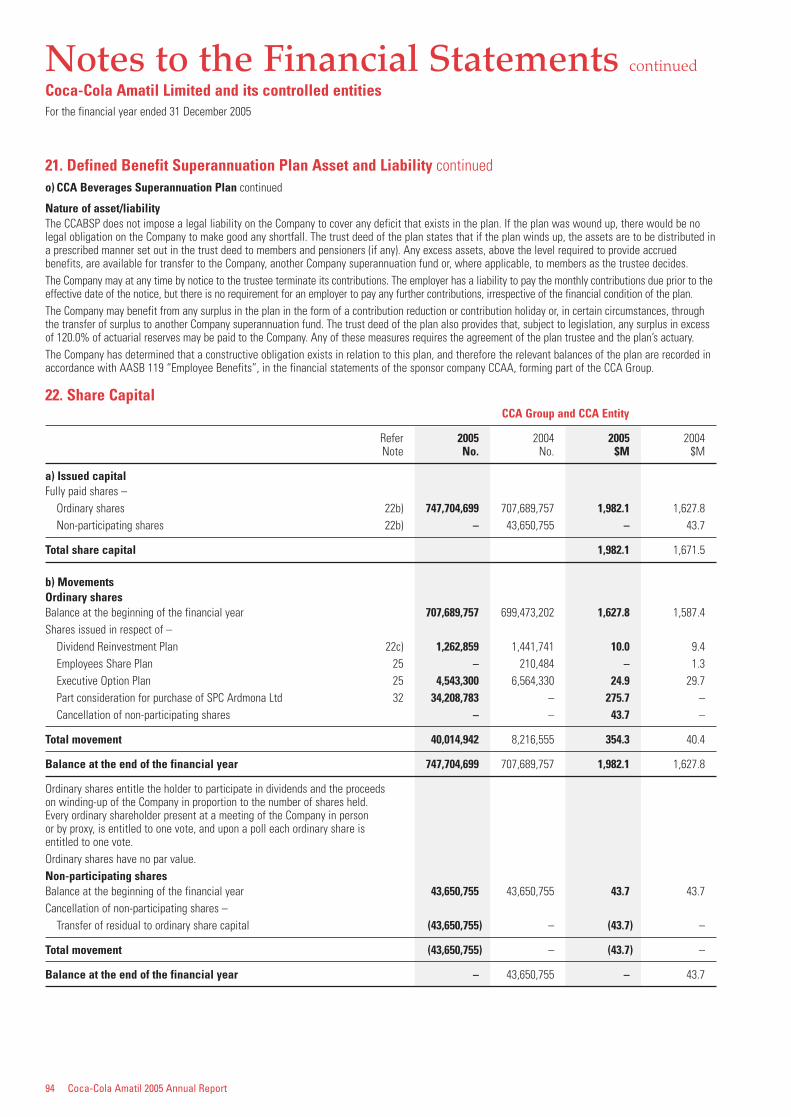
94 Coca-Cola Amatil 2005 Annual Report
Notes to the Financial Statements continued
Coca-Cola Amatil Limited and its controlled entitiesFor the financial year ended 31 December 2005
21. Defined Benefit Superannuation Plan Asset and Liability continuedo) CCA Beverages Superannuation Plan continued
Nature of asset/liabilityThe CCABSP does not impose a legal liability on the Company to cover any deficit that exists in the plan. If the plan was wound up, there would be nolegal obligation on the Company to make good any shortfall. The trust deed of the plan states that if the plan winds up, the assets are to be distributed ina prescribed manner set out in the trust deed to members and pensioners (if any). Any excess assets, above the level required to provide accruedbenefits, are available for transfer to the Company, another Company superannuation fund or, where applicable, to members as the trustee decides.The Company may at any time by notice to the trustee terminate its contributions. The employer has a liability to pay the monthly contributions due prior to theeffective date of the notice, but there is no requirement for an employer to pay any further contributions, irrespective of the financial condition of the plan.The Company may benefit from any surplus in the plan in the form of a contribution reduction or contribution holiday or, in certain circumstances, throughthe transfer of surplus to another Company superannuation fund. The trust deed of the plan also provides that, subject to legislation, any surplus in excessof 120.0% of actuarial reserves may be paid to the Company. Any of these measures requires the agreement of the plan trustee and the plan’s actuary.The Company has determined that a constructive obligation exists in relation to this plan, and therefore the relevant balances of the plan are recorded inaccordance with AASB 119 “Employee Benefits”, in the financial statements of the sponsor company CCAA, forming part of the CCA Group.
22. Share CapitalCCA Group and CCA Entity
Refer 2005 2004 2005 2004Note No. No. $M $M
a) Issued capitalFully paid shares –
Ordinary shares 22b) 747,704,699 707,689,757 1,982.1 1,627.8Non-participating shares 22b) – 43,650,755 – 43.7
Total share capital 1,982.1 1,671.5
b) MovementsOrdinary sharesBalance at the beginning of the financial year 707,689,757 699,473,202 1,627.8 1,587.4Shares issued in respect of –
Dividend Reinvestment Plan 22c) 1,262,859 1,441,741 10.0 9.4Employees Share Plan 25 – 210,484 – 1.3Executive Option Plan 25 4,543,300 6,564,330 24.9 29.7Part consideration for purchase of SPC Ardmona Ltd 32 34,208,783 – 275.7 –Cancellation of non-participating shares – – 43.7 –
Total movement 40,014,942 8,216,555 354.3 40.4
Balance at the end of the financial year 747,704,699 707,689,757 1,982.1 1,627.8
Ordinary shares entitle the holder to participate in dividends and the proceeds on winding-up of the Company in proportion to the number of shares held. Every ordinary shareholder present at a meeting of the Company in person or by proxy, is entitled to one vote, and upon a poll each ordinary share is entitled to one vote.Ordinary shares have no par value.Non-participating sharesBalance at the beginning of the financial year 43,650,755 43,650,755 43.7 43.7Cancellation of non-participating shares –
Transfer of residual to ordinary share capital (43,650,755) – (43.7) –
Total movement (43,650,755) – (43.7) –
Balance at the end of the financial year – 43,650,755 – 43.7
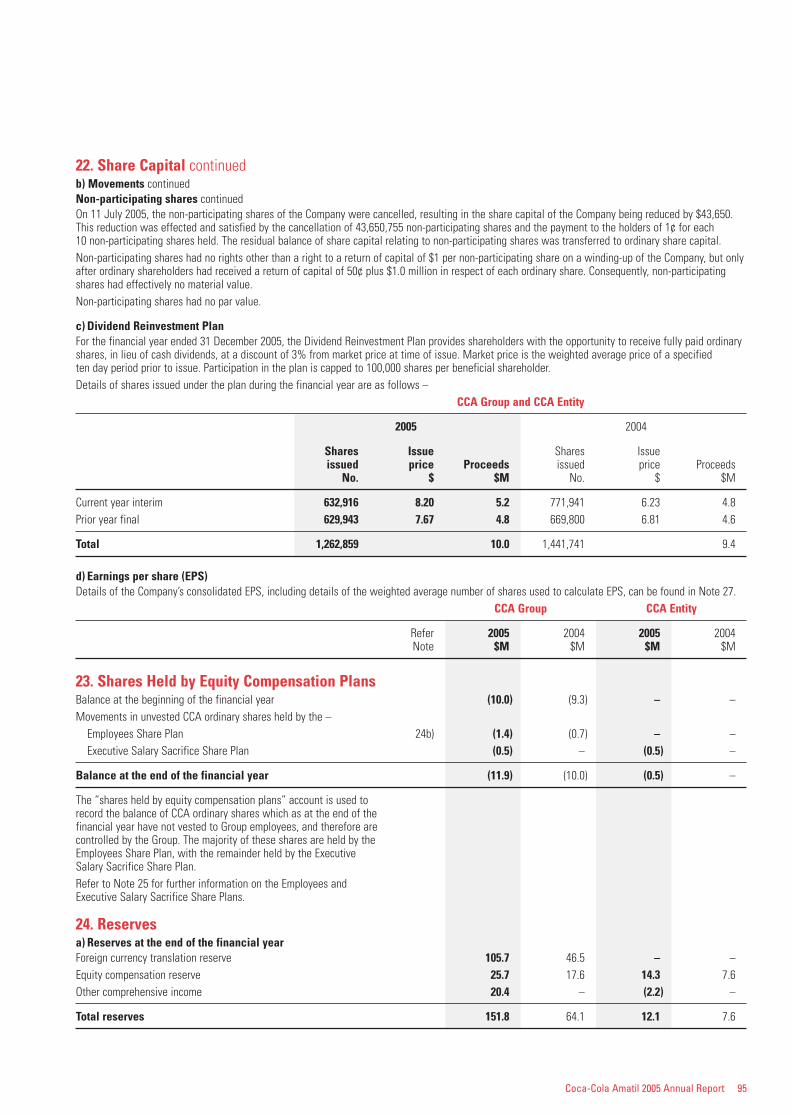
Coca-Cola Amatil 2005 Annual Report 95
22. Share Capital continuedb) Movements continuedNon-participating shares continuedOn 11 July 2005, the non-participating shares of the Company were cancelled, resulting in the share capital of the Company being reduced by $43,650.This reduction was effected and satisfied by the cancellation of 43,650,755 non-participating shares and the payment to the holders of 1¢ for each 10 non-participating shares held. The residual balance of share capital relating to non-participating shares was transferred to ordinary share capital.Non-participating shares had no rights other than a right to a return of capital of $1 per non-participating share on a winding-up of the Company, but onlyafter ordinary shareholders had received a return of capital of 50¢ plus $1.0 million in respect of each ordinary share. Consequently, non-participatingshares had effectively no material value.Non-participating shares had no par value.
c) Dividend Reinvestment PlanFor the financial year ended 31 December 2005, the Dividend Reinvestment Plan provides shareholders with the opportunity to receive fully paid ordinaryshares, in lieu of cash dividends, at a discount of 3% from market price at time of issue. Market price is the weighted average price of a specified ten day period prior to issue. Participation in the plan is capped to 100,000 shares per beneficial shareholder.Details of shares issued under the plan during the financial year are as follows –
CCA Group and CCA Entity
2005 2004
Shares Issue Shares Issueissued price Proceeds issued price Proceeds
No. $ $M No. $ $M
Current year interim 632,916 8.20 5.2 771,941 6.23 4.8Prior year final 629,943 7.67 4.8 669,800 6.81 4.6
Total 1,262,859 10.0 1,441,741 9.4
d) Earnings per share (EPS)Details of the Company’s consolidated EPS, including details of the weighted average number of shares used to calculate EPS, can be found in Note 27.
CCA Group CCA Entity
Refer 2005 2004 2005 2004Note $M $M $M $M
23. Shares Held by Equity Compensation PlansBalance at the beginning of the financial year (10.0) (9.3) – –Movements in unvested CCA ordinary shares held by the –
Employees Share Plan 24b) (1.4) (0.7) – –Executive Salary Sacrifice Share Plan (0.5) – (0.5) –
Balance at the end of the financial year (11.9) (10.0) (0.5) –
The “shares held by equity compensation plans” account is used to record the balance of CCA ordinary shares which as at the end of the financial year have not vested to Group employees, and therefore are controlled by the Group. The majority of these shares are held by the Employees Share Plan, with the remainder held by the Executive Salary Sacrifice Share Plan.Refer to Note 25 for further information on the Employees and Executive Salary Sacrifice Share Plans.
24. Reservesa) Reserves at the end of the financial yearForeign currency translation reserve 105.7 46.5 – –Equity compensation reserve 25.7 17.6 14.3 7.6Other comprehensive income 20.4 – (2.2) –
Total reserves 151.8 64.1 12.1 7.6
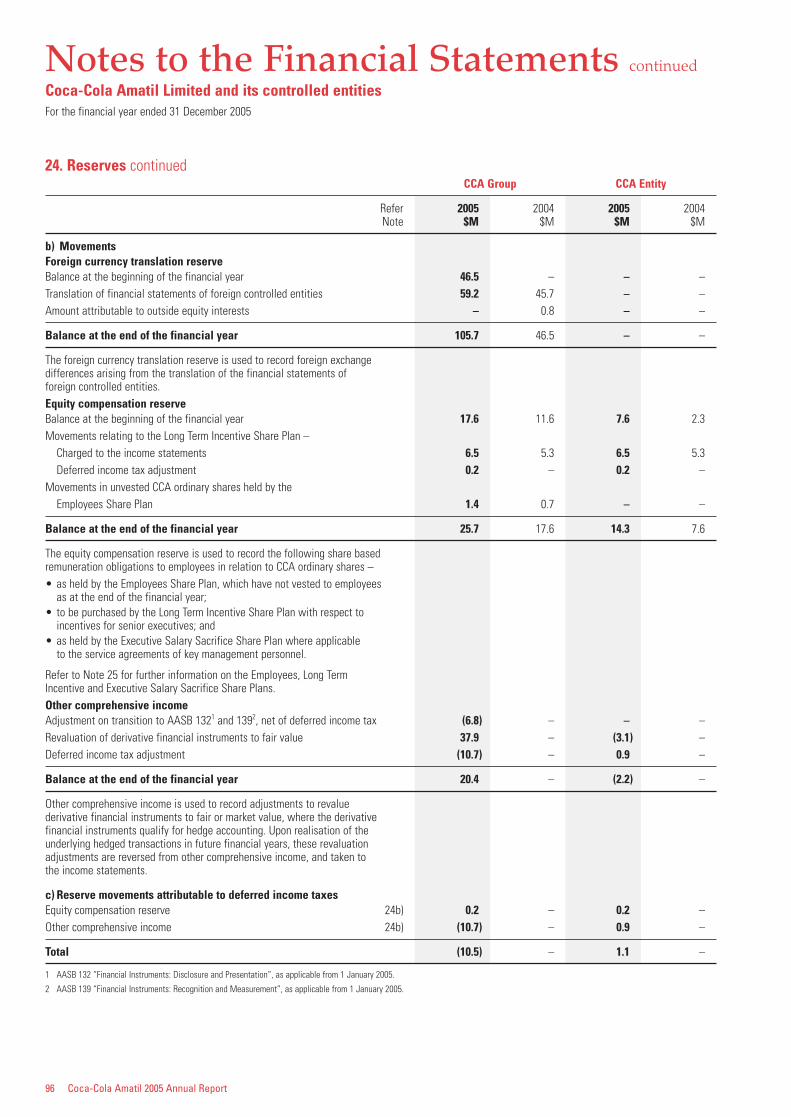
96 Coca-Cola Amatil 2005 Annual Report
Notes to the Financial Statements continued
Coca-Cola Amatil Limited and its controlled entitiesFor the financial year ended 31 December 2005
24. Reserves continuedCCA Group CCA Entity
Refer 2005 2004 2005 2004Note $M $M $M $M
b) MovementsForeign currency translation reserveBalance at the beginning of the financial year 46.5 – – –Translation of financial statements of foreign controlled entities 59.2 45.7 – –Amount attributable to outside equity interests – 0.8 – –
Balance at the end of the financial year 105.7 46.5 – –
The foreign currency translation reserve is used to record foreign exchange differences arising from the translation of the financial statements of foreign controlled entities.Equity compensation reserveBalance at the beginning of the financial year 17.6 11.6 7.6 2.3Movements relating to the Long Term Incentive Share Plan –
Charged to the income statements 6.5 5.3 6.5 5.3Deferred income tax adjustment 0.2 – 0.2 –
Movements in unvested CCA ordinary shares held by theEmployees Share Plan 1.4 0.7 – –
Balance at the end of the financial year 25.7 17.6 14.3 7.6
The equity compensation reserve is used to record the following share based remuneration obligations to employees in relation to CCA ordinary shares –• as held by the Employees Share Plan, which have not vested to employees
as at the end of the financial year;• to be purchased by the Long Term Incentive Share Plan with respect to
incentives for senior executives; and• as held by the Executive Salary Sacrifice Share Plan where applicable
to the service agreements of key management personnel.
Refer to Note 25 for further information on the Employees, Long Term Incentive and Executive Salary Sacrifice Share Plans.Other comprehensive incomeAdjustment on transition to AASB 1321 and 1392, net of deferred income tax (6.8) – – –Revaluation of derivative financial instruments to fair value 37.9 – (3.1) –Deferred income tax adjustment (10.7) – 0.9 –
Balance at the end of the financial year 20.4 – (2.2) –
Other comprehensive income is used to record adjustments to revalue derivative financial instruments to fair or market value, where the derivative financial instruments qualify for hedge accounting. Upon realisation of the underlying hedged transactions in future financial years, these revaluation adjustments are reversed from other comprehensive income, and taken to the income statements.
c) Reserve movements attributable to deferred income taxesEquity compensation reserve 24b) 0.2 – 0.2 –Other comprehensive income 24b) (10.7) – 0.9 –
Total (10.5) – 1.1 –
1 AASB 132 “Financial Instruments: Disclosure and Presentation”, as applicable from 1 January 2005.
2 AASB 139 “Financial Instruments: Recognition and Measurement”, as applicable from 1 January 2005.
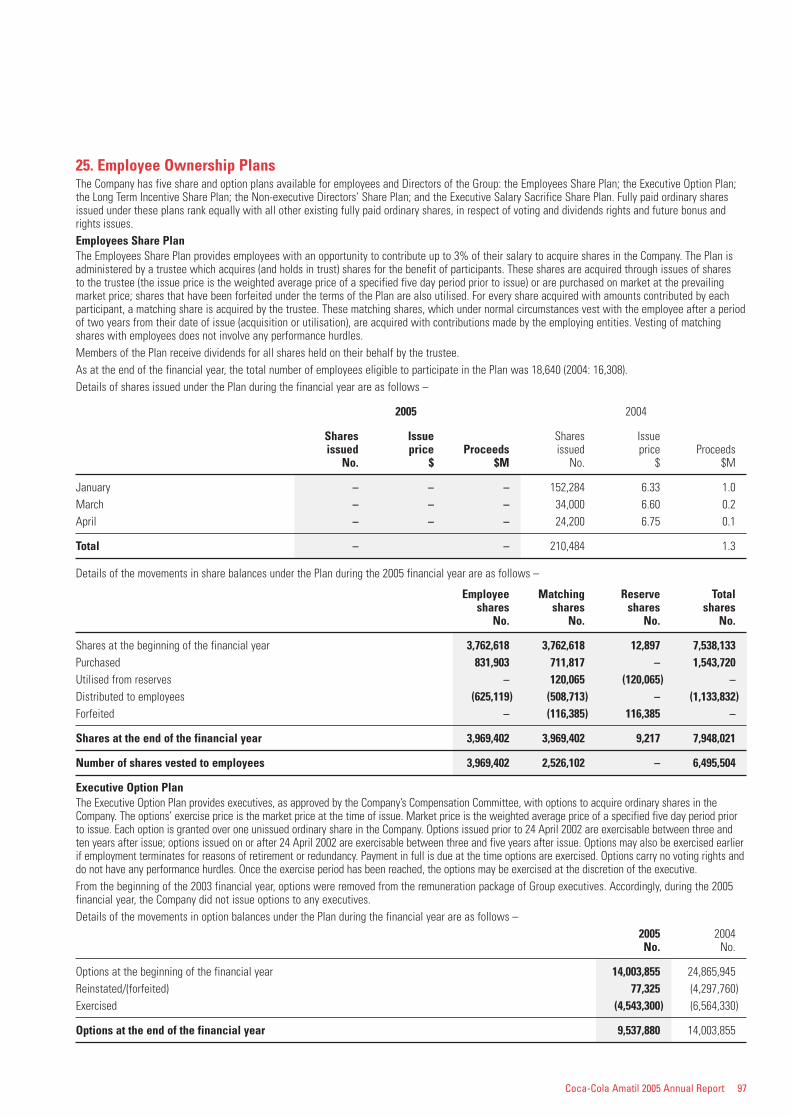
Coca-Cola Amatil 2005 Annual Report 97
25. Employee Ownership PlansThe Company has five share and option plans available for employees and Directors of the Group: the Employees Share Plan; the Executive Option Plan;the Long Term Incentive Share Plan; the Non-executive Directors’ Share Plan; and the Executive Salary Sacrifice Share Plan. Fully paid ordinary sharesissued under these plans rank equally with all other existing fully paid ordinary shares, in respect of voting and dividends rights and future bonus andrights issues.Employees Share PlanThe Employees Share Plan provides employees with an opportunity to contribute up to 3% of their salary to acquire shares in the Company. The Plan isadministered by a trustee which acquires (and holds in trust) shares for the benefit of participants. These shares are acquired through issues of shares to the trustee (the issue price is the weighted average price of a specified five day period prior to issue) or are purchased on market at the prevailingmarket price; shares that have been forfeited under the terms of the Plan are also utilised. For every share acquired with amounts contributed by eachparticipant, a matching share is acquired by the trustee. These matching shares, which under normal circumstances vest with the employee after a periodof two years from their date of issue (acquisition or utilisation), are acquired with contributions made by the employing entities. Vesting of matchingshares with employees does not involve any performance hurdles.Members of the Plan receive dividends for all shares held on their behalf by the trustee.As at the end of the financial year, the total number of employees eligible to participate in the Plan was 18,640 (2004: 16,308).Details of shares issued under the Plan during the financial year are as follows –
2005 2004
Shares Issue Shares Issueissued price Proceeds issued price Proceeds
No. $ $M No. $ $M
January – – – 152,284 6.33 1.0March – – – 34,000 6.60 0.2April – – – 24,200 6.75 0.1
Total – – 210,484 1.3
Details of the movements in share balances under the Plan during the 2005 financial year are as follows –
Employee Matching Reserve Totalshares shares shares shares
No. No. No. No.
Shares at the beginning of the financial year 3,762,618 3,762,618 12,897 7,538,133Purchased 831,903 711,817 – 1,543,720Utilised from reserves – 120,065 (120,065) –Distributed to employees (625,119) (508,713) – (1,133,832)Forfeited – (116,385) 116,385 –
Shares at the end of the financial year 3,969,402 3,969,402 9,217 7,948,021
Number of shares vested to employees 3,969,402 2,526,102 – 6,495,504
Executive Option PlanThe Executive Option Plan provides executives, as approved by the Company’s Compensation Committee, with options to acquire ordinary shares in theCompany. The options’ exercise price is the market price at the time of issue. Market price is the weighted average price of a specified five day period priorto issue. Each option is granted over one unissued ordinary share in the Company. Options issued prior to 24 April 2002 are exercisable between three andten years after issue; options issued on or after 24 April 2002 are exercisable between three and five years after issue. Options may also be exercised earlierif employment terminates for reasons of retirement or redundancy. Payment in full is due at the time options are exercised. Options carry no voting rights anddo not have any performance hurdles. Once the exercise period has been reached, the options may be exercised at the discretion of the executive.From the beginning of the 2003 financial year, options were removed from the remuneration package of Group executives. Accordingly, during the 2005financial year, the Company did not issue options to any executives.Details of the movements in option balances under the Plan during the financial year are as follows –
2005 2004No. No.
Options at the beginning of the financial year 14,003,855 24,865,945Reinstated/(forfeited) 77,325 (4,297,760)Exercised (4,543,300) (6,564,330)
Options at the end of the financial year 9,537,880 14,003,855
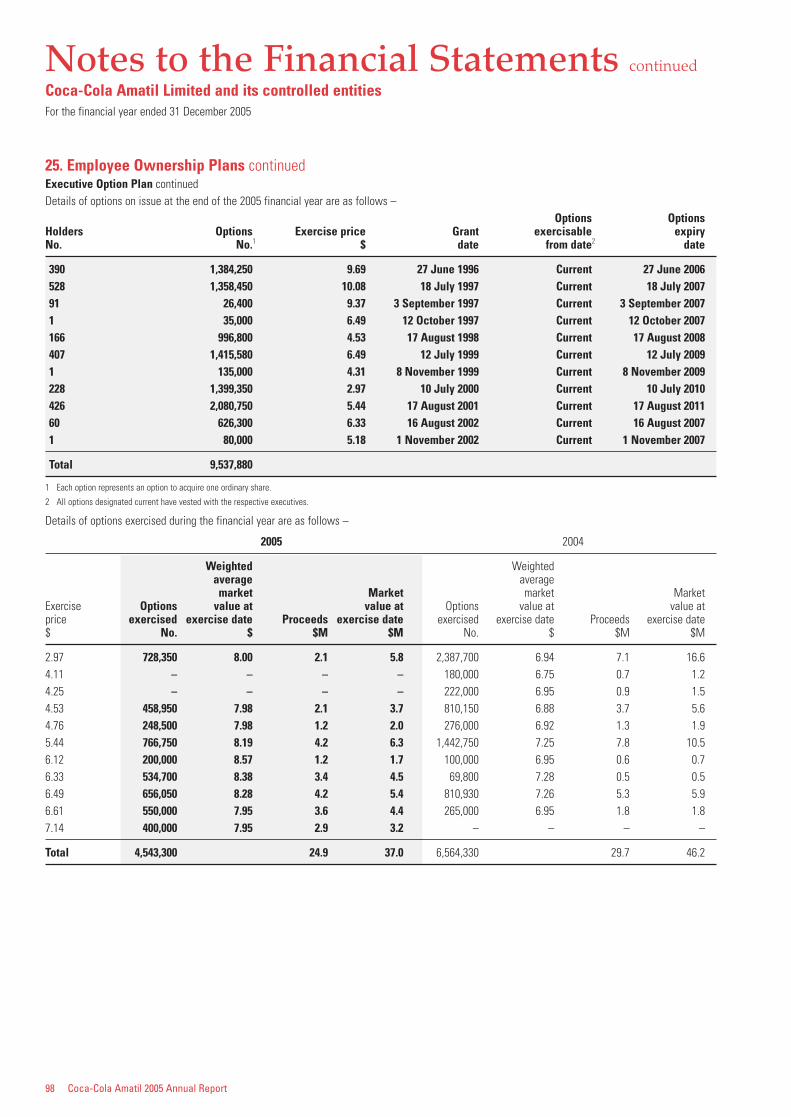
98 Coca-Cola Amatil 2005 Annual Report
Notes to the Financial Statements continued
Coca-Cola Amatil Limited and its controlled entitiesFor the financial year ended 31 December 2005
25. Employee Ownership Plans continuedExecutive Option Plan continuedDetails of options on issue at the end of the 2005 financial year are as follows –
Options OptionsHolders Options Exercise price Grant exercisable expiryNo. No.1 $ date from date2 date
390 1,384,250 9.69 27 June 1996 Current 27 June 2006528 1,358,450 10.08 18 July 1997 Current 18 July 200791 26,400 9.37 3 September 1997 Current 3 September 20071 35,000 6.49 12 October 1997 Current 12 October 2007166 996,800 4.53 17 August 1998 Current 17 August 2008407 1,415,580 6.49 12 July 1999 Current 12 July 20091 135,000 4.31 8 November 1999 Current 8 November 2009228 1,399,350 2.97 10 July 2000 Current 10 July 2010426 2,080,750 5.44 17 August 2001 Current 17 August 201160 626,300 6.33 16 August 2002 Current 16 August 20071 80,000 5.18 1 November 2002 Current 1 November 2007
Total 9,537,880
1 Each option represents an option to acquire one ordinary share.
2 All options designated current have vested with the respective executives.
Details of options exercised during the financial year are as follows –
2005 2004
Weighted Weightedaverage average
market Market market MarketExercise Options value at value at Options value at value atprice exercised exercise date Proceeds exercise date exercised exercise date Proceeds exercise date$ No. $ $M $M No. $ $M $M
2.97 728,350 8.00 2.1 5.8 2,387,700 6.94 7.1 16.64.11 – – – – 180,000 6.75 0.7 1.24.25 – – – – 222,000 6.95 0.9 1.54.53 458,950 7.98 2.1 3.7 810,150 6.88 3.7 5.64.76 248,500 7.98 1.2 2.0 276,000 6.92 1.3 1.95.44 766,750 8.19 4.2 6.3 1,442,750 7.25 7.8 10.56.12 200,000 8.57 1.2 1.7 100,000 6.95 0.6 0.76.33 534,700 8.38 3.4 4.5 69,800 7.28 0.5 0.56.49 656,050 8.28 4.2 5.4 810,930 7.26 5.3 5.96.61 550,000 7.95 3.6 4.4 265,000 6.95 1.8 1.87.14 400,000 7.95 2.9 3.2 – – – –
Total 4,543,300 24.9 37.0 6,564,330 29.7 46.2
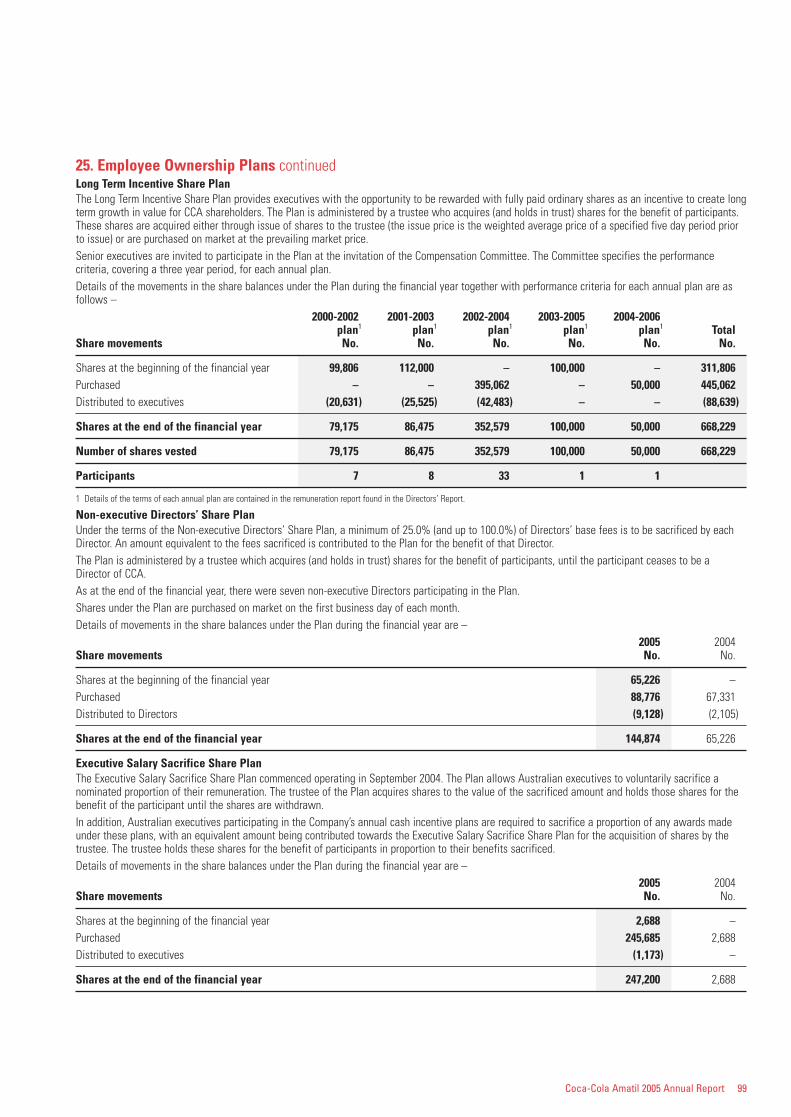
Coca-Cola Amatil 2005 Annual Report 99
25. Employee Ownership Plans continuedLong Term Incentive Share PlanThe Long Term Incentive Share Plan provides executives with the opportunity to be rewarded with fully paid ordinary shares as an incentive to create longterm growth in value for CCA shareholders. The Plan is administered by a trustee who acquires (and holds in trust) shares for the benefit of participants.These shares are acquired either through issue of shares to the trustee (the issue price is the weighted average price of a specified five day period priorto issue) or are purchased on market at the prevailing market price.Senior executives are invited to participate in the Plan at the invitation of the Compensation Committee. The Committee specifies the performancecriteria, covering a three year period, for each annual plan.Details of the movements in the share balances under the Plan during the financial year together with performance criteria for each annual plan are asfollows –
2000-2002 2001-2003 2002-2004 2003-2005 2004-2006plan1 plan1 plan1 plan1 plan1 Total
Share movements No. No. No. No. No. No.
Shares at the beginning of the financial year 99,806 112,000 – 100,000 – 311,806Purchased – – 395,062 – 50,000 445,062Distributed to executives (20,631) (25,525) (42,483) – – (88,639)
Shares at the end of the financial year 79,175 86,475 352,579 100,000 50,000 668,229
Number of shares vested 79,175 86,475 352,579 100,000 50,000 668,229
Participants 7 8 33 1 1
1 Details of the terms of each annual plan are contained in the remuneration report found in the Directors’ Report.
Non-executive Directors’ Share PlanUnder the terms of the Non-executive Directors’ Share Plan, a minimum of 25.0% (and up to 100.0%) of Directors’ base fees is to be sacrificed by eachDirector. An amount equivalent to the fees sacrificed is contributed to the Plan for the benefit of that Director.The Plan is administered by a trustee which acquires (and holds in trust) shares for the benefit of participants, until the participant ceases to be aDirector of CCA.As at the end of the financial year, there were seven non-executive Directors participating in the Plan.Shares under the Plan are purchased on market on the first business day of each month.Details of movements in the share balances under the Plan during the financial year are –
2005 2004Share movements No. No.
Shares at the beginning of the financial year 65,226 –Purchased 88,776 67,331Distributed to Directors (9,128) (2,105)
Shares at the end of the financial year 144,874 65,226
Executive Salary Sacrifice Share PlanThe Executive Salary Sacrifice Share Plan commenced operating in September 2004. The Plan allows Australian executives to voluntarily sacrifice anominated proportion of their remuneration. The trustee of the Plan acquires shares to the value of the sacrificed amount and holds those shares for thebenefit of the participant until the shares are withdrawn.In addition, Australian executives participating in the Company’s annual cash incentive plans are required to sacrifice a proportion of any awards madeunder these plans, with an equivalent amount being contributed towards the Executive Salary Sacrifice Share Plan for the acquisition of shares by thetrustee. The trustee holds these shares for the benefit of participants in proportion to their benefits sacrificed.Details of movements in the share balances under the Plan during the financial year are –
2005 2004Share movements No. No.
Shares at the beginning of the financial year 2,688 –Purchased 245,685 2,688Distributed to executives (1,173) –
Shares at the end of the financial year 247,200 2,688
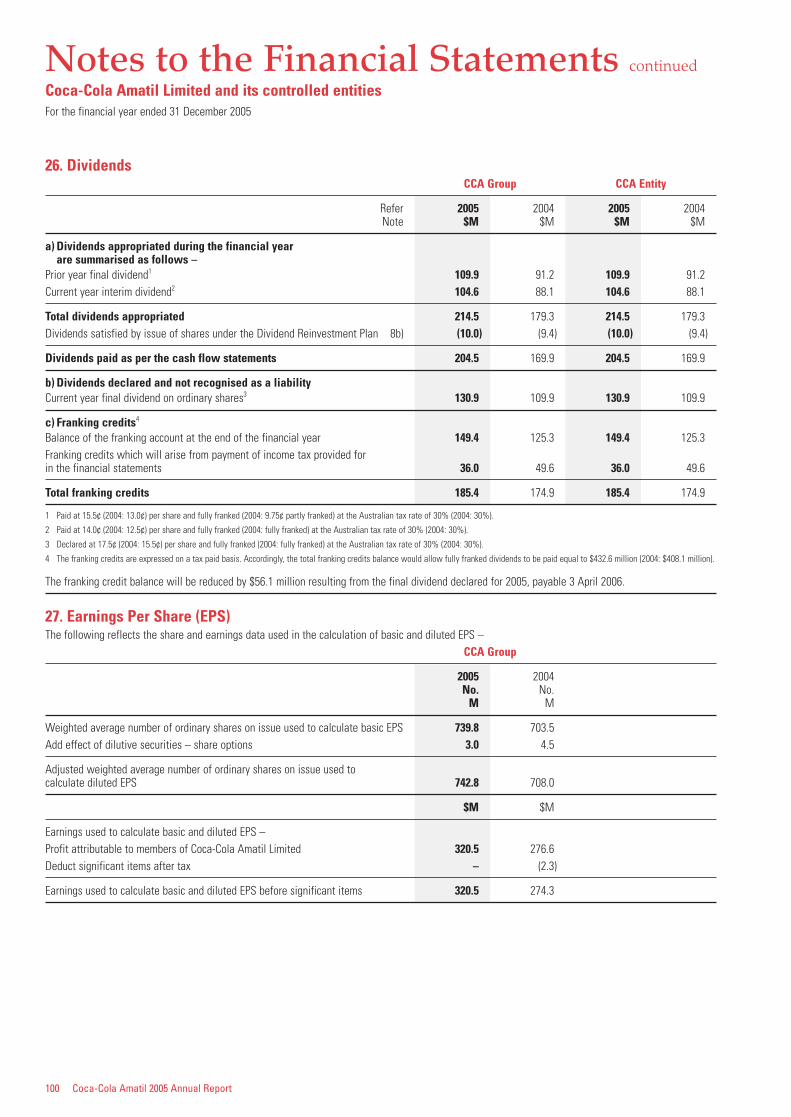
100 Coca-Cola Amatil 2005 Annual Report
Notes to the Financial Statements continued
Coca-Cola Amatil Limited and its controlled entitiesFor the financial year ended 31 December 2005
26. DividendsCCA Group CCA Entity
Refer 2005 2004 2005 2004Note $M $M $M $M
a) Dividends appropriated during the financial year are summarised as follows –
Prior year final dividend1 109.9 91.2 109.9 91.2Current year interim dividend2 104.6 88.1 104.6 88.1
Total dividends appropriated 214.5 179.3 214.5 179.3Dividends satisfied by issue of shares under the Dividend Reinvestment Plan 8b) (10.0) (9.4) (10.0) (9.4)
Dividends paid as per the cash flow statements 204.5 169.9 204.5 169.9
b) Dividends declared and not recognised as a liabilityCurrent year final dividend on ordinary shares3 130.9 109.9 130.9 109.9
c) Franking credits4
Balance of the franking account at the end of the financial year 149.4 125.3 149.4 125.3Franking credits which will arise from payment of income tax provided for in the financial statements 36.0 49.6 36.0 49.6
Total franking credits 185.4 174.9 185.4 174.9
1 Paid at 15.5¢ (2004: 13.0¢) per share and fully franked (2004: 9.75¢ partly franked) at the Australian tax rate of 30% (2004: 30%).
2 Paid at 14.0¢ (2004: 12.5¢) per share and fully franked (2004: fully franked) at the Australian tax rate of 30% (2004: 30%).
3 Declared at 17.5¢ (2004: 15.5¢) per share and fully franked (2004: fully franked) at the Australian tax rate of 30% (2004: 30%).
4 The franking credits are expressed on a tax paid basis. Accordingly, the total franking credits balance would allow fully franked dividends to be paid equal to $432.6 million (2004: $408.1 million).
The franking credit balance will be reduced by $56.1 million resulting from the final dividend declared for 2005, payable 3 April 2006.
27. Earnings Per Share (EPS)The following reflects the share and earnings data used in the calculation of basic and diluted EPS –
CCA Group
2005 2004No. No.
M M
Weighted average number of ordinary shares on issue used to calculate basic EPS 739.8 703.5Add effect of dilutive securities – share options 3.0 4.5
Adjusted weighted average number of ordinary shares on issue used to calculate diluted EPS 742.8 708.0
$M $M
Earnings used to calculate basic and diluted EPS –Profit attributable to members of Coca-Cola Amatil Limited 320.5 276.6Deduct significant items after tax – (2.3)
Earnings used to calculate basic and diluted EPS before significant items 320.5 274.3
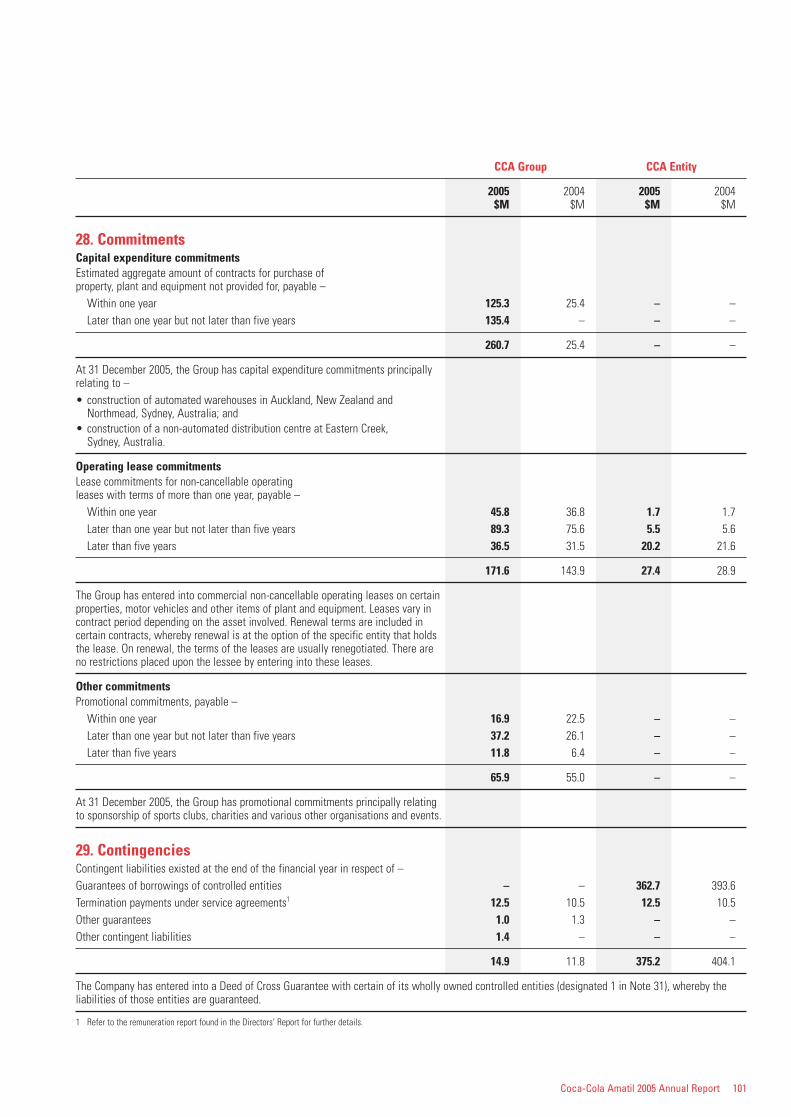
Coca-Cola Amatil 2005 Annual Report 101
CCA Group CCA Entity
2005 2004 2005 2004$M $M $M $M
28. CommitmentsCapital expenditure commitmentsEstimated aggregate amount of contracts for purchase ofproperty, plant and equipment not provided for, payable –
Within one year 125.3 25.4 – –Later than one year but not later than five years 135.4 – – –
260.7 25.4 – –
At 31 December 2005, the Group has capital expenditure commitments principally relating to –• construction of automated warehouses in Auckland, New Zealand and
Northmead, Sydney, Australia; and• construction of a non-automated distribution centre at Eastern Creek,
Sydney, Australia.
Operating lease commitmentsLease commitments for non-cancellable operating leases with terms of more than one year, payable –
Within one year 45.8 36.8 1.7 1.7Later than one year but not later than five years 89.3 75.6 5.5 5.6Later than five years 36.5 31.5 20.2 21.6
171.6 143.9 27.4 28.9
The Group has entered into commercial non-cancellable operating leases on certain properties, motor vehicles and other items of plant and equipment. Leases vary in contract period depending on the asset involved. Renewal terms are included in certain contracts, whereby renewal is at the option of the specific entity that holds the lease. On renewal, the terms of the leases are usually renegotiated. There are no restrictions placed upon the lessee by entering into these leases.
Other commitmentsPromotional commitments, payable –
Within one year 16.9 22.5 – –Later than one year but not later than five years 37.2 26.1 – –Later than five years 11.8 6.4 – –
65.9 55.0 – –
At 31 December 2005, the Group has promotional commitments principally relating to sponsorship of sports clubs, charities and various other organisations and events.
29. ContingenciesContingent liabilities existed at the end of the financial year in respect of –Guarantees of borrowings of controlled entities – – 362.7 393.6Termination payments under service agreements1 12.5 10.5 12.5 10.5Other guarantees 1.0 1.3 – –Other contingent liabilities 1.4 – – –
14.9 11.8 375.2 404.1
The Company has entered into a Deed of Cross Guarantee with certain of its wholly owned controlled entities (designated 1 in Note 31), whereby theliabilities of those entities are guaranteed.
1 Refer to the remuneration report found in the Directors’ Report for further details.
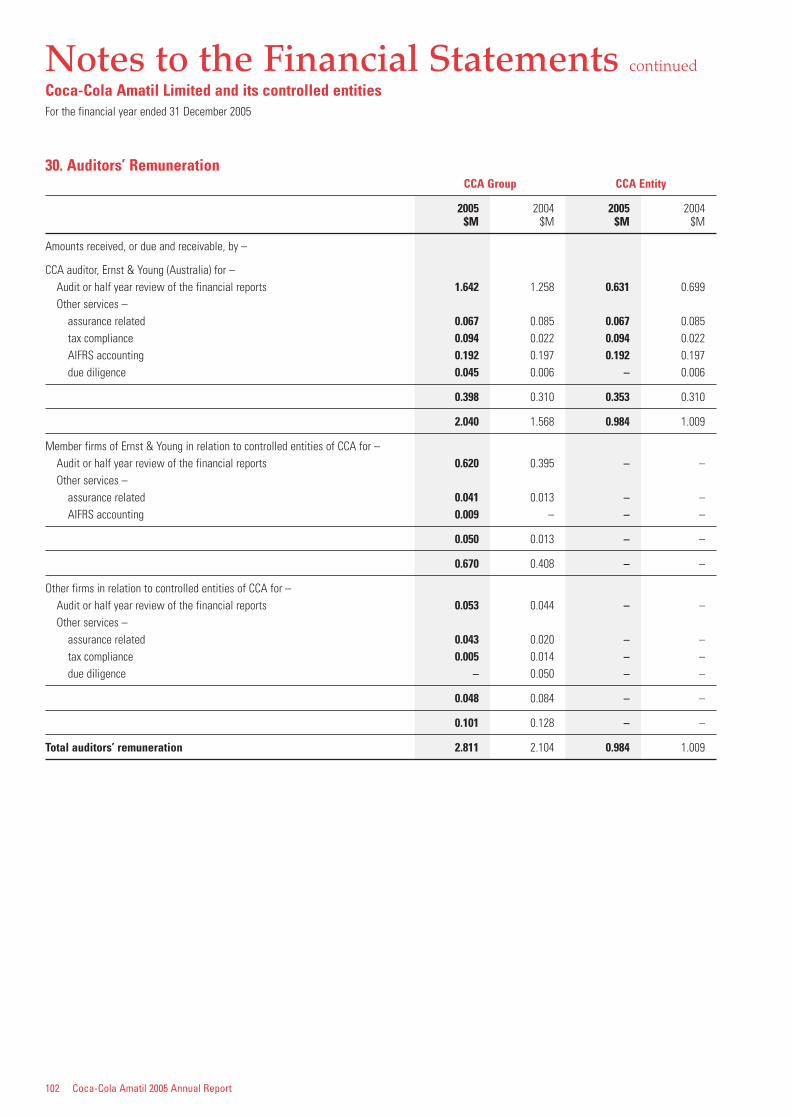
102 Coca-Cola Amatil 2005 Annual Report
Notes to the Financial Statements continued
Coca-Cola Amatil Limited and its controlled entitiesFor the financial year ended 31 December 2005
30. Auditors’ RemunerationCCA Group CCA Entity
2005 2004 2005 2004$M $M $M $M
Amounts received, or due and receivable, by –
CCA auditor, Ernst & Young (Australia) for –Audit or half year review of the financial reports 1.642 1.258 0.631 0.699Other services –
assurance related 0.067 0.085 0.067 0.085tax compliance 0.094 0.022 0.094 0.022AIFRS accounting 0.192 0.197 0.192 0.197due diligence 0.045 0.006 – 0.006
0.398 0.310 0.353 0.310
2.040 1.568 0.984 1.009
Member firms of Ernst & Young in relation to controlled entities of CCA for –Audit or half year review of the financial reports 0.620 0.395 – –Other services –
assurance related 0.041 0.013 – –AIFRS accounting 0.009 – – –
0.050 0.013 – –
0.670 0.408 – –
Other firms in relation to controlled entities of CCA for –Audit or half year review of the financial reports 0.053 0.044 – –Other services –
assurance related 0.043 0.020 – –tax compliance 0.005 0.014 – –due diligence – 0.050 – –
0.048 0.084 – –
0.101 0.128 – –
Total auditors’ remuneration 2.811 2.104 0.984 1.009
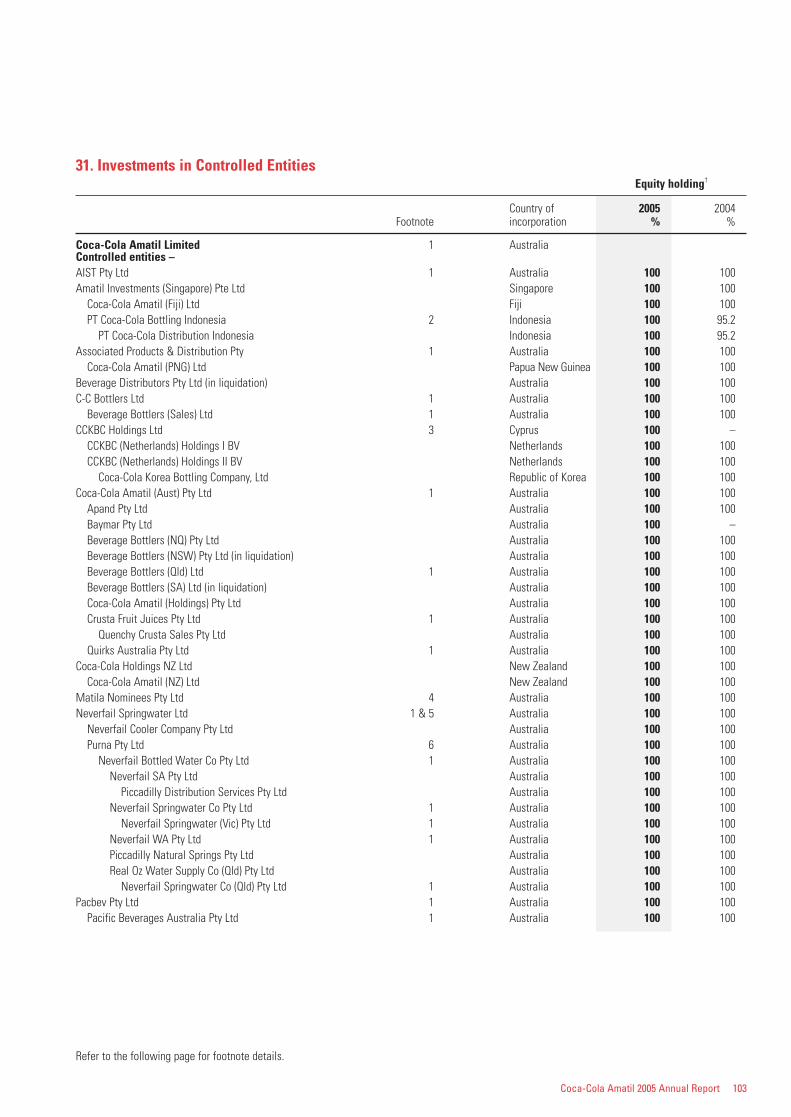
Coca-Cola Amatil 2005 Annual Report 103
31. Investments in Controlled EntitiesEquity holding†
Country of 2005 2004Footnote incorporation % %
Coca-Cola Amatil Limited 1 AustraliaControlled entities –AIST Pty Ltd 1 Australia 100 100Amatil Investments (Singapore) Pte Ltd Singapore 100 100
Coca-Cola Amatil (Fiji) Ltd Fiji 100 100PT Coca-Cola Bottling Indonesia 2 Indonesia 100 95.2
PT Coca-Cola Distribution Indonesia Indonesia 100 95.2Associated Products & Distribution Pty 1 Australia 100 100
Coca-Cola Amatil (PNG) Ltd Papua New Guinea 100 100Beverage Distributors Pty Ltd (in liquidation) Australia 100 100C-C Bottlers Ltd 1 Australia 100 100
Beverage Bottlers (Sales) Ltd 1 Australia 100 100CCKBC Holdings Ltd 3 Cyprus 100 –
CCKBC (Netherlands) Holdings I BV Netherlands 100 100CCKBC (Netherlands) Holdings II BV Netherlands 100 100
Coca-Cola Korea Bottling Company, Ltd Republic of Korea 100 100Coca-Cola Amatil (Aust) Pty Ltd 1 Australia 100 100
Apand Pty Ltd Australia 100 100Baymar Pty Ltd Australia 100 –Beverage Bottlers (NQ) Pty Ltd Australia 100 100Beverage Bottlers (NSW) Pty Ltd (in liquidation) Australia 100 100Beverage Bottlers (Qld) Ltd 1 Australia 100 100Beverage Bottlers (SA) Ltd (in liquidation) Australia 100 100Coca-Cola Amatil (Holdings) Pty Ltd Australia 100 100Crusta Fruit Juices Pty Ltd 1 Australia 100 100
Quenchy Crusta Sales Pty Ltd Australia 100 100Quirks Australia Pty Ltd 1 Australia 100 100
Coca-Cola Holdings NZ Ltd New Zealand 100 100Coca-Cola Amatil (NZ) Ltd New Zealand 100 100
Matila Nominees Pty Ltd 4 Australia 100 100Neverfail Springwater Ltd 1 & 5 Australia 100 100
Neverfail Cooler Company Pty Ltd Australia 100 100Purna Pty Ltd 6 Australia 100 100
Neverfail Bottled Water Co Pty Ltd 1 Australia 100 100Neverfail SA Pty Ltd Australia 100 100
Piccadilly Distribution Services Pty Ltd Australia 100 100Neverfail Springwater Co Pty Ltd 1 Australia 100 100
Neverfail Springwater (Vic) Pty Ltd 1 Australia 100 100Neverfail WA Pty Ltd 1 Australia 100 100Piccadilly Natural Springs Pty Ltd Australia 100 100Real Oz Water Supply Co (Qld) Pty Ltd Australia 100 100
Neverfail Springwater Co (Qld) Pty Ltd 1 Australia 100 100Pacbev Pty Ltd 1 Australia 100 100
Pacific Beverages Australia Pty Ltd 1 Australia 100 100
Refer to the following page for footnote details.
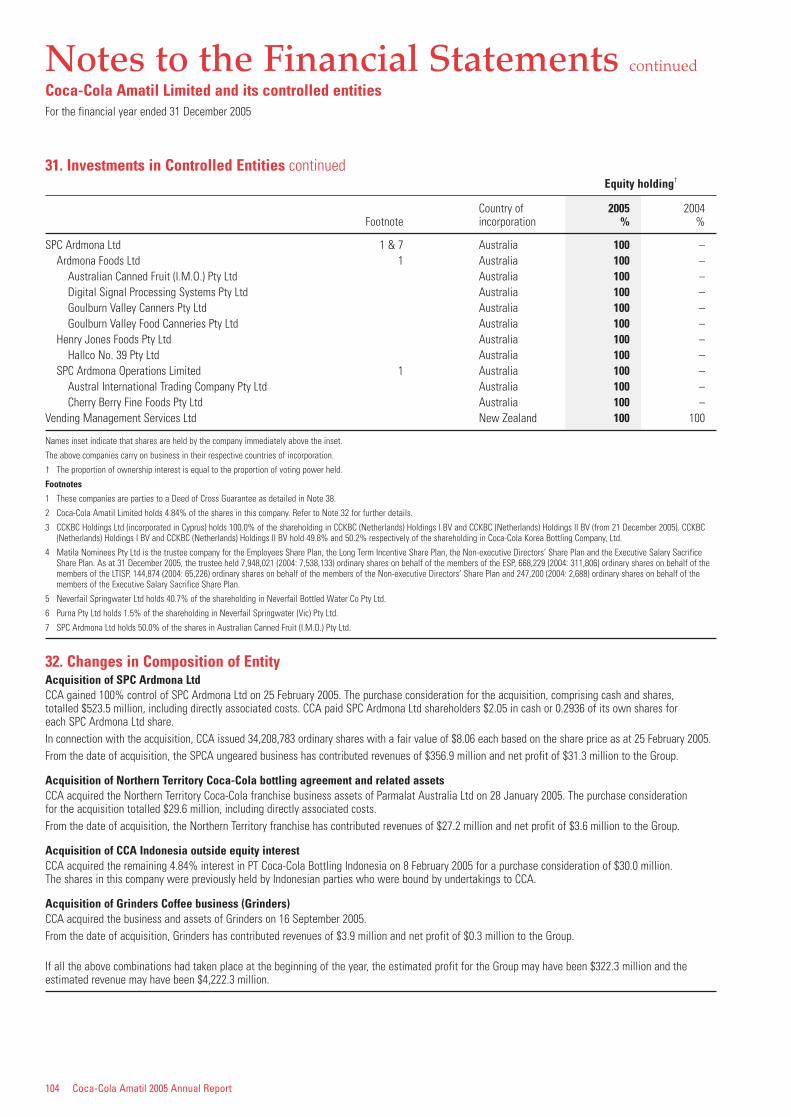
104 Coca-Cola Amatil 2005 Annual Report
Notes to the Financial Statements continued
Coca-Cola Amatil Limited and its controlled entitiesFor the financial year ended 31 December 2005
31. Investments in Controlled Entities continuedEquity holding†
Country of 2005 2004Footnote incorporation % %
SPC Ardmona Ltd 1 & 7 Australia 100 –Ardmona Foods Ltd 1 Australia 100 –
Australian Canned Fruit (I.M.O.) Pty Ltd Australia 100 –Digital Signal Processing Systems Pty Ltd Australia 100 –Goulburn Valley Canners Pty Ltd Australia 100 –Goulburn Valley Food Canneries Pty Ltd Australia 100 –
Henry Jones Foods Pty Ltd Australia 100 –Hallco No. 39 Pty Ltd Australia 100 –
SPC Ardmona Operations Limited 1 Australia 100 –Austral International Trading Company Pty Ltd Australia 100 –Cherry Berry Fine Foods Pty Ltd Australia 100 –
Vending Management Services Ltd New Zealand 100 100
Names inset indicate that shares are held by the company immediately above the inset.
The above companies carry on business in their respective countries of incorporation.
† The proportion of ownership interest is equal to the proportion of voting power held.
Footnotes
1 These companies are parties to a Deed of Cross Guarantee as detailed in Note 38.
2 Coca-Cola Amatil Limited holds 4.84% of the shares in this company. Refer to Note 32 for further details.
3 CCKBC Holdings Ltd (incorporated in Cyprus) holds 100.0% of the shareholding in CCKBC (Netherlands) Holdings I BV and CCKBC (Netherlands) Holdings II BV (from 21 December 2005). CCKBC(Netherlands) Holdings I BV and CCKBC (Netherlands) Holdings II BV hold 49.8% and 50.2% respectively of the shareholding in Coca-Cola Korea Bottling Company, Ltd.
4 Matila Nominees Pty Ltd is the trustee company for the Employees Share Plan, the Long Term Incentive Share Plan, the Non-executive Directors’ Share Plan and the Executive Salary SacrificeShare Plan. As at 31 December 2005, the trustee held 7,948,021 (2004: 7,538,133) ordinary shares on behalf of the members of the ESP, 668,229 (2004: 311,806) ordinary shares on behalf of themembers of the LTISP, 144,874 (2004: 65,226) ordinary shares on behalf of the members of the Non-executive Directors’ Share Plan and 247,200 (2004: 2,688) ordinary shares on behalf of themembers of the Executive Salary Sacrifice Share Plan.
5 Neverfail Springwater Ltd holds 40.7% of the shareholding in Neverfail Bottled Water Co Pty Ltd.
6 Purna Pty Ltd holds 1.5% of the shareholding in Neverfail Springwater (Vic) Pty Ltd.
7 SPC Ardmona Ltd holds 50.0% of the shares in Australian Canned Fruit (I.M.O.) Pty Ltd.
32. Changes in Composition of EntityAcquisition of SPC Ardmona LtdCCA gained 100% control of SPC Ardmona Ltd on 25 February 2005. The purchase consideration for the acquisition, comprising cash and shares, totalled $523.5 million, including directly associated costs. CCA paid SPC Ardmona Ltd shareholders $2.05 in cash or 0.2936 of its own shares for each SPC Ardmona Ltd share.In connection with the acquisition, CCA issued 34,208,783 ordinary shares with a fair value of $8.06 each based on the share price as at 25 February 2005.From the date of acquisition, the SPCA ungeared business has contributed revenues of $356.9 million and net profit of $31.3 million to the Group.
Acquisition of Northern Territory Coca-Cola bottling agreement and related assetsCCA acquired the Northern Territory Coca-Cola franchise business assets of Parmalat Australia Ltd on 28 January 2005. The purchase consideration for the acquisition totalled $29.6 million, including directly associated costs.From the date of acquisition, the Northern Territory franchise has contributed revenues of $27.2 million and net profit of $3.6 million to the Group.
Acquisition of CCA Indonesia outside equity interestCCA acquired the remaining 4.84% interest in PT Coca-Cola Bottling Indonesia on 8 February 2005 for a purchase consideration of $30.0 million. The shares in this company were previously held by Indonesian parties who were bound by undertakings to CCA.
Acquisition of Grinders Coffee business (Grinders)CCA acquired the business and assets of Grinders on 16 September 2005.From the date of acquisition, Grinders has contributed revenues of $3.9 million and net profit of $0.3 million to the Group.
If all the above combinations had taken place at the beginning of the year, the estimated profit for the Group may have been $322.3 million and theestimated revenue may have been $4,222.3 million.
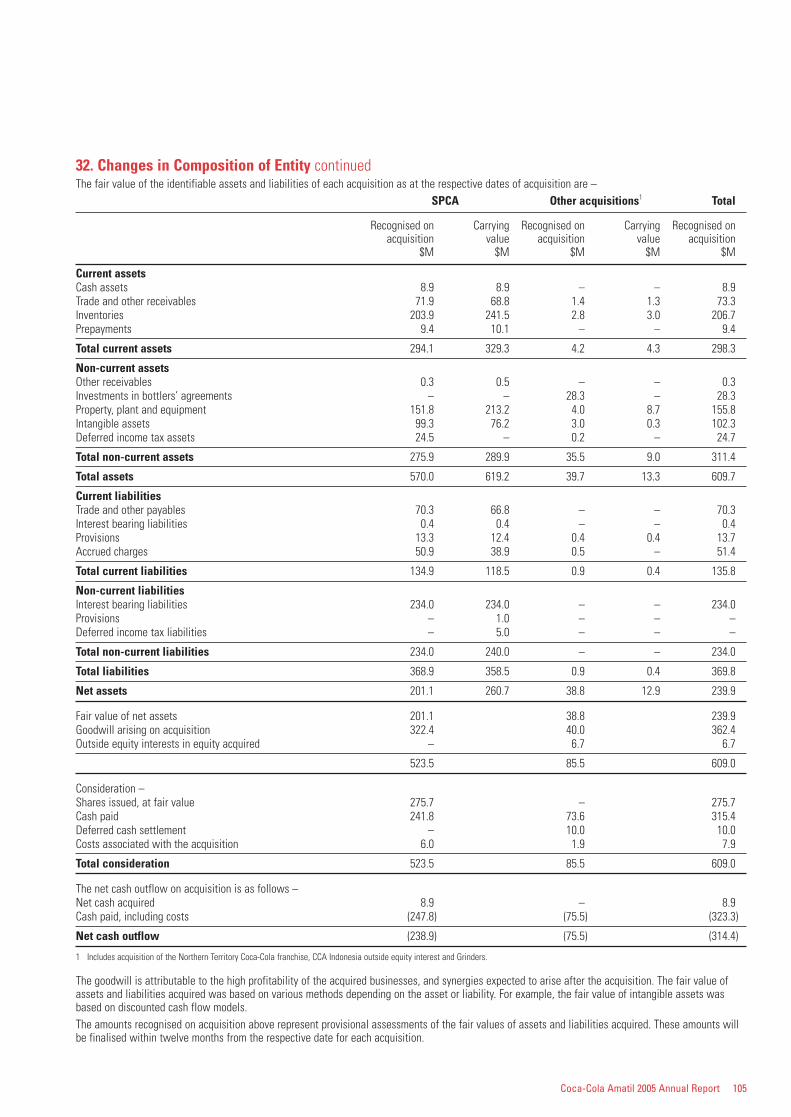
Coca-Cola Amatil 2005 Annual Report 105
32. Changes in Composition of Entity continuedThe fair value of the identifiable assets and liabilities of each acquisition as at the respective dates of acquisition are –
SPCA Other acquisitions1 Total
Recognised on Carrying Recognised on Carrying Recognised onacquisition value acquisition value acquisition
$M $M $M $M $M
Current assetsCash assets 8.9 8.9 – – 8.9Trade and other receivables 71.9 68.8 1.4 1.3 73.3Inventories 203.9 241.5 2.8 3.0 206.7Prepayments 9.4 10.1 – – 9.4
Total current assets 294.1 329.3 4.2 4.3 298.3
Non-current assetsOther receivables 0.3 0.5 – – 0.3Investments in bottlers’ agreements – – 28.3 – 28.3Property, plant and equipment 151.8 213.2 4.0 8.7 155.8Intangible assets 99.3 76.2 3.0 0.3 102.3Deferred income tax assets 24.5 – 0.2 – 24.7
Total non-current assets 275.9 289.9 35.5 9.0 311.4
Total assets 570.0 619.2 39.7 13.3 609.7
Current liabilitiesTrade and other payables 70.3 66.8 – – 70.3Interest bearing liabilities 0.4 0.4 – – 0.4Provisions 13.3 12.4 0.4 0.4 13.7Accrued charges 50.9 38.9 0.5 – 51.4
Total current liabilities 134.9 118.5 0.9 0.4 135.8
Non-current liabilitiesInterest bearing liabilities 234.0 234.0 – – 234.0Provisions – 1.0 – – –Deferred income tax liabilities – 5.0 – – –
Total non-current liabilities 234.0 240.0 – – 234.0
Total liabilities 368.9 358.5 0.9 0.4 369.8
Net assets 201.1 260.7 38.8 12.9 239.9
Fair value of net assets 201.1 38.8 239.9Goodwill arising on acquisition 322.4 40.0 362.4Outside equity interests in equity acquired – 6.7 6.7
523.5 85.5 609.0
Consideration –Shares issued, at fair value 275.7 – 275.7Cash paid 241.8 73.6 315.4Deferred cash settlement – 10.0 10.0Costs associated with the acquisition 6.0 1.9 7.9
Total consideration 523.5 85.5 609.0
The net cash outflow on acquisition is as follows –Net cash acquired 8.9 – 8.9Cash paid, including costs (247.8) (75.5) (323.3)
Net cash outflow (238.9) (75.5) (314.4)
1 Includes acquisition of the Northern Territory Coca-Cola franchise, CCA Indonesia outside equity interest and Grinders.
The goodwill is attributable to the high profitability of the acquired businesses, and synergies expected to arise after the acquisition. The fair value ofassets and liabilities acquired was based on various methods depending on the asset or liability. For example, the fair value of intangible assets wasbased on discounted cash flow models.The amounts recognised on acquisition above represent provisional assessments of the fair values of assets and liabilities acquired. These amounts willbe finalised within twelve months from the respective date for each acquisition.
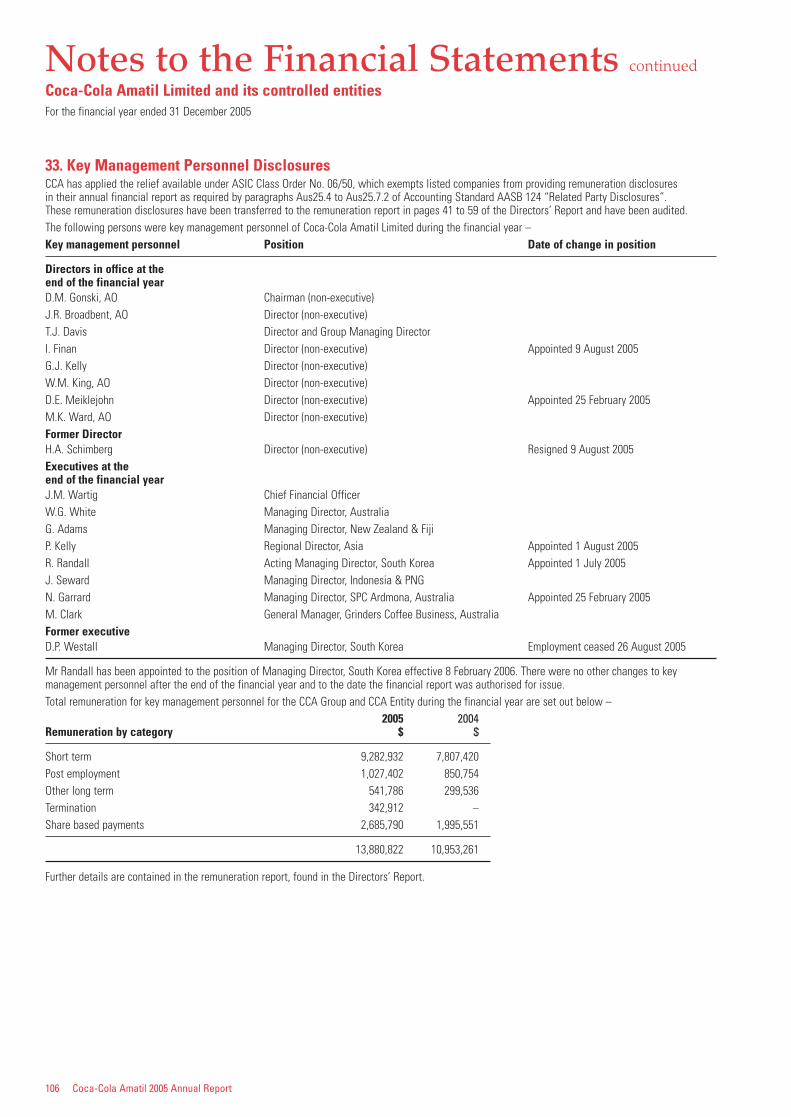
106 Coca-Cola Amatil 2005 Annual Report
Notes to the Financial Statements continued
Coca-Cola Amatil Limited and its controlled entitiesFor the financial year ended 31 December 2005
33. Key Management Personnel DisclosuresCCA has applied the relief available under ASIC Class Order No. 06/50, which exempts listed companies from providing remuneration disclosures in their annual financial report as required by paragraphs Aus25.4 to Aus25.7.2 of Accounting Standard AASB 124 “Related Party Disclosures”.These remuneration disclosures have been transferred to the remuneration report in pages 41 to 59 of the Directors’ Report and have been audited.The following persons were key management personnel of Coca-Cola Amatil Limited during the financial year –Key management personnel Position Date of change in position
Directors in office at the end of the financial yearD.M. Gonski, AO Chairman (non-executive)J.R. Broadbent, AO Director (non-executive)T.J. Davis Director and Group Managing DirectorI. Finan Director (non-executive) Appointed 9 August 2005G.J. Kelly Director (non-executive)W.M. King, AO Director (non-executive)D.E. Meiklejohn Director (non-executive) Appointed 25 February 2005M.K. Ward, AO Director (non-executive)Former DirectorH.A. Schimberg Director (non-executive) Resigned 9 August 2005Executives at the end of the financial yearJ.M. Wartig Chief Financial OfficerW.G. White Managing Director, AustraliaG. Adams Managing Director, New Zealand & FijiP. Kelly Regional Director, Asia Appointed 1 August 2005R. Randall Acting Managing Director, South Korea Appointed 1 July 2005J. Seward Managing Director, Indonesia & PNGN. Garrard Managing Director, SPC Ardmona, Australia Appointed 25 February 2005M. Clark General Manager, Grinders Coffee Business, AustraliaFormer executiveD.P. Westall Managing Director, South Korea Employment ceased 26 August 2005
Mr Randall has been appointed to the position of Managing Director, South Korea effective 8 February 2006. There were no other changes to keymanagement personnel after the end of the financial year and to the date the financial report was authorised for issue.Total remuneration for key management personnel for the CCA Group and CCA Entity during the financial year are set out below –
2005 2004Remuneration by category $ $
Short term 9,282,932 7,807,420Post employment 1,027,402 850,754Other long term 541,786 299,536Termination 342,912 –Share based payments 2,685,790 1,995,551
13,880,822 10,953,261
Further details are contained in the remuneration report, found in the Directors’ Report.
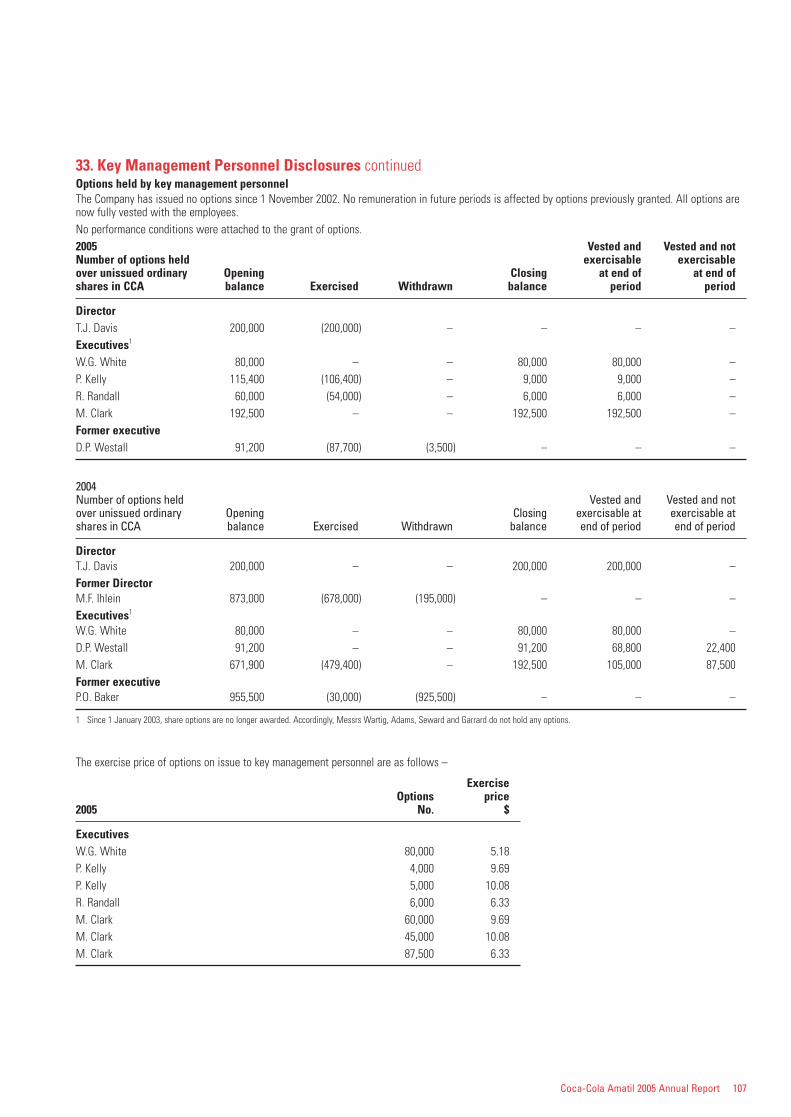
Coca-Cola Amatil 2005 Annual Report 107
33. Key Management Personnel Disclosures continuedOptions held by key management personnelThe Company has issued no options since 1 November 2002. No remuneration in future periods is affected by options previously granted. All options arenow fully vested with the employees.No performance conditions were attached to the grant of options.2005 Vested and Vested and not Number of options held exercisable exercisableover unissued ordinary Opening Closing at end of at end ofshares in CCA balance Exercised Withdrawn balance period period
DirectorT.J. Davis 200,000 (200,000) – – – –Executives1
W.G. White 80,000 – – 80,000 80,000 –P. Kelly 115,400 (106,400) – 9,000 9,000 –R. Randall 60,000 (54,000) – 6,000 6,000 –M. Clark 192,500 – – 192,500 192,500 –Former executiveD.P. Westall 91,200 (87,700) (3,500) – – –
2004Number of options held Vested and Vested and not over unissued ordinary Opening Closing exercisable at exercisable at shares in CCA balance Exercised Withdrawn balance end of period end of period
DirectorT.J. Davis 200,000 – – 200,000 200,000 –Former DirectorM.F. Ihlein 873,000 (678,000) (195,000) – – –Executives1
W.G. White 80,000 – – 80,000 80,000 –D.P. Westall 91,200 – – 91,200 68,800 22,400M. Clark 671,900 (479,400) – 192,500 105,000 87,500Former executiveP.O. Baker 955,500 (30,000) (925,500) – – –
1 Since 1 January 2003, share options are no longer awarded. Accordingly, Messrs Wartig, Adams, Seward and Garrard do not hold any options.
The exercise price of options on issue to key management personnel are as follows –
ExerciseOptions price
2005 No. $
ExecutivesW.G. White 80,000 5.18P. Kelly 4,000 9.69P. Kelly 5,000 10.08R. Randall 6,000 6.33M. Clark 60,000 9.69M. Clark 45,000 10.08M. Clark 87,500 6.33
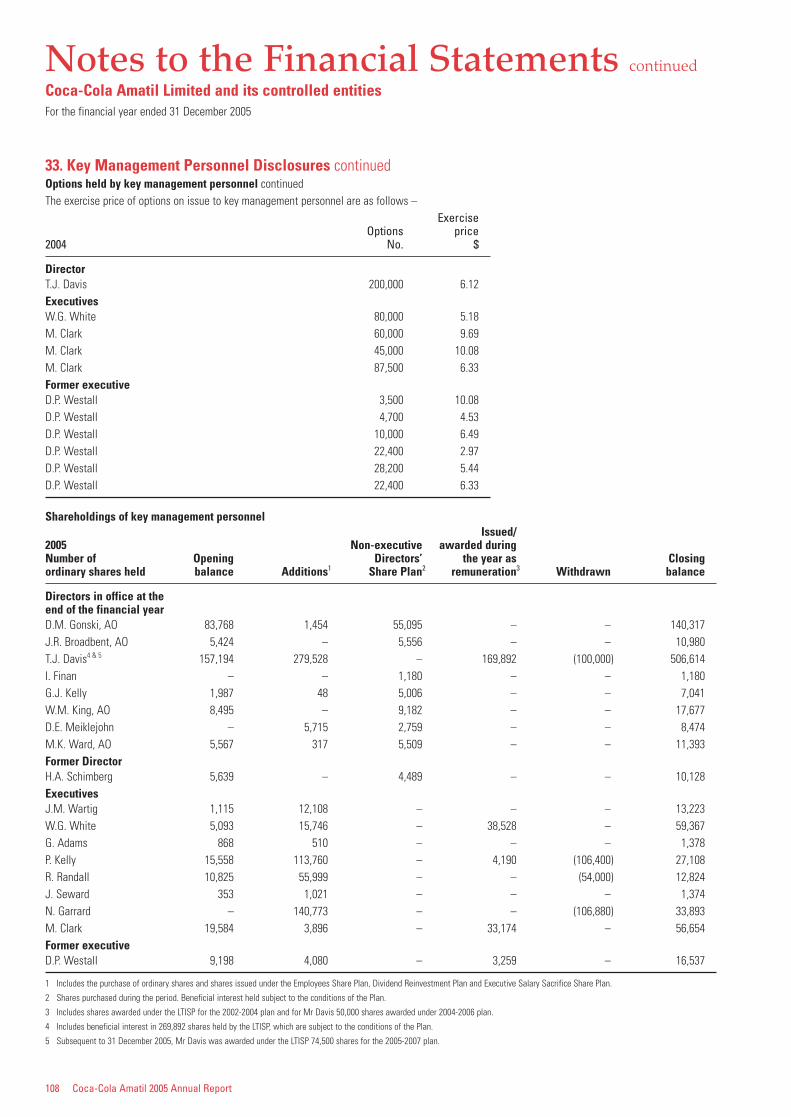
108 Coca-Cola Amatil 2005 Annual Report
Notes to the Financial Statements continued
Coca-Cola Amatil Limited and its controlled entitiesFor the financial year ended 31 December 2005
33. Key Management Personnel Disclosures continuedOptions held by key management personnel continuedThe exercise price of options on issue to key management personnel are as follows –
ExerciseOptions price
2004 No. $
DirectorT.J. Davis 200,000 6.12ExecutivesW.G. White 80,000 5.18M. Clark 60,000 9.69M. Clark 45,000 10.08M. Clark 87,500 6.33Former executiveD.P. Westall 3,500 10.08D.P. Westall 4,700 4.53D.P. Westall 10,000 6.49D.P. Westall 22,400 2.97D.P. Westall 28,200 5.44D.P. Westall 22,400 6.33
Shareholdings of key management personnelIssued/
2005 Non-executive awarded during Number of Opening Directors’ the year as Closingordinary shares held balance Additions1 Share Plan2 remuneration3 Withdrawn balance
Directors in office at the end of the financial yearD.M. Gonski, AO 83,768 1,454 55,095 – – 140,317J.R. Broadbent, AO 5,424 – 5,556 – – 10,980T.J. Davis4 & 5 157,194 279,528 – 169,892 (100,000) 506,614I. Finan – – 1,180 – – 1,180G.J. Kelly 1,987 48 5,006 – – 7,041W.M. King, AO 8,495 – 9,182 – – 17,677D.E. Meiklejohn – 5,715 2,759 – – 8,474M.K. Ward, AO 5,567 317 5,509 – – 11,393Former DirectorH.A. Schimberg 5,639 – 4,489 – – 10,128ExecutivesJ.M. Wartig 1,115 12,108 – – – 13,223W.G. White 5,093 15,746 – 38,528 – 59,367G. Adams 868 510 – – – 1,378P. Kelly 15,558 113,760 – 4,190 (106,400) 27,108R. Randall 10,825 55,999 – – (54,000) 12,824J. Seward 353 1,021 – – – 1,374N. Garrard – 140,773 – – (106,880) 33,893M. Clark 19,584 3,896 – 33,174 – 56,654Former executiveD.P. Westall 9,198 4,080 – 3,259 – 16,537
1 Includes the purchase of ordinary shares and shares issued under the Employees Share Plan, Dividend Reinvestment Plan and Executive Salary Sacrifice Share Plan.
2 Shares purchased during the period. Beneficial interest held subject to the conditions of the Plan.
3 Includes shares awarded under the LTISP for the 2002-2004 plan and for Mr Davis 50,000 shares awarded under 2004-2006 plan.
4 Includes beneficial interest in 269,892 shares held by the LTISP, which are subject to the conditions of the Plan.
5 Subsequent to 31 December 2005, Mr Davis was awarded under the LTISP 74,500 shares for the 2005-2007 plan.
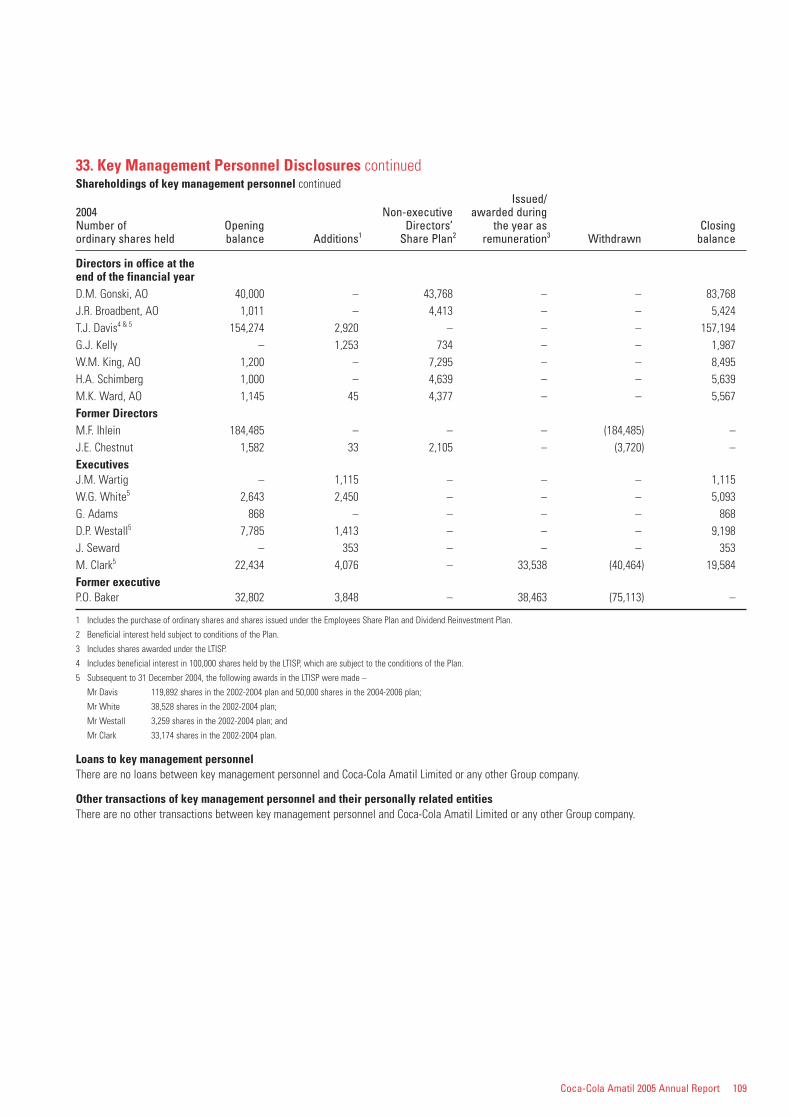
Coca-Cola Amatil 2005 Annual Report 109
33. Key Management Personnel Disclosures continuedShareholdings of key management personnel continued
Issued/2004 Non-executive awarded during Number of Opening Directors’ the year as Closingordinary shares held balance Additions1 Share Plan2 remuneration3 Withdrawn balance
Directors in office at the end of the financial yearD.M. Gonski, AO 40,000 – 43,768 – – 83,768J.R. Broadbent, AO 1,011 – 4,413 – – 5,424T.J. Davis4 & 5 154,274 2,920 – – – 157,194G.J. Kelly – 1,253 734 – – 1,987W.M. King, AO 1,200 – 7,295 – – 8,495H.A. Schimberg 1,000 – 4,639 – – 5,639M.K. Ward, AO 1,145 45 4,377 – – 5,567Former DirectorsM.F. Ihlein 184,485 – – – (184,485) –J.E. Chestnut 1,582 33 2,105 – (3,720) –ExecutivesJ.M. Wartig – 1,115 – – – 1,115W.G. White5 2,643 2,450 – – – 5,093G. Adams 868 – – – – 868D.P. Westall5 7,785 1,413 – – – 9,198J. Seward – 353 – – – 353M. Clark5 22,434 4,076 – 33,538 (40,464) 19,584Former executiveP.O. Baker 32,802 3,848 – 38,463 (75,113) –
1 Includes the purchase of ordinary shares and shares issued under the Employees Share Plan and Dividend Reinvestment Plan.
2 Beneficial interest held subject to conditions of the Plan.
3 Includes shares awarded under the LTISP.
4 Includes beneficial interest in 100,000 shares held by the LTISP, which are subject to the conditions of the Plan.
5 Subsequent to 31 December 2004, the following awards in the LTISP were made –
Mr Davis 119,892 shares in the 2002-2004 plan and 50,000 shares in the 2004-2006 plan;
Mr White 38,528 shares in the 2002-2004 plan;
Mr Westall 3,259 shares in the 2002-2004 plan; and
Mr Clark 33,174 shares in the 2002-2004 plan.
Loans to key management personnelThere are no loans between key management personnel and Coca-Cola Amatil Limited or any other Group company.
Other transactions of key management personnel and their personally related entitiesThere are no other transactions between key management personnel and Coca-Cola Amatil Limited or any other Group company.
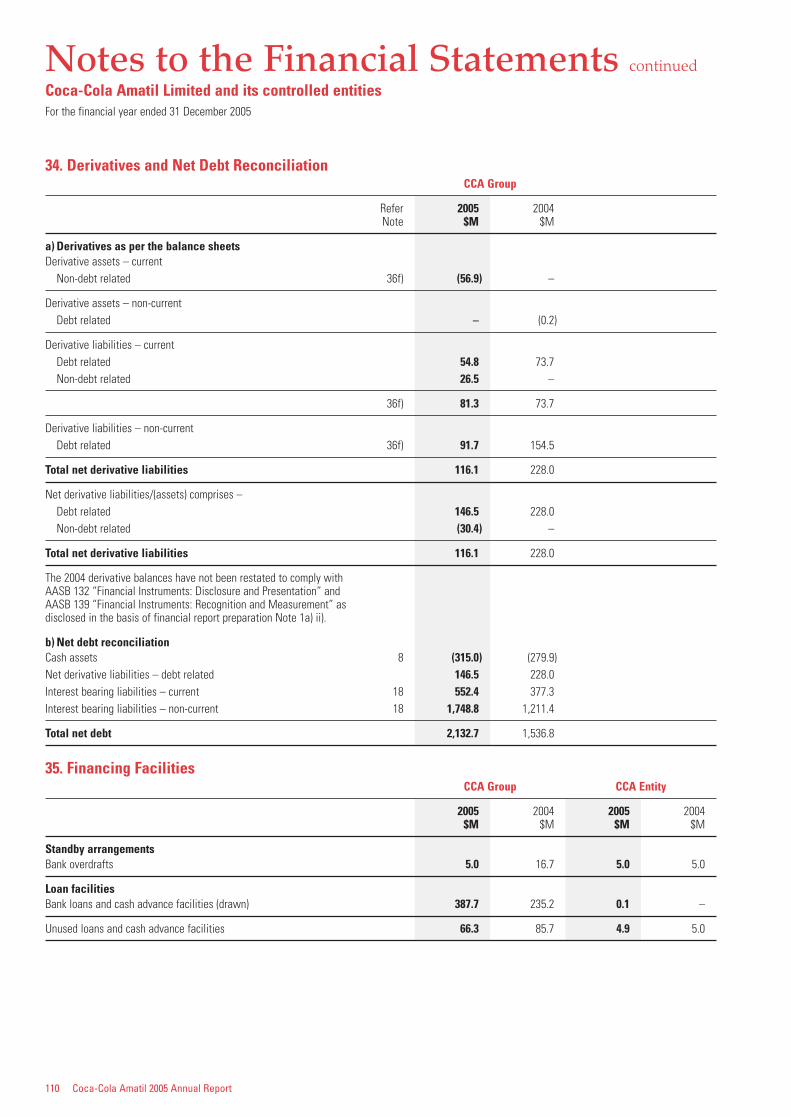
110 Coca-Cola Amatil 2005 Annual Report
Notes to the Financial Statements continued
Coca-Cola Amatil Limited and its controlled entitiesFor the financial year ended 31 December 2005
34. Derivatives and Net Debt ReconciliationCCA Group
Refer 2005 2004Note $M $M
a) Derivatives as per the balance sheetsDerivative assets – current
Non-debt related 36f) (56.9) –
Derivative assets – non-currentDebt related – (0.2)
Derivative liabilities – currentDebt related 54.8 73.7Non-debt related 26.5 –
36f) 81.3 73.7
Derivative liabilities – non-currentDebt related 36f) 91.7 154.5
Total net derivative liabilities 116.1 228.0
Net derivative liabilities/(assets) comprises –Debt related 146.5 228.0Non-debt related (30.4) –
Total net derivative liabilities 116.1 228.0
The 2004 derivative balances have not been restated to comply with AASB 132 “Financial Instruments: Disclosure and Presentation” and AASB 139 “Financial Instruments: Recognition and Measurement” as disclosed in the basis of financial report preparation Note 1a) ii).
b) Net debt reconciliationCash assets 8 (315.0) (279.9)Net derivative liabilities – debt related 146.5 228.0Interest bearing liabilities – current 18 552.4 377.3Interest bearing liabilities – non-current 18 1,748.8 1,211.4
Total net debt 2,132.7 1,536.8
35. Financing FacilitiesCCA Group CCA Entity
2005 2004 2005 2004$M $M $M $M
Standby arrangementsBank overdrafts 5.0 16.7 5.0 5.0
Loan facilitiesBank loans and cash advance facilities (drawn) 387.7 235.2 0.1 –
Unused loans and cash advance facilities 66.3 85.7 4.9 5.0
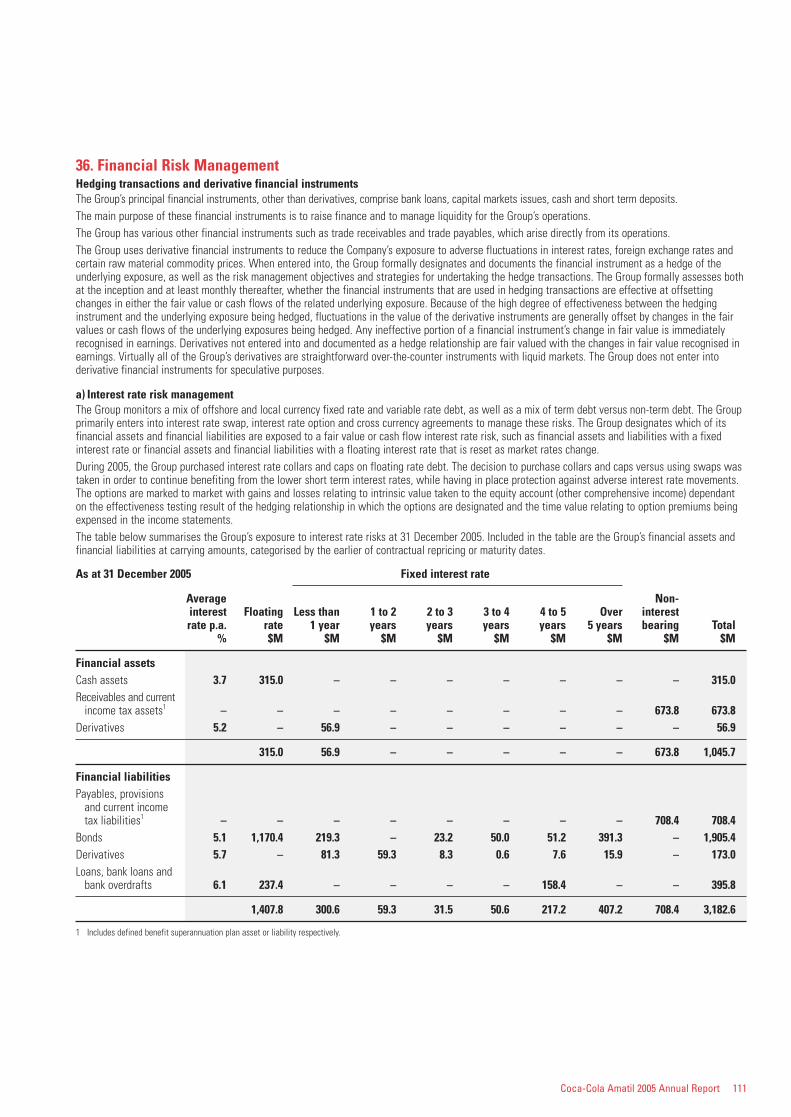
Coca-Cola Amatil 2005 Annual Report 111
36. Financial Risk ManagementHedging transactions and derivative financial instrumentsThe Group’s principal financial instruments, other than derivatives, comprise bank loans, capital markets issues, cash and short term deposits.The main purpose of these financial instruments is to raise finance and to manage liquidity for the Group’s operations.The Group has various other financial instruments such as trade receivables and trade payables, which arise directly from its operations.The Group uses derivative financial instruments to reduce the Company’s exposure to adverse fluctuations in interest rates, foreign exchange rates andcertain raw material commodity prices. When entered into, the Group formally designates and documents the financial instrument as a hedge of theunderlying exposure, as well as the risk management objectives and strategies for undertaking the hedge transactions. The Group formally assesses bothat the inception and at least monthly thereafter, whether the financial instruments that are used in hedging transactions are effective at offsettingchanges in either the fair value or cash flows of the related underlying exposure. Because of the high degree of effectiveness between the hedginginstrument and the underlying exposure being hedged, fluctuations in the value of the derivative instruments are generally offset by changes in the fairvalues or cash flows of the underlying exposures being hedged. Any ineffective portion of a financial instrument’s change in fair value is immediatelyrecognised in earnings. Derivatives not entered into and documented as a hedge relationship are fair valued with the changes in fair value recognised inearnings. Virtually all of the Group’s derivatives are straightforward over-the-counter instruments with liquid markets. The Group does not enter intoderivative financial instruments for speculative purposes.
a) Interest rate risk managementThe Group monitors a mix of offshore and local currency fixed rate and variable rate debt, as well as a mix of term debt versus non-term debt. The Groupprimarily enters into interest rate swap, interest rate option and cross currency agreements to manage these risks. The Group designates which of itsfinancial assets and financial liabilities are exposed to a fair value or cash flow interest rate risk, such as financial assets and liabilities with a fixedinterest rate or financial assets and financial liabilities with a floating interest rate that is reset as market rates change.During 2005, the Group purchased interest rate collars and caps on floating rate debt. The decision to purchase collars and caps versus using swaps wastaken in order to continue benefiting from the lower short term interest rates, while having in place protection against adverse interest rate movements.The options are marked to market with gains and losses relating to intrinsic value taken to the equity account (other comprehensive income) dependanton the effectiveness testing result of the hedging relationship in which the options are designated and the time value relating to option premiums beingexpensed in the income statements.The table below summarises the Group’s exposure to interest rate risks at 31 December 2005. Included in the table are the Group’s financial assets andfinancial liabilities at carrying amounts, categorised by the earlier of contractual repricing or maturity dates.
As at 31 December 2005 Fixed interest rate
Average Non-interest Floating Less than 1 to 2 2 to 3 3 to 4 4 to 5 Over interestrate p.a. rate 1 year years years years years 5 years bearing Total
% $M $M $M $M $M $M $M $M $M
Financial assetsCash assets 3.7 315.0 – – – – – – – 315.0Receivables and current
income tax assets1 – – – – – – – – 673.8 673.8Derivatives 5.2 – 56.9 – – – – – – 56.9
315.0 56.9 – – – – – 673.8 1,045.7
Financial liabilitiesPayables, provisions
and current income tax liabilities1 – – – – – – – – 708.4 708.4
Bonds 5.1 1,170.4 219.3 – 23.2 50.0 51.2 391.3 – 1,905.4Derivatives 5.7 – 81.3 59.3 8.3 0.6 7.6 15.9 – 173.0Loans, bank loans and
bank overdrafts 6.1 237.4 – – – – 158.4 – – 395.8
1,407.8 300.6 59.3 31.5 50.6 217.2 407.2 708.4 3,182.6
1 Includes defined benefit superannuation plan asset or liability respectively.
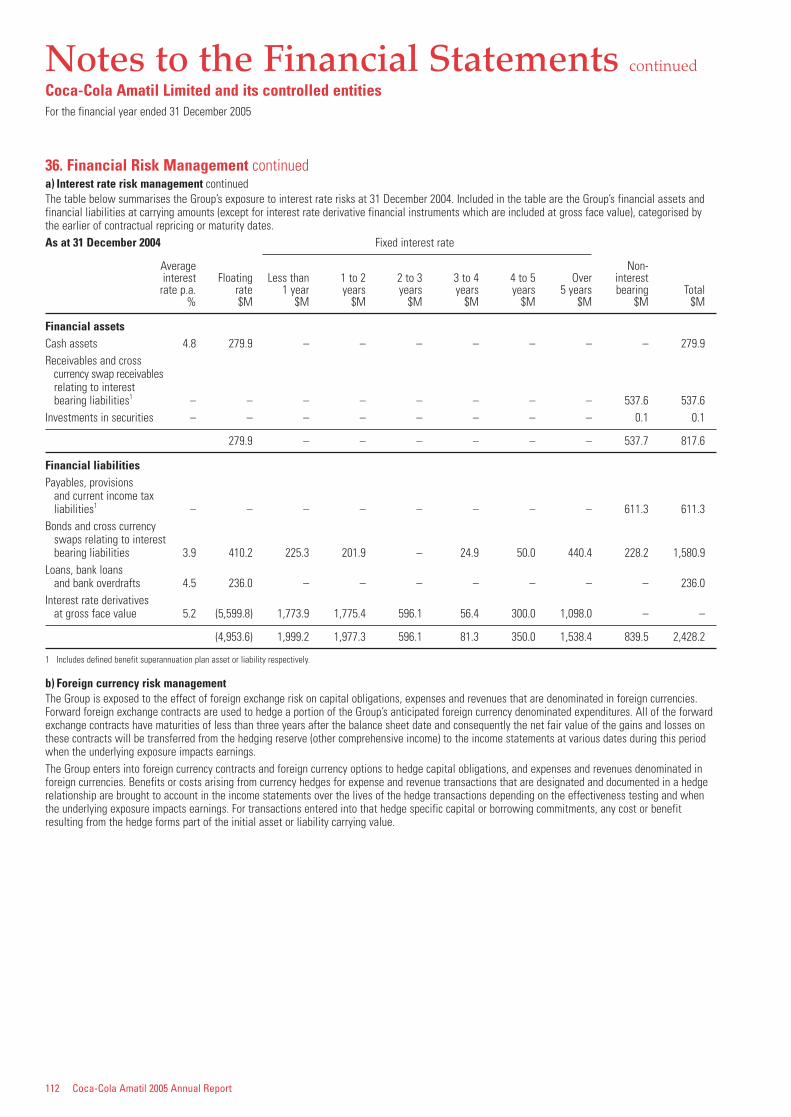
112 Coca-Cola Amatil 2005 Annual Report
Notes to the Financial Statements continued
Coca-Cola Amatil Limited and its controlled entitiesFor the financial year ended 31 December 2005
36. Financial Risk Management continueda) Interest rate risk management continuedThe table below summarises the Group’s exposure to interest rate risks at 31 December 2004. Included in the table are the Group’s financial assets andfinancial liabilities at carrying amounts (except for interest rate derivative financial instruments which are included at gross face value), categorised bythe earlier of contractual repricing or maturity dates.As at 31 December 2004 Fixed interest rate
Average Non-interest Floating Less than 1 to 2 2 to 3 3 to 4 4 to 5 Over interest
rate p.a. rate 1 year years years years years 5 years bearing Total% $M $M $M $M $M $M $M $M $M
Financial assetsCash assets 4.8 279.9 – – – – – – – 279.9Receivables and cross
currency swap receivablesrelating to interest bearing liabilities1 – – – – – – – – 537.6 537.6
Investments in securities – – – – – – – – 0.1 0.1
279.9 – – – – – – 537.7 817.6
Financial liabilitiesPayables, provisions
and current income tax liabilities1 – – – – – – – – 611.3 611.3
Bonds and cross currency swaps relating to interest bearing liabilities 3.9 410.2 225.3 201.9 – 24.9 50.0 440.4 228.2 1,580.9
Loans, bank loans and bank overdrafts 4.5 236.0 – – – – – – – 236.0
Interest rate derivatives at gross face value 5.2 (5,599.8) 1,773.9 1,775.4 596.1 56.4 300.0 1,098.0 – –
(4,953.6) 1,999.2 1,977.3 596.1 81.3 350.0 1,538.4 839.5 2,428.2
1 Includes defined benefit superannuation plan asset or liability respectively.
b) Foreign currency risk managementThe Group is exposed to the effect of foreign exchange risk on capital obligations, expenses and revenues that are denominated in foreign currencies.Forward foreign exchange contracts are used to hedge a portion of the Group’s anticipated foreign currency denominated expenditures. All of the forwardexchange contracts have maturities of less than three years after the balance sheet date and consequently the net fair value of the gains and losses onthese contracts will be transferred from the hedging reserve (other comprehensive income) to the income statements at various dates during this periodwhen the underlying exposure impacts earnings.The Group enters into foreign currency contracts and foreign currency options to hedge capital obligations, and expenses and revenues denominated inforeign currencies. Benefits or costs arising from currency hedges for expense and revenue transactions that are designated and documented in a hedgerelationship are brought to account in the income statements over the lives of the hedge transactions depending on the effectiveness testing and whenthe underlying exposure impacts earnings. For transactions entered into that hedge specific capital or borrowing commitments, any cost or benefitresulting from the hedge forms part of the initial asset or liability carrying value.
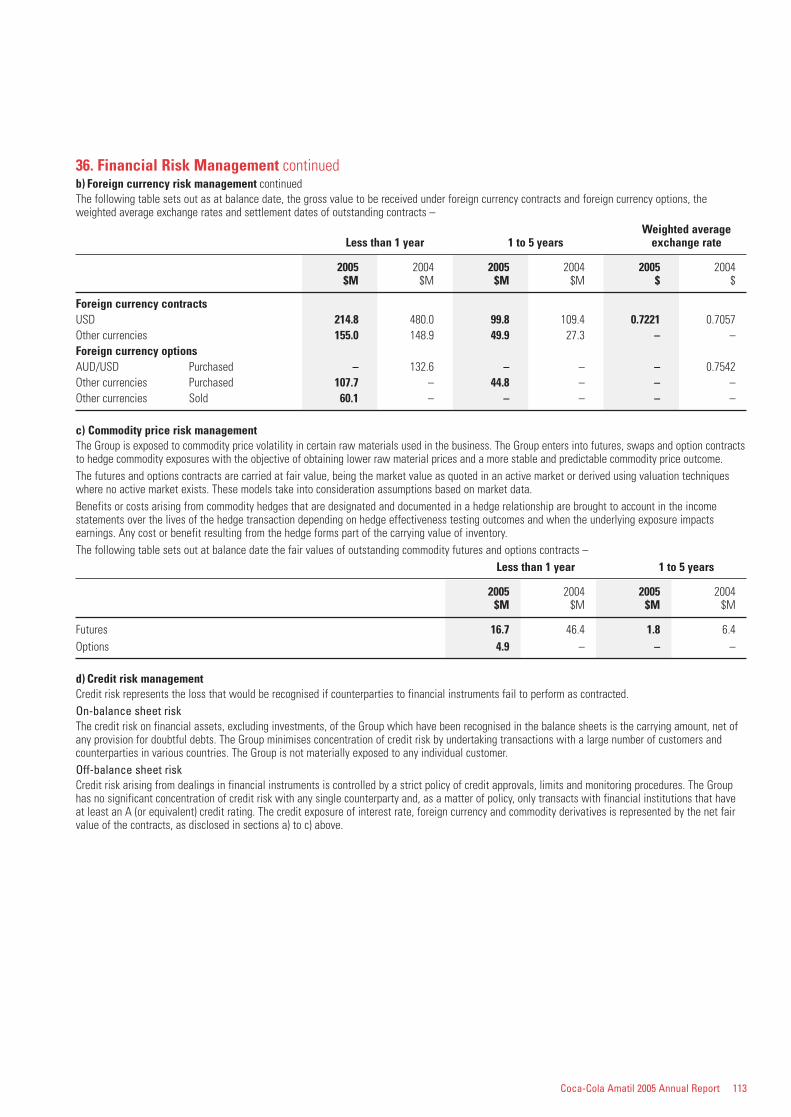
Coca-Cola Amatil 2005 Annual Report 113
36. Financial Risk Management continuedb) Foreign currency risk management continuedThe following table sets out as at balance date, the gross value to be received under foreign currency contracts and foreign currency options, theweighted average exchange rates and settlement dates of outstanding contracts –
Weighted averageLess than 1 year 1 to 5 years exchange rate
2005 2004 2005 2004 2005 2004$M $M $M $M $ $
Foreign currency contractsUSD 214.8 480.0 99.8 109.4 0.7221 0.7057Other currencies 155.0 148.9 49.9 27.3 – –Foreign currency optionsAUD/USD Purchased – 132.6 – – – 0.7542Other currencies Purchased 107.7 – 44.8 – – –Other currencies Sold 60.1 – – – – –
c) Commodity price risk managementThe Group is exposed to commodity price volatility in certain raw materials used in the business. The Group enters into futures, swaps and option contractsto hedge commodity exposures with the objective of obtaining lower raw material prices and a more stable and predictable commodity price outcome.The futures and options contracts are carried at fair value, being the market value as quoted in an active market or derived using valuation techniqueswhere no active market exists. These models take into consideration assumptions based on market data.Benefits or costs arising from commodity hedges that are designated and documented in a hedge relationship are brought to account in the incomestatements over the lives of the hedge transaction depending on hedge effectiveness testing outcomes and when the underlying exposure impactsearnings. Any cost or benefit resulting from the hedge forms part of the carrying value of inventory.The following table sets out at balance date the fair values of outstanding commodity futures and options contracts –
Less than 1 year 1 to 5 years
2005 2004 2005 2004$M $M $M $M
Futures 16.7 46.4 1.8 6.4Options 4.9 – – –
d) Credit risk managementCredit risk represents the loss that would be recognised if counterparties to financial instruments fail to perform as contracted.On-balance sheet riskThe credit risk on financial assets, excluding investments, of the Group which have been recognised in the balance sheets is the carrying amount, net ofany provision for doubtful debts. The Group minimises concentration of credit risk by undertaking transactions with a large number of customers andcounterparties in various countries. The Group is not materially exposed to any individual customer.Off-balance sheet riskCredit risk arising from dealings in financial instruments is controlled by a strict policy of credit approvals, limits and monitoring procedures. The Grouphas no significant concentration of credit risk with any single counterparty and, as a matter of policy, only transacts with financial institutions that haveat least an A (or equivalent) credit rating. The credit exposure of interest rate, foreign currency and commodity derivatives is represented by the net fairvalue of the contracts, as disclosed in sections a) to c) above.
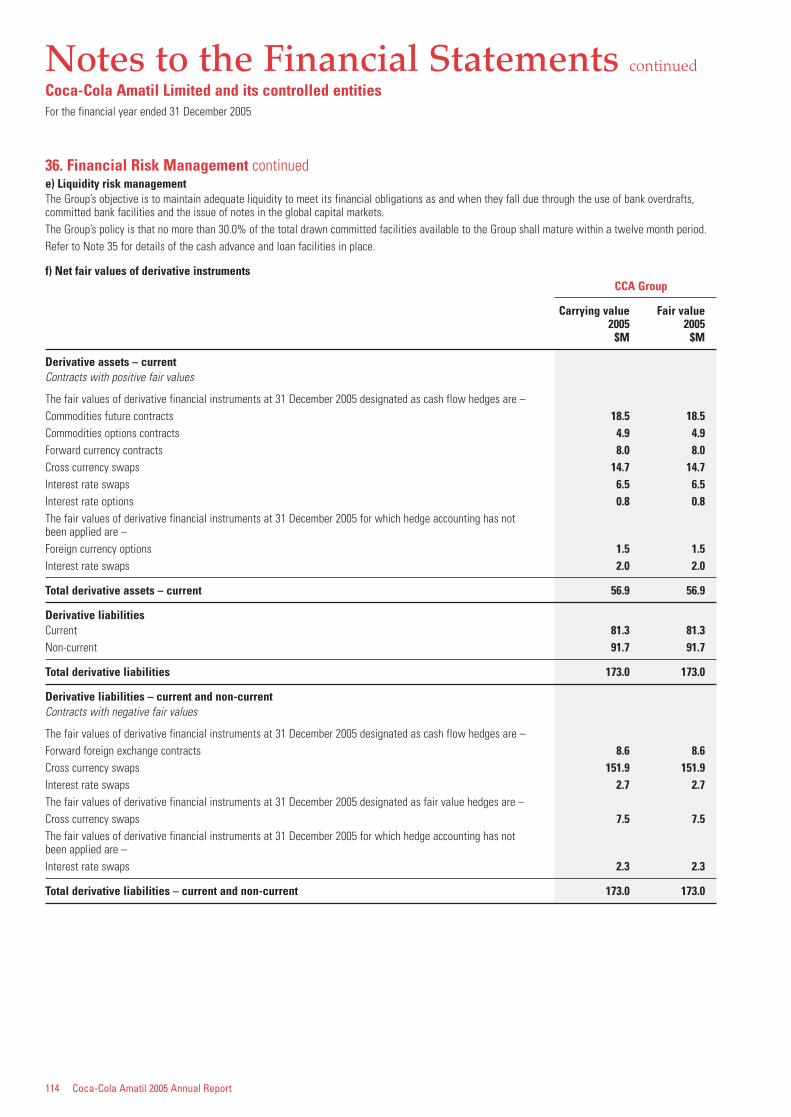
114 Coca-Cola Amatil 2005 Annual Report
Notes to the Financial Statements continued
Coca-Cola Amatil Limited and its controlled entitiesFor the financial year ended 31 December 2005
36. Financial Risk Management continuede) Liquidity risk managementThe Group’s objective is to maintain adequate liquidity to meet its financial obligations as and when they fall due through the use of bank overdrafts,committed bank facilities and the issue of notes in the global capital markets.The Group’s policy is that no more than 30.0% of the total drawn committed facilities available to the Group shall mature within a twelve month period.Refer to Note 35 for details of the cash advance and loan facilities in place.
f) Net fair values of derivative instrumentsCCA Group
Carrying value Fair value2005 2005
$M $M
Derivative assets – currentContracts with positive fair values
The fair values of derivative financial instruments at 31 December 2005 designated as cash flow hedges are –Commodities future contracts 18.5 18.5Commodities options contracts 4.9 4.9Forward currency contracts 8.0 8.0Cross currency swaps 14.7 14.7Interest rate swaps 6.5 6.5Interest rate options 0.8 0.8The fair values of derivative financial instruments at 31 December 2005 for which hedge accounting has not been applied are –Foreign currency options 1.5 1.5Interest rate swaps 2.0 2.0
Total derivative assets – current 56.9 56.9
Derivative liabilitiesCurrent 81.3 81.3Non-current 91.7 91.7
Total derivative liabilities 173.0 173.0
Derivative liabilities – current and non-currentContracts with negative fair values
The fair values of derivative financial instruments at 31 December 2005 designated as cash flow hedges are –Forward foreign exchange contracts 8.6 8.6Cross currency swaps 151.9 151.9Interest rate swaps 2.7 2.7The fair values of derivative financial instruments at 31 December 2005 designated as fair value hedges are –Cross currency swaps 7.5 7.5The fair values of derivative financial instruments at 31 December 2005 for which hedge accounting has not been applied are –Interest rate swaps 2.3 2.3
Total derivative liabilities – current and non-current 173.0 173.0
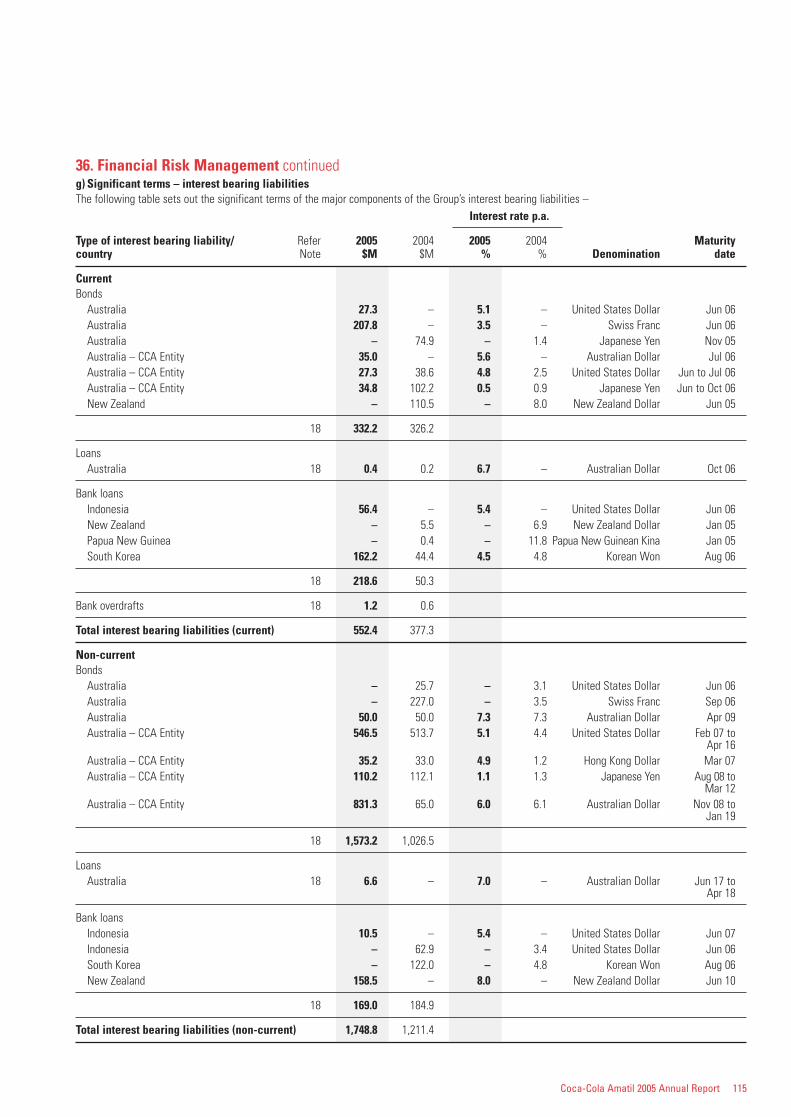
Coca-Cola Amatil 2005 Annual Report 115
36. Financial Risk Management continuedg) Significant terms – interest bearing liabilitiesThe following table sets out the significant terms of the major components of the Group’s interest bearing liabilities –
Interest rate p.a.
Type of interest bearing liability/ Refer 2005 2004 2005 2004 Maturitycountry Note $M $M % % Denomination date
CurrentBonds
Australia 27.3 – 5.1 – United States Dollar Jun 06Australia 207.8 – 3.5 – Swiss Franc Jun 06Australia – 74.9 – 1.4 Japanese Yen Nov 05Australia – CCA Entity 35.0 – 5.6 – Australian Dollar Jul 06Australia – CCA Entity 27.3 38.6 4.8 2.5 United States Dollar Jun to Jul 06Australia – CCA Entity 34.8 102.2 0.5 0.9 Japanese Yen Jun to Oct 06New Zealand – 110.5 – 8.0 New Zealand Dollar Jun 05
18 332.2 326.2
LoansAustralia 18 0.4 0.2 6.7 – Australian Dollar Oct 06
Bank loansIndonesia 56.4 – 5.4 – United States Dollar Jun 06New Zealand – 5.5 – 6.9 New Zealand Dollar Jan 05Papua New Guinea – 0.4 – 11.8 Papua New Guinean Kina Jan 05South Korea 162.2 44.4 4.5 4.8 Korean Won Aug 06
18 218.6 50.3
Bank overdrafts 18 1.2 0.6
Total interest bearing liabilities (current) 552.4 377.3
Non-currentBonds
Australia – 25.7 – 3.1 United States Dollar Jun 06Australia – 227.0 – 3.5 Swiss Franc Sep 06Australia 50.0 50.0 7.3 7.3 Australian Dollar Apr 09Australia – CCA Entity 546.5 513.7 5.1 4.4 United States Dollar Feb 07 to
Apr 16Australia – CCA Entity 35.2 33.0 4.9 1.2 Hong Kong Dollar Mar 07Australia – CCA Entity 110.2 112.1 1.1 1.3 Japanese Yen Aug 08 to
Mar 12Australia – CCA Entity 831.3 65.0 6.0 6.1 Australian Dollar Nov 08 to
Jan 19
18 1,573.2 1,026.5
LoansAustralia 18 6.6 – 7.0 – Australian Dollar Jun 17 to
Apr 18
Bank loansIndonesia 10.5 – 5.4 – United States Dollar Jun 07Indonesia – 62.9 – 3.4 United States Dollar Jun 06South Korea – 122.0 – 4.8 Korean Won Aug 06New Zealand 158.5 – 8.0 – New Zealand Dollar Jun 10
18 169.0 184.9
Total interest bearing liabilities (non-current) 1,748.8 1,211.4
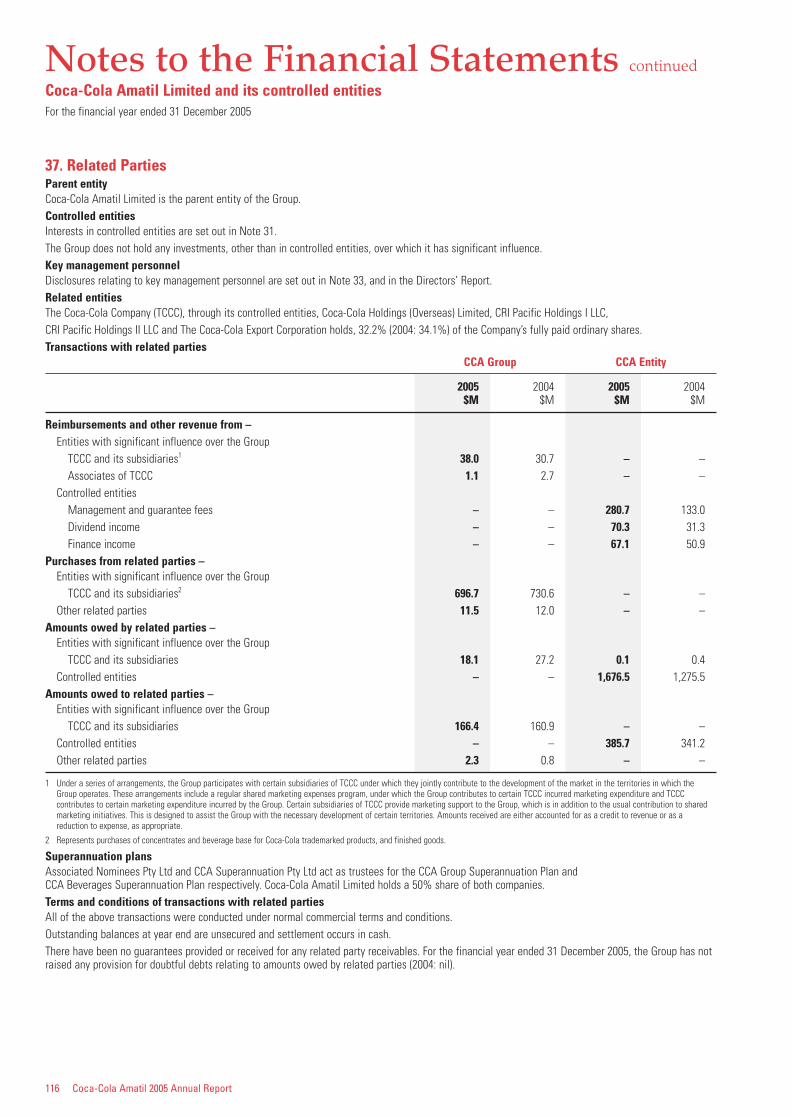
116 Coca-Cola Amatil 2005 Annual Report
Notes to the Financial Statements continued
Coca-Cola Amatil Limited and its controlled entitiesFor the financial year ended 31 December 2005
37. Related PartiesParent entityCoca-Cola Amatil Limited is the parent entity of the Group.Controlled entitiesInterests in controlled entities are set out in Note 31.The Group does not hold any investments, other than in controlled entities, over which it has significant influence.Key management personnelDisclosures relating to key management personnel are set out in Note 33, and in the Directors’ Report.Related entitiesThe Coca-Cola Company (TCCC), through its controlled entities, Coca-Cola Holdings (Overseas) Limited, CRI Pacific Holdings I LLC,CRI Pacific Holdings II LLC and The Coca-Cola Export Corporation holds, 32.2% (2004: 34.1%) of the Company’s fully paid ordinary shares.Transactions with related parties
CCA Group CCA Entity
2005 2004 2005 2004$M $M $M $M
Reimbursements and other revenue from –Entities with significant influence over the Group
TCCC and its subsidiaries1 38.0 30.7 – –Associates of TCCC 1.1 2.7 – –
Controlled entitiesManagement and guarantee fees – – 280.7 133.0Dividend income – – 70.3 31.3Finance income – – 67.1 50.9
Purchases from related parties –Entities with significant influence over the Group
TCCC and its subsidiaries2 696.7 730.6 – –Other related parties 11.5 12.0 – –
Amounts owed by related parties –Entities with significant influence over the Group
TCCC and its subsidiaries 18.1 27.2 0.1 0.4Controlled entities – – 1,676.5 1,275.5
Amounts owed to related parties –Entities with significant influence over the Group
TCCC and its subsidiaries 166.4 160.9 – –Controlled entities – – 385.7 341.2Other related parties 2.3 0.8 – –
1 Under a series of arrangements, the Group participates with certain subsidiaries of TCCC under which they jointly contribute to the development of the market in the territories in which theGroup operates. These arrangements include a regular shared marketing expenses program, under which the Group contributes to certain TCCC incurred marketing expenditure and TCCCcontributes to certain marketing expenditure incurred by the Group. Certain subsidiaries of TCCC provide marketing support to the Group, which is in addition to the usual contribution to sharedmarketing initiatives. This is designed to assist the Group with the necessary development of certain territories. Amounts received are either accounted for as a credit to revenue or as areduction to expense, as appropriate.
2 Represents purchases of concentrates and beverage base for Coca-Cola trademarked products, and finished goods.
Superannuation plansAssociated Nominees Pty Ltd and CCA Superannuation Pty Ltd act as trustees for the CCA Group Superannuation Plan andCCA Beverages Superannuation Plan respectively. Coca-Cola Amatil Limited holds a 50% share of both companies.Terms and conditions of transactions with related partiesAll of the above transactions were conducted under normal commercial terms and conditions.Outstanding balances at year end are unsecured and settlement occurs in cash.There have been no guarantees provided or received for any related party receivables. For the financial year ended 31 December 2005, the Group has notraised any provision for doubtful debts relating to amounts owed by related parties (2004: nil).
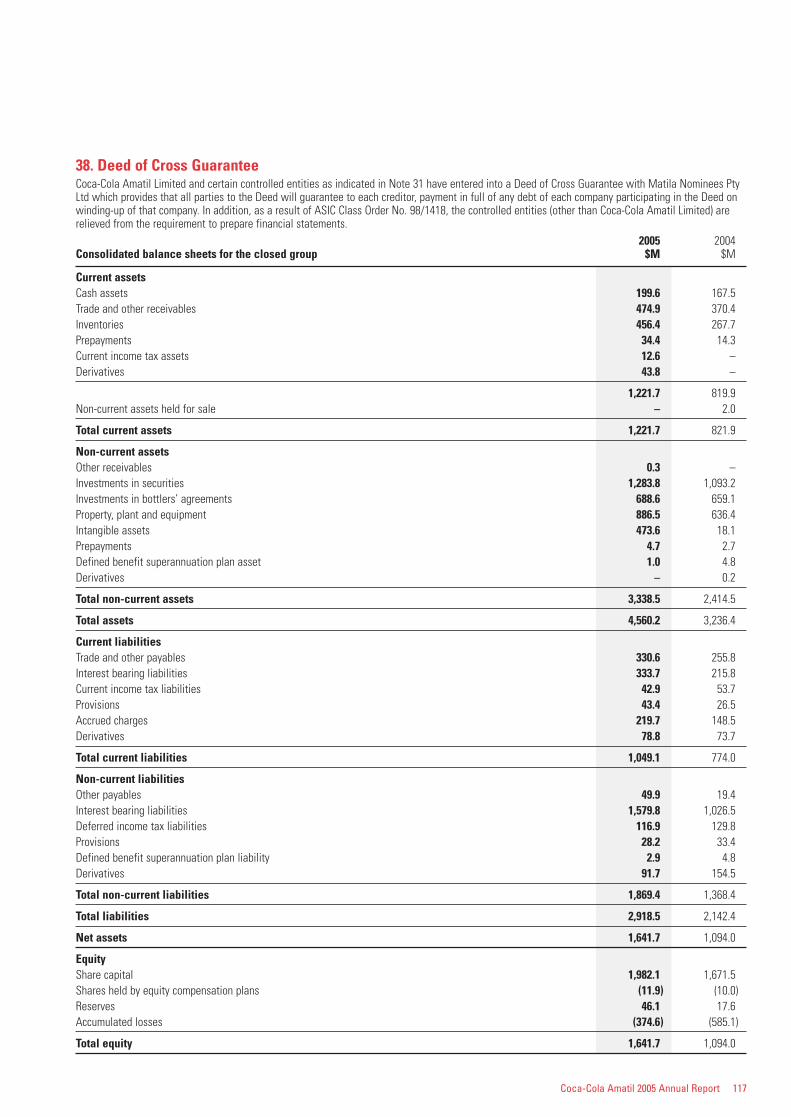
Coca-Cola Amatil 2005 Annual Report 117
38. Deed of Cross GuaranteeCoca-Cola Amatil Limited and certain controlled entities as indicated in Note 31 have entered into a Deed of Cross Guarantee with Matila Nominees PtyLtd which provides that all parties to the Deed will guarantee to each creditor, payment in full of any debt of each company participating in the Deed onwinding-up of that company. In addition, as a result of ASIC Class Order No. 98/1418, the controlled entities (other than Coca-Cola Amatil Limited) arerelieved from the requirement to prepare financial statements.
2005 2004Consolidated balance sheets for the closed group $M $M
Current assetsCash assets 199.6 167.5Trade and other receivables 474.9 370.4Inventories 456.4 267.7Prepayments 34.4 14.3Current income tax assets 12.6 –Derivatives 43.8 –
1,221.7 819.9Non-current assets held for sale – 2.0
Total current assets 1,221.7 821.9
Non-current assetsOther receivables 0.3 –Investments in securities 1,283.8 1,093.2Investments in bottlers’ agreements 688.6 659.1Property, plant and equipment 886.5 636.4Intangible assets 473.6 18.1Prepayments 4.7 2.7Defined benefit superannuation plan asset 1.0 4.8Derivatives – 0.2
Total non-current assets 3,338.5 2,414.5
Total assets 4,560.2 3,236.4
Current liabilitiesTrade and other payables 330.6 255.8Interest bearing liabilities 333.7 215.8Current income tax liabilities 42.9 53.7Provisions 43.4 26.5Accrued charges 219.7 148.5Derivatives 78.8 73.7
Total current liabilities 1,049.1 774.0
Non-current liabilitiesOther payables 49.9 19.4Interest bearing liabilities 1,579.8 1,026.5Deferred income tax liabilities 116.9 129.8Provisions 28.2 33.4Defined benefit superannuation plan liability 2.9 4.8Derivatives 91.7 154.5
Total non-current liabilities 1,869.4 1,368.4
Total liabilities 2,918.5 2,142.4
Net assets 1,641.7 1,094.0
EquityShare capital 1,982.1 1,671.5Shares held by equity compensation plans (11.9) (10.0)Reserves 46.1 17.6Accumulated losses (374.6) (585.1)
Total equity 1,641.7 1,094.0
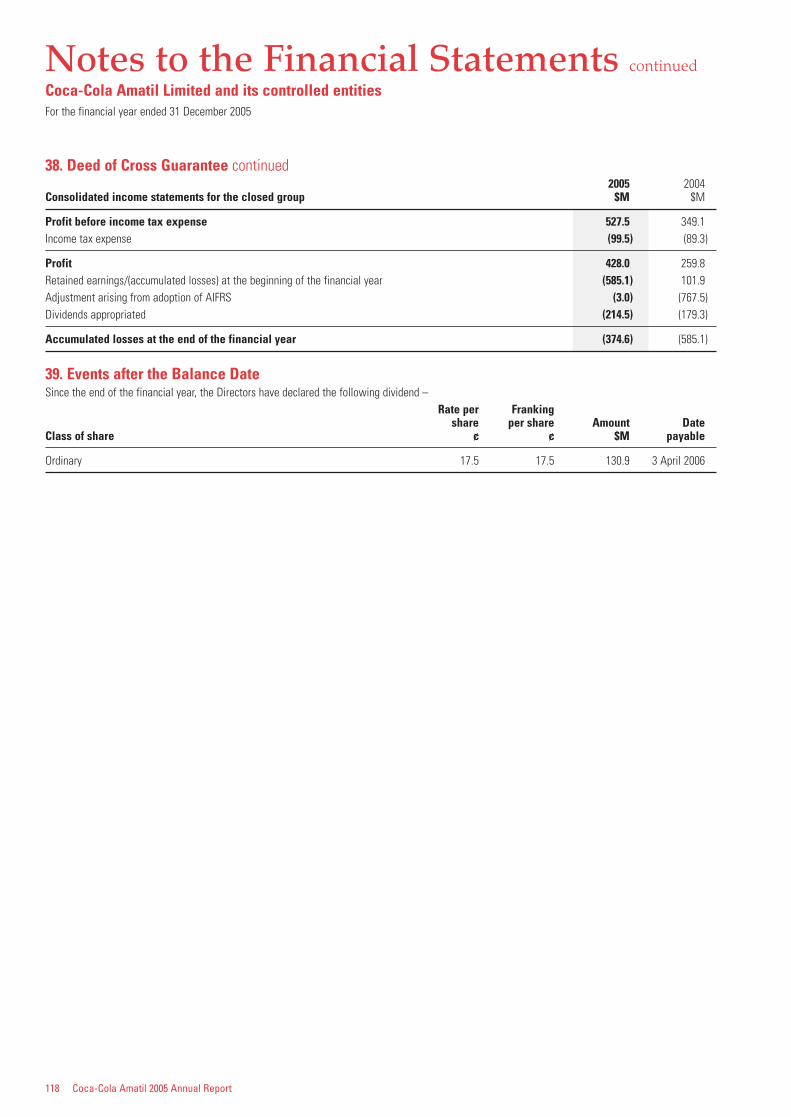
118 Coca-Cola Amatil 2005 Annual Report
38. Deed of Cross Guarantee continued2005 2004
Consolidated income statements for the closed group $M $M
Profit before income tax expense 527.5 349.1Income tax expense (99.5) (89.3)
Profit 428.0 259.8Retained earnings/(accumulated losses) at the beginning of the financial year (585.1) 101.9Adjustment arising from adoption of AIFRS (3.0) (767.5)Dividends appropriated (214.5) (179.3)
Accumulated losses at the end of the financial year (374.6) (585.1)
39. Events after the Balance DateSince the end of the financial year, the Directors have declared the following dividend –
Rate per Franking share per share Amount Date
Class of share ¢ ¢ $M payable
Ordinary 17.5 17.5 130.9 3 April 2006
Notes to the Financial Statements continued
Coca-Cola Amatil Limited and its controlled entitiesFor the financial year ended 31 December 2005
Coca-Cola Amatil 2005 Annual Report 119
In accordance with a resolution of the Directors of Coca-Cola Amatil Limited dated 9th February 2006, I state that –
In the opinion of the Directors –
a) the financial statements and notes and the additional disclosures included in the Directors’ Report designated as audited, of the Company and of theconsolidated entity, are in accordance with the Corporations Act 2001, including –i) giving a true and fair view of the Company’s and the consolidated entity’s financial position as at 31 December 2005, and of their performance for
the year ended on that date; andii) complying with Australian Accounting Standards and the Corporations Regulations 2001; and
b) at the date of this declaration, there are reasonable grounds to believe that the Company will be able to pay its debts as and when they become dueand payable; and
c) there are reasonable grounds to believe that the Company and the wholly owned controlled entities identified in Note 31 to the financial statementsas being parties to a Deed of Cross Guarantee with Matila Nominees Pty Ltd as trustee, will be able to meet any obligations or liabilities to which theyare, or may become, subject by virtue of the Deed.
This declaration has been made after receiving the declarations required to be made to Directors by the Group Managing Director and Chief FinancialOfficer, in accordance with section 295A of the Corporations Act 2001 for the financial year ended 31 December 2005.
On behalf of the Directors
T.J. DavisSydney9th day of February 2006
Directors’ DeclarationCoca-Cola Amatil Limited and its controlled entities
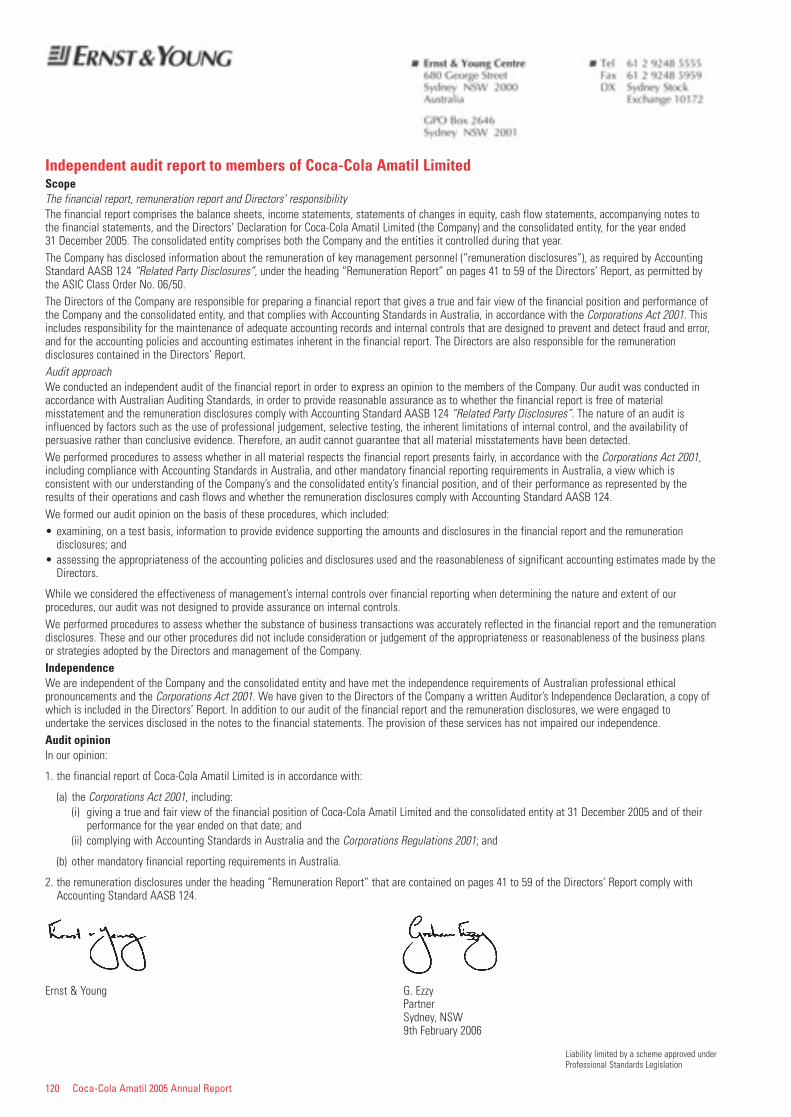
120 Coca-Cola Amatil 2005 Annual Report
Independent audit report to members of Coca-Cola Amatil LimitedScopeThe financial report, remuneration report and Directors’ responsibilityThe financial report comprises the balance sheets, income statements, statements of changes in equity, cash flow statements, accompanying notes tothe financial statements, and the Directors’ Declaration for Coca-Cola Amatil Limited (the Company) and the consolidated entity, for the year ended 31 December 2005. The consolidated entity comprises both the Company and the entities it controlled during that year.The Company has disclosed information about the remuneration of key management personnel (“remuneration disclosures”), as required by AccountingStandard AASB 124 “Related Party Disclosures”, under the heading “Remuneration Report” on pages 41 to 59 of the Directors’ Report, as permitted bythe ASIC Class Order No. 06/50.The Directors of the Company are responsible for preparing a financial report that gives a true and fair view of the financial position and performance ofthe Company and the consolidated entity, and that complies with Accounting Standards in Australia, in accordance with the Corporations Act 2001. Thisincludes responsibility for the maintenance of adequate accounting records and internal controls that are designed to prevent and detect fraud and error,and for the accounting policies and accounting estimates inherent in the financial report. The Directors are also responsible for the remunerationdisclosures contained in the Directors’ Report.Audit approachWe conducted an independent audit of the financial report in order to express an opinion to the members of the Company. Our audit was conducted inaccordance with Australian Auditing Standards, in order to provide reasonable assurance as to whether the financial report is free of materialmisstatement and the remuneration disclosures comply with Accounting Standard AASB 124 “Related Party Disclosures”. The nature of an audit isinfluenced by factors such as the use of professional judgement, selective testing, the inherent limitations of internal control, and the availability ofpersuasive rather than conclusive evidence. Therefore, an audit cannot guarantee that all material misstatements have been detected.We performed procedures to assess whether in all material respects the financial report presents fairly, in accordance with the Corporations Act 2001,including compliance with Accounting Standards in Australia, and other mandatory financial reporting requirements in Australia, a view which isconsistent with our understanding of the Company’s and the consolidated entity’s financial position, and of their performance as represented by theresults of their operations and cash flows and whether the remuneration disclosures comply with Accounting Standard AASB 124.We formed our audit opinion on the basis of these procedures, which included:• examining, on a test basis, information to provide evidence supporting the amounts and disclosures in the financial report and the remuneration
disclosures; and• assessing the appropriateness of the accounting policies and disclosures used and the reasonableness of significant accounting estimates made by the
Directors.
While we considered the effectiveness of management’s internal controls over financial reporting when determining the nature and extent of ourprocedures, our audit was not designed to provide assurance on internal controls.We performed procedures to assess whether the substance of business transactions was accurately reflected in the financial report and the remunerationdisclosures. These and our other procedures did not include consideration or judgement of the appropriateness or reasonableness of the business plansor strategies adopted by the Directors and management of the Company.IndependenceWe are independent of the Company and the consolidated entity and have met the independence requirements of Australian professional ethicalpronouncements and the Corporations Act 2001. We have given to the Directors of the Company a written Auditor’s Independence Declaration, a copy ofwhich is included in the Directors’ Report. In addition to our audit of the financial report and the remuneration disclosures, we were engaged toundertake the services disclosed in the notes to the financial statements. The provision of these services has not impaired our independence.Audit opinionIn our opinion:
1. the financial report of Coca-Cola Amatil Limited is in accordance with:
(a) the Corporations Act 2001, including:(i) giving a true and fair view of the financial position of Coca-Cola Amatil Limited and the consolidated entity at 31 December 2005 and of their
performance for the year ended on that date; and(ii) complying with Accounting Standards in Australia and the Corporations Regulations 2001; and
(b) other mandatory financial reporting requirements in Australia.
2. the remuneration disclosures under the heading “Remuneration Report” that are contained on pages 41 to 59 of the Directors’ Report comply withAccounting Standard AASB 124.
Ernst & Young G. EzzyPartnerSydney, NSW9th February 2006
Liability limited by a scheme approved underProfessional Standards Legislation
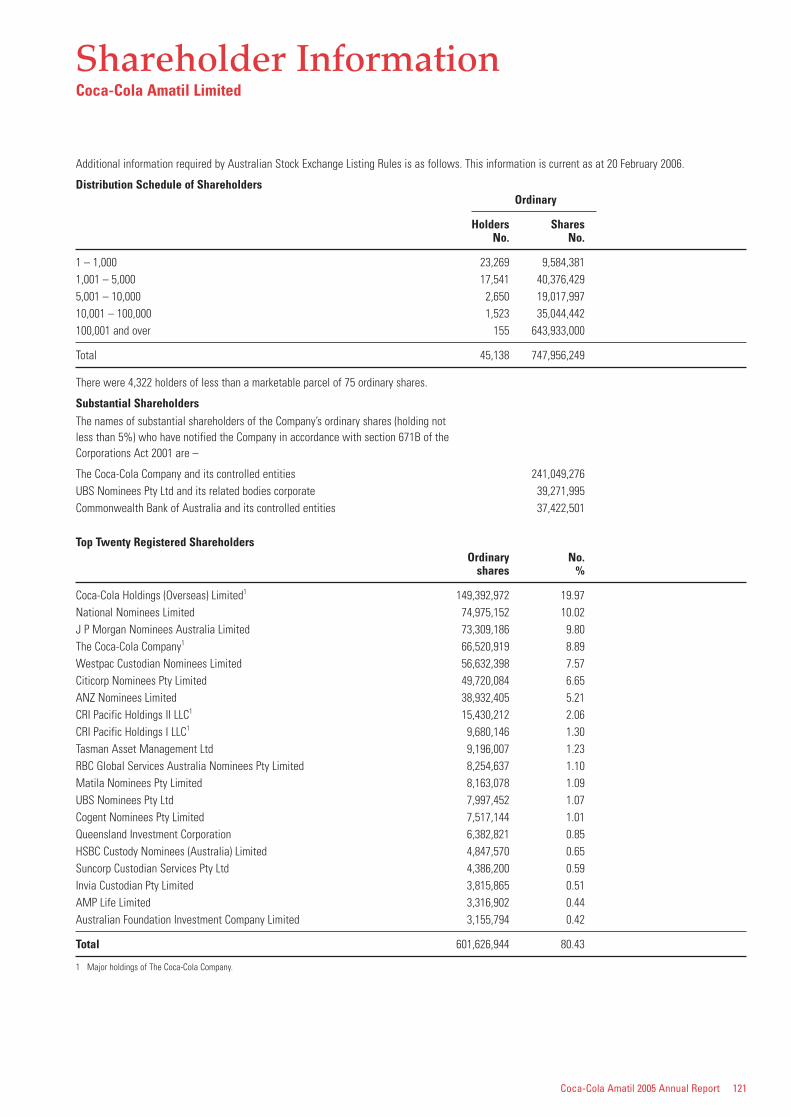
Coca-Cola Amatil 2005 Annual Report 121
Additional information required by Australian Stock Exchange Listing Rules is as follows. This information is current as at 20 February 2006.
Distribution Schedule of ShareholdersOrdinary
Holders SharesNo. No.
1 – 1,000 23,269 9,584,3811,001 – 5,000 17,541 40,376,4295,001 – 10,000 2,650 19,017,99710,001 – 100,000 1,523 35,044,442100,001 and over 155 643,933,000
Total 45,138 747,956,249
There were 4,322 holders of less than a marketable parcel of 75 ordinary shares.
Substantial ShareholdersThe names of substantial shareholders of the Company’s ordinary shares (holding not less than 5%) who have notified the Company in accordance with section 671B of the Corporations Act 2001 are –
The Coca-Cola Company and its controlled entities 241,049,276UBS Nominees Pty Ltd and its related bodies corporate 39,271,995Commonwealth Bank of Australia and its controlled entities 37,422,501
Top Twenty Registered ShareholdersOrdinary No.
shares %
Coca-Cola Holdings (Overseas) Limited1 149,392,972 19.97National Nominees Limited 74,975,152 10.02J P Morgan Nominees Australia Limited 73,309,186 9.80The Coca-Cola Company1 66,520,919 8.89Westpac Custodian Nominees Limited 56,632,398 7.57Citicorp Nominees Pty Limited 49,720,084 6.65ANZ Nominees Limited 38,932,405 5.21CRI Pacific Holdings II LLC1 15,430,212 2.06CRI Pacific Holdings I LLC1 9,680,146 1.30Tasman Asset Management Ltd 9,196,007 1.23RBC Global Services Australia Nominees Pty Limited 8,254,637 1.10Matila Nominees Pty Limited 8,163,078 1.09UBS Nominees Pty Ltd 7,997,452 1.07Cogent Nominees Pty Limited 7,517,144 1.01Queensland Investment Corporation 6,382,821 0.85HSBC Custody Nominees (Australia) Limited 4,847,570 0.65Suncorp Custodian Services Pty Ltd 4,386,200 0.59Invia Custodian Pty Limited 3,815,865 0.51AMP Life Limited 3,316,902 0.44Australian Foundation Investment Company Limited 3,155,794 0.42
Total 601,626,944 80.43
1 Major holdings of The Coca-Cola Company.
Shareholder InformationCoca-Cola Amatil Limited
122 Coca-Cola Amatil 2005 Annual Report
Business activitiesCCA’s beverage business operatesin six countries in the Asia-Pacificregion – Australia, New Zealand,Fiji, South Korea, Indonesia and Papua New Guinea. CCA manufactures, markets and distributes products of The Coca-Cola Company, as wellas local brands in some countries.The acquisition of SPC Ardmonawas completed on 25 February2005. SPC Ardmona is Australia’slargest manufacturer in the ready-to-eat packaged fruit sector withleading brands such as SPC,Ardmona, Goulburn Valley and IXL.
Annual GeneralMeetingCCA’s Annual General Meetingwill be held on Wednesday, 3 May 2006 at the City RecitalHall, Angel Place (Pitt Streetentrance), Sydney at 2pm.
Voting rightsShareholders are encouraged toattend the Annual GeneralMeeting, however, when this isnot possible, they are encouragedto use the form of proxy by whichthey can register their vote or voteonline atwww.linkmarketservices.com.au.
Every member present personallyor by proxy, attorney orrepresentative shall on a show ofhands have one vote and on a pollhave one vote for every share held.
ListingsCCA shares are listed under thesymbol CCL on Australian StockExchange (ASX). The securities of the Company are traded onASX on the issuer sponsored sub-register or under CHESS(Clearing House Electronic Sub-register System).
CCA ordinary shares are traded inthe United States in the form ofAmerican Depositary Receipts(ADRs) issued by The Bank ofNew York, as Depositary.
Each ADR represents two ordinaryshares. The ADRs trade over-the-counter under the symbol CCLAY.
Company publicationsOther than the Annual Report,CCA publishes Shareholder News,a newsletter sent to shareholderswith the September dividendadvice.
Share buy backThe Company is not currentlyundertaking an on-market sharebuy back.
WebsiteAll material contained in thisreport is also available on theCompany’s website. In addition,earnings announcements to ASX,media releases, presentations bysenior management and dividendhistory are also published on thewebsite. The address iswww.ccamatil.com.
DividendsIn 2005, CCA paid fully frankeddividends and has a payout policyof 70% to 80% of net profit,subject to the ongoing cash needsof the business.
It is expected that dividends paidin the future will be fully frankedfor at least the next two years.
DividendReinvestment PlanParticipation in the DividendReinvestment Plan (DRP) isoptional and available to allshareholders (except those with aregistered address in the UnitedStates). Shareholders may elect toparticipate for all or only some oftheir shares. Shares are currentlyissued under the DRP at adiscount of 3% from the marketprice of CCA ordinary shares. Themarket price is calculated at eachdividend payment, being theweighted average price of allordinary CCA shares sold on ASXon the first day on which thoseshares are quoted ex dividend andthe following nine business days.There are no brokerage, stampduty or other transaction costspayable by participants.
Participation in the DRP iscurrently capped at 100,000shares per shareholder.
Note: the DRP rules may bemodified, suspended orterminated by the Directors at anytime after giving one month’snotice to DRP participants.
For additional information and anapplication form, please contactour share registry, Link MarketServices on 61 2 8280 7121.
Tax File NumbersAustralian tax payers who do notprovide details of their tax filenumber will have dividendssubjected to the top marginalpersonal tax rate plus Medicarelevy. It may be in the interests ofshareholders to ensure that taxfile numbers have been suppliedto the share registry. Forms areavailable from the share registryshould you wish to notify theregistry of your tax file number ortax exemption details.
Change of addressIt is important for shareholders tonotify the share registry in writingpromptly of any change of address.As a security measure, the oldaddress should also be quoted aswell as your shareholder referencenumber (SRN).
Shareholder Information continued
Coca-Cola Amatil 2005 Annual Report 123
AIFRS Australian equivalents to International Financial Reporting Standards.
C&L Convenience and leisure.
Capital Employed Equity plus net debt.
Carbonated Soft Drinks, CSDs Non-alcoholic beverages with carbon dioxide.
CCA Coca-Cola Amatil.
Coca-Cola System, Coke System The Coca-Cola Company and its bottling partners.
COGS Cost of goods sold.
EBIT Earnings before interest and tax.
EBIT Margin Earnings before interest and tax divided by revenue from sales of beverages and food.
HoReCa Hotels, Restaurants and Cafes.
Non-Alcoholic Ready-To-Drink Non-alcoholic beverages, including carbonated and non-carbonated drinks.Beverages, NARTD
Non-Carbonated Beverages, NCBs Includes packaged water, ready-to-drink coffee and tea, juices/nectar, sports drinks, fruit still drinks and otherready-to-drink beverages.
PET Polyethylene Terephthalate. The material from which CCA’s plastic soft drink bottles are manufactured.
PNG Papua New Guinea.
Return on Capital Employed, ROCE Earnings before interest and tax divided by the average of the opening and closing balances of capital employed.
RGB Returnable glass bottles.
RTD Ready-to-Drink.
SPCA SPC Ardmona.
TCCC The Coca-Cola Company.
Unit Case A unit case is the equivalent of twenty four 8oz (237mL) serves or 5.678 litres.
Coca-Cola Trademarks ‘Coca-Cola’, ‘Coca-Cola zero’,’Vanilla Coke’, ‘Coke’, ‘diet Coca-Cola’, ‘Coke Light’, ‘diet Coke’, ‘Sprite’, ‘Sprite zero’, ‘Fanta’, ‘Fanta Lite’, ‘Lift’, ‘Minute Maid’, ’pump’ (Australia only), ’Neverfail’, ‘Peats Ridge’,’e2’, ’Frestea’, ‘Fruitopia’, ’Keri’, ’Kiwi Blue’, ‘Lift Plus’, ‘Aquashot’, ’Nestea’, ‘Powerade’ ‘Nescafé’, ‘Qoo’,
‘Recharge by Sprite’, ‘Crusta’, ‘SoonSoo 100’, ‘Schweppes’ (excluding Australia), ‘Always’, the ‘Always’ logo,the Dynamic Ribbon device and the contour bottle design are trademarks of The Coca-Cola Company.
Glossary
124 Coca-Cola Amatil 2005 Annual Report
ChairmanDavid Gonski
Corporate OfficeTerry DavisGroup Managing Director
John WartigGroup Chief Financial Officer
David WylieCompany Secretary
Senior ManagementWarwick WhiteManaging Director, Australia
Nessa O’SullivanChief Financial Officer, Australia
George AdamsManaging Director, New Zealand & Fiji
Peter KellyRegional Director, Asia
Reg RandallManaging Director, South Korea
David GateChief Financial Officer, South Korea
Bapak MugijantoPresident Commissioner, Indonesia
John SewardManaging Director, Indonesia & PNG
Steve GallagherChief Financial Officer, Indonesia
Charles RossiGeneral Manager, PNG
Ian FurlongGeneral Manager, Fiji
Nigel GarrardManaging Director, SPC Ardmona
Steve PerkinsChief Financial Officer, SPC Ardmona
Registered OfficeCoca-Cola Amatil Limited71 Macquarie StreetSydney NSW 2000Ph: 61 132 653Fx: 61 2 9259 6623
New ZealandThe Oasis, Mt WellingtonAucklandPh: 64 9 570 3000
South Korea84-11, 5-Ka, Namdaemun-RoChung-Ku Seoul 100-753Ph: 822 2259 5888
IndonesiaJI. Teuku Umar KM 46Cibitung. Bekasi 17520Ph: 62 21 8832 2222
Papua New GuineaErica StreetLae, Morobe ProvincePh: 675 472 1033
FijiRatu Dovi RoadLaucala Beach EstatePh: 679 394 333
SPC Ardmona19-25 Camberwell RoadHawthorn East Vic 3123Ph: 61 3 9861 8900
AuditorErnst & YoungChartered Accountants
For enquiries about CCA shares:
Link Market Services LimitedLocked Bag A14Sydney South NSW 1235Ph: 61 2 8280 7121Fx: 61 2 9287 0303Email: [email protected]
For enquiries about American Depositary Receipts (ADR):
The Bank of New YorkADR Division101 Barclay Street, 22WNew York, New York 10286 USAToll Free Ph: 1 888 269 2377
For enquiries about the operations of the Company:
Investor Relations71 Macquarie StreetSydney NSW 2000Ph: 61 2 9259 6159Fx: 61 2 9259 6614Email: [email protected]
Company Directories
Share Registry and Other Enquiries
Coca-Cola Amatil 2005 Annual Report 125
Calendar of Events 2006De
sign
ed b
y De
sign
ate
02 9
299
7711
Thursday, 9 February 2006 2005 full year results announcement
Monday, 20 February 2006 Ex-dividend date (final dividend)
Friday, 24 February 2006 Record date for dividend entitlements
Monday, 3 April 2006 2005 final ordinary dividend paid
Wednesday, 3 May 2006 Annual General Meeting
Thursday, 10 August 2006 2006 half year results announcement
Monday, 21 August 2006 Ex-dividend date (interim dividend)
Friday, 25 August 2006 Record date for dividend entitlements
Tuesday, 3 October 2006 2006 interim ordinary dividend paid
Coca-Cola Amatil LimitedABN 26 004 139 397