Embed Size (px)
Citation preview
• All participants are muted upon log in
• For questions, all participants will be un-muted after the presentation is completed
• Put yourself on mute by pressing *6 so that you do not detract other participants
Please Note:
Welcome to SWAMP Webinar
Title: Sublethal responses to environmental stressors in fish: an integrative multi-biomarker approach
Welcome to SWAMP Webinar
Title: Sublethal responses to environmental stressors in fish: an integrative multi-biomarker approach
Sublethal responses to environmental stressors in fish: an integrative multi-biomarker
approach
Sublethal responses to environmental stressors in fish: an integrative multi-biomarker
approach
Aquatic Toxicology LaboratorySchool of Veterinary Medicine - UC Davis
Richard Connon, Sebastian Beggel, Erika Fritsch, Richard Connon, Sebastian Beggel, Erika Fritsch, Leandro D’Abronzo, Becca Hudson-Davies, Leandro D’Abronzo, Becca Hudson-Davies,
Linda Deanovic, and Inge WernerLinda Deanovic, and Inge Werner2
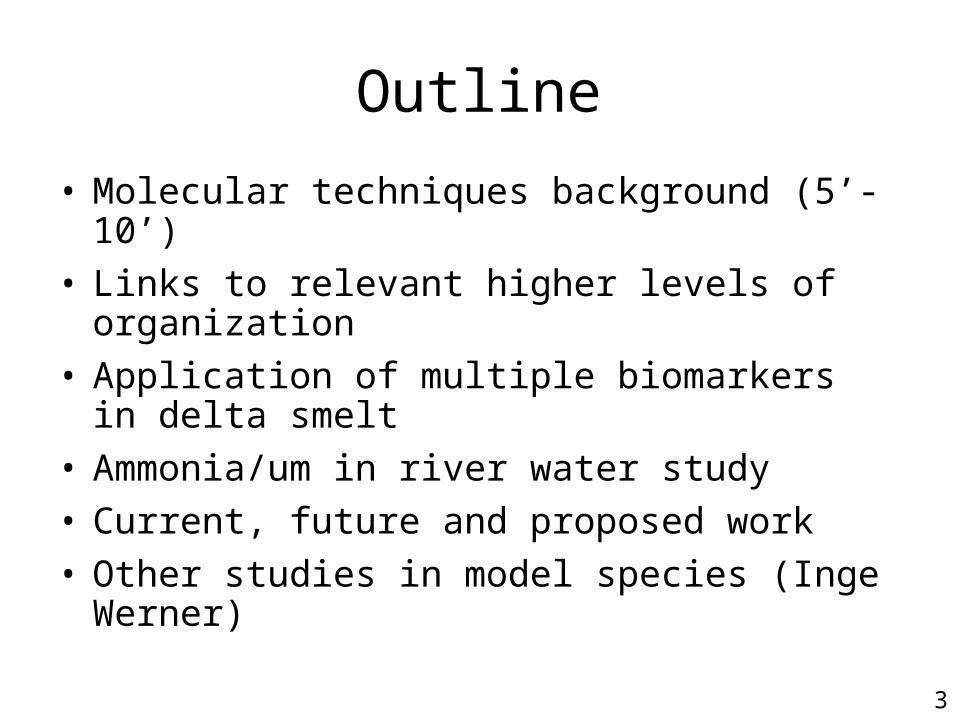
Outline
• Molecular techniques background (5’-10’)• Links to relevant higher levels of
organization• Application of multiple biomarkers in delta
smelt• Ammonia/um in river water study• Current, future and proposed work• Other studies in model species (Inge
Werner)
3
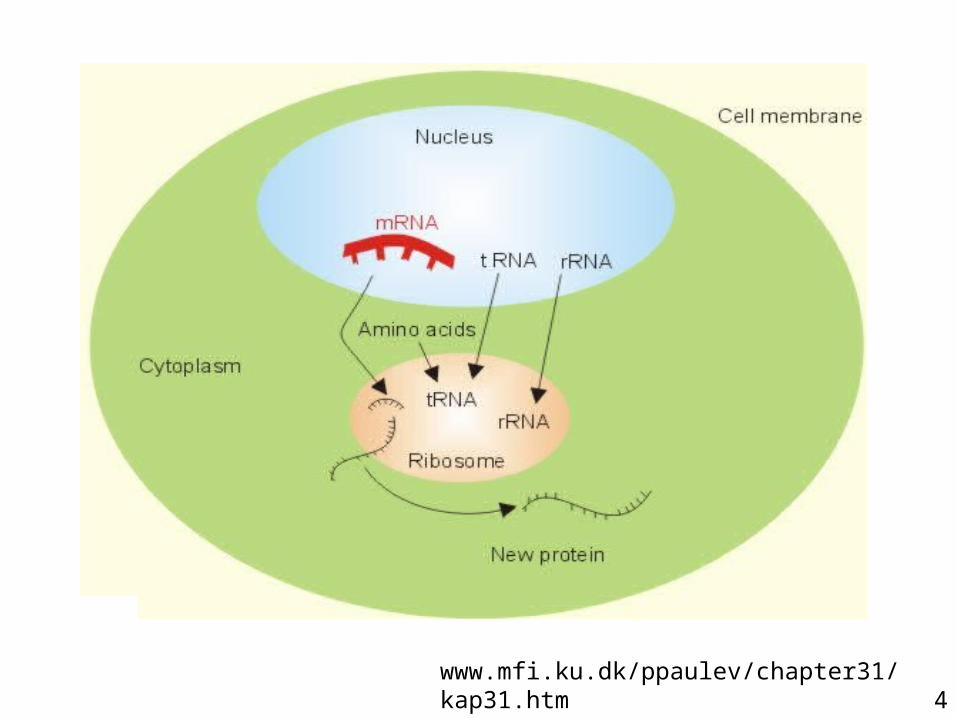
www.mfi.ku.dk/ppaulev/chapter31/kap31.htm 4
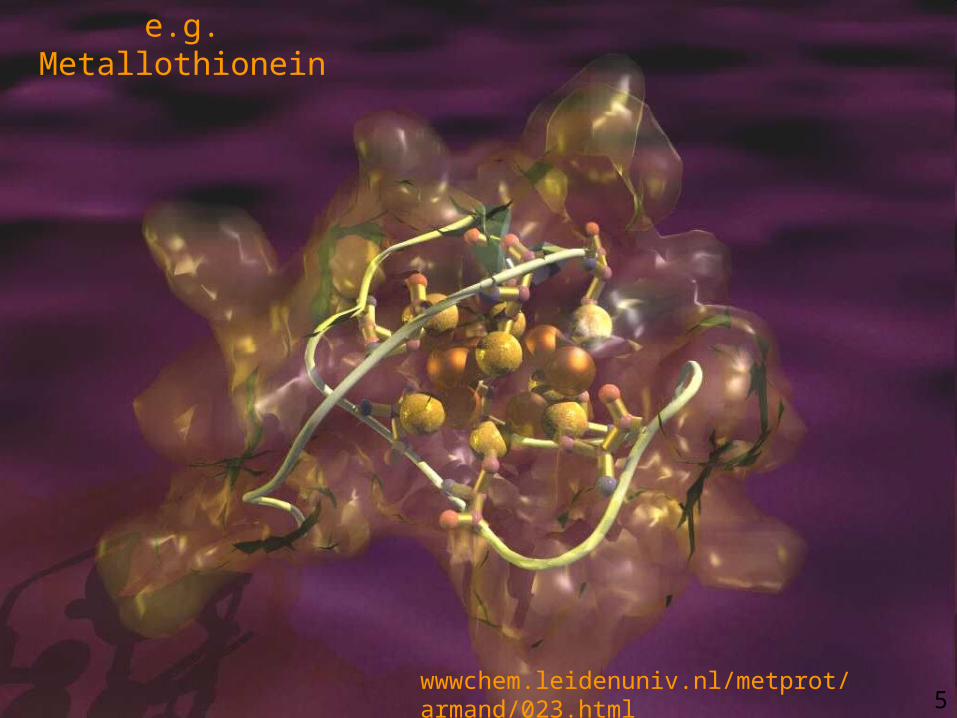
wwwchem.leidenuniv.nl/metprot/armand/023.html
e.g. Metallothionein
5
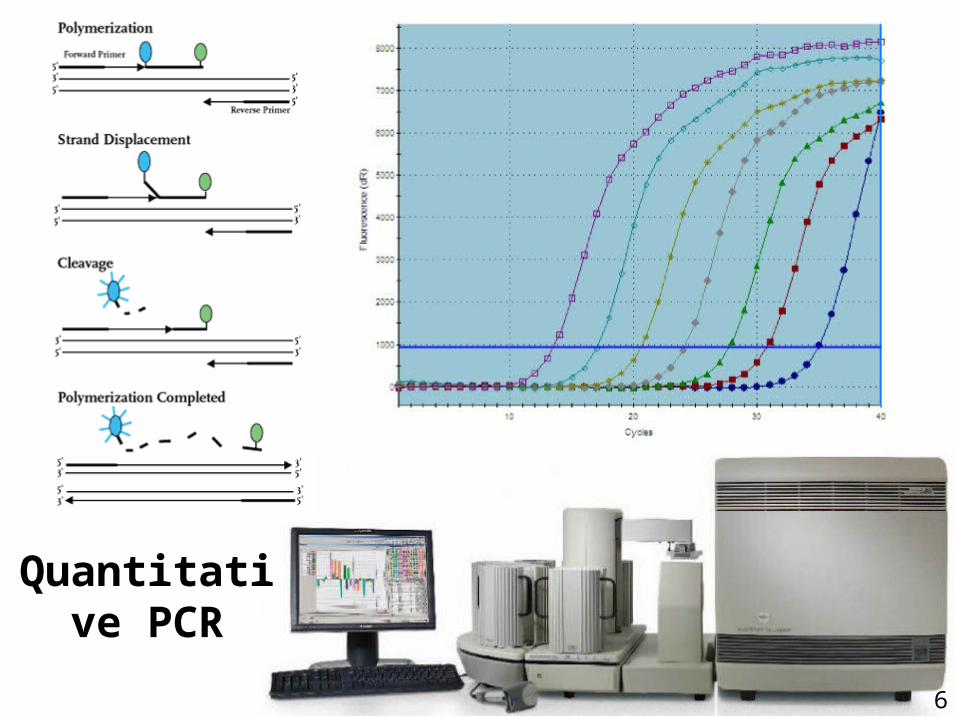
Quantitative PCR
6
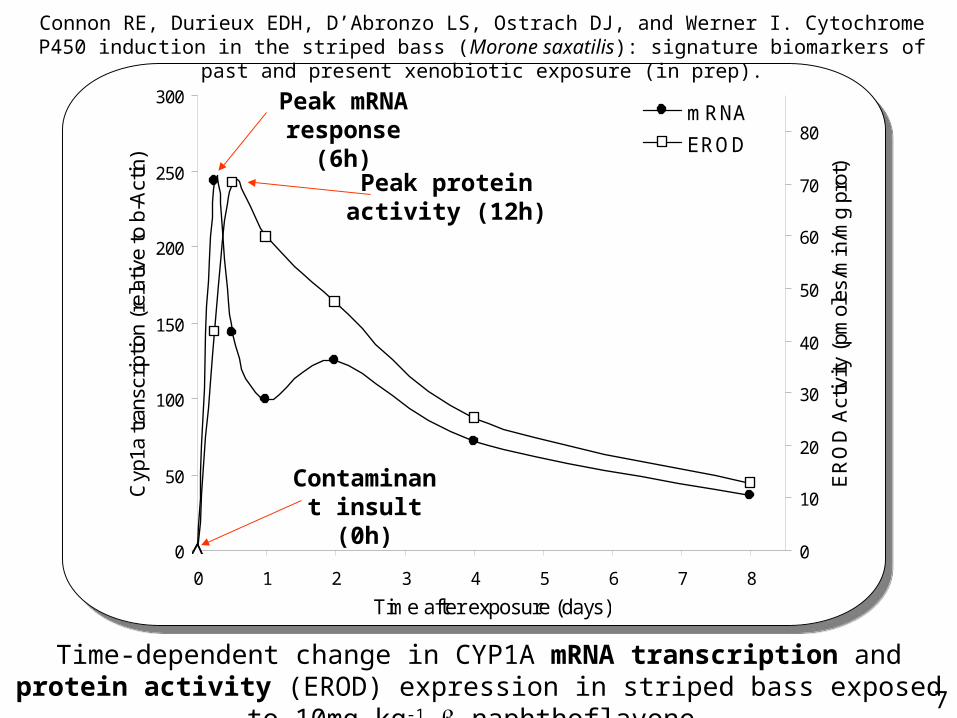
Time-dependent change in CYP1A mRNA transcription and protein activity (EROD) expression in striped bass exposed to 10mg.kg-1 -naphthoflavone.
0
50
100
150
200
250
300
0 1 2 3 4 5 6 7 8
Time after exposure (days)
Cyp
1a tr
ansc
riptio
n (r
elat
ive
to b
-Act
in)
0
10
20
30
40
50
60
70
80
ER
OD
Act
ivity
(pm
oles
/min
/mg
prot
)
mRNA
EROD
Contaminant insult (0h)
Peak mRNA response (6h)
Peak protein activity (12h)
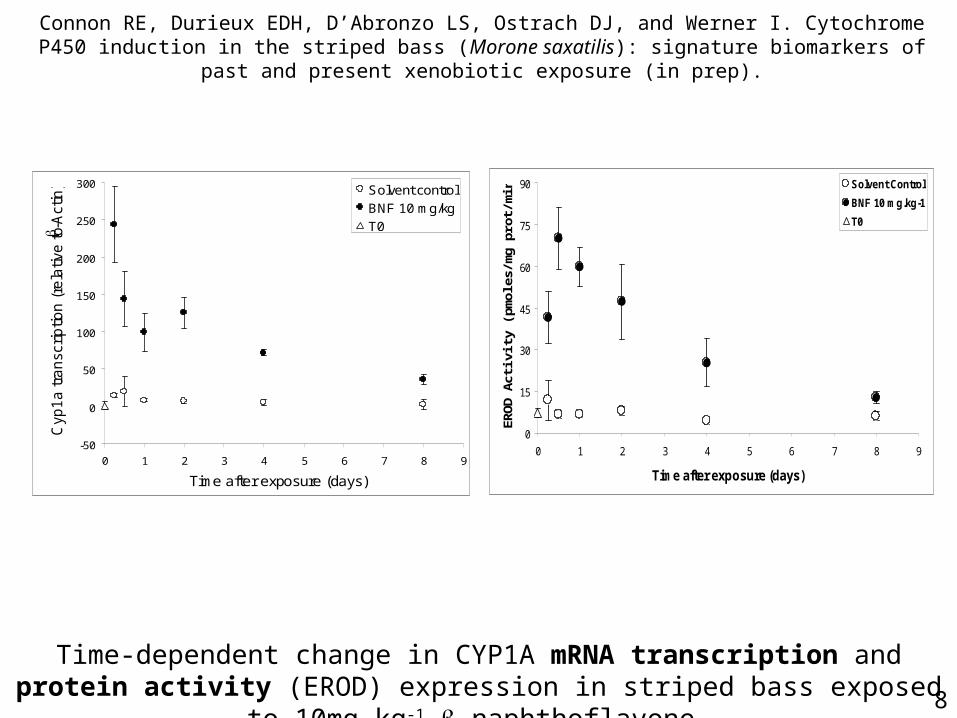
Connon RE, Durieux EDH, D’Abronzo LS, Ostrach DJ, and Werner I. Cytochrome P450 induction in the striped bass (Morone saxatilis): signature biomarkers of past and present xenobiotic exposure (in prep).
7
-50
0
50
100
150
200
250
300
0 1 2 3 4 5 6 7 8 9
Time after exposure (days)
Cyp
1a
tra
nsc
rip
tion
(re
lativ
e t
o
-A
ctin
) Solvent control
BNF 10 mg/kg
T0
0
15
30
45
60
75
90
0 1 2 3 4 5 6 7 8 9
Time after exposure (days)
ER
OD
Act
ivity
(pm
oles
/mg
prot
/min
)
Solvent Control
BNF 10 mg.kg-1
T0
8
Time-dependent change in CYP1A mRNA transcription and protein activity (EROD) expression in striped bass exposed to 10mg.kg-1 -naphthoflavone.
Connon RE, Durieux EDH, D’Abronzo LS, Ostrach DJ, and Werner I. Cytochrome P450 induction in the striped bass (Morone saxatilis): signature biomarkers of past and present xenobiotic exposure (in prep).
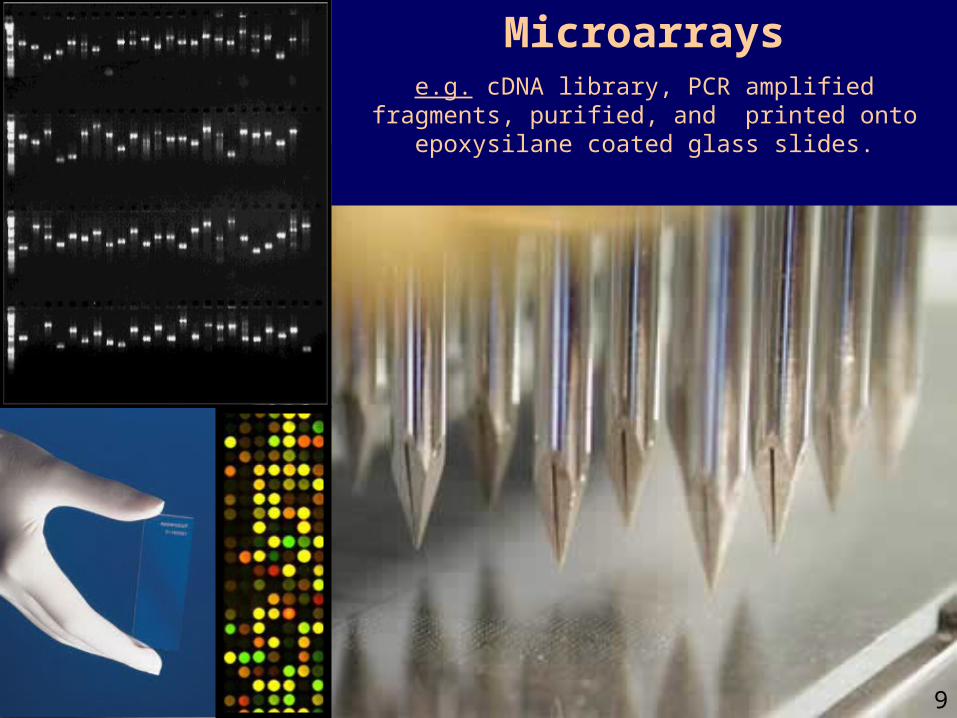
Microarrayse.g. cDNA library, PCR amplified fragments, purified, and
printed onto epoxysilane coated glass slides.
9
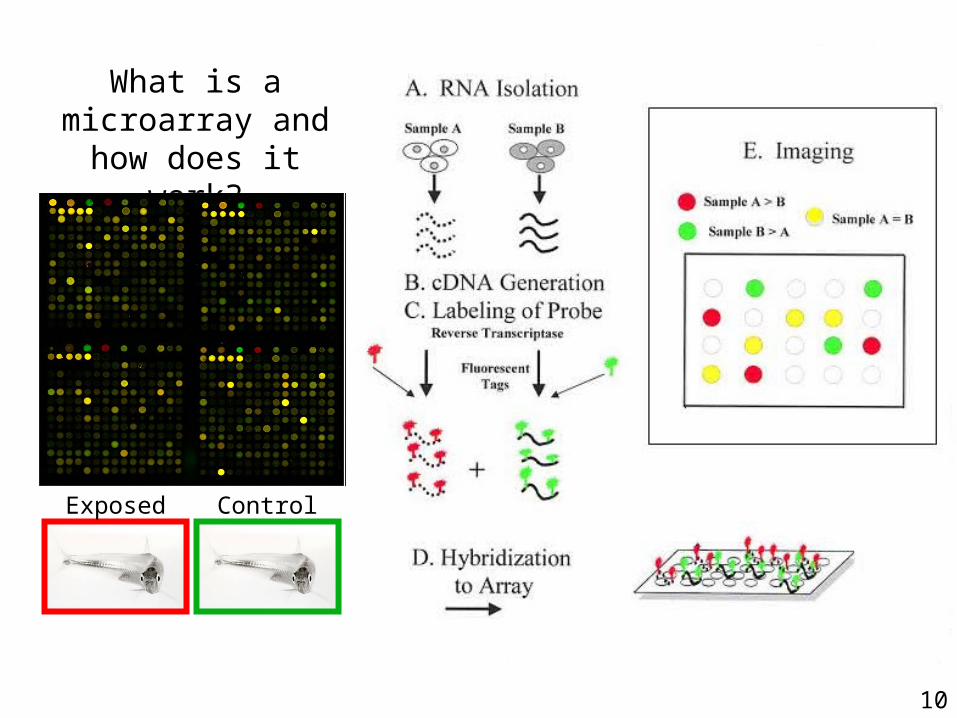
What is a microarray and
how does it work?
Exposed Control
10
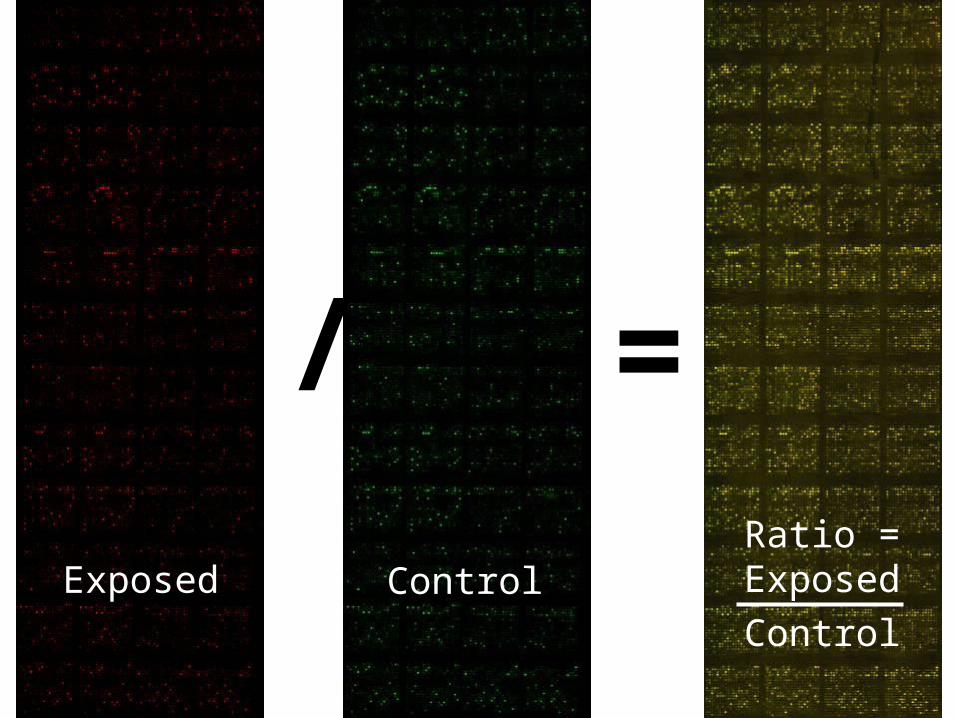
/ =
Exposed ControlRatio = ExposedControl
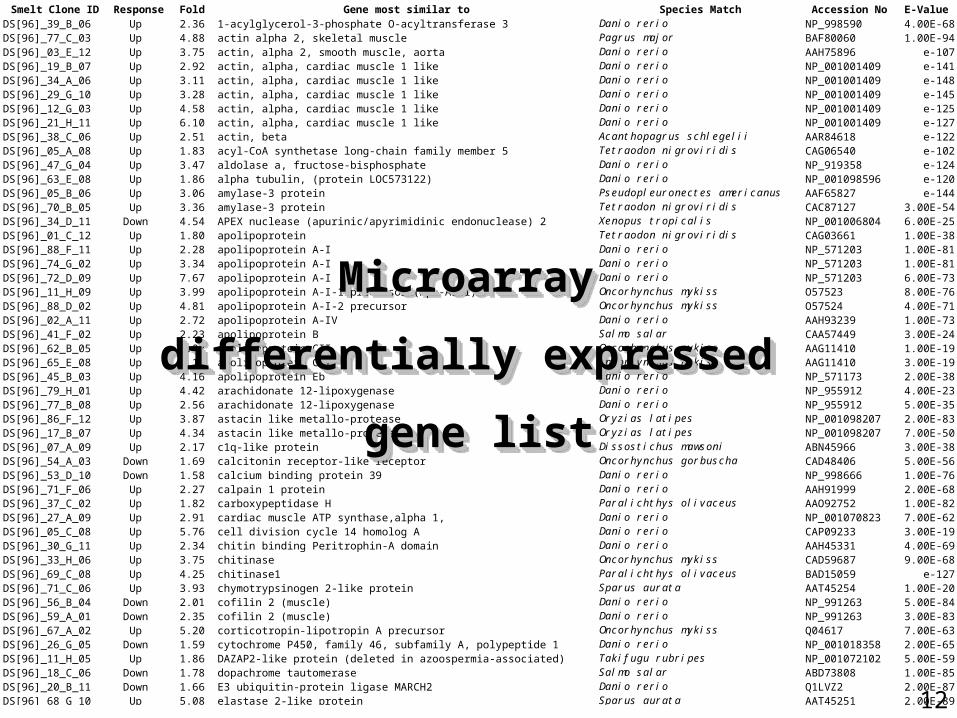
Smelt Clone ID Response Fold Gene most similar to Species Match Accession No E-ValueDS[96]_39_B_06 Up 2.36 1-acylglycerol-3-phosphate O-acyltransferase 3 Danio rerio NP_998590 4.00E-68DS[96]_77_C_03 Up 4.88 actin alpha 2, skeletal muscle Pagrus major BAF80060 1.00E-94DS[96]_03_E_12 Up 3.75 actin, alpha 2, smooth muscle, aorta Danio rerio AAH75896 e-107DS[96]_19_B_07 Up 2.92 actin, alpha, cardiac muscle 1 like Danio rerio NP_001001409 e-141DS[96]_34_A_06 Up 3.11 actin, alpha, cardiac muscle 1 like Danio rerio NP_001001409 e-148DS[96]_29_G_10 Up 3.28 actin, alpha, cardiac muscle 1 like Danio rerio NP_001001409 e-145DS[96]_12_G_03 Up 4.58 actin, alpha, cardiac muscle 1 like Danio rerio NP_001001409 e-125DS[96]_21_H_11 Up 6.10 actin, alpha, cardiac muscle 1 like Danio rerio NP_001001409 e-127DS[96]_38_C_06 Up 2.51 actin, beta Acanthopagrus schlegelii AAR84618 e-122DS[96]_05_A_08 Up 1.83 acyl-CoA synthetase long-chain family member 5 Tetraodon nigroviridis CAG06540 e-102DS[96]_47_G_04 Up 3.47 aldolase a, fructose-bisphosphate Danio rerio NP_919358 e-124DS[96]_63_E_08 Up 1.86 alpha tubulin, (protein LOC573122) Danio rerio NP_001098596 e-120DS[96]_05_B_06 Up 3.06 amylase-3 protein Pseudopleuronectes americanus AAF65827 e-144DS[96]_70_B_05 Up 3.36 amylase-3 protein Tetraodon nigroviridis CAC87127 3.00E-54DS[96]_34_D_11 Down 4.54 APEX nuclease (apurinic/apyrimidinic endonuclease) 2 Xenopus tropicalis NP_001006804 6.00E-25DS[96]_01_C_12 Up 1.80 apolipoprotein Tetraodon nigroviridis CAG03661 1.00E-38DS[96]_88_F_11 Up 2.28 apolipoprotein A-I Danio rerio NP_571203 1.00E-81DS[96]_74_G_02 Up 3.34 apolipoprotein A-I Danio rerio NP_571203 1.00E-81DS[96]_72_D_09 Up 7.67 apolipoprotein A-I Danio rerio NP_571203 6.00E-73DS[96]_11_H_09 Up 3.99 apolipoprotein A-I-1 precursor (Apo-AI-1) Oncorhynchus mykiss O57523 8.00E-76DS[96]_88_D_02 Up 4.81 apolipoprotein A-I-2 precursor Oncorhynchus mykiss O57524 4.00E-71DS[96]_02_A_11 Up 2.72 apolipoprotein A-IV Danio rerio AAH93239 1.00E-73DS[96]_41_F_02 Up 2.23 apolipoprotein B Salmo salar CAA57449 3.00E-24DS[96]_62_B_05 Up 2.02 apolipoprotein CII Oncorhynchus mykiss AAG11410 1.00E-19DS[96]_65_E_08 Up 2.17 apolipoprotein CII Oncorhynchus mykiss AAG11410 3.00E-19DS[96]_45_B_03 Up 4.16 apolipoprotein Eb Danio rerio NP_571173 2.00E-38DS[96]_79_H_01 Up 4.42 arachidonate 12-lipoxygenase Danio rerio NP_955912 4.00E-23DS[96]_77_B_08 Up 2.56 arachidonate 12-lipoxygenase Danio rerio NP_955912 5.00E-35DS[96]_86_F_12 Up 3.87 astacin like metallo-protease Oryzias latipes NP_001098207 2.00E-83DS[96]_17_B_07 Up 4.34 astacin like metallo-protease Oryzias latipes NP_001098207 7.00E-50DS[96]_07_A_09 Up 2.17 c1q-like protein Dissostichus mawsoni ABN45966 3.00E-38DS[96]_54_A_03 Down 1.69 calcitonin receptor-like receptor Oncorhynchus gorbuscha CAD48406 5.00E-56DS[96]_53_D_10 Down 1.58 calcium binding protein 39 Danio rerio NP_998666 1.00E-76DS[96]_71_F_06 Up 2.27 calpain 1 protein Danio rerio AAH91999 2.00E-68DS[96]_37_C_02 Up 1.82 carboxypeptidase H Paralichthys olivaceus AAO92752 1.00E-82DS[96]_27_A_09 Up 2.91 cardiac muscle ATP synthase,alpha 1, Danio rerio NP_001070823 7.00E-62DS[96]_05_C_08 Up 5.76 cell division cycle 14 homolog A Danio rerio CAP09233 3.00E-19DS[96]_30_G_11 Up 2.34 chitin binding Peritrophin-A domain Danio rerio AAH45331 4.00E-69DS[96]_33_H_06 Up 3.75 chitinase Oncorhynchus mykiss CAD59687 9.00E-68DS[96]_69_C_08 Up 4.25 chitinase1 Paralichthys olivaceus BAD15059 e-127DS[96]_71_C_06 Up 3.93 chymotrypsinogen 2-like protein Sparus aurata AAT45254 1.00E-20DS[96]_56_B_04 Down 2.01 cofilin 2 (muscle) Danio rerio NP_991263 5.00E-84DS[96]_59_A_01 Down 2.35 cofilin 2 (muscle) Danio rerio NP_991263 3.00E-83DS[96]_67_A_02 Up 5.20 corticotropin-lipotropin A precursor Oncorhynchus mykiss Q04617 7.00E-63DS[96]_26_G_05 Down 1.59 cytochrome P450, family 46, subfamily A, polypeptide 1 Danio rerio NP_001018358 2.00E-65DS[96]_11_H_05 Up 1.86 DAZAP2-like protein (deleted in azoospermia-associated) Takifugu rubripes NP_001072102 5.00E-59DS[96]_18_C_06 Down 1.78 dopachrome tautomerase Salmo salar ABD73808 1.00E-85DS[96]_20_B_11 Down 1.66 E3 ubiquitin-protein ligase MARCH2 Danio rerio Q1LVZ2 2.00E-87DS[96]_68_G_10 Up 5.08 elastase 2-like protein Sparus aurata AAT45251 2.00E-89
Microarray Microarray
differentially expressed differentially expressed
gene listgene list
Microarray Microarray
differentially expressed differentially expressed
gene listgene list
12
mindpowersystem.com/15/interrogation-methods/
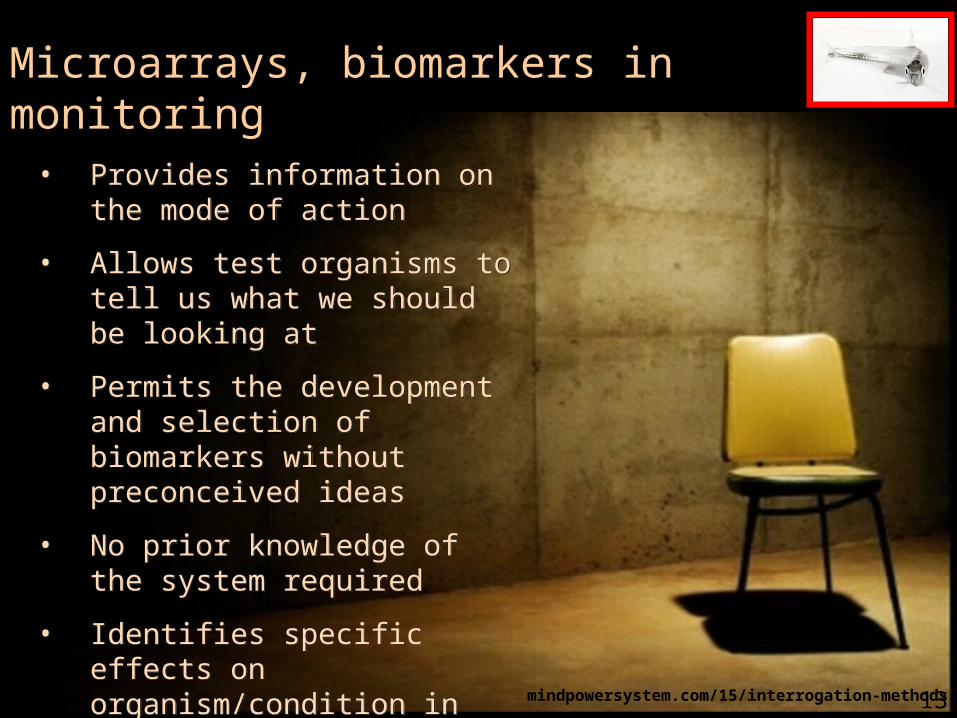
• Provides information on the mode of action
• Allows test organisms to tell us what we should be looking at
• Permits the development and selection of biomarkers without preconceived ideas
• No prior knowledge of the system required
• Identifies specific effects on organism/condition in question
• Provides information on the mode of action
• Allows test organisms to tell us what we should be looking at
• Permits the development and selection of biomarkers without preconceived ideas
• No prior knowledge of the system required
• Identifies specific effects on organism/condition in question
Microarrays, biomarkers in monitoring
13

mRNAmRNA
PopulationPopulation
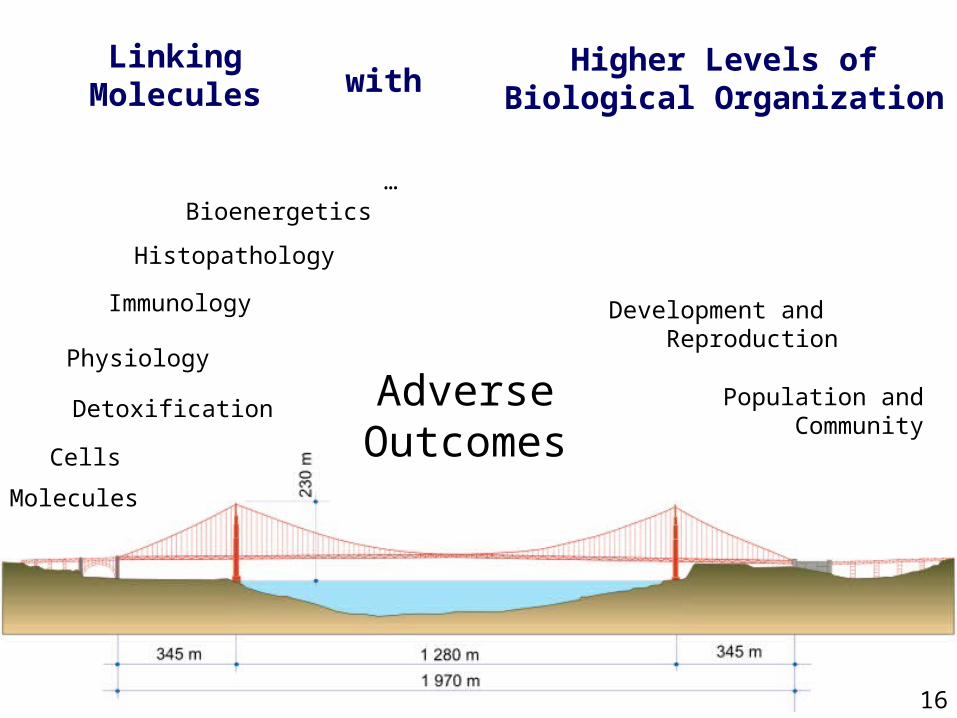
Linking Genomic Profiles with Relevant Higher Level
Effects:Adverse Outcome Pathways
Linking Genomic Profiles with Relevant Higher Level
Effects:Adverse Outcome Pathways
14

Molecules
Population and Community
Physiology
Immunology
Histopathology
Bioenergetics
withLinking
MoleculesHigher Levels of
Biological Organization
Cells
…
15
Development and Reproduction
Detoxification
Molecules
Population and Community
Physiology
Immunology
Histopathology
Bioenergetics
Detoxification
Development and Reproduction
with
Adverse Outcomes
Linking Molecules
Higher Levels of Biological Organization
Cells
…
16

Measure it
Swim it…
Bridge it
17
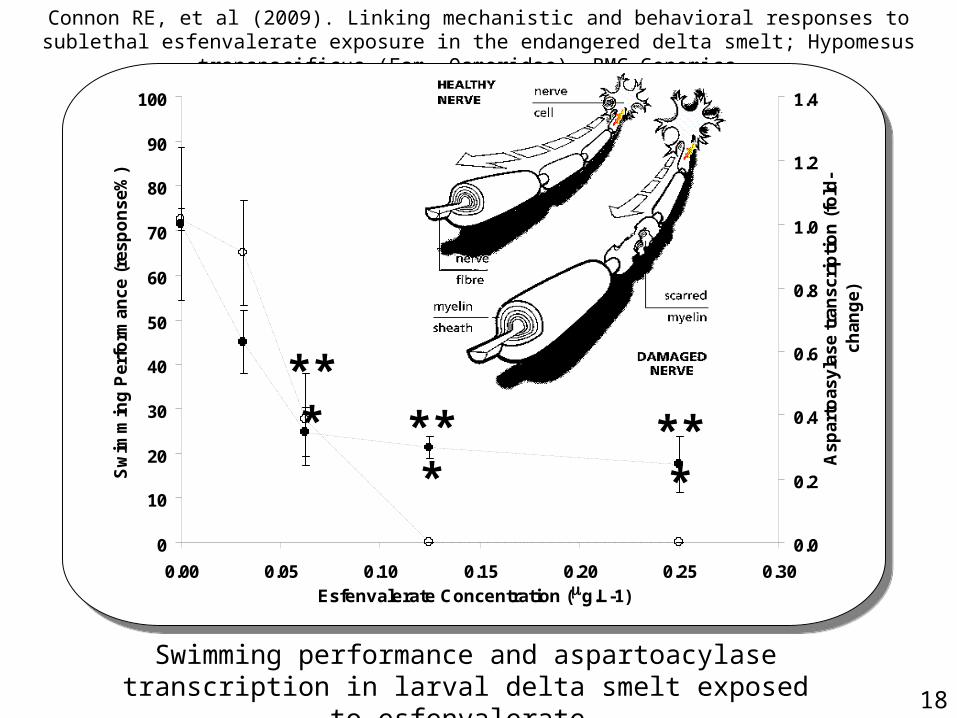
Swimming performance and aspartoacylase transcription in
larval delta smelt exposed to esfenvalerate
Connon RE, et al (2009). Linking mechanistic and behavioral responses to sublethal esfenvalerate exposure in the endangered delta smelt; Hypomesus transpacificus (Fam. Osmeridae). BMC Genomics.
0
10
20
30
40
50
60
70
80
90
100
0.00 0.05 0.10 0.15 0.20 0.25 0.30Esfenvalerate Concentration (mg.L-1)
Sw
imm
ing
Per
form
ance
(re
spo
nse
%)
0.0
0.2
0.4
0.6
0.8
1.0
1.2
1.4
Asp
arto
asyl
ase
tran
scri
pti
on
(fo
ld-
chan
ge)
Swimming
Aspartoacylase
****** ***
18
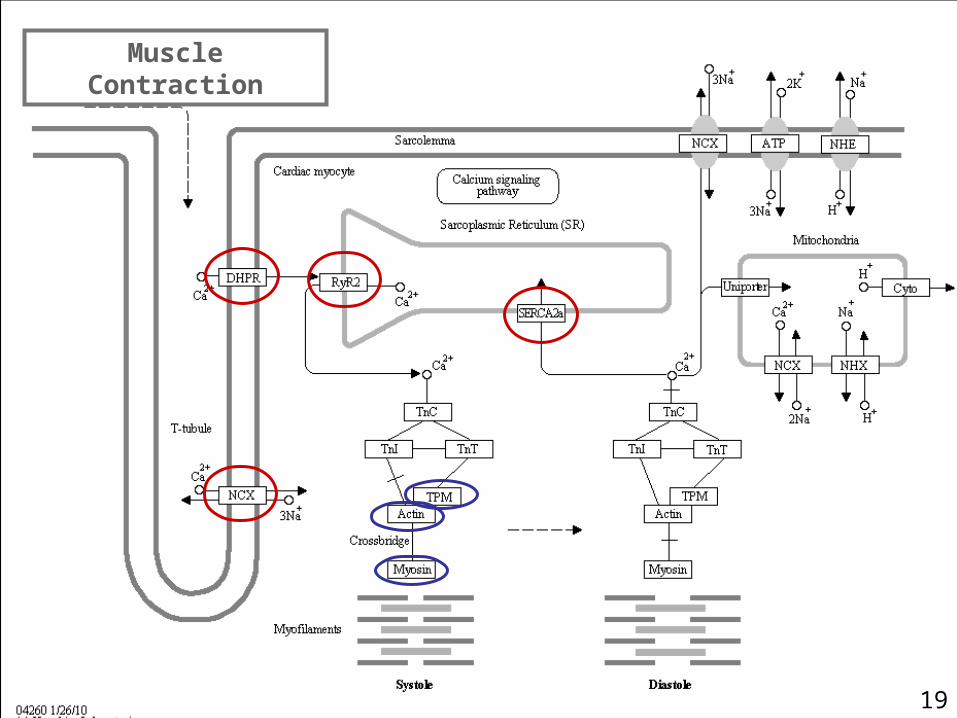
Muscle Contraction
19
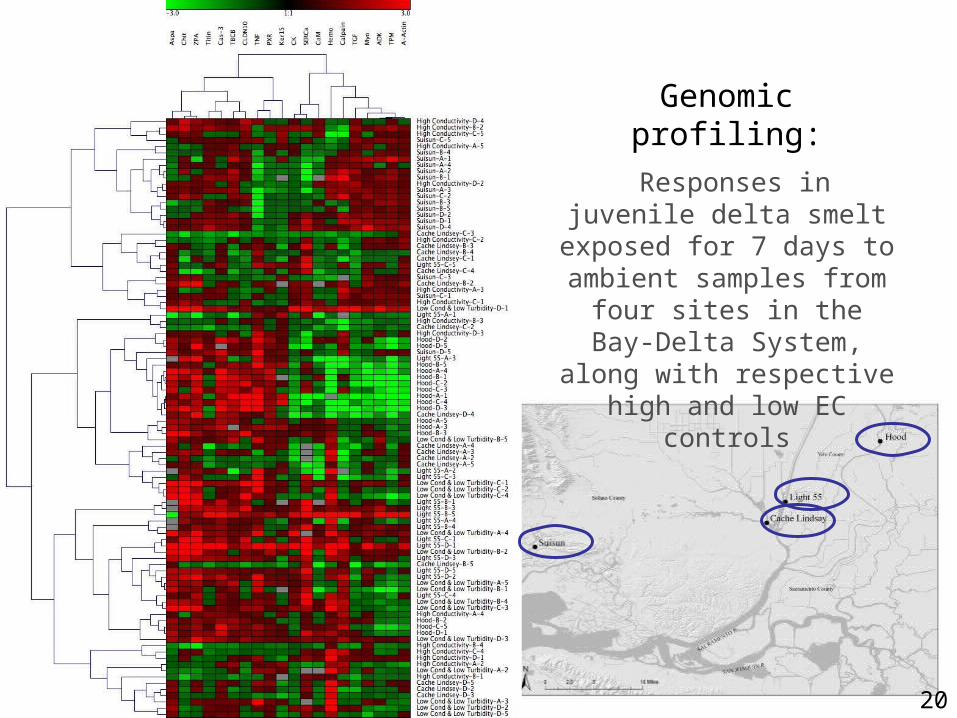
Genomic profiling: Responses in juvenile
delta smelt exposed for 7 days to ambient
samples from four sites in the Bay-Delta System,
along with respective high and low EC controls
20
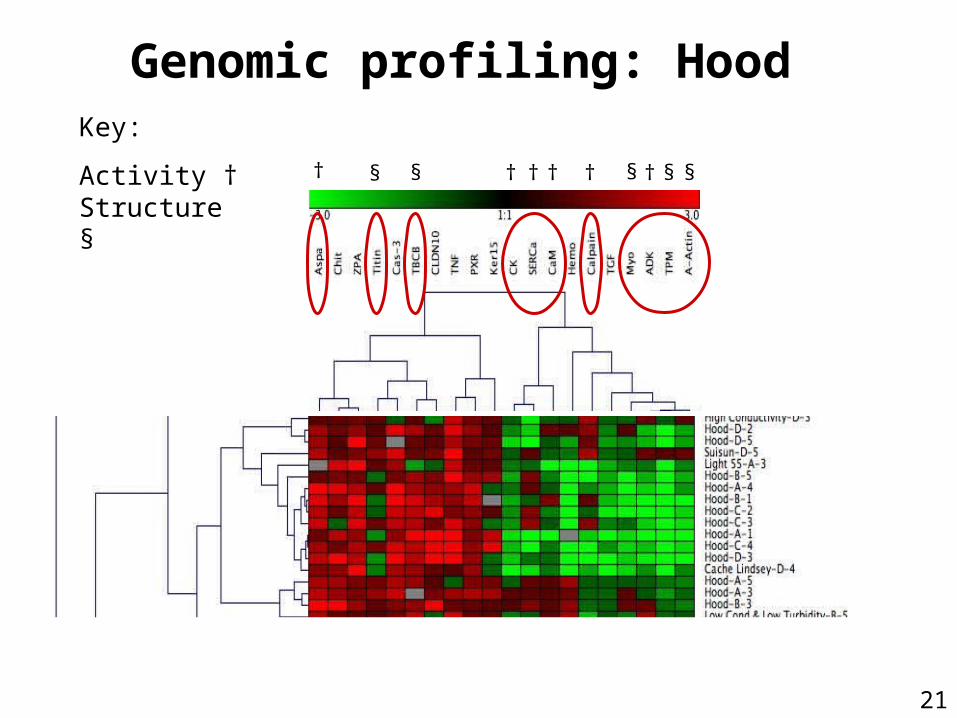
Key:
Activity † Structure §
† † † † † † §§§§ §
Genomic profiling: Hood
21
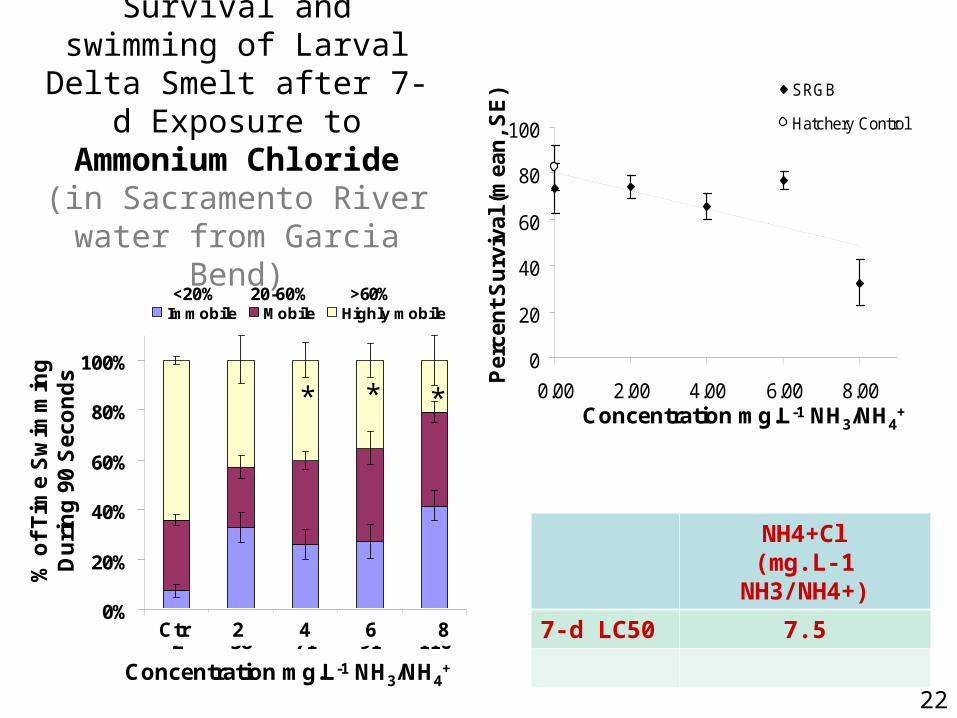
Survival and swimming of Larval Delta Smelt after 7-d Exposure to
Ammonium Chloride(in Sacramento River water
from Garcia Bend)
NH4+Cl(mg.L-1
NH3/NH4+)
7-d LC50 7.5
0
20
40
60
80
100
0.00 2.00 4.00 6.00 8.00
SRGB
Hatchery Control
Concentration mg.L-1 NH3/NH4+
Per
cen
t S
urv
ival
(m
ean
, S
E)
0%
20%
40%
60%
80%
100%
2 38 71 91 116
Immobile Mobile Highly mobile
Concentration mg.L-1 NH3/NH4+
% o
f T
ime
Sw
imm
ing
D
uri
ng
90
Sec
on
ds
<20% 20-60% >60%
Ctr 2 4 6 8
* * *
22
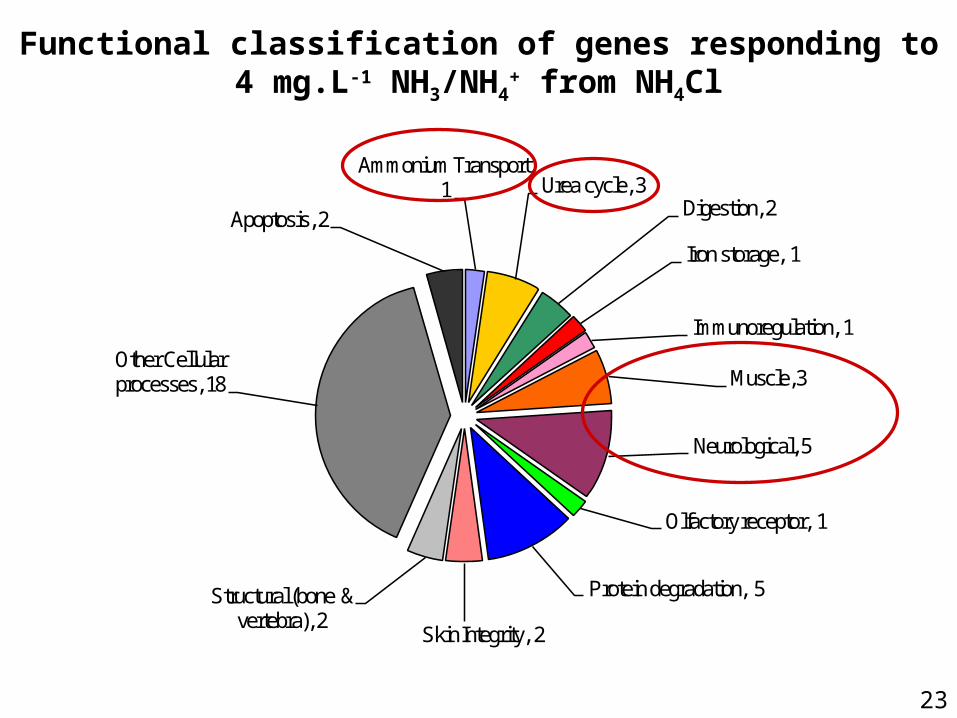
Functional classification of genes responding to4 mg.L-1 NH3/NH4
+ from NH4Cl
Ammonium Transport, 1 Urea cycle, 3
Digestion, 2
Iron storage, 1
Immunoregulation, 1
Muscle, 3
Neurological, 5
Olfactory receptor, 1
Protein degradation, 5
Skin Integrity, 2
Structural (bone & vertebra), 2
Other Cellular processes, 18
Apoptosis, 2
Sacramento River at Garcia Bend(upstream from Wastewater Treatment Plant)
23
-10
-5
0
5
10
15
20
0 2 4 6
-6
-4
-2
0
2
4
6
8
0 2 4 6
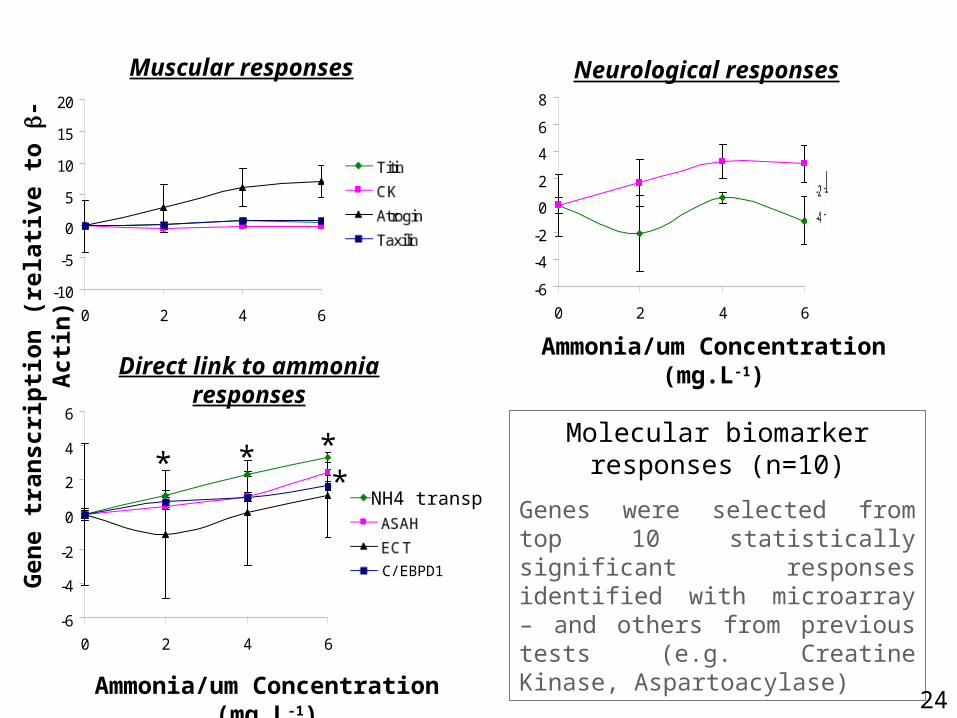
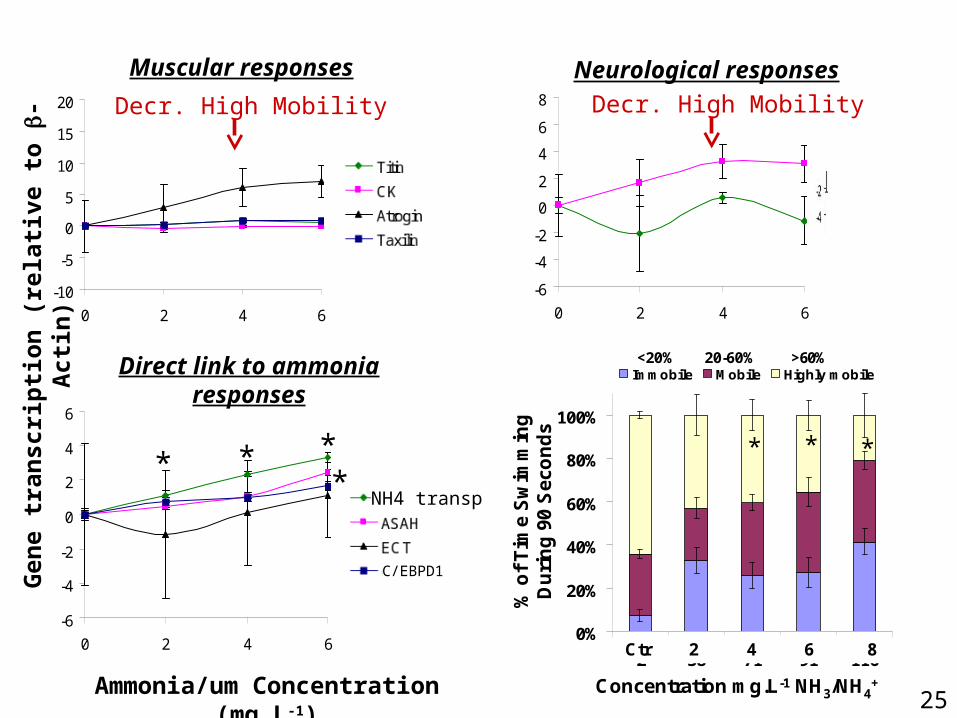
Muscular responses Neurological responses
-6
-4
-2
0
2
4
6
0 2 4 6
Direct link to ammonia responses
NH4 transp
C/EBPD1
* * **
Molecular biomarker responses (n=10)
Genes were selected from top 10 statistically significant responses identified with microarray – and others from previous tests (e.g. Creatine Kinase, Aspartoacylase)
Gen
e tr
ansc
rip
tio
n (
rela
tive
to
-A
ctin
)
Ammonia/um Concentration (mg.L-1)
Ammonia/um Concentration (mg.L-1)
24
-10
-5
0
5
10
15
20
0 2 4 6
-6
-4
-2
0
2
4
6
8
0 2 4 6
Muscular responses Neurological responses
Gen
e tr
ansc
rip
tio
n (
rela
tive
to
-A
ctin
)
Ammonia/um Concentration (mg.L-1)
Decr. High Mobility
-6
-4
-2
0
2
4
6
0 2 4 6
Direct link to ammonia responses
NH4 transp
C/EBPD1
* * **
0%
20%
40%
60%
80%
100%
2 38 71 91 116
Immobile Mobile Highly mobile
Concentration mg.L-1 NH3/NH4+
% o
f T
ime
Sw
imm
ing
D
uri
ng
90
Sec
on
ds
<20% 20-60% >60%
Ctr 2 4 6 8
* * *
Decr. High Mobility
25
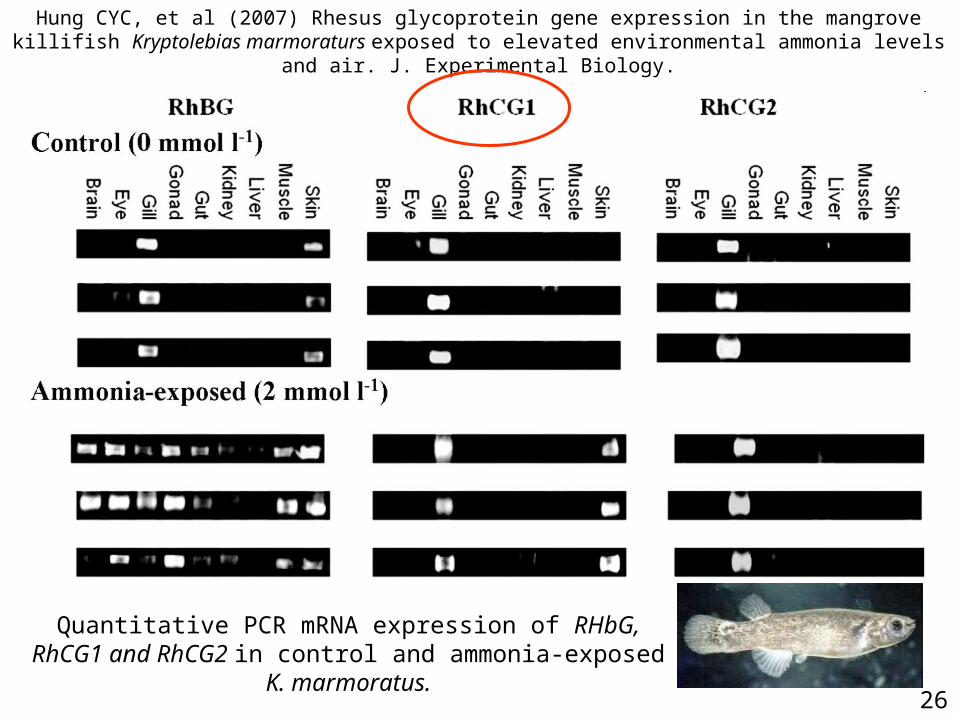
Hung CYC, et al (2007) Rhesus glycoprotein gene expression in the mangrove killifish Kryptolebias marmoraturs exposed to elevated environmental ammonia levels and air. J. Experimental Biology.
Quantitative PCR mRNA expression of RHbG, RhCG1 and RhCG2 in control and ammonia-exposed K. marmoratus.
26
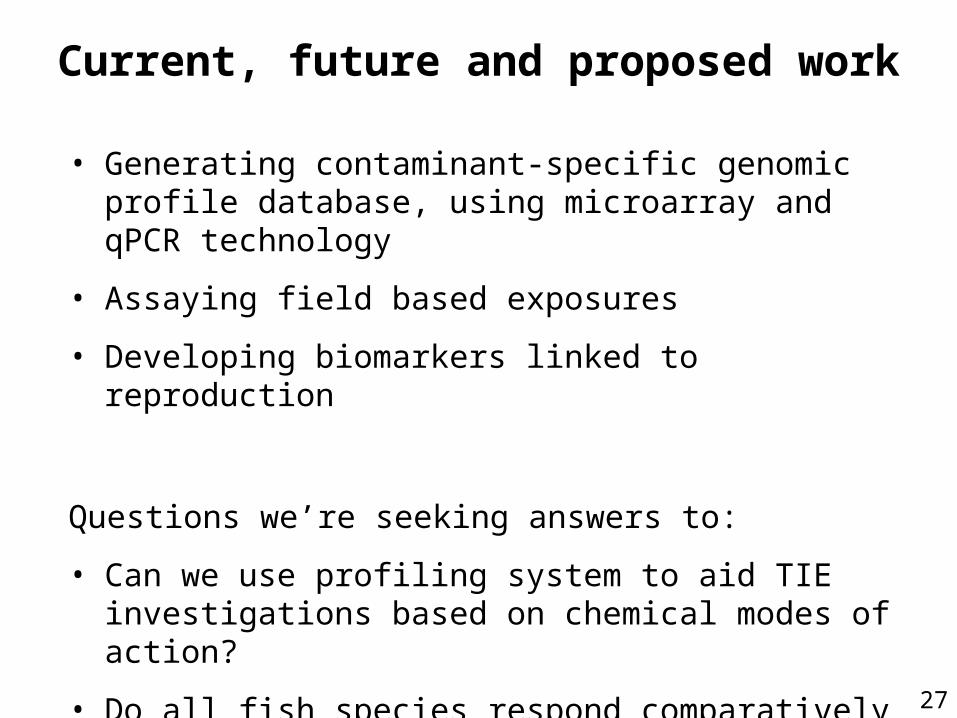
Current, future and proposed work
• Generating contaminant-specific genomic profile database, using microarray and qPCR technology
• Assaying field based exposures
• Developing biomarkers linked to reproduction
Questions we’re seeking answers to:
• Can we use profiling system to aid TIE investigations based on chemical modes of action?
• Do all fish species respond comparatively to equitoxic contaminant concentrations?
27
Molecular Biomarkers as Tools in Toxicity Testing and Field
Monitoring ?
Major Challenges:
Laboratory toxicity testing with resident species;
Often difficult to culture and handle.
Require extensive method development.
Can generally not be used for in-depth studies evaluating ecologically important chronic endpoints, such as reproductive success, behavior and/or growth.
Interpretation of biomarker data collected in field monitoring studies.
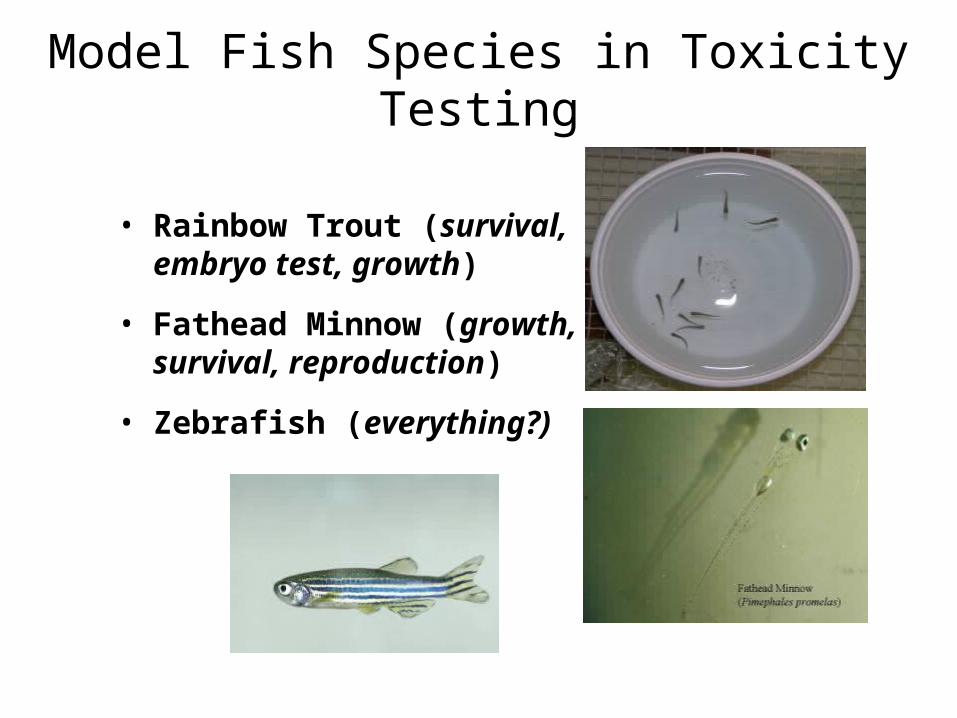
Model Fish Species in Toxicity Testing
• Rainbow Trout (survival, embryo test, growth)
• Fathead Minnow (growth, survival, reproduction)
• Zebrafish (everything?)
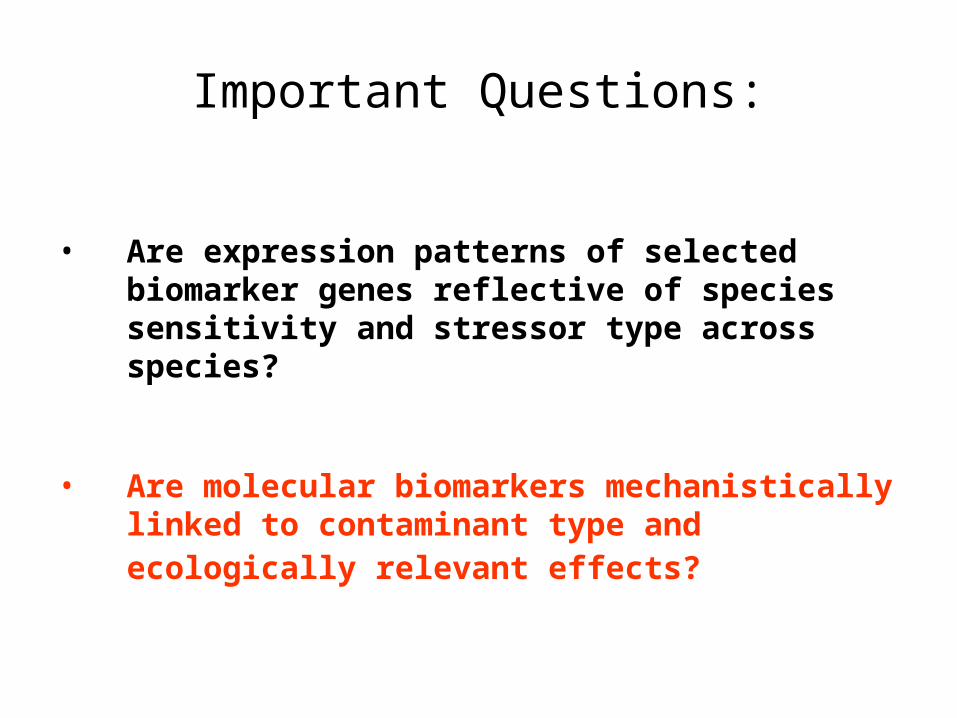
Important Questions:
• Are expression patterns of selected biomarker genes reflective of species sensitivity and stressor type across species?
• Are molecular biomarkers mechanistically linked to contaminant type and ecologically relevant effects?
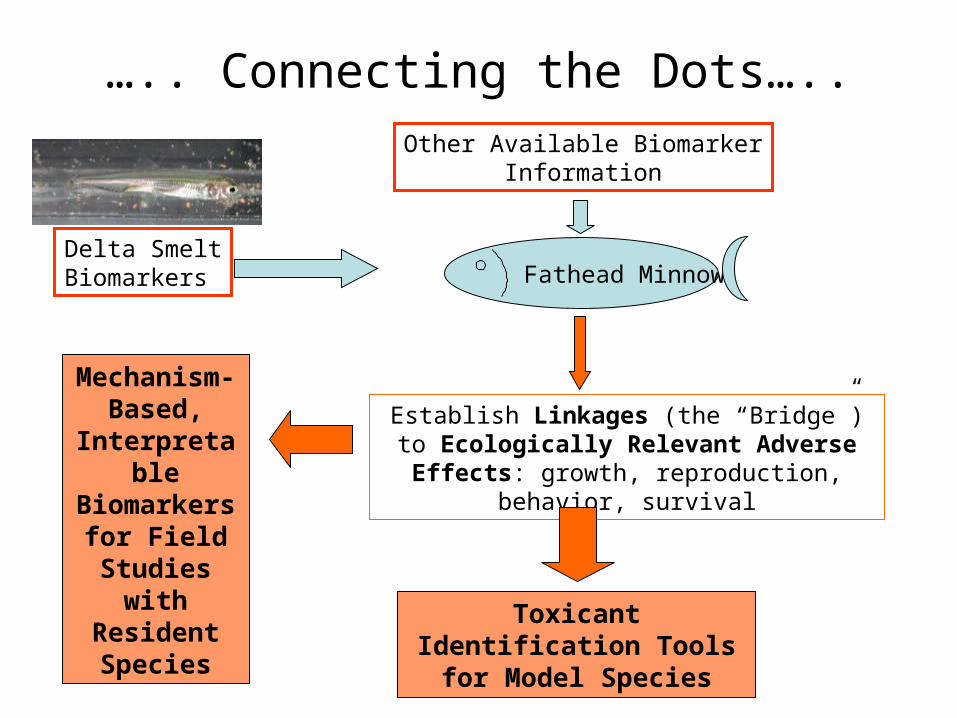
….. Connecting the Dots…..
Delta SmeltBiomarkers
Other Available BiomarkerInformation
Fathead Minnow
Establish Linkages (the “Bridge”) to Ecologically Relevant Adverse Effects: growth, reproduction, behavior, survival
Toxicant Identification Tools for Model Species
Mechanism-Based,
InterpretableBiomarkers
for Field Studies with
Resident Species
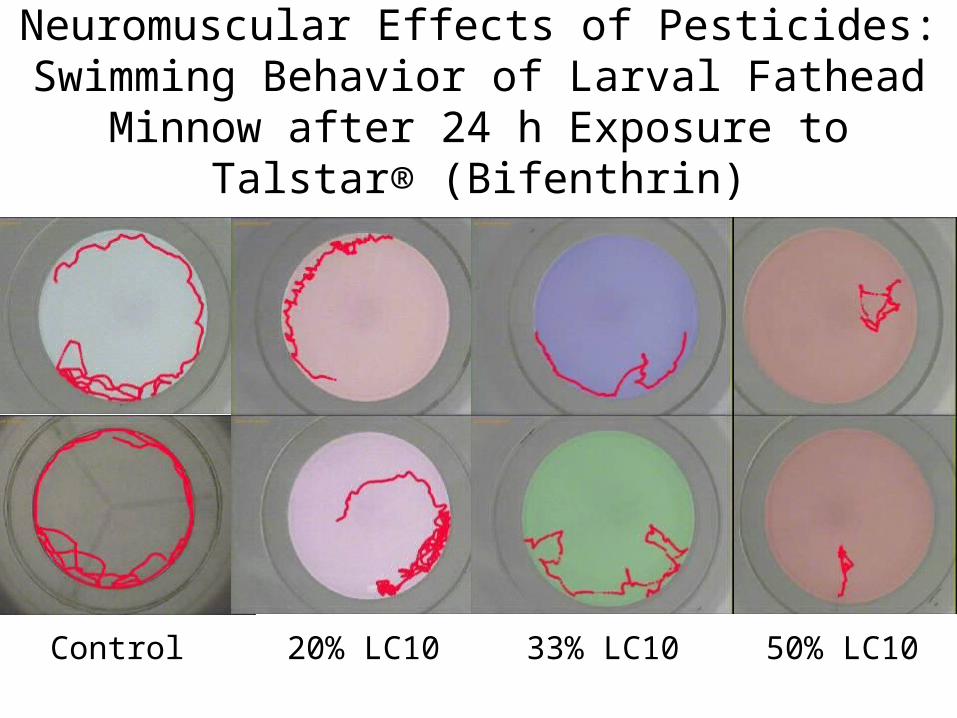
Neuromuscular Effects of Pesticides: Swimming Behavior of Larval Fathead Minnow after 24 h
Exposure to Talstar® (Bifenthrin)
Control 20% LC10 33% LC10 50% LC10
0
10
20
30
40
50
60
70
80
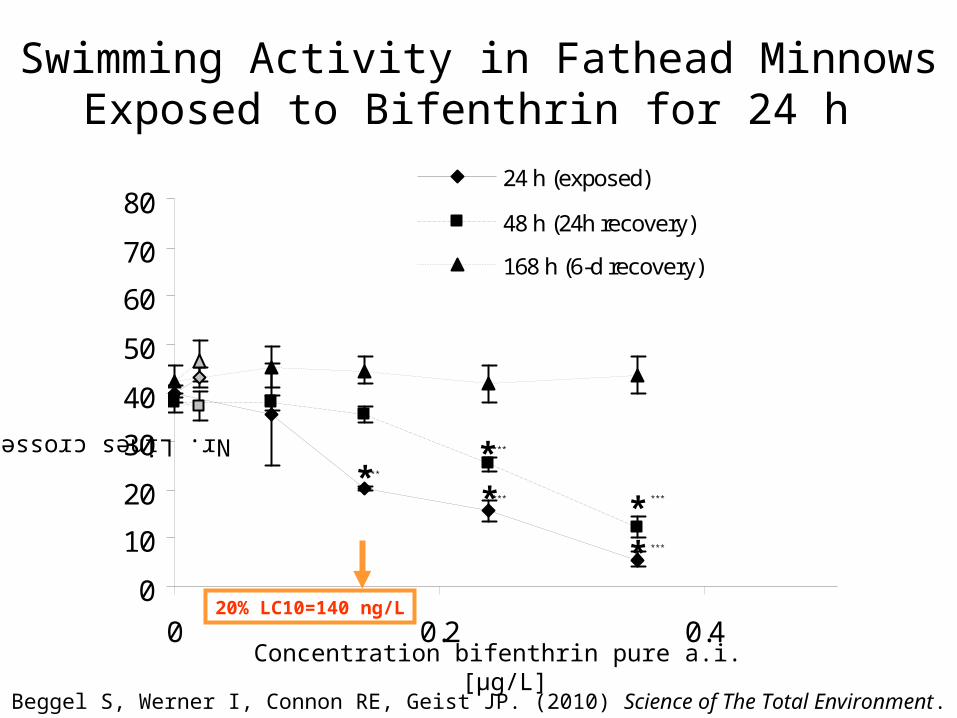
0 0.2 0.4
24 h (exposed)
48 h (24h recovery)
168 h (6-d recovery)Nr. Lines crossed/ min
Concentration bifenthrin pure a.i. [μg/L]
***
***
***
***
***
20% LC10=140 ng/L
Swimming Activity in Fathead Minnows Exposed to Bifenthrin for 24 h
Beggel S, Werner I, Connon RE, Geist JP. (2010) Science of The Total Environment. 408: 3169-3175.
**
*
*
*

Growth in Fathead Minnows
0
0.2
0.4
0.6
0.8
1
1.2
1.4
Control SolvControl 10% LC10 20% LC10 33% LC10 50% LC10
We
igh
t p
er
fis
h (
mg
)
bifenthrin pure A.I. bifenthrin formulation
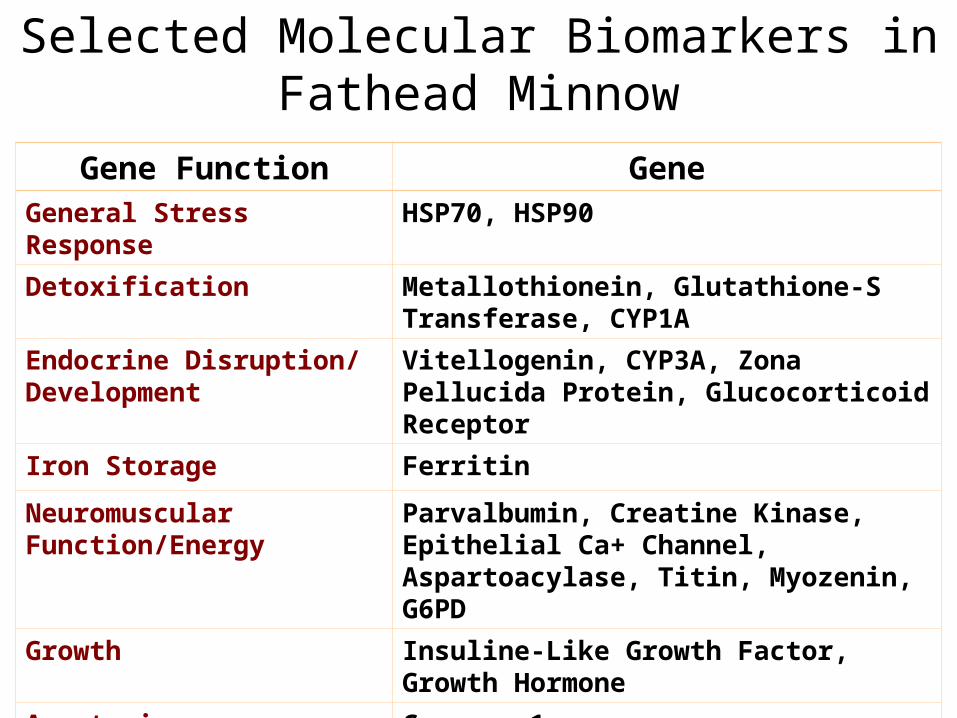
Gene Function GeneGeneral Stress Response HSP70, HSP90
Detoxification Metallothionein, Glutathione-S Transferase, CYP1A
Endocrine Disruption/Development
Vitellogenin, CYP3A, Zona Pellucida Protein, Glucocorticoid Receptor
Iron Storage Ferritin
Neuromuscular Function/Energy
Parvalbumin, Creatine Kinase, Epithelial Ca+ Channel, Aspartoacylase, Titin, Myozenin, G6PD
Growth Insuline-Like Growth Factor, Growth Hormone
Apoptosis Caspase 1
Immune System Microglobulin, IL8, Mx Protein, Nramp
Selected Molecular Biomarkers in Fathead Minnow
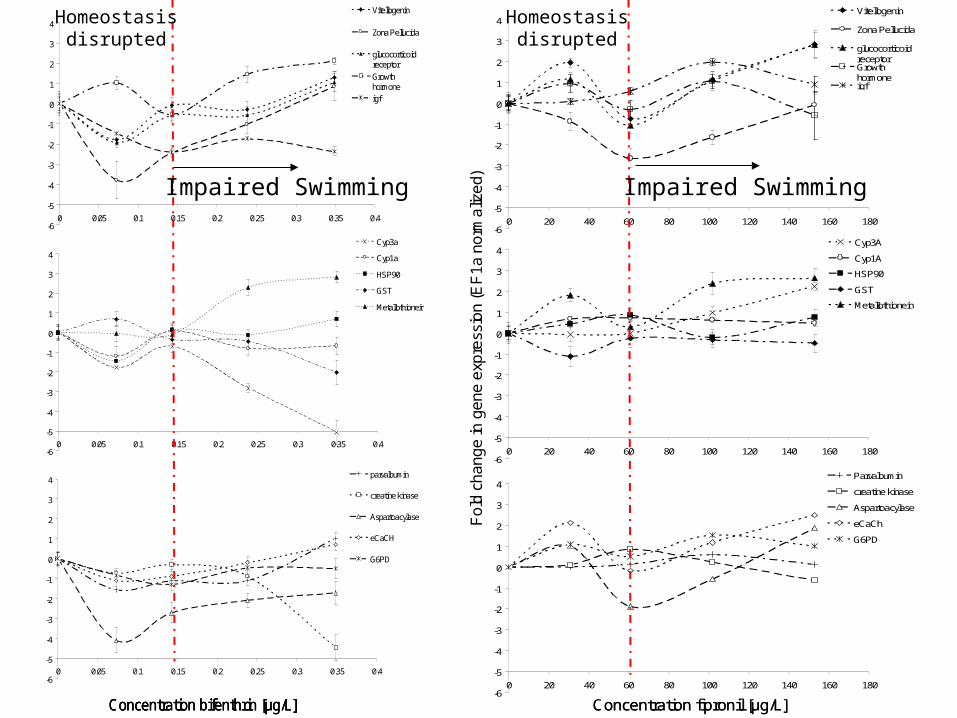
Fold
chan
gein
gen
eex
pres
sion
(EF1
a no
rmal
ized
)
-6
-5
-4
-3
-2
-1
0
1
2
3
4
0 0.05 0.1 0.15 0.2 0.25 0.3 0.35 0.4
Vitellogenin
Zona Pellucida
glucocorticoidreceptor
Growthhormoneigf
-6
-5
-4
-3
-2
-1
0
1
2
3
4
0 0.05 0.1 0.15 0.2 0.25 0.3 0.35 0.4
Cyp3a
Cyp1a
HSP90
GST
Metallothionein
-6
-5
-4
-3
-2
-1
0
1
2
3
4
0 0.05 0.1 0.15 0.2 0.25 0.3 0.35 0.4
parvalbumin
creatine kinase
Aspartoacylase
eCaCH
G6PD
Concentration bifenthrin [µg/L]
-6
-5
-4
-3
-2
-1
0
1
2
3
4
0 0.05 0.1 0.15 0.2 0.25 0.3 0.35 0.4
Vitellogenin
Zona Pellucida
glucocorticoidreceptor
Growthhormoneigf
-6
-5
-4
-3
-2
-1
0
1
2
3
4
0 0.05 0.1 0.15 0.2 0.25 0.3 0.35 0.4
Cyp3a
Cyp1a
HSP90
GST
Metallothionein
-6
-5
-4
-3
-2
-1
0
1
2
3
4
0 0.05 0.1 0.15 0.2 0.25 0.3 0.35 0.4
parvalbumin
creatine kinase
Aspartoacylase
eCaCH
G6PD
Concentration bifenthrin [µg/L]
-6
-5
-4
-3
-2
-1
0
1
2
3
4
0 20 40 60 80 100 120 140 160 180
Cyp3A
Cyp1A
HSP90
GST
Metallothionein
-6
-5
-4
-3
-2
-1
0
1
2
3
4
0 20 40 60 80 100 120 140 160 180
Vitellogenin
Zona Pellucida
glucocorticoidreceptorGrowthhormoneigf
-6
-5
-4
-3
-2
-1
0
1
2
3
4
0 20 40 60 80 100 120 140 160 180
Parvalbumin
creatine kinase
Aspartoacylase
eCaCh
G6PD
Concentration fipronil [µg/L]
Fo
ldch
an
ge
in g
en
ee
xpre
ssio
n(E
F1
a n
orm
aliz
ed)
-6
-5
-4
-3
-2
-1
0
1
2
3
4
0 20 40 60 80 100 120 140 160 180
Cyp3A
Cyp1A
HSP90
GST
Metallothionein
-6
-5
-4
-3
-2
-1
0
1
2
3
4
0 20 40 60 80 100 120 140 160 180
Vitellogenin
Zona Pellucida
glucocorticoidreceptorGrowthhormoneigf
-6
-5
-4
-3
-2
-1
0
1
2
3
4
0 20 40 60 80 100 120 140 160 180
Parvalbumin
creatine kinase
Aspartoacylase
eCaCh
G6PD
Concentration fipronil [µg/L]
Fo
ldch
an
ge
in g
en
ee
xpre
ssio
n(E
F1
a n
orm
aliz
ed)Impaired Swimming Impaired Swimming
Homeostasisdisrupted
Homeostasisdisrupted
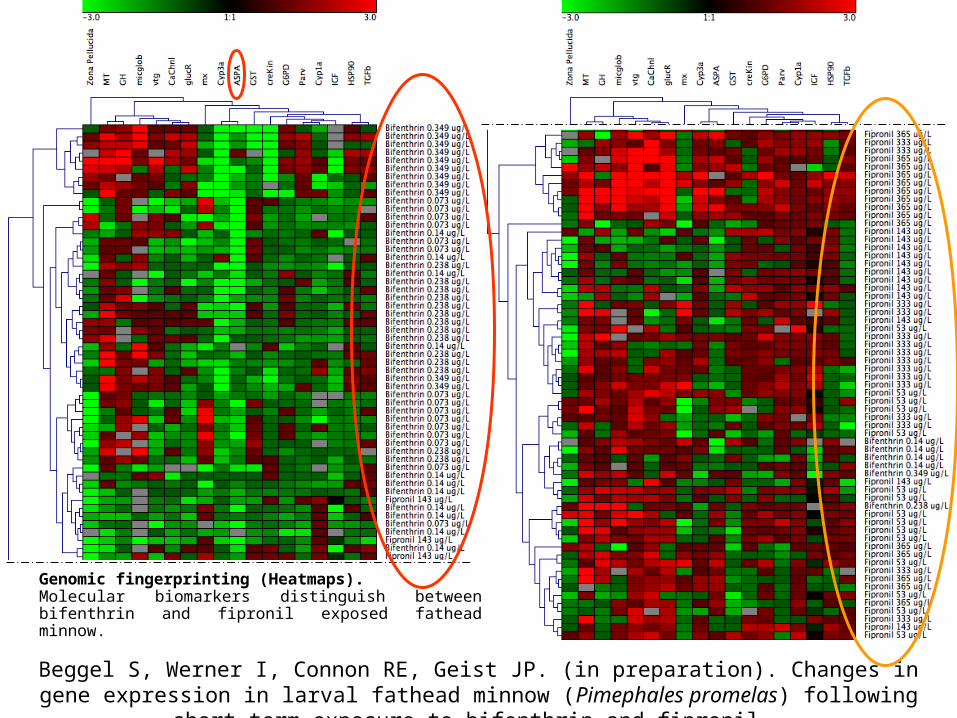
Genomic fingerprinting (Heatmaps). Molecular biomarkers distinguish between bifenthrin and fipronil exposed fathead minnow.
Beggel S, Werner I, Connon RE, Geist JP. (in preparation). Changes in gene expression in larval fathead minnow (Pimephales promelas) following short-term exposure to bifenthrin and fipronil.
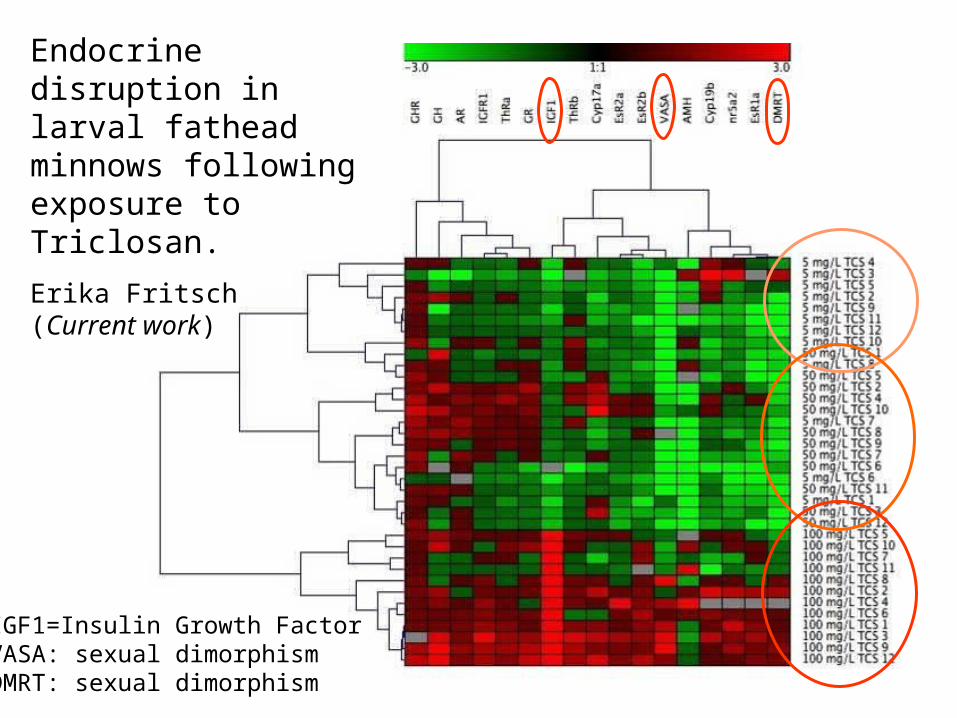
Endocrine disruption in larval fathead minnows following exposure to Triclosan.
Erika Fritsch (Current work)
IGF1=Insulin Growth FactorVASA: sexual dimorphismDMRT: sexual dimorphism
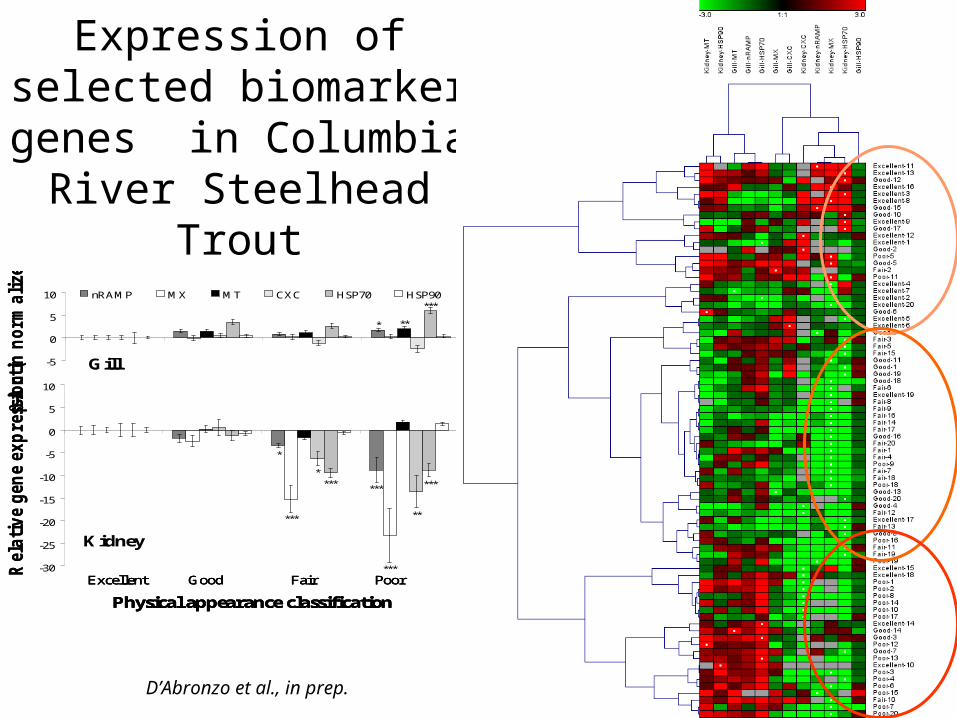
Expression of selected biomarker genes in
Columbia River Steelhead Trout
*
Rela
tiv
e g
en
e e
xp
ress
ion
(-
Acti
n n
orm
ali
zed
)
-5
0
5
10 nRAMP MX MT CXC HSP70 HSP90
-30
-25
-20
-15
-10
-5
0
5
10
Excellent Good Fair Poor
Physical appearance classification
Gill
Kidney
***
***
***
******
***
***
**
*
*
Rela
tiv
e g
en
e e
xp
ress
ion
(-
Acti
n n
orm
ali
zed
)
-5
0
5
10 nRAMP MX MT CXC HSP70 HSP90
-30
-25
-20
-15
-10
-5
0
5
10
Excellent Good Fair Poor
Physical appearance classification
Gill
Kidney
***
***
***
******
***
***
**
*
*
-5
0
5
10 nRAMP MX MT CXC HSP70 HSP90
-30
-25
-20
-15
-10
-5
0
5
10
Excellent Good Fair Poor
Physical appearance classification
Gill
Kidney
***
***
***
******
***
***
**
*
*
D’Abronzo et al., in prep.
Conclusions
• Microarray technology allows us to identify new mechanism-based molecular biomarkers.
• The multi-biomarker approach (heatmaps) integrates old and new information.
• Shows great promise in distinguishing the impact of different stressors (TIE).
• Allows mechanism based interpretation of biomarker signals.
• Leads to a better understanding of linkages (“adverse outcome pathways”).
AcknowledgmentsAcknowledgments
The Interagency Ecological Program, Sacramento, CA, for funding the microarray and biomarker work.
The UC Davis Fish Conservation and Culture Laboratory, Byron, CA, for providing delta smelt.
The staff of the UCD Aquatic Toxicology Lab.
Sebastian Beggel & Erika Frisch, Graduate Students in I. Werner’s lab.