Embed Size (px)
Citation preview
ALL RIGHTS RESERVEDNo part of this document may be reproduced without written approval from Limkokwing University of Creative Technology
1-1
Chapter 4
Portfolio Theory & Capital Asset Pricing Model
ALL RIGHTS RESERVEDNo part of this document may be reproduced without written approval from Limkokwing University of Creative Technology
1-2
1. How do we measure the risk/return tradeoff for an individual security?• We calculate the expected return on the
security and the standard deviation/variance of this return
2. How does the risk/return relationship change when we combine two different securities into a portfolio? • This depends on the covariance between the
returns on the two securities • We can use this to calculate the feasible set
and the efficient frontier of the risk/return outcomes
ALL RIGHTS RESERVEDNo part of this document may be reproduced without written approval from Limkokwing University of Creative Technology
1-3
4. What happens when we combine many different securities into a portfolio? • The risk of the portfolio is more dependent
on the covariance between the securities than on their variances
• The total risk of any individual security can be separated into its portfolio (systematic) risk and its idiosyncratic (diversifiable) risk
ALL RIGHTS RESERVEDNo part of this document may be reproduced without written approval from Limkokwing University of Creative Technology
1-4
5. What happens when we are able to combine a portfolio of risky assets with risk-free bonds? • We find there is a single optimal portfolio of
risky assets to hold; this is the same for all investors if they have homogeneous expectations
• Individual investors satisfy their risk preference by choosing how much to invest in this market portfolio relative to the riskless asset
ALL RIGHTS RESERVEDNo part of this document may be reproduced without written approval from Limkokwing University of Creative Technology
1-5
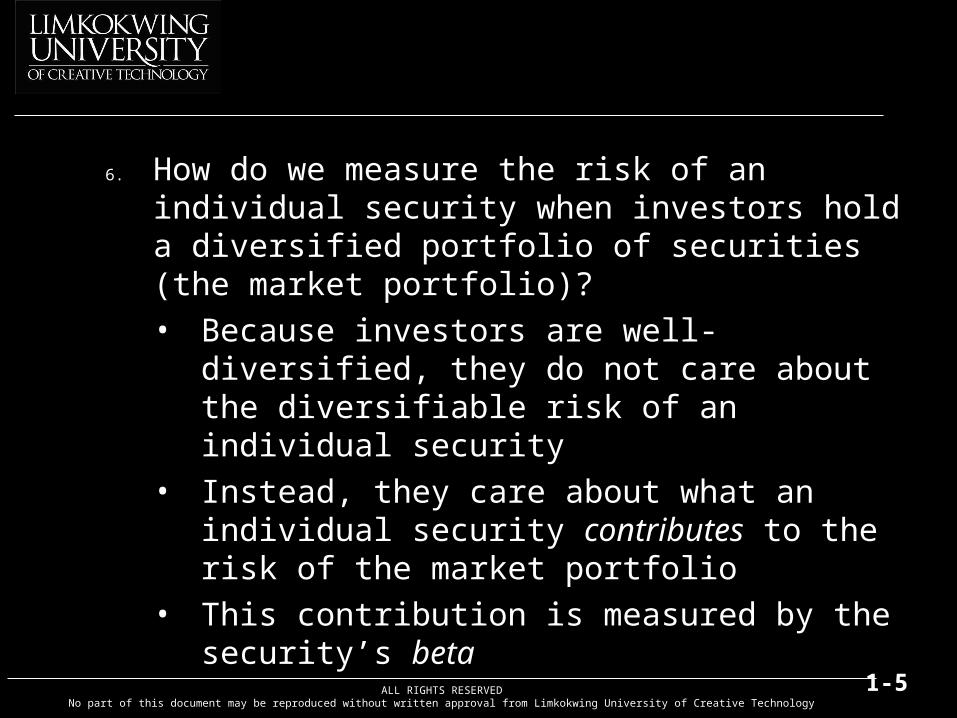
6. How do we measure the risk of an individual security when investors hold a diversified portfolio of securities (the market portfolio)? • Because investors are well-diversified, they
do not care about the diversifiable risk of an individual security
• Instead, they care about what an individual security contributes to the risk of the market portfolio
• This contribution is measured by the security’s beta
ALL RIGHTS RESERVEDNo part of this document may be reproduced without written approval from Limkokwing University of Creative Technology
1-6
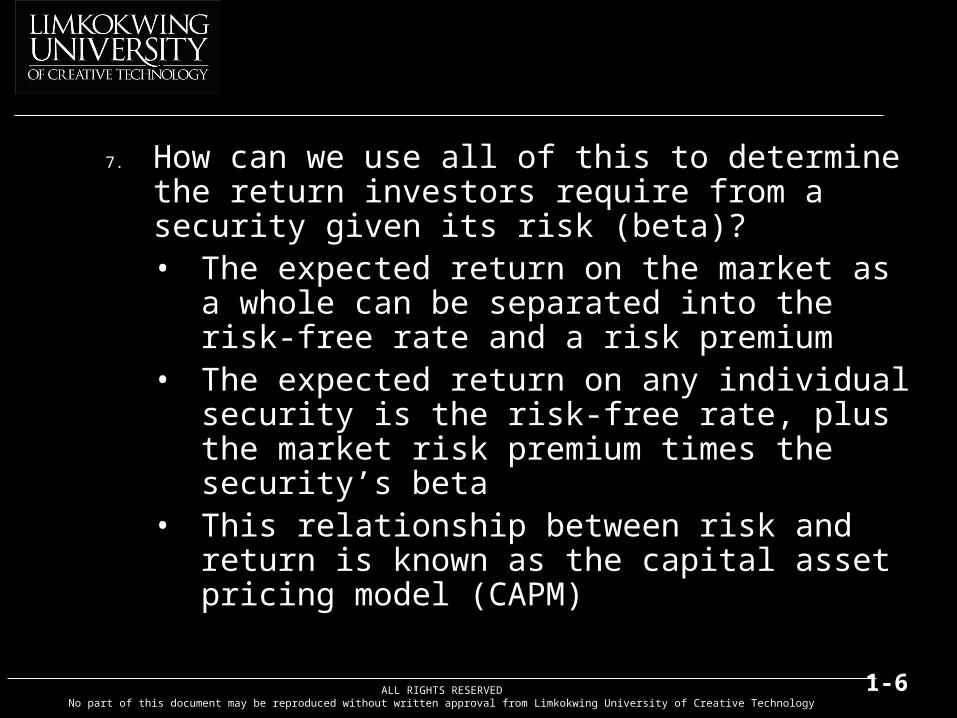
7. How can we use all of this to determine the return investors require from a security given its risk (beta)? • The expected return on the market as a
whole can be separated into the risk-free rate and a risk premium
• The expected return on any individual security is the risk-free rate, plus the market risk premium times the security’s beta
• This relationship between risk and return is known as the capital asset pricing model (CAPM)
ALL RIGHTS RESERVEDNo part of this document may be reproduced without written approval from Limkokwing University of Creative Technology
1-7
Expected Return, Variance, and Covariance
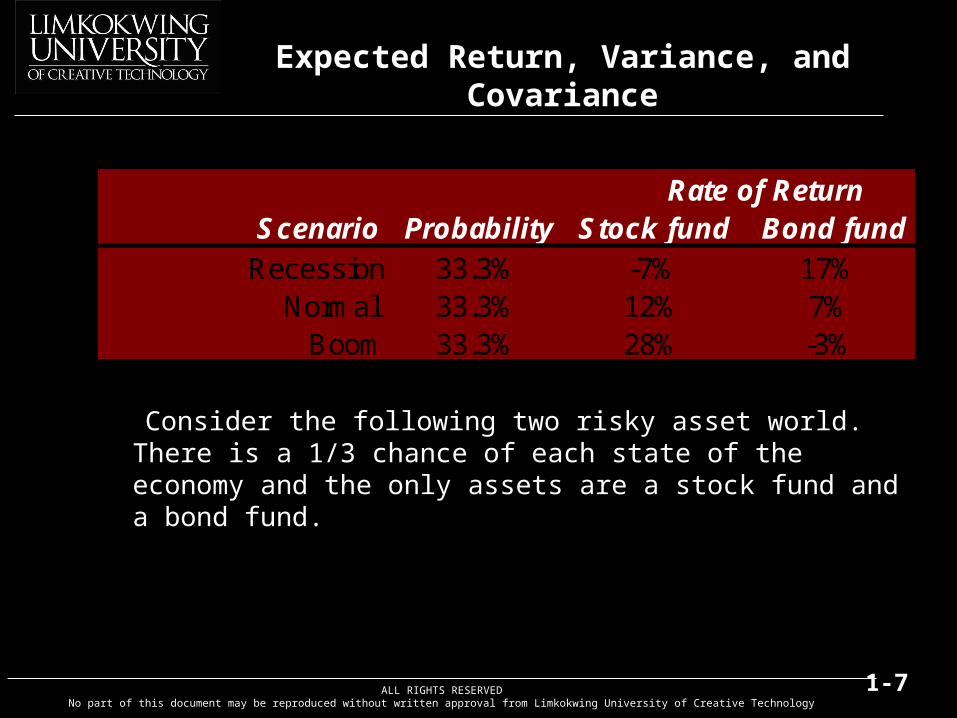
Consider the following two risky asset world. There is a 1/3 chance of each state of the economy and the only assets are a stock fund and a bond fund.
Rate of ReturnScenario Probability Stock fund Bond fund
Recession 33.3% -7% 17%Normal 33.3% 12% 7%
Boom 33.3% 28% -3%
ALL RIGHTS RESERVEDNo part of this document may be reproduced without written approval from Limkokwing University of Creative Technology
1-8
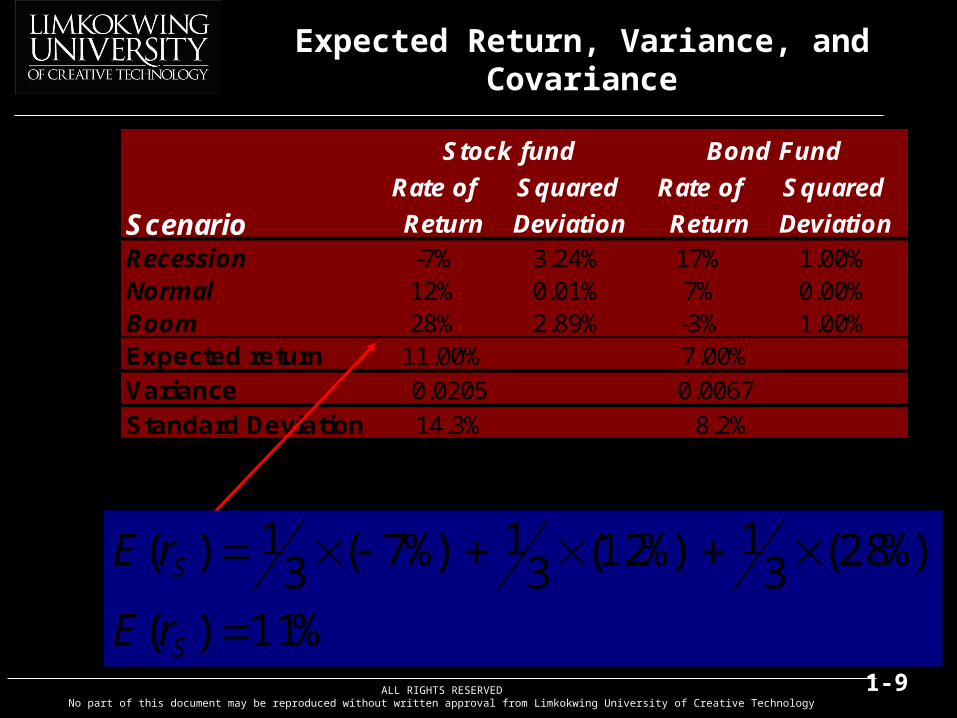
Expected Return, Variance, and Covariance
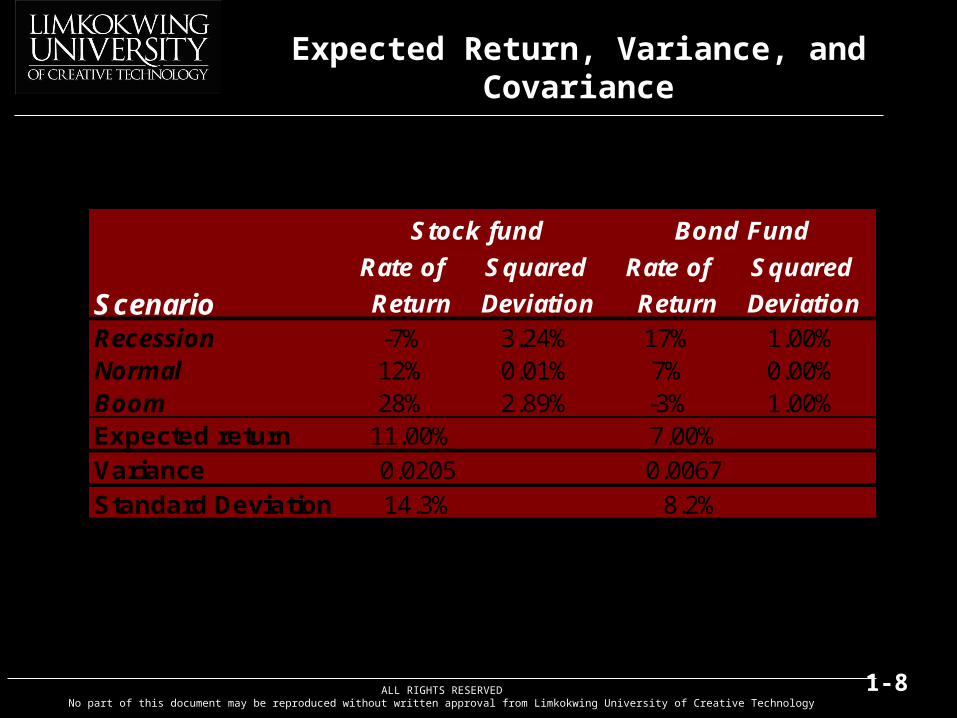
Stock fund Bond Fund
Rate of Squared Rate of Squared
Scenario Return Deviation Return Deviation Recession -7% 3.24% 17% 1.00%Normal 12% 0.01% 7% 0.00%Boom 28% 2.89% -3% 1.00%Expected return 11.00% 7.00%Variance 0.0205 0.0067Standard Deviation 14.3% 8.2%
ALL RIGHTS RESERVEDNo part of this document may be reproduced without written approval from Limkokwing University of Creative Technology
1-9
Expected Return, Variance, and Covariance
Stock fund Bond Fund
Rate of Squared Rate of Squared
Scenario Return Deviation Return Deviation Recession -7% 3.24% 17% 1.00%Normal 12% 0.01% 7% 0.00%Boom 28% 2.89% -3% 1.00%Expected return 11.00% 7.00%Variance 0.0205 0.0067Standard Deviation 14.3% 8.2%
%11)(
%)28(31%)12(3
1%)7(31)(
S
S
rE
rE
ALL RIGHTS RESERVEDNo part of this document may be reproduced without written approval from Limkokwing University of Creative Technology
1-10
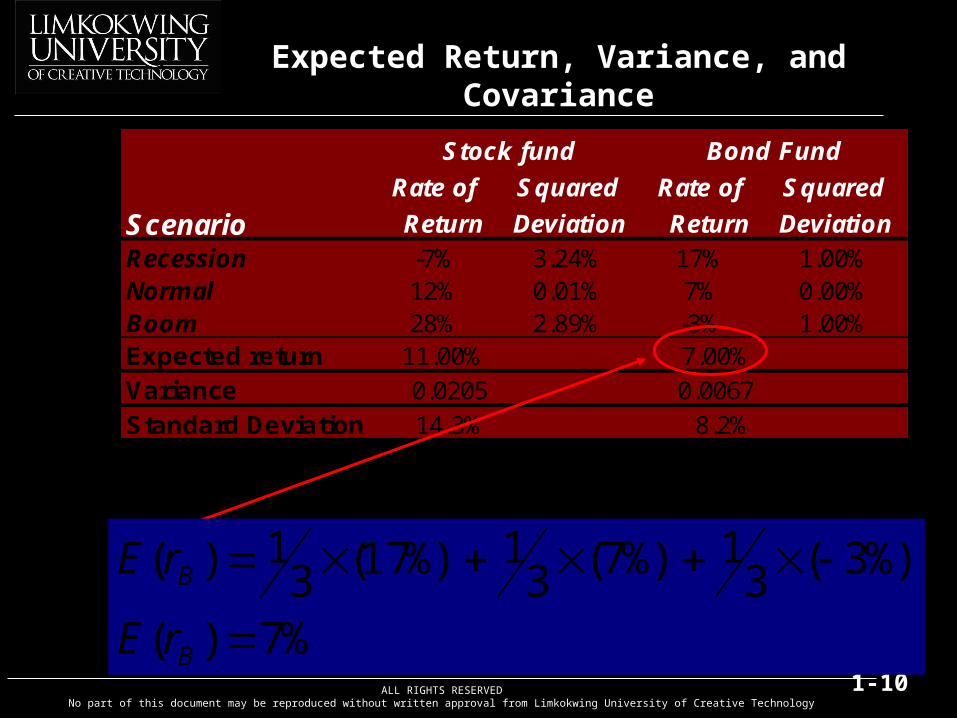
Expected Return, Variance, and Covariance
Stock fund Bond Fund
Rate of Squared Rate of Squared
Scenario Return Deviation Return Deviation Recession -7% 3.24% 17% 1.00%Normal 12% 0.01% 7% 0.00%Boom 28% 2.89% -3% 1.00%Expected return 11.00% 7.00%Variance 0.0205 0.0067Standard Deviation 14.3% 8.2%
%7)(
%)3(31%)7(3
1%)17(31)(
B
B
rE
rE
ALL RIGHTS RESERVEDNo part of this document may be reproduced without written approval from Limkokwing University of Creative Technology
1-11
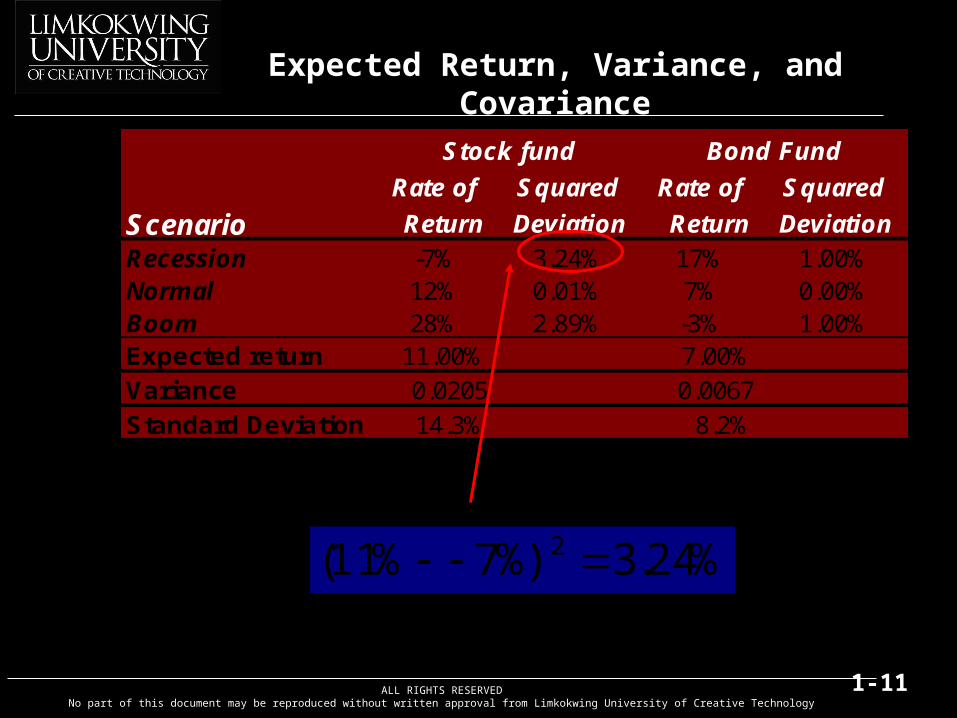
Expected Return, Variance, and Covariance
Stock fund Bond Fund
Rate of Squared Rate of Squared
Scenario Return Deviation Return Deviation Recession -7% 3.24% 17% 1.00%Normal 12% 0.01% 7% 0.00%Boom 28% 2.89% -3% 1.00%Expected return 11.00% 7.00%Variance 0.0205 0.0067Standard Deviation 14.3% 8.2%
%24.3%)7%11( 2
ALL RIGHTS RESERVEDNo part of this document may be reproduced without written approval from Limkokwing University of Creative Technology
1-12
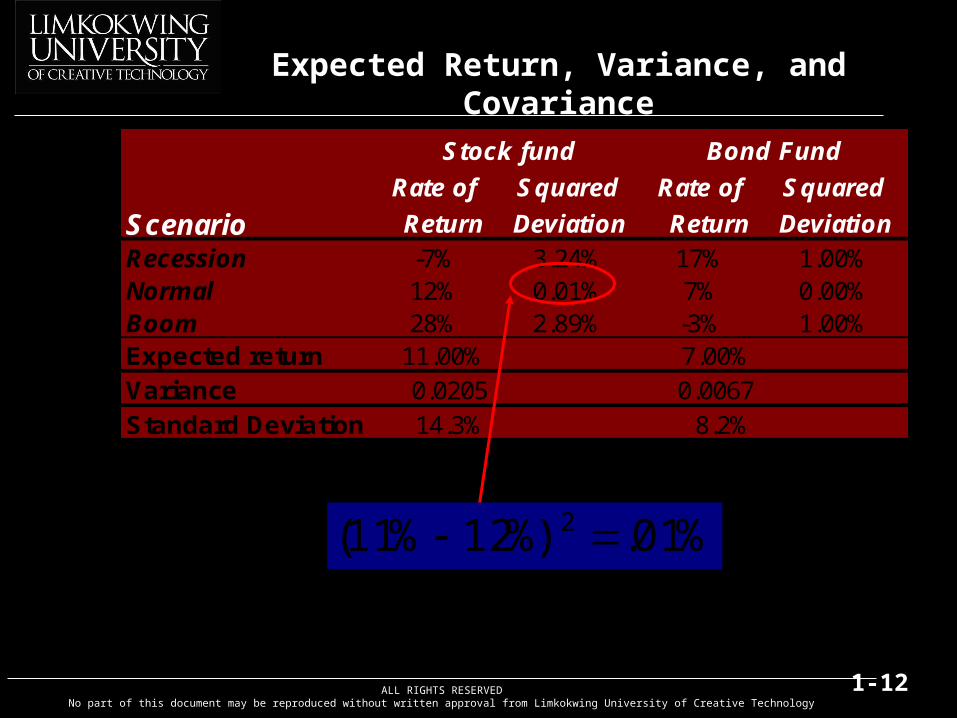
Expected Return, Variance, and Covariance
Stock fund Bond Fund
Rate of Squared Rate of Squared
Scenario Return Deviation Return Deviation Recession -7% 3.24% 17% 1.00%Normal 12% 0.01% 7% 0.00%Boom 28% 2.89% -3% 1.00%Expected return 11.00% 7.00%Variance 0.0205 0.0067Standard Deviation 14.3% 8.2%
%01.%)12%11( 2

ALL RIGHTS RESERVEDNo part of this document may be reproduced without written approval from Limkokwing University of Creative Technology
1-13
Expected Return, Variance, and Covariance
Stock fund Bond Fund
Rate of Squared Rate of Squared
Scenario Return Deviation Return Deviation Recession -7% 3.24% 17% 1.00%Normal 12% 0.01% 7% 0.00%Boom 28% 2.89% -3% 1.00%Expected return 11.00% 7.00%Variance 0.0205 0.0067Standard Deviation 14.3% 8.2%
%89.2%)28%11( 2
ALL RIGHTS RESERVEDNo part of this document may be reproduced without written approval from Limkokwing University of Creative Technology
1-14
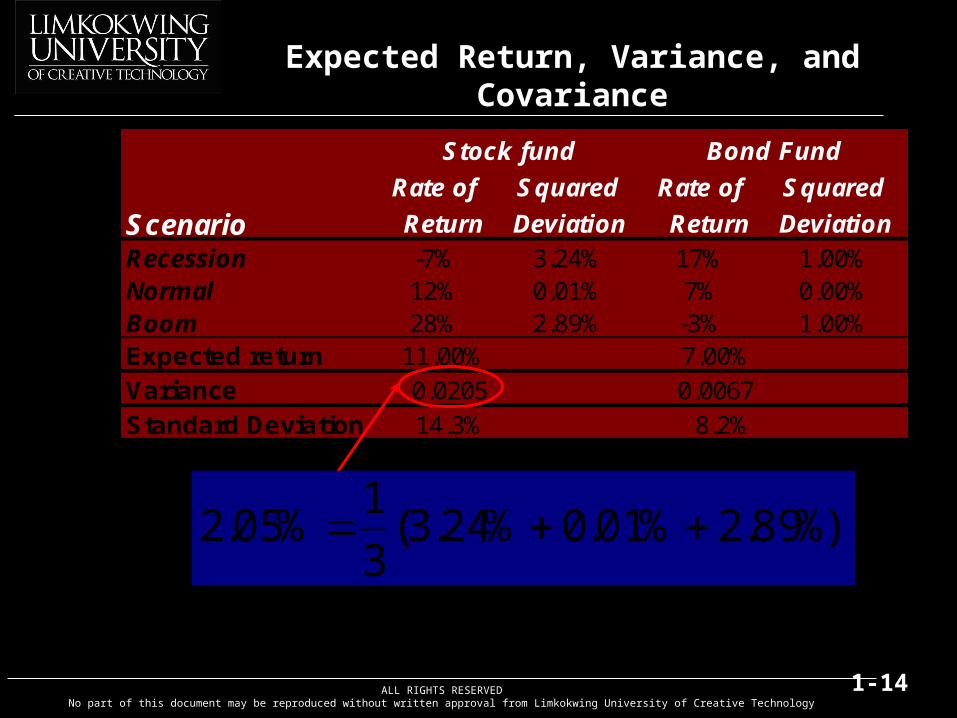
Expected Return, Variance, and Covariance
Stock fund Bond Fund
Rate of Squared Rate of Squared
Scenario Return Deviation Return Deviation Recession -7% 3.24% 17% 1.00%Normal 12% 0.01% 7% 0.00%Boom 28% 2.89% -3% 1.00%Expected return 11.00% 7.00%Variance 0.0205 0.0067Standard Deviation 14.3% 8.2%
%)89.2%01.0%24.3(3
1%05.2

ALL RIGHTS RESERVEDNo part of this document may be reproduced without written approval from Limkokwing University of Creative Technology
1-15
Expected Return, Variance, and Covariance
Stock fund Bond Fund
Rate of Squared Rate of Squared
Scenario Return Deviation Return Deviation Recession -7% 3.24% 17% 1.00%Normal 12% 0.01% 7% 0.00%Boom 28% 2.89% -3% 1.00%Expected return 11.00% 7.00%Variance 0.0205 0.0067Standard Deviation 14.3% 8.2%
0205.0%3.14
ALL RIGHTS RESERVEDNo part of this document may be reproduced without written approval from Limkokwing University of Creative Technology
1-16
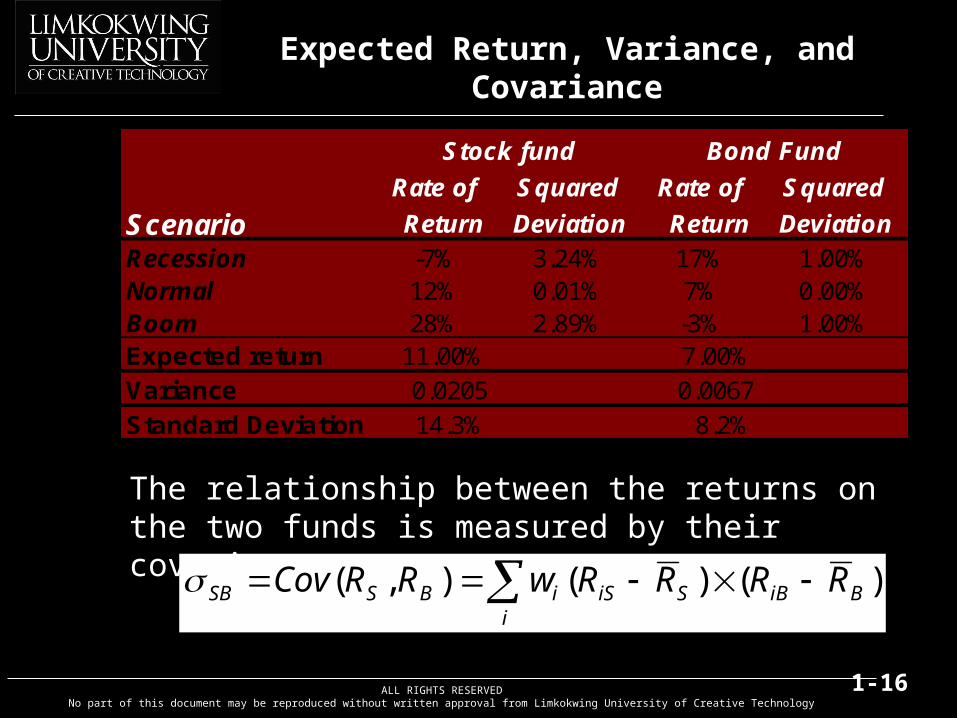
Expected Return, Variance, and Covariance
Stock fund Bond Fund
Rate of Squared Rate of Squared
Scenario Return Deviation Return Deviation Recession -7% 3.24% 17% 1.00%Normal 12% 0.01% 7% 0.00%Boom 28% 2.89% -3% 1.00%Expected return 11.00% 7.00%Variance 0.0205 0.0067Standard Deviation 14.3% 8.2%
The relationship between the returns on the two funds is measured by their covariance:
i
BiBSiSiBSSB RRRRwRRCov )()(),(
ALL RIGHTS RESERVEDNo part of this document may be reproduced without written approval from Limkokwing University of Creative Technology
1-17
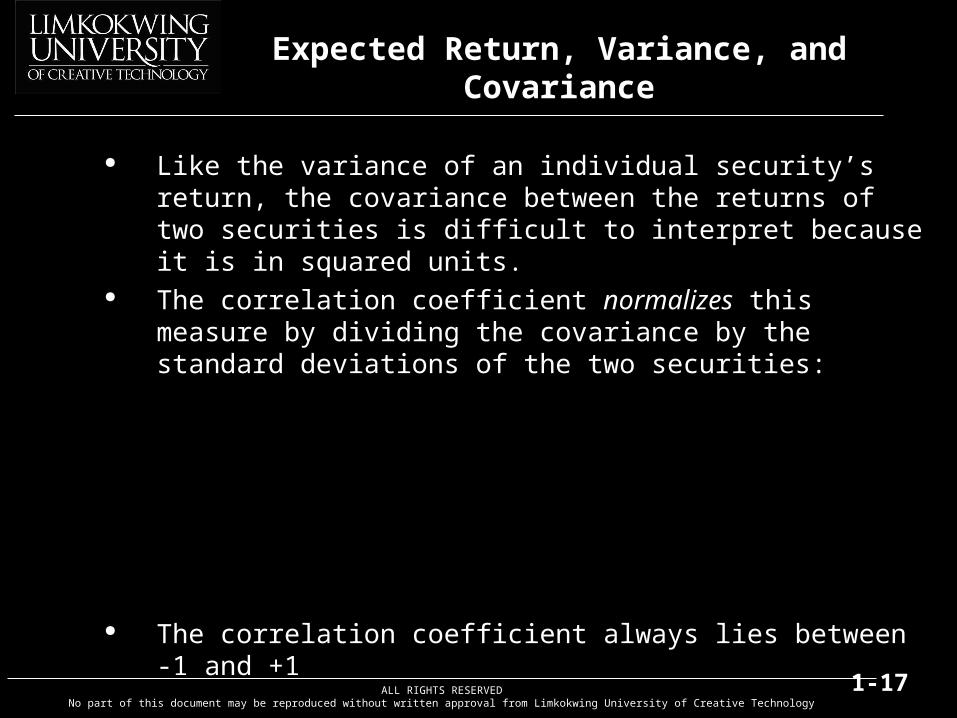
Expected Return, Variance, and Covariance
Like the variance of an individual security’s return, the covariance between the returns of two securities is difficult to interpret because it is in squared units.
The correlation coefficient normalizes this measure by dividing the covariance by the standard deviations of the two securities:
The correlation coefficient always lies between -1 and +1
)()(
),(),(
BS
BSBSSB RSDRSD
RRCovRRCorr
ALL RIGHTS RESERVEDNo part of this document may be reproduced without written approval from Limkokwing University of Creative Technology
1-18
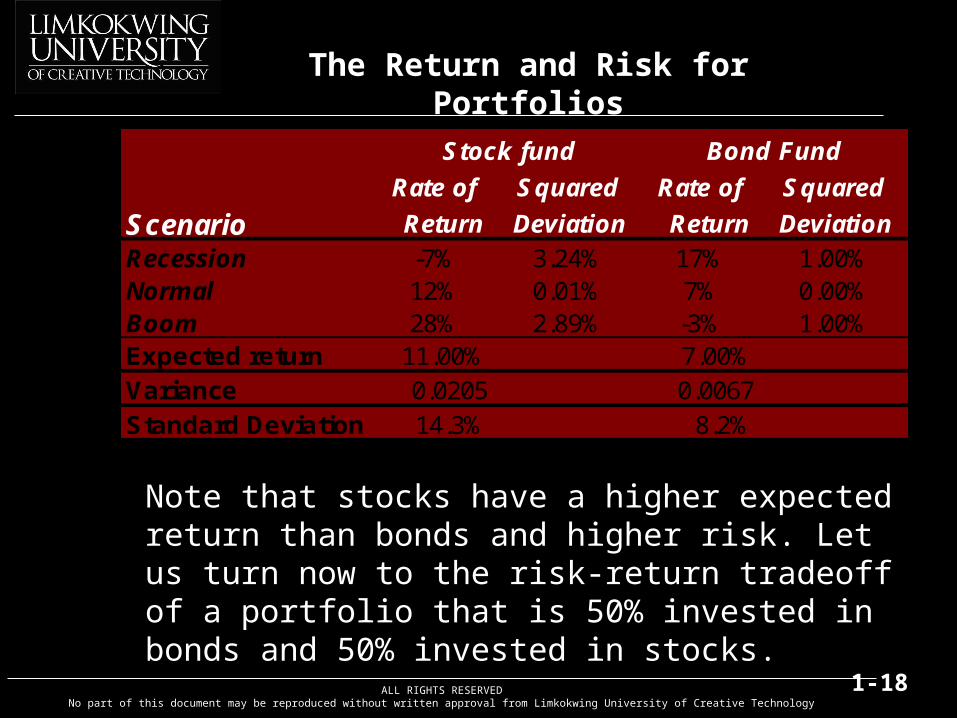
The Return and Risk for PortfoliosStock fund Bond Fund
Rate of Squared Rate of Squared
Scenario Return Deviation Return Deviation Recession -7% 3.24% 17% 1.00%Normal 12% 0.01% 7% 0.00%Boom 28% 2.89% -3% 1.00%Expected return 11.00% 7.00%Variance 0.0205 0.0067Standard Deviation 14.3% 8.2%
Note that stocks have a higher expected return than bonds and higher risk. Let us turn now to the risk-return tradeoff of a portfolio that is 50% invested in bonds and 50% invested in stocks.
ALL RIGHTS RESERVEDNo part of this document may be reproduced without written approval from Limkokwing University of Creative Technology
1-19
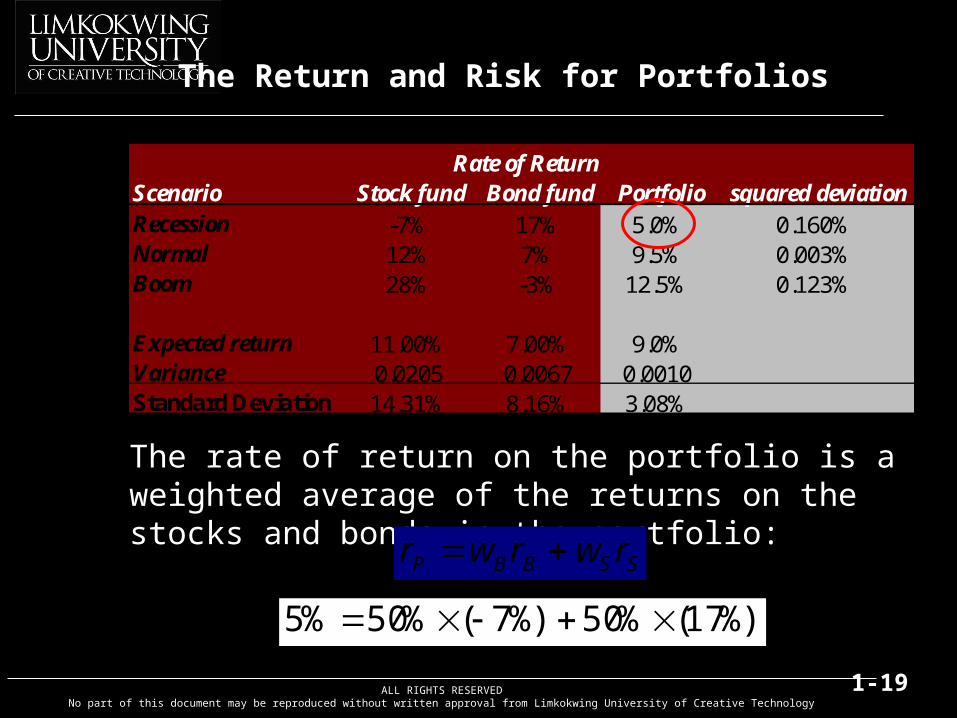
The Return and Risk for Portfolios
Rate of ReturnScenario Stock fund Bond fund Portfolio squared deviationRecession -7% 17% 5.0% 0.160%Normal 12% 7% 9.5% 0.003%Boom 28% -3% 12.5% 0.123%
Expected return 11.00% 7.00% 9.0%Variance 0.0205 0.0067 0.0010Standard Deviation 14.31% 8.16% 3.08%
The rate of return on the portfolio is a weighted average of the returns on the stocks and bonds in the portfolio:
SSBBP rwrwr
%)17(%50%)7(%50%5
ALL RIGHTS RESERVEDNo part of this document may be reproduced without written approval from Limkokwing University of Creative Technology
1-20
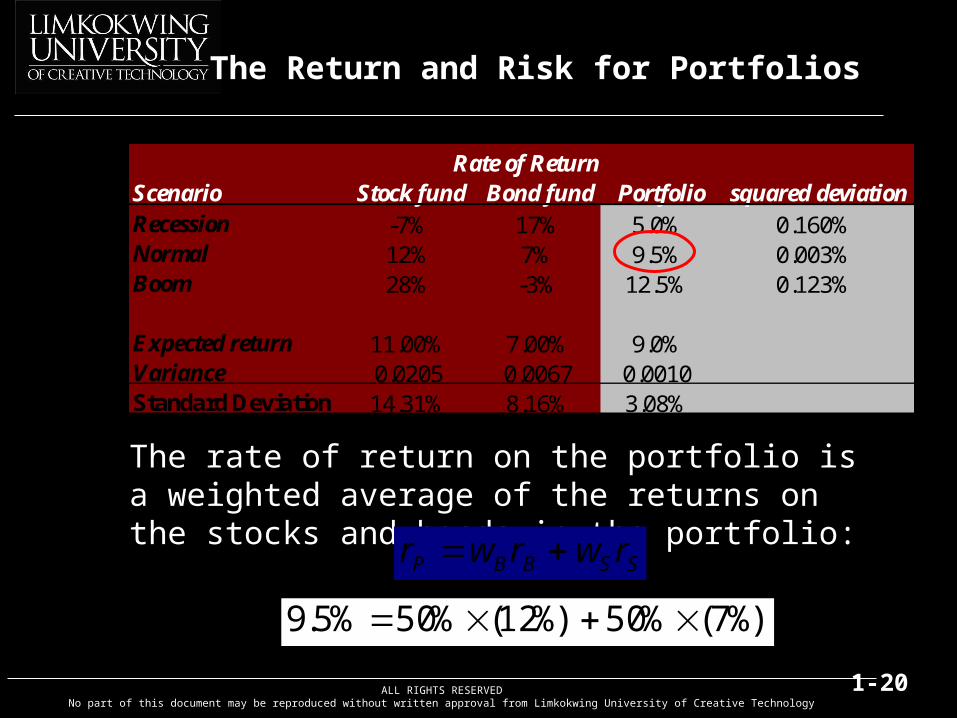
The Return and Risk for Portfolios
Rate of ReturnScenario Stock fund Bond fund Portfolio squared deviationRecession -7% 17% 5.0% 0.160%Normal 12% 7% 9.5% 0.003%Boom 28% -3% 12.5% 0.123%
Expected return 11.00% 7.00% 9.0%Variance 0.0205 0.0067 0.0010Standard Deviation 14.31% 8.16% 3.08%
The rate of return on the portfolio is a weighted average of the returns on the stocks and bonds in the portfolio:
%)7(%50%)12(%50%5.9
SSBBP rwrwr
ALL RIGHTS RESERVEDNo part of this document may be reproduced without written approval from Limkokwing University of Creative Technology
1-21
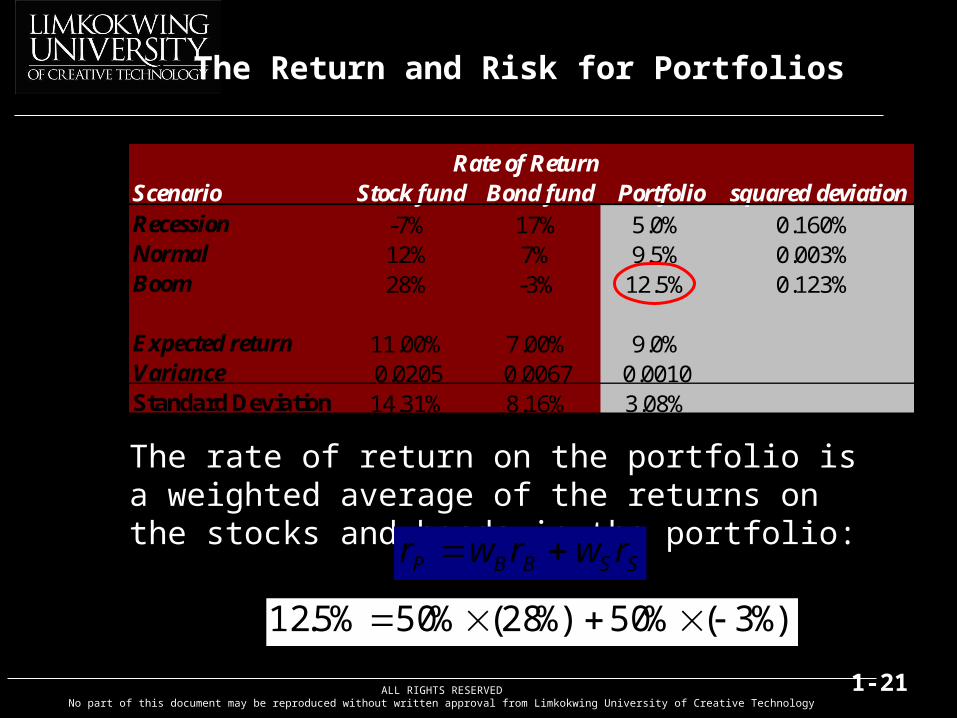
The Return and Risk for Portfolios
Rate of ReturnScenario Stock fund Bond fund Portfolio squared deviationRecession -7% 17% 5.0% 0.160%Normal 12% 7% 9.5% 0.003%Boom 28% -3% 12.5% 0.123%
Expected return 11.00% 7.00% 9.0%Variance 0.0205 0.0067 0.0010Standard Deviation 14.31% 8.16% 3.08%
The rate of return on the portfolio is a weighted average of the returns on the stocks and bonds in the portfolio:
%)3(%50%)28(%50%5.12
SSBBP rwrwr
ALL RIGHTS RESERVEDNo part of this document may be reproduced without written approval from Limkokwing University of Creative Technology
1-22
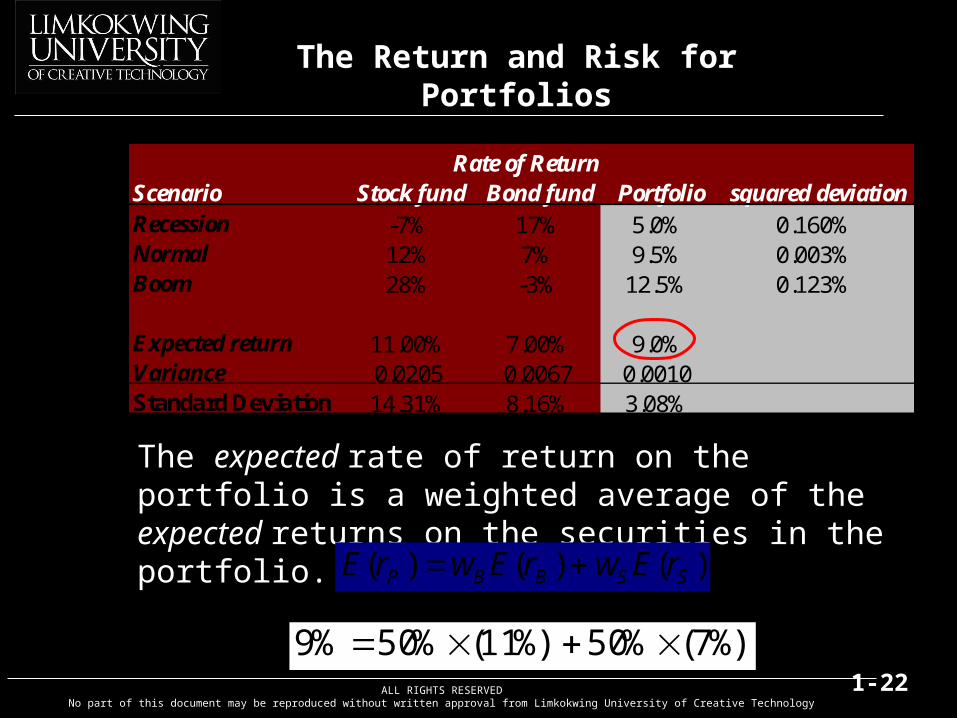
The Return and Risk for Portfolios
Rate of ReturnScenario Stock fund Bond fund Portfolio squared deviationRecession -7% 17% 5.0% 0.160%Normal 12% 7% 9.5% 0.003%Boom 28% -3% 12.5% 0.123%
Expected return 11.00% 7.00% 9.0%Variance 0.0205 0.0067 0.0010Standard Deviation 14.31% 8.16% 3.08%
The expected rate of return on the portfolio is a weighted average of the expected returns on the securities in the portfolio.
%)7(%50%)11(%50%9
)()()( SSBBP rEwrEwrE
ALL RIGHTS RESERVEDNo part of this document may be reproduced without written approval from Limkokwing University of Creative Technology
1-23
The Return and Risk for Portfolios
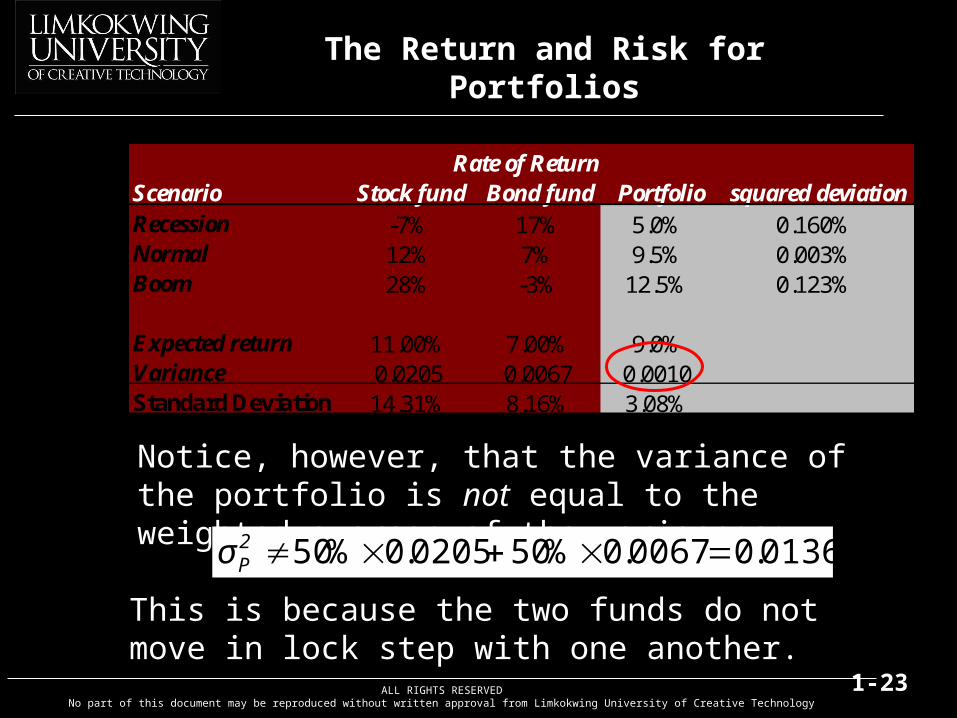
Rate of ReturnScenario Stock fund Bond fund Portfolio squared deviationRecession -7% 17% 5.0% 0.160%Normal 12% 7% 9.5% 0.003%Boom 28% -3% 12.5% 0.123%
Expected return 11.00% 7.00% 9.0%Variance 0.0205 0.0067 0.0010Standard Deviation 14.31% 8.16% 3.08%
Notice, however, that the variance of the portfolio is not equal to the weighted average of the variances:
0136.00067.0%500205.0%50 2Pσ
This is because the two funds do not move in lock step with one another.
ALL RIGHTS RESERVEDNo part of this document may be reproduced without written approval from Limkokwing University of Creative Technology
1-24
The Return and Risk for Portfolios
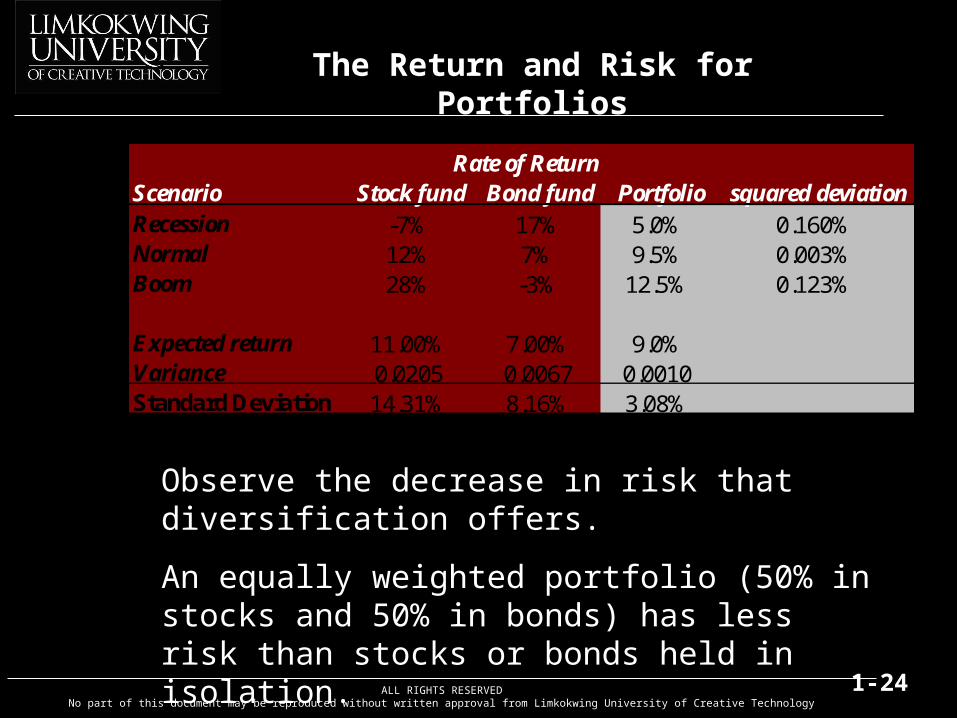
Rate of ReturnScenario Stock fund Bond fund Portfolio squared deviationRecession -7% 17% 5.0% 0.160%Normal 12% 7% 9.5% 0.003%Boom 28% -3% 12.5% 0.123%
Expected return 11.00% 7.00% 9.0%Variance 0.0205 0.0067 0.0010Standard Deviation 14.31% 8.16% 3.08%
Observe the decrease in risk that diversification offers.
An equally weighted portfolio (50% in stocks and 50% in bonds) has less risk than stocks or bonds held in isolation.
ALL RIGHTS RESERVEDNo part of this document may be reproduced without written approval from Limkokwing University of Creative Technology
1-25
The Efficient Set for Two Assets
Portfolo Risk and Return Combinations
5.0%
6.0%
7.0%
8.0%
9.0%
10.0%
11.0%
12.0%
0.0% 2.0% 4.0% 6.0% 8.0% 10.0% 12.0% 14.0% 16.0%
Portfolio Risk (standard deviation)Po
rtfol
io R
etur
n
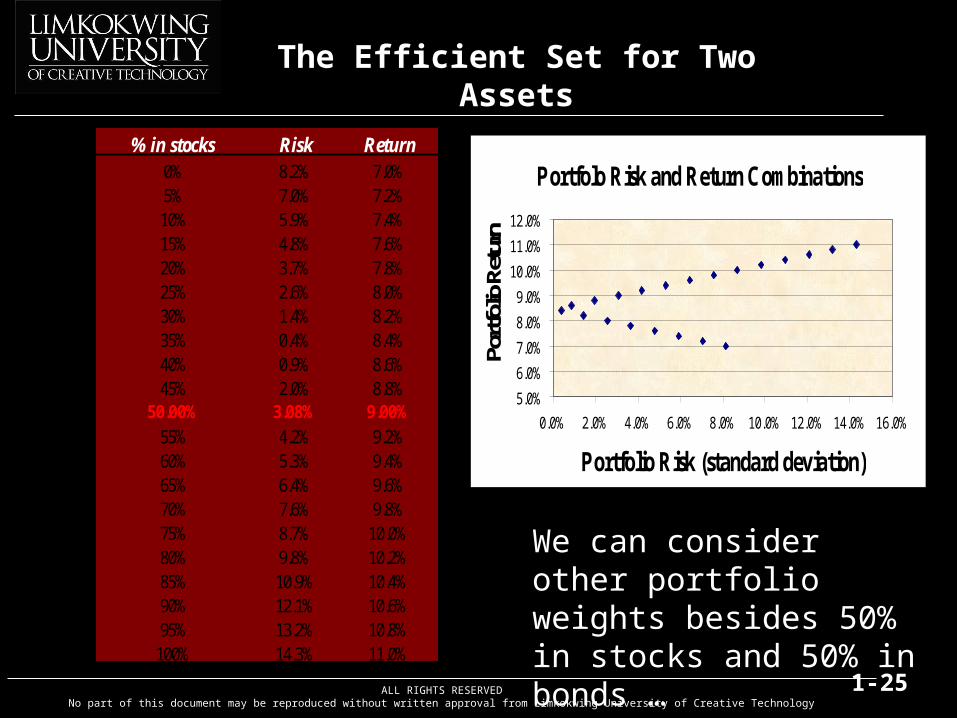
% in stocks Risk Return0% 8.2% 7.0%5% 7.0% 7.2%10% 5.9% 7.4%15% 4.8% 7.6%20% 3.7% 7.8%25% 2.6% 8.0%30% 1.4% 8.2%35% 0.4% 8.4%40% 0.9% 8.6%45% 2.0% 8.8%
50.00% 3.08% 9.00%55% 4.2% 9.2%60% 5.3% 9.4%65% 6.4% 9.6%70% 7.6% 9.8%75% 8.7% 10.0%80% 9.8% 10.2%85% 10.9% 10.4%90% 12.1% 10.6%95% 13.2% 10.8%
100% 14.3% 11.0%
We can consider other portfolio weights besides 50% in stocks and 50% in bonds …
ALL RIGHTS RESERVEDNo part of this document may be reproduced without written approval from Limkokwing University of Creative Technology
1-26
The Efficient Set for Two Assets
Portfolo Risk and Return Combinations
5.0%
6.0%
7.0%
8.0%
9.0%
10.0%
11.0%
12.0%
0.0% 2.0% 4.0% 6.0% 8.0% 10.0% 12.0% 14.0% 16.0%
Portfolio Risk (standard deviation)
Portf
olio R
etur
n
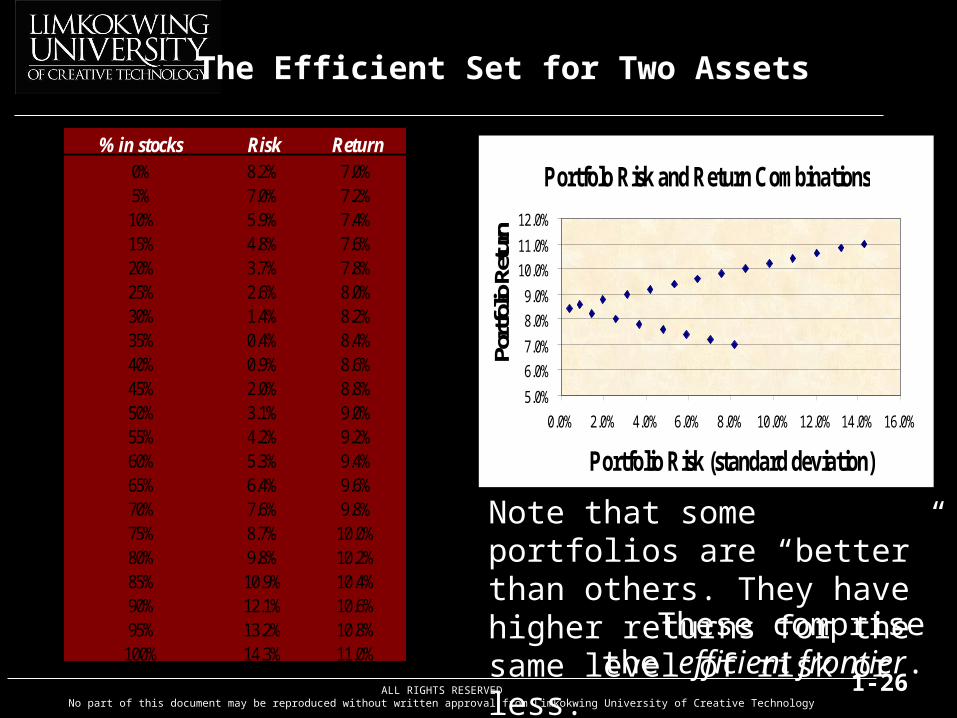
% in stocks Risk Return0% 8.2% 7.0%5% 7.0% 7.2%10% 5.9% 7.4%15% 4.8% 7.6%20% 3.7% 7.8%25% 2.6% 8.0%30% 1.4% 8.2%35% 0.4% 8.4%40% 0.9% 8.6%45% 2.0% 8.8%50% 3.1% 9.0%55% 4.2% 9.2%60% 5.3% 9.4%65% 6.4% 9.6%70% 7.6% 9.8%75% 8.7% 10.0%80% 9.8% 10.2%85% 10.9% 10.4%90% 12.1% 10.6%95% 13.2% 10.8%
100% 14.3% 11.0%
Note that some portfolios are “better” than others. They have higher returns for the same level of risk or less. These comprise the
efficient frontier.
ALL RIGHTS RESERVEDNo part of this document may be reproduced without written approval from Limkokwing University of Creative Technology
1-27
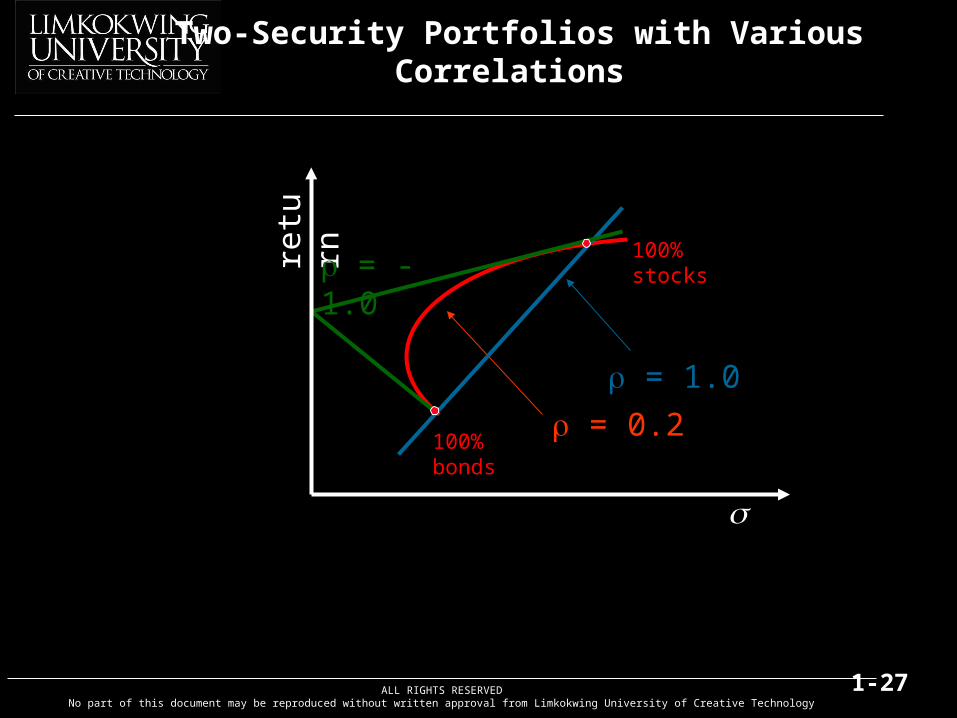
Two-Security Portfolios with Various Correlations
100% bonds
retu
rn
100% stocks
= 0.2
= 1.0
= -1.0
ALL RIGHTS RESERVEDNo part of this document may be reproduced without written approval from Limkokwing University of Creative Technology
1-28
Portfolio Risk/Return Two Securities: Correlation Effects
Relationship depends on correlation coefficient
-1.0 < < +1.0
The smaller the correlation, the greater the risk reduction potential
If= +1.0, no risk reduction is possible
ALL RIGHTS RESERVEDNo part of this document may be reproduced without written approval from Limkokwing University of Creative Technology
1-29
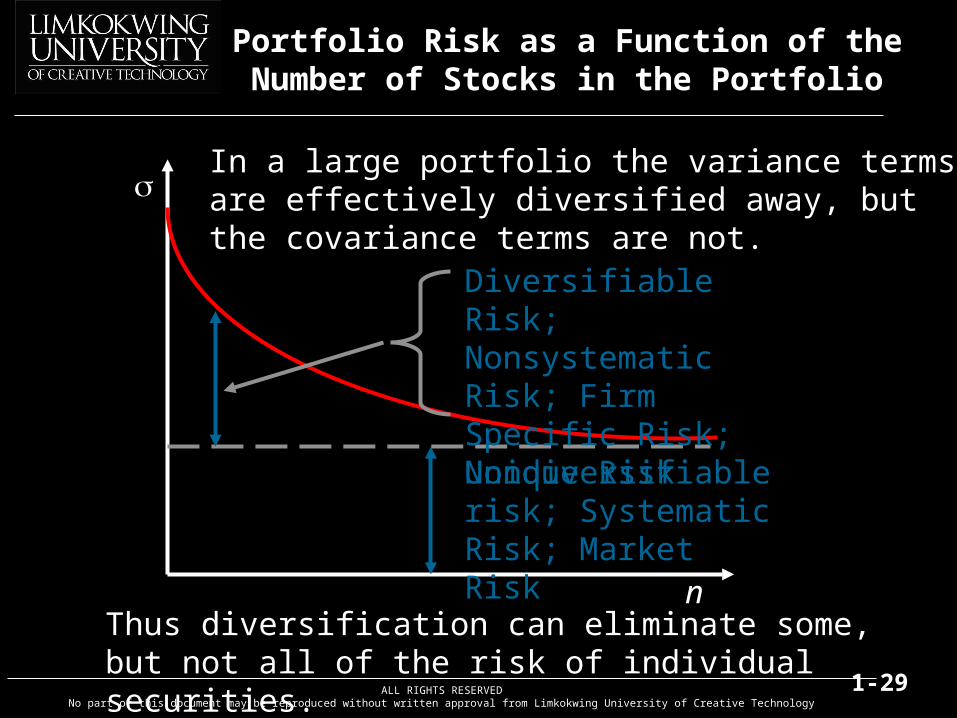
Portfolio Risk as a Function of the Number of Stocks in the Portfolio
Nondiversifiable risk; Systematic Risk; Market Risk
Diversifiable Risk; Nonsystematic Risk; Firm Specific Risk; Unique Risk
n
Thus diversification can eliminate some, but not all of the risk of individual securities.
In a large portfolio the variance terms are effectively diversified away, but the covariance terms are not.
ALL RIGHTS RESERVEDNo part of this document may be reproduced without written approval from Limkokwing University of Creative Technology
1-30
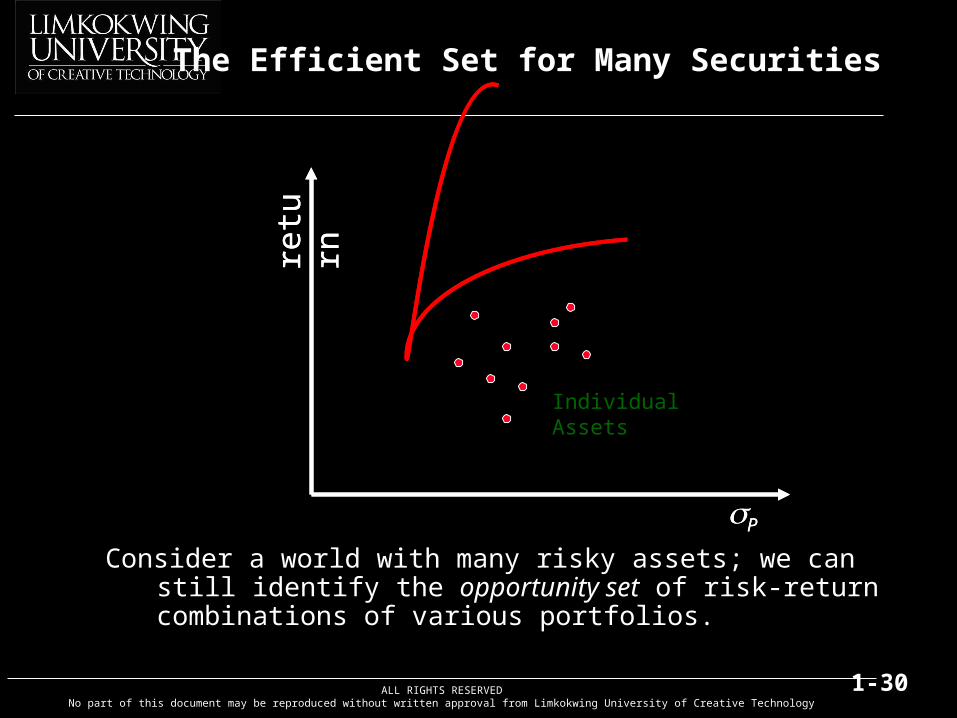
The Efficient Set for Many Securities
retu
rn
P
retu
rn
P
Individual Assets
Consider a world with many risky assets; we can still identify the opportunity set of risk-return combinations of various portfolios.
ALL RIGHTS RESERVEDNo part of this document may be reproduced without written approval from Limkokwing University of Creative Technology
1-31
The Efficient Set for Many Securities
retu
rn
P
minimum variance portfolio
Individual Assets
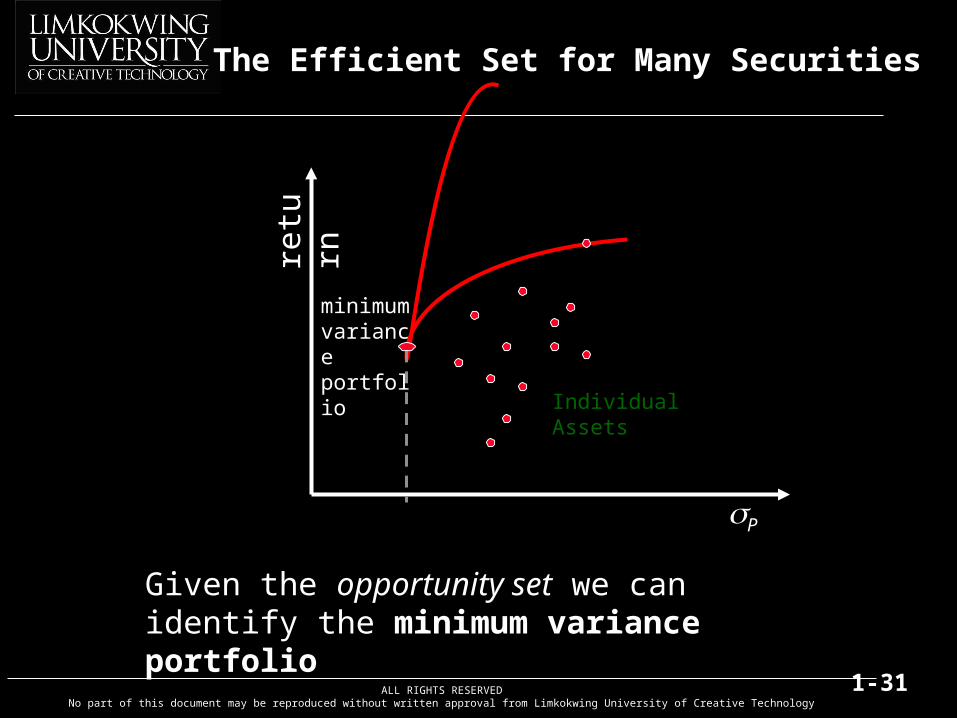
Given the opportunity set we can identify the minimum variance portfolio
ALL RIGHTS RESERVEDNo part of this document may be reproduced without written approval from Limkokwing University of Creative Technology
1-32
The Efficient Set for Many Securities
retu
rn
P
minimum variance portfolio
efficient frontier
Individual Assets
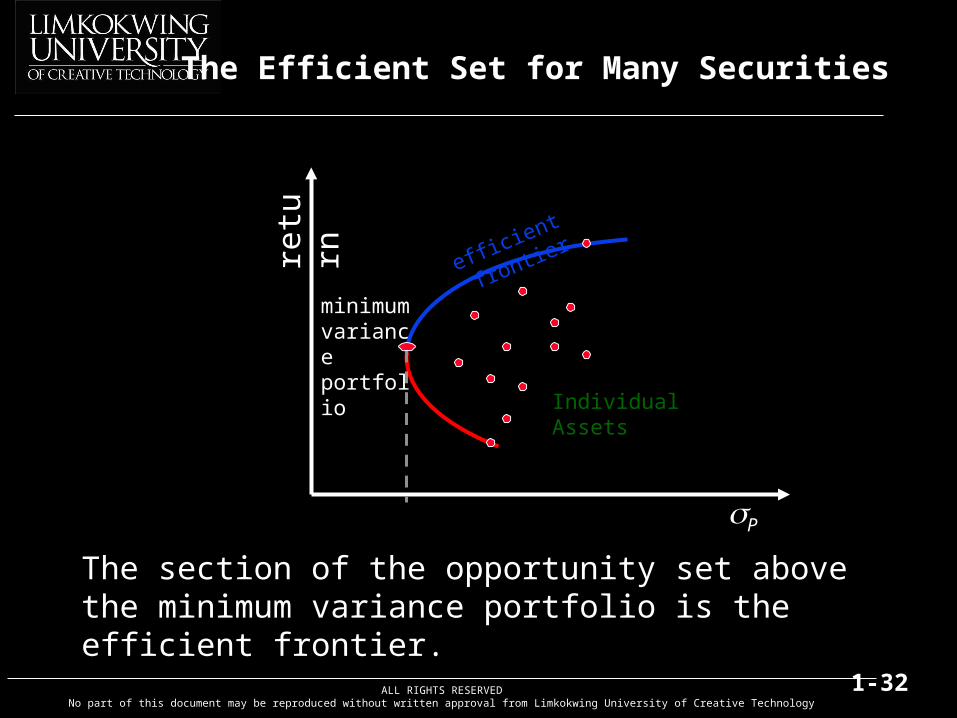
The section of the opportunity set above the minimum variance portfolio is the efficient frontier.
ALL RIGHTS RESERVEDNo part of this document may be reproduced without written approval from Limkokwing University of Creative Technology
1-33
Optimal Risky Portfolio with a Risk-Free Asset
100% bonds
100% stocks
retu
rn
efficient frontier
rf
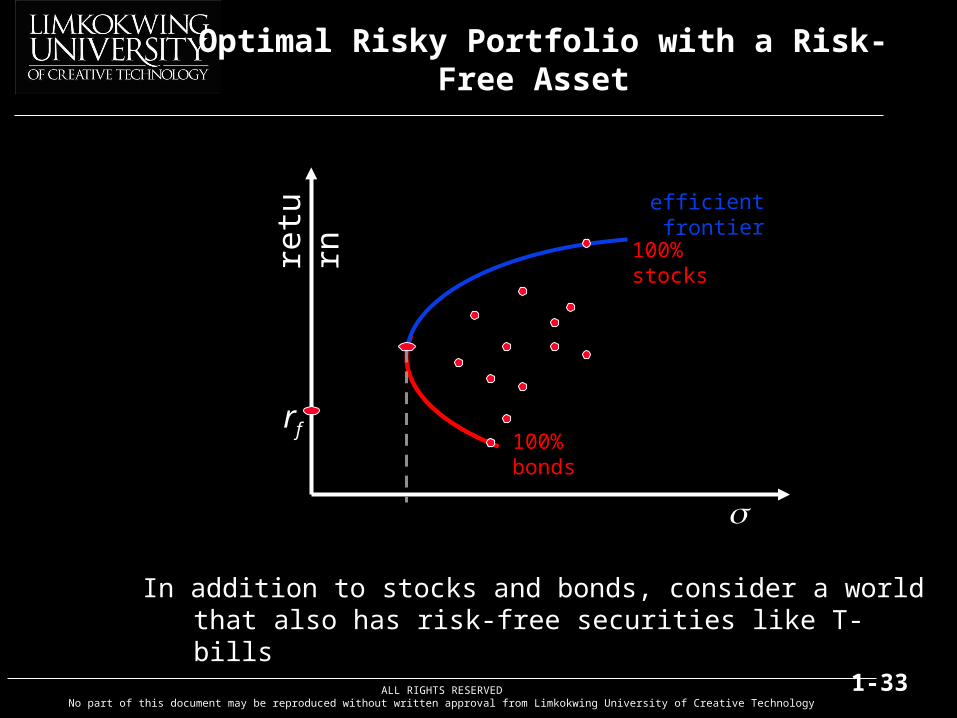
In addition to stocks and bonds, consider a world that also has risk-free securities like T-bills
ALL RIGHTS RESERVEDNo part of this document may be reproduced without written approval from Limkokwing University of Creative Technology
1-34
Market Equilibrium
retu
rn
P
efficient frontier
rf
CML
100% bonds
100% stocksM
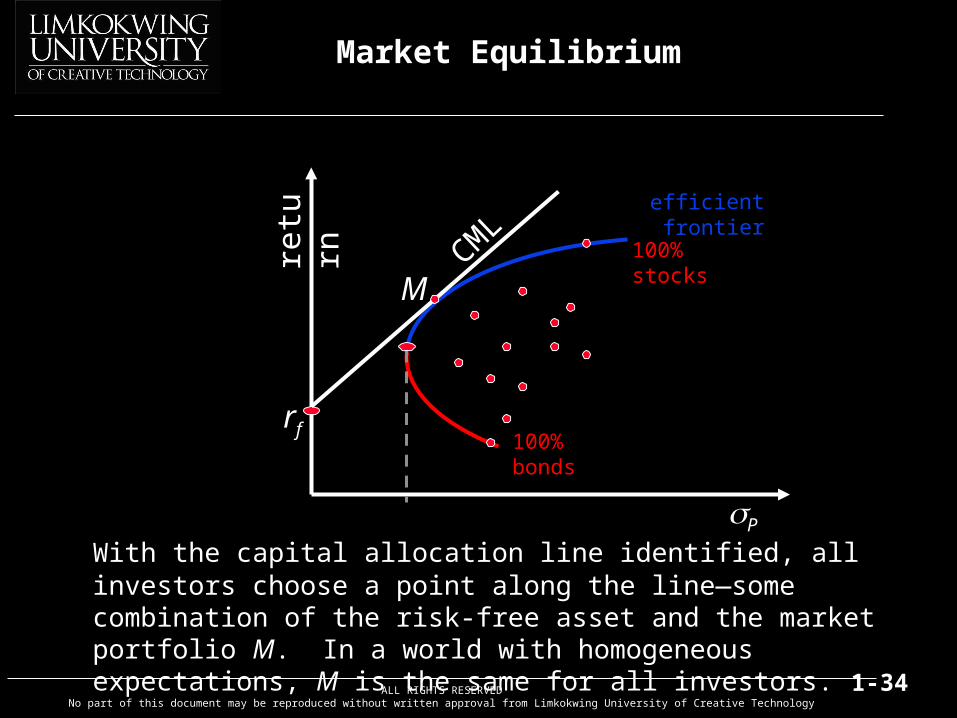
With the capital allocation line identified, all investors choose a point along the line—some combination of the risk-free asset and the market portfolio M. In a world with homogeneous expectations, M is the same for all investors.
ALL RIGHTS RESERVEDNo part of this document may be reproduced without written approval from Limkokwing University of Creative Technology
1-35
The Separation Property
retu
rn
P
efficient frontier
rf
MCM
L
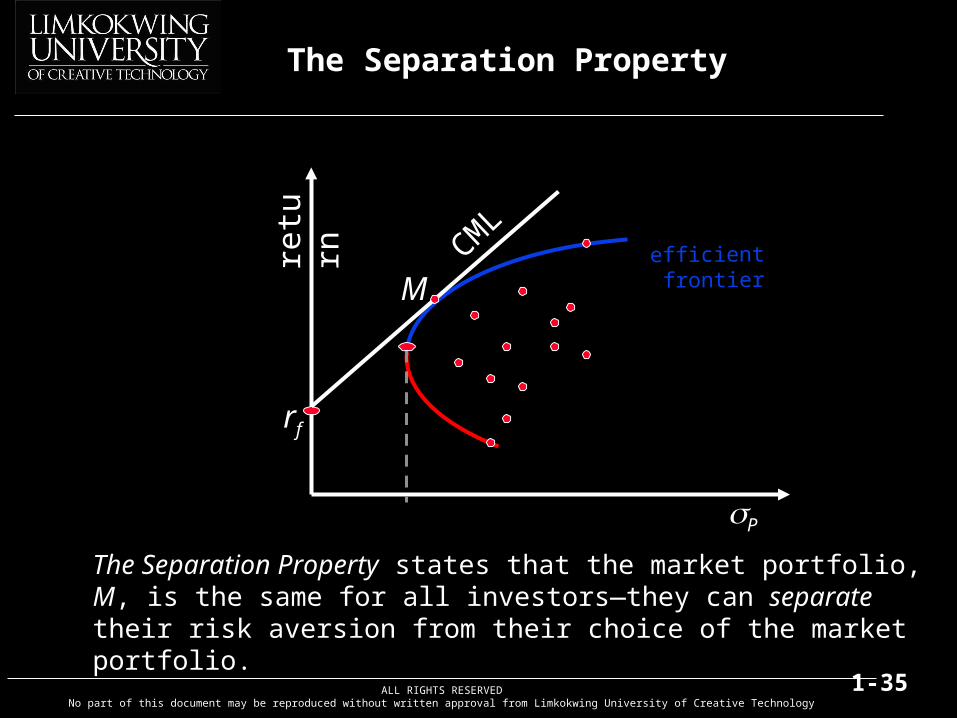
The Separation Property states that the market portfolio, M, is the same for all investors—they can separate their risk aversion from their choice of the market portfolio.
ALL RIGHTS RESERVEDNo part of this document may be reproduced without written approval from Limkokwing University of Creative Technology
1-36
The Separation Property
retu
rn
P
efficient frontier
rf
CML
M
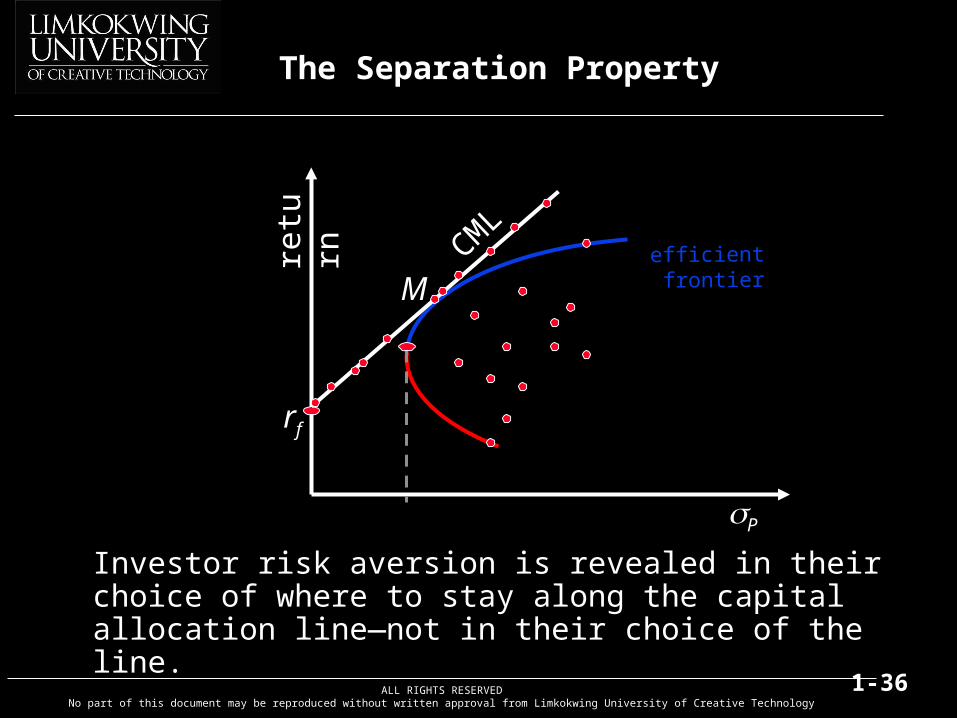
Investor risk aversion is revealed in their choice of where to stay along the capital allocation line—not in their choice of the line.
ALL RIGHTS RESERVEDNo part of this document may be reproduced without written approval from Limkokwing University of Creative Technology
1-37
Market Equilibrium
100% bonds
100% stocks
rf
retu
rn
Balanced fund
CML
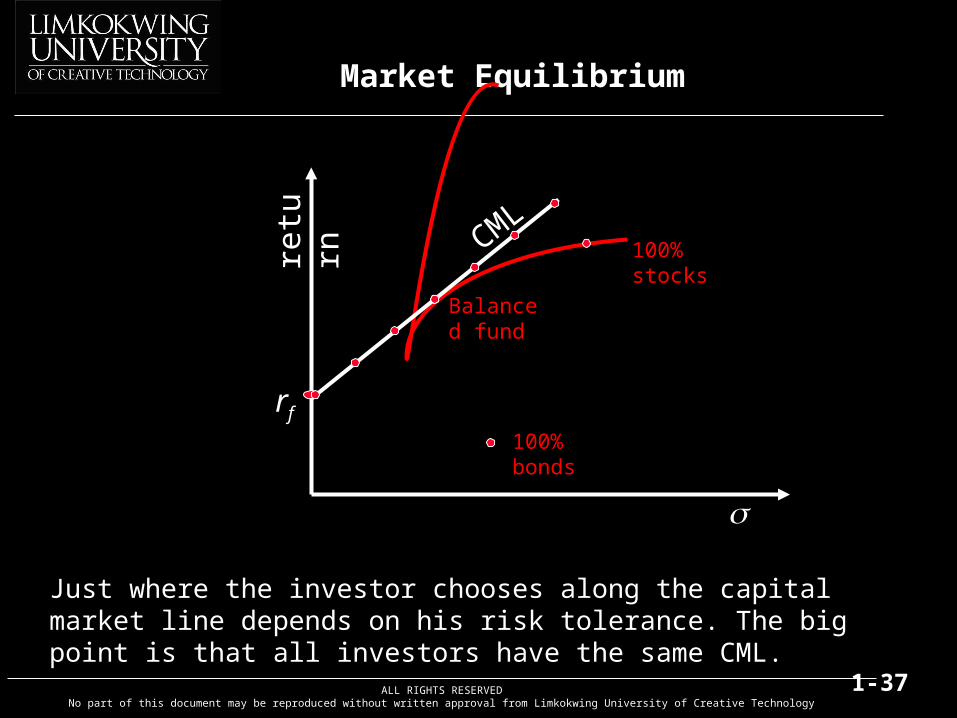
Just where the investor chooses along the capital market line depends on his risk tolerance. The big point is that all investors have the same CML.
ALL RIGHTS RESERVEDNo part of this document may be reproduced without written approval from Limkokwing University of Creative Technology
1-38
Market Equilibrium
100% bonds
100% stocks
rf
retu
rn
Optimal Risky Porfolio
CML
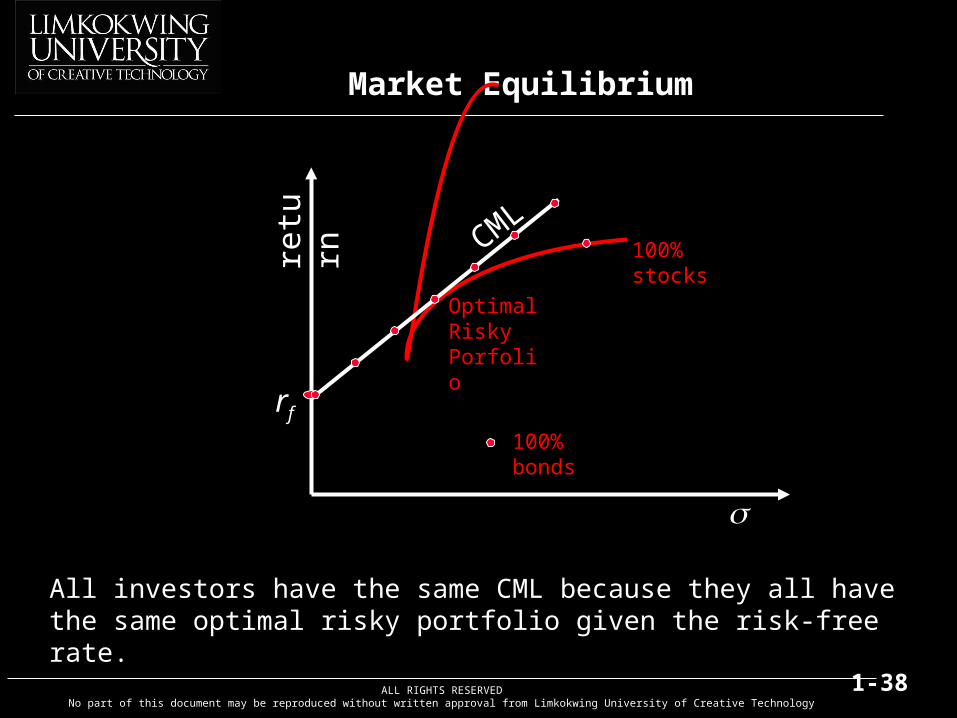
All investors have the same CML because they all have the same optimal risky portfolio given the risk-free rate.
ALL RIGHTS RESERVEDNo part of this document may be reproduced without written approval from Limkokwing University of Creative Technology
1-39
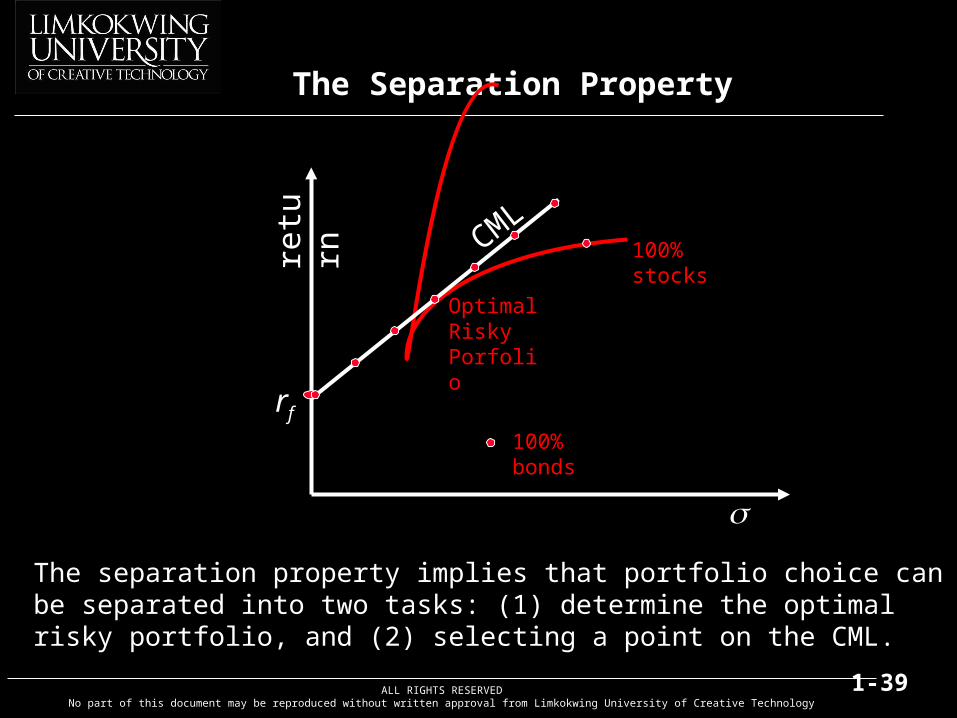
The Separation Property
100% bonds
100% stocks
rf
retu
rn
Optimal Risky Porfolio
CML
The separation property implies that portfolio choice can be separated into two tasks: (1) determine the optimal risky portfolio, and (2) selecting a point on the CML.
ALL RIGHTS RESERVEDNo part of this document may be reproduced without written approval from Limkokwing University of Creative Technology
1-40
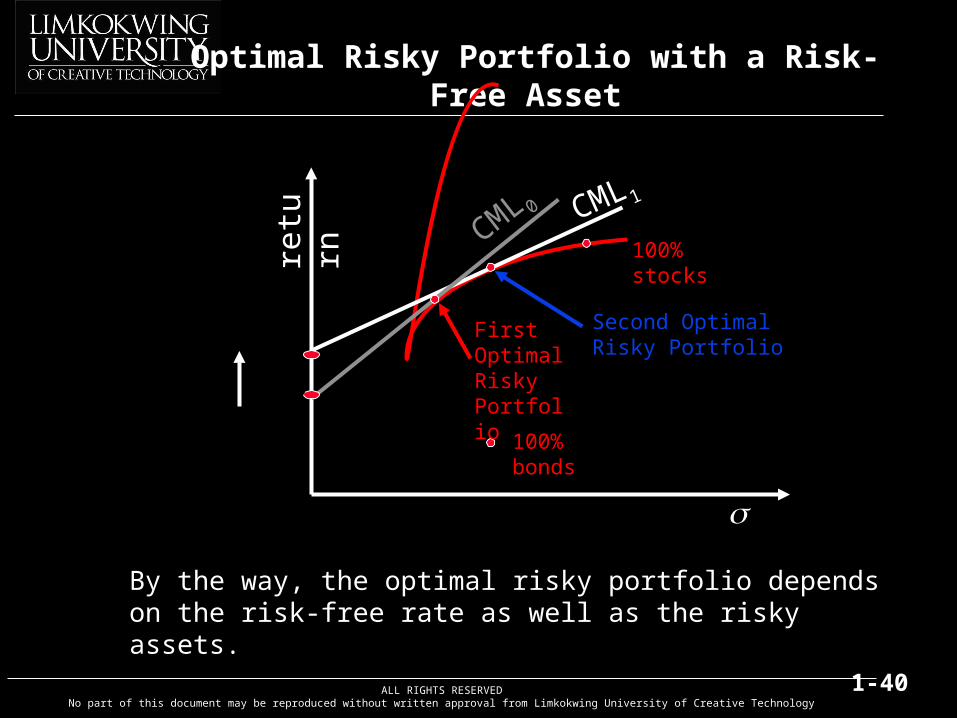
Optimal Risky Portfolio with a Risk-Free Asset
100% bonds
100% stocks
retu
rn
First Optimal Risky Portfolio
Second Optimal Risky Portfolio
CML 0 CML 1
0fr
1fr
By the way, the optimal risky portfolio depends on the risk-free rate as well as the risky assets.
ALL RIGHTS RESERVEDNo part of this document may be reproduced without written approval from Limkokwing University of Creative Technology
1-41
Definition of Risk When Investors Hold the Market Portfolio
Researchers have shown that the best measure of the risk of a security in a large portfolio is the beta () of the security.
Beta measures the responsiveness of a security to movements in the market portfolio.
)(
)(2
,
M
Mii R
RRCov
ALL RIGHTS RESERVEDNo part of this document may be reproduced without written approval from Limkokwing University of Creative Technology
1-42
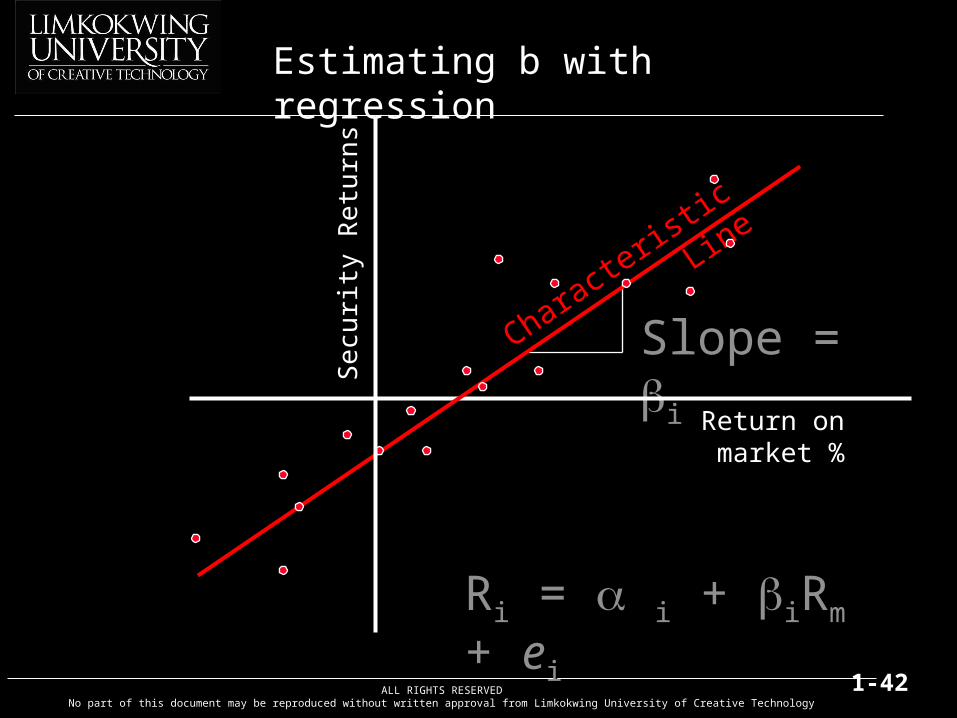
Estimating b with regression
Sec
urity
Ret
urns
Sec
urity
Ret
urns
Return on Return on market %market %
RRii = = ii + + iiRRmm + + eeii
Slope = Slope = iiChara
cteris
tic Line
Characte
ristic
Line
ALL RIGHTS RESERVEDNo part of this document may be reproduced without written approval from Limkokwing University of Creative Technology
1-43
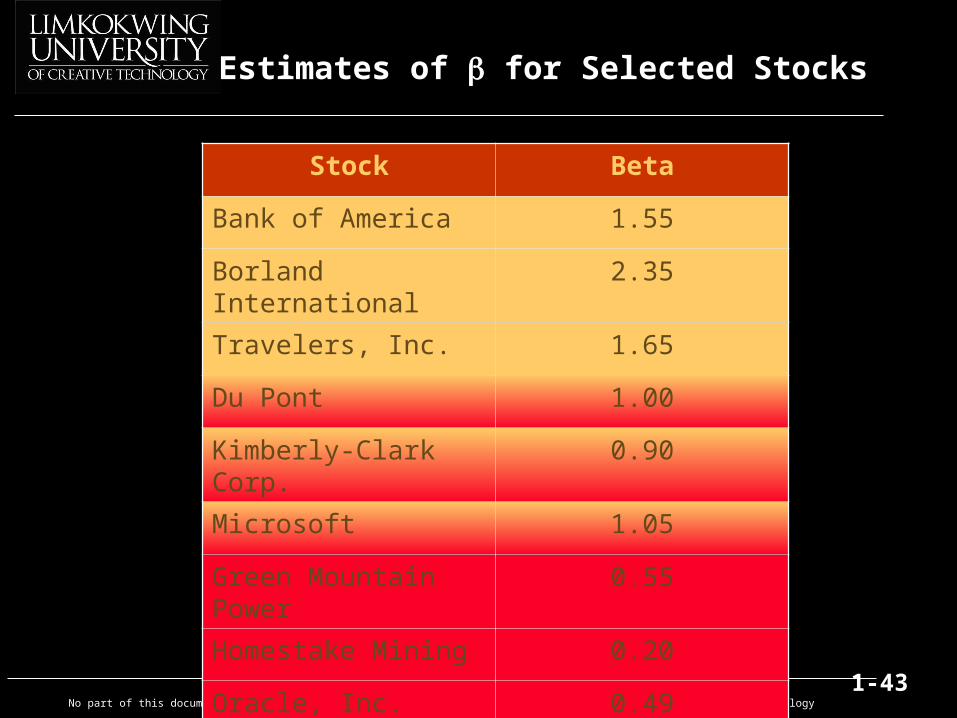
Estimates of for Selected Stocks
Stock Beta
Bank of America 1.55
Borland International 2.35
Travelers, Inc. 1.65
Du Pont 1.00
Kimberly-Clark Corp. 0.90
Microsoft 1.05
Green Mountain Power 0.55
Homestake Mining 0.20
Oracle, Inc. 0.49
ALL RIGHTS RESERVEDNo part of this document may be reproduced without written approval from Limkokwing University of Creative Technology
1-44
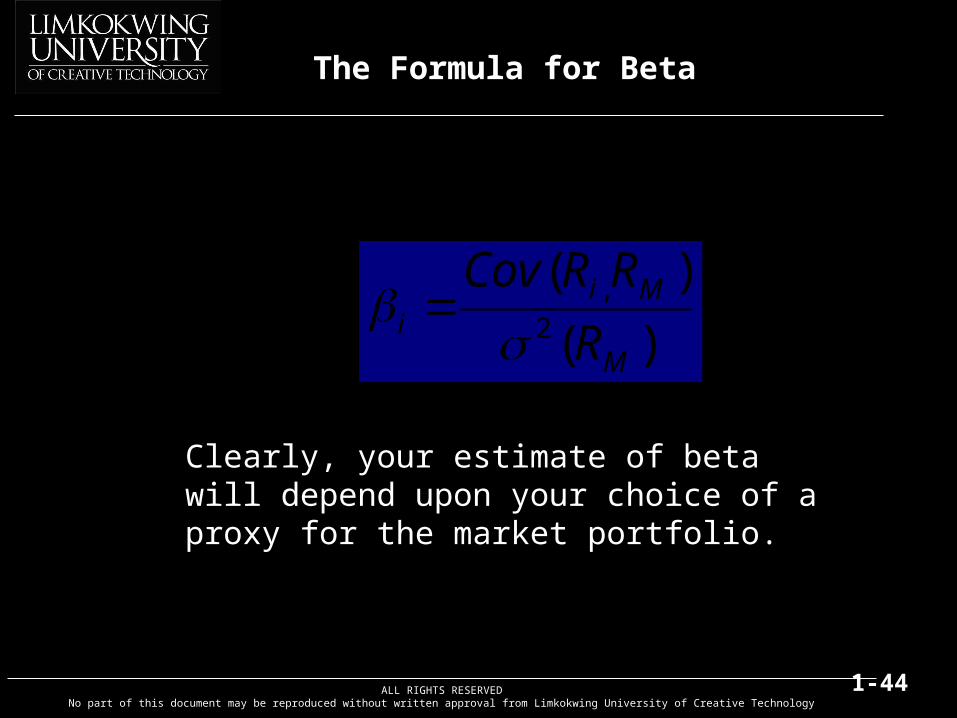
The Formula for Beta
)(
)(2
,
M
Mii R
RRCov
Clearly, your estimate of beta will depend upon your choice of a proxy for the market portfolio.
ALL RIGHTS RESERVEDNo part of this document may be reproduced without written approval from Limkokwing University of Creative Technology
1-45
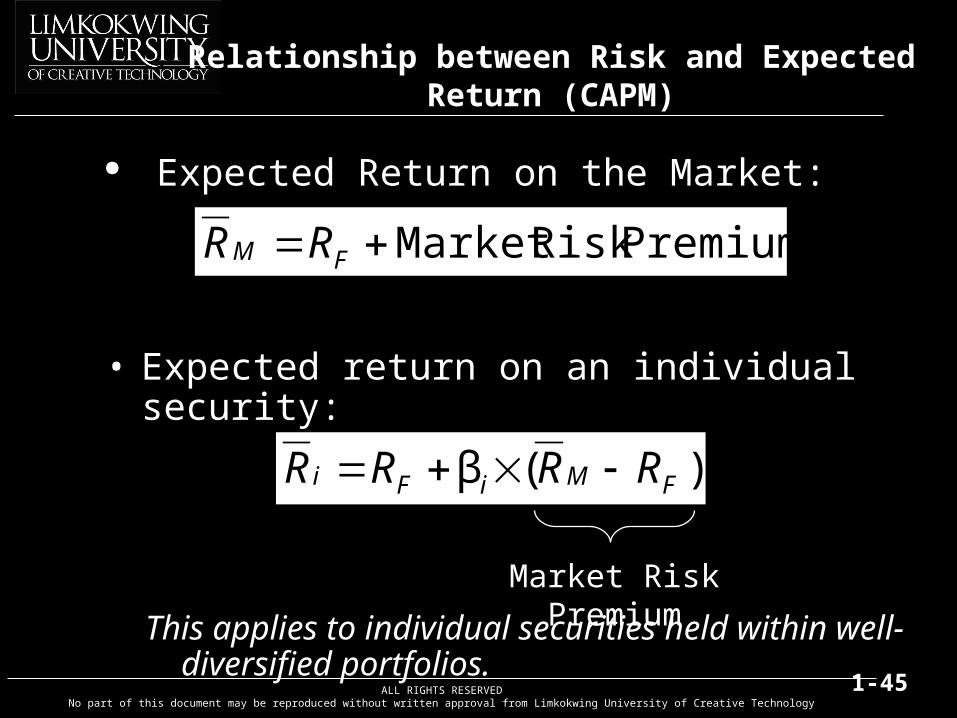
Relationship between Risk and Expected Return (CAPM)
Expected Return on the Market:
• Expected return on an individual security:
PremiumRisk Market FM RR
)(β FMiFi RRRR
Market Risk Premium
This applies to individual securities held within well-diversified portfolios.
ALL RIGHTS RESERVEDNo part of this document may be reproduced without written approval from Limkokwing University of Creative Technology
1-46
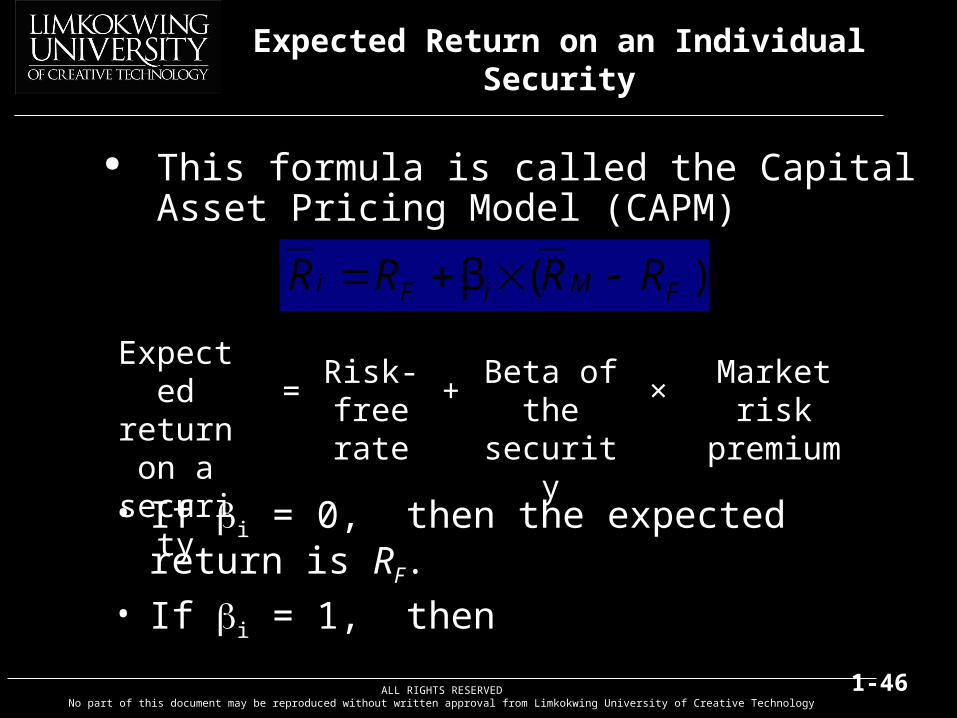
Expected Return on an Individual Security
This formula is called the Capital Asset Pricing Model (CAPM)
)(β FMiFi RRRR
• If i = 0, then the expected return is RF.• If i = 1, then
Expected return on a security
=Risk-
free rate+
Beta of the security
×Market risk
premium
ALL RIGHTS RESERVEDNo part of this document may be reproduced without written approval from Limkokwing University of Creative Technology
1-47
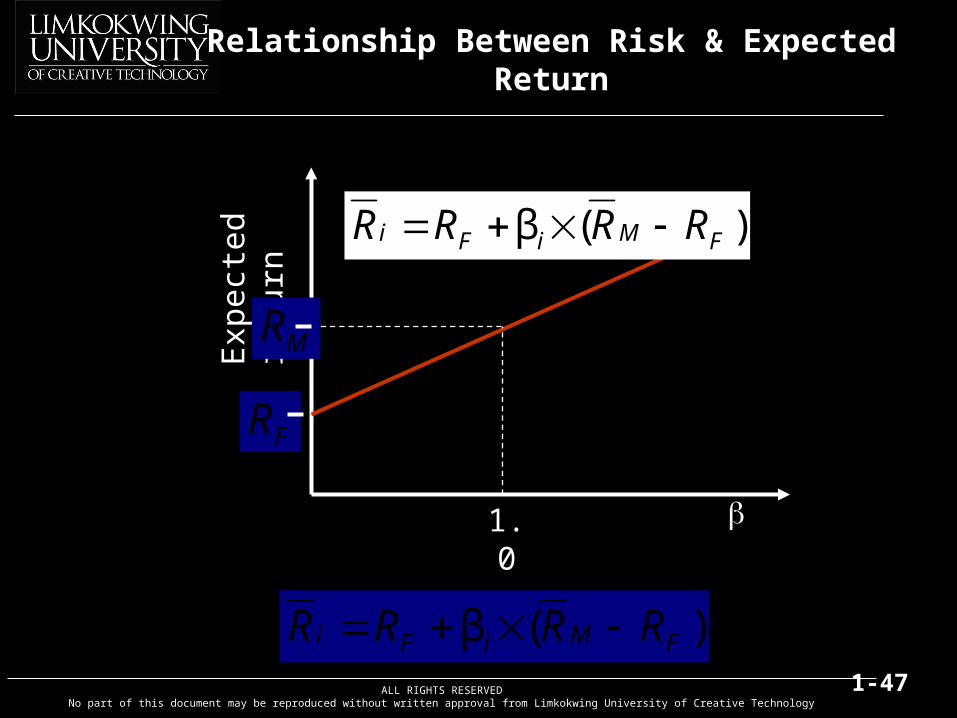
Relationship Between Risk & Expected Return
Exp
ecte
d re
turn
)(β FMiFi RRRR
FR
1.0
MR
)(β FMiFi RRRR
ALL RIGHTS RESERVEDNo part of this document may be reproduced without written approval from Limkokwing University of Creative Technology
1-48
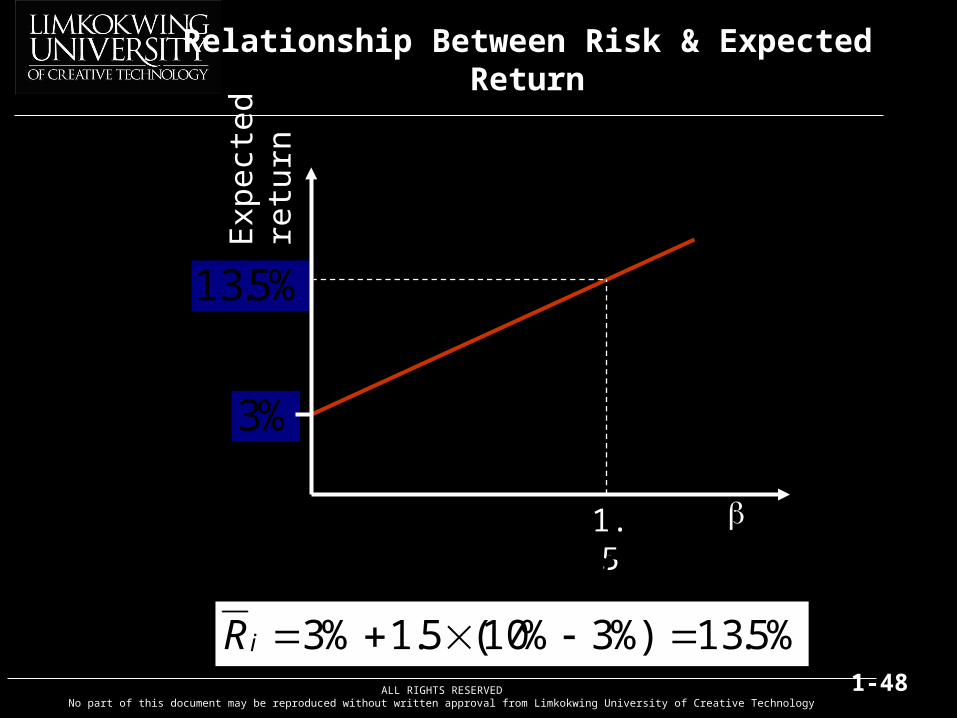
Relationship Between Risk & Expected Return
Exp
ecte
d re
turn
%3FR
%3
1.5
%5.13
5.1β i %10MR
%5.13%)3%10(5.1%3 iR
ALL RIGHTS RESERVEDNo part of this document may be reproduced without written approval from Limkokwing University of Creative Technology
1-49
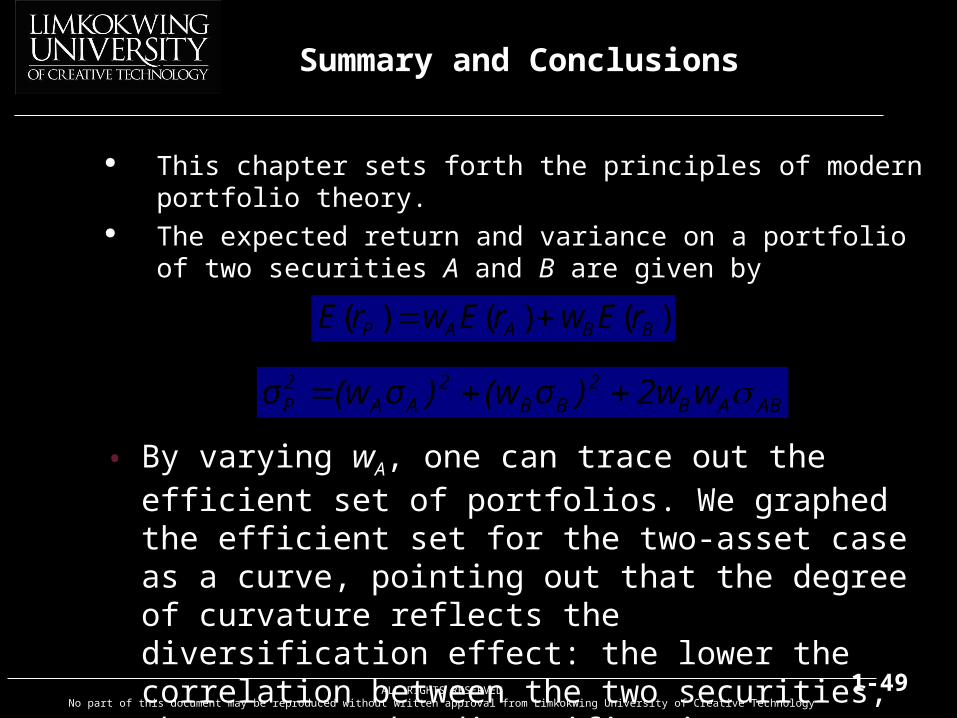
Summary and Conclusions
This chapter sets forth the principles of modern portfolio theory.
The expected return and variance on a portfolio of two securities A and B are given by
ABAB2
BB2
AA2P w2w)σ(w)σ(wσ
)()()( BBAAP rEwrEwrE
• By varying wA, one can trace out the efficient set of portfolios. We graphed the efficient set for the two-asset case as a curve, pointing out that the degree of curvature reflects the diversification effect: the lower the correlation between the two securities, the greater the diversification.
• The same general shape holds in a world of many assets.
ALL RIGHTS RESERVEDNo part of this document may be reproduced without written approval from Limkokwing University of Creative Technology
1-50
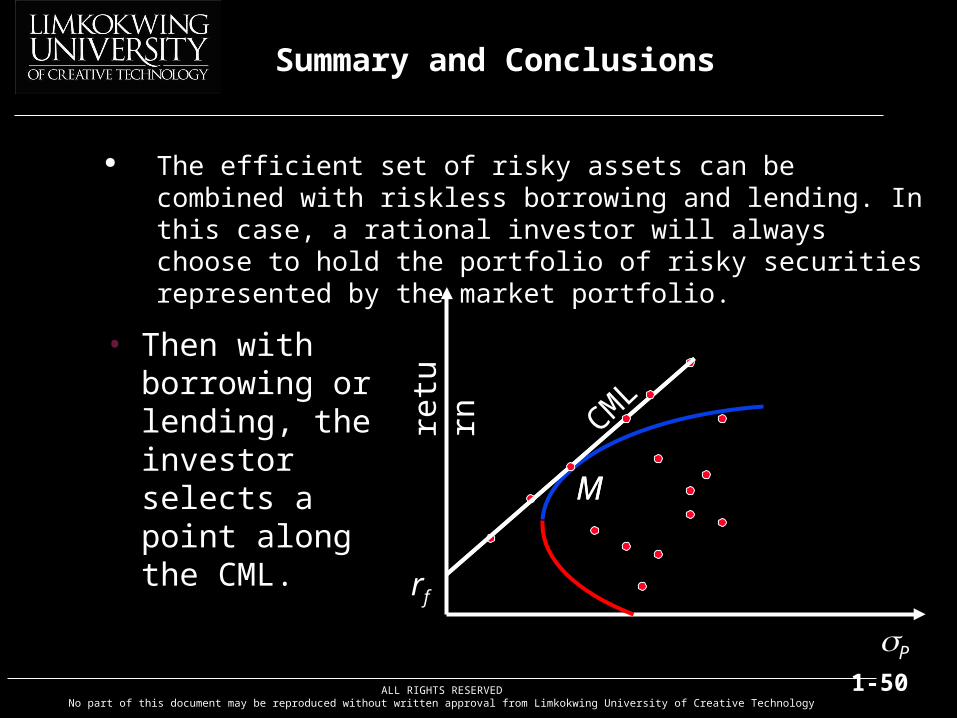
Summary and Conclusions
retu
rn
P
rf
MM
CML
The efficient set of risky assets can be combined with riskless borrowing and lending. In this case, a rational investor will always choose to hold the portfolio of risky securities represented by the market portfolio.
• Then with borrowing or lending, the investor selects a point along the CML.
ALL RIGHTS RESERVEDNo part of this document may be reproduced without written approval from Limkokwing University of Creative Technology
1-51
Summary and Conclusions
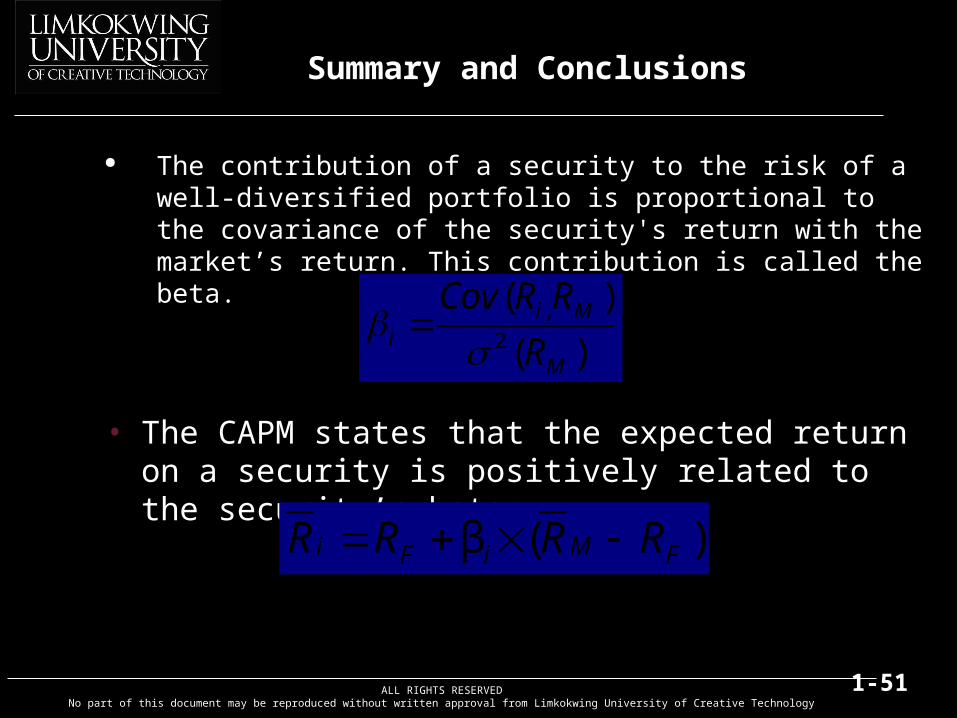
The contribution of a security to the risk of a well-diversified portfolio is proportional to the covariance of the security's return with the market’s return. This contribution is called the beta.
• The CAPM states that the expected return on a security is positively related to the security’s beta:
)(
)(2
,
M
Mii R
RRCov
)(β FMiFi RRRR