Embed Size (px)
Citation preview
111
2
DisclaimerAll rights reserved. The findings, interpretation, and conclusions expressed herein are those of the authors and donot necessarily reflect the views of the Board of Executive Directors of the World Bank or the governments theyrepresent. Copying and / or formatting portions or all of this work without prior permission may be in violation ofapplicable law. The World Bank encourages dissemination of its work and will normally grant permission promptly.Any queries in this regard should be addressed to the Office of the Publisher, World Bank, 1818 H. Street NW,Washington, DC 20433, e-mail: [email protected].
3
AcknowledgementsThis report is a joint effort of the Government of Afghanistan, Ministry of Economy and theWorld Bank. The report is the fourth in a series of reports as part of the World Bank’sprogrammatic approach to Poverty Assessment, which is led by Dean Jolliffe. Ismail Rahimi,Director General of Policy of ANDS M&E at Ministry of Economy, was a co-lead in thedevelopment of this report, and organized and chaired the Poverty Analysis and PolicyCommittee (PAPC) which played a critical role in forming this report. The team members on thisreport consisted of Jolliffe, Rahimi, Anna D’Souza (ERS, US Dept. of Agriculture), Abdul Malik(SASEP, WB), Lea Gimenez Duarte (SASEP, WB) and Silvia Redaelli (SASEP, WB). The teamreceived valuable input on numerous drafts leading up to this report from members of the PAPC,which includes GoA representatives from Central Statistics Organization (CSO), Ministry ofEconomy (MoEc), Ministry of Agriculture, Irrigation and Livestock (MAIL), Ministry of RuralRehabilitation and Development (MRRD), Ministry of Finance (MoF), Ministry of Labor, SocialAffairs, Martyrs and Disabled (MOLSAMD), as well as representatives from the EuropeanUnion (EU), UK Department for International Development (DfID), World Food Programme(WFP), Asian Development Bank (ADB), United Nations Assistance Mission in Afghanistan(UNAMA), and Japan International Cooperation Agency (JICA). The team thanks for theirsupport and guidance Josephine Bassinette, World Bank acting Country Director forAfghanistan, Nicholas Krafft, previously World Bank Country Director. The team also thanksWFP and MAIL for their feedback on drafts of this report, and input on the food consumptionscore. We further thank Mr.Farid Popalzai Director of Policy and ANDS evaluation, Mr. NabiSroosh, Director of ANDS Monitoring Methodology, Mr.Feroz Khan Masjidi, Manager PovertyAnalysis Department and all other members of the General Directorate of Policy and ANDSM&E; as well as Johannes Georges Pius (SASDA, WB), Vinaya Swaroop, SASEP SectorManager, John Newman, SASEP Lead Poverty Economist, and Amanullah Assil (WFP), fortheir valuable inputs. This report synthesizes research findings that were made possible byfinancial support from the World Bank’s Research Support Budget. The views expressed in thisreport do not necessarily represent the views of ERS or the U.S. Department of Agriculture.Finally, the team would like to note that without the dedication of staff from CSO and MRRD,and funding from EU, WFP, DfID, ADB, and WB to collect the NRVA 2007/08 data, this reportwould not have been possible.
444
5
EXECUTIVE SUMMARY
Afghanistan faces a severe problem of poor nutrition and food insecurity. Chronic malnutritionamong Afghan children is one of the highest in the world. More than half (54%) of Afghanchildren under age five are stunted (chronically malnourished) and over a third (34%) areunderweight. Around 72 percent of children (under age 5) suffer from the deficiency of keymicro-nutrients (such as iron and iodine). These poor nutritional outcomes are closely linked tothe state of food security in the country. More than a quarter (29 percent) of Afghan populationcannot meet its calorie requirement, that is, it consumes less than 2100 calories per day. Twentypercent of the population consumes a diet that lacks adequate dietary diversity, thus affectingtheir micro-nutrient intake. Moreover, the problem of food insecurity compounds in lean seasons(for example during the spring season) when 33 percent of the population suffers from caloriedeficiency and 24 percent from poor diet.
This report investigates the status of food insecurity in Afghanistan with a focus on mappingprovincial differences and an emphasis on understanding the impact of rising food prices on keymeasures of food security. It synthesizes findings from analysis of rising food prices and theirimpact on different measures of food access and utilization (such as calorie intake, proteinconsumption and the quality of diet) in Afghanistan. The findings are based on the analysis ofdata from the National Risk and Vulnerability Assessment (NRVA) 2007/08, a sample of over20,000 households from all 34 provinces of Afghanistan. This analytical work is an integral partof the on-going collaboration between the Government of Afghanistan and the World Bank inthe domain of poverty and vulnerability assessment. It aims to further the understanding ofhousehold wellbeing and vulnerability from the standpoint of food security and complements theearlier work presented in “Poverty Status in Afghanistan: A Profile based on National Risk andVulnerability Assessment (NRVA 2007/08)” and in the companion piece on sub-nationaldevelopment statistics—“Afghanistan Provincial Briefs”.
For the purposes of the empirical analysis in this report, three measures of household foodsecurity are used: per capita daily caloric intake; protein intake; and, household dietary diversity.The first measure—per capita daily caloric intake—is a measure of access to food and iscalculated by converting daily food quantities into kilocalories. The proportion of populationwhose daily calorie intake falls below 2100 calories are considered calorie deficient. The secondmeasure of food security looks at per capita protein intake from different food sources. Proteindeficiency rate refers to the percentage of population whose daily intake of protein is less than 50grams. Finally, household dietary diversity is based on food consumption score (FCS). It looks atthe count of various food groups consumed by the household. The food groups include staples,pulses, vegetables, fruit, meat/fish, milk/dairy, sugar, and oil/fat. Poor dietary diversity (alsoknown as borderline and poor food consumption) shows the percentage of population whosescores are equal to or less than 42. Each of these measures provides different dimensions of foodinsecurity and different insights into potential policy responses.
6
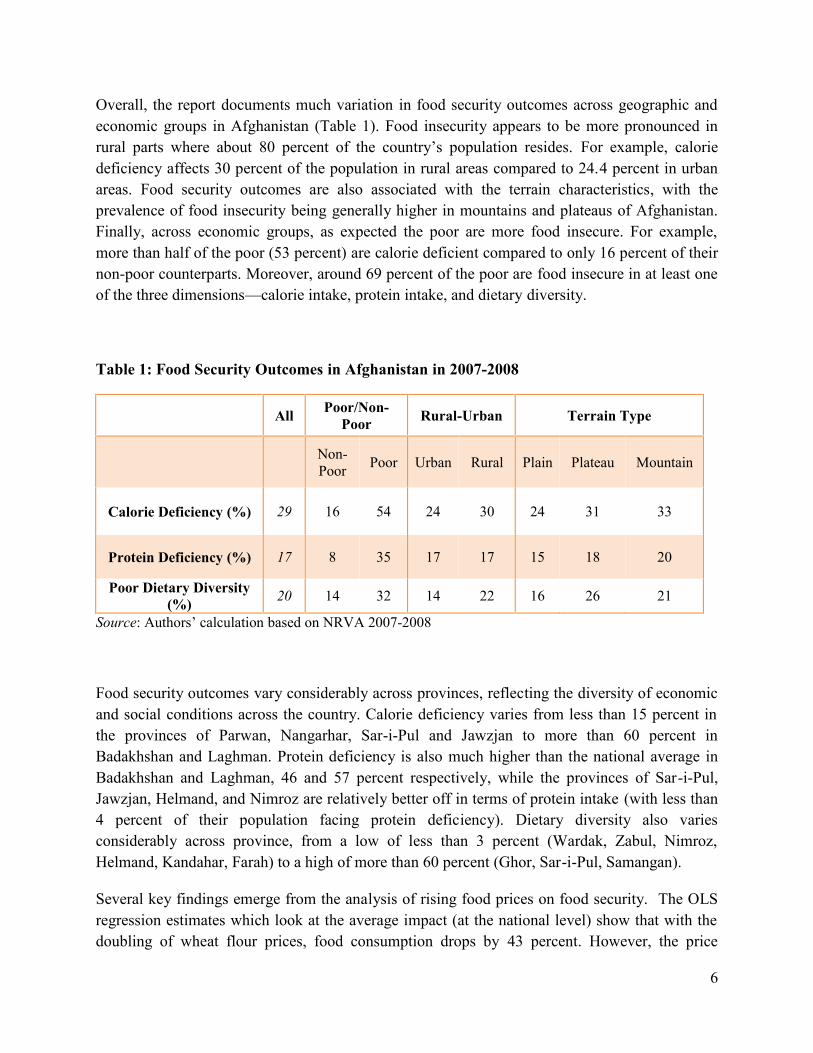
Overall, the report documents much variation in food security outcomes across geographic andeconomic groups in Afghanistan (Table 1). Food insecurity appears to be more pronounced inrural parts where about 80 percent of the country’s population resides. For example, caloriedeficiency affects 30 percent of the population in rural areas compared to 24.4 percent in urbanareas. Food security outcomes are also associated with the terrain characteristics, with theprevalence of food insecurity being generally higher in mountains and plateaus of Afghanistan.Finally, across economic groups, as expected the poor are more food insecure. For example,more than half of the poor (53 percent) are calorie deficient compared to only 16 percent of theirnon-poor counterparts. Moreover, around 69 percent of the poor are food insecure in at least oneof the three dimensions—calorie intake, protein intake, and dietary diversity.
Table 1: Food Security Outcomes in Afghanistan in 2007-2008
All Poor/Non-Poor Rural-Urban Terrain Type
Non-Poor Poor Urban Rural Plain Plateau Mountain
Calorie Deficiency (%) 29 16 54 24 30 24 31 33
Protein Deficiency (%) 17 8 35 17 17 15 18 20
Poor Dietary Diversity(%) 20 14 32 14 22 16 26 21
Source: Authors’ calculation based on NRVA 2007-2008
Food security outcomes vary considerably across provinces, reflecting the diversity of economicand social conditions across the country. Calorie deficiency varies from less than 15 percent inthe provinces of Parwan, Nangarhar, Sar-i-Pul and Jawzjan to more than 60 percent inBadakhshan and Laghman. Protein deficiency is also much higher than the national average inBadakhshan and Laghman, 46 and 57 percent respectively, while the provinces of Sar-i-Pul,Jawzjan, Helmand, and Nimroz are relatively better off in terms of protein intake (with less than4 percent of their population facing protein deficiency). Dietary diversity also variesconsiderably across province, from a low of less than 3 percent (Wardak, Zabul, Nimroz,Helmand, Kandahar, Farah) to a high of more than 60 percent (Ghor, Sar-i-Pul, Samangan).
Several key findings emerge from the analysis of rising food prices on food security. The OLSregression estimates which look at the average impact (at the national level) show that with thedoubling of wheat flour prices, food consumption drops by 43 percent. However, the price
7
responsive is smaller for calorie intake (18%) and dietary diversity (19%). This suggests thathouseholds in Afghanistan trade-off quality for quantity of calories consumed. As additionalevidence of this trade-off, the regression estimates show that the price increases are associatedwith changes in the composition of food consumption, namely decreases in dietary diversity anda movement towards the consumption of cheaper, staple foods.
Further analysis shows that there are large differences in the behavioral response of householdsto rising wheat flour price, depending on their relative food security status. Better-off households(those on the 75th percentile of the distribution of real food consumption) experience the largestpercentage declines in real food consumption for a given increase in wheat flour prices—overtwice as large as those at the 25th percentile (poor households). Similarly, the better off in termsof caloric intake experience larger percentage declines in caloric intake for a given increase inwheat flour prices. Households at the bottom of the caloric intake distribution experiencerelatively little decline in their intake due to rising prices. Such households live near subsistencelevels and are forced to make adjustments to the quality of their diets in order to maintain theirenergy levels. Therefore, these poor households (at the 25th percentile of the dietary diversity)make the largest changes to the quality of their diets—their reduction is more than 50 percentlarger than those at the higher end.
The findings have several implications for policy. First, given large differences in food securityoutcomes at the sub-national level (for example, across provinces), better targeting is crucial toincrease the effectiveness of food security programs. For example, provinces that are poor inoverall terms may not be equally poor in terms of calorie intake and the diversity of diet. In fact,many provinces that perform well on calorie intake (for example, Ghor and Sar-i-Pul) are worse-off in terms of dietary diversity. Similarly, provinces that do not produce surplus grain may notnecessarily be calorie deficient. For example, Daikuni, Nuristan, and Bamyan are in factexperiencing lower levels of calorie deficiency (less than 30 percent) compared to Ghazni,Balkh, Laghman and Badadshan where the calorie deficiency rate is in excess of 50 percent. Thissort of province-specific detail can provide input to discussions on the placement of grain silos,as well as help inform the development of grain dissemination strategies in times of need. Moregenerally, the large and sometimes divergent food security outcomes at the provincial levelunderscore both the complexity of, and need for, better targeting that is required to inform policychoices.
Second, the empirical evidence highlights that if policy makers focus exclusively on adverseeffects on caloric intake in the event of a price shock, they miss an important part of the bigpicture. While poorer households do cut back somewhat on calories, they absorb much more ofthe shock by reducing dietary quality, for example, by reducing the consumption of meat.Therefore, the government’s on-going efforts to ensure adequate supply of staple foods duringthe time of crisis can only address part of the challenge. The high degree of micro-nutrientdeficiency among children in general and high potential for this problem to compound during
8
times of food crisis (through decreased diet quality of the poor) suggest that complementaryefforts are also equally crucial to address micro-nutrient deficiency (such as through thefortification of staples and vitamin distributions). To this end, devising new initiatives as well asincreasing the outreach and targeting in existing programs (for example, WFP’s micro-nutrientenriched food for children and wheat flour fortification initiative) would help secure better foodsecurity outcomes. For example, increased efforts are needed to boost the uptake of fortifiedwheat flour in rural areas where the poor diet is affecting a much larger proportion of thepopulation. At present, the consumption of fortified wheat is estimated to be mainly concentratedin urban regions.
Finally, given that poor nutrition and food insecurity affects a sizeable proportion of Afghanpopulation year-round but more so during bad times (e.g. lean months of spring season or duringfood price shocks), there is genuine need for a scaled-up and well-targeted safety nets program inAfghanistan. Currently, the government is implementing a few state sponsored safety netsprograms but they have limited outreach. Other initiatives such as conditional in-kind and cashtransfers to the vulnerable groups under the WFP led programs are implemented as part of reliefand recovery efforts and have varying degrees of outreach and effectiveness. Lessons can belearned from these experiences to devise a comprehensive safety nets program that is welltargeted, reliable and sufficient in scale.
9
I. INTRODUCTION
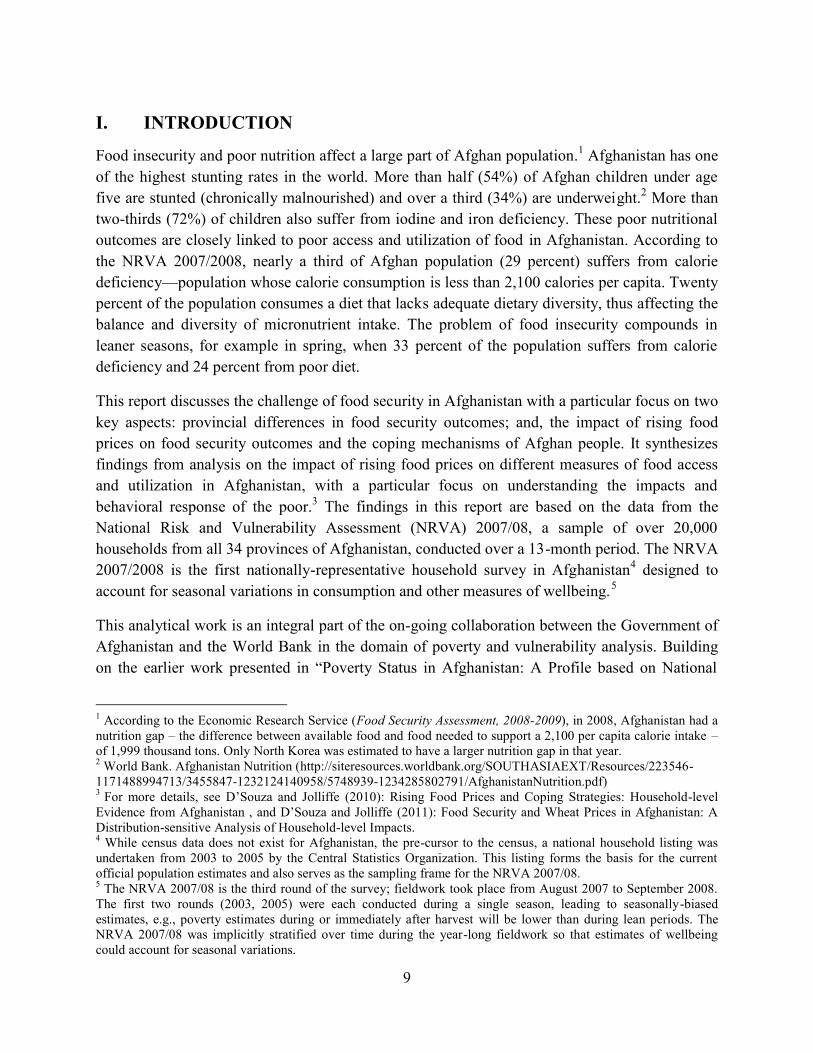
Food insecurity and poor nutrition affect a large part of Afghan population.1 Afghanistan has oneof the highest stunting rates in the world. More than half (54%) of Afghan children under agefive are stunted (chronically malnourished) and over a third (34%) are underweight.2 More thantwo-thirds (72%) of children also suffer from iodine and iron deficiency. These poor nutritionaloutcomes are closely linked to poor access and utilization of food in Afghanistan. According tothe NRVA 2007/2008, nearly a third of Afghan population (29 percent) suffers from caloriedeficiency—population whose calorie consumption is less than 2,100 calories per capita. Twentypercent of the population consumes a diet that lacks adequate dietary diversity, thus affecting thebalance and diversity of micronutrient intake. The problem of food insecurity compounds inleaner seasons, for example in spring, when 33 percent of the population suffers from caloriedeficiency and 24 percent from poor diet.
This report discusses the challenge of food security in Afghanistan with a particular focus on twokey aspects: provincial differences in food security outcomes; and, the impact of rising foodprices on food security outcomes and the coping mechanisms of Afghan people. It synthesizesfindings from analysis on the impact of rising food prices on different measures of food accessand utilization in Afghanistan, with a particular focus on understanding the impacts andbehavioral response of the poor.3 The findings in this report are based on the data from theNational Risk and Vulnerability Assessment (NRVA) 2007/08, a sample of over 20,000households from all 34 provinces of Afghanistan, conducted over a 13-month period. The NRVA2007/2008 is the first nationally-representative household survey in Afghanistan4 designed toaccount for seasonal variations in consumption and other measures of wellbeing.5
This analytical work is an integral part of the on-going collaboration between the Government ofAfghanistan and the World Bank in the domain of poverty and vulnerability analysis. Buildingon the earlier work presented in “Poverty Status in Afghanistan: A Profile based on National
1 According to the Economic Research Service (Food Security Assessment, 2008-2009), in 2008, Afghanistan had anutrition gap – the difference between available food and food needed to support a 2,100 per capita calorie intake –of 1,999 thousand tons. Only North Korea was estimated to have a larger nutrition gap in that year.2 World Bank. Afghanistan Nutrition (http://siteresources.worldbank.org/SOUTHASIAEXT/Resources/223546-1171488994713/3455847-1232124140958/5748939-1234285802791/AfghanistanNutrition.pdf)3 For more details, see D’Souza and Jolliffe (2010): Rising Food Prices and Coping Strategies: Household-levelEvidence from Afghanistan , and D’Souza and Jolliffe (2011): Food Security and Wheat Prices in Afghanistan: ADistribution-sensitive Analysis of Household-level Impacts.4 While census data does not exist for Afghanistan, the pre-cursor to the census, a national household listing wasundertaken from 2003 to 2005 by the Central Statistics Organization. This listing forms the basis for the currentofficial population estimates and also serves as the sampling frame for the NRVA 2007/08.5 The NRVA 2007/08 is the third round of the survey; fieldwork took place from August 2007 to September 2008.The first two rounds (2003, 2005) were each conducted during a single season, leading to seasonally-biasedestimates, e.g., poverty estimates during or immediately after harvest will be lower than during lean periods. TheNRVA 2007/08 was implicitly stratified over time during the year-long fieldwork so that estimates of wellbeingcould account for seasonal variations.
10
Risk and Vulnerability Assessment (NRVA 2007/08)” and in the companion piece on sub-national development statistics—“Afghanistan Provincial Briefs”, this reports aims to further theunderstanding of household wellbeing and vulnerability in Afghanistan from the perspective offood security. The report notes high levels of provincial variation in food security outcomes,which for the most part, go hand in hand with poverty. It also shows that rising food prices havehad a significant and adverse impact on the food security and vulnerability of households inAfghanistan, with both short term and long term implications for the wellbeing of households.
The document is organized into four main sections. The first section introduces Afghanistan’sdevelopment context followed by a description of the food security measures. The second sectionpresents a profile of food security in Afghanistan, with a special focus on mapping provincialvariations in the outcomes. The third part presents key findings of the two empirical papers witha view to give quantitative estimates of the impact of rising food prices on the various measuresof food security. It also provides the evidence of differing impact of rising food prices ondifferent population groups and on their coping responses. The final section summarizes keypolicy messages that emerge from the discussions presented in the main report.
AFGHANISTAN: DEVELOPMENT AND FOOD SECURITY CONTEXT
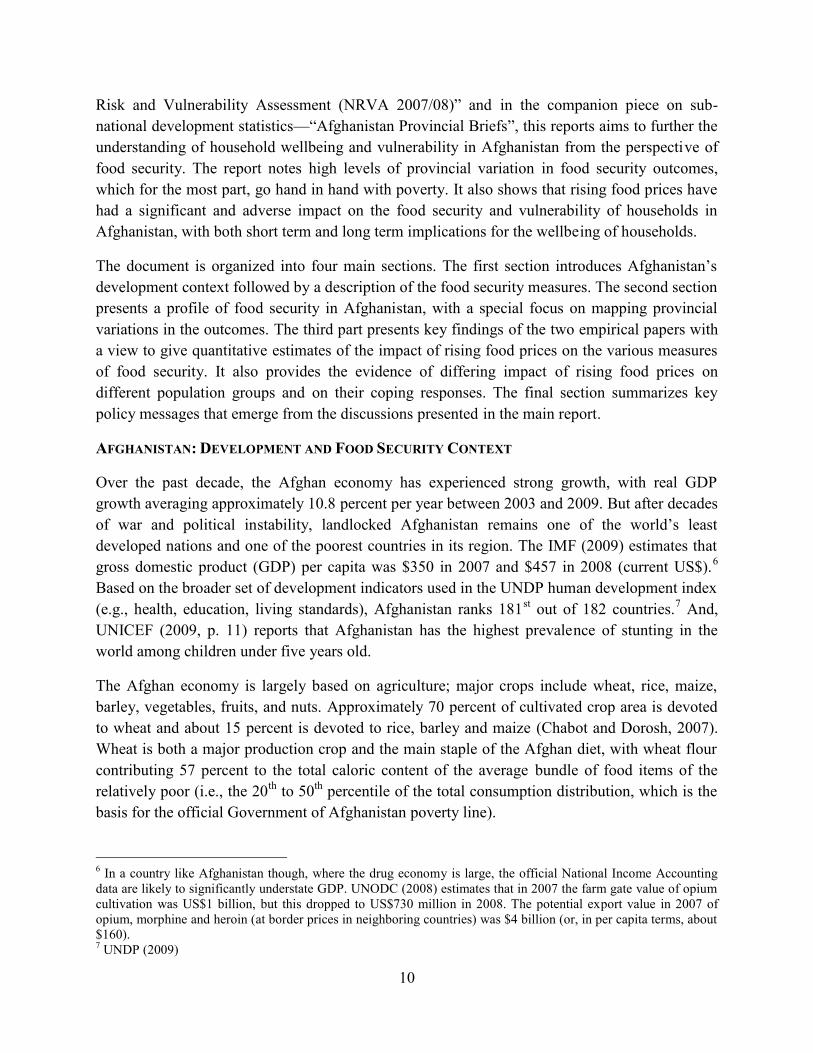
Over the past decade, the Afghan economy has experienced strong growth, with real GDPgrowth averaging approximately 10.8 percent per year between 2003 and 2009. But after decadesof war and political instability, landlocked Afghanistan remains one of the world’s leastdeveloped nations and one of the poorest countries in its region. The IMF (2009) estimates thatgross domestic product (GDP) per capita was $350 in 2007 and $457 in 2008 (current US$).6
Based on the broader set of development indicators used in the UNDP human development index(e.g., health, education, living standards), Afghanistan ranks 181st out of 182 countries.7 And,UNICEF (2009, p. 11) reports that Afghanistan has the highest prevalence of stunting in theworld among children under five years old.
The Afghan economy is largely based on agriculture; major crops include wheat, rice, maize,barley, vegetables, fruits, and nuts. Approximately 70 percent of cultivated crop area is devotedto wheat and about 15 percent is devoted to rice, barley and maize (Chabot and Dorosh, 2007).Wheat is both a major production crop and the main staple of the Afghan diet, with wheat flourcontributing 57 percent to the total caloric content of the average bundle of food items of therelatively poor (i.e., the 20th to 50th percentile of the total consumption distribution, which is thebasis for the official Government of Afghanistan poverty line).
6 In a country like Afghanistan though, where the drug economy is large, the official National Income Accountingdata are likely to significantly understate GDP. UNODC (2008) estimates that in 2007 the farm gate value of opiumcultivation was US$1 billion, but this dropped to US$730 million in 2008. The potential export value in 2007 ofopium, morphine and heroin (at border prices in neighboring countries) was $4 billion (or, in per capita terms, about$160).7 UNDP (2009)
11
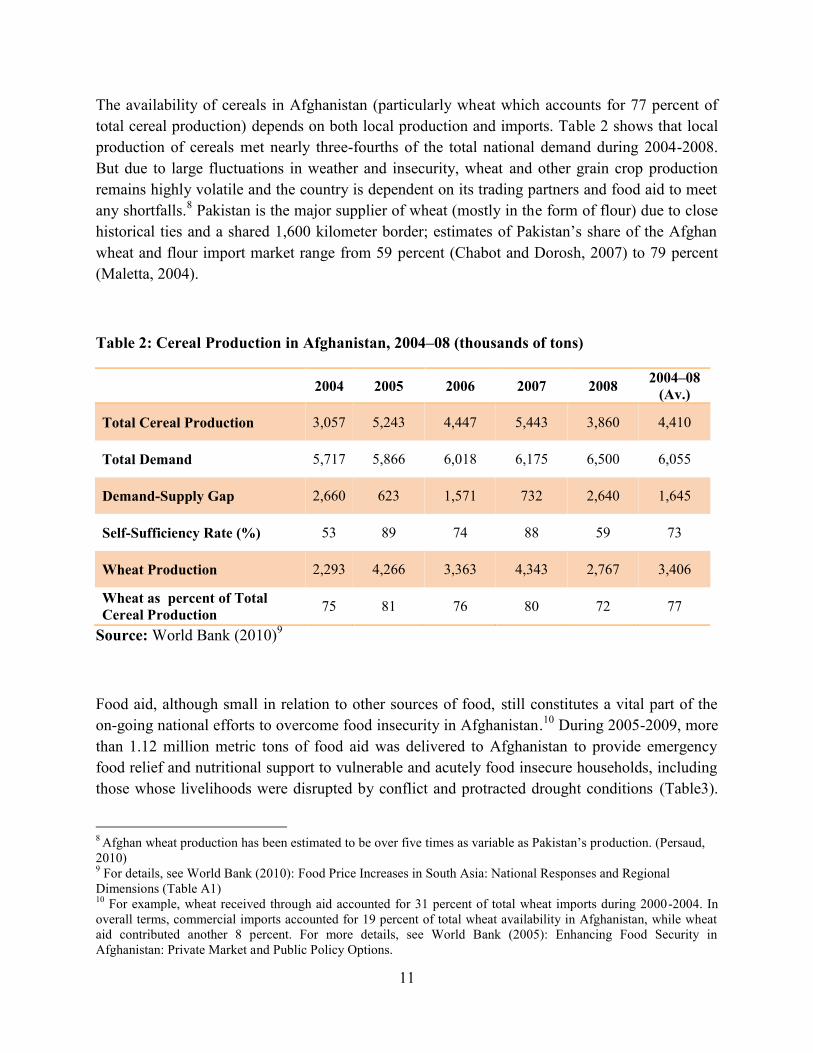
The availability of cereals in Afghanistan (particularly wheat which accounts for 77 percent oftotal cereal production) depends on both local production and imports. Table 2 shows that localproduction of cereals met nearly three-fourths of the total national demand during 2004-2008.But due to large fluctuations in weather and insecurity, wheat and other grain crop productionremains highly volatile and the country is dependent on its trading partners and food aid to meetany shortfalls.8 Pakistan is the major supplier of wheat (mostly in the form of flour) due to closehistorical ties and a shared 1,600 kilometer border; estimates of Pakistan’s share of the Afghanwheat and flour import market range from 59 percent (Chabot and Dorosh, 2007) to 79 percent(Maletta, 2004).
Table 2: Cereal Production in Afghanistan, 2004–08 (thousands of tons)
2004 2005 2006 2007 2008 2004–08(Av.)
Total Cereal Production 3,057 5,243 4,447 5,443 3,860 4,410
Total Demand 5,717 5,866 6,018 6,175 6,500 6,055
Demand-Supply Gap 2,660 623 1,571 732 2,640 1,645
Self-Sufficiency Rate (%) 53 89 74 88 59 73
Wheat Production 2,293 4,266 3,363 4,343 2,767 3,406
Wheat as percent of TotalCereal Production 75 81 76 80 72 77
Source: World Bank (2010)9
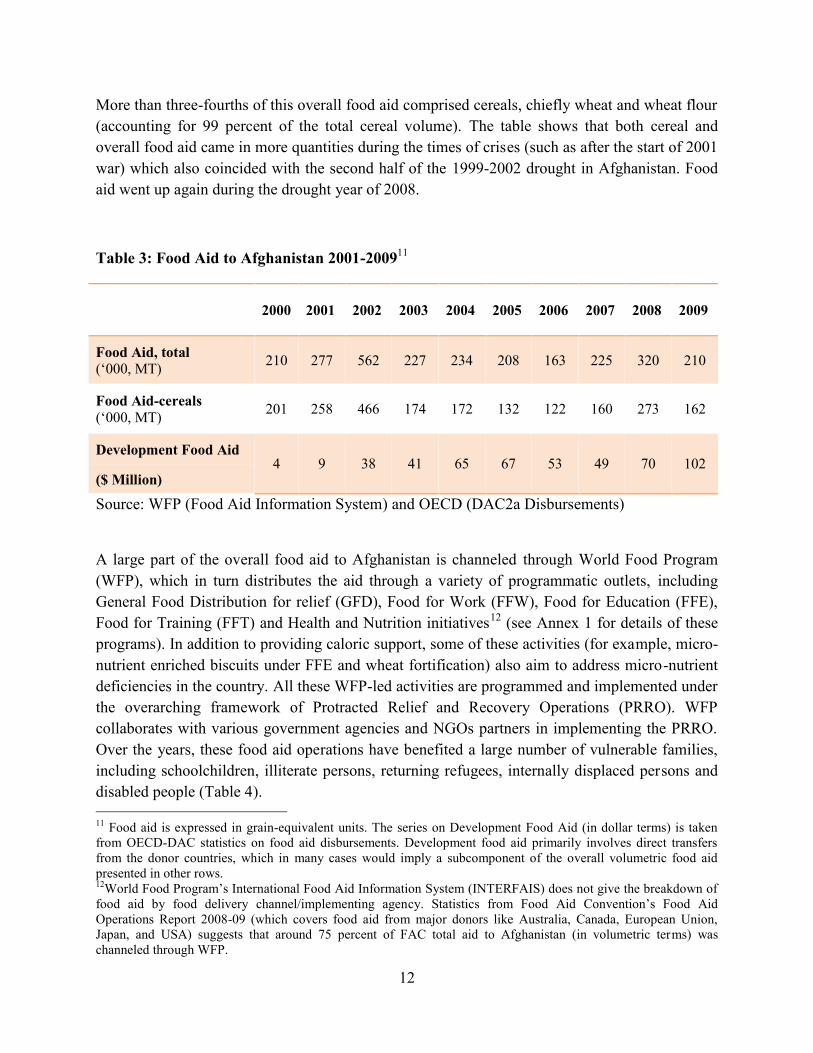
Food aid, although small in relation to other sources of food, still constitutes a vital part of theon-going national efforts to overcome food insecurity in Afghanistan.10 During 2005-2009, morethan 1.12 million metric tons of food aid was delivered to Afghanistan to provide emergencyfood relief and nutritional support to vulnerable and acutely food insecure households, includingthose whose livelihoods were disrupted by conflict and protracted drought conditions (Table3).
8 Afghan wheat production has been estimated to be over five times as variable as Pakistan’s production. (Persaud,2010)9 For details, see World Bank (2010): Food Price Increases in South Asia: National Responses and RegionalDimensions (Table A1)10 For example, wheat received through aid accounted for 31 percent of total wheat imports during 2000-2004. Inoverall terms, commercial imports accounted for 19 percent of total wheat availability in Afghanistan, while wheataid contributed another 8 percent. For more details, see World Bank (2005): Enhancing Food Security inAfghanistan: Private Market and Public Policy Options.
12
More than three-fourths of this overall food aid comprised cereals, chiefly wheat and wheat flour(accounting for 99 percent of the total cereal volume). The table shows that both cereal andoverall food aid came in more quantities during the times of crises (such as after the start of 2001war) which also coincided with the second half of the 1999-2002 drought in Afghanistan. Foodaid went up again during the drought year of 2008.
Table 3: Food Aid to Afghanistan 2001-200911
2000 2001 2002 2003 2004 2005 2006 2007 2008 2009
Food Aid, total(‘000, MT) 210 277 562 227 234 208 163 225 320 210
Food Aid-cereals(‘000, MT) 201 258 466 174 172 132 122 160 273 162
Development Food Aid4 9 38 41 65 67 53 49 70 102
($ Million)
Source: WFP (Food Aid Information System) and OECD (DAC2a Disbursements)
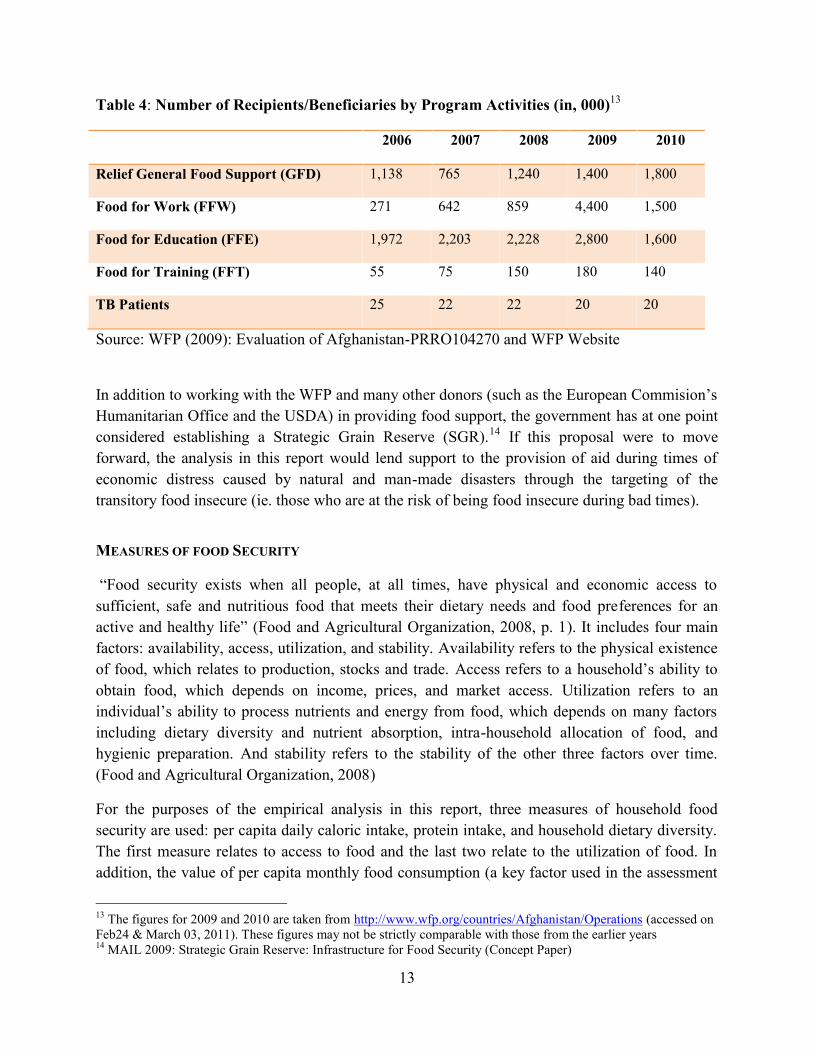
A large part of the overall food aid to Afghanistan is channeled through World Food Program(WFP), which in turn distributes the aid through a variety of programmatic outlets, includingGeneral Food Distribution for relief (GFD), Food for Work (FFW), Food for Education (FFE),Food for Training (FFT) and Health and Nutrition initiatives12 (see Annex 1 for details of theseprograms). In addition to providing caloric support, some of these activities (for example, micro-nutrient enriched biscuits under FFE and wheat fortification) also aim to address micro-nutrientdeficiencies in the country. All these WFP-led activities are programmed and implemented underthe overarching framework of Protracted Relief and Recovery Operations (PRRO). WFPcollaborates with various government agencies and NGOs partners in implementing the PRRO.Over the years, these food aid operations have benefited a large number of vulnerable families,including schoolchildren, illiterate persons, returning refugees, internally displaced persons anddisabled people (Table 4).
11 Food aid is expressed in grain-equivalent units. The series on Development Food Aid (in dollar terms) is takenfrom OECD-DAC statistics on food aid disbursements. Development food aid primarily involves direct transfersfrom the donor countries, which in many cases would imply a subcomponent of the overall volumetric food aidpresented in other rows.12World Food Program’s International Food Aid Information System (INTERFAIS) does not give the breakdown offood aid by food delivery channel/implementing agency. Statistics from Food Aid Convention’s Food AidOperations Report 2008-09 (which covers food aid from major donors like Australia, Canada, European Union,Japan, and USA) suggests that around 75 percent of FAC total aid to Afghanistan (in volumetric terms) waschanneled through WFP.
13
Table 4: Number of Recipients/Beneficiaries by Program Activities (in, 000)13
2006 2007 2008 2009 2010
Relief General Food Support (GFD) 1,138 765 1,240 1,400 1,800
Food for Work (FFW) 271 642 859 4,400 1,500
Food for Education (FFE) 1,972 2,203 2,228 2,800 1,600
Food for Training (FFT) 55 75 150 180 140
TB Patients 25 22 22 20 20
Source: WFP (2009): Evaluation of Afghanistan-PRRO104270 and WFP Website
In addition to working with the WFP and many other donors (such as the European Commision’sHumanitarian Office and the USDA) in providing food support, the government has at one pointconsidered establishing a Strategic Grain Reserve (SGR).14 If this proposal were to moveforward, the analysis in this report would lend support to the provision of aid during times ofeconomic distress caused by natural and man-made disasters through the targeting of thetransitory food insecure (ie. those who are at the risk of being food insecure during bad times).
MEASURES OF FOOD SECURITY
“Food security exists when all people, at all times, have physical and economic access tosufficient, safe and nutritious food that meets their dietary needs and food preferences for anactive and healthy life” (Food and Agricultural Organization, 2008, p. 1). It includes four mainfactors: availability, access, utilization, and stability. Availability refers to the physical existenceof food, which relates to production, stocks and trade. Access refers to a household’s ability toobtain food, which depends on income, prices, and market access. Utilization refers to anindividual’s ability to process nutrients and energy from food, which depends on many factorsincluding dietary diversity and nutrient absorption, intra-household allocation of food, andhygienic preparation. And stability refers to the stability of the other three factors over time.(Food and Agricultural Organization, 2008)
For the purposes of the empirical analysis in this report, three measures of household foodsecurity are used: per capita daily caloric intake, protein intake, and household dietary diversity.The first measure relates to access to food and the last two relate to the utilization of food. Inaddition, the value of per capita monthly food consumption (a key factor used in the assessment
13 The figures for 2009 and 2010 are taken from http://www.wfp.org/countries/Afghanistan/Operations (accessed onFeb24 & March 03, 2011). These figures may not be strictly comparable with those from the earlier years14 MAIL 2009: Strategic Grain Reserve: Infrastructure for Food Security (Concept Paper)
14
of poverty) is also used as an indicator of food security in analyzing the impact of rising foodprices. This additional measure—a core component of poverty measurement—is used tostrengthen the analysis of food security.
The first measure, calorie deficiency rate, is calculated by taking the proportion of populationwhose daily calorie intake falls below 2100 calories. In calculating daily calorie intake, the FAOFood Composition Tables for the Near East have been used to convert daily food quantities intokilocalories that are then divide by the effective household size to get per capita daily caloricintake (in kilocalories).15 The effective number of household members incorporates guests eatingmeals within the home.16
There is evidence though that caloric intake is not a sufficient indicator of nutritional status (e.g.Deaton & Dreze, 2009), so we examine the other indicators, namely protein deficiency, dietarydiversity, and overall food consumption. Protein deficiency rate is an important measure ofquality of food intake. It refers to the percentage of population whose daily consumption ofprotein (from different food sources) is less than 50 grams. For the empirical analysis, proteinintake is calculated by dividing weekly total household protein intake (from both animal andvegetable sources) by seven days and by the effective household size.
To measure household dietary diversity, the report uses food consumption score (FCS)developed by the World Food Programme (WFP). The dietary diversity is a weighted sum of thefrequencies with which households consume foods within eight food groups over the previousweek.17 The food groups include staples, pulses, vegetables, fruit, meat/fish, milk/dairy, sugar,and oil/fat. Higher scores denote a more varied diet and are suggestive of a higher quality dietwith potential for higher micronutrient intake. Poor dietary diversity (also known as borderlineand poor food consumption) shows the percentage of population whose food consumption scoresare equal to or less than 42.
Finally, the value of monthly food consumption is used as an additional measure of foodsecurity. This measure is constructed by adding the value of food items purchased from marketas well as those produced and consumed at home. 18 Since not all food items were available in alldistrict markets at all times of the year, missing prices were imputed first, which were then used
15 Spices, water, and ‘other’ foods do not contribute to total calories. USDA sources were used for a few items thatwere not available in the FAO tables.16 Some studies use household size to calculate per capita amounts. In Afghanistan the custom of sharing meals withguests makes it important to account for guests eating meals from the household cooking pot. The effectivehousehold size also incorporates information on household members eating outside the home. Other studies useequivalency scales to account for differences in consumption of adults and children when calculating measures ofwellbeing. We opt to include variables for household composition directly into the regression model in order tocontrol for such differences.17 Weights for the food groups range from 0.5 to 4 based on nutrient density. Condiments receive zero nutritionalweight. Frequencies are truncated at 7 for each food group. The measure ranges from 0 to 112.18 Households are asked for the quantity of foods consumed over the past seven days; these quantities are multipliedby 4.2 to get monthly values.
15
to value those items that households may have been producing at home, as well as goods thathouseholds may have obtained from more distant markets.19 The value of expenditure on foodaway from home is included in the calculation of the value of food consumption. 20 Finally,nominal values were converted to real values using a consumer food price index.21
II. PROFILE OF FOOD SECURITY
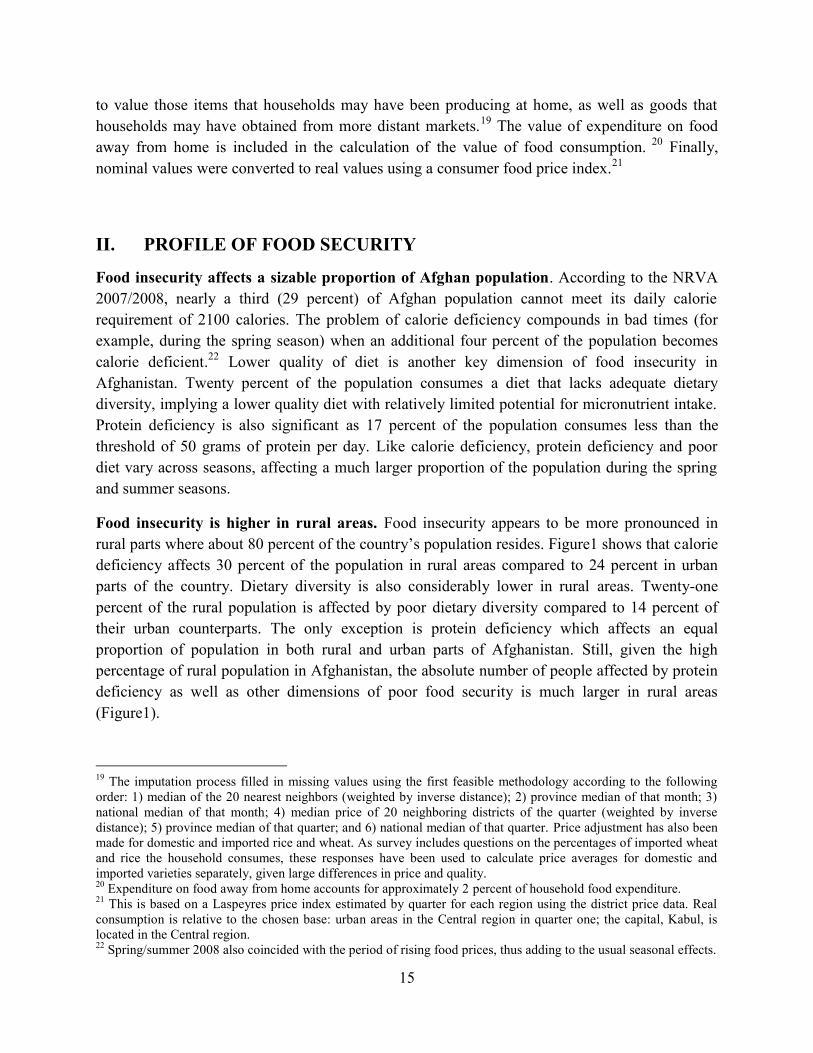
Food insecurity affects a sizable proportion of Afghan population. According to the NRVA2007/2008, nearly a third (29 percent) of Afghan population cannot meet its daily calorierequirement of 2100 calories. The problem of calorie deficiency compounds in bad times (forexample, during the spring season) when an additional four percent of the population becomescalorie deficient.22 Lower quality of diet is another key dimension of food insecurity inAfghanistan. Twenty percent of the population consumes a diet that lacks adequate dietarydiversity, implying a lower quality diet with relatively limited potential for micronutrient intake.Protein deficiency is also significant as 17 percent of the population consumes less than thethreshold of 50 grams of protein per day. Like calorie deficiency, protein deficiency and poordiet vary across seasons, affecting a much larger proportion of the population during the springand summer seasons.
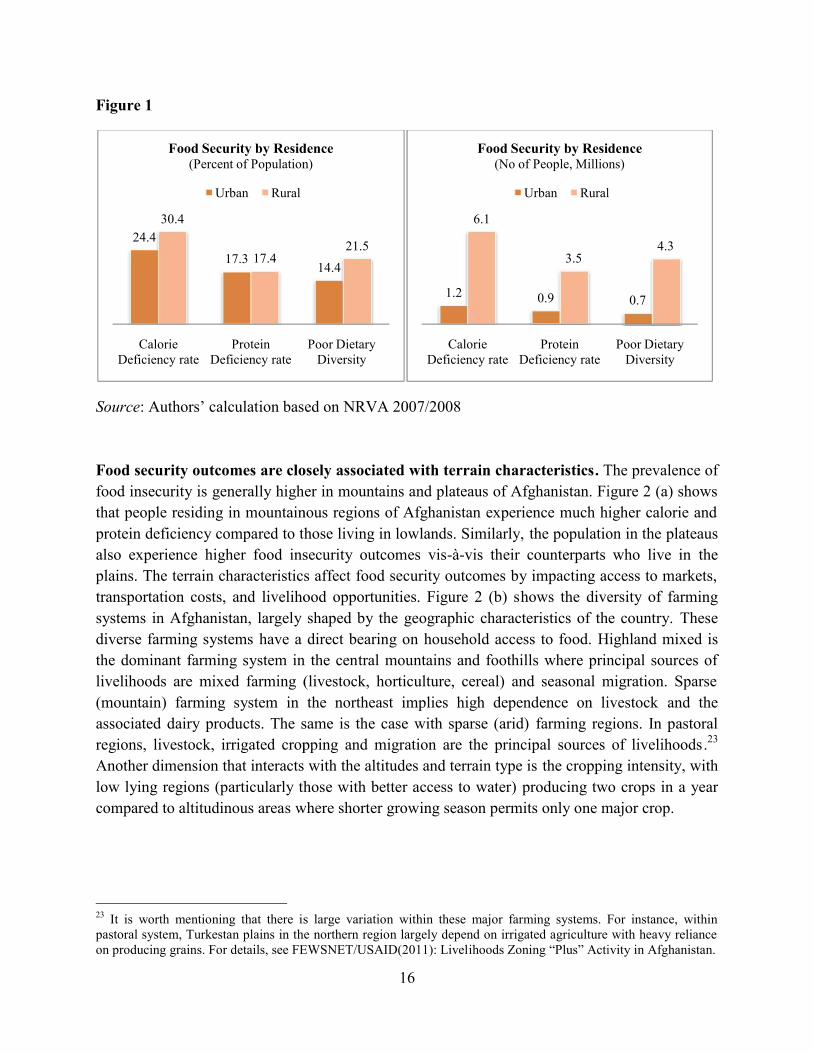
Food insecurity is higher in rural areas. Food insecurity appears to be more pronounced inrural parts where about 80 percent of the country’s population resides. Figure1 shows that caloriedeficiency affects 30 percent of the population in rural areas compared to 24 percent in urbanparts of the country. Dietary diversity is also considerably lower in rural areas. Twenty-onepercent of the rural population is affected by poor dietary diversity compared to 14 percent oftheir urban counterparts. The only exception is protein deficiency which affects an equalproportion of population in both rural and urban parts of Afghanistan. Still, given the highpercentage of rural population in Afghanistan, the absolute number of people affected by proteindeficiency as well as other dimensions of poor food security is much larger in rural areas(Figure1).
19 The imputation process filled in missing values using the first feasible methodology according to the followingorder: 1) median of the 20 nearest neighbors (weighted by inverse distance); 2) province median of that month; 3)national median of that month; 4) median price of 20 neighboring districts of the quarter (weighted by inversedistance); 5) province median of that quarter; and 6) national median of that quarter. Price adjustment has also beenmade for domestic and imported rice and wheat. As survey includes questions on the percentages of imported wheatand rice the household consumes, these responses have been used to calculate price averages for domestic andimported varieties separately, given large differences in price and quality.20 Expenditure on food away from home accounts for approximately 2 percent of household food expenditure.21 This is based on a Laspeyres price index estimated by quarter for each region using the district price data. Realconsumption is relative to the chosen base: urban areas in the Central region in quarter one; the capital, Kabul, islocated in the Central region.22 Spring/summer 2008 also coincided with the period of rising food prices, thus adding to the usual seasonal effects.
16
Figure 1
Source: Authors’ calculation based on NRVA 2007/2008
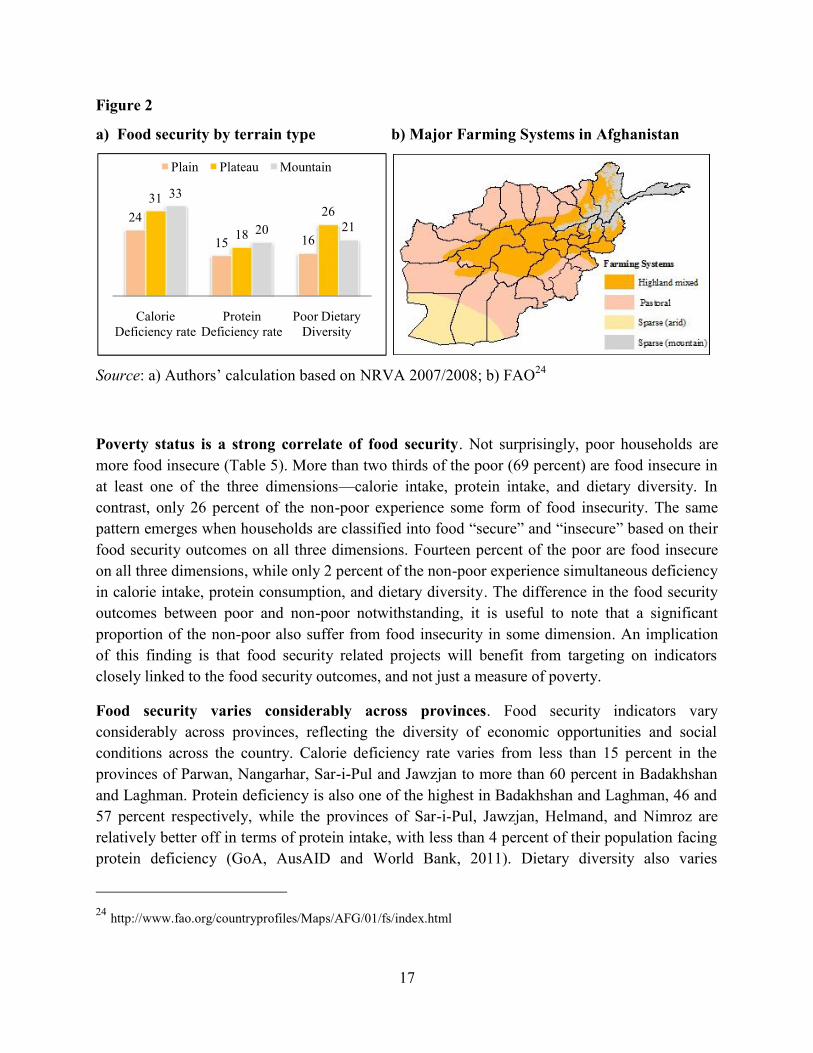
Food security outcomes are closely associated with terrain characteristics. The prevalence offood insecurity is generally higher in mountains and plateaus of Afghanistan. Figure 2 (a) showsthat people residing in mountainous regions of Afghanistan experience much higher calorie andprotein deficiency compared to those living in lowlands. Similarly, the population in the plateausalso experience higher food insecurity outcomes vis-à-vis their counterparts who live in theplains. The terrain characteristics affect food security outcomes by impacting access to markets,transportation costs, and livelihood opportunities. Figure 2 (b) shows the diversity of farmingsystems in Afghanistan, largely shaped by the geographic characteristics of the country. Thesediverse farming systems have a direct bearing on household access to food. Highland mixed isthe dominant farming system in the central mountains and foothills where principal sources oflivelihoods are mixed farming (livestock, horticulture, cereal) and seasonal migration. Sparse(mountain) farming system in the northeast implies high dependence on livestock and theassociated dairy products. The same is the case with sparse (arid) farming regions. In pastoralregions, livestock, irrigated cropping and migration are the principal sources of livelihoods.23
Another dimension that interacts with the altitudes and terrain type is the cropping intensity, withlow lying regions (particularly those with better access to water) producing two crops in a yearcompared to altitudinous areas where shorter growing season permits only one major crop.
23 It is worth mentioning that there is large variation within these major farming systems. For instance, withinpastoral system, Turkestan plains in the northern region largely depend on irrigated agriculture with heavy relianceon producing grains. For details, see FEWSNET/USAID(2011): Livelihoods Zoning “Plus” Activity in Afghanistan.
24.417.3
30.4
17.4
CalorieDeficiency rate
ProteinDeficiency rate
Poor DietaryDiversity
Food Security by Residence(Percent of Population)
Urban Rural
16
Figure 1
Source: Authors’ calculation based on NRVA 2007/2008
Food security outcomes are closely associated with terrain characteristics. The prevalence offood insecurity is generally higher in mountains and plateaus of Afghanistan. Figure 2 (a) showsthat people residing in mountainous regions of Afghanistan experience much higher calorie andprotein deficiency compared to those living in lowlands. Similarly, the population in the plateausalso experience higher food insecurity outcomes vis-à-vis their counterparts who live in theplains. The terrain characteristics affect food security outcomes by impacting access to markets,transportation costs, and livelihood opportunities. Figure 2 (b) shows the diversity of farmingsystems in Afghanistan, largely shaped by the geographic characteristics of the country. Thesediverse farming systems have a direct bearing on household access to food. Highland mixed isthe dominant farming system in the central mountains and foothills where principal sources oflivelihoods are mixed farming (livestock, horticulture, cereal) and seasonal migration. Sparse(mountain) farming system in the northeast implies high dependence on livestock and theassociated dairy products. The same is the case with sparse (arid) farming regions. In pastoralregions, livestock, irrigated cropping and migration are the principal sources of livelihoods.23
Another dimension that interacts with the altitudes and terrain type is the cropping intensity, withlow lying regions (particularly those with better access to water) producing two crops in a yearcompared to altitudinous areas where shorter growing season permits only one major crop.
23 It is worth mentioning that there is large variation within these major farming systems. For instance, withinpastoral system, Turkestan plains in the northern region largely depend on irrigated agriculture with heavy relianceon producing grains. For details, see FEWSNET/USAID(2011): Livelihoods Zoning “Plus” Activity in Afghanistan.
14.421.5
Poor DietaryDiversity
Food Security by Residence(Percent of Population)
Rural
1.2 0.9
6.1
3.5
CalorieDeficiency rate
ProteinDeficiency rate
Poor DietaryDiversity
Food Security by Residence(No of People, Millions)
Urban Rural
16
Figure 1
Source: Authors’ calculation based on NRVA 2007/2008
Food security outcomes are closely associated with terrain characteristics. The prevalence offood insecurity is generally higher in mountains and plateaus of Afghanistan. Figure 2 (a) showsthat people residing in mountainous regions of Afghanistan experience much higher calorie andprotein deficiency compared to those living in lowlands. Similarly, the population in the plateausalso experience higher food insecurity outcomes vis-à-vis their counterparts who live in theplains. The terrain characteristics affect food security outcomes by impacting access to markets,transportation costs, and livelihood opportunities. Figure 2 (b) shows the diversity of farmingsystems in Afghanistan, largely shaped by the geographic characteristics of the country. Thesediverse farming systems have a direct bearing on household access to food. Highland mixed isthe dominant farming system in the central mountains and foothills where principal sources oflivelihoods are mixed farming (livestock, horticulture, cereal) and seasonal migration. Sparse(mountain) farming system in the northeast implies high dependence on livestock and theassociated dairy products. The same is the case with sparse (arid) farming regions. In pastoralregions, livestock, irrigated cropping and migration are the principal sources of livelihoods.23
Another dimension that interacts with the altitudes and terrain type is the cropping intensity, withlow lying regions (particularly those with better access to water) producing two crops in a yearcompared to altitudinous areas where shorter growing season permits only one major crop.
23 It is worth mentioning that there is large variation within these major farming systems. For instance, withinpastoral system, Turkestan plains in the northern region largely depend on irrigated agriculture with heavy relianceon producing grains. For details, see FEWSNET/USAID(2011): Livelihoods Zoning “Plus” Activity in Afghanistan.
0.7
4.3
Poor DietaryDiversity
Food Security by Residence(No of People, Millions)
Rural
17
Figure 2
a) Food security by terrain type b) Major Farming Systems in Afghanistan
Source: a) Authors’ calculation based on NRVA 2007/2008; b) FAO24
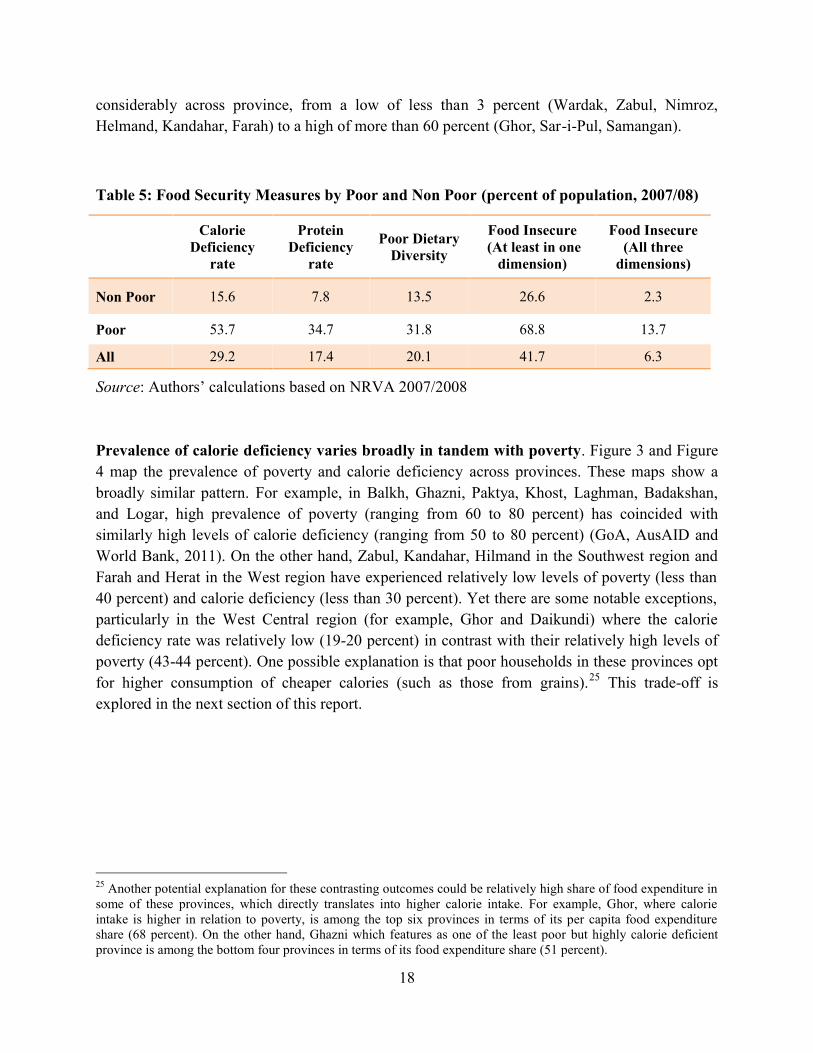
Poverty status is a strong correlate of food security. Not surprisingly, poor households aremore food insecure (Table 5). More than two thirds of the poor (69 percent) are food insecure inat least one of the three dimensions—calorie intake, protein intake, and dietary diversity. Incontrast, only 26 percent of the non-poor experience some form of food insecurity. The samepattern emerges when households are classified into food “secure” and “insecure” based on theirfood security outcomes on all three dimensions. Fourteen percent of the poor are food insecureon all three dimensions, while only 2 percent of the non-poor experience simultaneous deficiencyin calorie intake, protein consumption, and dietary diversity. The difference in the food securityoutcomes between poor and non-poor notwithstanding, it is useful to note that a significantproportion of the non-poor also suffer from food insecurity in some dimension. An implicationof this finding is that food security related projects will benefit from targeting on indicatorsclosely linked to the food security outcomes, and not just a measure of poverty.
Food security varies considerably across provinces. Food security indicators varyconsiderably across provinces, reflecting the diversity of economic opportunities and socialconditions across the country. Calorie deficiency rate varies from less than 15 percent in theprovinces of Parwan, Nangarhar, Sar-i-Pul and Jawzjan to more than 60 percent in Badakhshanand Laghman. Protein deficiency is also one of the highest in Badakhshan and Laghman, 46 and57 percent respectively, while the provinces of Sar-i-Pul, Jawzjan, Helmand, and Nimroz arerelatively better off in terms of protein intake, with less than 4 percent of their population facingprotein deficiency (GoA, AusAID and World Bank, 2011). Dietary diversity also varies
24 http://www.fao.org/countryprofiles/Maps/AFG/01/fs/index.html
24
15 16
31
18
33
20
CalorieDeficiency rate
ProteinDeficiency rate
Poor DietaryDiversity
Plain Plateau Mountain
17
Figure 2
a) Food security by terrain type b) Major Farming Systems in Afghanistan
Source: a) Authors’ calculation based on NRVA 2007/2008; b) FAO24
Poverty status is a strong correlate of food security. Not surprisingly, poor households aremore food insecure (Table 5). More than two thirds of the poor (69 percent) are food insecure inat least one of the three dimensions—calorie intake, protein intake, and dietary diversity. Incontrast, only 26 percent of the non-poor experience some form of food insecurity. The samepattern emerges when households are classified into food “secure” and “insecure” based on theirfood security outcomes on all three dimensions. Fourteen percent of the poor are food insecureon all three dimensions, while only 2 percent of the non-poor experience simultaneous deficiencyin calorie intake, protein consumption, and dietary diversity. The difference in the food securityoutcomes between poor and non-poor notwithstanding, it is useful to note that a significantproportion of the non-poor also suffer from food insecurity in some dimension. An implicationof this finding is that food security related projects will benefit from targeting on indicatorsclosely linked to the food security outcomes, and not just a measure of poverty.
Food security varies considerably across provinces. Food security indicators varyconsiderably across provinces, reflecting the diversity of economic opportunities and socialconditions across the country. Calorie deficiency rate varies from less than 15 percent in theprovinces of Parwan, Nangarhar, Sar-i-Pul and Jawzjan to more than 60 percent in Badakhshanand Laghman. Protein deficiency is also one of the highest in Badakhshan and Laghman, 46 and57 percent respectively, while the provinces of Sar-i-Pul, Jawzjan, Helmand, and Nimroz arerelatively better off in terms of protein intake, with less than 4 percent of their population facingprotein deficiency (GoA, AusAID and World Bank, 2011). Dietary diversity also varies
24 http://www.fao.org/countryprofiles/Maps/AFG/01/fs/index.html
16
2621
Poor DietaryDiversity
Mountain
17
Figure 2
a) Food security by terrain type b) Major Farming Systems in Afghanistan
Source: a) Authors’ calculation based on NRVA 2007/2008; b) FAO24
Poverty status is a strong correlate of food security. Not surprisingly, poor households aremore food insecure (Table 5). More than two thirds of the poor (69 percent) are food insecure inat least one of the three dimensions—calorie intake, protein intake, and dietary diversity. Incontrast, only 26 percent of the non-poor experience some form of food insecurity. The samepattern emerges when households are classified into food “secure” and “insecure” based on theirfood security outcomes on all three dimensions. Fourteen percent of the poor are food insecureon all three dimensions, while only 2 percent of the non-poor experience simultaneous deficiencyin calorie intake, protein consumption, and dietary diversity. The difference in the food securityoutcomes between poor and non-poor notwithstanding, it is useful to note that a significantproportion of the non-poor also suffer from food insecurity in some dimension. An implicationof this finding is that food security related projects will benefit from targeting on indicatorsclosely linked to the food security outcomes, and not just a measure of poverty.
Food security varies considerably across provinces. Food security indicators varyconsiderably across provinces, reflecting the diversity of economic opportunities and socialconditions across the country. Calorie deficiency rate varies from less than 15 percent in theprovinces of Parwan, Nangarhar, Sar-i-Pul and Jawzjan to more than 60 percent in Badakhshanand Laghman. Protein deficiency is also one of the highest in Badakhshan and Laghman, 46 and57 percent respectively, while the provinces of Sar-i-Pul, Jawzjan, Helmand, and Nimroz arerelatively better off in terms of protein intake, with less than 4 percent of their population facingprotein deficiency (GoA, AusAID and World Bank, 2011). Dietary diversity also varies
24 http://www.fao.org/countryprofiles/Maps/AFG/01/fs/index.html
18
considerably across province, from a low of less than 3 percent (Wardak, Zabul, Nimroz,Helmand, Kandahar, Farah) to a high of more than 60 percent (Ghor, Sar-i-Pul, Samangan).
Table 5: Food Security Measures by Poor and Non Poor (percent of population, 2007/08)
CalorieDeficiency
rate
ProteinDeficiency
rate
Poor DietaryDiversity
Food Insecure(At least in one
dimension)
Food Insecure(All three
dimensions)
Non Poor 15.6 7.8 13.5 26.6 2.3
Poor 53.7 34.7 31.8 68.8 13.7
All 29.2 17.4 20.1 41.7 6.3
Source: Authors’ calculations based on NRVA 2007/2008
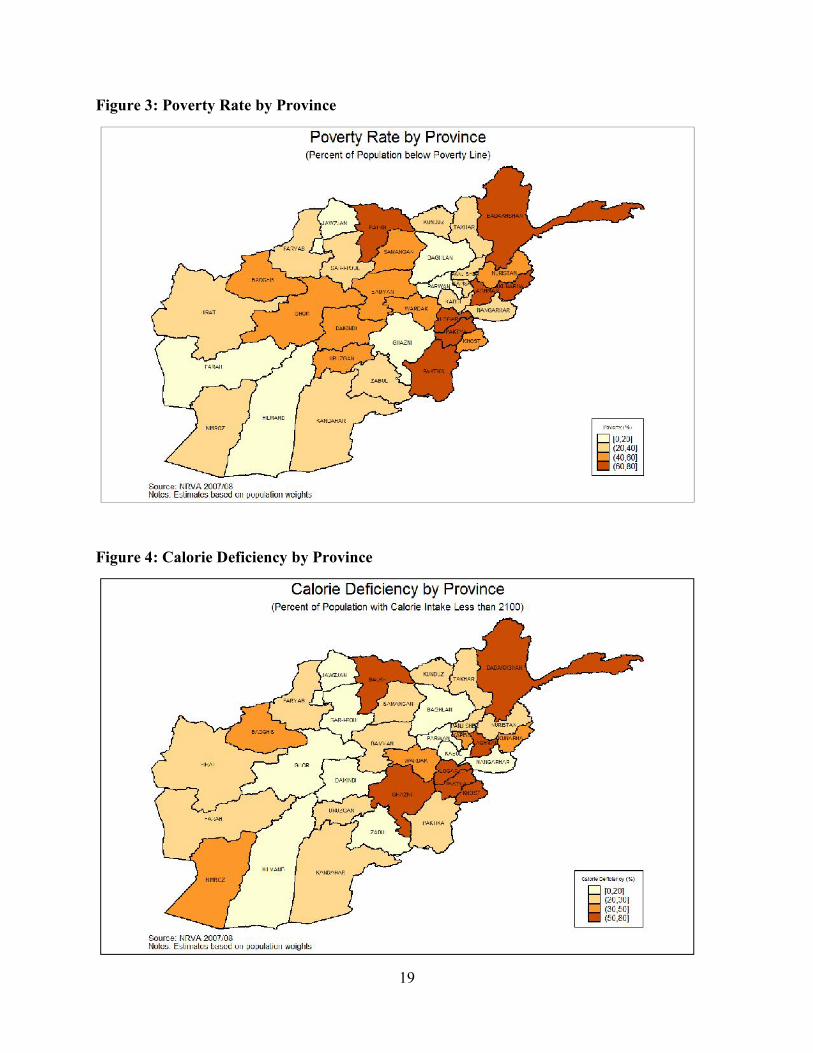
Prevalence of calorie deficiency varies broadly in tandem with poverty. Figure 3 and Figure4 map the prevalence of poverty and calorie deficiency across provinces. These maps show abroadly similar pattern. For example, in Balkh, Ghazni, Paktya, Khost, Laghman, Badakshan,and Logar, high prevalence of poverty (ranging from 60 to 80 percent) has coincided withsimilarly high levels of calorie deficiency (ranging from 50 to 80 percent) (GoA, AusAID andWorld Bank, 2011). On the other hand, Zabul, Kandahar, Hilmand in the Southwest region andFarah and Herat in the West region have experienced relatively low levels of poverty (less than40 percent) and calorie deficiency (less than 30 percent). Yet there are some notable exceptions,particularly in the West Central region (for example, Ghor and Daikundi) where the caloriedeficiency rate was relatively low (19-20 percent) in contrast with their relatively high levels ofpoverty (43-44 percent). One possible explanation is that poor households in these provinces optfor higher consumption of cheaper calories (such as those from grains).25 This trade-off isexplored in the next section of this report.
25 Another potential explanation for these contrasting outcomes could be relatively high share of food expenditure insome of these provinces, which directly translates into higher calorie intake. For example, Ghor, where calorieintake is higher in relation to poverty, is among the top six provinces in terms of its per capita food expenditureshare (68 percent). On the other hand, Ghazni which features as one of the least poor but highly calorie deficientprovince is among the bottom four provinces in terms of its food expenditure share (51 percent).
19
Figure 3: Poverty Rate by Province
Figure 4: Calorie Deficiency by Province
20
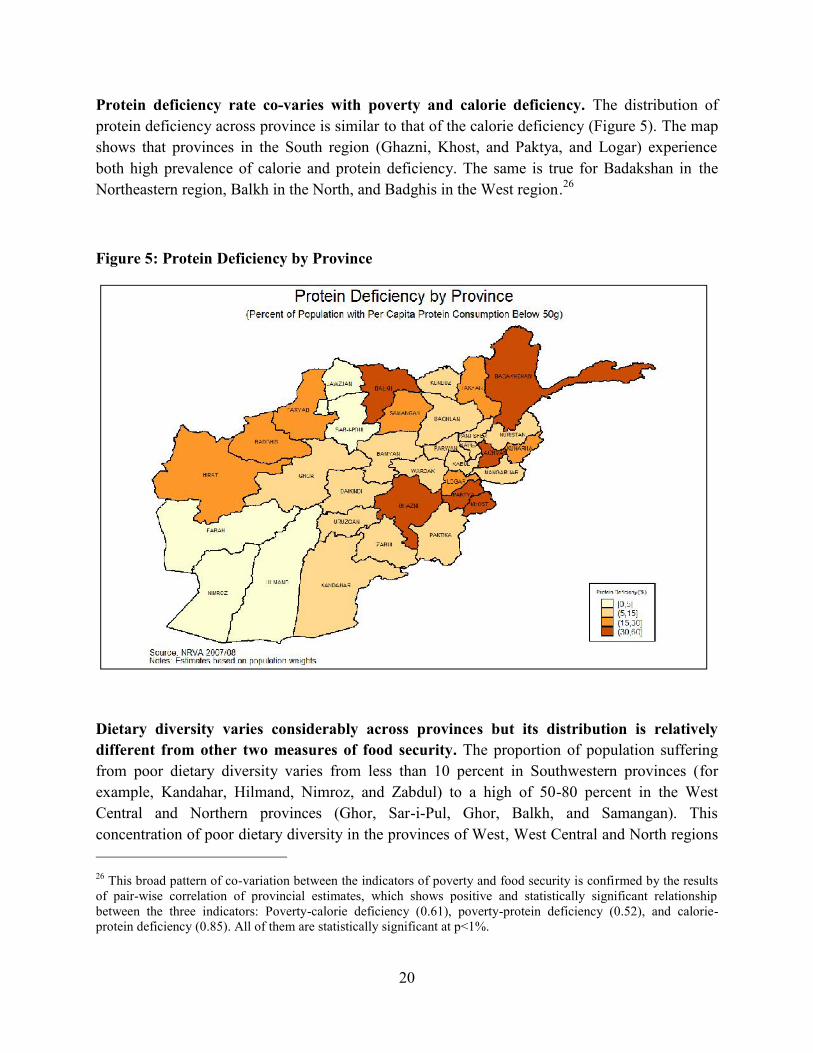
Protein deficiency rate co-varies with poverty and calorie deficiency. The distribution ofprotein deficiency across province is similar to that of the calorie deficiency (Figure 5). The mapshows that provinces in the South region (Ghazni, Khost, and Paktya, and Logar) experienceboth high prevalence of calorie and protein deficiency. The same is true for Badakshan in theNortheastern region, Balkh in the North, and Badghis in the West region.26
Figure 5: Protein Deficiency by Province
Dietary diversity varies considerably across provinces but its distribution is relativelydifferent from other two measures of food security. The proportion of population sufferingfrom poor dietary diversity varies from less than 10 percent in Southwestern provinces (forexample, Kandahar, Hilmand, Nimroz, and Zabdul) to a high of 50-80 percent in the WestCentral and Northern provinces (Ghor, Sar-i-Pul, Ghor, Balkh, and Samangan). Thisconcentration of poor dietary diversity in the provinces of West, West Central and North regions
26 This broad pattern of co-variation between the indicators of poverty and food security is confirmed by the resultsof pair-wise correlation of provincial estimates, which shows positive and statistically significant relationshipbetween the three indicators: Poverty-calorie deficiency (0.61), poverty-protein deficiency (0.52), and calorie-protein deficiency (0.85). All of them are statistically significant at p<1%.
21
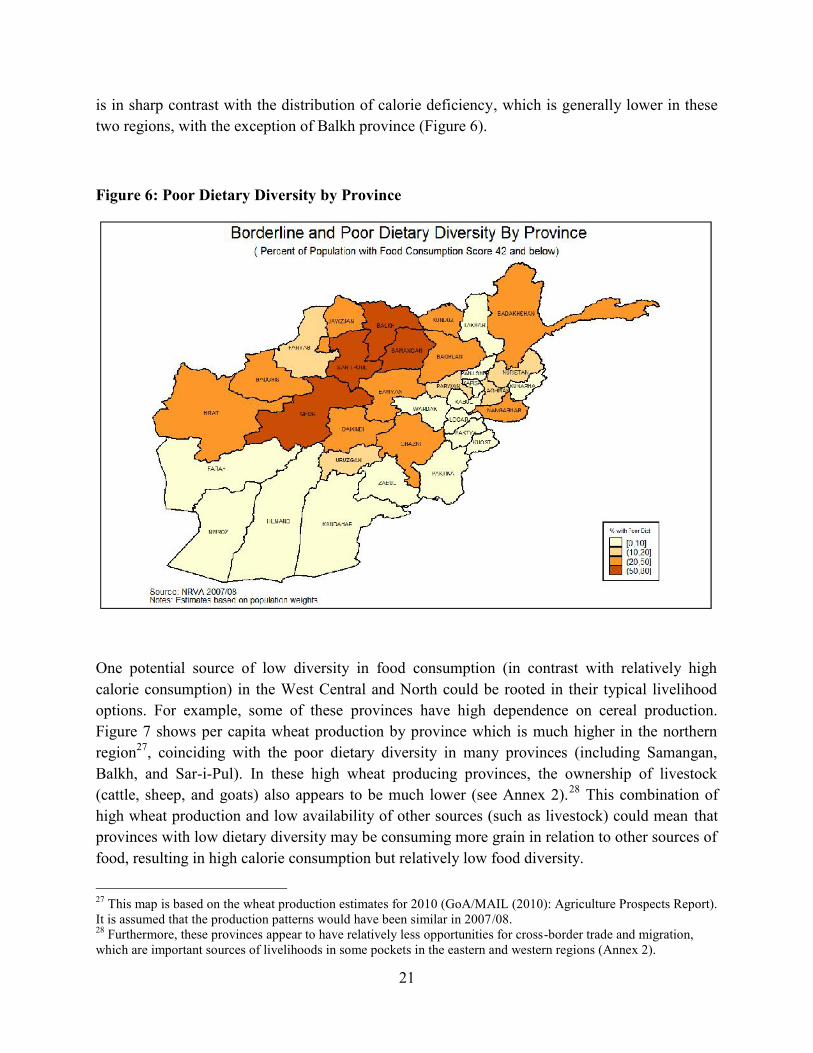
is in sharp contrast with the distribution of calorie deficiency, which is generally lower in thesetwo regions, with the exception of Balkh province (Figure 6).
Figure 6: Poor Dietary Diversity by Province
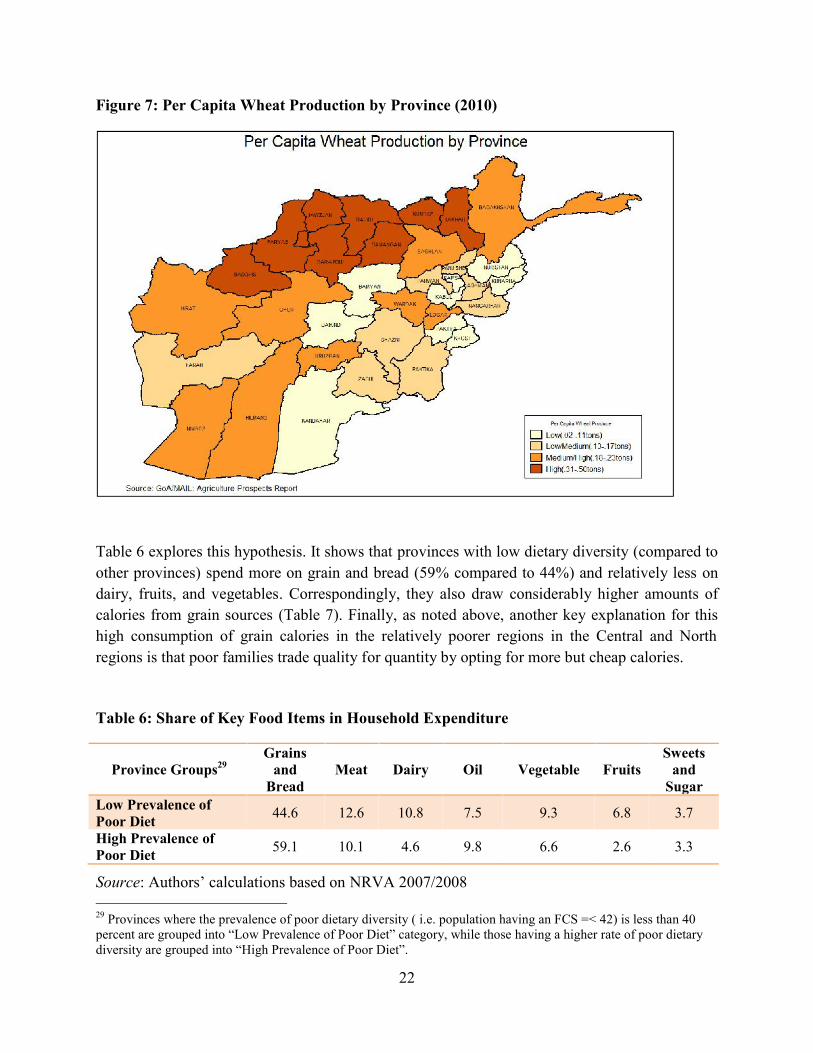
One potential source of low diversity in food consumption (in contrast with relatively highcalorie consumption) in the West Central and North could be rooted in their typical livelihoodoptions. For example, some of these provinces have high dependence on cereal production.Figure 7 shows per capita wheat production by province which is much higher in the northernregion27, coinciding with the poor dietary diversity in many provinces (including Samangan,Balkh, and Sar-i-Pul). In these high wheat producing provinces, the ownership of livestock(cattle, sheep, and goats) also appears to be much lower (see Annex 2).28 This combination ofhigh wheat production and low availability of other sources (such as livestock) could mean thatprovinces with low dietary diversity may be consuming more grain in relation to other sources offood, resulting in high calorie consumption but relatively low food diversity.
27 This map is based on the wheat production estimates for 2010 (GoA/MAIL (2010): Agriculture Prospects Report).It is assumed that the production patterns would have been similar in 2007/08.28 Furthermore, these provinces appear to have relatively less opportunities for cross-border trade and migration,which are important sources of livelihoods in some pockets in the eastern and western regions (Annex 2).
22
Figure 7: Per Capita Wheat Production by Province (2010)
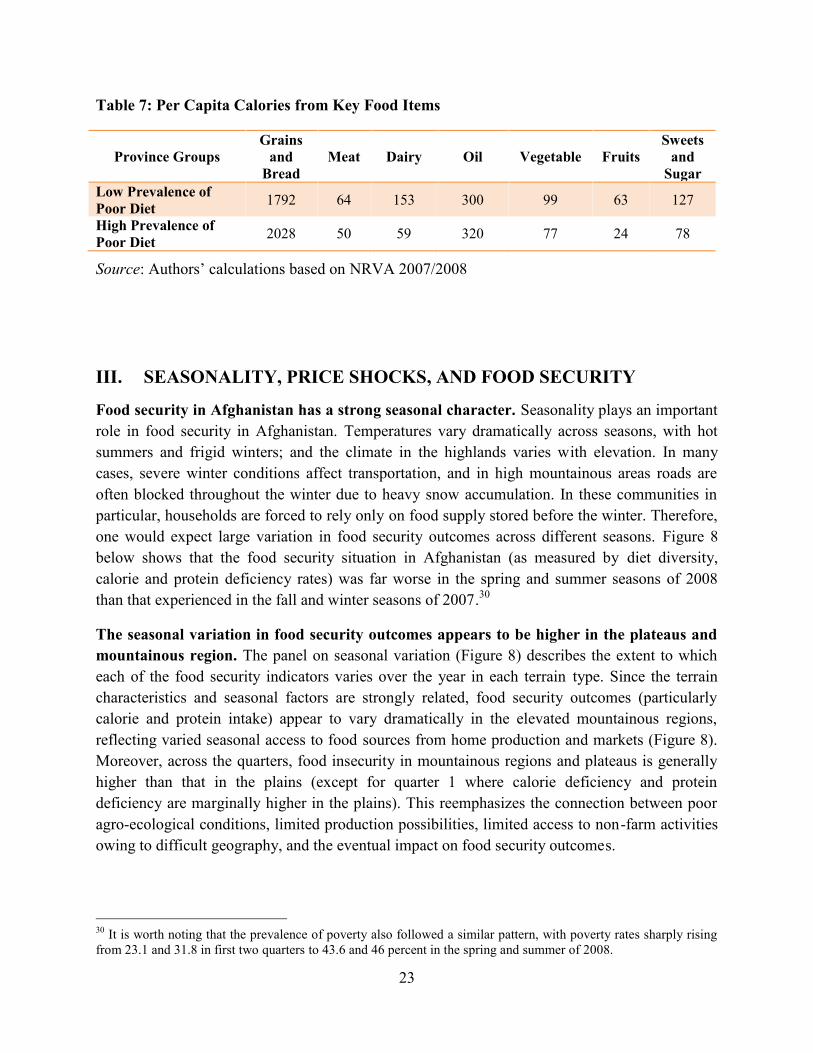
Table 6 explores this hypothesis. It shows that provinces with low dietary diversity (compared toother provinces) spend more on grain and bread (59% compared to 44%) and relatively less ondairy, fruits, and vegetables. Correspondingly, they also draw considerably higher amounts ofcalories from grain sources (Table 7). Finally, as noted above, another key explanation for thishigh consumption of grain calories in the relatively poorer regions in the Central and Northregions is that poor families trade quality for quantity by opting for more but cheap calories.
Table 6: Share of Key Food Items in Household Expenditure
Province Groups29Grains
andBread
Meat Dairy Oil Vegetable FruitsSweets
andSugar
Low Prevalence ofPoor Diet 44.6 12.6 10.8 7.5 9.3 6.8 3.7
High Prevalence ofPoor Diet 59.1 10.1 4.6 9.8 6.6 2.6 3.3
Source: Authors’ calculations based on NRVA 2007/2008
29 Provinces where the prevalence of poor dietary diversity ( i.e. population having an FCS =< 42) is less than 40percent are grouped into “Low Prevalence of Poor Diet” category, while those having a higher rate of poor dietarydiversity are grouped into “High Prevalence of Poor Diet”.
23
Table 7: Per Capita Calories from Key Food Items
Province GroupsGrains
andBread
Meat Dairy Oil Vegetable FruitsSweets
andSugar
Low Prevalence ofPoor Diet 1792 64 153 300 99 63 127
High Prevalence ofPoor Diet 2028 50 59 320 77 24 78
Source: Authors’ calculations based on NRVA 2007/2008
III. SEASONALITY, PRICE SHOCKS, AND FOOD SECURITY
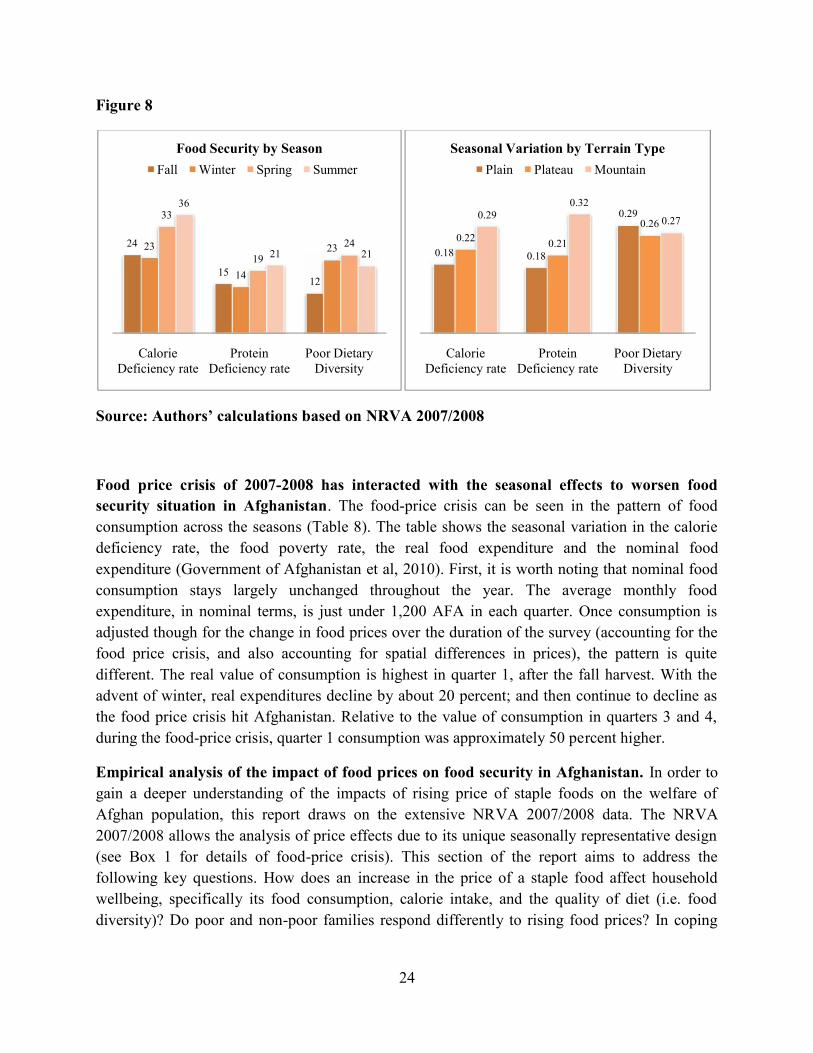
Food security in Afghanistan has a strong seasonal character. Seasonality plays an importantrole in food security in Afghanistan. Temperatures vary dramatically across seasons, with hotsummers and frigid winters; and the climate in the highlands varies with elevation. In manycases, severe winter conditions affect transportation, and in high mountainous areas roads areoften blocked throughout the winter due to heavy snow accumulation. In these communities inparticular, households are forced to rely only on food supply stored before the winter. Therefore,one would expect large variation in food security outcomes across different seasons. Figure 8below shows that the food security situation in Afghanistan (as measured by diet diversity,calorie and protein deficiency rates) was far worse in the spring and summer seasons of 2008than that experienced in the fall and winter seasons of 2007.30
The seasonal variation in food security outcomes appears to be higher in the plateaus andmountainous region. The panel on seasonal variation (Figure 8) describes the extent to whicheach of the food security indicators varies over the year in each terrain type. Since the terraincharacteristics and seasonal factors are strongly related, food security outcomes (particularlycalorie and protein intake) appear to vary dramatically in the elevated mountainous regions,reflecting varied seasonal access to food sources from home production and markets (Figure 8).Moreover, across the quarters, food insecurity in mountainous regions and plateaus is generallyhigher than that in the plains (except for quarter 1 where calorie deficiency and proteindeficiency are marginally higher in the plains). This reemphasizes the connection between pooragro-ecological conditions, limited production possibilities, limited access to non-farm activitiesowing to difficult geography, and the eventual impact on food security outcomes.
30 It is worth noting that the prevalence of poverty also followed a similar pattern, with poverty rates sharply risingfrom 23.1 and 31.8 in first two quarters to 43.6 and 46 percent in the spring and summer of 2008.
24
Figure 8
Source: Authors’ calculations based on NRVA 2007/2008
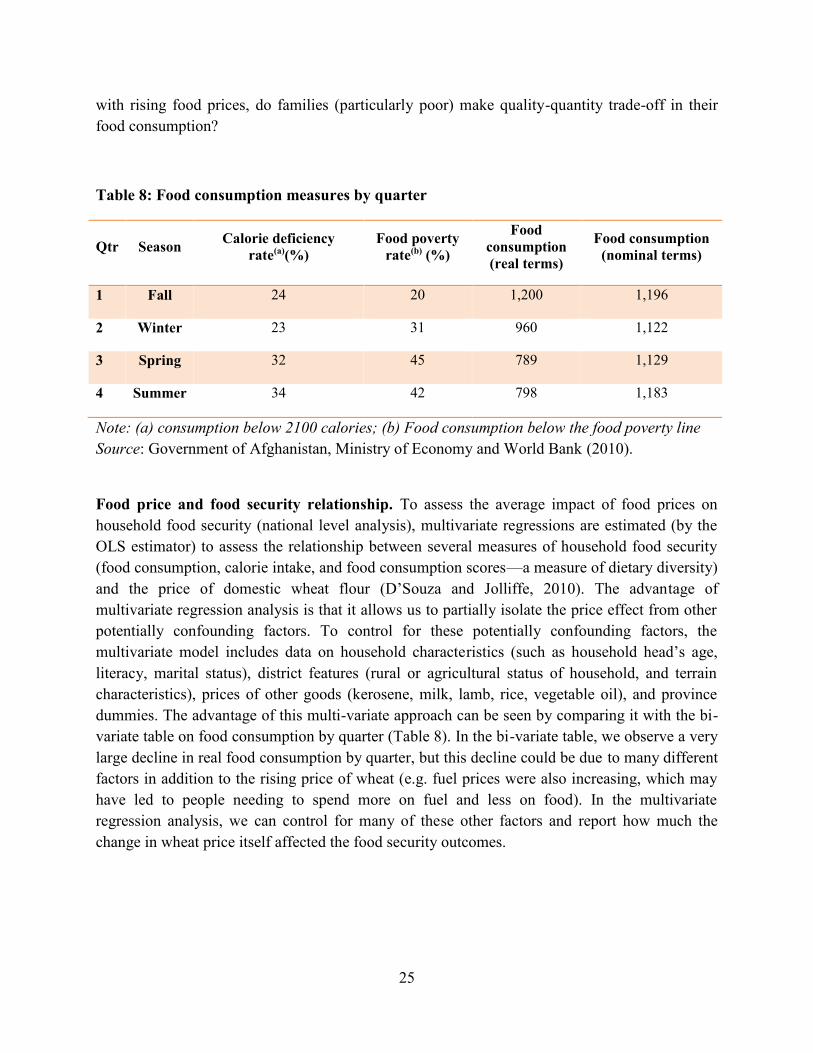
Food price crisis of 2007-2008 has interacted with the seasonal effects to worsen foodsecurity situation in Afghanistan. The food-price crisis can be seen in the pattern of foodconsumption across the seasons (Table 8). The table shows the seasonal variation in the caloriedeficiency rate, the food poverty rate, the real food expenditure and the nominal foodexpenditure (Government of Afghanistan et al, 2010). First, it is worth noting that nominal foodconsumption stays largely unchanged throughout the year. The average monthly foodexpenditure, in nominal terms, is just under 1,200 AFA in each quarter. Once consumption isadjusted though for the change in food prices over the duration of the survey (accounting for thefood price crisis, and also accounting for spatial differences in prices), the pattern is quitedifferent. The real value of consumption is highest in quarter 1, after the fall harvest. With theadvent of winter, real expenditures decline by about 20 percent; and then continue to decline asthe food price crisis hit Afghanistan. Relative to the value of consumption in quarters 3 and 4,during the food-price crisis, quarter 1 consumption was approximately 50 percent higher.
Empirical analysis of the impact of food prices on food security in Afghanistan. In order togain a deeper understanding of the impacts of rising price of staple foods on the welfare ofAfghan population, this report draws on the extensive NRVA 2007/2008 data. The NRVA2007/2008 allows the analysis of price effects due to its unique seasonally representative design(see Box 1 for details of food-price crisis). This section of the report aims to address thefollowing key questions. How does an increase in the price of a staple food affect householdwellbeing, specifically its food consumption, calorie intake, and the quality of diet (i.e. fooddiversity)? Do poor and non-poor families respond differently to rising food prices? In coping
24
1512
23
14
33
19
36
21
CalorieDeficiency rate
ProteinDeficiency rate
Poor DietaryDiversity
Food Security by SeasonFall Winter Spring
24
Figure 8
Source: Authors’ calculations based on NRVA 2007/2008
Food price crisis of 2007-2008 has interacted with the seasonal effects to worsen foodsecurity situation in Afghanistan. The food-price crisis can be seen in the pattern of foodconsumption across the seasons (Table 8). The table shows the seasonal variation in the caloriedeficiency rate, the food poverty rate, the real food expenditure and the nominal foodexpenditure (Government of Afghanistan et al, 2010). First, it is worth noting that nominal foodconsumption stays largely unchanged throughout the year. The average monthly foodexpenditure, in nominal terms, is just under 1,200 AFA in each quarter. Once consumption isadjusted though for the change in food prices over the duration of the survey (accounting for thefood price crisis, and also accounting for spatial differences in prices), the pattern is quitedifferent. The real value of consumption is highest in quarter 1, after the fall harvest. With theadvent of winter, real expenditures decline by about 20 percent; and then continue to decline asthe food price crisis hit Afghanistan. Relative to the value of consumption in quarters 3 and 4,during the food-price crisis, quarter 1 consumption was approximately 50 percent higher.
Empirical analysis of the impact of food prices on food security in Afghanistan. In order togain a deeper understanding of the impacts of rising price of staple foods on the welfare ofAfghan population, this report draws on the extensive NRVA 2007/2008 data. The NRVA2007/2008 allows the analysis of price effects due to its unique seasonally representative design(see Box 1 for details of food-price crisis). This section of the report aims to address thefollowing key questions. How does an increase in the price of a staple food affect householdwellbeing, specifically its food consumption, calorie intake, and the quality of diet (i.e. fooddiversity)? Do poor and non-poor families respond differently to rising food prices? In coping
12
23 2421
Poor DietaryDiversity
Food Security by SeasonSummer
0.18 0.18
0.22 0.21
0.290.32
CalorieDeficiency rate
ProteinDeficiency rate
Poor DietaryDiversity
Seasonal Variation by Terrain TypePlain Plateau Mountain
24
Figure 8
Source: Authors’ calculations based on NRVA 2007/2008
Food price crisis of 2007-2008 has interacted with the seasonal effects to worsen foodsecurity situation in Afghanistan. The food-price crisis can be seen in the pattern of foodconsumption across the seasons (Table 8). The table shows the seasonal variation in the caloriedeficiency rate, the food poverty rate, the real food expenditure and the nominal foodexpenditure (Government of Afghanistan et al, 2010). First, it is worth noting that nominal foodconsumption stays largely unchanged throughout the year. The average monthly foodexpenditure, in nominal terms, is just under 1,200 AFA in each quarter. Once consumption isadjusted though for the change in food prices over the duration of the survey (accounting for thefood price crisis, and also accounting for spatial differences in prices), the pattern is quitedifferent. The real value of consumption is highest in quarter 1, after the fall harvest. With theadvent of winter, real expenditures decline by about 20 percent; and then continue to decline asthe food price crisis hit Afghanistan. Relative to the value of consumption in quarters 3 and 4,during the food-price crisis, quarter 1 consumption was approximately 50 percent higher.
Empirical analysis of the impact of food prices on food security in Afghanistan. In order togain a deeper understanding of the impacts of rising price of staple foods on the welfare ofAfghan population, this report draws on the extensive NRVA 2007/2008 data. The NRVA2007/2008 allows the analysis of price effects due to its unique seasonally representative design(see Box 1 for details of food-price crisis). This section of the report aims to address thefollowing key questions. How does an increase in the price of a staple food affect householdwellbeing, specifically its food consumption, calorie intake, and the quality of diet (i.e. fooddiversity)? Do poor and non-poor families respond differently to rising food prices? In coping
0.290.26 0.27
Poor DietaryDiversity
Seasonal Variation by Terrain TypeMountain
25
with rising food prices, do families (particularly poor) make quality-quantity trade-off in theirfood consumption?
Table 8: Food consumption measures by quarter
Qtr Season Calorie deficiencyrate(a)(%)
Food povertyrate(b) (%)
Foodconsumption(real terms)
Food consumption(nominal terms)
1 Fall 24 20 1,200 1,196
2 Winter 23 31 960 1,122
3 Spring 32 45 789 1,129
4 Summer 34 42 798 1,183
Note: (a) consumption below 2100 calories; (b) Food consumption below the food poverty lineSource: Government of Afghanistan, Ministry of Economy and World Bank (2010).
Food price and food security relationship. To assess the average impact of food prices onhousehold food security (national level analysis), multivariate regressions are estimated (by theOLS estimator) to assess the relationship between several measures of household food security(food consumption, calorie intake, and food consumption scores—a measure of dietary diversity)and the price of domestic wheat flour (D’Souza and Jolliffe, 2010). The advantage ofmultivariate regression analysis is that it allows us to partially isolate the price effect from otherpotentially confounding factors. To control for these potentially confounding factors, themultivariate model includes data on household characteristics (such as household head’s age,literacy, marital status), district features (rural or agricultural status of household, and terraincharacteristics), prices of other goods (kerosene, milk, lamb, rice, vegetable oil), and provincedummies. The advantage of this multi-variate approach can be seen by comparing it with the bi-variate table on food consumption by quarter (Table 8). In the bi-variate table, we observe a verylarge decline in real food consumption by quarter, but this decline could be due to many differentfactors in addition to the rising price of wheat (e.g. fuel prices were also increasing, which mayhave led to people needing to spend more on fuel and less on food). In the multivariateregression analysis, we can control for many of these other factors and report how much thechange in wheat price itself affected the food security outcomes.
26
Box 1: Food-Price Crisis
Source: D’Souza & Jolliffe (2010)
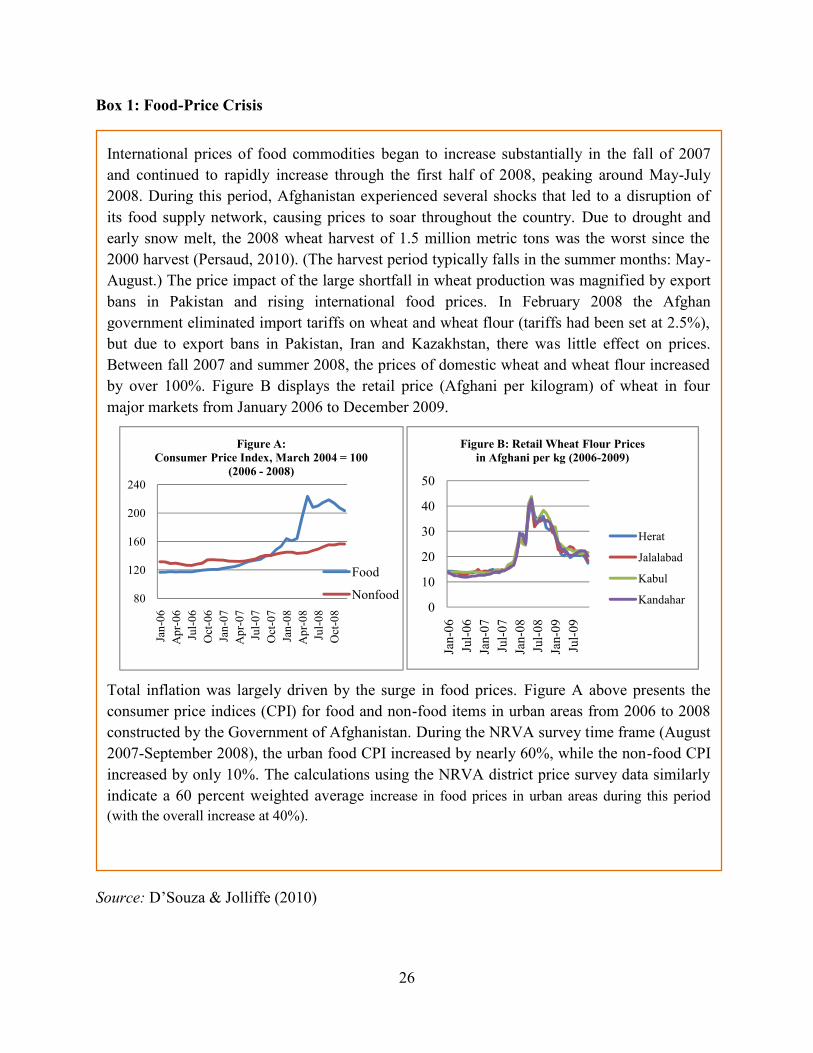
International prices of food commodities began to increase substantially in the fall of 2007and continued to rapidly increase through the first half of 2008, peaking around May-July2008. During this period, Afghanistan experienced several shocks that led to a disruption ofits food supply network, causing prices to soar throughout the country. Due to drought andearly snow melt, the 2008 wheat harvest of 1.5 million metric tons was the worst since the2000 harvest (Persaud, 2010). (The harvest period typically falls in the summer months: May-August.) The price impact of the large shortfall in wheat production was magnified by exportbans in Pakistan and rising international food prices. In February 2008 the Afghangovernment eliminated import tariffs on wheat and wheat flour (tariffs had been set at 2.5%),but due to export bans in Pakistan, Iran and Kazakhstan, there was little effect on prices.Between fall 2007 and summer 2008, the prices of domestic wheat and wheat flour increasedby over 100%. Figure B displays the retail price (Afghani per kilogram) of wheat in fourmajor markets from January 2006 to December 2009.
Total inflation was largely driven by the surge in food prices. Figure A above presents theconsumer price indices (CPI) for food and non-food items in urban areas from 2006 to 2008constructed by the Government of Afghanistan. During the NRVA survey time frame (August2007-September 2008), the urban food CPI increased by nearly 60%, while the non-food CPIincreased by only 10%. The calculations using the NRVA district price survey data similarlyindicate a 60 percent weighted average increase in food prices in urban areas during this period(with the overall increase at 40%).
80
120
160
200
240
Jan-
06A
pr-0
6Ju
l-06
Oct
-06
Jan-
07A
pr-0
7Ju
l-07
Oct
-07
Jan-
08A
pr-0
8Ju
l-08
Oct
-08
Figure A:Consumer Price Index, March 2004 = 100
(2006 - 2008)
Food
Nonfood0
10
20
30
40
50
Jan-
06Ju
l-06
Jan-
07Ju
l-07
Jan-
08Ju
l-08
Jan-
09Ju
l-09
Figure B: Retail Wheat Flour Pricesin Afghani per kg (2006-2009)
Herat
Jalalabad
Kabul
Kandahar
27
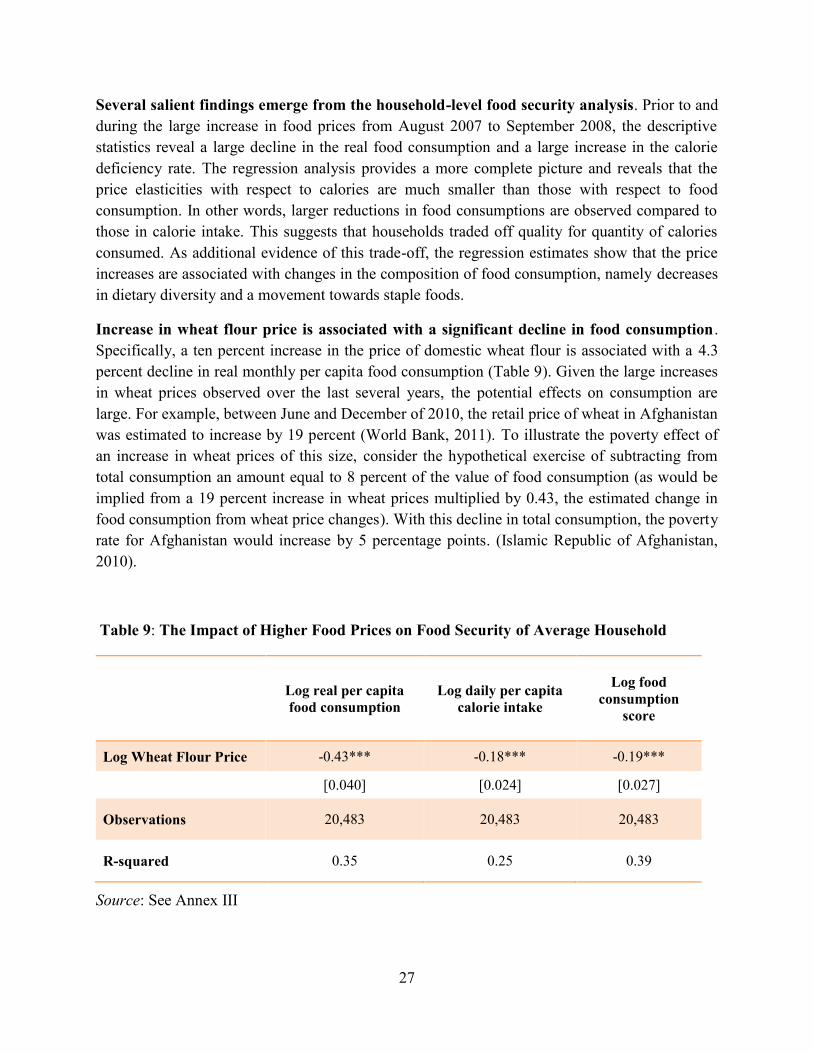
Several salient findings emerge from the household-level food security analysis. Prior to andduring the large increase in food prices from August 2007 to September 2008, the descriptivestatistics reveal a large decline in the real food consumption and a large increase in the caloriedeficiency rate. The regression analysis provides a more complete picture and reveals that theprice elasticities with respect to calories are much smaller than those with respect to foodconsumption. In other words, larger reductions in food consumptions are observed compared tothose in calorie intake. This suggests that households traded off quality for quantity of caloriesconsumed. As additional evidence of this trade-off, the regression estimates show that the priceincreases are associated with changes in the composition of food consumption, namely decreasesin dietary diversity and a movement towards staple foods.
Increase in wheat flour price is associated with a significant decline in food consumption .Specifically, a ten percent increase in the price of domestic wheat flour is associated with a 4.3percent decline in real monthly per capita food consumption (Table 9). Given the large increasesin wheat prices observed over the last several years, the potential effects on consumption arelarge. For example, between June and December of 2010, the retail price of wheat in Afghanistanwas estimated to increase by 19 percent (World Bank, 2011). To illustrate the poverty effect ofan increase in wheat prices of this size, consider the hypothetical exercise of subtracting fromtotal consumption an amount equal to 8 percent of the value of food consumption (as would beimplied from a 19 percent increase in wheat prices multiplied by 0.43, the estimated change infood consumption from wheat price changes). With this decline in total consumption, the povertyrate for Afghanistan would increase by 5 percentage points. (Islamic Republic of Afghanistan,2010).
Table 9: The Impact of Higher Food Prices on Food Security of Average Household
Log real per capitafood consumption
Log daily per capitacalorie intake
Log foodconsumption
score
Log Wheat Flour Price -0.43*** -0.18*** -0.19***
[0.040] [0.024] [0.027]
Observations 20,483 20,483 20,483
R-squared 0.35 0.25 0.39
Source: See Annex III
28
The impact of rising wheat price on calorie intake and food diversity is less pronouncedthan that experienced in food consumption. The price response of calories and dietarydiversity (at the national level) show that households are able to buffer the impact of the largeshock in prices to a certain extent. The regression results in Table 9 show that on average, a tenpercent in the wheat flour price would lead to a 1.9 percent decline in calorie intake. Thisrelatively smaller effect on calories can be explained by the decline in dietary diversity. Foodconsumption scores—a measure of dietary diversity—would decline by a similar amount (1.8percent), on average, with a ten percent increase in the price of wheat.31
Evidence suggests that households are trading off quality for quantity. As a result of theprice increases and the subsequent decline in purchasing power, households change thecomposition of their diets in order to maintain calories.32 In particular, they shift towards lowerquality (less nutrient-rich), cheaper foods, thus allowing them to acquire more food to maintaintheir calories – to the extent possible – in the face of large declines in purchasing power.33 Theregression results show a decline in expenditure shares of all food groups except grains,consistent with a story of substitution across food groups and a movement toward staple foodconsumption (D’Souza and Jolliffe 2010). The largest decline is seen in fruit, which can beconsidered a luxury item.
Behavioral response of different groups: The forgoing results provide the estimate of averageresponse of households to a change in wheat price. However, if there are reasons to believe thatpoor households respond to price changes differently than nonpoor households (or, moreprecisely, households at different points of the distribution), then it is helpful to disaggregate theestimated behavioral responses for different groups. For example, a household’s degree ofsensitivity to an increase in wheat flour prices may depend on the percentage of its budgetdevoted to wheat relative to other foods or on its average level of nutrition; and factors such asthese may differ for rich and poor households. In such situations, the average estimatescalculated through OLS regression (such as those presented above) could be misleading.
Distribution sensitive analysis of behavioral response. The following analysis shows theimpact of rising prices on different groups, classified by their status on the food security measureof interest. Using a recent innovation in quantile regression analysis – the unconditional quantileregression (UQR), the analysis now examines the impact of the wheat flour price shocks on
31 Other analysis by D’Souza and Jolliffe (2010) reveals that the percentage reduction in grams of protein consumedis greater than the reduction in calories and diversity.32 The NRVA 2007/2008 has a section on shocks which asks the respondents to mention any shocks (up to three)that have negatively impacted their household. Surprisingly, only 1.5 percent of the households reported ‘unusuallyhigh increases in food price’ as a shock. Those who reported food price increase as a shock also mentioned usingdifferent coping mechanisms including reducing food consumption, sale of assets, community support etc. Furtherdisaggregation of those who reported reducing quality or quantity of food shows that 25 percent reported reducingboth quantity and quality, 11 percent mentioned reducing quality only and 12 percent reported reducing the quantityonly. This contrast between subjective findings and empirical results require further investigation.33 Diagana et al., (1999) find similar effects – decreases dietary diversity and changes in food consumption patterns– after the devaluation of the CFA franc in 1994.
29
several measures of food security for different groups. The estimates for 25th, 50th, 75th quantilesare examined to assess whether the effects differ in informative ways across the distribution. Forexample, price effect on the calorie intake of the poor households (those belonging to the 25th
percentile of calorie consumption) are compared with that of the better-off (75th percentile ofcalorie consumption) to examine whether the effects are different. Similarly, the paper examinesthe estimates for quantiles corresponding to thresholds of policy relevance, e.g., 2100 calories – acommonly used nutritional benchmark. Measuring responses at these thresholds can help tobetter inform policymakers of how households on the cusp of poverty and/or poor health areaffected by price changes. Such information may be particularly salient in a country likeAfghanistan, where a large portion of the population lives close to subsistence levels or inpoverty.
Analysis shows several disparities in the behavioral responses of different groups toincreases in the price of wheat flour. Results show that households with highest real foodconsumption and caloric intake experience the largest declines in each of these measures, asmight have been expected given that these households can afford to cut back. In contrast,households at the bottom of the caloric intake distribution cannot afford to cut back on caloriessince they are close to the minimum daily per capita energy requirement of 2,100 kilocalories;there is no significant effect of the wheat flour price increases on their intake. Finally householdsat the bottom of the dietary diversity distribution – often very poor households – experience largedeclines in dietary diversity as a result of the wheat flour price increases. Since households livingat subsistence levels cannot make major cuts to caloric intake, they must adjust the compositionsof their diet in order to maintain energy levels.
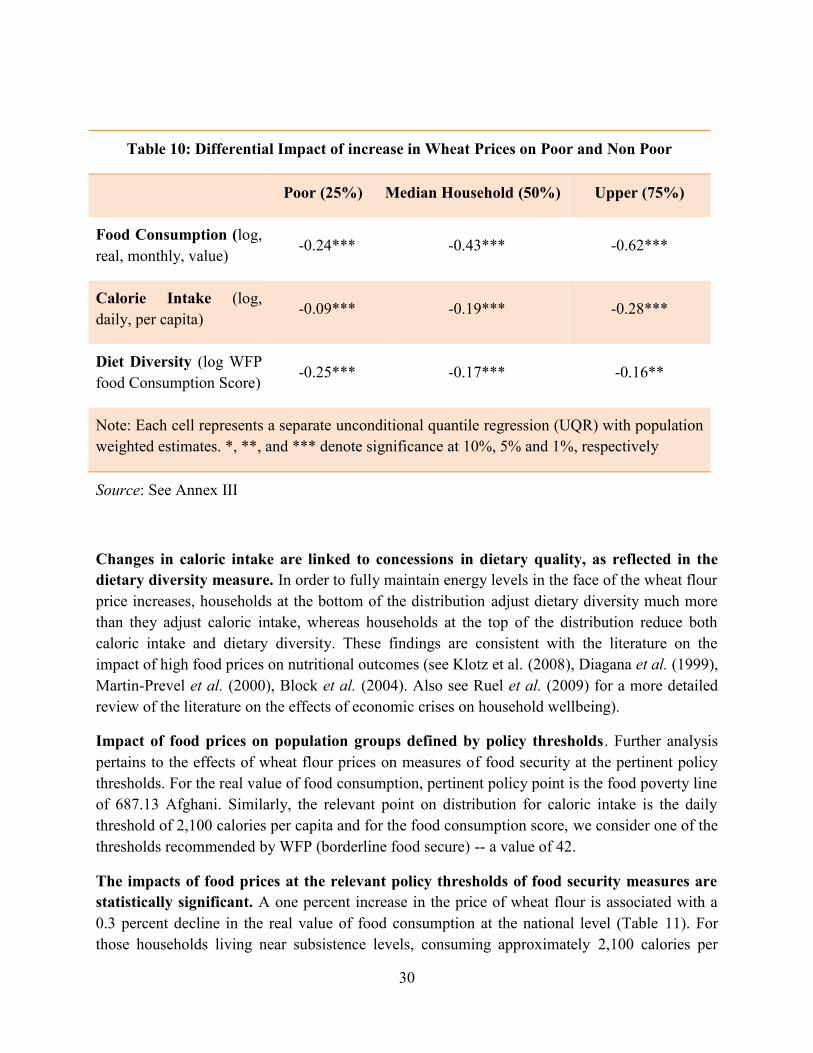
With rising food prices, richer households’ consumption fell more dramatically than that oftheir poor counterpart. The decline in the per capita food consumption of richer households(75th percentile) is about two and a half times as large as the reduction for households at thebottom quartile (25th percentile) (Table 10). At a very basic level, richer households have more togive, whereas poor households cannot make large reductions to their food consumption sincethey are living closer to subsistence levels. Further, richer households may host more guests andwaste more food, on average, than do poorer households; therefore the former may be able tomake larger reductions in their value of food consumption without greatly affecting food intakeof individual household members.
Changes in caloric intake are also larger for the richer households. A ten percent increase inwheat flour prices is estimated to reduce caloric intake by 2.8 percent for those better offhouseholds (those at the 75th percentile). This effect is three times larger than for calorie-poorhouseholds (at the 25th percentile) who reduce calories by a relatively small amount (less than 1percent for a 10 percent increase in prices). These poor households are living at the threshold ofenergy requirements and likely are unable to cut back on calories without experiencing seriousnutritional consequences; daily per capita caloric intake for households at the 25 th percentile is alow 2,030 kilocalories per person per day.
30
Table 10: Differential Impact of increase in Wheat Prices on Poor and Non Poor
Poor (25%) Median Household (50%) Upper (75%)
Food Consumption (log,real, monthly, value)
-0.24*** -0.43*** -0.62***
Calorie Intake (log,daily, per capita)
-0.09*** -0.19*** -0.28***
Diet Diversity (log WFPfood Consumption Score)
-0.25*** -0.17*** -0.16**
Note: Each cell represents a separate unconditional quantile regression (UQR) with populationweighted estimates. *, **, and *** denote significance at 10%, 5% and 1%, respectively
Source: See Annex III
Changes in caloric intake are linked to concessions in dietary quality, as reflected in thedietary diversity measure. In order to fully maintain energy levels in the face of the wheat flourprice increases, households at the bottom of the distribution adjust dietary diversity much morethan they adjust caloric intake, whereas households at the top of the distribution reduce bothcaloric intake and dietary diversity. These findings are consistent with the literature on theimpact of high food prices on nutritional outcomes (see Klotz et al. (2008), Diagana et al. (1999),Martin-Prevel et al. (2000), Block et al. (2004). Also see Ruel et al. (2009) for a more detailedreview of the literature on the effects of economic crises on household wellbeing).
Impact of food prices on population groups defined by policy thresholds. Further analysispertains to the effects of wheat flour prices on measures of food security at the pertinent policythresholds. For the real value of food consumption, pertinent policy point is the food poverty lineof 687.13 Afghani. Similarly, the relevant point on distribution for caloric intake is the dailythreshold of 2,100 calories per capita and for the food consumption score, we consider one of thethresholds recommended by WFP (borderline food secure) -- a value of 42.
The impacts of food prices at the relevant policy thresholds of food security measures arestatistically significant. A one percent increase in the price of wheat flour is associated with a0.3 percent decline in the real value of food consumption at the national level (Table 11). Forthose households living near subsistence levels, consuming approximately 2,100 calories per
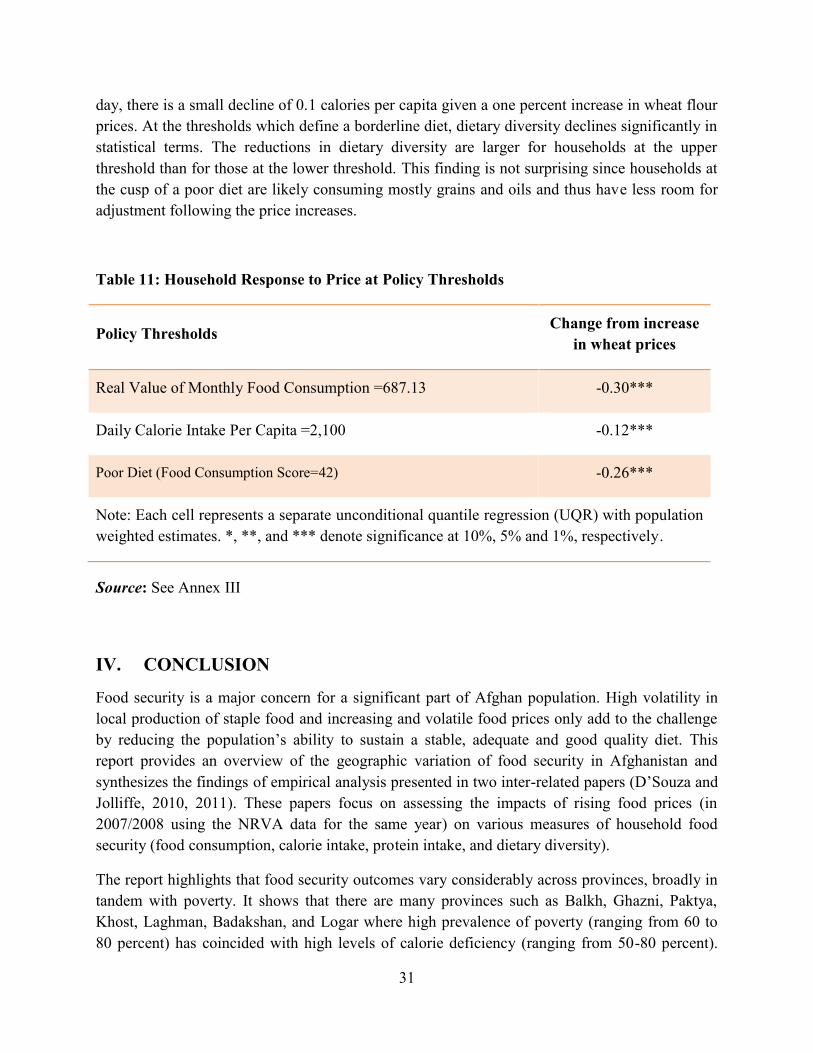
31
day, there is a small decline of 0.1 calories per capita given a one percent increase in wheat flourprices. At the thresholds which define a borderline diet, dietary diversity declines significantly instatistical terms. The reductions in dietary diversity are larger for households at the upperthreshold than for those at the lower threshold. This finding is not surprising since households atthe cusp of a poor diet are likely consuming mostly grains and oils and thus have less room foradjustment following the price increases.
Table 11: Household Response to Price at Policy Thresholds
Policy Thresholds Change from increasein wheat prices
Real Value of Monthly Food Consumption =687.13 -0.30***
Daily Calorie Intake Per Capita =2,100 -0.12***
Poor Diet (Food Consumption Score=42) -0.26***
Note: Each cell represents a separate unconditional quantile regression (UQR) with populationweighted estimates. *, **, and *** denote significance at 10%, 5% and 1%, respectively.
Source: See Annex III
IV. CONCLUSION
Food security is a major concern for a significant part of Afghan population. High volatility inlocal production of staple food and increasing and volatile food prices only add to the challengeby reducing the population’s ability to sustain a stable, adequate and good quality diet. Thisreport provides an overview of the geographic variation of food security in Afghanistan andsynthesizes the findings of empirical analysis presented in two inter-related papers (D’Souza andJolliffe, 2010, 2011). These papers focus on assessing the impacts of rising food prices (in2007/2008 using the NRVA data for the same year) on various measures of household foodsecurity (food consumption, calorie intake, protein intake, and dietary diversity).
The report highlights that food security outcomes vary considerably across provinces, broadly intandem with poverty. It shows that there are many provinces such as Balkh, Ghazni, Paktya,Khost, Laghman, Badakshan, and Logar where high prevalence of poverty (ranging from 60 to80 percent) has coincided with high levels of calorie deficiency (ranging from 50-80 percent).
32
This inter-relatedness of poverty and food security is confirmed by the fact that more than twothirds of the poor (69 percent) are food insecure in at least one of the three dimensions—calorieintake, protein intake, and dietary diversity. In contrast, only 26 percent of non-poor experiencesome form of food insecurity.
Several key findings emerge from the impact analysis of rising food prices on food security. TheOLS regression estimates which look at the average impact (at the national level) show that withthe doubling of wheat flour prices, food consumption drops by 43 percent. However, the priceresponsive is smaller for calorie intake (18 percent) and dietary diversity (10 percent). Thissuggests that households reduced consumption by reducing both the quantity consumed (asmeasured by calories) and diet quality (as measured by dietary diversity). In reducing dietquality, households essentially traded off quality for quantity of calories consumed. As additionalevidence of this trade-off, regression estimates show that the price increases are associated withchanges in the composition of food consumption, namely decreases in dietary diversity and amovement towards staple foods (D’Souza and Jolliffe, 2010).
Further analysis of price effects on different types of households (using UQR) shows that thereare large differences in the behavioral response of households to rising wheat flour price basedon their food security status (eg. whether food secure or insecure). The differences uncovered inthis analysis are typically obscured when using standard (OLS) estimation techniques.Households at the 75th percentile of the distribution of real food consumption (ie. those that arebetter off in terms of food consumption) experience the largest percentage declines in real foodconsumption for a given increase in wheat flour prices – over four times larger than those at the25th percentile. Analogously, those at the 75th percentile of the caloric intake distributionexperience the largest percentage declines in caloric intake for a given increase in wheat flourprices. As some might expect, households at the bottom of the caloric intake distributionexperience a relatively small decline in caloric intake due to the price increases. Such householdslive near subsistence levels and are forced to make adjustments to the quality of their diets inorder to maintain energy levels; households at the 25th percentile of the dietary diversitydistribution make the largest changes to the quality of their diets – about fifty percent larger thanthose at the 75th percentile (ie. those with relatively much higher dietary diversity).
The findings have several implications for policy. First, given large differences in food securityoutcomes at the sub-national level (for example, across provinces), better targeting is crucial toincrease the effectiveness of food security programs. For example, provinces that are poor inoverall terms may or may not be equally poor in terms of calorie intake and the diversity of diet.In fact, many provinces that perform well on calorie intake (for example, Ghor and Sar-i-Pul) areworse-off in terms of dietary diversity. Similarly, provinces that do not produce surplus grainmay not necessarily be calorie deficient. For example, Daikuni, Nuristan, and Bamyan haveexperienced relatively lower levels of calorie deficiency (less than 30 percent) compared toGhazni, Balkh, Laghman and Badadshan where the calorie deficiency rate is in excess of 50
33
percent.34 These large and sometime divergent food security outcomes at the provincial levelunderscore both complexity of and need for better targeting that is required to inform policychoices.
Second, the empirical evidence highlights that if policy makers focus exclusively on changes incaloric intake in the event of a price shock, they may miss an important component of the bigpicture. While poorer households do not cut back on calories, it is likely that they reduce dietaryquality by making adjustment in their consumption patterns, for example, by increasing theconsumption of staple food (for example, wheat). Therefore, the government’s on-going effortsto ensure adequate supply of staple food during the time of crisis can only address part of thechallenge. But the high degree of micro-nutrient deficiency among children in general and highpotential for this problem to compound during the time of food crisis (through increasedconsumption of low quality diet by the poor) suggest that complementary efforts are also equallycrucial to address micro-nutrient deficiency (such as through the fortification of staples andvitamin distributions). To this end, devising new initiatives as well as improving the outreachand targeting in existing programs (for example, WFP’s micro-nutrient enriched food forchildren and wheat flour fortification initiative) would help secure better food security outcomes.For example, increased efforts are needed to boost the uptake of fortified wheat flour in ruralareas where the poor diet is affecting a much larger proportion of the population.
Finally, given that poor nutrition and food insecurity affects a sizeable proportion of Afghanpopulation year-round but more so during bad times (e.g. lean months of spring season or duringfood price shocks), there is genuine need for a scaled-up and well-targeted safety nets program inAfghanistan. Currently, the government is implementing a few state sponsored safety netsprograms but they have limited outreach. Other initiatives such as conditional in-kind and cashtransfers to the vulnerable groups under the WFP led programs are implemented as part of reliefand recovery efforts and have varying degrees of outreach and effectiveness. Lessons can belearned from these experiences to devise a comprehensive safety nets program that is welltargeted, reliable and sufficient in scale.
34 MAIL 2009: Strategic Grain Reserve: Infrastructure for Food Security (Concept Paper)
34
References
Block, Steven A., Lynnda Kiess, Patrick Webb, Soewarta Kosen, Regina Moench-Pfanner,Martin W. Bloem, and C. Peter Timmer. “Macro shocks and micro outcomes: child nutritionduring Indonesia’s crisis,” Economics and Human Biology. Vol 2. 2004. 21-44.
Chabot, Philippe and Paul A. Dorosh (2007): “Wheat markets, food aid and food security inAfghanistan,” Food Policy. Vol. 32. 2007. 334-353.
Deaton, A., & Dreze, J. (2009). Food and Nutrition in India: Facts and Interpretations. Economicand Political Weekly, XLIV(7), 42-65
Diagana, Bocar, Francis Akindes, Kimseyinga Savadogo, Thomas Reardon, and John Staatz.“Effects of the CFA franc devaluation on urban food consumption in West Africa: overviewand cross-country comparisons,” Food Policy. Vol. 24. 1999. 465-478.
D'Souza, A. E., & Jolliffe, D. (2012): Rising Food Prices and Coping Strategies: Household-Level Evidence from Afghanistan. Journal of Development Studies, 48(2): pp-pp.
D'Souza, A. E., & Jolliffe, D. (2011). Food Security and Wheat Prices in Afghanistan: ADistribution-sensitive Analysis of Household-level Impacts, orld Bank Policy ResearchWorking Paper Series 56XX.
Economic Research Service, U.S. Department of Agriculture: Food Security Assessment, 2008-2009. GFA-20. June 2009.
FEWSNET and USAID: Livelihoods Zoning “Plus” Activity in Afghanistan. [Online:]
http://www.fews.net/docs/Publications/AF_livelihoods%20descriptions_en.pdf [August 4, 2011]
Food Aid Convention (FAC): Food Aid Operations 2008/09. Secretariat of the InternationalGrain Council, London, February 2010.
Food and Agricultural Organization, U. N (2006): Afghanistan. National Livestock Census 2002-2003, Final Report 2006. [Online:] http://www.fao.org/docrep/010/i0034e/i0034e00.htm.
Food and Agricultural Organization, U. N. (2008). The State of Food Insecurity in the World2008: High food prices and food security – threats and opportunities.
Food and Agricultural Organization, U. N. Afghanistan: Map of Major Farming Systems.[Online:] http://www.fao.org/countryprofiles/Maps/AFG/01/fs/index.html [January 3, 2012]
Islamic Republic of Afghanistan, Ministry of Agriculture, Irrigation and Livestock: AgricultureProspects Report, MAIL, General Department of Policy and Planning, Statistics andMarketing Information Office, Kabul. May 2010.
35
Islamic Republic of Afghanistan, Ministry of Economy, and the World Bank, Economic Policyand Poverty Sector. Poverty Status in Afghanistan: A Profile based on the National Risk andVulnerability Assessment (NRVA) 2007/08. Kabul: July 2010.
Islamic Republic of Afghanistan, Ministry of Economy, and the World Bank, Economic Policyand Poverty Sector. Afghanistan Provincial Briefs. Kabul: June 2011.
International Monetary Fund (2009): World Economic Outlook 2009. Crisis and Recovery, April2009
Klotz, Christine, Saskia de Pee, Andrew Thorne-Lyman, Klaus Kraemer, and Martin Bloem.“Nutrition in the Perfect Storm: Why Micronutrient Malnutrition will be a WidespreadHealth Consequence of High Food Prices,” Sight and Life Magazine. Iss. 2. 2008.
Maletta, Hector (2004): “Winters of Discontent: Seasonal changes in wages and food prices inAfghanistan, 2002-2003,” FAO discussion paper. January 2004. [Online:]ftp://ftp.fao.org/country/afghanistan/Winters_of_discontent.pdf [April 15, 2010]
Martin-Prevel, Y., F. Delpeuch, P. Traissac, J-P. Massamba, G. Adoua-Oyila, K. Coudert, and S.Treche. “Deterioration in the nutritional status of young children and their mothers inBrazzaville, Congo, following the 1994 devaluation of the CFA franc,” Bulletin of theWorld Health Organization. Vol.78. Iss. 1. 2000. 108-118.
Ministry of Agriculture, Irrigation and Livestock (MAIL): Strategic Grain Reserve:Infrastructure for Food Security, Concept Paper under the Agricultural Production andProductivity Programme, National Agriculture Development Framework, April 2009.
Organization for Economic Co-operation and Development (OECD)/Development AssistanceCommittee (DAC): DAC2a ODA Disbursements. [Online:]http://stats.oecd.org/Index.aspx?DatasetCode=TABLE2A [March 5, 2011]
Persaud, Suresh (2010): “Price Volatility in Afghanistan's Wheat Market,” E-Outlook ReportNo. WHS-10d-01. U.S. Department of Agriculture, Economic Research Service. May 2010.
Ruel, Marie T., James L. Garrett, Corinna Hawkes and Marc J. Cohen. "The Food, Fuel, andFinancial Crises Affect the Urban and Rural Poor disproportionately: A Review of theEvidence,” in supplement: “The Impact of Climate Change, the Economic Crisis, and theIncrease in Food Prices on Malnutrition,” The Journal of Nutrition (Nov. 25, 2009).
UNICEF: Tracking Progress on Child and Maternal Nutrition: a survival and developmentpriority. New York: UNICEF. November 2009.
United Nations Development Program (UNDP): Human Development Report 2009. [Online:]http://hdr.undp.org/en/reports/global/hdr2009/chapters/ [April 20, 2010]
United Nations Office on Drugs and Crime (UNODC) (2008): Afghanistan Opium Survey, 2008.Kabul and Vienna: UNODC. September 2008. [Online:]
36
http://www.unodc.org/documents/publications/Afghanistan_Opium_Survey_2008.pdf[January 03, 2012]
World Bank. Enhancing Food Security in Afghanistan: Private Market and Public PolicyOptions, Agriculture and Rural Development Sector and Human Development Sector SouthAsia Region, Discussion Paper Series. August 2005.
World Bank. Food Price Increases in South Asia: National Responses and Regional Dimensions.South Asia Region Sustainable Development Department. Washington DC. June 2010
World Bank. Afghanistan Nutrition, Washington, DC. 2011. [Online:]http://siteresources.worldbank.org/SOUTHASIAEXT/Resources/223546-1171488994713/3455847-1232124140958/5748939-1234285802791/AfghanistanNutrition.pdf. [December 14, 2011]
World Bank. Food Price Watch. Poverty Reduction and Economic Management Newsletter.Washington, DC. 2011. [Online:]http://siteresources.worldbank.org/INTPREMNET/Resources/Food_Price_Watch_Feb_2011_Final_Version.pdf. [December 15, 2011]
World Bank and UNHCR—The UN Refugee Agency. Research Study on IDPs in UrbanSettings of Afghanistan. Kabul, May 2011. [Online:]http://siteresources.worldbank.org/EXTSOCIALDEVELOPMENT/Resources/244362-1265299949041/6766328-1265299960363/WB-UNHCR-IDP_Full-Report.pdf. [January 3,2012]
World Food Programme (WFP) (2009): Evaluation of Afghanistan-PRRO 10427 (EvaluationReport). “Post Conflict Relief and Rehabilitation in the Islamic Republic of Afghanistan”,Office of Evaluation, World Food Programme 2009.
World Food Programme (WFP): [Online:] http://www.wfp.org/countries/Afghanistan/Operations[February 24 & March 03, 2011]
World Food Programme (WFP): International Food Aid Information System. [Online:]http://www.wfp.org/fais/quantity-reporting [March 5, 2011]
37
Annex 1: WFP’s Key Food Assistance Programs and their Performance
a) Relief-General Food Distribution
Provision of relief ration to people who suffer from man-made and natural disasters is one of thekey components of WFP’s food operations. During 2006-2008, 21 percent of WFP’s overall fooddistribution went to support emergency food aid, including relief-focused food for workprograms to benefit on average a million people each year (WFP 2009). In 2010, WFP’s relieffood assistance reached more than 1.8 million people, including those affected by floods andlandslides as well as returning refugees and internally displaced persons due to conflict (Table4).
Relief food activities have done a relatively better job in reaching the desired groups. A WorldBank report “Enhancing Food Security in Afghanistan: Private Market and Public PolicyOptions” notes that relief food aid targeted the poorest 20 percent better than the other twoprograms—Food for Work and Cash for Work (World Bank 2005). However, the report alsoidentified significant exclusion errors; 85 percent of food insecure households did not benefitfrom relief food, implying both limited coverage of the program as well as significant inclusionerrors. A more recent evaluation carried out by the WFP notes that the majority of relief foodrecipients matched the specified targeting criteria which typically included widows/femaleheaded households, disabled, IDPs/returnees and landless families in rural areas (WFP 2009).
b) Food for Work
The Food for Work (FFW) program provides food support to vulnerable and poor Afghans as anincentive for their labor contribution in building or repairing productive communityinfrastructure such as roads, bridges, reservoirs and irrigation systems. The projects are selectedin consultation with the government and local communities. Though FFW was originallyintended to be a recovery activity, it has also become a key component of relief food aid,reflecting the general cultural preference of beneficiaries to contribute back in exchange forrelief food. As a result, FFW activities (both relief and recovery) has become one of the largestcomponent of WFP’s food aid. For instance, recovery FFW accounted for 38 percent of overallfood distribution in 2006-2008, while relief FFW claimed another 8 percent during the sameperiod (WFP 2009).
In terms of beneficiary coverage, FFW assisted around 1.5 million Afghan people in 2010.Targeting appears to be a challenge, however. World Bank (2005) notes that only 37 percent ofpoor households participated in FFW programs, while nearly two-thirds were excluded. Theevaluation of most recent PRRO by WFP notes that low value of FFW vis-à-vis daily labor rateshelp self select the beneficiaries from most vulnerable groups (WFP 2009). However, the reportalso mentions reports from donors indicating as little as 50 percent of beneficiaries meeting theWFP’s specified criteria for FFW eligibility. There were also cases in which communities
38
reported food delivery delays of up to 8 months, thus curtailing the ability of vulnerablecommunities to cope with their food needs.
c) Food for Education
Food for Education (FFE) aims to bridge nutritional gaps among children and promote schoolenrollment, particularly among girls, by providing school meals and take-home rations. Itcontinues to be one of the largest components of WFP’s food operations in Afghanistan,accounting for close to a third of overall food distribution and serving an annual beneficiary baseof more than 1 million children35. In 2010 alone, as part of its on-site feeding program, WFP fedover a million children with a daily snack of micro-nutrient enriched biscuits (also known asHigh Energy Biscuits) or a hot meal. In addition, to reduce the gender gap in schooling in areaswhere female enrollment is low, WFP distributed a take-home ration of vegetable oil to 600,000girl students as an incentive to their families to send the girls to schools.
FFE is considered to have an important role in strengthening enrollment in primary schools,particularly among girls. Comparison between FFE beneficiary and non-beneficiary schoolsshow positive effects in terms of narrowing gender gap, with FFE incentives being moresuccessful in enrolling girls at the entry level grades (WFP 2009). These positive effectsnotwithstanding, there were challenges associated with the exclusion of potentially eligibleparticipants from FFE programs due to complexity of targeting criteria. Over-crowding in FFE-schools was also noted as a key issue in some instances.
d) Food for Training
Food for Training (FFT) is designed to help the poor acquire functional literacy and vocationalskills. The ultimate objective of FFT is to improve economic and social prospects for vulnerablemembers of the community, particularly women. As part of this initiative, WFP has providedfood ration to over 500,000 participants since 2006. This includes 140,000 participants, mostlywomen, who were given food ration during 2010 to feed their families in return for theirparticipation in various training activities, including literacy, reproductive and child care, andother skills-building programs (such as handicraft production, carpentry, and plumbing). FFTalso includes food support for teachers’ training, mostly in rural parts. Overall, FFT hasprimarily focused on reaching to beneficiary groups in food insecure regions and has helpedensure participation in functional literacy and vocational training programs.
e) Health and Nutrition Components
WFP supports a number of health and nutrition activities, including assistance to TB patients,wheat flour fortification, and a newly launched Mother and Child Health and Nutrition
35 For example, FFE accounted for 30 percent of WFP’s total distribution in 2006-08, benefiting around 2.1 million childrenannually (see table 3-6 in Evaluation of Afghanistan-PRRO 104270, Office of Evaluations WFP, October 2009)
39
program36. Under its efforts to support national campaign against tuberculosis (TB), WFP isproviding a monthly ration to more than 20,000 patients as an incentive to complete their eight-month Direct Observational Treatment (DOT) course at clinics across the country. As a result,many positive outcomes have been witnessed over the years, including an increase in the numberof people seeking voluntary TB treatment, increased DOT coverage and an overall decrease inthe number of defaulters in terms treatment completion (WFP 2009).
Wheat flour fortification initiative aims to reduce deficiencies of iron and other micronutrientsamong vulnerable groups, particularly among women of child-bearing age. In 2010, eight millsacross Afghanistan were producing on average 250 metric tons of fortified wheat flour per day.The fortification involved adding vitamins and other essentials minerals to wheat flour. Initialassessments show that majority of fortified wheat consumers belong to urban lower and middle-income class (WFP 2009).
Mother and Child Health and Nutrition program aims to fight malnutrition among pregnantwomen, new mothers and children under the age of 5. Under this newly launched program, WFPprovides nutritious food to pregnant and nursing mothers to help survive pregnancy, whilechildren under the age of 5 are given a special nutritional past to avoid long-term consequencesof poor nutrition. In 2011, WFP aims to increase the outreach of the program by providingnutritional support to around 55,000 women (pregnant and nursing mothers) and 62,000 children.
36 De-worming initiative has been another notable activity under the health and nutrition component. The initiative aims toaddress high levels of worm infestation among school going children (see WFP 2009 for more details).
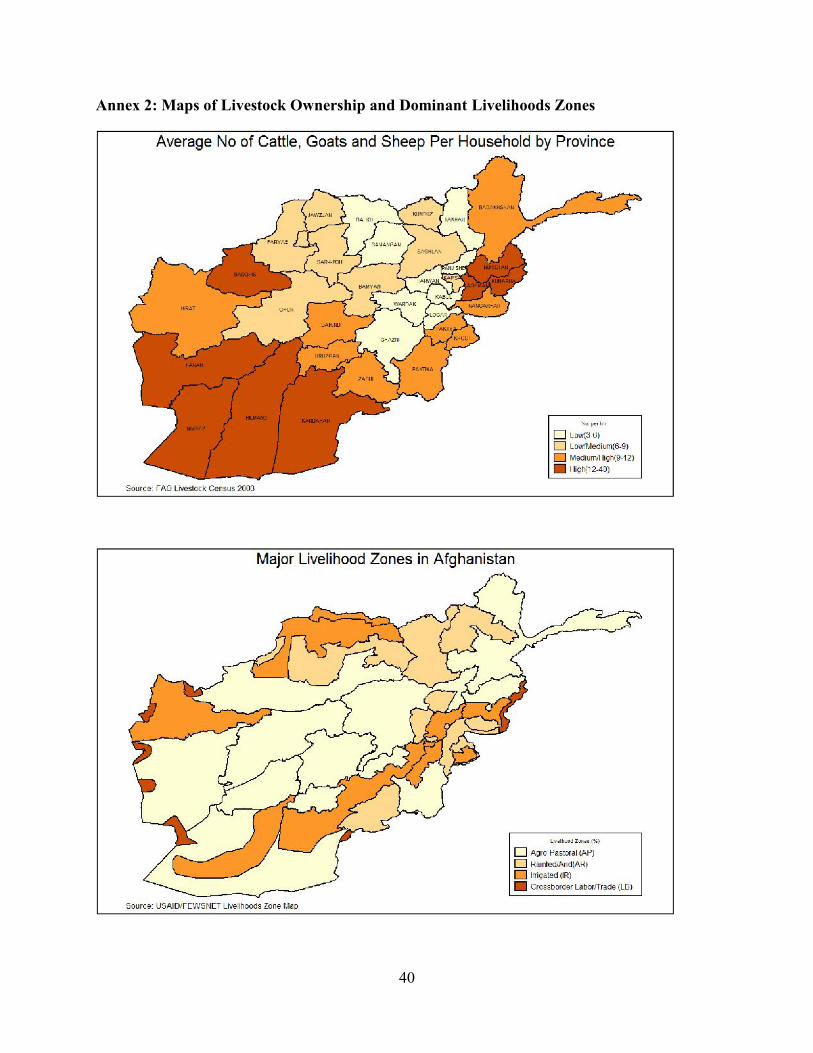
40
Annex 2: Maps of Livestock Ownership and Dominant Livelihoods Zones
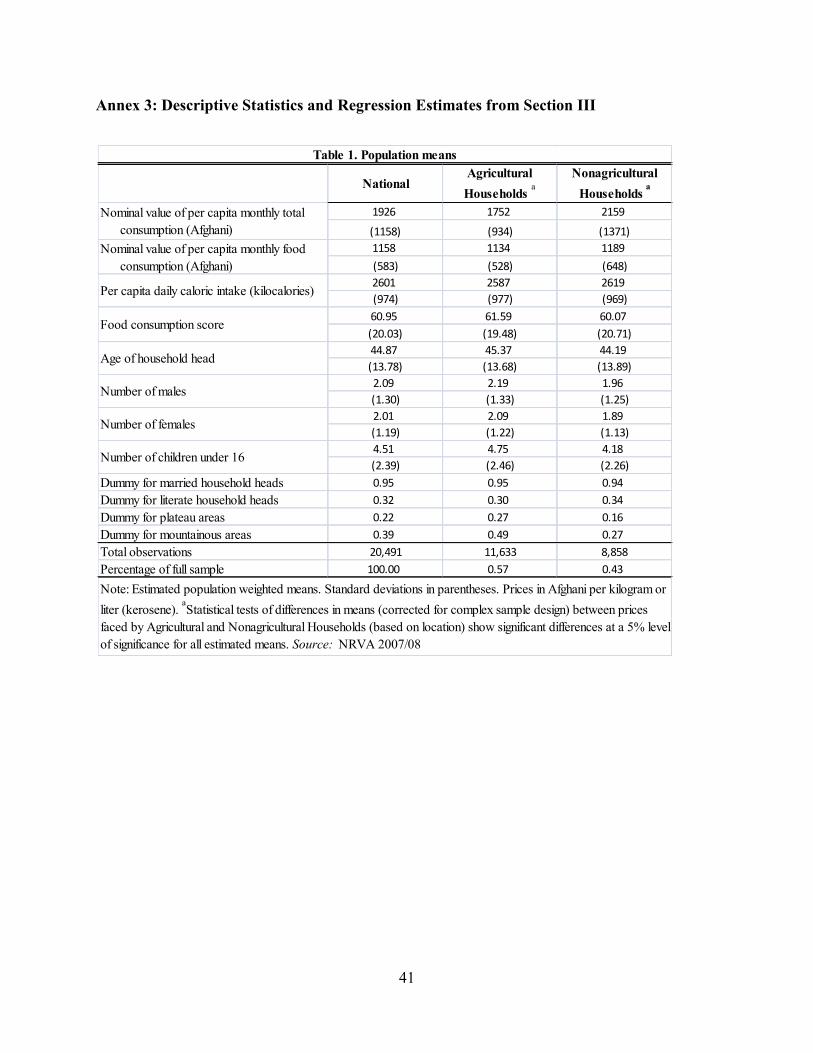
41
Annex 3: Descriptive Statistics and Regression Estimates from Section III
NationalAgriculturalHouseholds a
NonagriculturalHouseholds a
1926 1752 2159
(1158) (934) (1371)1158 1134 1189(583) (528) (648)2601 2587 2619(974) (977) (969)60.95 61.59 60.07(20.03) (19.48) (20.71)44.87 45.37 44.19(13.78) (13.68) (13.89)2.09 2.19 1.96(1.30) (1.33) (1.25)2.01 2.09 1.89(1.19) (1.22) (1.13)4.51 4.75 4.18(2.39) (2.46) (2.26)
Dummy for married household heads 0.95 0.95 0.94Dummy for literate household heads 0.32 0.30 0.34Dummy for plateau areas 0.22 0.27 0.16Dummy for mountainous areas 0.39 0.49 0.27Total observations 20,491 11,633 8,858Percentage of full sample 100.00 0.57 0.43
Table 1. Population means
Note: Estimated population weighted means. Standard deviations in parentheses. Prices in Afghani per kilogram orliter (kerosene). aStatistical tests of differences in means (corrected for complex sample design) between pricesfaced by Agricultural and Nonagricultural Households (based on location) show significant differences at a 5% levelof significance for all estimated means. Source: NRVA 2007/08
Nominal value of per capita monthly total consumption (Afghani)Nominal value of per capita monthly food consumption (Afghani)
Per capita daily caloric intake (kilocalories)
Food consumption score
Age of household head
Number of males
Number of females
Number of children under 16
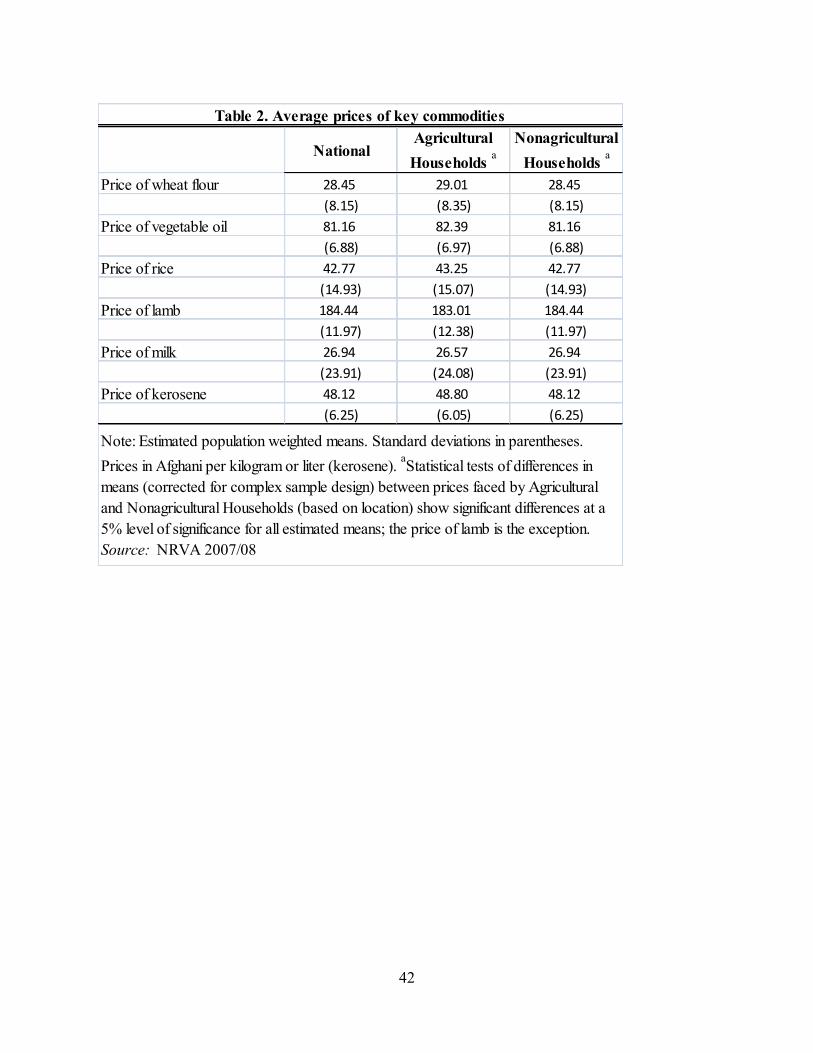
42
NationalAgriculturalHouseholds a
NonagriculturalHouseholds a
Price of wheat flour 28.45 29.01 28.45(8.15) (8.35) (8.15)
Price of vegetable oil 81.16 82.39 81.16(6.88) (6.97) (6.88)
Price of rice 42.77 43.25 42.77(14.93) (15.07) (14.93)
Price of lamb 184.44 183.01 184.44(11.97) (12.38) (11.97)
Price of milk 26.94 26.57 26.94(23.91) (24.08) (23.91)
Price of kerosene 48.12 48.80 48.12(6.25) (6.05) (6.25)
Table 2. Average prices of key commodities
Note: Estimated population weighted means. Standard deviations in parentheses.Prices in Afghani per kilogram or liter (kerosene). aStatistical tests of differences inmeans (corrected for complex sample design) between prices faced by Agriculturaland Nonagricultural Households (based on location) show significant differences at a5% level of significance for all estimated means; the price of lamb is the exception.Source: NRVA 2007/08
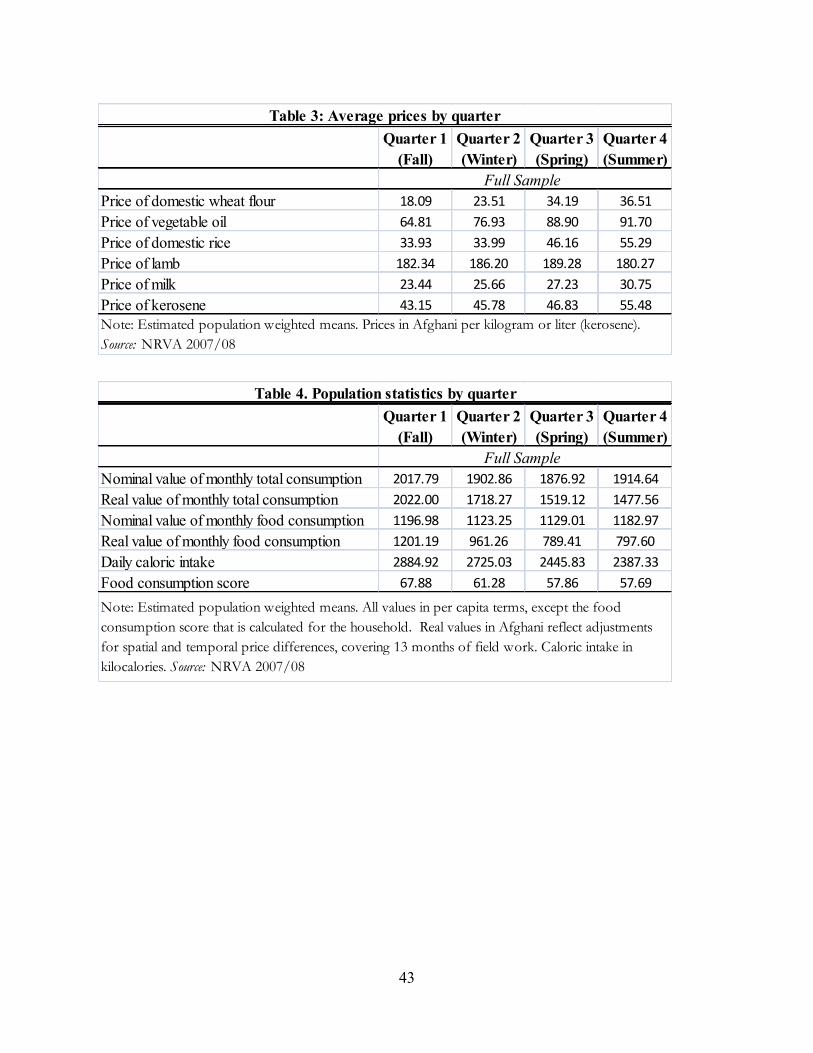
43
Quarter 1(Fall)
Quarter 2(Winter)
Quarter 3(Spring)
Quarter 4(Summer)
Price of domestic wheat flour 18.09 23.51 34.19 36.51Price of vegetable oil 64.81 76.93 88.90 91.70Price of domestic rice 33.93 33.99 46.16 55.29Price of lamb 182.34 186.20 189.28 180.27Price of milk 23.44 25.66 27.23 30.75Price of kerosene 43.15 45.78 46.83 55.48
Table 3: Average prices by quarter
Full Sample
Note: Estimated population weighted means. Prices in Afghani per kilogram or liter (kerosene).Source: NRVA 2007/08
Quarter 1(Fall)
Quarter 2(Winter)
Quarter 3(Spring)
Quarter 4(Summer)
Nominal value of monthly total consumption 2017.79 1902.86 1876.92 1914.64Real value of monthly total consumption 2022.00 1718.27 1519.12 1477.56Nominal value of monthly food consumption 1196.98 1123.25 1129.01 1182.97Real value of monthly food consumption 1201.19 961.26 789.41 797.60Daily caloric intake 2884.92 2725.03 2445.83 2387.33Food consumption score 67.88 61.28 57.86 57.69
Table 4. Population statistics by quarter
Full Sample
Note: Estimated population weighted means. All values in per capita terms, except the foodconsumption score that is calculated for the household. Real values in Afghani reflect adjustmentsfor spatial and temporal price differences, covering 13 months of field work. Caloric intake inkilocalories. Source: NRVA 2007/08
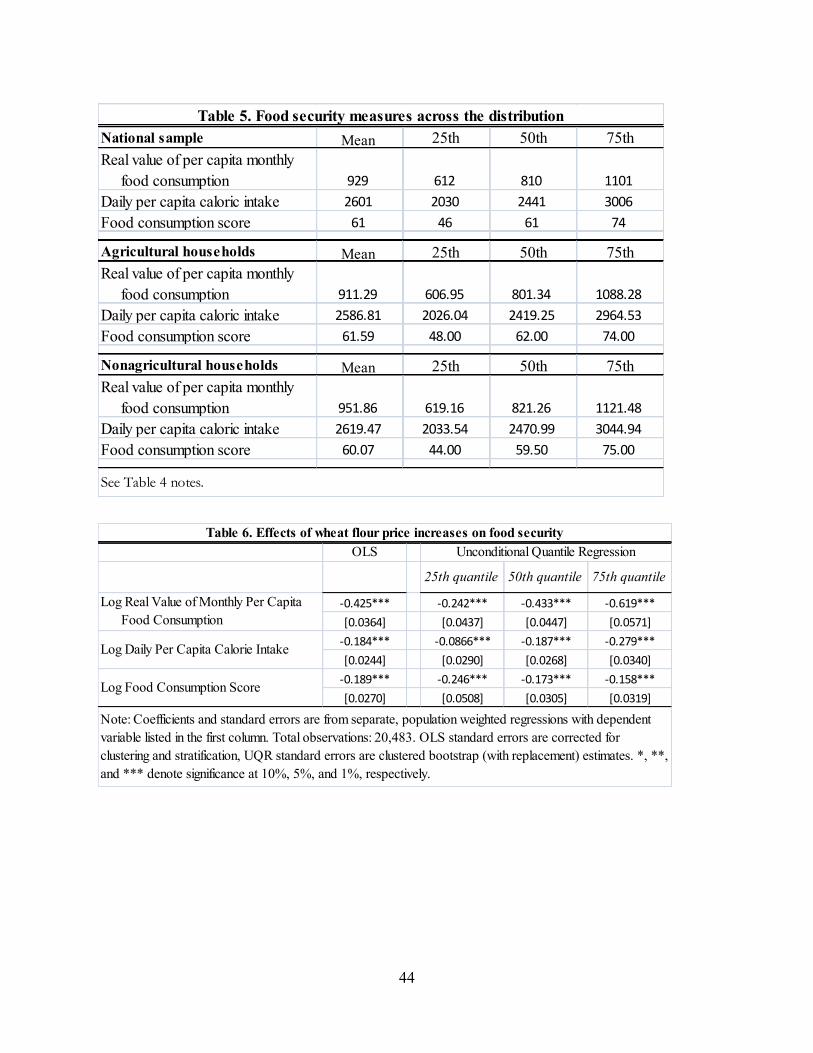
44
National sample Mean 25th 50th 75thReal value of per capita monthly food consumption 929 612 810 1101Daily per capita caloric intake 2601 2030 2441 3006Food consumption score 61 46 61 74
Agricultural households Mean 25th 50th 75thReal value of per capita monthly food consumption 911.29 606.95 801.34 1088.28Daily per capita caloric intake 2586.81 2026.04 2419.25 2964.53Food consumption score 61.59 48.00 62.00 74.00
Nonagricultural households Mean 25th 50th 75thReal value of per capita monthly food consumption 951.86 619.16 821.26 1121.48Daily per capita caloric intake 2619.47 2033.54 2470.99 3044.94Food consumption score 60.07 44.00 59.50 75.00
Table 5. Food security measures across the distribution
See Table 4 notes.
OLS
25th quantile 50th quantile 75th quantile
-0.425*** -0.242*** -0.433*** -0.619***[0.0364] [0.0437] [0.0447] [0.0571]-0.184*** -0.0866*** -0.187*** -0.279***[0.0244] [0.0290] [0.0268] [0.0340]-0.189*** -0.246*** -0.173*** -0.158***[0.0270] [0.0508] [0.0305] [0.0319]
Table 6. Effects of wheat flour price increases on food securityUnconditional Quantile Regression
Note: Coefficients and standard errors are from separate, population weighted regressions with dependentvariable listed in the first column. Total observations: 20,483. OLS standard errors are corrected forclustering and stratification, UQR standard errors are clustered bootstrap (with replacement) estimates. *, **,and *** denote significance at 10%, 5%, and 1%, respectively.
Log Real Value of Monthly Per Capita Food Consumption
Log Daily Per Capita Calorie Intake
Log Food Consumption Score
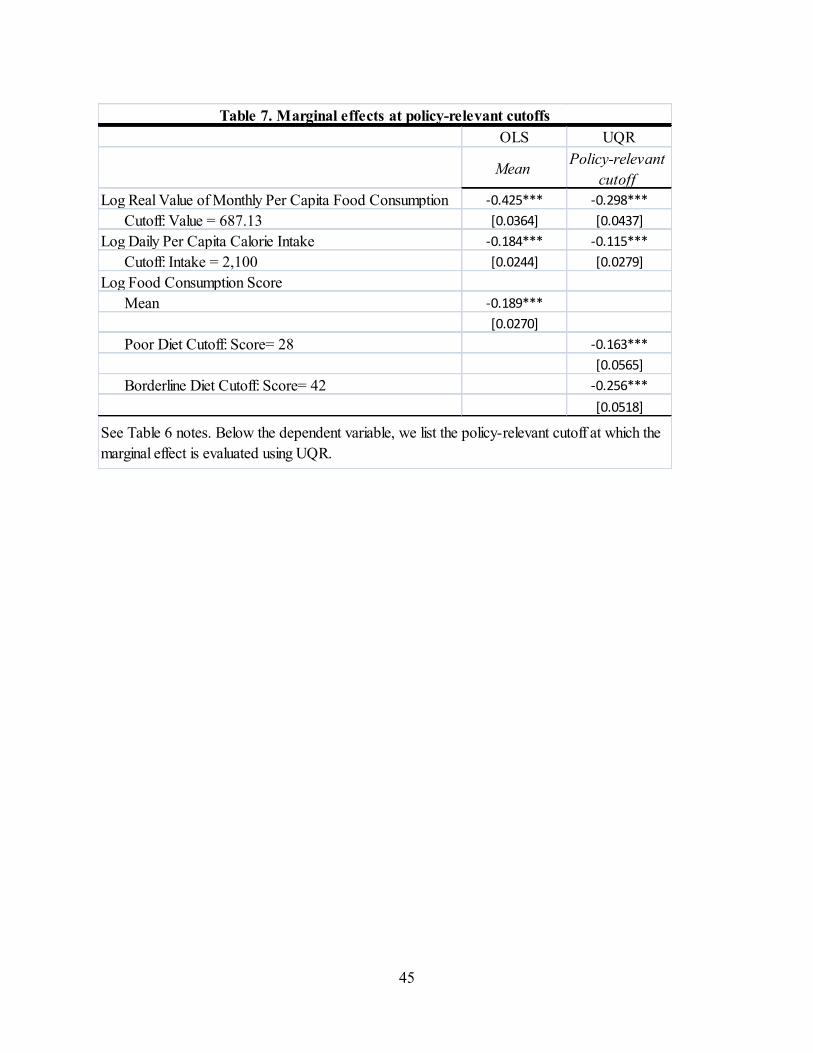
45
OLS UQR
Mean Policy-relevantcutoff
Log Real Value of Monthly Per Capita Food Consumption -0.425*** -0.298*** Cutoff: Value = 687.13 [0.0364] [0.0437]Log Daily Per Capita Calorie Intake -0.184*** -0.115*** Cutoff: Intake = 2,100 [0.0244] [0.0279]Log Food Consumption Score Mean -0.189***
[0.0270] Poor Diet Cutoff: Score= 28 -0.163***
[0.0565] Borderline Diet Cutoff: Score= 42 -0.256***
[0.0518]
Table 7. Marginal effects at policy-relevant cutoffs
See Table 6 notes. Below the dependent variable, we list the policy-relevant cutoff at which themarginal effect is evaluated using UQR.
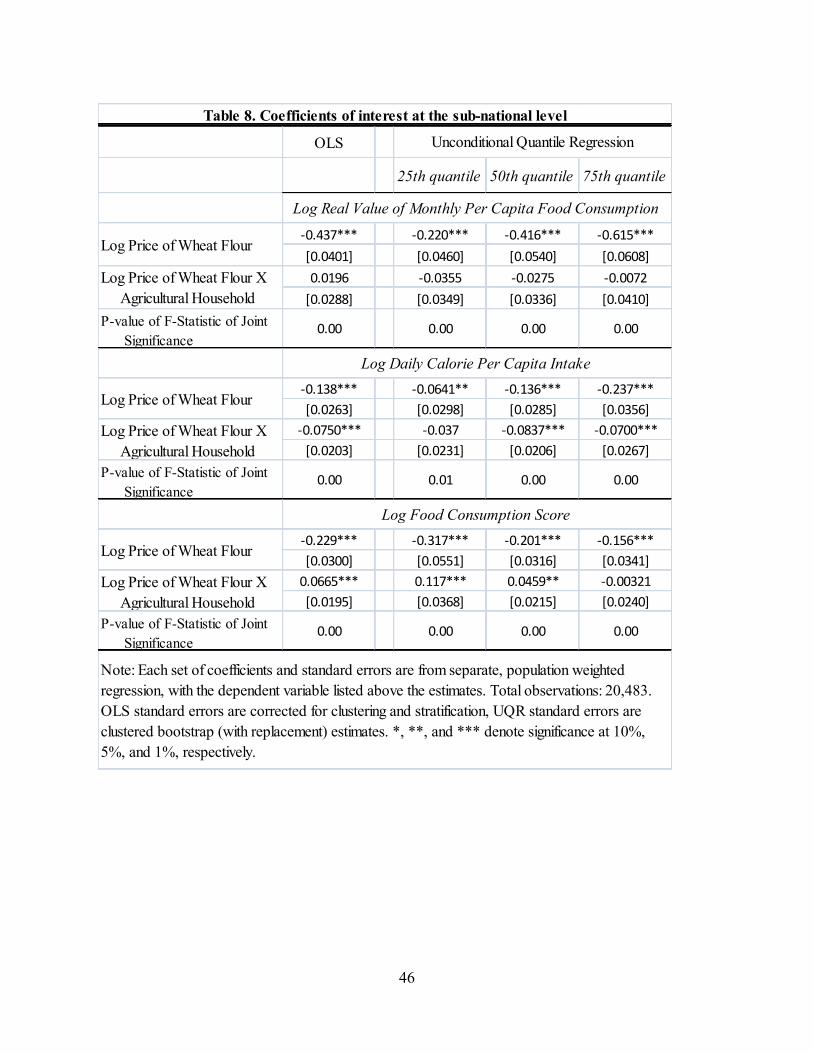
46
OLS
25th quantile 50th quantile 75th quantile
-0.437*** -0.220*** -0.416*** -0.615***[0.0401] [0.0460] [0.0540] [0.0608]0.0196 -0.0355 -0.0275 -0.0072[0.0288] [0.0349] [0.0336] [0.0410]
P-value of F-Statistic of Joint Significance
0.00 0.00 0.00 0.00
-0.138*** -0.0641** -0.136*** -0.237***[0.0263] [0.0298] [0.0285] [0.0356]-0.0750*** -0.037 -0.0837*** -0.0700***[0.0203] [0.0231] [0.0206] [0.0267]
P-value of F-Statistic of Joint Significance
0.00 0.01 0.00 0.00
-0.229*** -0.317*** -0.201*** -0.156***[0.0300] [0.0551] [0.0316] [0.0341]0.0665*** 0.117*** 0.0459** -0.00321[0.0195] [0.0368] [0.0215] [0.0240]
P-value of F-Statistic of Joint Significance
0.00 0.00 0.00 0.00
Note: Each set of coefficients and standard errors are from separate, population weightedregression, with the dependent variable listed above the estimates. Total observations: 20,483.OLS standard errors are corrected for clustering and stratification, UQR standard errors areclustered bootstrap (with replacement) estimates. *, **, and *** denote significance at 10%,5%, and 1%, respectively.
Log Price of Wheat Flour
Log Price of Wheat Flour X Agricultural Household
Log Price of Wheat Flour
Log Price of Wheat Flour X Agricultural Household
Log Food Consumption Score
Log Price of Wheat Flour X Agricultural Household
Log Daily Calorie Per Capita Intake
Table 8. Coefficients of interest at the sub-national level
Unconditional Quantile Regression
Log Real Value of Monthly Per Capita Food Consumption
Log Price of Wheat Flour
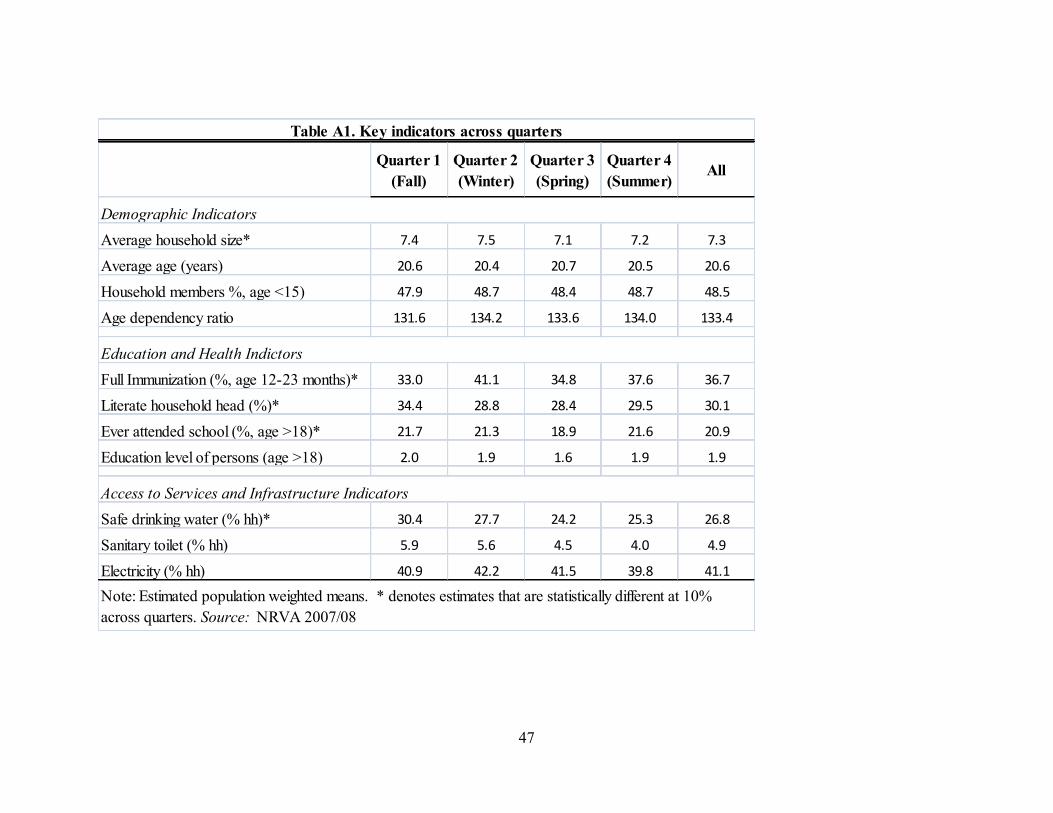
47
Quarter 1(Fall)
Quarter 2(Winter)
Quarter 3(Spring)
Quarter 4(Summer)
All
Average household size* 7.4 7.5 7.1 7.2 7.3
Average age (years) 20.6 20.4 20.7 20.5 20.6
Household members %, age <15) 47.9 48.7 48.4 48.7 48.5
Age dependency ratio 131.6 134.2 133.6 134.0 133.4
Full Immunization (%, age 12-23 months)* 33.0 41.1 34.8 37.6 36.7
Literate household head (%)* 34.4 28.8 28.4 29.5 30.1
Ever attended school (%, age >18)* 21.7 21.3 18.9 21.6 20.9
Education level of persons (age >18) 2.0 1.9 1.6 1.9 1.9
Safe drinking water (% hh)* 30.4 27.7 24.2 25.3 26.8
Sanitary toilet (% hh) 5.9 5.6 4.5 4.0 4.9
Electricity (% hh) 40.9 42.2 41.5 39.8 41.1
Note: Estimated population weighted means. * denotes estimates that are statistically different at 10%across quarters. Source: NRVA 2007/08
Table A1. Key indicators across quarters
Access to Services and Infrastructure Indicators
Education and Health Indictors
Demographic Indicators
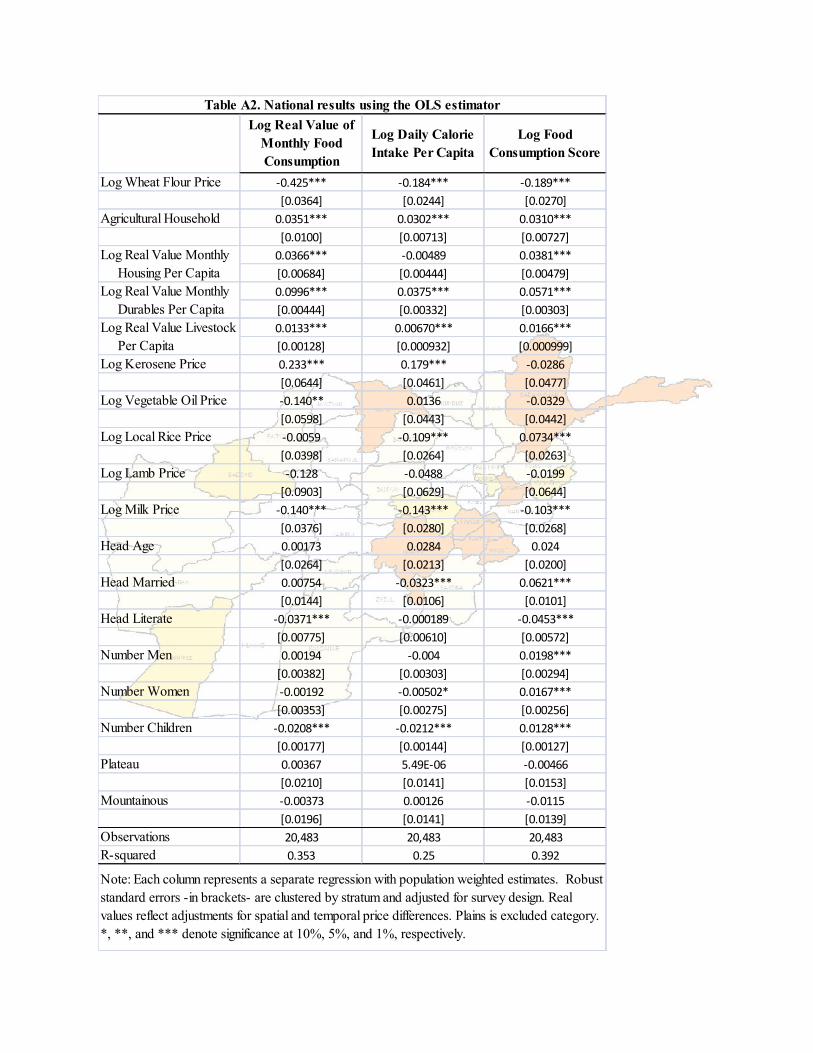
Log Real Value ofMonthly FoodConsumption
Log Daily CalorieIntake Per Capita
Log FoodConsumption Score
Log Wheat Flour Price -0.425*** -0.184*** -0.189***[0.0364] [0.0244] [0.0270]
Agricultural Household 0.0351*** 0.0302*** 0.0310***[0.0100] [0.00713] [0.00727]0.0366*** -0.00489 0.0381***[0.00684] [0.00444] [0.00479]0.0996*** 0.0375*** 0.0571***[0.00444] [0.00332] [0.00303]0.0133*** 0.00670*** 0.0166***[0.00128] [0.000932] [0.000999]
Log Kerosene Price 0.233*** 0.179*** -0.0286[0.0644] [0.0461] [0.0477]
Log Vegetable Oil Price -0.140** 0.0136 -0.0329[0.0598] [0.0443] [0.0442]
Log Local Rice Price -0.0059 -0.109*** 0.0734***[0.0398] [0.0264] [0.0263]
Log Lamb Price -0.128 -0.0488 -0.0199[0.0903] [0.0629] [0.0644]
Log Milk Price -0.140*** -0.143*** -0.103***[0.0376] [0.0280] [0.0268]
Head Age 0.00173 0.0284 0.024[0.0264] [0.0213] [0.0200]
Head Married 0.00754 -0.0323*** 0.0621***[0.0144] [0.0106] [0.0101]
Head Literate -0.0371*** -0.000189 -0.0453***[0.00775] [0.00610] [0.00572]
Number Men 0.00194 -0.004 0.0198***[0.00382] [0.00303] [0.00294]
Number Women -0.00192 -0.00502* 0.0167***[0.00353] [0.00275] [0.00256]
Number Children -0.0208*** -0.0212*** 0.0128***[0.00177] [0.00144] [0.00127]
Plateau 0.00367 5.49E-06 -0.00466[0.0210] [0.0141] [0.0153]
Mountainous -0.00373 0.00126 -0.0115[0.0196] [0.0141] [0.0139]
Observations 20,483 20,483 20,483R-squared 0.353 0.25 0.392
Table A2. National results using the OLS estimator
Note: Each column represents a separate regression with population weighted estimates. Robuststandard errors -in brackets- are clustered by stratum and adjusted for survey design. Realvalues reflect adjustments for spatial and temporal price differences. Plains is excluded category.*, **, and *** denote significance at 10%, 5%, and 1%, respectively.
Log Real Value Monthly Housing Per CapitaLog Real Value Monthly Durables Per CapitaLog Real Value Livestock Per Capita
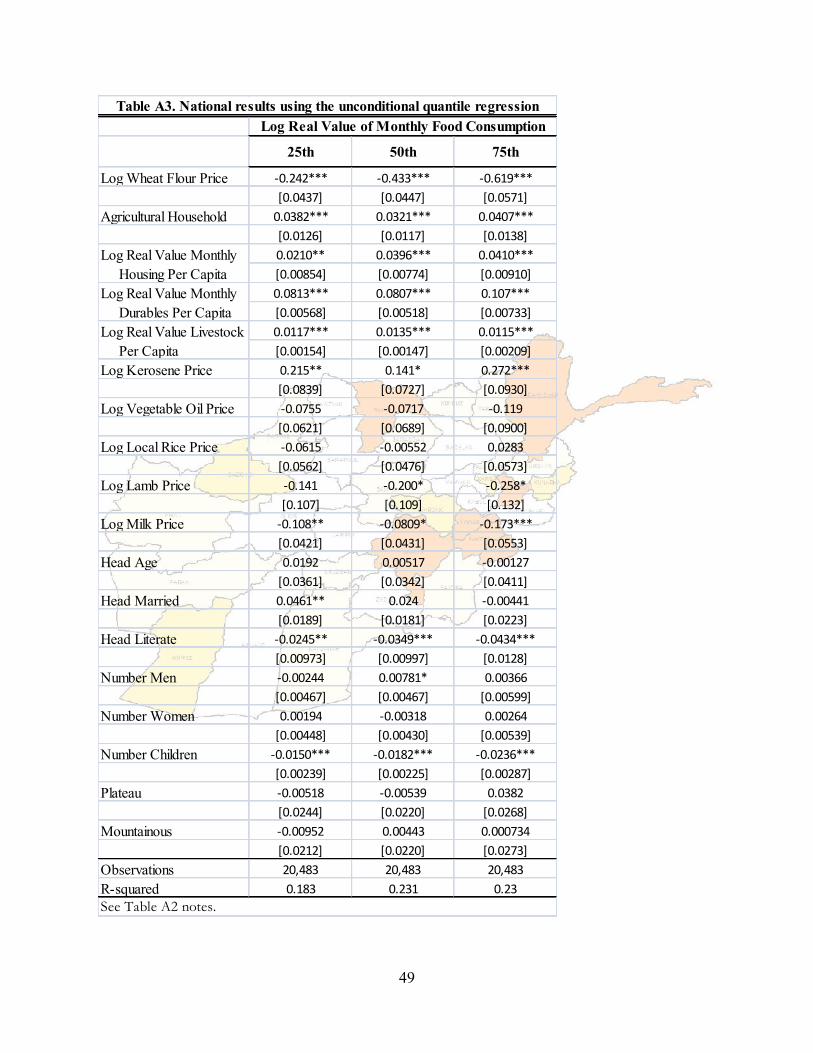
49
25th 50th 75th
Log Wheat Flour Price -0.242*** -0.433*** -0.619***[0.0437] [0.0447] [0.0571]
Agricultural Household 0.0382*** 0.0321*** 0.0407***[0.0126] [0.0117] [0.0138]0.0210** 0.0396*** 0.0410***[0.00854] [0.00774] [0.00910]0.0813*** 0.0807*** 0.107***[0.00568] [0.00518] [0.00733]0.0117*** 0.0135*** 0.0115***[0.00154] [0.00147] [0.00209]
Log Kerosene Price 0.215** 0.141* 0.272***[0.0839] [0.0727] [0.0930]
Log Vegetable Oil Price -0.0755 -0.0717 -0.119[0.0621] [0.0689] [0.0900]
Log Local Rice Price -0.0615 -0.00552 0.0283[0.0562] [0.0476] [0.0573]
Log Lamb Price -0.141 -0.200* -0.258*[0.107] [0.109] [0.132]
Log Milk Price -0.108** -0.0809* -0.173***[0.0421] [0.0431] [0.0553]
Head Age 0.0192 0.00517 -0.00127[0.0361] [0.0342] [0.0411]
Head Married 0.0461** 0.024 -0.00441[0.0189] [0.0181] [0.0223]
Head Literate -0.0245** -0.0349*** -0.0434***[0.00973] [0.00997] [0.0128]
Number Men -0.00244 0.00781* 0.00366[0.00467] [0.00467] [0.00599]
Number Women 0.00194 -0.00318 0.00264[0.00448] [0.00430] [0.00539]
Number Children -0.0150*** -0.0182*** -0.0236***[0.00239] [0.00225] [0.00287]
Plateau -0.00518 -0.00539 0.0382[0.0244] [0.0220] [0.0268]
Mountainous -0.00952 0.00443 0.000734[0.0212] [0.0220] [0.0273]
Observations 20,483 20,483 20,483R-squared 0.183 0.231 0.23See Table A2 notes.
Table A3. National results using the unconditional quantile regressionLog Real Value of Monthly Food Consumption
Log Real Value Monthly Housing Per CapitaLog Real Value Monthly Durables Per CapitaLog Real Value Livestock Per Capita
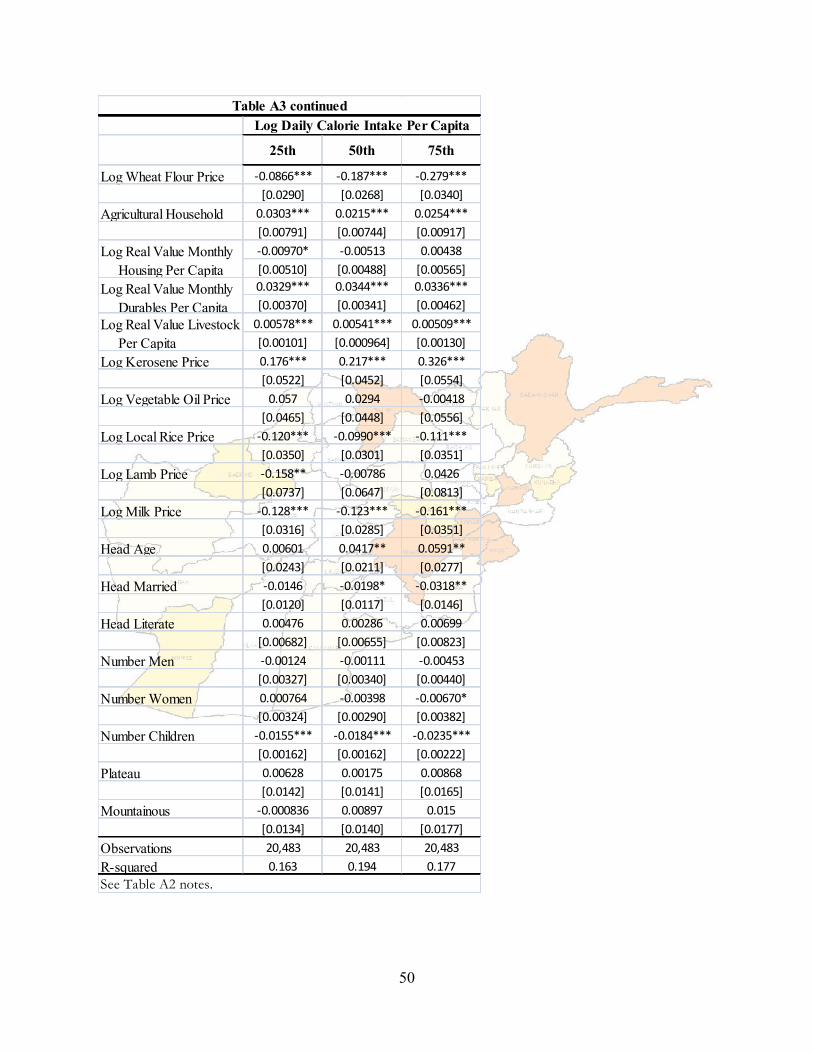
50
25th 50th 75th
Log Wheat Flour Price -0.0866*** -0.187*** -0.279***[0.0290] [0.0268] [0.0340]
Agricultural Household 0.0303*** 0.0215*** 0.0254***[0.00791] [0.00744] [0.00917]-0.00970* -0.00513 0.00438[0.00510] [0.00488] [0.00565]0.0329*** 0.0344*** 0.0336***[0.00370] [0.00341] [0.00462]0.00578*** 0.00541*** 0.00509***[0.00101] [0.000964] [0.00130]
Log Kerosene Price 0.176*** 0.217*** 0.326***[0.0522] [0.0452] [0.0554]
Log Vegetable Oil Price 0.057 0.0294 -0.00418[0.0465] [0.0448] [0.0556]
Log Local Rice Price -0.120*** -0.0990*** -0.111***[0.0350] [0.0301] [0.0351]
Log Lamb Price -0.158** -0.00786 0.0426[0.0737] [0.0647] [0.0813]
Log Milk Price -0.128*** -0.123*** -0.161***[0.0316] [0.0285] [0.0351]
Head Age 0.00601 0.0417** 0.0591**[0.0243] [0.0211] [0.0277]
Head Married -0.0146 -0.0198* -0.0318**[0.0120] [0.0117] [0.0146]
Head Literate 0.00476 0.00286 0.00699[0.00682] [0.00655] [0.00823]
Number Men -0.00124 -0.00111 -0.00453[0.00327] [0.00340] [0.00440]
Number Women 0.000764 -0.00398 -0.00670*[0.00324] [0.00290] [0.00382]
Number Children -0.0155*** -0.0184*** -0.0235***[0.00162] [0.00162] [0.00222]
Plateau 0.00628 0.00175 0.00868[0.0142] [0.0141] [0.0165]
Mountainous -0.000836 0.00897 0.015[0.0134] [0.0140] [0.0177]
Observations 20,483 20,483 20,483R-squared 0.163 0.194 0.177
Table A3 continuedLog Daily Calorie Intake Per Capita
See Table A2 notes.
Log Real Value Monthly Housing Per CapitaLog Real Value Monthly Durables Per CapitaLog Real Value Livestock Per Capita
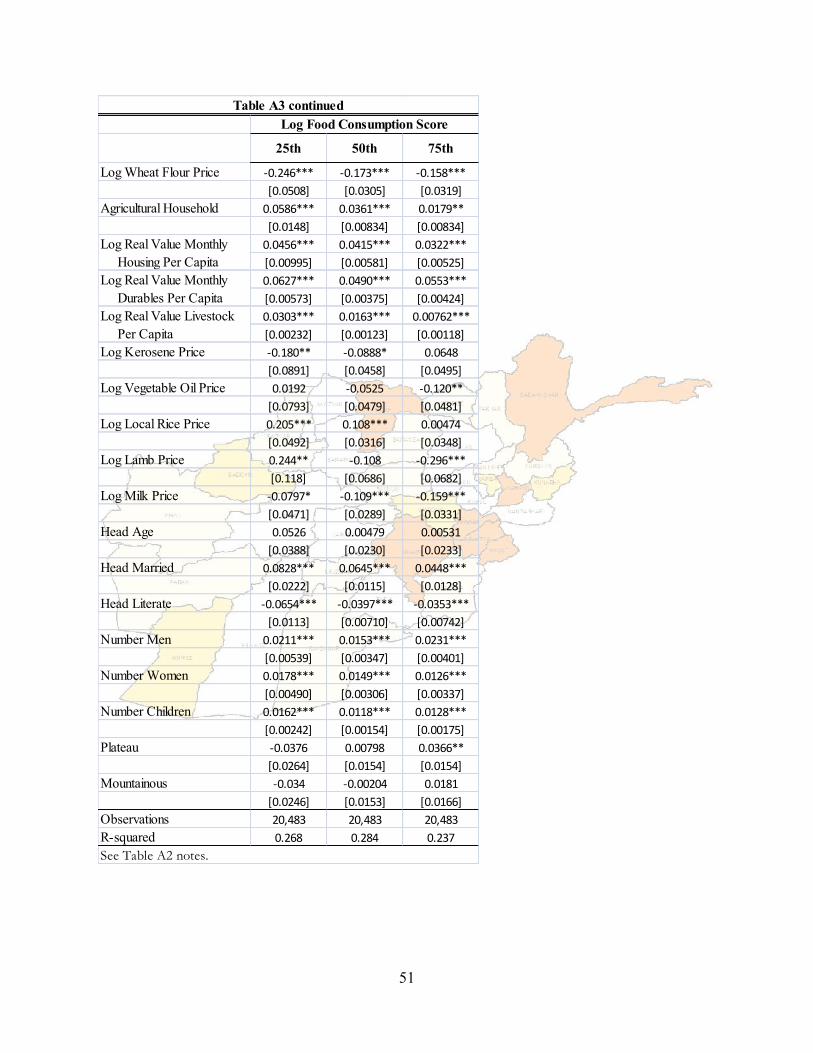
51
25th 50th 75th
Log Wheat Flour Price -0.246*** -0.173*** -0.158***[0.0508] [0.0305] [0.0319]
Agricultural Household 0.0586*** 0.0361*** 0.0179**[0.0148] [0.00834] [0.00834]0.0456*** 0.0415*** 0.0322***[0.00995] [0.00581] [0.00525]0.0627*** 0.0490*** 0.0553***[0.00573] [0.00375] [0.00424]0.0303*** 0.0163*** 0.00762***[0.00232] [0.00123] [0.00118]
Log Kerosene Price -0.180** -0.0888* 0.0648[0.0891] [0.0458] [0.0495]
Log Vegetable Oil Price 0.0192 -0.0525 -0.120**[0.0793] [0.0479] [0.0481]
Log Local Rice Price 0.205*** 0.108*** 0.00474[0.0492] [0.0316] [0.0348]
Log Lamb Price 0.244** -0.108 -0.296***[0.118] [0.0686] [0.0682]
Log Milk Price -0.0797* -0.109*** -0.159***[0.0471] [0.0289] [0.0331]
Head Age 0.0526 0.00479 0.00531[0.0388] [0.0230] [0.0233]
Head Married 0.0828*** 0.0645*** 0.0448***[0.0222] [0.0115] [0.0128]
Head Literate -0.0654*** -0.0397*** -0.0353***[0.0113] [0.00710] [0.00742]
Number Men 0.0211*** 0.0153*** 0.0231***[0.00539] [0.00347] [0.00401]
Number Women 0.0178*** 0.0149*** 0.0126***[0.00490] [0.00306] [0.00337]
Number Children 0.0162*** 0.0118*** 0.0128***[0.00242] [0.00154] [0.00175]
Plateau -0.0376 0.00798 0.0366**[0.0264] [0.0154] [0.0154]
Mountainous -0.034 -0.00204 0.0181[0.0246] [0.0153] [0.0166]
Observations 20,483 20,483 20,483R-squared 0.268 0.284 0.237
Table A3 continuedLog Food Consumption Score
See Table A2 notes.
Log Real Value Monthly Housing Per CapitaLog Real Value Monthly Durables Per CapitaLog Real Value Livestock Per Capita