Embed Size (px)
Citation preview
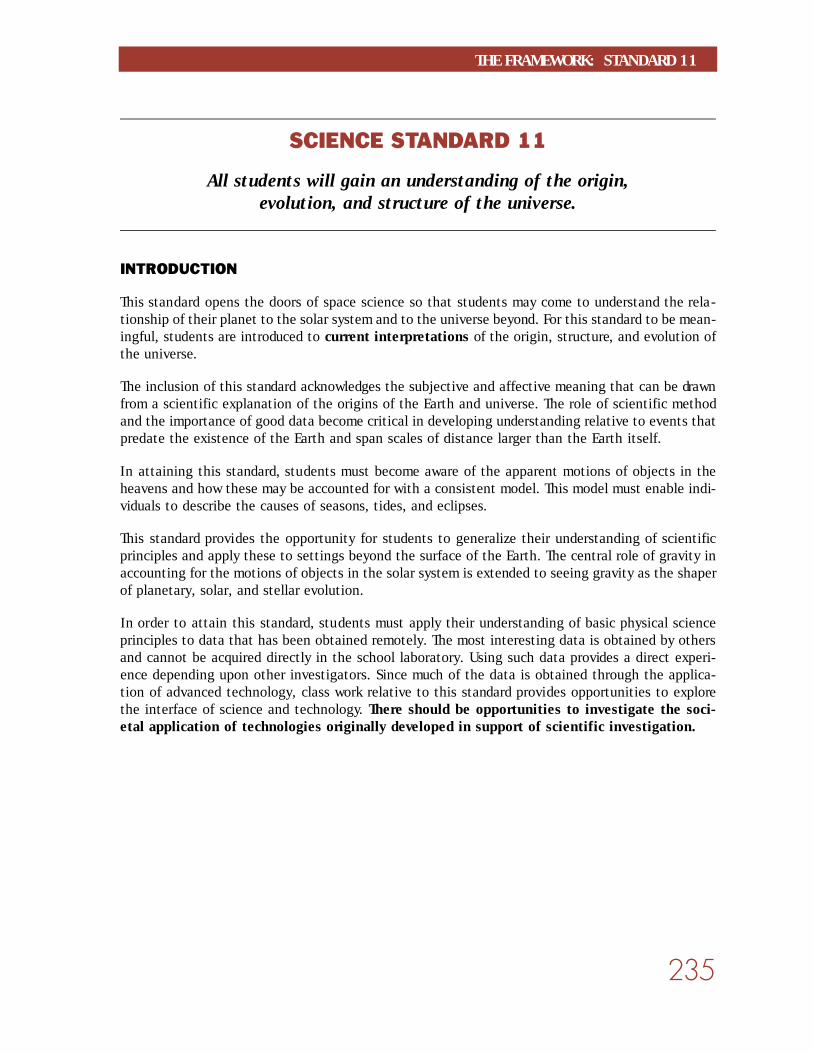
All students will gain an understanding of the origin,evolution, and structure of the universe.
This standard opens the doors of space science so that students may come to understand the rela-tionship of their planet to the solar system and to the universe beyond. For this standard to be mean-ingful, students are introduced to current interpretations of the origin, structure, and evolution ofthe universe.
The inclusion of this standard acknowledges the subjective and affective meaning that can be drawnfrom a scientific explanation of the origins of the Earth and universe. The role of scientific methodand the importance of good data become critical in developing understanding relative to events thatpredate the existence of the Earth and span scales of distance larger than the Earth itself.
In attaining this standard, students must become aware of the apparent motions of objects in theheavens and how these may be accounted for with a consistent model. This model must enable indi-viduals to describe the causes of seasons, tides, and eclipses.
This standard provides the opportunity for students to generalize their understanding of scientificprinciples and apply these to settings beyond the surface of the Earth. The central role of gravity inaccounting for the motions of objects in the solar system is extended to seeing gravity as the shaperof planetary, solar, and stellar evolution.
In order to attain this standard, students must apply their understanding of basic physical scienceprinciples to data that has been obtained remotely. The most interesting data is obtained by othersand cannot be acquired directly in the school laboratory. Using such data provides a direct experi-ence depending upon other investigators. Since much of the data is obtained through the applica-tion of advanced technology, class work relative to this standard provides opportunities to explorethe interface of science and technology. There should be opportunities to investigate the soci-etal application of technologies originally developed in support of scientific investigation.
THE FRAMEWORK: STANDARD 11
Young children must be guided in careful observation of the apparent motion of objects in the sky.Their growing awareness of direction, points of the compass, and location needs to be associatedwith the rising and setting of the sun and moon. Before grade 4, students can observe the phasesof the moon to find the pattern of the moon’s apparent shape and location in the sky. The need forand development of a model to account for the apparent motions can flow naturally from studentawareness of celestial phenomena.
It is important that students have an opportunity to relate observations, or data, to the standardmodel of the solar system. The relative positions and sizes of the planets should be part of each stu-dent’s understanding in the sense that the student knows where to find this information and knowshow it was obtained by scientists. The on-going space science investigations supported by NASA area source of current information that enable teachers to make the standard model as relevant as astate highway map.
Middle-school students begin to acquire a range of scientific understandings that can be applied tomaking sense of the data used by astronomers and space scientists. High-quality visual spectrumimages are only a part of the data that has revolutionized our understanding of the solar system andof the universe. By grade 8, students can begin to examine the quantitative descriptions of gravityand of the other forces that space scientists take into account as they examine data from Earth-basedand space probe sources.
After grade 8, instruction must be planned to help students understand the process of developingconsistent explanations for observations of the solar system and the world. This planning must allowfor students to develop usable concepts of gravity, magnetic fields, and electromagnetic spectra.Students must be allowed enough time and experience to make these fundamental concepts theirown. Then they will successfully apply these in contexts such as relating stellar spectra to modelsfor stellar and cosmic evolution. Students in high school will also begin to examine the issue of costsversus benefits when doing large-scale, technology-supported science such as that required inastronomy and the space sciences.
The study of science should include a study of the planet Earth and its relationship to the rest of theuniverse. This standard describes what students should know about the composition of the Earth andthe forces that shape it, while Science Standard 11 describes what students should know aboutastronomy and space science.
CHAPTER 8
NEW JERSEY SCIENCE CURRICULUM FRAMEWORK
By the end of Grade 4, students
1. Observe and identify objects and their apparent motion in the day and night sky.
2. Relate the motions of the earth-sun-moon system to units of time (days, months, seasons,years).
3. Construct a model of the solar system.
Building upon knowledge and skills gained in the preceding grades,by the end of Grade 8, students
4. Describe the physical characteristics of the components of the solar system, and comparethe earth to other planets.
5. Explain how naturally occurring events on earth are related to the positions of the sun,earth, and moon.
6. Describe the technologies used to explore the universe.
Building upon knowledge and skills gained in the preceding grades,by the end of Grade 12, students
7. Construct a model that accounts for variation in the length of day and night.
8. Evaluate evidence that supports scientific theories of the origin of the universe.
9. Analyze benefits generated by the technology of space exploration.
THE FRAMEWORK: STANDARD 11
Objects in the Day and Night Sky Connect the StarsShadow Persons Shadow Sticks
Moon Journals
Day and Night Four Seasons: A Tropical YearFlowerpot Clock Sun Domes
Angle of the Sun’s RaysSeasons and Length of Day
The Solar System in the Gym Mission to MarsDay and Night Sky Distances in the Solar System Model
Scale Model of Earth/Moon VolumesWalk through the Solar System
Inner and Outer Planets Comparing Distances and SizesPlanet Atmospheres Impact CratersPlanet Gravities Planet Sorting
The Creature Feature
CHAPTER 8
NEW JERSEY SCIENCE CURRICULUM FRAMEWORK
Modeling Events A Mathematical Model of EclipsesTides Tide Tables
Build Your Own Telescopes Radio AstronomySpace Shuttle Simulation Probe Data
Pictures from Space
Sunlight and the EarthEstimating Day and Night
Big BangExpanding UniverseStellar Evolution
Cost-Benefit AnalysisCourtroom Drama
THE FRAMEWORK: STANDARD 11
Indicator 1: Observe and identify objects and their apparent motion in the day and night sky.
Objects in the Day and Night Sky. Demonstrate the concepts of sun, moon, and stars with visu-al aids such as big books, posters, and pictures. Students draw pictures of objects that they can seein the day sky and night sky. They also identify pictures and diagrams of these objects.
Afterwards, students put on a play in which classmates guess the answers to questions like “Whatam I?” and “Do you see me in the day or night?”
Related Science Standards: 1, 2Related Workplace Readiness Standards: 2.2, 2.8, 3.1-3.8, 3.15, 4.2, 5.7
Shadow Persons. Working in teams of two, students go out in the school yard to trace their shad-ows. One student stands facing south while his or her partner traces the resulting shadow on theasphalt or on a large piece of paper. The students return to the same spot several more times duringthe day, especially at noon. Each time they sketch the new shadows on the pavement. Students drawpictures of the sun’s position in the sky at the same time they observe their shadows. They answerquestions such as the following:
■ How did your shadow change?
■ Are any shadows on top of each other?
■ Where was the sun each time you sketched your shadow?
■ How did the sun’s position change?
■ Which of the shadows you drew was the shadow of local noon?
Post the students’ shadow persons in the school hallway.Related Science Standards: 1, 2Related Workplace Readiness Standards: 2.2, 2.8, 3.1-3.8, 3.15, 4.2, 5.7
CHAPTER 8
NEW JERSEY SCIENCE CURRICULUM FRAMEWORK
Connect the Stars. Give student groups pieces of paper with stars in various positions. The stu-dents connect the stars to make an object and write a story that tells how the object entered thesky. Student groups act out their stories about their constellations.
Next, students design constellation projectors using black construction paper and cardboard cylin-ders (such as oatmeal containers). They cut out black disks just a little larger than the end of thecylinder, punch holes to depict actual constellations, and tape these disks to one of the open endsof the tube. In a darkened room, students use flashlights to project their constellations on the class-room ceiling. As an extension activity, students punch holes outlining other objects. Classmates tryto guess each new constellation.
The ultimate extension would be to obtain a StarLab planetarium. StarLab is a large, inflatable plan-etarium that sets up in minutes. It can be obtained on loan from museums with outreach educationalprograms. Students crawl in and observe the night sky while appropriate music is played in the back-ground. They identify constellations discovered through their own projects. Students listen to mythsthat reflect how different cultures regard the constellations. Examples exist in the folklore ofEthiopia, China, Native America, etc. Students ultimately develop some form of report that summa-rizes their discoveries about constellations and accompanying folktales.
Related Science Standards: 1-4Related Workplace Readiness Standards: 2.2, 2.7, 3.1-3.8, 3.12, 4.2, 4.9, 5.7
Shadow Sticks. By following the steps below, students record the apparent motion of the sunacross the sky by tracing the shadow of a short, upright stick at regular intervals.
■ Facing magnetic north, they place a large sheet of paper on the ground in a location wherethe sun will shine all day.
■ They draw a box around the sheet so they can put the paper back in the same place eachtime they take a reading.
■ They secure a stick or straw in a clump of clay and place it midway along the edge of thepaper that faces south.
■ Then they trace a line around the shadow of the stick.
■ They label the time.
Students repeat the above procedure every hour (or at least three times) during the day.
They can repeat this activity twice during the week; once a week for several weeks; once a monthfor several months; or on astronomically important days, such as the fall and spring equinoxes or thewinter and summer solstices. If the students use sheets of clear acetate instead of paper, they canplace weekly, monthly, or seasonal readings on top of each other on the overhead projector and com-pare them.
THE FRAMEWORK: STANDARD 11
Students look for the relationship between the direction of the shadow and the location of the sun,patterns in the movement of the shadows from hour to hour, and the relationship between the timeof day and the length of the shadows. They examine the change in length during various one-hourintervals and also consider the changes in the direction of the angle during the day. They identifypatterns that emerge during long-term observations. Students plan how to organize their observa-tions so as to share them with students living at other latitudes. They may use e-mail to share theirresults or to plan joint observations with students who live elsewhere. With students from other loca-tions, they look for similarities, differences, and applications of their observations.
Related Science Standards: 1, 2, 5, 9, 10Related Workplace Readiness Standards: 3.3, 3.7, 3.9, 3.12, 5.3, 5.7
Moon Journals. To determine students’ prior knowledge, ask them to generate a list of what theyknow about the apparent motion of the moon in the day and night sky. After this introductory activ-ity, students look for the moon every day and night for a period of two months. They keep a journalof their moon observations. At the beginning of this investigation, students discuss what informa-tion is important to note in their journals. They might include the following:
■ date and time of observation
■ a drawing of the moon
■ the moon in relation to a fixed point, such as a tree, telephone pole, horizon, or sun
■ weather conditions
Encourage students to design their own journal formats, using computers when possible.
Daily, students share their journal entries with the class. Each day an entry can be posted on a bul-letin board to create a classroom moon journal. In this way, all students have the opportunity tonotice patterns in the moon’s appearance over time.
Periodically, students discuss the patterns they have been observing. They discover patterns in theappearance of the moon and its position in the sky.
After a month, students transfer their journal drawings of the moon’s appearance onto a calendar.This helps them synthesize their observations. They share with each other what they now know aboutthe moon. They compile a class list of “Moon Truths” and compare it to the list they generated atthe beginning of the unit.
Students test their “Moon Truths” with another month of lunar observations. They verify the patterns,nullify them, or discover new ones.
Related Science Standards: 1, 2, 5, 9Related Workplace Readiness Standards: 2.7, 3.1-3.9, 3.12, 4.2, 5.7
CHAPTER 8
NEW JERSEY SCIENCE CURRICULUM FRAMEWORK
Indicator 2: Relate the motions of the Earth-sun-moon system tounits of time (days, months, seasons, years).
Day and Night. This activity simulates day and night and demonstrates the effects of sunlight onEarth. Using small building blocks, students create a model of their home, school, street, or neigh-borhood. They include buildings, plants, people, and animals.
To simulate daytime, the students shine flashlights onto the block model. They move the appropri-ate pieces to depict the actions of living things during daytime. They notice that the flashlight isgiving off light, and they identify its effect on the model town.
Next, the students turn off the flashlights, simulating nighttime. They answer questions such as thefollowing:
■ What changes take place in the environment?
■ How do the actions of living things change?
When flashlights are turned on and off at regular intervals, students begin to realize that the order-ly occurrence of day and night affects life on Earth.
Related Science Standards: 1, 2, 6Related Workplace Readiness Standards: 3.3, 3.7, 3.9, 5.3, 5.7
Flowerpot Clock. Students create a sun clock using a flowerpot and a long stick. First, they securea long stick in the hole at the bottom of the flowerpot by placing it in a ball of clay. Next they placethe pot in the sunlight outside. To maintain proper orientation, they make a mark on the pot tomatch a mark on the ground.
During the course of the day, they watch the shadow of the stick move along the rim of the pot.Every hour, they mark the spot of the shadow on the rim of the flowerpot and record the time of day.The next day, when they put the pot in the same place, aligning the marks, they are able to tell theapproximate time by reading the location of the shadow on the pot.
Supporting Educational Research: Adapted from a Young Astronauts activity(Young Astronauts Council, Washington, D.C.)Related Science Standards: 1, 2, 5, 9, 10Related Workplace Readiness Standards: 3.3, 3.7, 3.9, 3.12, 5.3, 5.7
THE FRAMEWORK: STANDARD 11
Four Seasons: A Tropical Year. Students draw positions of the sun in a seasonal backgroundthroughout the year no less than twice a month at the same time each day. (Hopefully, they will havean unimpeded view of the southern sky from the school yard.) Students enter the date in their jour-nal and note the sun’s height in the sky each time. As time goes by, they answer questions such asthe following:
■ Is there a relation between the height of the sun and the season of observation?
■ Is there a relationship between seasons and weather phenomena?
As the school year draws to a close, students generate a multimedia summary of their findings. Inthis summary, students compare the position of the sun with the seasons amongst any other find-ings. Ask the students: “If you continue this study through the summer as well as the fall, winter,and spring of the next school year, and therefore observe a second first day of spring, what unit oftime will have passed?” A full revolution of the Earth around the sun has occurred; this unit of timeis called a tropical year.
Related Science Standards: 1, 2, 10Related Workplace Readiness Standards: 2.8, 3.1-3.8, 3.15, 4.2, 4.9, 5.7
Sun Domes. In this investigation, students plot the apparent path of the sun across the sky dur-ing the day and predict the sun’s path during different seasons of the year. They first discuss whatthey know about the apparent path of the sun during the day. They generate a list that they willreturn to at the end of their investigation. Some ideas may include time and direction of sunrise andsunset, and time when the sun is directly overhead.
Then students make a sun dome using a clear, plastic hemisphere (e.g., the bottom section of a clear,round plastic soda bottle whose black bottom has been popped off). They tape the hemisphere to asquare piece of cardboard large enough to fit the hemisphere. Then they place the dome (represent-ing the celestial sky) on the square so that the top of the dome is directly above the intersection oftwo perpendicular lines labeled with the cardinal directions (N, S, E, W) on the cardboard.
At the beginning of a sunny school day, students take their sun domes outside and place the domeson the ground, correlating north on their sun domes with north on their directional compasses. Theydraw a chalk line around their sun dome squares so that they can return to the same place later thatday. Using a permanent marker, they touch the marker on the plastic dome so that the pen’s tip castsa shadow onto the center of the dome (the intersection of the two lines drawn on the cardboard).
They make a mark with the tip of the pen and label it with the time. (This mark represents the posi-tion of the sun in the sky at that particular time.) In the same manner, students take sun dome read-ings every half hour during the rest of the day. Between readings, students predict where the nextdot will be on the dome, or where the sun will appear in the sky next. They also predict at what timethey think the sun will be at its highest. At the end of the day, students make generalizations aboutthe pattern of the apparent path of the sun. They extrapolate the path of the sun to where it roseand where it will set. They predict how the pattern might change in a different season.
CHAPTER 8
NEW JERSEY SCIENCE CURRICULUM FRAMEWORK
This activity can be done once in the fall, once in the winter, and once in the spring. In the spring,the students revisit their original list of what they knew about the sun and compare it with whatthey know now.
Related Science Standards: 1, 2, 4, 5, 9Related Workplace Readiness Standards: 2.7, 2.8, 3.1-3.8, 3.12, 5.4, 5.7
Angle of the Sun’s Rays. In this two-part activity, students investigate how the angle of the sun’srays influences the amount of heat and light received on Earth.
First, the students observe how the angle of the sun’s rays changes during the course of the day byfollowing these steps:
■ Using a sharp pencil point, they punch a small, round hole in a piece of paper or cardboard.
■ They place this paper in a southern window, where the sun’s rays will shine through the holeand onto a large piece of white paper on the floor, table, or windowsill.
■ They draw the outline of the spot where the beam of light shines on the paper and label thedate and time inside the outline.
Students repeat this procedure periodically throughout the day. They note changes in the placementand size of the outline over time.
Next, the students investigate the effect of the angle of the sun’s rays on heating the Earth’s sur-face. They design and conduct experiments that compare the temperature of a substance when heat-ed by a light source at varying angles. They use materials such as
■ heat lamps (simulating the sun)
■ sand, soil, or water (Earth surface materials)
■ thermometers or temperature probes and corresponding computer software
In these experiments, the students could tilt the light at an angle while keeping the surface mater-ial sitting flat, simulating our perspective from Earth. Alternately, the light could be constant andstudents could place the surface material in a tilted tray, simulating the perspective from space.
Using spreadsheets and graphing skills, students analyze their data and summarize the results.
Related Science Standards: 1, 2, 4, 5, 10Related Workplace Readiness Standards: 2.2, 2.7, 3.1-3.3, 3.6-3.9, 3.12. 4.2, 4.9,5.3, 5.4, 5.7
Seasons and Length of Day. Students investigate the relationship between length of day and sea-sons. Throughout the school year, students record times for sunrise and sunset. (They get the datafrom newspapers, television, or the Internet.) The students look for patterns and relationships byexamining their charts. Specifically, they study correlations between length of day and the seasons.
THE FRAMEWORK: STANDARD 11
Simultaneously, students investigate the location of the sun as close to sunrise and sunset as pos-sible. Facing north, they record the location of the sun as it rises and again as it sets. They repeatthis procedure, going back to the same location once a month throughout the year. They draw orwrite their observations, giving landmarks for the important points (due east, sunrise, due west, andsunset). Students observe that the sun both rises and sets farther north in the spring and summerthan in the winter, thus creating a longer day in the spring and summer.
Next, students investigate the relationship between the length of time that the sun shines on Earthand the amount of heat received by the Earth. They design and conduct experiments measuring thetemperature of a substance heated for varying amounts of time using the following materials:
■ heat lamps (simulating sunlight)
■ sand, soil, or water (Earth surface materials)
■ thermometers or temperature probes and corresponding computer software
Using spreadsheets and graphing skills, students analyze their data and summarize the results.
These activities help students understand how the length of day—and therefore the amount of sun-light shining on a portion of the Earth—influences the seasons.
Related Science Standards: 1, 2, 4, 5, 9, 10Related Workplace Readiness Standards: 2.2, 2.6, 3.3, 3.5-3.9, 3.12, 5.3, 5.4, 5.7
Indicator 3: Construct a model of the solar system.
The Solar System in the Gym. In this activity, students simulate the solar system in the schoolgymnasium. They become planets, moons, comets, and asteroids. (Perhaps art class might providethe props to turn this escapade into a ballet of the planets, especially if appropriate music accom-panies the activity.) Actively direct the action, so that the movement of the members of the solarsystem are appropriate in relation to the sun.
Related Science Standards: 1, 2Related Workplace Readiness Standards: 3.1-3.8, 3.12, 3.15, 4.2, 5.7
Day and Night Sky. Students look at the sky during the day (being careful not to look directly atthe sun). They draw pictures of the sky that they see, including drawings of the sun, the moon (if itis out), clouds birds, and airplanes. Over time, they make several observations and drawings of thedaytime sky. They follow up this activity with a discussion of the properties, locations, and move-ments of the objects they have drawn. Ask them questions such as the following:
CHAPTER 8
NEW JERSEY SCIENCE CURRICULUM FRAMEWORK
■ What color is the sky at sunrise? at sunset?
■ Where does the sun appear in the morning? in the afternoon?
■ Do you notice any patterns in the sun’s motions?
■ What activities do people and animals perform in the daytime?
Next, students look at the sky at night, making periodic observations. They draw the night sky,including the moon and the stars. (Cray-pas or colored pencils on black paper are effective.) Again,ask them questions about the properties, locations, and movements of the objects they have drawn:
■ What shapes of the moon have you seen?
■ What colors of the moon have you seen?
■ What features of the moon’s surface have you noticed?
■ Where have you seen the moon?
■ How does the moon seem to move in the sky?
■ How would you describe the color and brightness and colors of the stars?
■ What have you noticed about the movement of stars?
■ Do you notice any patterns in the stars’ and moon’s motions?
■ What activities do people and animals do at night?Related Science Standards: 1, 2Related Workplace Readiness Standards: 3.2, 3.7, 3.9, 5.3, 5.7
Mission to Mars. Mars exploration has been in the spotlight recently. Two spacecraft, the MarsGlobal Surveyor and the Mars Pathfinder, were launched in 1996, and the Mars Surveyor Orbiter andLander missions are planned for the near future. These space missions send back to Earth important(and exciting) information about Martian atmosphere, weather, climate, magnetic field, surface com-position, and surface features such as polar caps and river channels. NASA revealed that a meteoritefrom Mars was found that possibly contains evidence of primitive life there. The continued coopera-tion between the Russian and American space programs has led to knowledge about how the humanbody adapts to long-term habitation in zero gravity.
In this research activity, students learn more about Mars and the Mars exploration program by sim-ulating a mission to Mars. First, they discuss humans’ basic needs for survival. Then they researchthe characteristics of Mars by visiting the library or the many informative Web sites on the Internet.With an understanding of space flight and the Martian environment, they develop a plan for build-ing a community on Mars. Students use the most up-to-date information and technology as theyapply their problem-solving and decision-making skills in a creative and meaningful setting.
Related Science Standards: 1, 2, 4-6, 9, 10Related Workplace Readiness Standards: 1.2, 1.7, 2.2, 2.5-2.7, 2.9, 3.1-3.5, 3.8,3.11, 3.15, 4.1-4.3, 4.6, 4.7, 4.11, 5.3, 5.4, 5.7
THE FRAMEWORK: STANDARD 11
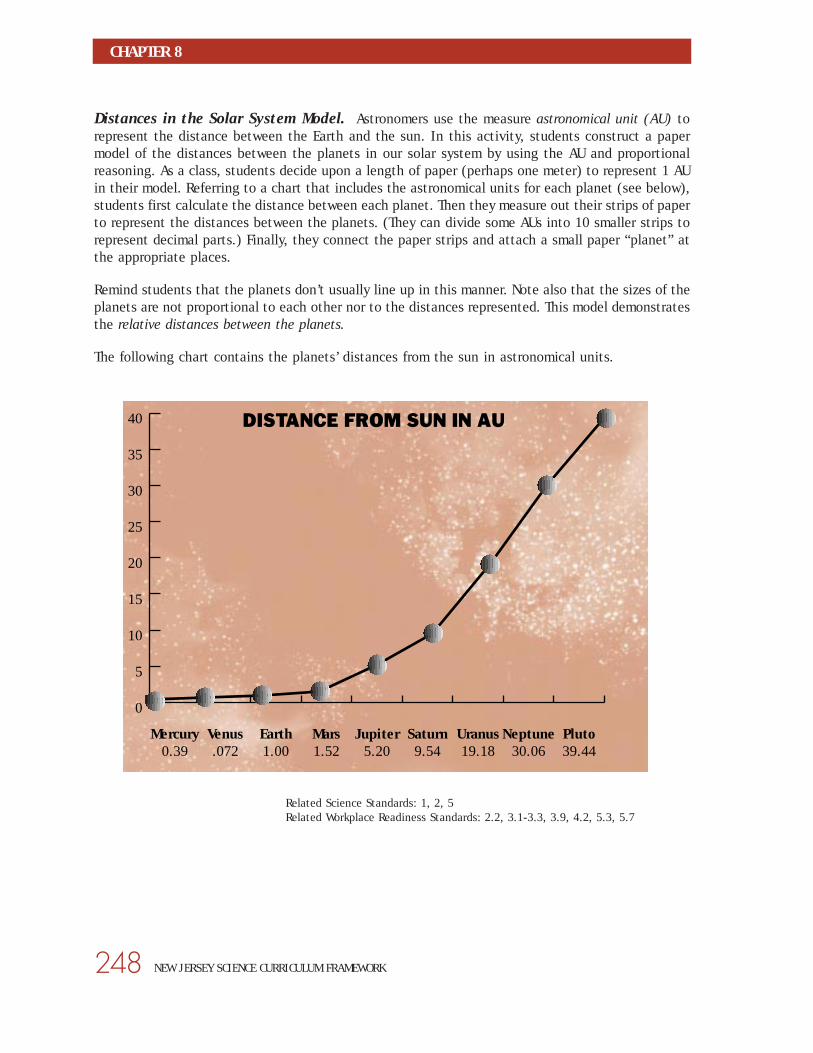
Distances in the Solar System Model. Astronomers use the measure astronomical unit (AU) torepresent the distance between the Earth and the sun. In this activity, students construct a papermodel of the distances between the planets in our solar system by using the AU and proportionalreasoning. As a class, students decide upon a length of paper (perhaps one meter) to represent 1 AUin their model. Referring to a chart that includes the astronomical units for each planet (see below),students first calculate the distance between each planet. Then they measure out their strips of paperto represent the distances between the planets. (They can divide some AUs into 10 smaller strips torepresent decimal parts.) Finally, they connect the paper strips and attach a small paper “planet” atthe appropriate places.
Remind students that the planets don’t usually line up in this manner. Note also that the sizes of theplanets are not proportional to each other nor to the distances represented. This model demonstratesthe relative distances between the planets.
The following chart contains the planets’ distances from the sun in astronomical units.
Distance from Sun
Planet in AU
Mercury 0.39
Venus 0.72
Earth 1.00
Mars 1.52
Jupiter 5.20
Saturn 9.54
Uranus 19.18
Neptune 30.06
Pluto 39.44
Related Science Standards: 1, 2, 5Related Workplace Readiness Standards: 2.2, 3.1-3.3, 3.9, 4.2, 5.3, 5.7
248
CHAPTER 8
NEW JERSEY SCIENCE CURRICULUM FRAMEWORK
0
5
10
15
20
25
30
35
40
Pluto39.44
Neptune30.06
Uranus19.18
Saturn9.54
Jupiter5.20
Mars1.52
Earth1.00
Venus.072
Mercury0.39
DISTANCE FROM SUN IN AU
Scale Model of Earth/Moon Volumes. This activity gives students the opportunity to demon-strate proportion as they model the relationship between the volume of the Earth and the volume ofthe moon.
First, the students divide a large lump of clay into 50 balls of equal size. After separating one of theclay balls from the rest of the group, they combine the remaining 49 balls of clay to make one largesphere. In this way, they create a proportional model, or scale model, of the moon (one small ball)and the Earth (a large sphere composed of 49 small balls). The ratio of the moon’s volume to theEarth’s volume is 1:49, the same as it is in real life.
Supporting Educational Research: Adapted from Project SPICA (Harvard-Smithsonian Center for Astrophysics).Related Science Standards: 5, 10Related Workplace Readiness Standards: 3.2, 3.9, 5.4, 5.7
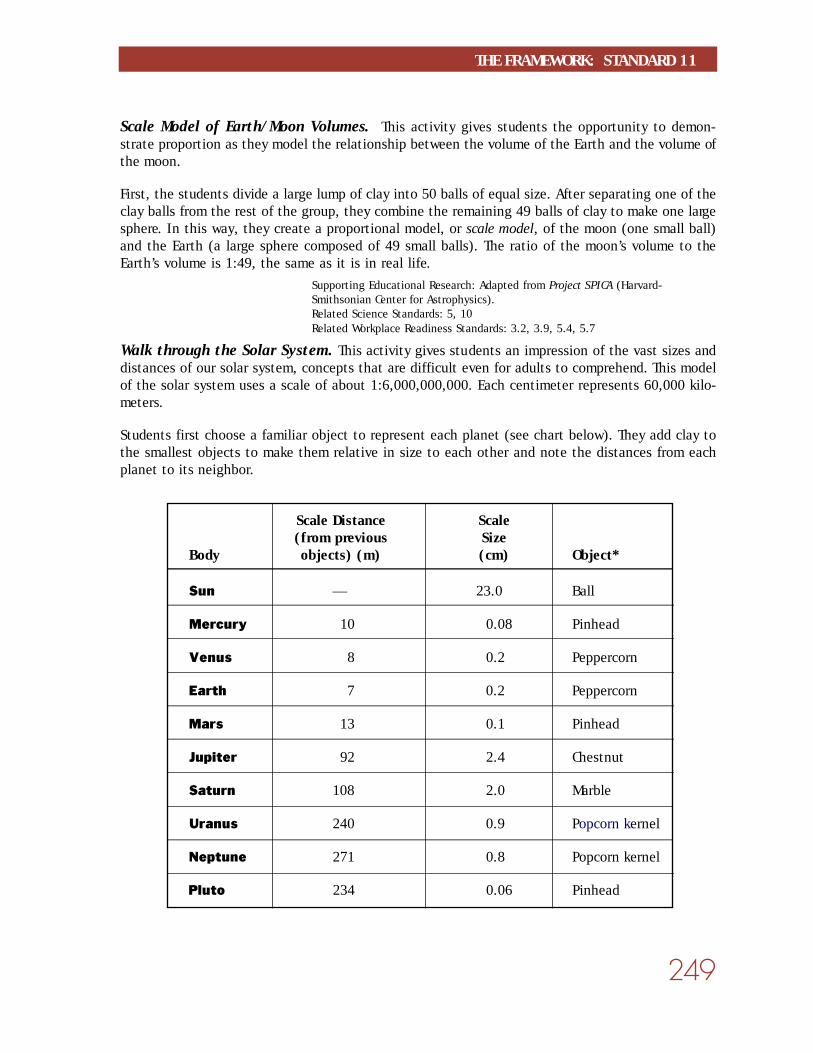
Walk through the Solar System. This activity gives students an impression of the vast sizes anddistances of our solar system, concepts that are difficult even for adults to comprehend. This modelof the solar system uses a scale of about 1:6,000,000,000. Each centimeter represents 60,000 kilo-meters.
Students first choose a familiar object to represent each planet (see chart below). They add clay tothe smallest objects to make them relative in size to each other and note the distances from eachplanet to its neighbor.
Scale Distance Scale(from previous Size
Body objects) (m) (cm) Object*
Sun — 23.0 Ball
Mercury 10 0.08 Pinhead
Venus 8 0.2 Peppercorn
Earth 7 0.2 Peppercorn
Mars 13 0.1 Pinhead
Jupiter 92 2.4 Chestnut
Saturn 108 2.0 Marble
Uranus 240 0.9 Popcorn kernel
Neptune 271 0.8 Popcorn kernel
Pluto 234 0.06 Pinhead
THE FRAMEWORK: STANDARD 11
Scale Distance Scale(from previous Size
Body objects) (m) (cm) Object*
— 23.0 Ball
10 0.08 Pinhead
8 0.2 Peppercorn
7 0.2 Peppercorn
13 0.1 Pinhead
92 2.4 Chestnut
108 2.0 Marble
240 0.9 Popcorn kernel
271 0.8 Popcorn kernel
234 0.06 Pinhead
Next, the students embark on a walk through the solar system. This scaled walk spans about 1,000meters. They count off meter paces (each meter-long pace represents 6,000,000 m) until they reachthe location of each planet. Students then take a few minutes to listen to a classmate’s report aboutthat planet. Afterward, they continue on their walk, discussing aspects of the solar system, until thelast planet.
Remind students of the following:
■ The planets are not usually lined up in this manner.
■ The planets move at different speeds.
■ This is a model that represents relative sizes of planets and distances between the planets.Supporting Educational Research: Based on “The Thousand Yard Model” by GuyOttewell (Astronomical Workshop, Furman University, Greenville, SC 29613) asadapted by Kenneth M. Uslabar in “A Stroll through the Solar System.” Science Scope, October 1993.Related Science Standards: 1, 2, 5Related Workplace Readiness Standards: 3.2-3.5, 3.8, 3.9, 5.3, 5.7
Indicator 4: Describe the physical characteristics of the compo-nents of the solar system, and compare the Earth toother planets.
Inner and Outer Planets. In this activity, students explore the large amount of planetary datathat has been assembled during the past 20 years. This information is available in print, on CD-ROMs,and on the Internet directly from NASA.
Students organize specific data to contrast the inner and outer planets. If they have begun to studythe concept of density, they can use information on the radius and mass of the planets to calculatethe gross density of each planet (see chart). (This activity also provides students an opportunity toapply the formula for the volume of a sphere.) After students calculate the planet densities, they cre-ate a bar graph of density, with the planets in order according to distance from the sun. They dis-cover the great differences between the inner and outer planets.
Challenge the students to account for this density difference in terms of the gross materials thatmake up the inner and outer planets (e.g., silica, iron, and hydrogen). The students can obtain andorganize information regarding materials and bar charts of the percent composition of silica, iron,and hydrogen. After examining their results, students develop generalizations about the physicalcharacteristics of the planets.
Related Science Standards: 1, 2, 4Related Workplace Readiness Standards: 1, 2
CHAPTER 8
NEW JERSEY SCIENCE CURRICULUM FRAMEWORK
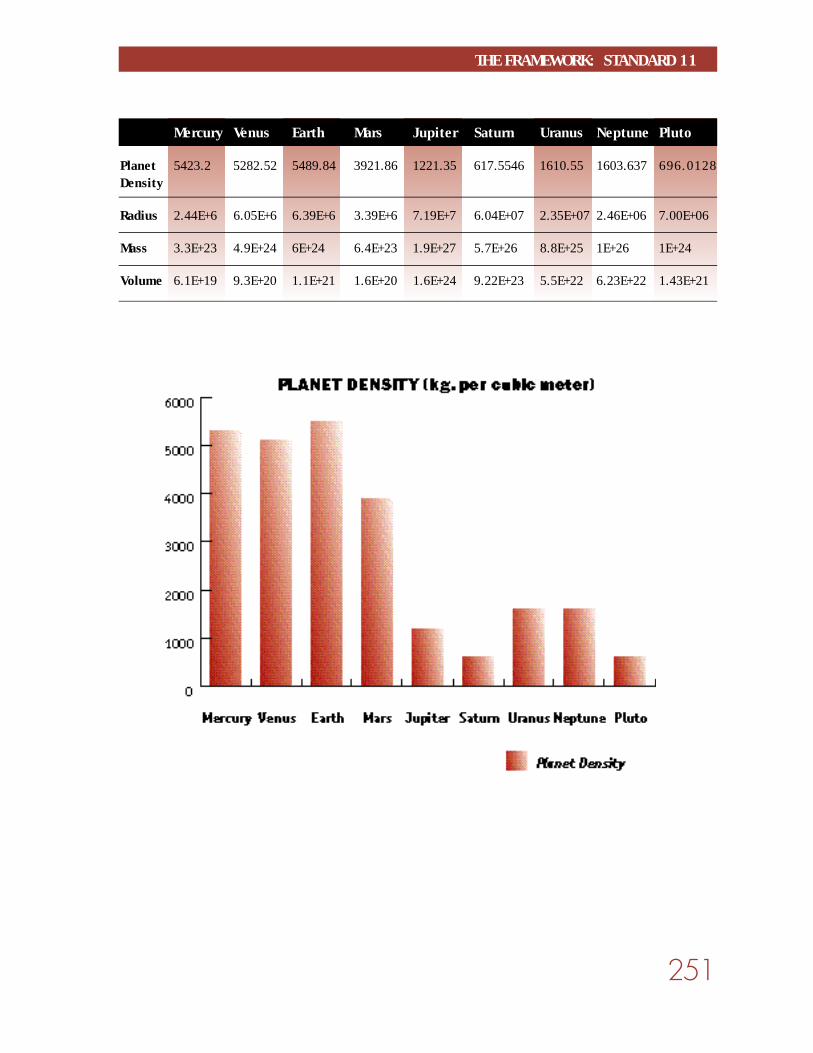
Mercury Venus Earth Mars Jupiter Saturn Uranus Neptune Pluto
Planet 5423.2 5282.52 5489.84 3921.86 1221.35 617.5546 1610.55 1603.637 6 9 6 . 0 1 2 8Density
Radius 2.44E+6 6.05E+6 6.39E+6 3.39E+6 7.19E+7 6.04E+07 2.35E+07 2.46E+06 7.00E+06
Mass 3.3E+23 4.9E+24 6E+24 6.4E+23 1.9E+27 5.7E+26 8.8E+25 1E+26 1E+24
Volume 6.1E+19 9.3E+20 1.1E+21 1.6E+20 1.6E+24 9.22E+23 5.5E+22 6.23E+22 1.43E+21
THE FRAMEWORK: STANDARD 11
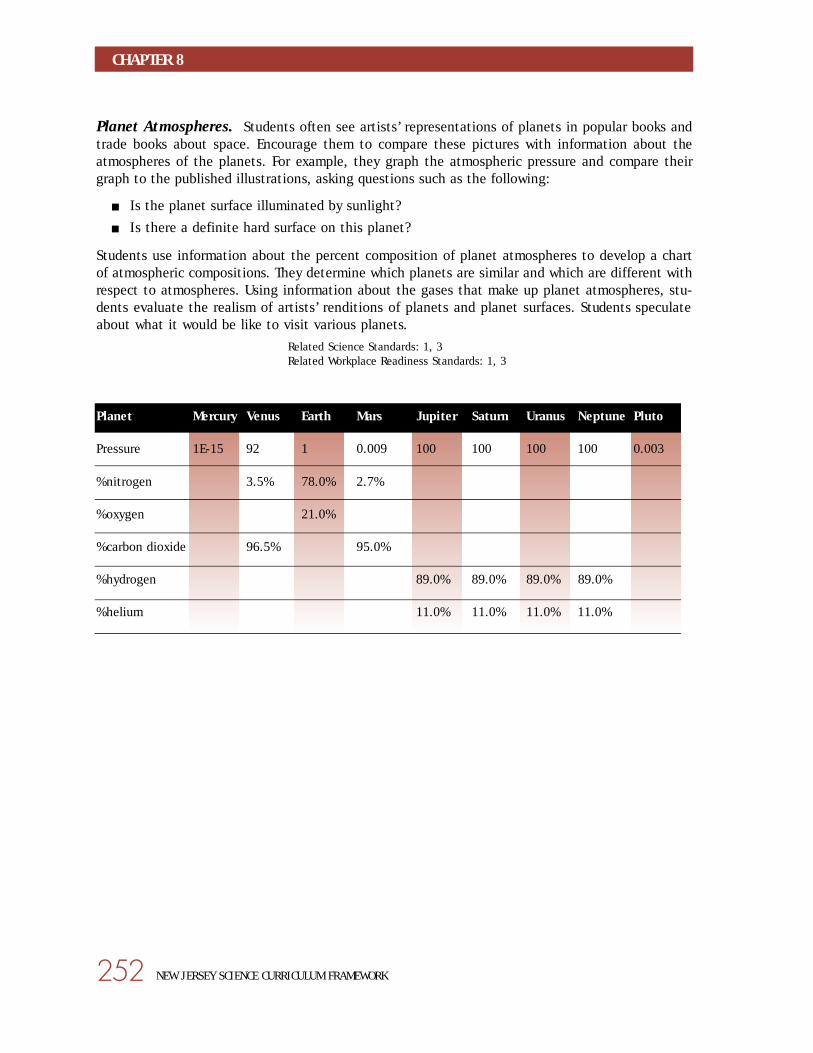
Planet Atmospheres. Students often see artists’ representations of planets in popular books andtrade books about space. Encourage them to compare these pictures with information about theatmospheres of the planets. For example, they graph the atmospheric pressure and compare theirgraph to the published illustrations, asking questions such as the following:
■ Is the planet surface illuminated by sunlight?
■ Is there a definite hard surface on this planet?
Students use information about the percent composition of planet atmospheres to develop a chartof atmospheric compositions. They determine which planets are similar and which are different withrespect to atmospheres. Using information about the gases that make up planet atmospheres, stu-dents evaluate the realism of artists’ renditions of planets and planet surfaces. Students speculateabout what it would be like to visit various planets.
Related Science Standards: 1, 3 Related Workplace Readiness Standards: 1, 3
Planet Mercury Venus Earth Mars Jupiter Saturn Uranus Neptune Pluto
Pressure 1E-15 92 1 0.009 100 100 100 100 0.003
%nitrogen 3.5% 78.0% 2.7%
%oxygen 21.0%
%carbon dioxide 96.5% 95.0%
%hydrogen 89.0% 89.0% 89.0% 89.0%
%helium 11.0% 11.0% 11.0% 11.0%
CHAPTER 8
NEW JERSEY SCIENCE CURRICULUM FRAMEWORK
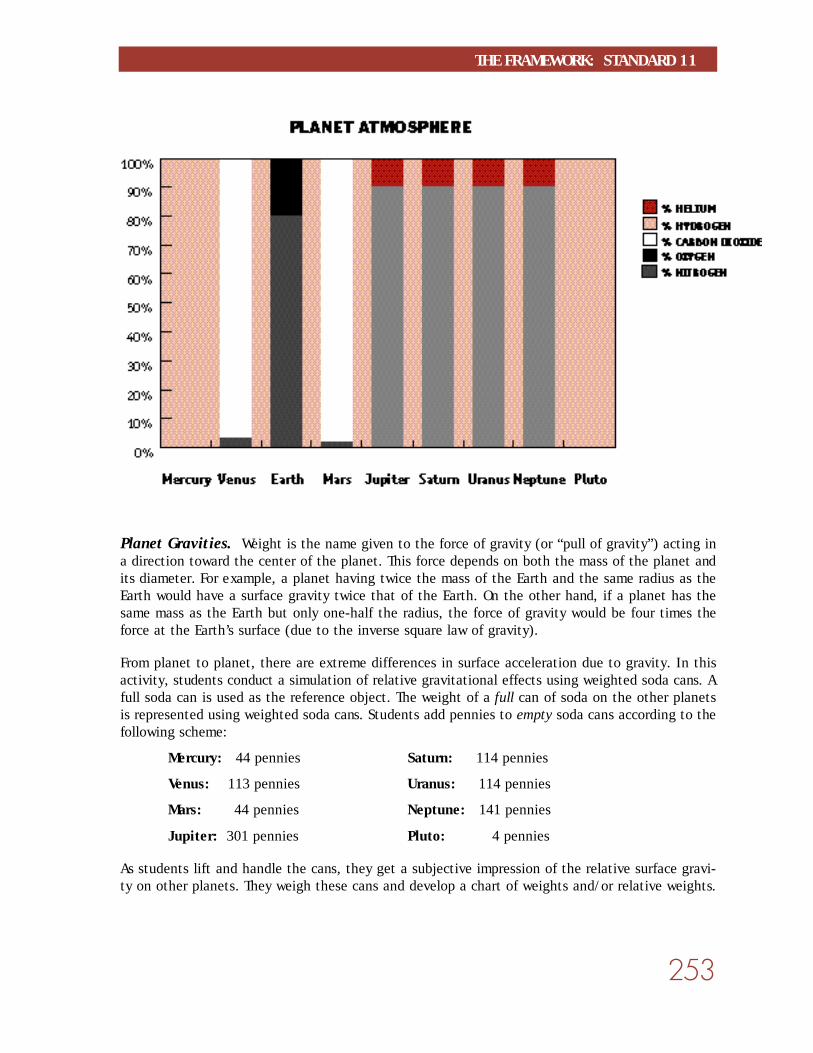
Planet Gravities. Weight is the name given to the force of gravity (or “pull of gravity”) acting ina direction toward the center of the planet. This force depends on both the mass of the planet andits diameter. For example, a planet having twice the mass of the Earth and the same radius as theEarth would have a surface gravity twice that of the Earth. On the other hand, if a planet has thesame mass as the Earth but only one-half the radius, the force of gravity would be four times theforce at the Earth’s surface (due to the inverse square law of gravity).
From planet to planet, there are extreme differences in surface acceleration due to gravity. In thisactivity, students conduct a simulation of relative gravitational effects using weighted soda cans. Afull soda can is used as the reference object. The weight of a full can of soda on the other planetsis represented using weighted soda cans. Students add pennies to empty soda cans according to thefollowing scheme:
Mercury: 44 pennies Saturn: 114 pennies
Venus: 113 pennies Uranus: 114 pennies
Mars: 44 pennies Neptune: 141 pennies
Jupiter: 301 pennies Pluto: 4 pennies
As students lift and handle the cans, they get a subjective impression of the relative surface gravi-ty on other planets. They weigh these cans and develop a chart of weights and/or relative weights.
THE FRAMEWORK: STANDARD 11
Students use the results of these measurements to calculate their own weight on other planets.Challenge students to account for the similarity in surface gravity for planets where the accelerationdue to gravity is similar but the planet radii are different.
Alternatively, code the cans (but do not reveal which planet they each represent), then challenge thestudents to determine which can represents the pull of gravity on which planet.
Related Science Standards: 2, 4, 5Related Workplace Readiness Standards: 2, 3
Comparing Distances and Sizes. Students construct scale models of specific relationshipsbetween objects within our solar system, such as
■ the Earth-moon-sun system (distance and diameter)
■ the distance of the planets
■ the diameter of the sun compared to that of the planets
Since the models must show relative distance or size, students learn to use a scaling factor. First theydecide which relationship they will model. Then, studying the actual numbers involved, they choosea scale appropriate to the model they have selected, the available materials, and the amount of spacein which to work. For example, to construct a scaled model of the distances between objects in thesolar system, students may choose to make one meter of adding machine tape (or similar paper tape)equal an astronomical unit (AU). This model could even be scaled down further by allowing 20 cen-timeters of paper tape to represent 1 AU. (The Earth-sun distance is represented by one astronomi-cal unit. Distances between planets are compared to that unit.) A one-meter scaling down wouldneed 40 meters of tape, but a 20-centimeter scaling fits on only 6 meters of tape.
Once students have selected a model they wish to construct and an appropriate scaling factor, theycalculate the actual sizes of the features in their models and then plan and construct their models.Materials for the models may include:
■ large mural paper
■ adding machine tape (or similar paper tape)
■ string
■ spheres in a variety of sizes
■ masking tape
■ arts and crafts materials
For the Earth-moon-sun system and the diameter of the sun and the planets, students can create thebodies or find objects that closely represent the dimensions of the bodies in their model. After cre-ating the models, the students explain their models to the class. In this way, students see variedvisual representations of the relationships within our solar system.
Related Science Standards: 1, 2, 4, 5, 9Related Workplace Readiness Standards: 2.2, 2.3, 2.7, 3.1, 3.8, 3.12-3.15, 4.2,5.3, 5.4, 5.7
CHAPTER 8
NEW JERSEY SCIENCE CURRICULUM FRAMEWORK
Impact Craters. Students investigate the nature of impact craters on the moon by experimentingwith bolides (colliding objects) to create craters in a bin of flour. First, students determine whichproperties of an object could affect a crater left upon impact. These factors include
■ the mass of the object
■ the volume of the object
■ the height from which the object is dropped
■ the angle of the object’s path
By studying pictures of lunar craters, students determine which properties of the crater to measure.They consider the following:
■ the diameter of the crater
■ the depth of the crater
■ the height of the crater wall
■ the maximum distance of the ejecta
The students design their experiments, being sure to test only one variable at a time. They place flourin a large bin and cover the flour with a thin layer of cocoa. Then they choose a bolide from a setof balls of varying sizes. They drop the object from a predetermined height and take measurementsof the resulting crater and ejecta. They repeat this procedure several times.
After the experiment, students enter their recorded data into a computer database. After combiningdatabases, they analyze the class data and draw conclusions about the relationships between theobject’s characteristics and the resulting craters.
Related Science Standards: 2, 4, 5, 9, 10Related Workplace Readiness Standards: 2.2, 2.4, 2.7, 3.1-3.3, 3.6-3.9, 3.12, 4.2,5.3, 5.4, 5.7
Planet Sorting. Students review a select set of photographs of planets and planet features. Thesemight be
■ a collection of actual photographs
■ selected 35-mm slides
■ selected images on videodiscs or CD-ROMs
■ images located and downloaded from specific Web sites
The illustrations used to generate this activity should include photographs of the following:
■ Earth: blue sky with clouds; blue water with beach; white snow with mountains; a volcano; ahurricane from space; the almost-full Earth; specific locations such as Los Angeles, the SinaiPeninsula, and the Red River (all photos taken from space); Earth’s full moon
■ Mercury: the planet as seen by Mariner 10
■ Venus: the planet as seen by Mariner 10
THE FRAMEWORK: STANDARD 11
■ Mars: a telescope view of the planet; a volcano and a dry river bed taken by Mariner 9
■ Jupiter: a full view of the planet; Io and its volcanoes
■ Saturn: a full view of the planet
■ Pluto: the most recent image of the planet
Working in teams of two to four, students classify the selected planet images using a classificationscheme of their own design. They defend their classification schemes to their classmates. The stu-dents return to their work and try another classification scheme. They should look for more specificfeatures such as clouds, water, dust, etc.
Challenge students to answer the following questions:
■ What is the white in some photos? the blue? the tan? the red?
■ Do different planets have similar features?
■ Is there a planet that resembles our moon?
■ Is Earth the only planet with hurricanes? the only planet with wind?Supporting Educational Research: Adapted from an activity published byAstronomy Society of the Pacific. Related Science Standards: 1, 2, 4, 5, 9Related Workplace Readiness Standards: 2.2, 2.3, 2.5, 2.6, 3.1-3.8, 3.12-3.14,4.2, 4.3, 5.7
The Creature Feature. Student teams cooperatively explore an individual planet over a period oftime. Establish the following learning centers around the classroom:
■ books, periodicals, and NASA materials
■ a videotape-library viewing area
■ a laser videodisc set-up
■ one or two multimedia computers offering access to CD-ROM technology
■ Internet access to help students access Web sites such as Nine Planets
Each cooperative team member has a specific task, as outlined below:
■ The travel agent produces a travel brochure laced with planet facts but including somestretches of the imagination that extols the virtues of visiting the planet.
■ The ship’s captain develops a “Captain’s Log” that describes the travels to and from his/herplanet (truthfully, yet at times imaginatively).
■ The biologist “discovers” a creature whose features directly reveal planet facts. (Here imagi-nation has no bounds.)
Each team works together to produce a display representing their creature using posters, sculptures,and/or videos.
CHAPTER 8
NEW JERSEY SCIENCE CURRICULUM FRAMEWORK
A unique aspect of this activity is that the planet name is to be covered up or not used as class-mates review each team’s reports, brochures, and creatures. A class vote seeks to match planets tothe work of the teams. Once all planets have been identified, the products of the research are dis-played on hallway bulletin boards and in display cases.
Related Science Standards: 1, 2, 4, 5, 9Related Workplace Readiness Standards: 2.2, 2.3, 2.5, 2.6, 3.1-3.8, 3.12-3.14,4.2, 4.3, 5.7
Indicator 5: Explain how naturally occurring events on Earth arerelated to the positions of the sun, Earth, and moon.
Modeling Events. Students create models to demonstrate how relationships between the move-ments of the sun and moon generate not only measures of time but also naturally occurring events.
To begin this investigation, students ask questions based on their observations of the moon and sun.For example, students might ask
■ “Why do we have night and day?”
■ “Why does it take about a month for the moon to go through all its phases?”
■ “Why do the sun and moon appear to rise in the east and set in the west?”
■ “What other regularly repeating phenomena relate to the Earth, moon, and sun?”
Next, students choose one question to investigate and select the most appropriate materials:
■ Styrofoam™ balls of various sizes (to represent the Earth or the moon)
■ skewer sticks (to hold up the balls or to represent the axes)
■ toothpicks (to point out one spot on the Earth or moon)
■ a lamplight without a shade (to represent the sun)
Manipulating these materials, the students are able to model the phenomena that they haveobserved. For example, to answer the question about eclipses, students can put a skewer stickthrough a Styrofoam™ ball to represent the Earth and poke a toothpick in a spot that would indicatethe place on Earth where they live. They can demonstrate a total solar eclipse by skewering a small-er sphere and positioning it between the “Earth” and the “sun” so that its shadow falls upon theEarth at the toothpick spot.
THE FRAMEWORK: STANDARD 11
By creating these models, the students deepen their understanding of concepts such as length ofnight and day, naturally occurring moon phases, and the seasons (students can easily simulate thetilt of the Earth’s axis).
Related Science Standards: 1, 2, 4, 5, 9Related Workplace Readiness Standards: 3.1-3.8, 3.12-3.15, 4.2, 4.3, 5.3, 5.4, 5.7
Tides. Tides are the periodic rise and fall of the ocean (sea) level. Of all the celestial bodies, themoon has the greatest influence on the tides. First, students review information about tides usingtexts and other reference books, CD-ROMs, videodiscs, and videotapes.
Note: There are spectacular videos of Bay of Fundy tides.
Next, students create a paper and plastic-transparency model that displays high and low tides. Theytake a tidal bulge/moon diagram viewed from far above the Earth’s North Pole. The counterclockwisemovement of the tidal bulge moving below the moon and the inertial bulge on the opposite side areindicated by an arrow. A second diagram of the Earth, with its azimuthal point of view, is photo-copied onto transparency film so that students can place it directly on top of the tidal bulge figure.Both figures, pushpinned down through the Earth’s center to a piece of corrugated cardboard, allowfor movement. As the students rotate the Earth counterclockwise into and out of the bulges, theyclearly see how each day (one spin) consists of two high and two low tides.
After manipulating their models, students describe the role of the moon in generating the ocean tidesand explain the different kinds of tides.
Related Science Standards: 1-3Related Workplace Readiness Standards: 1.1, 2.3, 3.1, 3.2, 3.7, 4.2, 4.3, 4.9, 5.3,5.4
A Mathematical Model of Eclipses. Working cooperatively in small groups, students discover con-cepts relating to eclipses by researching various information sources, such as books and periodicals,videodiscs, CD-ROMs, and Internet sites. They determine the conditions of all types of solar and lunareclipses. The students relate this information to the modeling they may have done in earlier grades.
Math can reinforce the students’ understanding of eclipse phenomena. Using 8.5-by-11-inch graphpaper with divisions of 10 units to the inch, students set up three illustrations of eclipse possibili-ties. The measurements of each radius are listed below:
■ Sun: 1.0 inch
■ Earth: 0.5 inch
■ Moon: 0.1 inch
CHAPTER 8
NEW JERSEY SCIENCE CURRICULUM FRAMEWORK
Tangents touching the sun and moon create solar eclipses, while tangents to the Earth and sun resultin lunar eclipses because the tangents generate umbras and penumbras behind both the moon andthe Earth.
Related Science Standards: 1, 2, 4, 5, 9Related Workplace Readiness Standards: 3.1-3.8, 3.12-3.15, 4.2, 4.3, 5.3, 5.4, 5.7
Tide Tables. Tides are the periodic rise and fall of the ocean (sea) level. Of all the celestial bod-ies, the moon has the greatest influence on the tides. Students review information about tides usingtexts and other reference books, CD-ROMs, videodiscs, and videotapes.
Note: There are spectacular videos of Bay of Fundy tides.
Students practice using a tide table, which summarizes daily tidal information. With a sample pagefrom a New Jersey tide table, students identify and record the times for high and low tides on a spe-cific day and for several days in succession. They then graph time of high tide vs. date and answerquestions such as the following:
■ How long is it from one high tide to the next?
■ How long is it from a high tide to the very next low tide?
■ Do the equivalent tides occur at the same time every day? If not, approximately how muchlater? Why?
After completing this exercise, students describe the role of the moon in generating the ocean tidesand explain the different kinds of tides.
Related Science Standards: 1-3Related Workplace Readiness Standards: 1.1, 2.3, 3.1, 3.2, 3.7, 4.2, 4.3, 4.9, 5.3,5.4
THE FRAMEWORK: STANDARD 11
Indicator 6: Describe the technologies used to explore theuniverse.
Build Your Own Telescope. Students research the various types of telescopes available, especial-ly those mounted aboard the Hubble Orbiting Telescope. The students display pictures, diagrams, andmodels of their discoveries.
Based on their research findings, the students construct a simple refractor telescope from mailingtubes, Styrofoam™ trays, and surplus lenses. Obtain mailing tubes that telescope, that is, an insidetube fits in a larger outside tube. Substitutes made from oaktag or some other source are suitablebut are not as firm. Another makeshift alternative can be two paper-towel tubes, one slit lengthwiseand tightened a little.
Purchase biconvex surplus lenses, one large and one small, from a science supply house or othersource. Students follow the steps outlined below to mount the larger lens:
■ Cut a short segment from the outside tube to use for tracing.
■ Trace three circles (the lens mounting rings) on the Styrofoam tray equal to the tube’s insidediameter, then cut these circles out.
■ Place the large lens in the center of one of the circles.
■ Trace the outline of the lens. Cut this circle out, forming a ring in which the lens can slip.
■ Place the lens on the other two disks, and trace again. When cutting, cut the opening a lit-tle smaller.
■ Place the lens in the center disk, sandwiching it in with the other two disks. Use rubber orcontact cement to hold the layers of Styrofoam together.
■ Repeat the same procedure to mount the smaller lens.
After both lenses are individually mounted, the students hold the two lens assemblies up and lookthrough both at the same time, moving them back and forth until a distant object comes into focus.They now cut both the inner and outer mailing tubes to 1.5 times that distance.
Related Science Standards: 1, 2, 4, 5, 9Related Workplace Readiness Standards: 3.1-3.8, 3.12-3.15, 4.2, 4.3, 5.3, 5.4, 5.7
Build Your Own Telescope. The students carefully mount the large lens assembly into one end ofthe large tube and the small lens assembly into the small tube. They may need to carefully shape andsand the assemblies so they slip into their respective tubes and fit snugly.
CHAPTER 8
NEW JERSEY SCIENCE CURRICULUM FRAMEWORK
The students insert the inside tube into the outside tube so that the lenses are on either end. Theyaim their refractor telescope at distant objects and focus by pushing or pulling the tubes in or out.Ask them to note whether the object is right side up. Students take the refractor home and look atthe moon at night as well as Jupiter and any other celestial object available. Emphasize that theyshould never look at the sun with any telescope.
Note: You may choose to begin the activity by encouraging students to explore the images the lensesform. Guide the students in using the available materials, lenses, mounting circles, and tubes to arriveat an appropriate construction such as that described above. They may modify the construction to solveany problems they encounter as they build their telescope.
Space Shuttle Simulation. Students simulate a space shuttle research mission. First, they builda space shuttle simulator, control panel, and monitors needed for Mission Control using readily avail-able materials, such as
■ sheets of plastic and duct tape for the simulator
■ cardboard and plastic soda-bottle tops for the control panel
■ cardboard boxes, wooden dowels, and laminating film for Mission Control monitors
Next, students draw pictures of the sequence in a shuttle launch on rolls of paper and place them ina cardboard box “TV monitor.” They unroll these illustrations during the countdown and launch. Thestudents place video cameras in the shuttle simulator and hook them up to a television monitor inthe next room (Mission Control). Similarly, they place a video camera in Mission Control and a tele-vision on the shuttle’s control panel.
While building the simulator, students explore space research missions on NASA Select television andon the Internet. Together, they choose experiments to conduct both in the simulator and on “Earth,”so they can compare results. Students practice communication skills by dividing into two groups sep-arated by a wall: one group gives directions for constructing a building out of manipulatives, whilethe other group constructs the building from the verbal instructions.
Shuttle crew jobs include the following:
■ commander
■ pilot
■ EVA (extravehicular activity) specialist
■ science officers
Mission Control jobs include the following:
■ flight director
■ crew activities and health director
■ EVA specialist
■ science officers
■ public affairs officer
THE FRAMEWORK: STANDARD 11
Supporting Educational Research: Adapted from “More Space in the Classroom,” by Betty Fowler, inScience and Children. Sept. 1994, pp. 40-41, 45.
Related Science Standards: 1, 4-6, 9, 10Related Workplace Readiness Standards: 1.2, 1.7, 2.2, 2.5-2.7, 2.9, 3.1-3.9, 3.11-3.15, 4.1-4.3, 4.6, 4.7, 4.9, 4.11, 5.3, 5.4, 5.7
Space Shuttle Simulation. Walkie-talkies are used during the flight. The officers at MissionControl communicate instructions and orders to the astronauts during the flight. Science officersdirect experiments conducted on the shuttle. Missions can include activities such as
■ constructing a building out of manipulatives
■ using a robot arm (a long stick with a grabber)
■ using a stereoscopic microscope to examine small objects found in “space”
■ investigating worm response to wet and dry surfaces
■ measuring heart rates before and after exercise
■ any other experiments designed by the students
During the countdown, students play a tape of sound effects simulating ignition and lift-off. Aftertakeoff, the flight director is in control. During the flight, astronauts conduct their experiments, anEVA takes place, astronauts eat a meal, and an “emergency” may take place. After the problem getsresolved, the shuttle lands, and students discuss the results of the shuttle experiments.
In conjunction with this activity, visits might be scheduled to the Buchler Center and/or LibertyScience Center.
Radio Astronomy. Students explore parts of the radio spectrum using a portable radio tuned to aweak AM radio station. By turning the radio through 360 degrees around all three axes (horizontal,longitudinal, and vertical), students are able to describe the effect of the position of the radio’santenna. They then explore the effects of bringing the radio near sources of “electromagnetic noise.”These sources may include light switches as they are switched off and on; fluorescent lights; andcomputers. Students may use the radio as a detector to find other sources of electromagnetic noise.
Students then study radio astronomy and radio telescopes through photographs, readings, and videoresources. They compare visual and radio spectrum images for the same celestial objects. Dramaticimages of this type are accessible on the Internet as well as in trade books.
Students explore the nature of interference utilized in very long baseline radio interferometry by usingvisible light. Interference plates that have photographically produced sets of parallel “slits” of vary-ing dimension are commercially available. If the students view a distant light source through thesegrids, they may observe spectral interference. (These grids are more suitable for this activity than
CHAPTER 8
NEW JERSEY SCIENCE CURRICULUM FRAMEWORK
are diffraction gratings because the dimensions of the slits are visible to the naked eye.) Using avail-able computer software, students simulate the production of radio images by combining the slightlydifferent signals received by multiple radio antennas.
With this qualitative experience as background, students search out information that describes theconstruction and use of radio interferometry antenna arrays.
Related Science Standards: 1-3Related Workplace Readiness Standards: 1.1, 1.8, 2.3, 3.9, 4.9
Probe Data. There are several long-term, unmanned NASA probes that can be the basis for a sus-tained study of technology and the collection of information about the solar system. The Voyager 1and Voyager 2 probes are classics in terms of the scope of information collected and of the economyof technology used to collect the information. Another is the more recent Galileo interplanetary mis-sion. NASA supports an Internet site for the Galileo project (as it does for several other projects).The Galileo project is of particular interest because it allows students to explore questions such asthe following:
■ How big is the probe? (A full-scale silhouette of the probe could be created and mounted inthe school during the unit of study focusing on Galileo.)
■ How was the Galileo probe launched?
■ What was the overall plan for using the probe to collect information?
■ What information was obtained in the first few years of the project?
■ What technical problems had to be solved after the launch?
■ What instruments are on the probe?
■ How is information sent from the probe to the Earth?
■ What information was obtained about Jupiter?
■ What satellites of Jupiter are to be studied?
■ What adjustments in scientific thinking about Jupiter and its satellites have occurredbecause of data from Galileo?
In this activity, students collect information about the properties of several planets and naturalsatellites. They collect and display photographs from Galileo’s cameras. They study the technologyused to explore the solar system as well as the actual data obtained.
Related Science Standards: 1-4Related Workplace Readiness Standards: 1, 2, 4
Pictures from Space. Students frequently perceive that the views of the planets and other celes-tial objects in books, on CD-ROMs, or on videotapes are the results of a roll of film being developed.Through this activity, students learn about the process of optical scanning and how it is used to cre-ate planetary images.
THE FRAMEWORK: STANDARD 11
To accomplish this task, students obtain a long paper tube (from a roll of wrapping paper, a mailingtube, or a tube constructed from a sheet of oaktag). They trace the tube end on an index card toform a circle slightly larger that the size of the tube. Students cut out the circle and cut that samecircle exactly in half. They tape the halves to the end of their tube, leaving a narrow slit of 1-2 mm.
Students now hold the uncovered end of the tube to their eye, close or cover the other eye, and slow-ly pan around the room or around the school yard. Ask them questions such as
■ What do you see?
■ Is anything clearly discernible?
Next, the students pan around the room or yard rapidly. Ask them what they now see (or what theythink they have seen).
Afterwards, students discuss how images are received from space probes and satellites:
■ This information comes in as strings of data.
■ Scanning devices within spacecraft imaging systems analyze objects one line at a time.
These light values are converted to radio signals, relayed to receivers on Earth, and then sent to com-puters that retrieve the original scan one line at a time. The assembled lines form the finishedimages.
If possible, obtain a sample video of an image developing on a Jet Propulsion Lab screen.Related Science Standards: 1, 2, 4, 5, 9Related Workplace Readiness Standards: 3.1-3.8, 3.12-3.15, 4.2, 4.3, 5.3, 5.4, 5.7
CHAPTER 8
NEW JERSEY SCIENCE CURRICULUM FRAMEWORK
Indicator 7: Construct a model that accounts for variation in thelength of day and night.
Sunlight and the Earth. Weather satellites generate imagery by the visible radiation that isreflected back to the planet. A set of four images is not unlike black-and-white photographs thatreveal the seasonal variations in solar altitude (the angle of the sun above the local horizon) andlength of daylight at different latitudes.
Students use visible images of the Earth as viewed by a geostationary satellite in an orbit of 35,800km. (These images are available from NOAA and other Internet sites.) The images available for thisexercise have a subsatellite point located on the equator at 75 degrees west longitude. They alsowere taken as the sun was setting at the subsatellite point. Therefore, one half of the Earth’s disk isin sunlight, and the other half is in darkness. The terminator falls directly at 75 degrees west longi-tude. The images include latitude, longitude, and the Tropics of Cancer and Capricorn. At the equa-tor, the length of daylight is always 12 hours (ignoring atmospheric optical effects that lengthendaylight). Local time of sunset at the subsatellite point is approximately 6 p.m.
Using these images, students construct a model that allows them to do the following:
■ describe the changes in orientation of the Earth’s rotational axis relative to the sun’s raysover the course of the year
■ determine the latitude where the sun is directly overhead (solar altitude of 90 degrees) atlocal solar noon during the solstices and equinoxes
■ estimate the noon solar altitude at any given latitude
■ approximate the number of hours of daylight at any latitude
■ explain variations in solar altitude and length of daylight in terms of the Earth’s motions inspace
Related Science Standards: 1, 2, 4, 5, 9Related Workplace Readiness Standards: 2.2, 2.3, 2.5, 2.6, 3.1-3.8, 3.12-3.15,4.2, 4.3, 5.3, 5.4, 5.7
Estimating Day and Night. Students apply their developing skills with geometric constructionsto develop a geometric model that is related to observations of the length of day and night as wellas the height of the sun at local noon. For several days, students use a “shadow stick” to measurethe angle of elevation of the sun at local noon. They make these measurements as accurately as pos-sible, and finally graph the angle vs. the date so that they can use a best-fit curve to further reducemeasurement errors. For each day during the period when local noon measurements are made, stu-dents find newspaper postings of sunrise and sunset.
THE FRAMEWORK: STANDARD 11
Students select a specific day. Using the local latitude and the local sun elevation, they constructthe following diagram.
1. Construct the circle that represents the Earth.
2. Draw and label the equator.
3. Draw and label the axis of rotation at right angles to the equator.
4. From the center of the circle, draw a ray at the latitude angle. Label this the latitude ray.
5. From a convenient point on the latitude ray, draw a ray at an angle of 90 degrees (thenoon altitude angle). Label this the shadow ray.
6. Through the center of the Earth construct a line perpendicular to the shadow ray. Labelthis line the terminator.
7. Measure the distance from the axis to point L. Construct a circle with this radius.
8. Construct two perpendicular lines through the center of this circle.
9. Measure the distance from point L to the terminator. Label it D.
10. Measure off the distance D from the circle and along one of the diameters in the secondcircle.
11. Construct a line parallel to the other diameter. Shade in the shadow side of the Earth atthe observer’s latitude.
12. Measure the central angle in shadow. Use ratios of angles and hours (360 in 24 hours) tofind the length of day and night.
13. Compare the result to the published length of day and night.Related Science Standards: 1-4Related Workplace Readiness Standards: 1-3
CHAPTER 8
NEW JERSEY SCIENCE CURRICULUM FRAMEWORK
Indicator 8: Evaluate evidence that supports scientific theories of the origin of the universe.
Big Bang. The term “big bang” has entered the cultural lexicon. In order for students to incorpo-rate the big bang concept into their thinking about the origin of the universe, they must developand coordinate several concepts.
The first concept is that of the black body radiator. Students conduct activities and make measure-ments that enable them to relate the energy output of an object to the temperature produced at agiven point away from the object. They use a thermometer with the bulb covered with a square ofblackened aluminum foil. They measure the equilibrium temperature produced by 15W, 60W, 100W,and 250W lightbulbs at a fixed distance (such as 50 cm) from the bulbs. A graph of temperature ver-sus energy output in watts will point students toward the idea that the energy output of an objectand the related temperature produce a measurable effect away from the object.
To understand the justification for the big bang, students must be able to relate the measurableeffects they have observed (in the activity with the lightbulbs, for example) to the idea that allobjects radiate photons with an energy proportional to their temperature. A qualitative concept ofphotons and photon sources is one of the conceptual building blocks students must acquire in orderto make sense of the big bang. They develop this concept with readings and with video presenta-tions on the properties of photons. As the students learn about the spectrum of a black body radia-tor, they should be able to sketch such a spectrum. Ask students to describe the nature of objectsthat can produce black body radiation of various wavelengths or spectra.
Related Science Standards: 1-3Related Workplace Readiness Standards: 1.1, 1.8, 2.3, 3.9, 4.9
Big Bang. Another issue that students must deal with is the classic Olbers paradox. In the processof coming to grips with the reality that the night sky is not bright in spite of the multitude of starsand galaxies, students use the ideas of the red shift and the expanding universe.
Through these activities, students learn about several concepts: black body radiation, photon ener-gy, and an expanding universe. At this point, students are presented with the 1965 identification ofthe cosmic background radiation in the microwave range by New Jersey scientists Arno Penzias andRobert Wilson. Challenge students and guide them in incorporating this phenomenon into an accountof the stages in the big bang. The goal in this sequence of experiences is to enable students to usethe idea of the big bang as a conceptual model to account for observable phenomena.
THE FRAMEWORK: STANDARD 11
Expanding Universe. After students have developed the ability to apply the concept of spectralshifts resulting from the relative motion of sources of electromagnetic radiation, they apply the con-cept to the cosmological red shift. The implication of the cosmological red shift with greater spectralshifts for more distant objects is an expanding universe.
Students simulate this relationship using the surface of a balloon. They partially inflate a sphericalballoon and mark and label 5 to 10 points in random locations on the surface. They consider one ofthe points as a representation of the solar system, the point from which the cosmological red shiftis observed. They measure the diameter of the balloon and the (great circle) distance to each pointfrom the solar system point using a flexible tape measure or a string and ruler. They then inflate theballoon to a larger diameter and repeat the measurements. The students repeat this process again inorder to get at least four sets of measurements. Then they graph the distance to each labeled pointvs. the diameter of the balloon. Students answer questions such as the following:
Is the increase in distance from the solar system the same for all the points?
Is there a relation between the increase in distance and the original distance?
Remind students that although the balloon is a three-dimensional object, it is the surface of the bal-loon that simulates three-dimensional space in this model.
Related Science Standards: 1, 2, 4Related Workplace Readiness Standards: 1, 2
Stellar Evolution. Students, while reviewing existing theories of the origin of the universe, real-ize that stellar evolution is an important aspect of the total picture. To follow up on stellar evolu-tion, students access Hubble telescope image sites on the Web and examine images caught by thevarious instruments located on this orbiting observation platform. Many of these images are used inresearch articles that discuss the origin of the universe and stellar evolution. Students access andreview the written articles as well.
Independent class activities help the students understand how scientists interpret all the informa-tion obtained via scientific probes and research.
■ They obtain handheld spectroscopes and aim them at various sources of light in a darkenedlab classroom. Such light sources include incandescent light, fluorescent light, and spectraltubes of various elements. Students become aware that each element has its own spectral“fingerprint” and that light from stars may be analyzed with this knowledge. Unknown spec-tral strips from stars are then analyzed for the composition of the source of light.
■ They begin to recognize that a star’s color, temperature, and brightness are interrelated.Students graph data of all of these characteristics simultaneously. As the data accumulates,the Hertzsprung-Russell classification scheme emerges.
■ Using the Hubble Classification System for galaxies continues the expansion of studentunderstanding. Give students a set of photos of galaxies and urge them to create a way ofsummarizing their observations of these photos. Students observe type of galaxy and direc-tion of rotation, and then estimate the age of the galaxy.
CHAPTER 8
NEW JERSEY SCIENCE CURRICULUM FRAMEWORK
■ Continued research using library resources, computer CD-ROMs, and Internet sites eventuallyleads the student to the concept of a black hole, a region of space so strong that nothingcan escape it.
Students summarize their project into stellar evolution by means of a multimedia presentation,research, models, and/or videos.
Related Science Standards: 1, 2, 4, 5, 9Related Workplace Readiness Standards: 2.2, 2.3, 2.5, 2.6, 3.1-3.8, 3.12-3.15,4.2, 4.3, 5.3, 5.4, 5.7
Indicator 9: Analyze benefits generated by the technology ofspace exploration.
Cost-Benefit Analysis. The development of a cost-benefit analysis is a complex task. In the caseof large science (such as that embodied in NASA projects), the task is complicated because the sci-entific information obtained is a social good that may not have immediate economic value. Whenpublic money is allocated to do science, there is seldom a guarantee of economic benefits. As stu-dents study the technologies that have spun off from NASA’s large science projects, they willencounter contributions to commercial products as well as general health and safety.
Through reading, debating, and writing, they investigate the formal models for doing cost-benefitanalyses. They identify the social and political processes the nation uses to arrive at decisions, espe-cially decisions that are justified on the basis of social good.
Students contact their senators and congressional representatives about NASA funding. Hopefully,they will get up-to-date information from these legislators that will provide a sense of how thenation is currently solving the cost-benefit problem.
Related Science Standards: 1, 2, 4Related Workplace Readiness Standards: 1, 3
Courtroom Drama. Students develop a courtroom scene: “Benefits generated by the technologyused for space exploration: guilty or innocent?!”
Students first review the literature by all means at their disposal, including accessing Web sites. NASAsites, for example, possess a vast array of materials both in print and online. Enough time should beset aside to allow for research at home, in school, or at the library.
THE FRAMEWORK: STANDARD 11
As the trial date approaches, students assign themselves roles for the courtroom scenario, such asthe following:
■ judge
■ jury
■ witnesses for
■ witnesses against
Costuming might even be considered. Students record the proceedings using video cameras. The netresult should emphasize the great advances in technology generated by the effort to explore spaceand the spin-off of these advances into society. The gathered evidence is displayed on hallway bul-letin boards or in display cases.
Another role play emphasizes only the advances that spun off into medical technology. Studentsresearch various sources to gather information. They then envision an extremely active emergencyroom (ER!), when suddenly all technological advances spurred on by space exploration disappears.
In their research, students select a technology device and find out how space research and develop-ment influenced the device’s development.
Related Science Standards: 2, 4, 5Related Workplace Readiness Standards: 2.2, 2.3, 2.5, 2.6, 3.1-3.8, 3.12-3.15,4.2, 4.3, 5.3, 5.4, 5.7
CHAPTER 8
NEW JERSEY SCIENCE CURRICULUM FRAMEWORK